29
PARABLES, MYTHS AND RISKS

PARABLES, MYTHS AND RISKS

ADVANCES IN PUBLIC INTEREST
ACCOUNTING
Series Editor: Cheryl R. Lehman
Recent Volumes:
Volume 1: 1986
Volume 2: 1987
Volume 3: 1990
Volume 4: 1991
Volume 5: 1993
Volume 6: 1995
Volume 7: 1998
Volume 8: Advances in Accountability: Regulation, Research, Gender and
Justice, 2001
Volume 9: Mirrors and Prisms: Interrogating Accounting, 2002
Volume 10: Re-inventing Realities, 2005
Volume 11: Corporate Governance: Does Any Size Fit?, 2005
Volume 12: Independent Accounts, 2006
Volume 13: Envisioning a New Accountability, 2008
Volume 14: Extending Schumacher’s Concept of Total Accounting and
Accountability into the 21st Century, 2009
Volume 15: Ethics, Equity, and Regulation, 2010
Volume 16: Managing Reality: Accountability and the Miasma of Private and
Public Domains, 2013
Volume 17: Accountability and Social Accounting for Social and Non-profit
Organizations, 2014
Volume 18: Sustainability and Governance, 2015
Volume 19: Accounting in Conflict: Globalization, Gender, Race and
Class, 2016

ADVANCES IN PUBLIC INTEREST ACCOUNTINGVOLUME 20
PARABLES, MYTHS ANDRISKS
EDITED BY
CHERYL R. LEHMANHofstra University, New York, USA
United Kingdom � North America � Japan
India � Malaysia � China
Emerald Publishing Limited
Howard House, Wagon Lane, Bingley BD16 1WA, UK
First edition 2017
Copyright r 2017 Emerald Publishing Limited
Reprints and permissions service
Contact: [email protected]
No part of this book may be reproduced, stored in a retrieval system, transmitted in any
form or by any means electronic, mechanical, photocopying, recording or otherwise
without either the prior written permission of the publisher or a licence permitting
restricted copying issued in the UK by The Copyright Licensing Agency and in the USA
by The Copyright Clearance Center. Any opinions expressed in the chapters are those of
the authors. Whilst Emerald makes every effort to ensure the quality and accuracy of its
content, Emerald makes no representation implied or otherwise, as to the chapters’
suitability and application and disclaims any warranties, express or implied, to their use.
British Library Cataloguing in Publication Data
A catalogue record for this book is available from the British Library
ISBN: 978-1-78714-534-4 (Print)
ISBN: 978-1-78714-533-7 (Online)
ISBN: 978-1-78714-965-6 (Epub)
ISSN: 1041-7060 (Series)
Certificate Number 1985ISO 14001
ISOQAR certified Management System,awarded to Emerald for adherence to Environmental standard ISO 14001:2004.

CONTENTS
LIST OF CONTRIBUTORS vii
EDITORIAL BOARD ix
INTERNAL CONTROL MATERIAL WEAKNESS ANDREAL EARNINGS MANAGEMENT
Nana Y. Amoah, Anthony Anderson, Isaac Bonaparte andAlex P. Tang
1
CAN GOWN HELP TOWN? EXPLORING THE “GAP”BETWEEN ACCOUNTING PRACTICE AND ACADEMIAAND PROVIDING A THEORY FOR WHY IT EXISTS
Rebecca Bloch, Gary Kleinman and Amanda Peterson 23
AN EXAMINATION OF THE PERCEPTIONS OFAUDITORS AND CHIEF FINANCIAL OFFICERS OF THEPROPOSED AUDITING STANDARD INVOLVING OTHERINFORMATION IN AUDIT REPORTS
John E. McEnroe, Ning Du and Mark Sullivan 63
THE MYTH OF TAX EVASION IN SOUTH ASIA: THECASE OF A LOWER-MIDDLE INCOME ECONOMY
Mohammad Nurunnabi 85
INSTITUTIONAL PILLARS AND CONTEXTUALIZINGPUBLIC INTEREST IN THE ACCOUNTING PROFESSION
George Joseph 135
“HOW SAFE IS SAFE ENOUGH?” USING BECK’S RISKSOCIETY CONSTRUCTS TO FACILITATE CHANGES TOUNSUSTAINABLE NOTIONS OF ACCOUNTABILITY
Kala Saravanamuthu 167
LIST OF REVIEWERS 221
v

LIST OF CONTRIBUTORS
Nana Y. Amoah Crummer Graduate School of Business,Rollins College, Winter Park, FL, USA
Anthony Anderson School of Business, Howard University,Washington DC, USA
Rebecca Bloch Department of Accounting, FairfieldUniversity, Fairfield, CT, USA
Isaac Bonaparte College of Business and Economics,Towson University, Towson, MD, USA
Ning Du School of Accountancy & MIS, DePaulUniversity, Chicago, IL, USA
George Joseph University of Massachusetts, Lowell, MA,USA
Gary Kleinman Montclair State University Montclair,NJ, USA
John E. McEnroe School of Accountancy & MIS, DePaulUniversity, Chicago, IL, USA
Mohammad Nurunnabi Department of Accounting, Prince SultanUniversity, Riyadh Saudi Arabia
Amanda Peterson East Carolina University, Greenville,NC, USA
Kala Saravanamuthu Newcastle Business School, Faculty ofBusiness and Law, University of Newcastle,Callaghan, Australia
Mark Sullivan Chicago, IL, USA
Alex P. Tang Graves School of Business and Mgt, MorganState University, Baltimore, MD, USA
vii

EDITORIAL BOARD
Gloria Agyemang
Royal Holloway, University of
London, UK
Jane Andrew
University of Sydney, Australia
Ed Arrington
University of Wollongong, Australia
Jane Broadbent
Royal Holloway, University of
London, UK
Judy Brown
Victoria University of Wellington,
New Zealand
Nihel Chabrak
United Arab Emirates University,
UAE
Charles Cho
ESSEC Business School, France
Wai Fong Chua
University of New South Wales,
Australia
Michele Chwastiak
University of New Mexico, USA
Penny Ciancanelli
University of Glasgow, UK
David Cooper
University of Alberta, Canada
Jesse Dillard
Portland State University, USA
Jeff Everett
York University, Canada
Martin Freedman
Towson University, USA
Sonja Gallhofer
University of Glasgow, UK
James Guthrie
Macquarie University, Australia
Theresa Hammond
San Francisco State University, USA
Kerry Jacobs
University of New South Wales,
Australia
Ingrid Jeacle
University of Edinburgh, UK
David Knights
Lancaster University Management
School, UK
Naoko Komori
Sheffield University, UK
ix

Leslie Oakes
University of New Mexico, USA
Fahrettin Okcabol
Critical Accounting Society, USA
Lee Parker
RMIT University, Australia
Joanne Rockness
University North Carolina
Wilmington, USA
Massimo Sargiacomo
University Gabriele d’Annunzio
Chieti-Pescara, Italy
Paul Williams
North Carolina State University,
USA
Hugh Willmott
Cass Business School, City University
of London, UK
x EDITORIAL BOARD

INTERNAL CONTROL MATERIAL
WEAKNESS AND REAL EARNINGS
MANAGEMENT
Nana Y. Amoah, Anthony Anderson, Isaac Bonaparte
and Alex P. Tang
ABSTRACT
This study examines the relation between internal control material weakness
(ICMW) under Section 404 of the Sarbanes-Oxley Act (SOX) and real
earnings management. Our measures of real earnings management are
abnormal cash flow from operations (ABCFOs), abnormal discretionary
expenses (ABDISEXP), and abnormal production cost (ABPROD). We
use a sample of 1,824 manufacturing firms over the period 2004�2011 to run
regressions of ABCFO, ABDISEXP, and ABPROD on ICMW and other
independent variables. We find that ICMW is negatively associated with
ABCFOs. Another result that emerges from this study is a positive relation
between ICMW and ABPROD. Our results imply that manufacturing firms
with materially weak internal controls predominantly use overproduction and
excessive price discounts to manage operational activities to achieve earnings
targets. As SOX Section 404 is designed to reduce the instances of firms
having ICMW, our finding that ICMW firms engage in real earnings man-
agement suggests that the use of real earnings management could be reduced
as SOX Section 404 succeeds in reducing ICMW.
Keywords: Real earnings management; internal control material
weakness; SOX
Parables, Myths and Risks
Advances in Public Interest Accounting, Volume 20, 1�21
Copyright r 2017 by Emerald Publishing Limited
All rights of reproduction in any form reserved
ISSN: 1041-7060/doi:10.1108/S1041-706020170000020001
1

INTRODUCTION
Extant literature documents the use of not only accrual earnings management,
but also real earnings management by firms to achieve earnings targets.
Roychowdhury (2006) defines real earnings management as “departures from
normal operational practices, motivated by managers’ desire to mislead at least
some stakeholders into believing certain financial reporting goals have been
met in the normal course of operations.”
Real earnings management appears to have gained greater acceptability
among managers as auditors and regulators cannot readily challenge real eco-
nomic actions to meet earnings targets that are taken in the normal course of
business. Graham, Harvey, and Rajgopal (2005) note that as a result of the
stigma attached to accounting frauds following the Enron and other accounting
scandals, managers appear to prefer real earnings management over accrual
earnings management.
A number of studies report that the use of real earnings management has
increased after the SOX. For example, Cohen, Dey, and Lys (2008) report
higher levels of real earnings management and lower levels of accrual earnings
management in the post-SOX period, which suggests that managers may have
switched to real earnings management due to the greater scrutiny of accrual
earnings management after SOX.
One of the key requirements of SOX is Section 404 which mandates manage-
ment to report on the effectiveness of internal control over financial reporting
and the auditor to issue a report on management’s assessment of internal con-
trol.1 The disclosure of ICMW is necessary when there is a significant deficiency
or combination of significant deficiencies which makes it more than remotely
likely that a material misstatement of the financial statements will not be pre-
vented or detected.
We examine the relation between real earnings management and ICMW
under Section 404 of SOX as it enables us to consider the effect of internal con-
trol on management’s earnings management decisions in a post-SOX environ-
ment where there is heightened scrutiny of accrual earnings management and a
preference for real earnings management.
Consistent with prior studies such as Roychowdhury (2006) and Cohen et al.
(2008), we focus on the following real earnings management tools: overproduc-
tion, management of sales through excessive price discounts and reduction of
discretionary expenditures. We use 1,824 firm observations over the period
2004�2011 to investigate the association between ICMW and our measures of
real earnings management, which are ABPROD, ABCFOs, and ABDISEXPs.
Our study focuses on manufacturing industry firms (Standard Industry
Classification (SIC) codes between 2000 and 3999) and we find that the disclo-
sure of ICMW is negatively associated with ABCFO, which suggests that
ICMW firms manage earnings by granting excessive price discounts.2 Our
2 NANA Y. AMOAH ET AL.

finding of a positive relation between ICMW and ABPROD implies that
ICMW firms engage in overproduction to achieve earnings targets. Accordingly,
our findings indicate that managers of manufacturing firms that have materially
weak internal controls largely use overproduction and excessive price discounts
to manage operational activities to achieve their earnings targets.3
While many critics of the SOX, such as SEC registrants and business asso-
ciations, have cited the huge costs associated with the implementation of the
internal control reporting requirements of Section 404 (Raghunandan & Rama,
2006; Solomon, 2005; Xu & Tang, 2012), others including Don Nicolaisen, for-
mer Chief Accountant of the US Securities and Exchange Commission (SEC),
have argued that the benefits of the SOX internal control reporting require-
ments outweigh the costs of implementation and, therefore, Section 404 should
not be amended.4 Our study contributes to the debate on the usefulness of SOX
Section 404 given that SOX Section 404 is designed to reduce the instances of
firms having ICMW and our finding that ICMW firms engage in real earnings
management implies that real earnings management could be reduced as SOX
Section 404 succeeds in reducing ICMW.The remainder of the paper proceeds as follows. The next section discusses
the related literature and our research objectives. In the section “Research
Methodology,” we describe the research methodology. The empirical results are
presented in the section “Empirical Results.” In the section “Robustness
Check,” we test the robustness of our results to selection bias. The final section
presents the conclusion.
LITERATURE REVIEW AND RESEARCH OBJECTIVES
We first discuss related literature, and then we state our research objectives
using the available body of evidence. Extant literature documents the manage-
ment of production, discretionary expenditure and sales to attain earnings
targets. For example, Roychowdhury (2006) finds that firms avoid reporting
losses through cuts to discretionary expenditure, overproduction, and tempo-
rary boosts to sales.Real earnings management could be achieved through the granting of exces-
sive price discounts to temporarily boost sales. Roychowdhury (2006) notes
that such excessive price discounts could negatively impact operating cash flows
in the current period due to the decline in profit margins and the increased
production costs relative to sales as a result of overproduction.In the case of overproduction as a real earnings management tool,
manufacturing firms could deliberately produce more goods than is necessary
to meet expected demand. Under absorption costing, which is a GAAPs
(Generally Accepted Accounting Principles) requirement, such overproduction
will reduce the production cost per unit as the fixed overhead costs will be
3Internal Control Material Weakness and Real Earnings Management

spread over the large number of units produced. Total cost per unit should
decrease provided that the effect of the reduction in fixed cost per unit is not
equalized by any increase in the marginal cost per unit. Consequently, cost of
goods sold will be reduced, which in turn increases operating profits.
The use of discretionary expenses to manage earnings is widely reported by
many studies. For example, Baber, Fairfield, and Haggard (1991) and Bushee
(1998) document that managers reduce investments in research and develop-
ment (R&D) expenses to meet earnings benchmarks. Gunny (2010) documents
the reduction of selling, general and administrative expense items such as
employee training, maintenance, and travel expenses to increase reported income.Real earnings management tools, such as discretionary expenditure cuts, exces-
sive price discounts, and overproduction, could adversely impact future cash flows
and long-term firm value (Chi et al., 2011; Cohen & Zarowin, 2010; Cohen et al.,
2008; Roychowdhury, 2006). Cuts to discretionary expenditures such as R&D
could limit a firm’s future competitiveness and harm long-run firm value. Chi
et al. (2011) note that excessive price discounts and overproduction could impose
long-term costs due to a possible decline in the profit margin on future sales and a
buildup of unwanted inventory together with an increase in holding costs.Evidence of managerial opportunism and the long-term cost of real earnings
management are documented by studies such as Mizik and Jacobson (2007),
Gupta, Pevzner, and Seethamraju (2010), and Kim and Sohn (2013).
Consistent with real earnings management imposing long-term costs, Mizik
and Jacobson (2007) document the opportunistic reduction of marketing expen-
ditures by managers around seasoned equity offerings (SEOs), which results in
a short-term increase in reported earnings and stock prices around the SEO
and a long-term decline in stock price performance. Moreover, Kim and Sohn
(2013) report a positive relation between cost of capital and real earnings man-
agement, which is driven by opportunistic behavior. In addition, Gupta et al.
(2010) report that firms with high fixed manufacturing overhead cost (FMO)
have a greater incentive for opportunistic overproduction which results in high
operating performance (return on assets (ROA)) in the current year and a
decline in operating performance (ROA) in the subsequent year.We note, however, that not all overproduction, price discounts, and discretion-
ary expenditure cuts are driven by managerial opportunism. For example, over-
production may not be opportunistic when a firm experiences a drop in demand
for its products and the firm is unable to adjust production levels at short notice
(Gupta et al., 2010). Moreover, a short-term reduction in discretionary expenses
such as R&D expense during an economic downturn may be motivated by the
intent to ensure the firm’s short-term solvency until a period of recovery.Consistent with the view that real earnings management is not opportunistic
in some settings, Gunny (2010) documents stronger future operating perfor-
mance by firms that manage real activities to just meet earnings targets, which
suggests that the real earnings management of such firms is not opportunistic
but rather a signal of firm value.
4 NANA Y. AMOAH ET AL.

Though there is no consensus in the literature about whether real earnings
management is opportunistic, there appears to be a general consensus that real
earnings management has gained greater acceptability among managers. A survey
of 400 managers of the US firms by Graham et al. (2005) indicates that managers
are inclined to use real earnings management tools to achieve earnings targets.
Compared to accrual earnings management, the use of real earnings man-
agement appears to have increased after SOX as it generally does not attract
scrutiny from auditors and regulators. Cohen et al. (2008) report that real earn-
ings management increased while accruals earnings management declined in the
post-SOX period. Franz, HassabElnaby, and Lobo (2014) find that in the post-
SOX period, firms with a greater incentive to avoid debt covenant violation
employ more earnings management as a whole, less accrual earnings manage-
ment and more real earnings management. The finding of an increase (a
decrease) in real earnings management (accrual earnings management) in the
post-SOX period appears to be consistent with Zang (2012) which reports that
accrual earnings management and real earnings management are substitutes.One of the important reporting requirements under SOX is Section 404
which mandates management to issue an assessment of the effectiveness of
internal control over financial reporting and the auditor to attest to manage-
ment’s assessment of internal control. Disclosure of ICMW under SOX
Section 404 is warranted when a significant deficiency or combination of signifi-
cant deficiencies results in more than a remote likelihood that a material
misstatement of the financial statements will not be prevented or detected.
A number of studies highlight some of the ramifications of the presence of
ICMW on firms. For example, Ashbaugh-Skaife, Collins, and Kinney (2007)
report that ICMW firms have smaller amounts of resources for internal control,
higher incidences of auditor resignations, and higher accounting risk. Lopez,
Vandervelde, and Wu (2009) document a higher likelihood of financial state-
ment restatement, less transparent financial statements, higher cost of capital,
and lower earnings predictability among firms with ICMW. Rezee, Espahbodi,
Espahbodi, and Espahbodi (2012) find more negative stock returns for firms
that report ICMW compared to firms with effective internal control. ICMW
firms also appear to be more prone to litigation based on the findings of
Hogan, Lambert, and Schmidt (2013) which indicates a higher probability of
restatement-related litigation among firms that report ICMW.Given that the results of prior studies suggest that ICMW firms are charac-
terized by weak monitoring of management and a greater risk of material
misstatement of the financial statements, we consider the possible impact of
ICMW on the earnings management decisions of managers. On one hand,
weak monitoring of management could provide opportunity for a higher level
of total earnings management among ICMW firms compared to non-ICMW
firms. Consistent with management’s preference for real earnings management
in the post-SOX period, a higher level of real earnings management could be
observed among ICMW firms if management choices result in a higher level of
5Internal Control Material Weakness and Real Earnings Management

total earnings management. We also note the possibility of a higher level of
accrual earnings management among ICMW firms due to the weak monitoring
of management.
On the other hand, if the presence of ICMW does not result in more total
earnings management, a higher level of real earnings management may not be
observed for ICMW firms. If earnings management as a whole does not
increase due to the presence of ICMW, the ICMW firms could employ more
accrual earnings management due to the lax monitoring of management and
we may observe a lower level of real earnings management.
Accordingly, our research objective is to investigate the association between
ICMW and real earnings management and we specifically focus on overproduc-
tion, granting of excessive price discounts to manage sales and the cutting of
discretionary expenses as the tools of real earnings management.
RESEARCH METHODOLOGY
Regression Model
The general form of the regression model for investigating the relation between
real earnings management and ICMW is:
Yi;t ¼ α0 þ β1ðICMWÞi;t þ β2ðSIZEÞi;t þ β3ðMTBÞi;t þ β4ðROAÞi;tþ β5ðINDVARMÞi;t þ β6ðLSDEBTNÞi;t þ β7ðLCTNÞi;t þ β8ðBIG6Þi;tþ β9ðSINVRECNÞi;t þ β10ðINVTURNÞi;t þ β11ðRECTURNÞi;tþ β12ðABSDAÞi;t þ εt
where Yi,t represents the real earnings management measures. We run
separate regressions for our three real earnings measures which are ABCFOs,
ABPROD, and ABDISEXPs.
Similar to Roychowdhury (2006), we estimate the normal cash flow from
operations (NCFO), the normal production cost (NPROD) and the normal
discretionary expenses (NDISEXP) as the first step in our determination of
ABCFOs, ABPROD, and ABDISEXPs, respectively.
To estimate the model for NCFOs, we run the following cross-sectional
regression for each industry and year:
CFOt=At�1 ¼ α0 þ α1ð1=At�1Þ þ β1ðSt=At�1Þ þ β2ðΔSt=At�1Þ þ εt ð1Þ
where At� 1 is the total assets at the end of period t� 1, St is the sales during
period t and ΔSt ¼ St � St� 1. For every firm-year, normal CFO is calculated
using estimated coefficients from the corresponding industry-year model and
6 NANA Y. AMOAH ET AL.
the firm’s sales and lagged assets. ABCFO is then determined by subtracting
the NCFO from the actual cash flow from operations (ACFO).
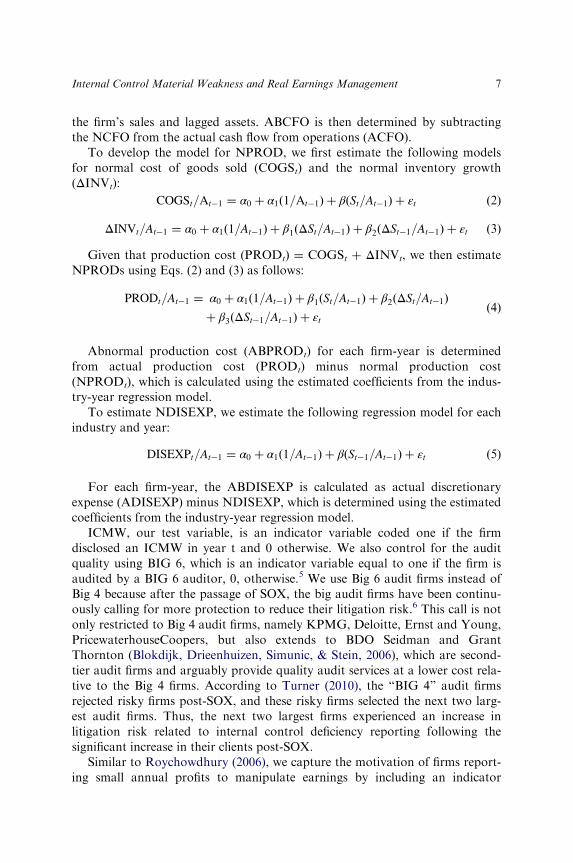
To develop the model for NPROD, we first estimate the following models
for normal cost of goods sold (COGSt) and the normal inventory growth
(ΔINVt):
COGSt=At�1 ¼ α0 þ α1ð1=At�1Þ þ βðSt=At�1Þ þ εt ð2Þ
ΔINVt=At�1 ¼ α0 þ α1ð1=At�1Þ þ β1ðΔSt=At�1Þ þ β2ðΔSt�1=At�1Þ þ εt ð3Þ
Given that production cost (PRODt) ¼ COGSt þ ΔINVt, we then estimate
NPRODs using Eqs. (2) and (3) as follows:
PRODt=At�1 ¼ α0 þ α1ð1=At�1Þ þ β1ðSt=At�1Þ þ β2ðΔSt=At�1Þþ β3ðΔSt�1=At�1Þ þ εt
ð4Þ
Abnormal production cost (ABPRODt) for each firm-year is determined
from actual production cost (PRODt) minus normal production cost
(NPRODt), which is calculated using the estimated coefficients from the indus-
try-year regression model.
To estimate NDISEXP, we estimate the following regression model for each
industry and year:
DISEXPt=At�1 ¼ α0 þ α1ð1=At�1Þ þ βðSt�1=At�1Þ þ εt ð5Þ
For each firm-year, the ABDISEXP is calculated as actual discretionary
expense (ADISEXP) minus NDISEXP, which is determined using the estimated
coefficients from the industry-year regression model.
ICMW, our test variable, is an indicator variable coded one if the firm
disclosed an ICMW in year t and 0 otherwise. We also control for the audit
quality using BIG 6, which is an indicator variable equal to one if the firm is
audited by a BIG 6 auditor, 0, otherwise.5 We use Big 6 audit firms instead of
Big 4 because after the passage of SOX, the big audit firms have been continu-
ously calling for more protection to reduce their litigation risk.6 This call is not
only restricted to Big 4 audit firms, namely KPMG, Deloitte, Ernst and Young,
PricewaterhouseCoopers, but also extends to BDO Seidman and Grant
Thornton (Blokdijk, Drieenhuizen, Simunic, & Stein, 2006), which are second-
tier audit firms and arguably provide quality audit services at a lower cost rela-
tive to the Big 4 firms. According to Turner (2010), the “BIG 4” audit firms
rejected risky firms post-SOX, and these risky firms selected the next two larg-
est audit firms. Thus, the next two largest firms experienced an increase in
litigation risk related to internal control deficiency reporting following the
significant increase in their clients post-SOX.Similar to Roychowdhury (2006), we capture the motivation of firms report-
ing small annual profits to manipulate earnings by including an indicator
7Internal Control Material Weakness and Real Earnings Management

variable (INDVARM), which is equal to one if ROAs is between 0 and 0.005,
and 0 otherwise.Consistent with Cohen et al. (2008), we consider the effect of accrual earn-
ings manipulation in the model and also use the absolute value of discretionary
accruals (ABSDA) as our measure of accrual manipulation. ABSDA is
included in the model based on the expectation that firms may use both accrual
earnings management and real earnings management as the reliance on accrual
earnings management alone might be risky (Graham et al., 2005).We compute discretionary accruals using the modified cross-sectional Jones
model (Cohen et al., 2008; Dechow, Sloan, & Sweeney, 1995), which is esti-
mated for each two-digit SIC-year grouping as follows:
TAi;t=Assetsi;t�1 ¼ K1ð1=Assetsi;t�1Þ þ K2ðΔREVi;tÞ=Assetsi;t�1
þ K3PPE=Assetsi;t�1 þ εt ð6Þ
where TAi,t ¼ IBi,t � CFOi,t (TA represents total accruals; IB is the earnings
before extraordinary items and CFO is the cash flow from operations);
Assetsi,t� 1 ¼ Total assets; ΔREVi,t ¼ Change in revenues from the preceding
year; PPE ¼ Gross value of property, plant, and equipment.
The coefficient estimates from Eq. (6) are used to estimate the firm-specific
nondiscretionary accruals (NAi,t) for the sample firms as follows:
NAi;t ¼ K1ð1=Assetsi;t�1Þ þ K2ðΔREVi;t � ΔARi;tÞ=Assetsi;t�1 þ K3PPE=Assetsi;t�1
ð7Þ
where ΔARi,t is the change in accounts receivable from the preceding year. We
then measure the discretionary accruals as:
DA ¼ ðTAi;t=Assetsi;t�1Þ � NAi;t ð8Þ
The following control variables are included in the real earnings manage-
ment model:
SIZE ¼ Log of the market value of equity
MTB ¼ Ratio of the market value of equity to book value of equity
ROA ¼ Income before extraordinary item scaled by lagged total assets
LSDEBTN ¼ Long and short-term debt normalized by lagged assets
LCTN ¼ Current Liability minus short-term debt divided by lagged assets
SINVRECN ¼ Sum of Inventory and Receivables scaled by lagged assets
INVTURN ¼ Inventory Turnover Ratio (computed as COGS/Average Inventory)
RECTURN ¼ Receivables Turnover Ratio (computed as Sales/Average Receivables)
8 NANA Y. AMOAH ET AL.

Size is defined as the log of the market value of equity. We include Size as a
control variable based on the finding of a systematic variation in ABCFOs,
ABPRODs, and ABDISEXPs, respectively, with the size of firms (Gunny,
2010; Roychowdhury, 2006).
We control for growth (MTB) in our analyses as the pressure to maintain
growth could make firms more prone to real earnings management. Our mea-
sure of growth (MTB) is defined as the market value of common equity divided
by the book value of common equity.
We also include ROA in our model to control for firm performance consis-
tent with the finding of an association between firm performance and earnings
management (Dechow, Kothari, & Watts, 1998; Gunny, 2010).Consistent with Roychowdhury (2006), we control for the effects of debt,
current liabilities, receivables, and inventory on real earnings management
using the following measures: LSDEBTN (long-term and short-term debt nor-
malized by lagged assets), LCTN (current liability minus short-term debt
divided by lagged assets), SINVRECN (sum of inventory and receivables scaled
by lagged assets), INVTURN (inventory turnover ratio), and RECTURN
(receivables turnover ratio). We include LSDEBTN in the model based on the
expectation that firms with higher debt levels may have a greater motivation to
manage operational activities to avert tighter debt covenants or debt covenant
violation.7 LCTN is included in the model to control for current liabilities as
firms with higher levels of current liabilities may have a greater incentive to
manage operational activities to avoid tighter credit terms from suppliers. We
also include SINVRECN, INVTURN, and RECTURN in the model consistent
with the expectation that firms customarily maintaining high stocks of inven-
tory and offering substantial credit sales to customers in the normal course of
operations could engage in more real earnings management compared to their
counterparts without such flexibility (Roychowdhury, 2006).
Data/Sample
We begin with 26,953 firm-year observations from the COMPUSTAT database
for the period 2004�2011. We delete firm-year observations with missing data.
As in Roychowdhury (2006), we also delete firms in industries with less than 15
observations within a 2-digit SIC code. Next, we extract Section 404 internal
control disclosure data over the period 2004�2011 from the Audit Analytics
database. We concentrate on the auditor’s assessment of the effectiveness of the
internal controls. For the firms with multiple firm-year observations of
ICMWs, we select the first year in which material weaknesses in internal control
is reported. We then merge the COMPUSTAT data with Section 404 internal
control data to obtain our full sample. The full sample consists of 407 ICMW
firms (test group) reporting at least one material weakness in internal control
9Internal Control Material Weakness and Real Earnings Management

under Section 404 and 1,417 non-ICMW firms (control group) that do not
report material weakness in internal control from 2004 to 2011. The selection
procedure is depicted in Table 1.
EMPIRICAL RESULTS
Descriptive Statistics
Table 2 presents the descriptive statistics of the categorical variables (Panel A)
and the continuous variables (Panel B). Panel A of Table 2 shows that within
the full sample of 1,824 firms, 1,373 firms (75.3%) are audited by a BIG 6 audi-
tor and 21 firms (1.2%) report ROA between 0 and 0.005.8 As noted earlier,
407 firms (22.3%) out of the 1,824 sample firms disclose ICMW.Panel B of Table 2 shows that the means of LSDEBTN for the ICMW firms
and non-ICMW firms are 0.246 and 0.218, respectively. The difference in means
is significant at the 10% level. Furthermore, the means of LCTN for the
ICMW firms and non-ICMW firms are 0.308 and 0.262, respectively, and the
difference in the means is significant at the 1% level.The mean SIZE of the ICMW (non-ICMW) firms as measured by the log of
the market value of equity is 6.074 (6.867), while the median SIZE of the
ICMW (non-ICMW) firms is 5.915 (6.576). The mean SIZE of ICMW firms is
significantly smaller than that of non-ICMW firms. Mean of the SINVRECN
for the ICMW (non-ICMW) firms is 0.356 (0.322) and the median of
SINVRECN for the ICMW (non-ICMW) firms is 0.312 (0.292). We find that,
Table 1. Sample Selection Procedure.
Item Firm-Year
Observation
Total manufacturing firms selected from the COMPUSTAT database for the
period 2004�2011
26,953
Delete observations with missing data in COMPUSTAT Database 11,658
Manufacturing firms after the deletion of observations with missing
COMPUSTAT data
15,295
Deleted industry-year observations with less than 15 observations in a 2-digit
SIC Code
108
Manufacturing industry-year obs. after deleting industry-year observations with
less than 15 records
15,187
Deleted observations with missing Audit Analytics data 6,133
Number of firm-year observations after merging with Audit Analytics Database 9,054
Deleted observations with multiple occurrences 7,230
Number of firm observations after deleting multiple occurrences 1,824
10 NANA Y. AMOAH ET AL.

Table 2. Descriptive Statistics of the Categorical Variables (Panel A) and the Continuous Variables (Panel B).
Panel A
Variable Number of firms Percentage
BIG 6 1,373 75.3
INDVARM 21 1.2
ICMW 407 22.3
Panel B
Variables ICMW firms (ICMW ¼ 1) Non-ICMW firms (ICMW ¼ 0) Difference in means t-test
Mean Median Min Max Std. Mean Median Min Max Std.
LSDEBTN 0.246 0.176 0.000 5.582 0.378 0.218 0.144 0.000 6.880 0.329 0.028*
LCTN 0.308 0.235 0.044 1.597 0.243 0.262 0.222 0.010 9.455 0.336 0.046***
SIZE 6.074 5.915 �0.451 10.923 1.533 6.867 6.576 0.783 12.750 1.803 �0.793***
SINVRECN 0.356 0.312 0.006 2.424 0.253 0.322 0.292 0.000 4.583 0.239 0.034***
MTB 3.540 2.116 �148.6 142.5 15.2 3.418 2.379 �51.6 142.0 6.908 0.122*
INVTURN 7.334 4.107 0.097 247.7 15.9 6.755 4.664 0.000 200.671 9.858 0.579
RECTURN 8.277 6.342 0.133 92.600 8.610 8.334 6.693 0.000 144.269 8.526 �0.057
ROA �0.024 0.009 �3.345 1.151 0.347 0.007 0.063 �27.023 0.947 0.778 �0.031
Table 2 presents descriptive statistics for 1,824 sample firms over the period 2004�2011. Panel A reports the descriptive statistics for the binary independent
variables. BIG 6 is an indicator variable coded 1 if the auditor is a BIG 6 auditor; 0, otherwise. INDVARM equals 1 if ROA is between 0 and 0.005, 0, oth-
erwise. ICMW is an indicator variable coded 1 if internal control material weakness is reported under Section 404, 0, otherwise. Panel B reports the descrip-
tive statistics for the continuous independent variables across the ICMW firms (ICMW ¼ 1) and non-ICMW firms (ICMW ¼ 0). LSDEBTN equals long-
term and short-term debt outstanding normalized by lagged total asset. LCTN equals the variable for current liabilities excluding short-term debt scaled by
total assets. SIZE is the log of the market value of equity. SINVRECN equals the variable for the sum of Inventories and Receivables normalized by total
assets. MTB equals the ratio of market value of equity divided by book value of equity. INVTURN equals inventory turnover ratio. RECTURN equals the
receivables turnover ratio. ROA equals income before extraordinary item scaled by lagged total assets.
Statistical significance at the 1% and 10% levels is denoted by *** and *, respectively.
11
Intern
alContro
lMateria
lWeakness
andRealEarningsManagem
ent

on average, ICMW firms have more scaled inventories and receivables than
non-ICMW firms.
The mean of the ratio of market value of equity to book value of equity
(MTB) for the ICMW (non-ICMW) firms is 3.540 (3.418), while the median of
MTB for the ICMW (non-ICMW) firms is 2.116 (2.379). On an average,
ICMW firms have higher MTB ratio than non-ICMW firms. The means of the
INVTURN, RECTURN, and ROA for the ICMW and non-ICMW firms are
not significantly different.Table 3 reports the univariate results for the 407 ICMW firms and 1,417
non-ICMW firms across ABCFOs, ABPROD, and ABDISEXPs over the
period 2004�2011.The results show that ICMW firms have a lower ABCFOs and a higher
ABPROD compared to non-ICMW firms.
Specifically, the t-test (Wilcoxon test) results indicate a difference in the
mean (median) ABCFOs across the ICMW and non-ICMW firms of �0.097
(�0.045), which is significant at the 1% level. The t-test of the difference
between the mean (median) ABPRODs across the ICMW and non-ICMW
firms of 0.060 (0.041) is also significant at the 1% level. The significant results
of the univariate tests suggest that ICMW firms manage sales through
increased price discounts. In addition, the univariate results imply that ICMW
firms engage in real earnings management through overproduction. Thus, the
evidence from the univariate tests provides a preliminary indication that
ICMW firms engage in real earnings management.
Table 3. Univariate Results for Real Earnings Management across ICMW
and Non-ICMW Reporting Firms.
Variable ICMW ¼ 1
(N ¼ 407)
ICMW ¼ 0
(N ¼ 1,417)
Difference in
Means t-Test
Difference in Medians
Wilcoxon Test
Mean Median Mean Median
ABCFO �0.108 �0.014 �0.011 0.031 �0.097*** �0.045***
ABPROD 0.057 0.025 �0.003 �0.016 0.060*** 0.041***
ABDISEXP �0.017 �0.073 �0.03 �0.064 0.013 �0.009
This table presents the univariate results for 407 ICMW and 1,417 non-ICMW firms across the real
earnings managements measures (abnormal cash flow from operations (ABCFO), abnormal produc-
tion cost (ABPROD), and abnormal discretionary expenses (ABDISEXP)) over the period
2004�2011. ICMW is an indicator variable coded 1 if internal control material weakness is reported
under Section 404, 0, otherwise. ABCFO equals the deviations from the predicted values from the
corresponding industry-year regression for the normal or expected cash flow from operations.
ABPROD equals the deviations from the predicted values from the corresponding industry-year
regression for normal production cost. ABDISEXP equals the deviations from the predicted values
from the corresponding industry-year regression for normal discretionary expenses.
Statistical significance at the 1% level is denoted by ***.
12 NANA Y. AMOAH ET AL.

Table 4 shows the results of the regressions of the ABCFOs, ABPROD, and
ABDISEXPs on ICMW, audit quality (BIG 6), motivation for real earnings
management (INDVARM), absolute discretionary accruals (ABSDA) and
other variables.We find that the estimated coefficient of ICMW in the ABCFO regression
(Column 1) is negative and significant at the 5% level. We also find that the
Table 4. Regressions of ABCFO, ABPROD, and ABDISEXP.
Variable ABCFO ABPROD ABDISEXP
Coefficient estimate
(t-statistic)
Coefficient estimate
(t-statistic)
Coefficient estimate
(t-statistic)
Intercept 0.176*** (2.98) �0.085** (�2.38) �0.410*** (�4.09)
ICMW �0.060** (�2.08) 0.041** (2.33) �0.032 (�0.66)
SIZE �0.012 (�1.58) 0.002 (0.45) 0.014 (1.10)
MTB �0.005*** (�3.85) �0.001 (�1.17) 0.005** (2.46)
ROA 0.409*** (9.09) �0.154*** (�5.65) �0.334*** (�4.37)
INDVARM �0.065 (�0.58) 0.032 (0.48) �0.005 (�0.03)
LSDEBTN �0.051 (�1.17) 0.079*** (3.02) �0.136* (�1.86)
LCTN �0.055 (�0.63) 0.032 (0.61) 0.436*** (2.97)
BIG 6 0.030 (1.04) �0.012 (�0.68) 0.065 (1.33)
SINVRECN �0.182** (�2.53) 0.225*** (5.15) 0.079 (0.65)
INVTURN 0.000 (0.90) �0.000 (�0.29) �0.000 (�1.64)
RECTURN �0.005*** (�3.20) �0.002* (�1.80) 0.012*** (4.88)
ABSDA �0.027 (�0.48) �0.008 (�0.24) 0.574*** (6.09)
Adj. R2 0.0752 0.0608 0.0544
F-value 12.95 10.51 9.45
P-value <0.0001 <0.0001 <0.0001
This Table presents regressions of the abnormal cash flow from operations (ABCFO) in Column 1,
abnormal production cost (ABPROD) in Column 2, and abnormal discretionary expenses
(ABDISEXP) in Column 3. ABCFO equals the deviations from the predicted values from the corre-
sponding industry-year regression for the normal or expected cash flow from operations. ABPROD
equals the deviations from the predicted values from the corresponding industry-year regression for
normal production cost. ABDISEXP equals the deviations from the predicted values from the corre-
sponding industry-year regression for normal discretionary expenses. ICMW is an indicator variable
coded 1 if internal control material weakness is reported under Section 404, 0, otherwise. SIZE is the
log of the market value of equity. MTB equals the ratio of market value of equity divided by book
value of equity. ROA equals income before extraordinary item scaled by lagged total assets.
INDVARM equals 1 if ROA is between 0 and 0.005, 0, otherwise. LSDEBTN equals long-term and
short-term debt outstanding normalized by lagged total asset. LCTN equals the variable for current
liabilities excluding short-term debt scaled by total assets. BIG 6 is an indicator variable coded 1 if
the auditor is a BIG 6 auditor; 0, otherwise. SINVRECN equals the variable for the sum of
Inventories and Receivables normalized by total assets. INVTURN equals inventory turnover ratio.
RECTURN equals the receivables turnover ratio. ABSDA is the absolute discretionary accruals.
Statistical significance at the 1%, 5%, and 10% levels is denoted by ***, ** and *, respectively.
13Internal Control Material Weakness and Real Earnings Management

estimated coefficient of ICMW in the ABPROD regression (Column 2) is posi-
tive and significant at the 5% level.
Consistent with the expectation that firms under pressure to sustain growth
grant excessive price discounts to manage sales, we find that the coefficient esti-
mate of MTB (market to book value of equity) in the ABCFO regression
(Column 1) is negative and significant at the 1% level. The coefficient estimate
of LSDEBTN is positive and significant at the 1% level in the ABPROD
regression and negative and significant at the 10% level in the ABDISEXPs
regression. Accordingly, the results for the estimates of LSDEBTN provide evi-
dence that firms with higher debt levels use overproduction and the reduction
of discretionary expenses as real earnings management tools to avoid tighter
debt covenants.
The coefficient estimates of SINVRECN are significant and negative
(positive) in the ABCFO (ABPROD) regressions, implying that firms, which
customarily maintain high stocks of inventory and offer substantial credit sales
to customers in the normal course of operations, grant excessive price discounts
and overproduce to manage earnings. The variance inflation factors of all the
regressions are between 1.04 and 1.98, which implies that multicollinearity is
not an issue.
ROBUSTNESS CHECK
Self-Selection of Internal Control Material Weakness
There exists the possibility of selection bias in our study as firms can choose the
quality of their internal controls, their efforts to discover weaknesses and the
disclosure of any known weaknesses (Ashbaugh-Skaife et al., 2008). We econo-
metrically test for self-selection bias by using the Heckman (1979) two-stage
approach. We follow Sartori (2003) by formulating a selection equation that is
different from the outcome equation. The first stage model is a probit regres-
sion of ICMW on the determinants of material weakness and the variables we
employ as the determinants of selection are presented in Table 5.We next use the parameters from the first stage selection model to compute
an Inverse Mills Ratio (IMR) for our real earnings management models:
ABCFOs, ABDISEXPs, and ABPROD. In the second stage, we include the
IMR in each of our real earnings management regressions.
As shown in Table 6, the IMR Coefficients in the prediction models are not
statistically significant as the t-values are �0.946, 0.234, and 0.542, respectively,
while the p-values are 0.344, 0.815, and 0.588, respectively. Accordingly, we
conclude that there is no indication of selection bias.
14 NANA Y. AMOAH ET AL.

Table 5. Determinants of Material Weaknesses � First-Stage Estimation.
Dependent Variable ¼ Material
Weakness (ICMW)
Variable Predicted Sign
Coefficient Estimate p-Value
Intercept 0.129 0.461
SIZE � �0.184 0.000***
MTB þ 0.003 0.454
ROA þ 0.007 0.956
INDVARM þ 0.489 0.093*
LSDEBTN þ 0.147 0.242
LCTN þ 0.967 0.000***
BIG 6 � �0.107 0.201
SINVRECN � �0.254 0.216
INVTURN � �0.001 0.906
RECTURN � �0.000 0.963
FOREIGN CURRENCY þ 0.224 0.005***
ABSDA þ 0.223 0.125
This table presents the (first-stage Heckman model) probit regression of ICMW on the determinants
of material weaknesses. ICMW is an indicator variable coded 1 if internal control material weakness
is reported under Section 404, 0, otherwise. SIZE is the log of the market value of equity. MTB
equals the ratio of market value of equity divided by book value of equity. ROA equals income
before extraordinary item scaled by lagged total assets. INDVARM equals 1 if ROA is between 0
and 0.005, 0, otherwise. LSDEBTN equals long-term and short-term debt outstanding normalized
by lagged total asset. LCTN equals the variable for current liabilities excluding short-term debt
scaled by total assets. BIG 6 is an indicator variable coded 1 if the auditor is a BIG 6 auditor; 0,
otherwise. SINVRECN equals the variable for the sum of Inventories and Receivables normalized by
total assets. INVTURN equals inventory turnover ratio. RECTURN equals the receivables turnover
ratio. FOREIGN CURRENCY is an indicator variable coded one if the foreign currency translation
dollar amount is greater than 0, and 0 otherwise. ABSDA is the absolute discretionary accruals.
Statistical significance at the 1% and 10% levels is denoted by *** and *, respectively.
Table 6. Determinants of Self-Selection Bias � Second-Stage Outcomes.
Dependent Variable IMR t Value p-Value
ABCFO �0.1528 �0.946 0.344
ABPROD 0.0202 0.234 0.815
ABDISEXP 0.1401 0.542 0.588
This table presents the second-stage Heckman model. ABCFO equals the deviations from the pre-
dicted values from the corresponding industry-year regression for the normal or expected cash flow
from operations. ABPROD equals the deviations from the predicted values from the corresponding
industry-year regression for normal production cost. ABDISEXP equals the deviations from the pre-
dicted values from the corresponding industry-year regression for normal discretionary expenses.
IMR is the Inverse Mills Ratio.
15Internal Control Material Weakness and Real Earnings Management

CONCLUSION
In this study, we examine the relation between firms reporting material weak-
ness in internal control (ICMW) under Section 404 of SOX and real earnings
management. Our findings suggest that to achieve earnings targets, ICMW
firms manage sales by granting excessive price discounts. Another result that
emerges from the study is that ICMW firms engage in overproduction to attain
earnings targets.
We find that highly financially leveraged firms as well as firms with large
stocks of inventories and receivables engage in overproduction to manage earn-
ings. In addition, we report that firms with high growth opportunities and firms
with large stocks of inventories and receivables manage earnings by granting
excessive price discounts to boost sales. The reported relations between real
earnings management and financial leverage, growth opportunities, and the
stocks of inventories and receivables are consistent with the findings of
Roychowdhury (2006).Given that we focus on manufacturing industry firms, our results imply that
manufacturing firms with ICMW appear to predominantly use overproduction
and excessive price discounts to accomplish real earnings management. Our
finding of an association between ICMW and ABPRODs is noteworthy as
Roychowdhury (2006) notes that overproduction as an earnings management
strategy is only available to manufacturing firms.As SOX Section 404 is designed to reduce the instances of firms having
ICMW, our finding that ICMW firms engage in real earnings management
implies that real earnings management could be reduced as SOX Section 404
succeeds in reducing ICMW.
Given that our finding of an association between ICMW and real earnings
management suggests that the management of real activities by ICMW firms
may be opportunistic, we note the possibility that our findings may not be
driven by managerial opportunism. We accept the possibility that overproduc-
tion combined with the granting of price discounts to boost sales could be con-
sistent with reaching optimal production quantity and an effective strategy to
increase firm value, especially by the management of manufacturing firms with
high FMO.
Accordingly, to shed more light on whether managers of ICMW firms
engage in opportunistic real earnings management, we suggest that future stud-
ies examine whether ICMW firms engage in real earnings management to
improve current performance at the expense of future operating and stock price
performance. Finally, we note that additional insights on the role of ICMW in
management’s earnings management decisions could be obtained from an
investigation of the relation between the remediation of ICMW and real earn-
ings management. We leave this as an additional direction for future research.
16 NANA Y. AMOAH ET AL.

NOTES
1. We focus on the auditor’s assessment of the effectiveness of internal control.2. We note that the reduction of operating cash flows can be attributed to other real
activities such as overproduction and the relaxation of credit terms to customers.3. While we acknowledge that the use of a manufacturing firm sample may limit the
generalizability of our results, the restriction of our sample to manufacturing firms pro-vides important evidence on the association between ICMW and real earnings manipula-tion, particularly among manufacturing firms. Roychowdhury (2006) notes that bothmanufacturing and nonmanufacturing firms can offer price discounts to boost sales butoverproduction as an earnings management strategy is only available to manufacturingfirms. Accordingly, our finding of an association between ICMW and ABPROD is note-worthy as it is based on a sample of manufacturing firms.
4. In a Speech on the developments within the SEC and PCAOB at the 2004 AICPANational Conference in Washington, DC on December 6, 2004, Don Nicolaisen, formerChief Accountant of the US SEC emphasized that the primary objective of the SOX is toenhance financial reporting to better serve the needs of investors. Investors, he noted,expect organizations to have effective processes and strong internal controls to enhancethe credibility and integrity of financial reporting. He noted that despite the huge costassociated with its implementation, the SOX is necessary to protect capital markets,which thrive on faith and trust. He noted that investor confidence waned significantlyafter the financial scandals, making it necessary for the stringent controls under the SOX(PCAOB, 2004).
5. According to Beasley and Salterio (2001), the attestation of the internal controls offirms by auditors implies that they can be considered as an integral component of anorganization’s corporate governance mechanism.
6. Ashbaugh-Skaife et al. (2007) justify the inclusion of Grant Thornton andBDO Seidman as part of the largest six audit firms as follows: “We classify BDOSeidman, Deloitte and Touche, Ernst and Young, Grant Thornton, KPMG, andPricewaterhouseCoopers as the dominant audit suppliers. We include BDO Seidman andGrant Thornton in the dominant auditor classification because these two firms acquireda significant number of SEC reporting clients following the demise of Arthur Andersen,which resulted in these firms facing additional litigation risk related to internal controldeficiency reporting.”
7. Roychowdhury (2006) finds that firms with high debt are more likely to engage inreal earnings management to avoid tighter debt covenants from lenders.
8. For a full sample of 21,758 firm-years, Roychowdhury (2006) reports 503 firm-yearswith ROA between 0 and 0.005 which represents 2.3% of the total firm-years.
REFERENCES
Ashbaugh-Skaife, H., Collins, D., Kinney, W. R., & LaFond, R. (2008). The effect of SOX internal
control deficiencies and their remediation on accrual quality. Accounting Review, 83(1),
217–250.
Ashbaugh-Skaife, H., Collins, D. W., & Kinney, W. R. (2007). The discovery and reporting of inter-
nal control deficiencies prior to SOX-mandated audits. Journal of Accounting and Economics,
44, 166�192.
Baber, W., Fairfield, P. M., & Haggard, J. A. (1991). The effect of concern about reported income
on discretionary spending decisions: The case of research and development. Accounting
Review, 66(4), 818�829.
17Internal Control Material Weakness and Real Earnings Management

Beasley, M., & Salterio, S. (2001). The relationship between board characteristics and voluntary
improvements in the capability of audit committees to monitor. Contemporary Accounting
Research, 18(4), 539–570.
Blokdijk, H., Drieenhuizen, F., Simunic, D., & Stein, M. (2006). An analysis of cross-sectional dif-
ferences in big and non-big public accounting firms’ audit programs. Auditing: A Journal of
Practice and Theory, 25(1), 27�48.
Bushee, B. (1998). The influence of institutional investors on myopic R&D investment behavior.
Accounting Review, 71(3), 305�333.
Chi, W., Lisic, L. L., & Pevzner, M. (2011). Is enhanced audit quality associated with greater real
earnings management? Accounting Horizons, 25(2), 315�335.
Cohen, D. A., & Zarowin, P. (2010). Accrual-based and real earnings management activities around
seasoned equity offerings. Journal of Accounting and Economics, 50, 2�19.
Cohen, D. A., Dey, A., & Lys, T. Z. (2008). Real and accrual-based earnings management in the
pre- and post-Sarbanes-Oxley periods. Accounting Review, 83(3), 757�787.
Dechow, P., Kothari, S., & Watts, R. R. (1998). Executive incentives and the horizon problem.
Journal of Accounting and Economics, 14, 51�89.
Dechow, P., Sloan, R., & Sweeney, A. (1995). Detecting earnings management. Accounting Review,
70(2), 193–225.
Franz, D. R., HassabElnaby, H. R., & Lobo, G. J. (2014). Impact of proximity to debt covenant
violation on earnings management. Review of Accounting Studies, 41(1), 89�107.
Graham, J. R., Harvey, C. R., & Rajgopal, S. (2005). The economic implications of corporate finan-
cial reporting. Journal of Accounting and Economics, 40(1�3), 3�73.
Gunny, K. (2010). The relation between earnings management using real activities manipulation and
future performance: Evidence from meeting earnings benchmarks. Contemporary Accounting
Research, 27(3), 855�888.
Gupta, M., Pevzner, M., & Seethamraju, C. (2010). The implications of absorption cost accounting
and production decisions for future firm performance and valuation. Contemporary
Accounting Research, 27(3), 889�922.
Heckman, J. (1979). Sample selection bias as a specification error. Econometrica, 47(1), 153�161.
Hogan, C E., Lambert, T A., & Schmidt, J J. (2013). Do management internal control certifications
increase the likelihood of restatement-related litigation? Retrieved from http://www.ssrn.com/
abstract¼2169553 or doi:10.2139/ssrn.2169553. Accessed on April 2017.
Kim, J.-B., & Sohn, B. C. (2013). Real earnings management and cost of capital. Journal of
Accounting and Public Policy, 32, 518�543.
Lopez, T. J., Vandervelde, S. D., & Wu, Y. (2009). Investor perceptions of an auditor’s adverse
internal control opinion. Journal of Accounting and Public Policy, 28(3), 231�250.
Mizik, N., & Jacobson, R. (2007). Myopic marketing management: Evidence of the phenomenon
and its long-term performance consequences in the SEO context. Marketing Science, 26,
361�379.
PCAOB. (2004). Auditing standard No. 2, an audit of internal control over financial reporting per-
formed in conjunction with an audit of financial statements. Washington, DC: Public Company
Accounting Oversight Board.
Raghunandan, K., & Rama, D. V. (2006). SOX Section 404 material weakness disclosures and audit
fees. Auditing: A Journal of Practice and Theory, 25(1), 99�114.
Rezee, Z., Espahbodi, R., Espahbodi, P., & Espahbodi, H. (2012). Firm characteristics and stock
price reaction to SOX 404 compliance. Abacus, 48(4), 473�501.
Roychowdhury, S. (2006). Earnings management through real activities manipulation. Journal of
Accounting and Economics, 42, 335�370.
Sartori, A. (2003). An estimator for some binary-outcome selection models without exclusion restric-
tions. Political Analysis, 11, 111�138.
Solomon, D. (2005). Accounting rule exposes problems but draws complaints about costs. Wall
Street Journal, March 2, p. 1.
18 NANA Y. AMOAH ET AL.

Turner, J. (2010). Changes in litigation risk: an analysis of post-Sarbanes Oxley audit portfolios.
Journal of Forensic and Investigative Accounting, 2(2), 159�228.
Xu, L., & Tang, A. P. (2012). Internal control material weakness, analysts accuracy and bias, and
brokerage reputation. Review of Quantitative Finance and Accounting, 39(1), 27�53.
Zang, A. (2012). Evidence on the tradeoff between real manipulation and accrual manipulation.
Accounting Review, 87(2), 675�703.
19Internal Control Material Weakness and Real Earnings Management

APPENDIX
Variable descriptions
ICMW An indicator variable coded one if the firm has disclosed internal control
material weakness under Section 404 in year t and 0 otherwise
BIG 6 An indicator variable coded one if the auditor is a BIG 6 auditor,
0 otherwise
MVOE The market value of equity extracted from the COMPUSTAT database
A Total Assets from the COMPUSTAT database
BVOE The book value of equity from the COMPUSTAT database
IBEI Income before extraordinary items from the COMPUSTAT database
CFO Cash flow from operations from the COMPUSTAT database
ACCRUAL IBEI � CFO
COGS Cost of goods sold from the COMPUSTAT database
Production costs
(PROD)
COGS þ Change in inventory from the COMPUSTAT database
normalized by lagged assets
Discretionary expenses
(DISEXP)
R&D þ Advertising þ Selling, General, and Administrative expenses.
If SG&A is present, advertising and R&D are set to zero if they are
missing. All the three variables are from the COMPUSTAT database.
The figure is normalized by lagged assets
S Sales from the COMPUSTAT database
ΔS Change in sales
ROA Net income divided by lagged of total assets
INDVARM Indicator variable for motive to engage in real earnings management.
Dummy variable of 1 if ROA is between 0 and 0.005, and 0 otherwise
INVTURN COGS/Average Inventory. Average inventory is (Beginning Inventory þEnding Inventory)/2
RECTURN Sales/Average Receivables. Average receivables is (Beginning gross
receivables þ Ending gross receivables)/2
ABCFO Abnormal cash flow from operations measured as the deviations from
the predicted values from the corresponding industry-year regression
for CFON
ABPROD Abnormal production cost measured as deviations from the predicted
values from the corresponding industry-year regression for PRODN
ABDISEXP Abnormal discretionary expenses, measured as deviations from the
predicted values from the corresponding industry-year regression for
DISEXPN
IMR Inverse Mills ratio
NI Income before extraordinary items (IBEI) scaled by lagged total
assets (A)
SIZE Logarithm of the MVOE
MTB The ratio of MVOE divided by BVOE
20 NANA Y. AMOAH ET AL.

(Continued )
LSDEBTN Long-term and short-term debt outstanding normalized by lagged
total asset
LCTN Current Liabilities excluding short-term debt scaled by total assets
SINVRECN The sum of Inventories and Receivables expressed as a percentage of
total assets
FOREIGN
CURRENCY
An indicator variable coded one if the foreign currency translation
dollar amount is greater than zero, and zero otherwise
21Internal Control Material Weakness and Real Earnings Management


