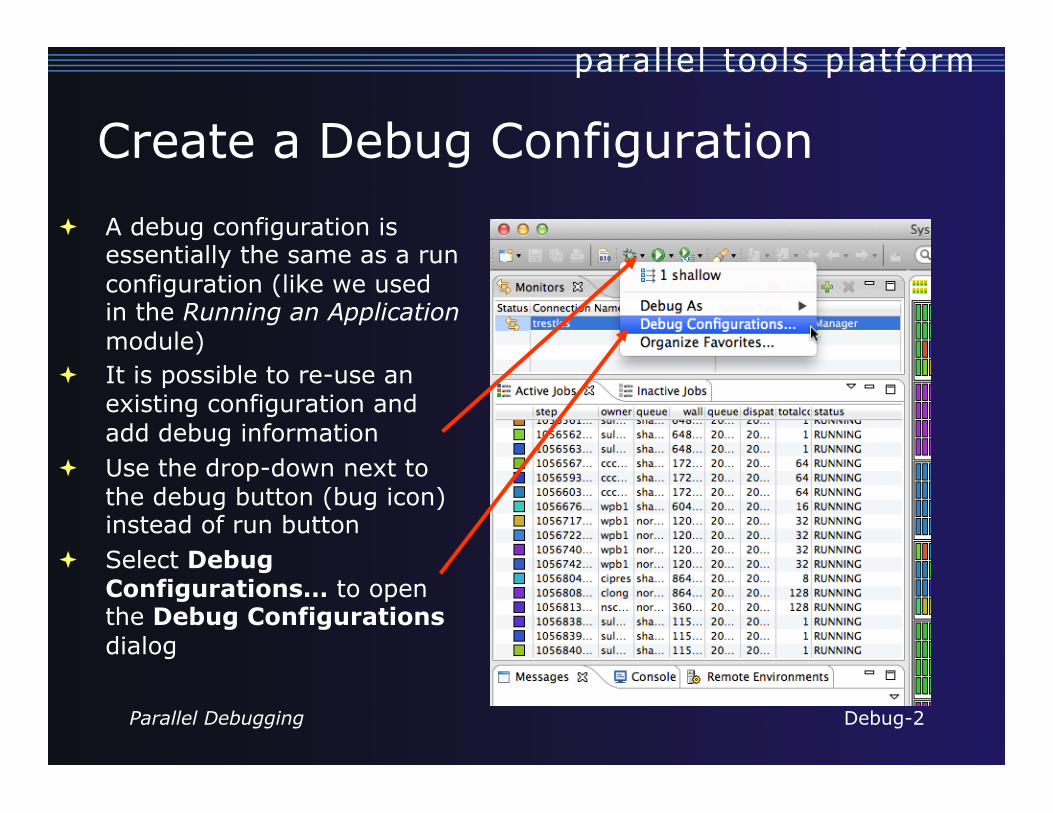
Create a Debug Configuration ª A debug configuration is
essentially the same as a run configuration (like we used in the Running an Application module)
ª It is possible to re-use an existing configuration and add debug information
ª Use the drop-down next to the debug button (bug icon) instead of run button
ª Select Debug Configurations… to open the Debug Configurations dialog
Parallel Debugging Debug-2
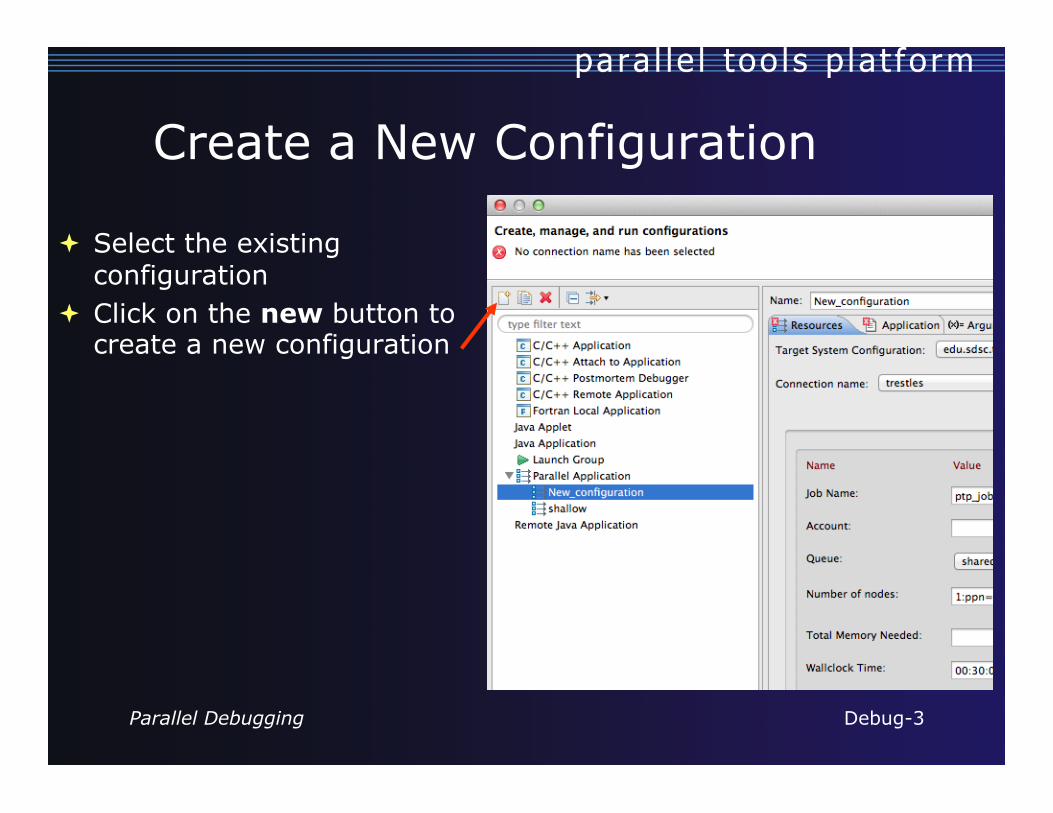
Create a New Configuration
ª Select the existing configuration
ª Click on the new button to create a new configuration
Parallel Debugging Debug-3
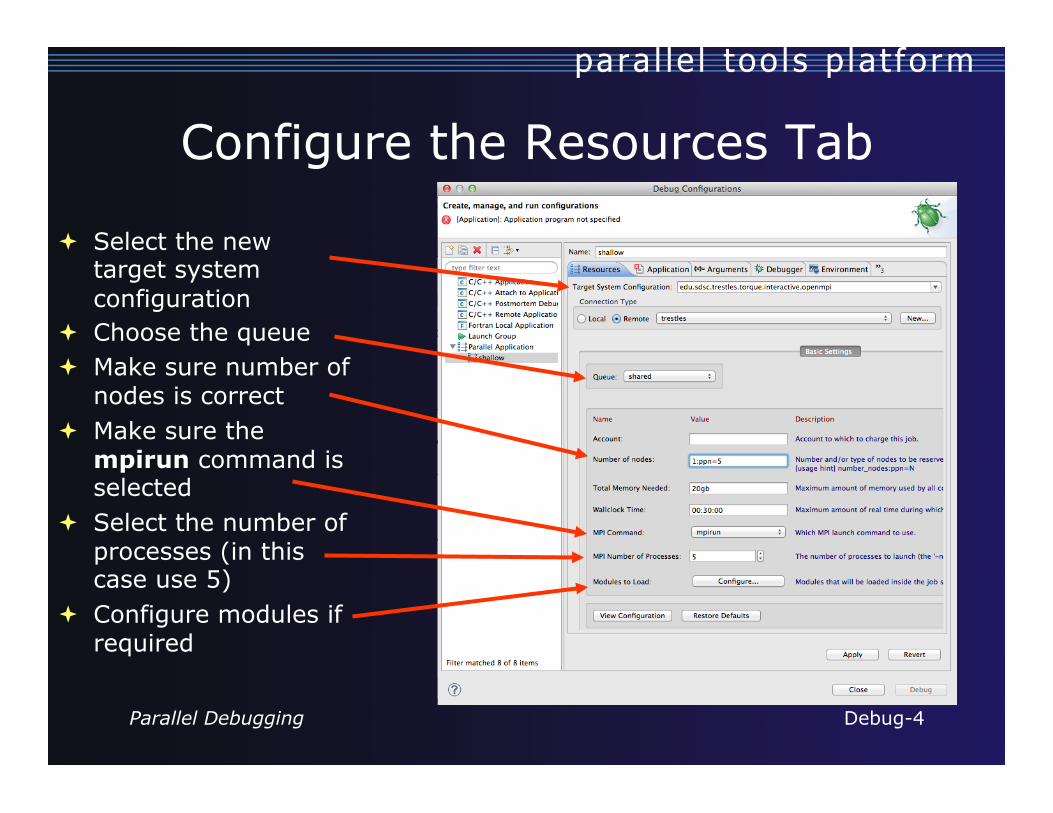
Configure the Resources Tab
ª Select the new target system configuration
ª Choose the queue ª Make sure number of
nodes is correct ª Make sure the
mpirun command is selected
ª Select the number of processes (in this case use 5)
ª Configure modules if required
Parallel Debugging Debug-4
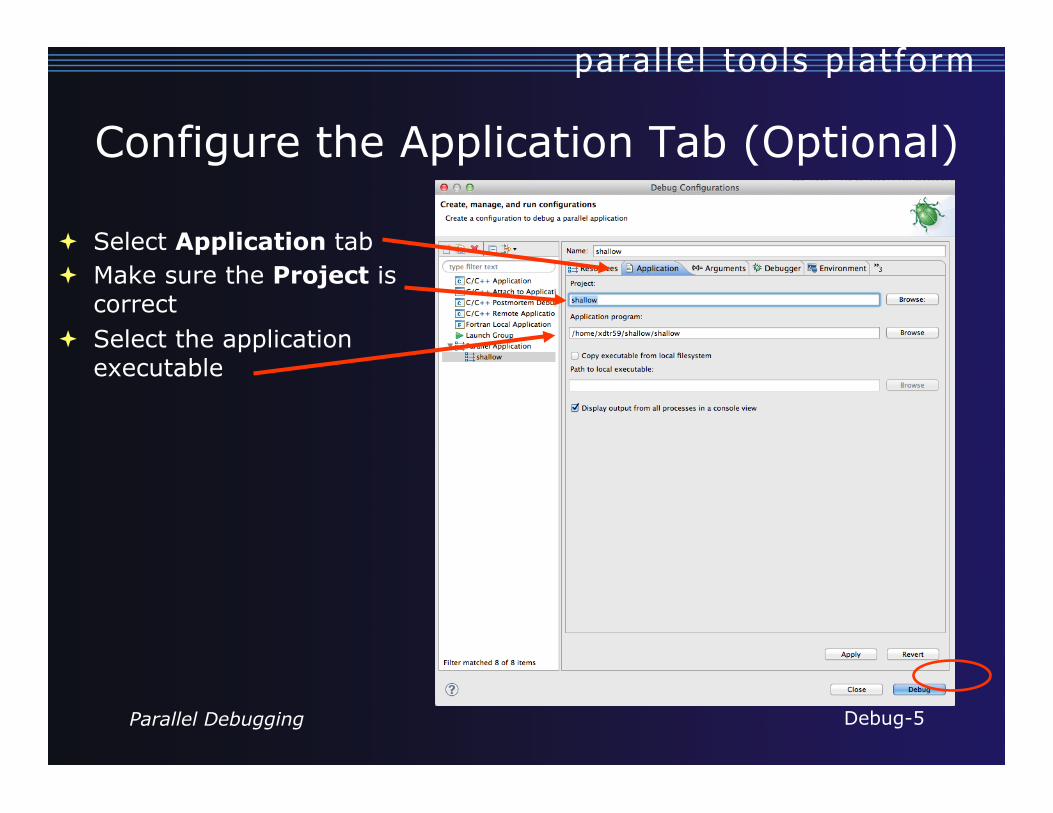
Configure the Application Tab (Optional)
ª Select Application tab ª Make sure the Project is
correct ª Select the application
executable
Parallel Debugging Debug-5
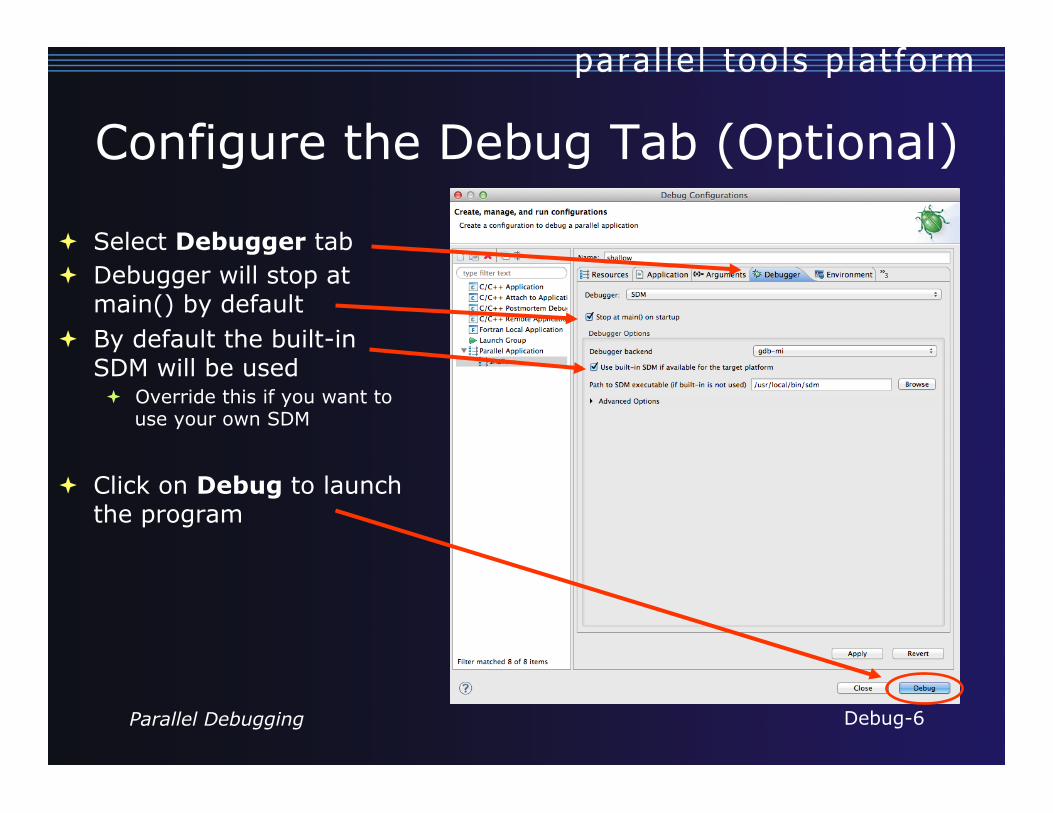
Configure the Debug Tab (Optional)
ª Select Debugger tab ª Debugger will stop at
main() by default ª By default the built-in
SDM will be used ª Override this if you want to
use your own SDM
ª Click on Debug to launch
the program
Parallel Debugging Debug-6
Exercise
1. Open the debug configuration dialog 2. Create a new configuration 3. Select the edu.sdsc.trestles.torque.interactive.openmpi
target configuration 4. Configure the Debug tab
ª Queue: shared ª Number of nodes: 1:ppn=5 ª MPI Command: mpirun ª MPI Number of Processes: 5
5. Launch the debugger
Parallel Debugging Debug-7
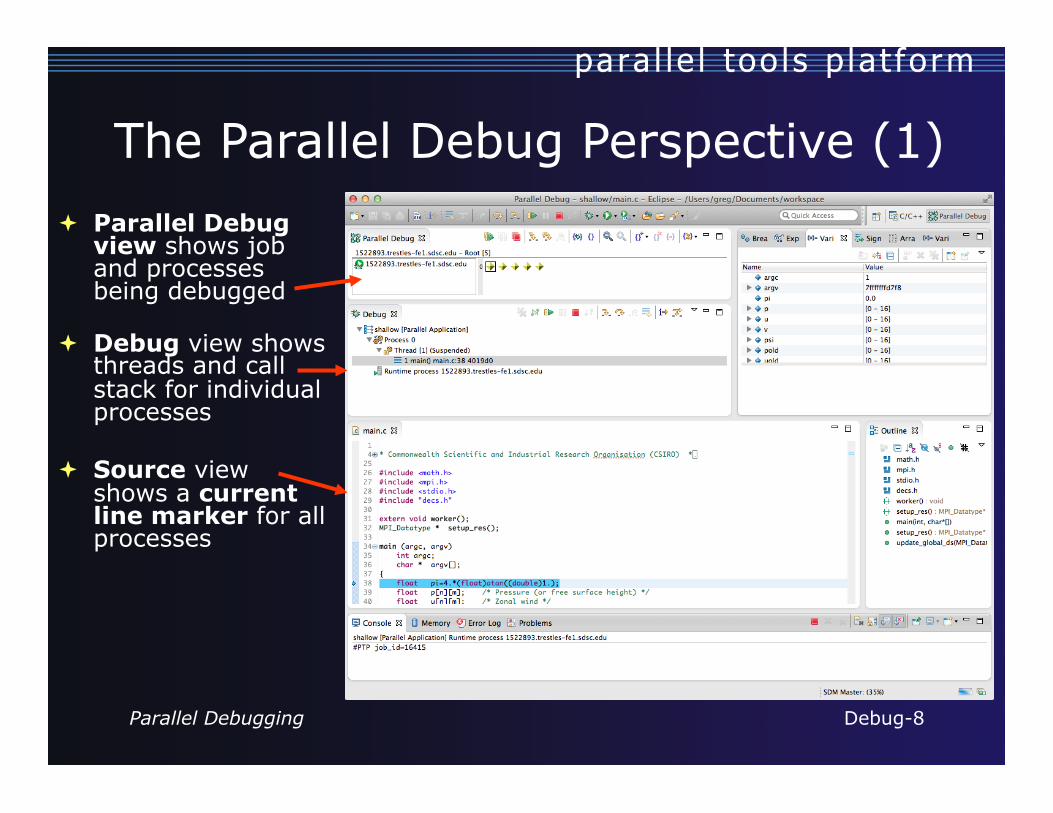
ª Parallel Debug view shows job and processes being debugged
ª Debug view shows threads and call stack for individual processes
ª Source view shows a current line marker for all processes
The Parallel Debug Perspective (1)
Parallel Debugging Debug-8
The Parallel Debug Perspective (2) ª Breakpoints view
shows breakpoints that have been set (more on this later)
ª Variables view shows the current values of variables for the currently selected process in the Debug view
ª Outline view (from CDT) of source code
Parallel Debugging Debug-9
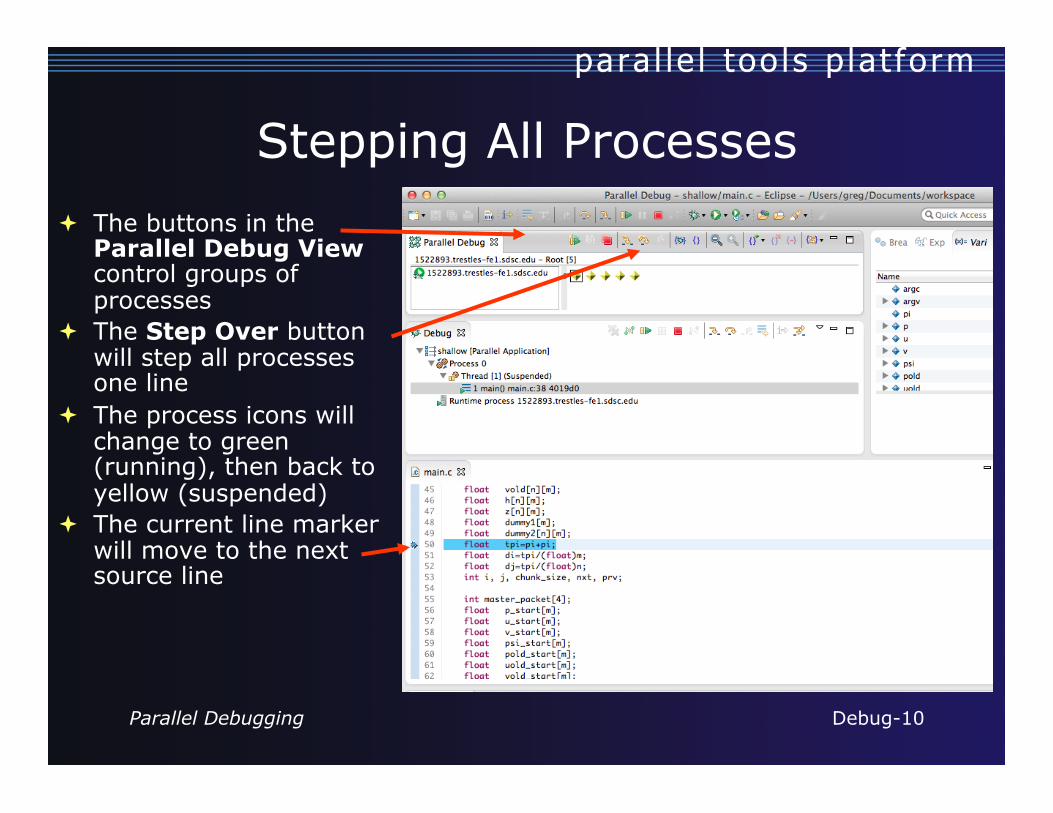
Stepping All Processes ª The buttons in the
Parallel Debug View control groups of processes
ª The Step Over button will step all processes one line
ª The process icons will change to green (running), then back to yellow (suspended)
ª The current line marker will move to the next source line
Parallel Debugging Debug-10
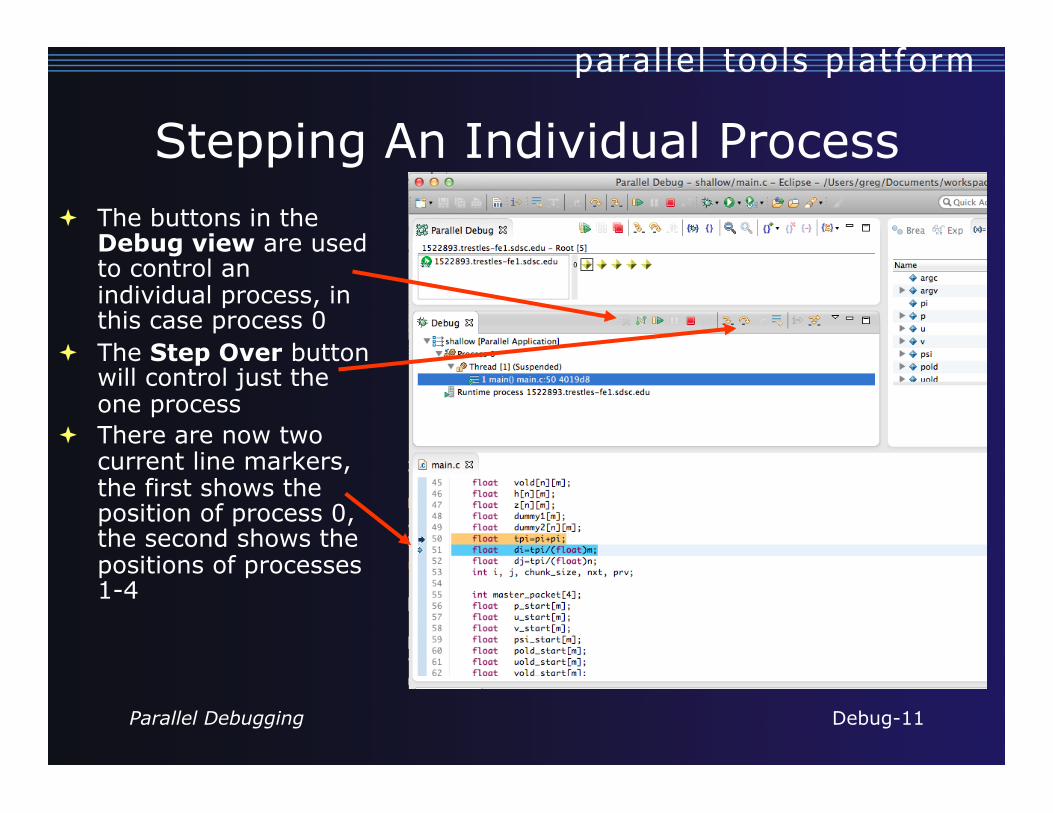
Stepping An Individual Process ª The buttons in the
Debug view are used to control an individual process, in this case process 0
ª The Step Over button will control just the one process
ª There are now two current line markers, the first shows the position of process 0, the second shows the positions of processes 1-4
Parallel Debugging Debug-11
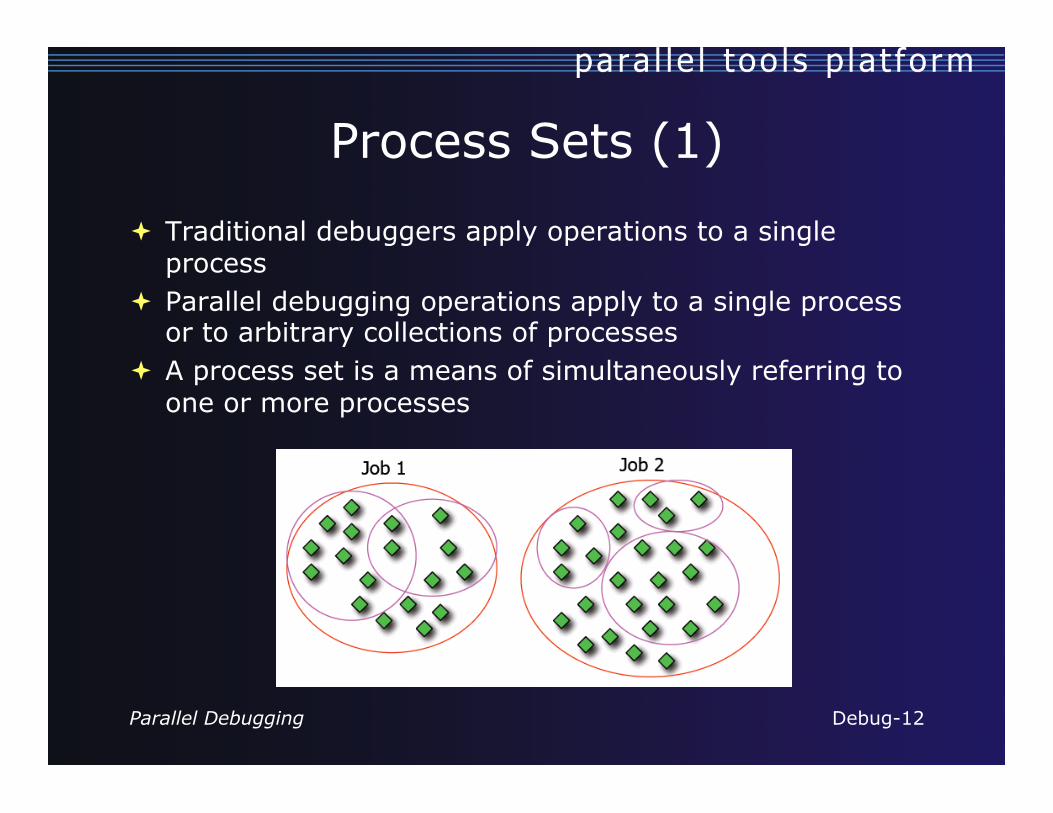
Process Sets (1)
ª Traditional debuggers apply operations to a single process
ª Parallel debugging operations apply to a single process or to arbitrary collections of processes
ª A process set is a means of simultaneously referring to one or more processes
Parallel Debugging Debug-12
Process Sets (2)
ª When a parallel debug session is first started, all processes are placed in a set, called the Root set
ª Sets are always associated with a single job ª A job can have any number of process sets ª A set can contain from 1 to the number of processes in
a job
Parallel Debugging Debug-13
Operations On Process Sets ª Debug operations on the
Parallel Debug view toolbar always apply to the current set: ª Resume, suspend, stop,
step into, step over, step return
ª The current process set is listed next to job name along with number of processes in the set
ª The processes in process set are visible in right hand part of the view
Root set = all processes
Parallel Debugging Debug-14
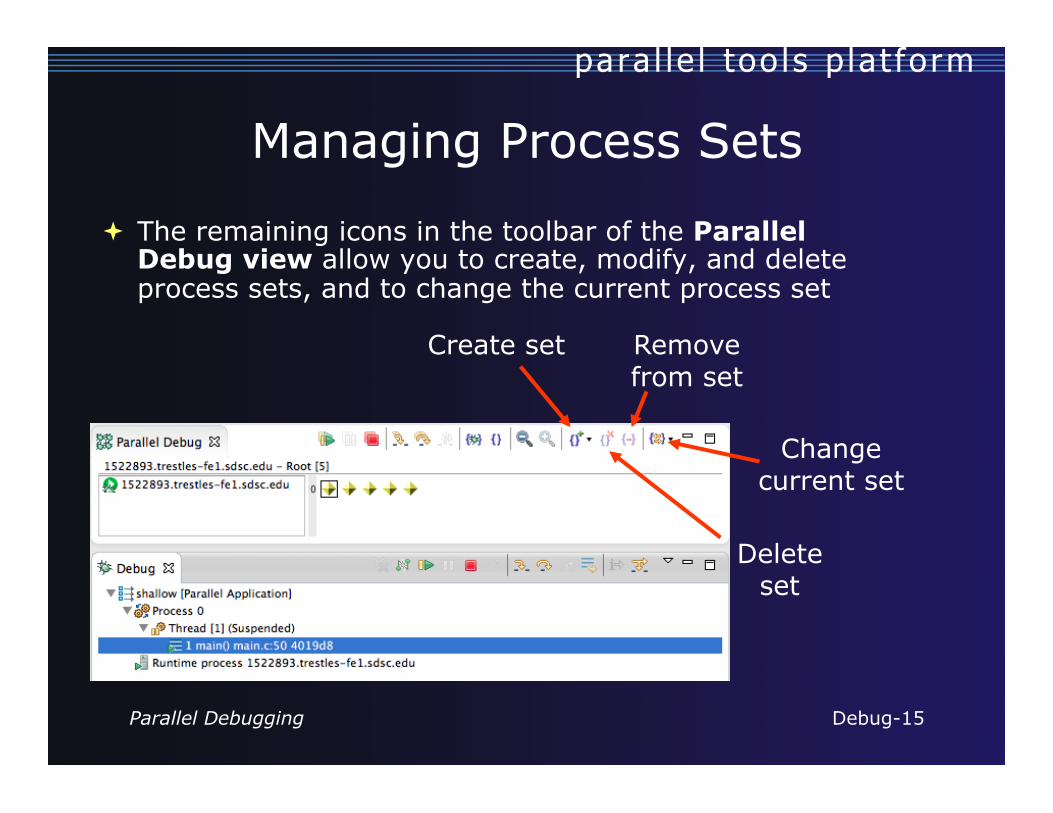
Create set Remove from set
Delete set
Change current set
Managing Process Sets
ª The remaining icons in the toolbar of the Parallel Debug view allow you to create, modify, and delete process sets, and to change the current process set
Parallel Debugging Debug-15
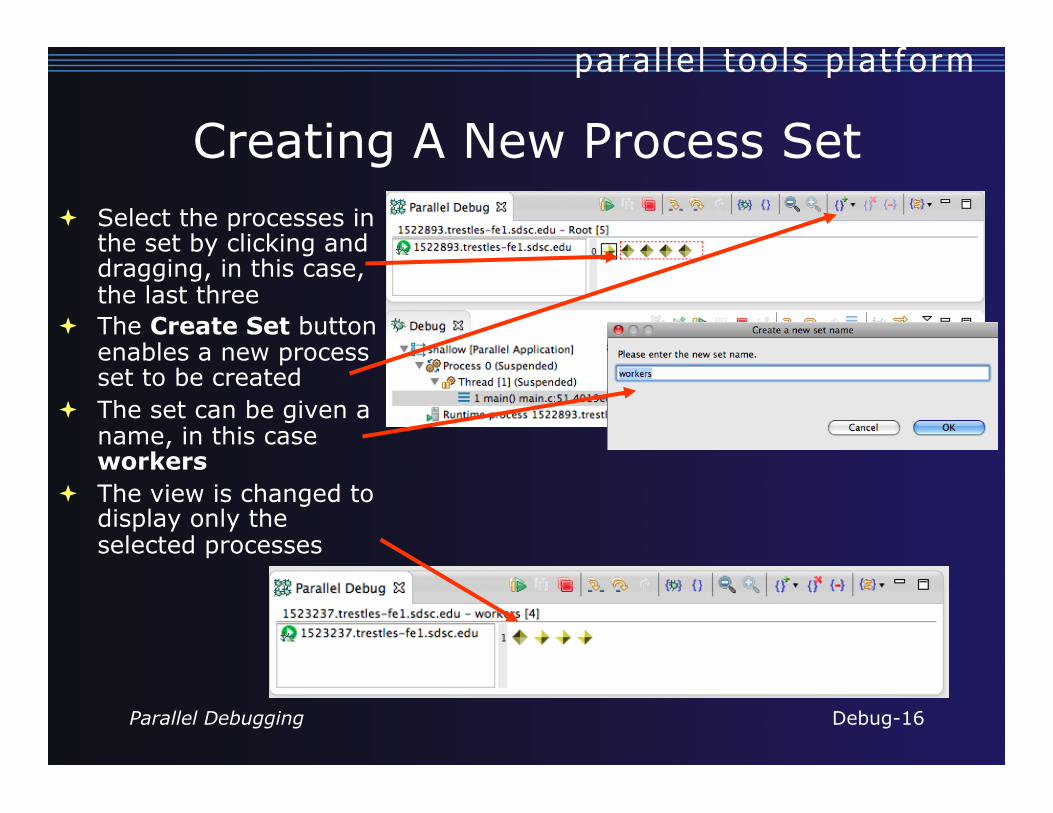
Creating A New Process Set ª Select the processes in
the set by clicking and dragging, in this case, the last three
ª The Create Set button enables a new process set to be created
ª The set can be given a name, in this case workers
ª The view is changed to display only the selected processes
Parallel Debugging Debug-16
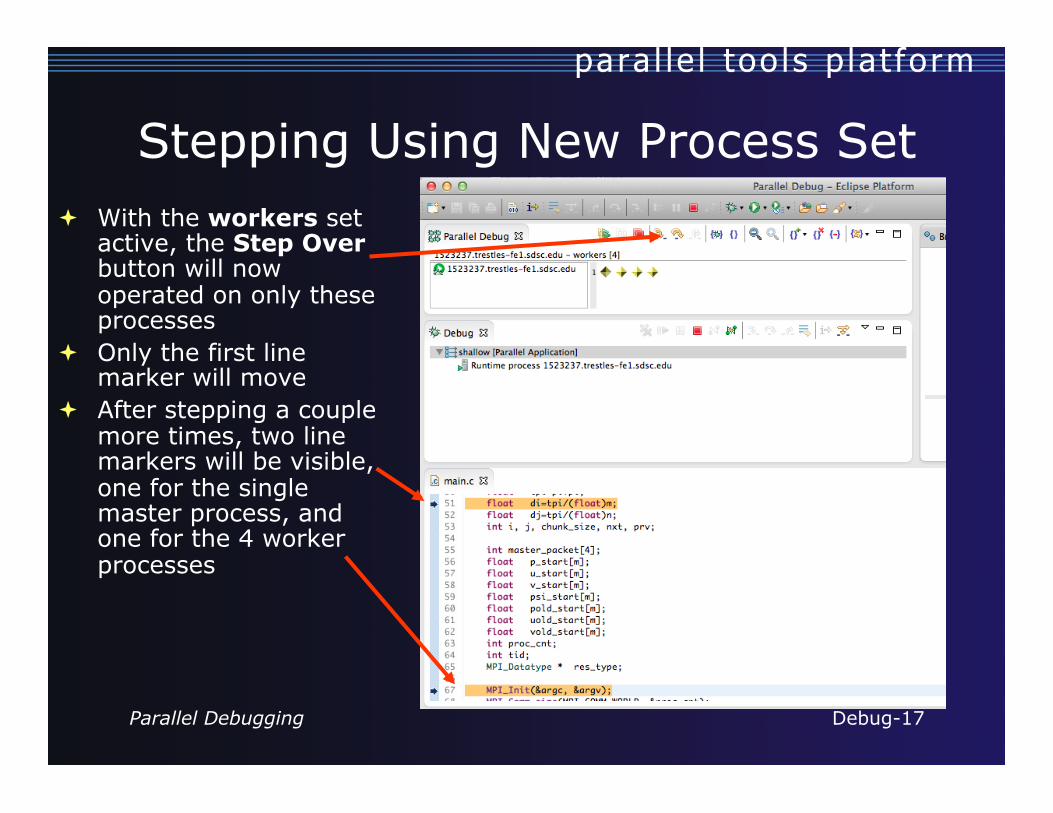
Stepping Using New Process Set ª With the workers set
active, the Step Over button will now operated on only these processes
ª Only the first line marker will move
ª After stepping a couple more times, two line markers will be visible, one for the single master process, and one for the 4 worker processes
Parallel Debugging Debug-17
Process Registration
ª Process set commands apply to groups of processes
ª For finer control and more detailed information, a process can be registered and isolated in the Debug view
ª Registered processes, including their stack traces and threads, appear in the Debug view
ª Any number of processes can be registered, and processes can be registered or un-registered at any time
Parallel Debugging Debug-18
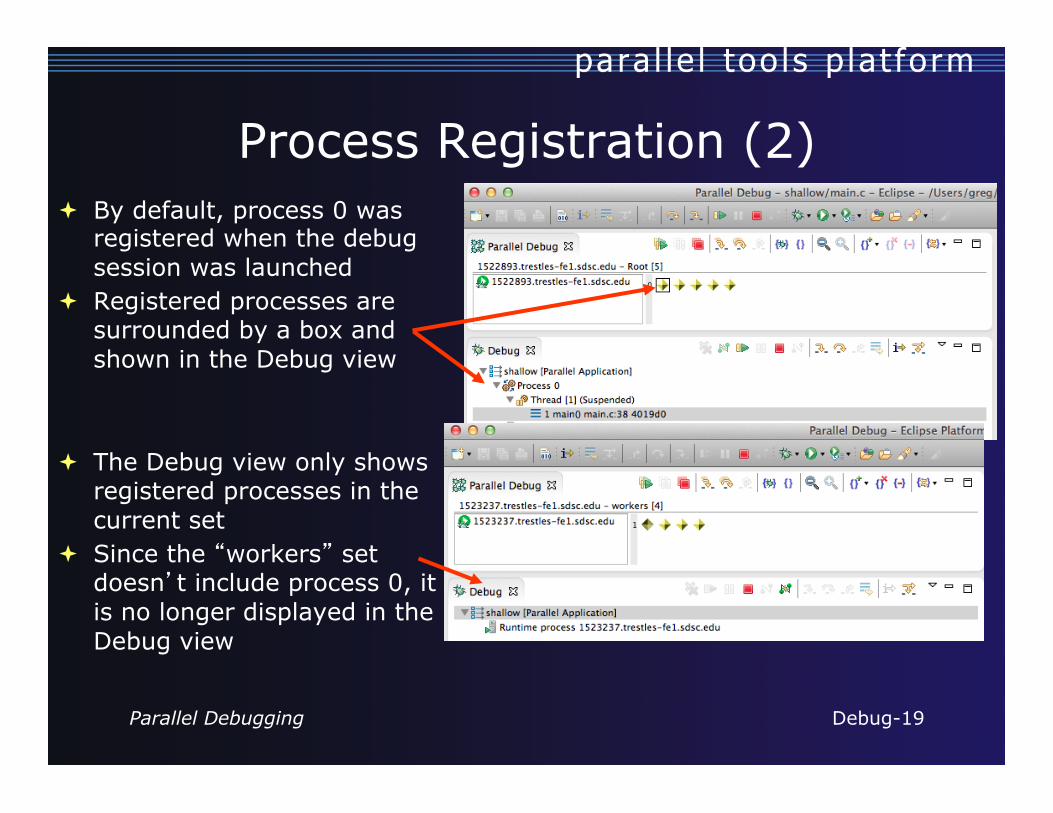
Process Registration (2) ª By default, process 0 was
registered when the debug session was launched
ª Registered processes are surrounded by a box and shown in the Debug view
ª The Debug view only shows registered processes in the current set
ª Since the “workers” set doesn’t include process 0, it is no longer displayed in the Debug view
Parallel Debugging Debug-19
Registering A Process ª To register a process,
double-click its process icon in the Parallel Debug view or select a number of processes and click on the register button
ª To un-register a process, double-click on the process icon or select a number of processes and click on the unregister button
Individual (registered) processes
Groups (sets) of processes
5-20 Parallel Debugging
Current Line Marker
ª The current line marker is used to show the current location of suspended processes
ª In traditional programs, there is a single current line marker (the exception to this is multi-threaded programs)
ª In parallel programs, there is a current line marker for every process
ª The PTP debugger shows one current line marker for every group of processes at the same location
Parallel Debugging Debug-21
Multiple processes marker Registered process marker Un-registered process marker
Colors And Markers
ª The highlight color depends on the processes suspended at that line: ª Blue: All registered process(es) ª Orange: All unregistered
process(es) ª Green: Registered or unregistered
process with no source line (e.g. suspended in a library routine)
ª The marker depends on the type of process stopped at that location
ª Hover over marker for more details about the processes suspend at that location
Parallel Debugging Debug-22
Exercise
1. From the initial debugger session, step all processes until the current line is just after MPI_Init (line 68)
2. Create a process set called “workers” containing processes 1-4
3. Step the “worker” processes twice, observe two line markers
4. Hover over markers to see properties 5. Switch to the “root” set 6. Step only process 0 twice so that all processes are now
at line 71 (hint – use the debug view)
Parallel Debugging Debug-23
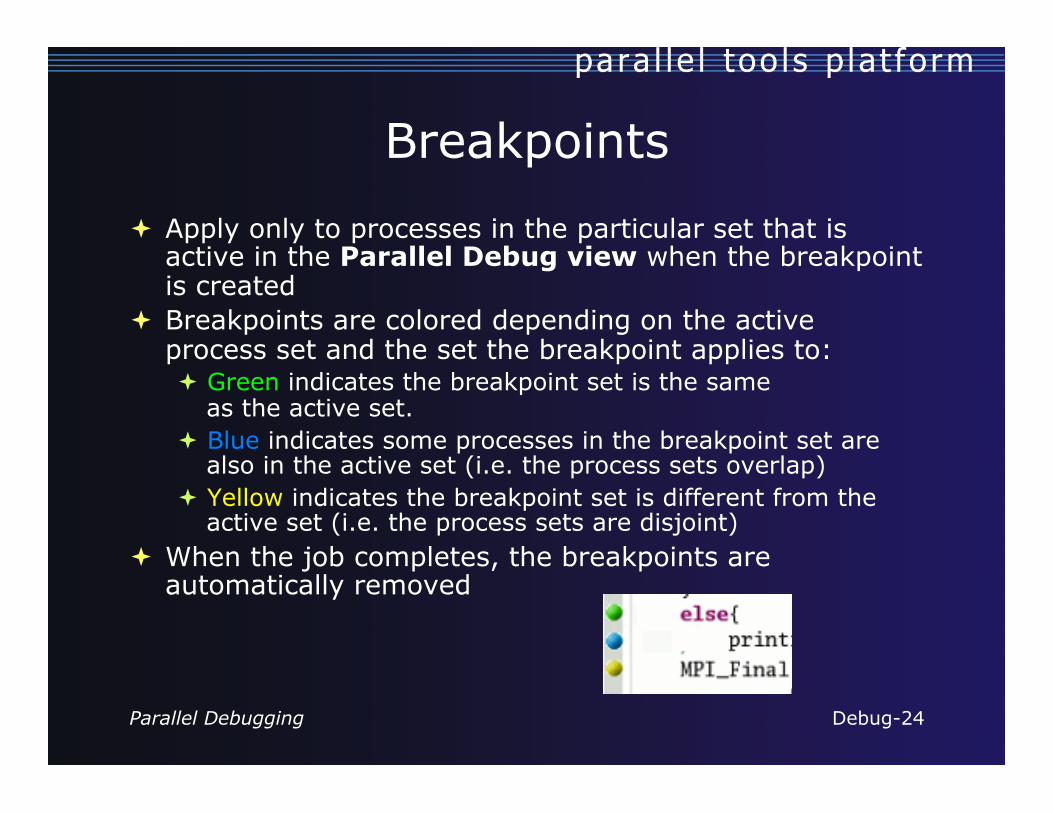
ª Apply only to processes in the particular set that is active in the Parallel Debug view when the breakpoint is created
ª Breakpoints are colored depending on the active process set and the set the breakpoint applies to: ª Green indicates the breakpoint set is the same
as the active set. ª Blue indicates some processes in the breakpoint set are
also in the active set (i.e. the process sets overlap) ª Yellow indicates the breakpoint set is different from the
active set (i.e. the process sets are disjoint) ª When the job completes, the breakpoints are
automatically removed
Breakpoints
Parallel Debugging Debug-24
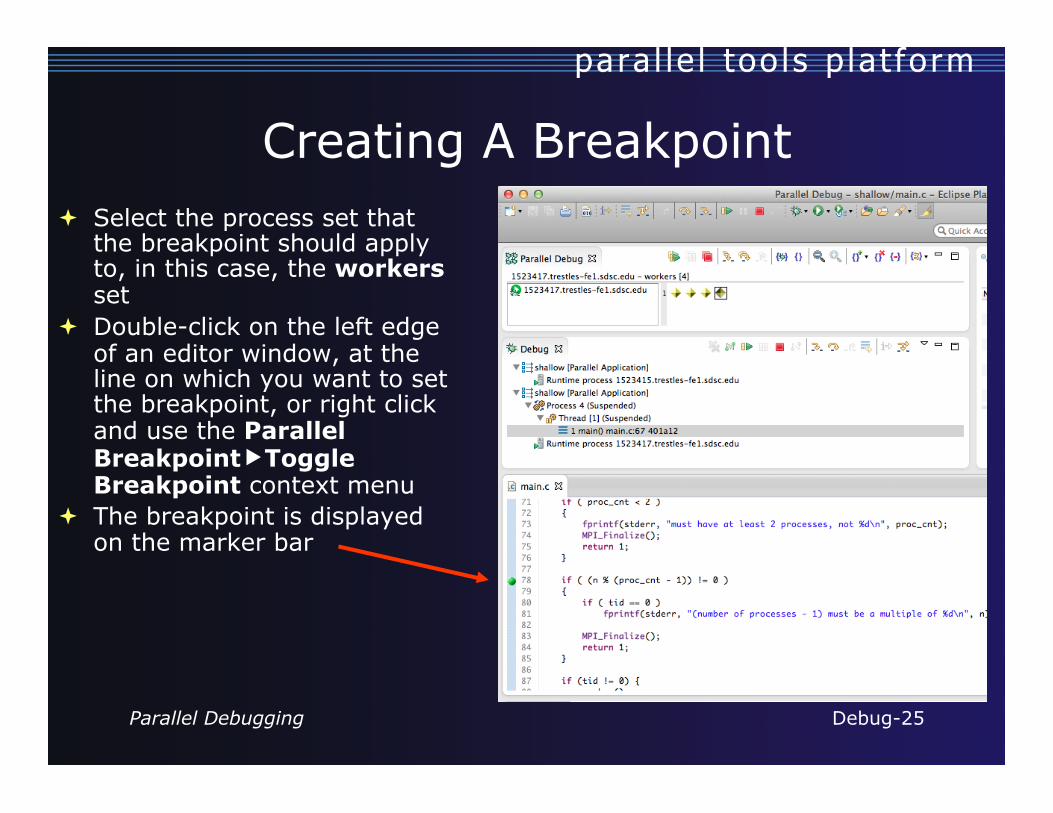
Creating A Breakpoint ª Select the process set that
the breakpoint should apply to, in this case, the workers set
ª Double-click on the left edge of an editor window, at the line on which you want to set the breakpoint, or right click and use the Parallel Breakpoint�Toggle Breakpoint context menu
ª The breakpoint is displayed on the marker bar
Parallel Debugging Debug-25
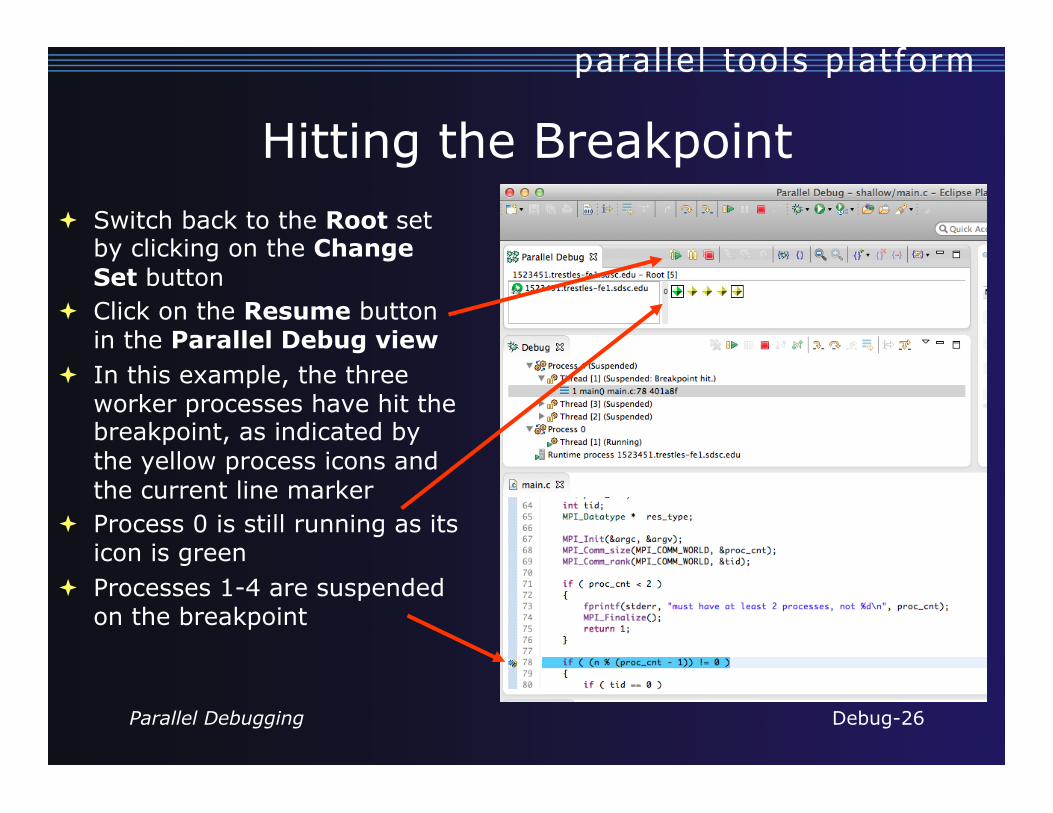
Hitting the Breakpoint ª Switch back to the Root set
by clicking on the Change Set button
ª Click on the Resume button in the Parallel Debug view
ª In this example, the three worker processes have hit the breakpoint, as indicated by the yellow process icons and the current line marker
ª Process 0 is still running as its icon is green
ª Processes 1-4 are suspended on the breakpoint
Parallel Debugging Debug-26
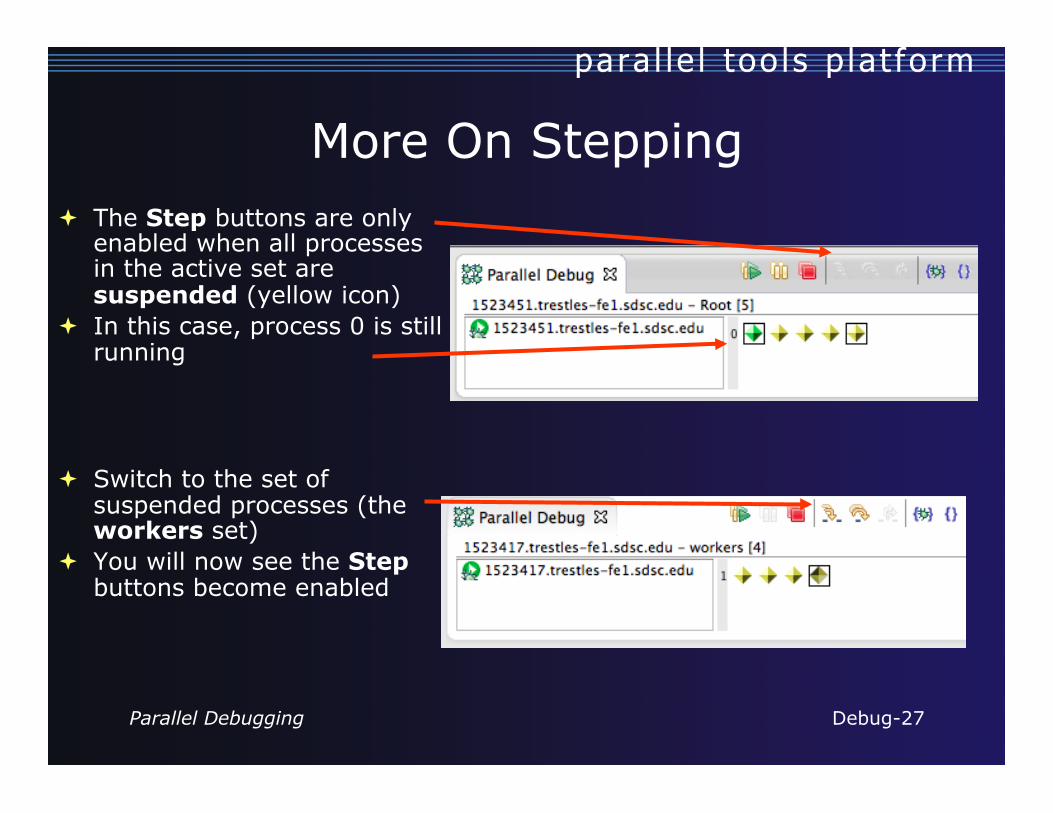
More On Stepping ª The Step buttons are only
enabled when all processes in the active set are suspended (yellow icon)
ª In this case, process 0 is still running
ª Switch to the set of suspended processes (the workers set)
ª You will now see the Step buttons become enabled
Parallel Debugging Debug-27
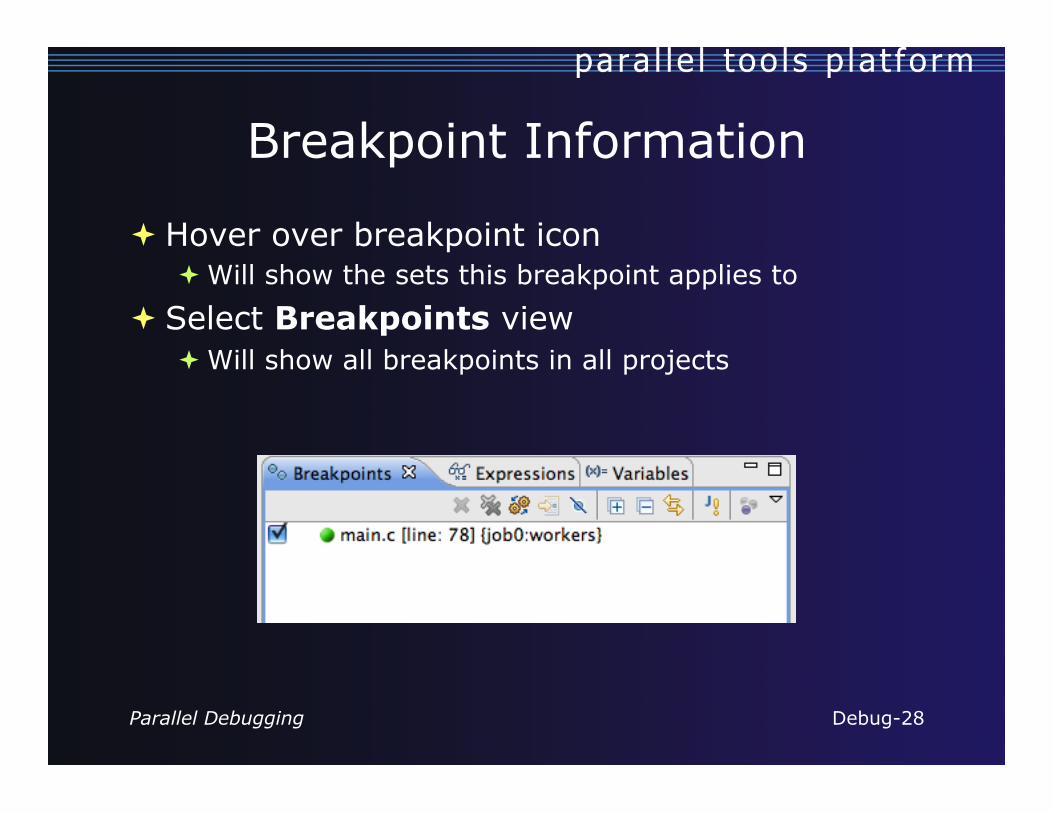
Breakpoint Information
ª Hover over breakpoint icon ª Will show the sets this breakpoint applies to
ª Select Breakpoints view ª Will show all breakpoints in all projects
Parallel Debugging Debug-28
ª Use the menu in the breakpoints view to group breakpoints by type
ª Breakpoints sorted by breakpoint set (process set)
Breakpoints View
Parallel Debugging Debug-29
ª Apply to all processes and all jobs ª Used for gaining control at debugger startup ª To create a global breakpoint
ª First make sure that no jobs are selected (click in white part of jobs view if necessary)
ª Double-click on the left edge of an editor window ª Note that if a job is selected, the breakpoint will apply to
the current set
Global Breakpoints
Parallel Debugging Debug-30
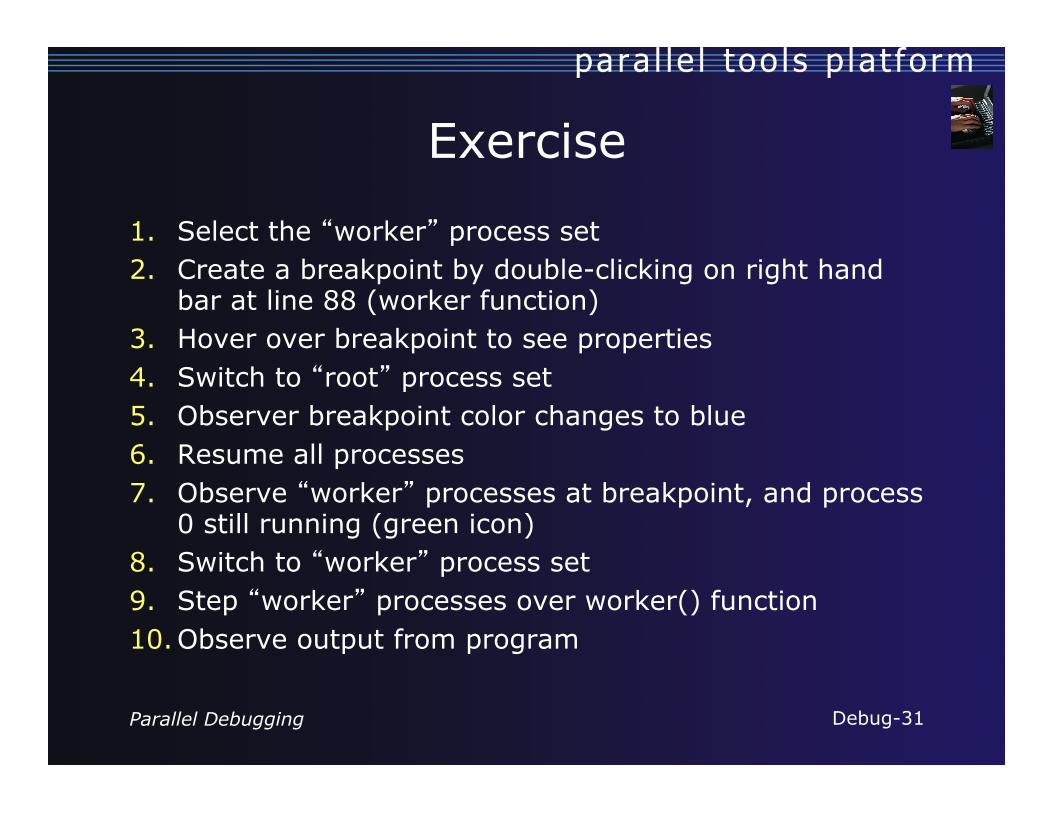
Exercise
1. Select the “worker” process set 2. Create a breakpoint by double-clicking on right hand
bar at line 88 (worker function) 3. Hover over breakpoint to see properties 4. Switch to “root” process set 5. Observer breakpoint color changes to blue 6. Resume all processes 7. Observe “worker” processes at breakpoint, and process
0 still running (green icon) 8. Switch to “worker” process set 9. Step “worker” processes over worker() function 10. Observe output from program
Parallel Debugging Debug-31
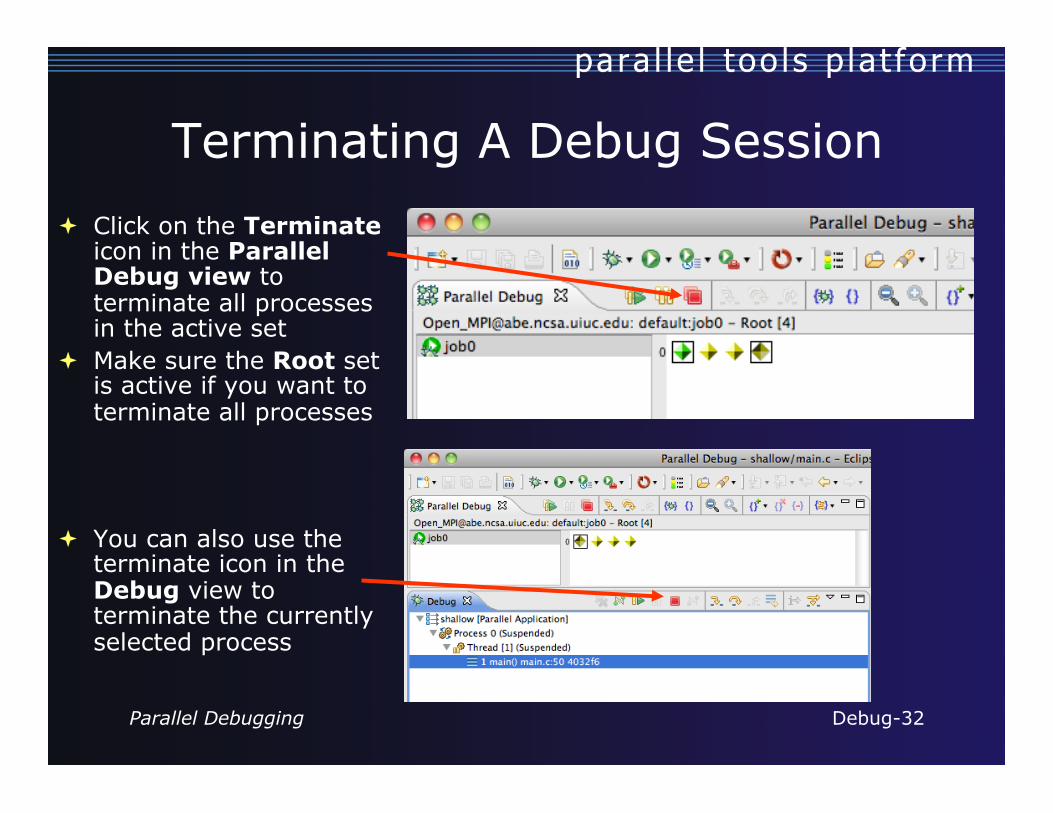
Terminating A Debug Session ª Click on the Terminate
icon in the Parallel Debug view to terminate all processes in the active set
ª Make sure the Root set is active if you want to terminate all processes
ª You can also use the terminate icon in the Debug view to terminate the currently selected process
Parallel Debugging Debug-32
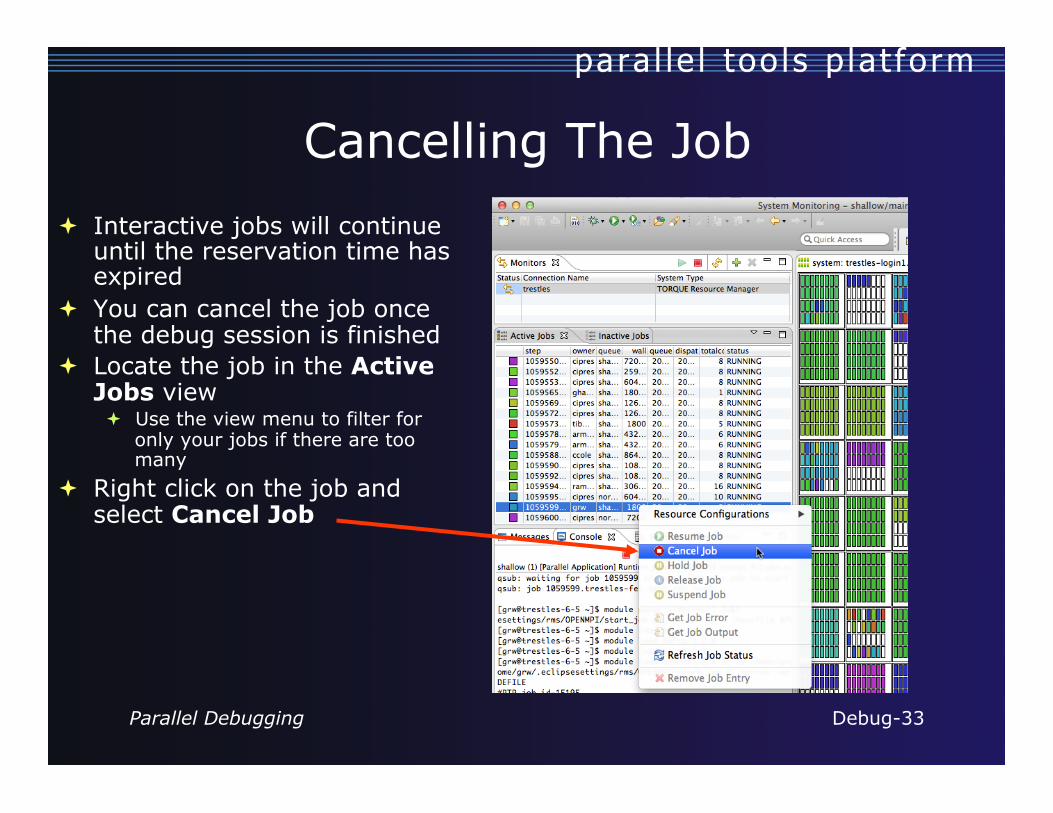
Cancelling The Job ª Interactive jobs will continue
until the reservation time has expired
ª You can cancel the job once the debug session is finished
ª Locate the job in the Active Jobs view ª Use the view menu to filter for
only your jobs if there are too many
ª Right click on the job and select Cancel Job
Parallel Debugging Debug-33
Exercise
1. Switch to the “root” set 2. Terminate all processes 3. Switch to the System Monitoring perspective 4. Right-click on your running job and select Cancel
Parallel Debugging Debug-34
Optional Exercise
1. Launch another debug job 2. Create a breakpoint at line 71 in main.c 3. Resume all processes 4. Select the Variables view tab if not already selected 5. Observe value of the “tid” variable 6. Register one of the worker processes 7. Select stack frame of worker process in Debug view 8. Observe value of the “tid” variable matches worker
process 9. Switch to the breakpoints view, change grouping 10. Terminate all processes 11. Switch to the System Monitoring perspective and