energies Article Parametric Analysis of Design Parameter Effects on the Performance of a Solar Desiccant Evaporative Cooling System in Brisbane, Australia Yunlong Ma 1 , Suvash C. Saha 1, *, Wendy Miller 1 and Lisa Guan 2 1 School of Chemistry Physics and Mechanical Engineering, Queensland University of Technology (QUT), 2 George Street, Brisbane, QLD 4000, Australia; [email protected] (Y.M.); [email protected] (W.M.) 2 Faculty of Design, Architecture & Building, University of Technology Sydney, PO Box 123, Broadway, Sydney, NSW 2007, Australia; [email protected]* Correspondence: [email protected]; Tel.: +61-7-3138-1413 Received: 25 May 2017; Accepted: 23 June 2017; Published: 25 June 2017 Abstract: Solar desiccant cooling is widely considered as an attractive replacement for conventional vapor compression air conditioning systems because of its environmental friendliness and energy efficiency advantages. The system performance of solar desiccant cooling strongly depends on the input parameters associated with the system components, such as the solar collector, storage tank and backup heater, etc. In order to understand the implications of different design parameters on the system performance, this study has conducted a parametric analysis on the solar collector area, storage tank volume, and backup heater capacity of a solid solar desiccant cooling system for an office building in Brisbane, Australia climate. In addition, a parametric analysis on the outdoor air humidity ratio control set-point which triggers the operation of the desiccant wheel has also been investigated. The simulation results have shown that either increasing the storage tank volume or increasing solar collector area would result in both increased solar fraction (SF) and system coefficient of performance (COP), while at the same time reduce the backup heater energy consumption. However, the storage tank volume is more sensitive to the system performance than the collector area. From the economic aspect, a storage capacity of 30 m 3 /576 m 2 has the lowest life cycle cost (LCC) of $405,954 for the solar subsystem. In addition, 100 kW backup heater capacity is preferable for the satisfaction of the design regeneration heating coil hot water inlet temperature set-point with relatively low backup heater energy consumption. Moreover, an outdoor air humidity ratio control set-point of 0.008 kgWater/kgDryAir is more reasonable, as it could both guarantee the indoor design conditions and achieve low backup heater energy consumption. Keywords: parametric analysis; design parameters; desiccant cooling; evaporative cooling; solar energy; building simulation; EnergyPlus 1. Introduction Solar desiccant cooling technology has been widely investigated and applied all over the world during the past years. It has been found to be environmentally friendly, and in some circumstances economically beneficial, as it is able to improve indoor air quality while at the same time reducing energy consumption [1,2]. The basic solar desiccant cooling system generally combines the desiccant process with evaporative cooling. A typical solar desiccant evaporative cooling (SDEC) system is mainly comprised of: (1) a solar subsystem which consists of solar collectors, a storage tank and a backup heater; (2) a desiccant subsystem which includes a desiccant wheel, desiccant materials (usually silica gel), a regeneration heating coil, and a sensible air-to-air heat exchanger; and (3) evaporative coolers. The schematic diagram of a typical SDEC system is illustrated in Figure 1 [3]. Energies 2017, 10, 849; doi:10.3390/en10070849 www.mdpi.com/journal/energies
Transcript
energies
Article
Parametric Analysis of Design Parameter Effects onthe Performance of a Solar Desiccant EvaporativeCooling System in Brisbane, Australia
Yunlong Ma 1, Suvash C. Saha 1,*, Wendy Miller 1 and Lisa Guan 2
1 School of Chemistry Physics and Mechanical Engineering, Queensland University of Technology (QUT),2 George Street, Brisbane, QLD 4000, Australia; [email protected] (Y.M.);[email protected] (W.M.)
2 Faculty of Design, Architecture & Building, University of Technology Sydney, PO Box 123, Broadway,Sydney, NSW 2007, Australia; [email protected]
Received: 25 May 2017; Accepted: 23 June 2017; Published: 25 June 2017
Abstract: Solar desiccant cooling is widely considered as an attractive replacement for conventionalvapor compression air conditioning systems because of its environmental friendliness and energyefficiency advantages. The system performance of solar desiccant cooling strongly depends on theinput parameters associated with the system components, such as the solar collector, storage tankand backup heater, etc. In order to understand the implications of different design parameters onthe system performance, this study has conducted a parametric analysis on the solar collector area,storage tank volume, and backup heater capacity of a solid solar desiccant cooling system for an officebuilding in Brisbane, Australia climate. In addition, a parametric analysis on the outdoor air humidityratio control set-point which triggers the operation of the desiccant wheel has also been investigated.The simulation results have shown that either increasing the storage tank volume or increasing solarcollector area would result in both increased solar fraction (SF) and system coefficient of performance(COP), while at the same time reduce the backup heater energy consumption. However, the storagetank volume is more sensitive to the system performance than the collector area. From the economicaspect, a storage capacity of 30 m3/576 m2 has the lowest life cycle cost (LCC) of $405,954 for thesolar subsystem. In addition, 100 kW backup heater capacity is preferable for the satisfaction of thedesign regeneration heating coil hot water inlet temperature set-point with relatively low backupheater energy consumption. Moreover, an outdoor air humidity ratio control set-point of 0.008kgWater/kgDryAir is more reasonable, as it could both guarantee the indoor design conditions andachieve low backup heater energy consumption.
Solar desiccant cooling technology has been widely investigated and applied all over the worldduring the past years. It has been found to be environmentally friendly, and in some circumstanceseconomically beneficial, as it is able to improve indoor air quality while at the same time reducingenergy consumption [1,2]. The basic solar desiccant cooling system generally combines the desiccantprocess with evaporative cooling. A typical solar desiccant evaporative cooling (SDEC) system ismainly comprised of: (1) a solar subsystem which consists of solar collectors, a storage tank and abackup heater; (2) a desiccant subsystem which includes a desiccant wheel, desiccant materials (usuallysilica gel), a regeneration heating coil, and a sensible air-to-air heat exchanger; and (3) evaporativecoolers. The schematic diagram of a typical SDEC system is illustrated in Figure 1 [3].
Energies 2017, 10, 849 2 of 22Energies 2017, 10, 849 2 of 21
Figure 1. Schematic diagram of the basic solar desiccant evaporative cooling system [3].
The SDEC system treats the sensible load and latent load of the supply air separately. The working principle of the solar desiccant cooling system is that the desiccant material in the desiccant wheel first dries and heats the outside air (1–2), then the dehumidified process air is cooled to near ambient temperature through a sensible air-to-air rotary heat exchanger (2–3). The process air is further cooled by the evaporative cooler (3–4) and is eventually sent to the conditioned space. In the regeneration air stream, the return air is cooled by a second evaporative cooler (5–6) in order to increase the heat exchanger’s efficiency. It is then heated to the regeneration temperature by the regeneration air heater (7–8). The continuous air dehumidification process saturates the desiccant material which must be regenerated in order to continue to perform its function. Thus, solar thermal energy is supplied to the regeneration heating coil for regeneration purposes. A backup heater is usually included whenever solar energy is insufficient.
Currently many research articles have examined the performance of the solar desiccant cooling system in the world. Baniyounes et al. [1] conducted the study of a solar desiccant cooling for an institutional building in Australian subtropical climate Rockhampton using TRNSYS 16 (software developed at the University of Wisconsin, Madison, SD, USA). They demonstrated that the system would achieve an annual coefficient of performance (COP) of 0.7, a 22% solar fraction (SF), 4.4 tonnes of greenhouse gas (GHG) emissions reduction, and 22 years payback by installing 10 m2 solar collectors and 0.4 m3 storage tank. Angrisani et al. [2] assessed the energy, environmental, and economic performances of a solar desiccant-based air handling unit (AHU) with three types of collectors: solar air collector, flat plate collector, and evacuated tube collector. They found that energy and environmental benefits increased with the solar collector surface, but the thermo-economic performance was not in proportion to the solar collector surface. The best solution for achieving the economic feasibility of the solar desiccant cooling system was the installation of 16 m2 evacuated tube collectors, which allowed 50.2% primary energy savings and 49.8% CO2 emissions reduction compared to the referenced conventional system, with about 20 years payback period. Rafique et al. [4] conducted a theoretical analysis of desiccant-based evaporative cooling systems for five cities in Saudi Arabia. They found that the system thermal COP ranged from 0.275 to 0.476 based on different locations. They also concluded that an increase of 15% in evaporative cooler effectiveness resulted in about 15 to 25% increase in the system thermal COP. Furthermore, a decrease in system COP would be caused by an increase in regeneration temperature and process/regeneration air flow ratio. In addition, the desiccant wheel dehumidifying efficiency increased with the increase of the ambient air humidity ratio. Angrisani et al. [5] again investigated three alternative configurations of an innovative solar-assisted hybrid desiccant-based AHU through TRNSYS 16 simulation: (1) heat recovery from the chiller heat rejection for pre-heating the regeneration air; (2) pre-heating of regeneration air with the warmer regeneration air exiting the desiccant wheel; and (3) pre-cooling of the process air before entering the desiccant wheel. By considering different collector types, surface
Figure 1. Schematic diagram of the basic solar desiccant evaporative cooling system [3].
The SDEC system treats the sensible load and latent load of the supply air separately. The workingprinciple of the solar desiccant cooling system is that the desiccant material in the desiccant wheelfirst dries and heats the outside air (1–2), then the dehumidified process air is cooled to near ambienttemperature through a sensible air-to-air rotary heat exchanger (2–3). The process air is further cooledby the evaporative cooler (3–4) and is eventually sent to the conditioned space. In the regenerationair stream, the return air is cooled by a second evaporative cooler (5–6) in order to increase the heatexchanger’s efficiency. It is then heated to the regeneration temperature by the regeneration air heater(7–8). The continuous air dehumidification process saturates the desiccant material which must beregenerated in order to continue to perform its function. Thus, solar thermal energy is supplied to theregeneration heating coil for regeneration purposes. A backup heater is usually included wheneversolar energy is insufficient.
Currently many research articles have examined the performance of the solar desiccant coolingsystem in the world. Baniyounes et al. [1] conducted the study of a solar desiccant cooling for aninstitutional building in Australian subtropical climate Rockhampton using TRNSYS 16 (softwaredeveloped at the University of Wisconsin, Madison, SD, USA). They demonstrated that the systemwould achieve an annual coefficient of performance (COP) of 0.7, a 22% solar fraction (SF), 4.4 tonnesof greenhouse gas (GHG) emissions reduction, and 22 years payback by installing 10 m2 solarcollectors and 0.4 m3 storage tank. Angrisani et al. [2] assessed the energy, environmental, andeconomic performances of a solar desiccant-based air handling unit (AHU) with three types ofcollectors: solar air collector, flat plate collector, and evacuated tube collector. They found thatenergy and environmental benefits increased with the solar collector surface, but the thermo-economicperformance was not in proportion to the solar collector surface. The best solution for achieving theeconomic feasibility of the solar desiccant cooling system was the installation of 16 m2 evacuatedtube collectors, which allowed 50.2% primary energy savings and 49.8% CO2 emissions reductioncompared to the referenced conventional system, with about 20 years payback period. Rafique etal. [4] conducted a theoretical analysis of desiccant-based evaporative cooling systems for five cities inSaudi Arabia. They found that the system thermal COP ranged from 0.275 to 0.476 based on differentlocations. They also concluded that an increase of 15% in evaporative cooler effectiveness resulted inabout 15 to 25% increase in the system thermal COP. Furthermore, a decrease in system COP wouldbe caused by an increase in regeneration temperature and process/regeneration air flow ratio. Inaddition, the desiccant wheel dehumidifying efficiency increased with the increase of the ambient airhumidity ratio. Angrisani et al. [5] again investigated three alternative configurations of an innovativesolar-assisted hybrid desiccant-based AHU through TRNSYS 16 simulation: (1) heat recovery fromthe chiller heat rejection for pre-heating the regeneration air; (2) pre-heating of regeneration air with
Energies 2017, 10, 849 3 of 22
the warmer regeneration air exiting the desiccant wheel; and (3) pre-cooling of the process air beforeentering the desiccant wheel. By considering different collector types, surface areas and tilt angles,they indicated that the desiccant-based AHU with evacuated tube collectors could achieve 15 to24% primary energy conservation and 14 to 22% CO2 emissions reduction compared to conventionalcooling systems. If the optimal configurations in terms of the solar thermal energy utilisation, surfaceareas, and tilt angles were adopted, the evacuated tube collectors could ensure 73% primary energysavings and 71% avoided equivalent CO2 emissions with only 6 years payback period. Li et al. [6]conducted a case study of a two-stage solar desiccant air conditioning system using evacuated tubeair collectors in China. They found that the average thermal COP could be 0.97 in cooling and 0.45 inheating. Ge et al. [7] compared the performance of a two-stage solar rotary desiccant cooling systemwith a conventional vapour compression system under Berlin and Shanghai climates. They indicatedthat the SDEC system was able to meet the cooling demand and produce comfortable supply air inboth cities with less energy consumption, and the payback period was 4.7 years for Berlin and 7.2 yearsfor Shanghai, respectively.
There are also a number of recent research studies that have been investigated to evaluate theimpacts of various system components design parameters on the solar desiccant cooling systemperformance in different climates. Goldsworthy and White [8] conducted the numerical optimisationof a solar desiccant cooling system for a certain climatic zone in Australia. They found that for70 ◦C regeneration temperature, a supply/regeneration flow ratio of 0.67 and an indirect evaporativecooler secondary/primary flow ratio of 0.3 gave the best system performance with the electric COPabove 20 for this particular location. It should be noted that the electric COP of the SDEC systemreported in the study is much larger than the thermal COP (ranges from 0.275 to 0.97) discussedabove. This is because of the different definitions and calculation formulas between the thermalCOP and electric COP. The thermal COP is defined as the ratio between the system cooling effect tothe external heat delivered to the regeneration air heater; while the electric COP is calculated as thesystem cooling effect to the total system electricity consumption including fans, pumps, and auxiliaryheater, etc. [9]. The definition and formula expression of the electric COP is quite similar to the energyefficient ratio (EER), which also takes into consideration of the consumption of electrical-consumedauxiliary devices. White et al. [10] assessed the performance of a solar desiccant cooling systemwithout thermal backup for office spaces located in Melbourne, Sydney, and Darwin. They concludedthat increasing the indirect evaporative effectiveness, supply air flow rate, and solar collector areaswould apparently result in reduced frequency of high indoor temperature events in Melbourne andSydney, but this impact was not evident in Darwin due to high outdoor air temperature and humidityratio in Darwin. Parmar and Hindoliya [11] conducted a comparable study of a SDEC system forvarious Indian climates. They concluded that a regeneration/process air ratio (R/P ratio) of 0.55led to the maximum thermal COP of 4.98 in warm and humid climates such as Mumbai with lessregeneration power and that the increase of the R/P ratio would result in decreased system COP andincreased regeneration heat requirement. It should also be noticed that according to [9], the thermalCOP of a solar desiccant cooling system strongly depends on the conditions of ambient air, supplyair, and return air, and the value usually ranges from 0.5 to 1.0. In this study however, the highthermal COP value of 4.98 is because that the system thermal COP is highly sensitive to the R/Pratio. In addition, the warm and humid outside air conditions in Mumbai make the solar desiccantcooling system more feasible and advantageous. Zahra et al. [12] presented an optimisation study ofthe required solar air collector areas for a solar desiccant cooling system in Iran by considering thedesiccant wheel parameters and operating conditions. They found that the solar air collector surfacewould be decreased by increasing the collector inlet air dry-bulb temperature, inlet air humidityratio, and solar irradiance; and it would be increased by increasing the regeneration air temperature.Panaras et al. [13] investigated the influential design parameters for the solar desiccant cooling systemperformance and they indicated that the air flow rate, regeneration temperature, operation cycle,and outdoor conditions have significant impacts on the solar desiccant cooling system performance.
Energies 2017, 10, 849 4 of 22
Rafique et al. [14] conducted a parametric analysis of a rotary liquid desiccant cooling system undervarious operating and climatic conditions. The parameters considered included evaporative coolereffectiveness, outside air temperature and humidity ratio, ratio of regeneration air to process airmass flow rate, and regeneration temperature. It was found that the increase of the evaporativecooler effectiveness would significantly improve the system performance. In addition, decreasing theregeneration/process air mass flow rate ratio and regeneration temperature was beneficial for theperformance of the system. Apart from the solar desiccant cooling system parameters analysis, Giulioet al. [15] conducted a dynamic multi-level simulation using Matlab/Simulink for a solar adsorptioncooling system to identify the correlations among different input variables and the climatic data. Byperforming the Fourier analysis, they concluded that the most important parameters influencingthe system COP, in order of importance, were ambient air temperature, condensation power of theadsorption chiller, chiller cooling effect, and heating power used by the chiller. They also found thatthe thermal power delivered to the hot storage unit was strongly correlated with, in order of priority,the adsorbent material temperature, condensation temperature, ambient temperature, and the heatingpower used by the chiller.
From the literature review, it appears that previous research has indicated some implications ofthe system components design parameters on the system performance, such as maximising the systemCOP, minimising the solar collector areas, and reducing the frequency of high indoor temperatureevents. However, little research has been conducted about the impacts of different system componentsdesign parameters on the energy performance of the solar desiccant cooling system. In addition, thereis little research about the parametric analysis of the SDEC system from the whole system performancepoint of view. There is also little research studies to evaluate the impacts of solar collector areas, storagetank volumes, backup heater capacities, and outdoor air humidity ratio control on the SDEC systemperformance in subtropical climate in Australia. Therefore, the purpose of this paper is to identifythe impacts of the system components design parameters on the SDEC system technical and energyperformances in Australia, in terms of solar collector area, storage tank volume, and backup heatercapacity. In addition, an energy management system (EMS) control on the outdoor air humidity ratioset-point which triggers the operation of the desiccant wheel has also been evaluated. This studyaims at establishing fundamental understanding of the influential design parameters that impactthe SDEC system performance under Australian climate and providing implications for the wholesystem optimisation.
2. Methods
2.1. Building Characteristics
The parametric investigation of different design parameters on the proposed SDEC systemperformance is based on computer simulation using EnergyPlus. The building to be modelled isa three-storey, 5-zone per floor, rectangular office building with a carpark, as shown in Figure 2.The total conditioned window-to-wall ratio (WWR) is 0.4, with the North and South facades of36.5 m × 1.35 m, and the East and West facades of 18.3 m × 0.54 m for each floor. The selection ofthis building model is because it is recommended by the Australian building codes board (ABCB) tobe a representative medium-sized commercial building in the central business district in Australiafor energy modelling [16], and it is widely studied in other projects [16–21]. The climatic location isBrisbane, Australia.
Energies 2017, 10, 849 5 of 22
Energies 2017, 10, 849 4 of 21
effectiveness would significantly improve the system performance. In addition, decreasing the regeneration/process air mass flow rate ratio and regeneration temperature was beneficial for the performance of the system. Apart from the solar desiccant cooling system parameters analysis, Giulio et al. [15] conducted a dynamic multi-level simulation using Matlab/Simulink for a solar adsorption cooling system to identify the correlations among different input variables and the climatic data. By performing the Fourier analysis, they concluded that the most important parameters influencing the system COP, in order of importance, were ambient air temperature, condensation power of the adsorption chiller, chiller cooling effect, and heating power used by the chiller. They also found that the thermal power delivered to the hot storage unit was strongly correlated with, in order of priority, the adsorbent material temperature, condensation temperature, ambient temperature, and the heating power used by the chiller.
From the literature review, it appears that previous research has indicated some implications of the system components design parameters on the system performance, such as maximising the system COP, minimising the solar collector areas, and reducing the frequency of high indoor temperature events. However, little research has been conducted about the impacts of different system components design parameters on the energy performance of the solar desiccant cooling system. In addition, there is little research about the parametric analysis of the SDEC system from the whole system performance point of view. There is also little research studies to evaluate the impacts of solar collector areas, storage tank volumes, backup heater capacities, and outdoor air humidity ratio control on the SDEC system performance in subtropical climate in Australia. Therefore, the purpose of this paper is to identify the impacts of the system components design parameters on the SDEC system technical and energy performances in Australia, in terms of solar collector area, storage tank volume, and backup heater capacity. In addition, an energy management system (EMS) control on the outdoor air humidity ratio set-point which triggers the operation of the desiccant wheel has also been evaluated. This study aims at establishing fundamental understanding of the influential design parameters that impact the SDEC system performance under Australian climate and providing implications for the whole system optimisation.
2. Methods
2.1. Building Characteristics
The parametric investigation of different design parameters on the proposed SDEC system performance is based on computer simulation using EnergyPlus. The building to be modelled is a three-storey, 5-zone per floor, rectangular office building with a carpark, as shown in Figure 2. The total conditioned window-to-wall ratio (WWR) is 0.4, with the North and South facades of 36.5 m × 1.35 m, and the East and West facades of 18.3 m × 0.54 m for each floor. The selection of this building model is because it is recommended by the Australian building codes board (ABCB) to be a representative medium-sized commercial building in the central business district in Australia for energy modelling [16], and it is widely studied in other projects [16–21]. The climatic location is Brisbane, Australia.
Figure 2. Building model geometry and zone division.
Figure 2. Building model geometry and zone division.
The building’s physical properties, internal load density and operation schedules are shown inTables 1 and 2 respectively.
Table 1. Building model physical properties [16].
Building Feature Value
Number of storeys 3Footprint dimensions 36.5 m × 18.3 m
Gross conditioned floor area 2003.85 m2
Aspect ratio 2:1Floor-to-ceiling height 2.7 m
Plenum wall height 0.9 mCar park height 3 m
Building total height 13.8 mOrientation Long axis East-West
Number of zones per floor 5
Roof Metal deck, air gap, foil, roof space, R2.0 batts, 13 mm acoustic tiles(U = 0.277 W/m2K)
Floor 175 mm concrete slab with carpet (U = 1.32 W/m2K)
Exterior wall 200 mm heavy weight concrete, R1.5 batts, 10 mm plasterboard(U = 0.554 W/m2K)
Window Single 6 mm clear glass, (U = 5.89 W/m2K)Window-to-wall ratio 0.4Floor-to-ceiling height 2.7 m
Plenum wall height 0.9 m
Table 2. Modelling assumptions of internal load density and operational schedules [22].
Modelling Assumptions Value
Lighting power density 15 W/m2
Equipment load density 15 W/m2
Occupant density 10 m2/personLighting schedule 91.5 h/week
HVAC (heating, ventilation, and airconditioning) operation schedule 60 h/week, 06:00–18:00, Monday to Friday
Infiltration rate 1 ACH (air change per hour), no infiltration during HVAC operationOutside air rate 10 L/s per person
HVAC set-points24 ± 1 ◦C, 50% relative humidity for cooling with setbacktemperature of 38 ◦C; 20 ± 1 ◦C for heating with setback
temperature of 12 ◦C
The infiltration rate is set as 1 ACH outside the HVAC operation and it assumes no infiltrationwhen the HVAC is on, which is referenced from [19]. The building code of Australia volume one ofthe national construction code 2016 [23] specifies that energy modelling infiltration rate is defined as1 ACH for perimeter zones only during HVAC operation, and 1.5 ACH for whole building outsideHVAC operation, which is also adopted by [16]. The infiltration rate adopted in this study is a littletighter than the Australian code specified. Generally the less air leakage the better the building energy
Energies 2017, 10, 849 6 of 22
performance as is concluded by Egan [24]. However, the changes in infiltration rate in this studywould not dramatically influence the energy consumption results for a building that is located in hotsummer warm winter climates with fixed windows, as is concluded by Feng et al. [25].
2.2. System Components Modelling
2.2.1. Solar Thermal Collector
In this study, the flat plate solar thermal collector is used for the simulation. The reason for theselection of this type of solar thermal collector is because according to Henning [26], flat plate solarthermal collectors are the most commonly used solar thermal collector type, dominating the marketwith about 90% market penetration around the world. In addition, according to international energyagency (IEA) solar heating and cooling program task 48 [27], the flat plate solar thermal collector is ableto produce as high as 100 ◦C hot water, which is enough for driving the solar desiccant cooling system.Another important reason for the selection of the flat plate solar thermal collector is that in EnergyPlus,only the SolarCollector:FlatPlate:Water object is available to model solar thermal collectors, which canrepresent the performance of single glazed, unglazed or evacuated tube collectors. Finally, the flatplate solar thermal collector is much more cost effective than the evacuated tube solar thermal collectorfor low temperature applications such solar cooling and heating [28]. The governing equations for themodelling of the solar thermal collector are expressed as [29]:
QSolar = ηSolar × Ac × I (1)
ηSolar = c0 + c1 ×Tin − Ta
I+ c2 ×
(Tin − Ta)
I
2
(2)
where ηSolar is the solar thermal collector overall efficiency; Ac is the gross area of the solar thermalcollector in m2; I is the total incident solar radiation in W/m2; Tin is the collector inlet temperature ofthe working fluid in ◦C; Ta is the ambient air temperature in ◦C; c0 is the collector optical efficiency; c1
and c2 are the collector heat loss coefficients.
2.2.2. Desiccant Wheel
In EnergyPlus, the desiccant wheel is modelled as a balanced flow desiccant heat exchanger whichdeals with both sensible and latent heat transfer between the process and regeneration air streams.It assumes the same air volume flow rate and face velocity through the regeneration and process airstream sides and no heat or humidity losses to the environment. The governing equations for themodelling of the desiccant wheel are [29]:
RTO = B1 + B2 × RWI + B3 × RTI + B4 ×(
RWIRTI
)+ B5 × PWI + B6 × PTI + B7 ×
(PWIPTI
)+ B8 × RFV (3)
RWO = C1 + C2 × RWI + C3 × RTI + C4 ×(
RWIRTI
)+ C5 × PWI + C6 × PTI + C7 ×
(PWIPTI
)+ C8 × RFV (4)
where RTO is regeneration outlet air (point 9 in Figure 1) dry bulb temperature in ◦C; RWI isregeneration inlet air (point 8 in Figure 1) humidity ratio in kgWater/kgDryAir; RTI is regenerationinlet air dry bulb temperature in ◦C; PWI is process inlet air (point 1 in Figure 1) humidity ratio inkgWater/kgDryAir; PTI is process inlet air dry bulb temperature in ◦C; RFV is regeneration (andprocess) face velocity in m/s; Bn is temperature equation coefficient; RWO is regeneration outlet airhumidity ratio in kgWater/kgDryAir; and Cn is humidity ratio equation coefficient.
Once the regeneration outlet air conditions are determined as described above, the dry bulbtemperature and humidity differences across the regeneration side of the desiccant wheel can be
Energies 2017, 10, 849 7 of 22
calculated. Since the desiccant wheel is based on the assumptions of zero heat and humidity losses tothe environment, the following equations can be obtained:
t1 − t2 = t9 − t8 (5)
w1 − w2 = w9 − w8 (6)
The coefficients of Bn and Cn are shown in Table 3 below from the manufacturer’s data(EDC-3550-200) [30]. The selection of this desiccant wheel model is because it can meet with therequirement of the system supply air flow rate (69,753 m3/h nominal process air volume), and ithas good dehumidifying effect which is able to dehumidify the outdoor air humidity below 0.005kgWater/kgDryAir [30]. Therefore, a humidity ratio control set-point of 0.005 kgWater/kgDryAir isapplied on the desiccant wheel process air outlet node (point 2 in Figure 1) for dehumidifying controlpurposes [31].
Table 3. Coefficients for desiccant wheel temperature and humidity ratio equations.
The sensible air-to-air heat exchanger presents air streams of equal flow rate and no heat losses tothe environment. It is modelled based on the following equations [29]:
εHX =t2 − t3
t2 − t6(7)
t2 − t3 = t7 − t6 (8)
where εHX is heat exchanger effectiveness; t2 is heat exchanger process air inlet (point 2 in Figure 1)dry bulb temperature in ◦C; t3 is heat exchanger process air outlet (point 3 in Figure 1) dry bulbtemperature in ◦C; t6 is heat exchanger regeneration air inlet (point 6 in Figure 1) dry bulb temperaturein ◦C; and t7 is heat exchanger regeneration air outlet (point 7 in Figure 1) dry bulb temperature in ◦C.
2.2.4. Evaporative Cooler
The direct evaporative cooler is modelled using the following equation [29]. It assumes a constanteffectiveness model and the wet bulb temperature remains constant between the inlet and outlet of thedirect evaporative cooler:
Tdb,out = Tdb,in − ε(Tdb,in − Twb,in) (9)
where Tdb,out is the dry bulb temperature of the air leaving the cooler (point 4 and 6 in Figure 1) in ◦C;Tdb,in is the dry bulb temperature of the air entering the cooler (point 3 and 5 in Figure 1) in ◦C; Twb,inis the wet bulb temperature of the air entering the cooler in ◦C; and ε is the cooler effectiveness.
2.3. Performance Indicators
2.3.1. Solar Fraction
Solar fraction is an important technical indicator to assess the feasibility of the solar coolingsystems: the higher the SF, the greater the contribution of solar energy to the system. SF is the ratioof solar energy contribution to the total energy input for driving the solar cooling system. A backup
Energies 2017, 10, 849 8 of 22
heater is usually used to deliver the required thermal energy when solar energy is insufficient to drivethe cooling system. Therefore, the solar fraction can be defined in the following equation:
SF =ESolar
Ein=
ESolarEhvac + ESolar
(10)
where ESolar refers to the useful solar thermal energy input in GJ (gigajoule); Ein is the total energyinput requirement for driving the solar cooling system in GJ; and Ehvac is the energy consumption ofall the electrical components in the system in GJ, including fans, pumps, backup heater, evaporativecoolers, and desiccant wheel motor.
2.3.2. System Coefficient of Performance
In this study, electric COP is used as the technical performance indicator and is defined as the ratioof the system total cooling effect to the total HVAC electricity consumption from the city electricitygrid, which can be expressed in Equation (11) below:
COP =QC
Whvac=
mo × (ho − hs)
Whvac(11)
where mo is the outside air mass flow rate in kg/s; ho is the enthalpy of outside air in kJ/kg; and hs isthe enthalpy of supply air after the evaporative cooler 1 (point 4 in Figure 1) in kJ/kg.
Electricity energy consumption is one of the most important energy performance indicators toevaluate the SDEC system performance. Only the backup heater energy consumption is counted in thisresearch because the electricity consumption of pumps, evaporative coolers, and desiccant wheel motorcan be neglected compared with the system total energy consumption [1], and the inclusion of fanpower consumption would not dramatically change the results [10]. In other words, the variation of thesolar collector area, storage tank volume, backup heater capacity, and humidity ratio control set-pointwould not significantly influence the electricity energy consumption of fans, pumps, evaporativecoolers and desiccant wheel motor. The backup heater electricity consumption is calculated as [29]:
EAux =mCw(Tset − Tin) + UA
(T − Ta
)η
(12)
where m is the water mass flow rate in kg/s; Cw is water specific heat in kJ/(kg·◦C); η is the backupheater efficiency; Tset is the hot water set-point temperature in the backup heater in ◦C; Tin is the waterinlet temperature in ◦C; UA is the overall heat loss coefficient between the backup heater and theenvironment during operation; T is (Tset + Tin)/2 and Ta is the ambient environment temperaturein ◦C.
2.4. General System Input Parameters and Validation
The general system input parameters used for the simulation are summarised in Table 4 below.Generally the electricity backup heater efficiency is 1 during operation and thus no heat loss to
the environment [32]. The solar collector data is chosen from EnergyPlus datasets. The selection ofthe regenerative hot water loop flow rate is based on the assumption of 30 ◦C temperature differencesbetween the regeneration heating coil inlet and outlet. The simulation parameters for the desiccantwheel and sensible air-to-air heat exchanger are from manufacturers’ data [30,33].
Energies 2017, 10, 849 9 of 22
Table 4. General system input parameters in EnergyPlus simulation.
Parameters Value Parameters Value
Backup heater - Heat exchanger (HX) -Backup heater fuel type Electricity HX type Flat PlateBackup heater efficiency 1 Nominal air flow rate (m3/s) 19.4
Solar thermal collector (Solahart Industries Bt) - Ratio of supply to secondary h·A values 1Collector optical efficiency c0 0.753 Nominal electric power (W) 0
Collector heat loss coefficient c1 (W/m2·K) −5.2917 Nominal supply air inlet temperature (◦C) 54Collector heat loss coefficient c2 (W/m2·K2) 0.00638 Nominal supply air outlet temperature (◦C) 32.4
Collector fluid flow rate per unit area (kg/s·m2) 0.019 Nominal secondary air inlet temperature (◦C) 20Collector tilt 25◦ Direct evaporative cooler -
Solar collector type Flat Plate Coil maximum efficiency 0.9Regenerative hot water loop - Recirculating water pump power (W) 50
Hot water design set-point (◦C) 75 Regeneration heating coil -Hot water loop flow rate (kg/s) 2.4 Regeneration air heater capacity (kW) 300
Desiccant wheel (DW) - Rated ratio for air and water convection 0.5Nominal air flow rate (m3/s) 19.4 Supply air temperature set-point (◦C) 14Nominal electric power (W) 186 Supply & regeneration air fan -
Nominal air face velocity (m/s) 4 Fan delta pressure (Pa) 500Minimum regeneration temperature (◦C) 50 Fan total efficiency 0.7
For the building model and system validation, experimental measured data is not availableas this is an archetypal building and no existing SDEC system is in operation with this buildingmodel. Therefore, the building indoor design conditions are used for the validation. Figure 3 showsthe monthly building cooling and heating load. Figure 4 below shows the simulation results of themonthly building indoor temperature and relative humidity.
Figure 3 demonstrates that in Brisbane, for the Building Form B, cooling is dominant and isrequired all year round. The maximum cooling load occurs in March with 31.3 MWh, while theminimum cooling load happens in July with about 19 MWh. For the heating load profile, the heatingload is only required in June, July and August with about 6 kWh, 10.44 kWh and 8.45 kWh respectively.
From Figure 4 it can be seen that the SDEC system can meet the indoor design set-point conditionsof 24 ± 1 ◦C and 50% relative humidity for occupied cooling, and the monthly averaged buildingindoor temperature results coincide with the monthly building loads, indicating that the buildingmodel and the SDEC system are constructed correctly.
Energies 2017, 10, 849 9 of 21
the regenerative hot water loop flow rate is based on the assumption of 30 °C temperature differences between the regeneration heating coil inlet and outlet. The simulation parameters for the desiccant wheel and sensible air-to-air heat exchanger are from manufacturers’ data [30,33].
For the building model and system validation, experimental measured data is not available as this is an archetypal building and no existing SDEC system is in operation with this building model. Therefore, the building indoor design conditions are used for the validation. Figure 3 shows the monthly building cooling and heating load. Figure 4 below shows the simulation results of the monthly building indoor temperature and relative humidity.
Figure 3. Monthly building cooling and heating load.
Figure 4. Monthly averaged building indoor temperature and relative humidity.
Figure 3 demonstrates that in Brisbane, for the Building Form B, cooling is dominant and is required all year round. The maximum cooling load occurs in March with 31.3 MWh, while the minimum cooling load happens in July with about 19 MWh. For the heating load profile, the heating load is only required in June, July and August with about 6 kWh, 10.44 kWh and 8.45 kWh respectively.
From Figure 4 it can be seen that the SDEC system can meet the indoor design set-point conditions of 24 ± 1 °C and 50% relative humidity for occupied cooling, and the monthly averaged building indoor temperature results coincide with the monthly building loads, indicating that the building model and the SDEC system are constructed correctly.
A psychrometric chart of the SDEC system air processing procedure under the summer design condition is also demonstrated in Figure 5 below, which clearly illustrates the temperature and
Figure 3. Monthly building cooling and heating load.
Energies 2017, 10, 849 10 of 22
Energies 2017, 10, 849 9 of 21
the regenerative hot water loop flow rate is based on the assumption of 30 °C temperature differences between the regeneration heating coil inlet and outlet. The simulation parameters for the desiccant wheel and sensible air-to-air heat exchanger are from manufacturers’ data [30,33].
For the building model and system validation, experimental measured data is not available as this is an archetypal building and no existing SDEC system is in operation with this building model. Therefore, the building indoor design conditions are used for the validation. Figure 3 shows the monthly building cooling and heating load. Figure 4 below shows the simulation results of the monthly building indoor temperature and relative humidity.
Figure 3. Monthly building cooling and heating load.
Figure 4. Monthly averaged building indoor temperature and relative humidity.
Figure 3 demonstrates that in Brisbane, for the Building Form B, cooling is dominant and is required all year round. The maximum cooling load occurs in March with 31.3 MWh, while the minimum cooling load happens in July with about 19 MWh. For the heating load profile, the heating load is only required in June, July and August with about 6 kWh, 10.44 kWh and 8.45 kWh respectively.
From Figure 4 it can be seen that the SDEC system can meet the indoor design set-point conditions of 24 ± 1 °C and 50% relative humidity for occupied cooling, and the monthly averaged building indoor temperature results coincide with the monthly building loads, indicating that the building model and the SDEC system are constructed correctly.
A psychrometric chart of the SDEC system air processing procedure under the summer design condition is also demonstrated in Figure 5 below, which clearly illustrates the temperature and
Figure 4. Monthly averaged building indoor temperature and relative humidity.
A psychrometric chart of the SDEC system air processing procedure under the summer designcondition is also demonstrated in Figure 5 below, which clearly illustrates the temperature andhumidity ratio conditions of the air in each state point specified in Figure 1. The blue line indicatesthe process air stream and the red line indicates the regeneration air stream. It shows that under thesummer design cooling condition, the SDEC system could provide the designed supply air temperatureof 14 ◦C and keep the indoor conditions of 24 ◦C and 50% relative humidity. This could also providesome reliability and confidence for the building and system model validation.
Energies 2017, 10, 849 10 of 21
humidity ratio conditions of the air in each state point specified in Figure 1. The blue line indicates the process air stream and the red line indicates the regeneration air stream. It shows that under the summer design cooling condition, the SDEC system could provide the designed supply air temperature of 14 °C and keep the indoor conditions of 24 °C and 50% relative humidity. This could also provide some reliability and confidence for the building and system model validation.
Figure 5. Psychrometric chart of the SDEC system air processing stages.
3. Results and Discussion
3.1. The Impacts of Storage Tank Volume
According to [4], the recommended storage capacity for a solar cooling system is 50–100 L/m2 of the collector area. This can act as an indication and guidance to choose the values for the storage tank volume sensitivity analysis. The storage tank volume sensitivity examination simulations are based on a fixed collector area of 576 m2 and backup heater capacity of 100 kW. In order to justify the impacts of the storage tank volume on the SDEC system performance, five values are investigated: 10, 20, 30, 40 and 50 m3. The placement of the storage tank is not a key issue in this research; therefore, structural loading is not taken into the consideration. It could be assumed that the storage tank could be located in the plant room, basement, on the ground outside the building, or could be split into several small tanks. Figures 6 and 7 below show the impacts of changing storage tank volume on the system solar fraction and COP, respectively.
Figure 5. Psychrometric chart of the SDEC system air processing stages.
3. Results and Discussion
3.1. The Impacts of Storage Tank Volume
According to [4], the recommended storage capacity for a solar cooling system is 50–100 L/m2 ofthe collector area. This can act as an indication and guidance to choose the values for the storage tankvolume sensitivity analysis. The storage tank volume sensitivity examination simulations are based on
Energies 2017, 10, 849 11 of 22
a fixed collector area of 576 m2 and backup heater capacity of 100 kW. In order to justify the impacts ofthe storage tank volume on the SDEC system performance, five values are investigated: 10, 20, 30, 40and 50 m3. The placement of the storage tank is not a key issue in this research; therefore, structuralloading is not taken into the consideration. It could be assumed that the storage tank could be locatedin the plant room, basement, on the ground outside the building, or could be split into several smalltanks. Figures 6 and 7 below show the impacts of changing storage tank volume on the system solarfraction and COP, respectively.
Energies 2017, 10, 849 10 of 21
humidity ratio conditions of the air in each state point specified in Figure 1. The blue line indicates the process air stream and the red line indicates the regeneration air stream. It shows that under the summer design cooling condition, the SDEC system could provide the designed supply air temperature of 14 °C and keep the indoor conditions of 24 °C and 50% relative humidity. This could also provide some reliability and confidence for the building and system model validation.
Figure 5. Psychrometric chart of the SDEC system air processing stages.
3. Results and Discussion
3.1. The Impacts of Storage Tank Volume
According to [4], the recommended storage capacity for a solar cooling system is 50–100 L/m2 of the collector area. This can act as an indication and guidance to choose the values for the storage tank volume sensitivity analysis. The storage tank volume sensitivity examination simulations are based on a fixed collector area of 576 m2 and backup heater capacity of 100 kW. In order to justify the impacts of the storage tank volume on the SDEC system performance, five values are investigated: 10, 20, 30, 40 and 50 m3. The placement of the storage tank is not a key issue in this research; therefore, structural loading is not taken into the consideration. It could be assumed that the storage tank could be located in the plant room, basement, on the ground outside the building, or could be split into several small tanks. Figures 6 and 7 below show the impacts of changing storage tank volume on the system solar fraction and COP, respectively.
Figure 6. The impact of storage tank volume on solar fraction.
Energies 2017, 10, 849 11 of 21
Figure 6. The impact of storage tank volume on solar fraction.
Figure 7. The impact of storage tank volume on system COP.
As shown in Figure 6, it can be seen that the system SF increases with the increase of the hot water storage tank volume. The annual averaged SF achieves 0.7 when the storage tank volume is 10 m3 and goes up to 0.78 when a 50 m3 storage tank is installed. However, with the increase of the storage tank volume, the growth of the SF becomes less obvious. In addition, the SF increment in April to November is much larger than in other months except June. This is because in these months, the solar thermal energy availability ratio has increased dramatically with the enhancement of the storage tank volume. Generally the monthly SF in summer seasons is higher than in winter periods, which is also due to relatively low HVAC system input energy consumption and high solar energy utilisation (solar energy applied to the regenerative heating coil for regeneration, but not the solar energy gathered by the collectors at that period). Therefore, the larger the storage tank volume, the more the solar energy utilisation rate.
Figure 7 indicates that the system electric COP increases with the enhancement of the storage tank volume. The increment is more apparent in summer months from January to March, and from September to December. This is because in these months, the increase of the storage tank volume would lead to more available solar energy utilisation and thus less backup heater energy consumption. The maximum COP happens in February with as high as about 24.1 to 28.5 for different tank volumes. These results are also coincident with the results studied in [8] by Goldsworthy and White that an electric COP of over 20 would be achieved for the optimised solar desiccant cooling system in Australia, which also provides some reliability for the simulation results and contributes to the system model validation. In addition, the annual averaged system COP increases from 10.0 for 10 m3 storage tank volume to about 13.2 for 50 m3 storage tank volume.
Figure 8 below demonstrates the influence of the storage tank volume on the annual backup heater energy consumption. The figure shows that increasing the storage tank volume will decrease the backup heater energy consumption. When enlarging the storage tank volume from 10 to 20 m3, the annual backup heater energy consumption will reduce about 39 GJ from 193 to 154 GJ. However, the backup heater energy consumption reduction is not in proportion with the storage tank volume increment. For every 10 m3 of storage tank volume increment, the backup heater energy savings decreases with the tank volume increases. In other words, the larger the storage tank volume is, the smaller the amount of backup heater energy savings can be achieved. For instance, when raising the tank volume from 40 to 50 m3, only about 9 GJ backup heater energy can be saved. Therefore, it is not recommended to increase the storage tank volume immoderately if considering the storage tank investment cost.
Figure 7. The impact of storage tank volume on system COP.
As shown in Figure 6, it can be seen that the system SF increases with the increase of the hot waterstorage tank volume. The annual averaged SF achieves 0.7 when the storage tank volume is 10 m3
and goes up to 0.78 when a 50 m3 storage tank is installed. However, with the increase of the storagetank volume, the growth of the SF becomes less obvious. In addition, the SF increment in April toNovember is much larger than in other months except June. This is because in these months, the solarthermal energy availability ratio has increased dramatically with the enhancement of the storage tankvolume. Generally the monthly SF in summer seasons is higher than in winter periods, which is alsodue to relatively low HVAC system input energy consumption and high solar energy utilisation (solarenergy applied to the regenerative heating coil for regeneration, but not the solar energy gathered by
Energies 2017, 10, 849 12 of 22
the collectors at that period). Therefore, the larger the storage tank volume, the more the solar energyutilisation rate.
Figure 7 indicates that the system electric COP increases with the enhancement of the storagetank volume. The increment is more apparent in summer months from January to March, and fromSeptember to December. This is because in these months, the increase of the storage tank volumewould lead to more available solar energy utilisation and thus less backup heater energy consumption.The maximum COP happens in February with as high as about 24.1 to 28.5 for different tank volumes.These results are also coincident with the results studied in [8] by Goldsworthy and White that anelectric COP of over 20 would be achieved for the optimised solar desiccant cooling system in Australia,which also provides some reliability for the simulation results and contributes to the system modelvalidation. In addition, the annual averaged system COP increases from 10.0 for 10 m3 storage tankvolume to about 13.2 for 50 m3 storage tank volume.
Figure 8 below demonstrates the influence of the storage tank volume on the annual backupheater energy consumption. The figure shows that increasing the storage tank volume will decreasethe backup heater energy consumption. When enlarging the storage tank volume from 10 to 20 m3,the annual backup heater energy consumption will reduce about 39 GJ from 193 to 154 GJ. However,the backup heater energy consumption reduction is not in proportion with the storage tank volumeincrement. For every 10 m3 of storage tank volume increment, the backup heater energy savingsdecreases with the tank volume increases. In other words, the larger the storage tank volume is, thesmaller the amount of backup heater energy savings can be achieved. For instance, when raising thetank volume from 40 to 50 m3, only about 9 GJ backup heater energy can be saved. Therefore, it isnot recommended to increase the storage tank volume immoderately if considering the storage tankinvestment cost.Energies 2017, 10, 849 12 of 21
Figure 8. The impact of storage tank volume on backup heater energy consumption.
3.2. The Impacts of Solar Collector Area
According to Henning [34], a typical value of the suggested solar collector area for a solar cooling system is about 10 m2 per 1000 m3/h of nominal supply air flow rate. The simulation result indicates that the design supply air flow rate of the proposed SDEC system for this typical office building in Brisbane is about 16 m3/s. Therefore, the selected values for the solar collector areas vary from 576 m2 to 684 m2 with interval 36, representing the supply air volume of 16 m3/s, 17 m3/s, 18 m3/s, and 19 m3/s respectively. For the hydraulic connection of the solar array, it assumes that the solar array is consisted of 32 to 38 rows in parallel, with each row of about 18 m2 collector area, mounted on the roof of the building. This means that nine solar collector modules are in series in each row, as each module is 1.98 m2 for the selected Solarhart Industries Bt solar thermal collector. The impacts of the solar collector area on system SF, COP and annual backup heater energy consumption are shown in Figures 9–11 below. This result analysis is based on the fixed storage tank volume of 40 m3 and backup heater capacity of 100 kW.
Figure 9. The impact of the solar collector area on solar fraction.
Figure 9 implies that the monthly SF rises with the increase of the solar collector area. When improving the installed solar collector area from 576 to 684 m2, the average annual SF could boost from
Figure 8. The impact of storage tank volume on backup heater energy consumption.
3.2. The Impacts of Solar Collector Area
According to Henning [34], a typical value of the suggested solar collector area for a solar coolingsystem is about 10 m2 per 1000 m3/h of nominal supply air flow rate. The simulation result indicatesthat the design supply air flow rate of the proposed SDEC system for this typical office building inBrisbane is about 16 m3/s. Therefore, the selected values for the solar collector areas vary from 576 m2
to 684 m2 with interval 36, representing the supply air volume of 16 m3/s, 17 m3/s, 18 m3/s, and19 m3/s respectively. For the hydraulic connection of the solar array, it assumes that the solar array isconsisted of 32 to 38 rows in parallel, with each row of about 18 m2 collector area, mounted on the
Energies 2017, 10, 849 13 of 22
roof of the building. This means that nine solar collector modules are in series in each row, as eachmodule is 1.98 m2 for the selected Solarhart Industries Bt solar thermal collector. The impacts of thesolar collector area on system SF, COP and annual backup heater energy consumption are shown inFigures 9–11 below. This result analysis is based on the fixed storage tank volume of 40 m3 and backupheater capacity of 100 kW.
Figure 9 implies that the monthly SF rises with the increase of the solar collector area. Whenimproving the installed solar collector area from 576 to 684 m2, the average annual SF could boostfrom 0.768 to 0.798. This is because the larger the solar collector area, the more energy gains from thesun. It is also noted that in winter seasons from April to August and in some summer periods likeNovember and December, the SF increment is more obvious than in other months. This is because inthese months, the useful solar energy QSolar increases apparently with the enlargement of the collectorarea. While in summer seasons from January to March, since the solar energy gain is relatively highenough, increasing the solar collector area will not apparently increase the useful solar utilisation.
Energies 2017, 10, 849 12 of 21
Figure 8. The impact of storage tank volume on backup heater energy consumption.
3.2. The Impacts of Solar Collector Area
According to Henning [34], a typical value of the suggested solar collector area for a solar cooling system is about 10 m2 per 1000 m3/h of nominal supply air flow rate. The simulation result indicates that the design supply air flow rate of the proposed SDEC system for this typical office building in Brisbane is about 16 m3/s. Therefore, the selected values for the solar collector areas vary from 576 m2 to 684 m2 with interval 36, representing the supply air volume of 16 m3/s, 17 m3/s, 18 m3/s, and 19 m3/s respectively. For the hydraulic connection of the solar array, it assumes that the solar array is consisted of 32 to 38 rows in parallel, with each row of about 18 m2 collector area, mounted on the roof of the building. This means that nine solar collector modules are in series in each row, as each module is 1.98 m2 for the selected Solarhart Industries Bt solar thermal collector. The impacts of the solar collector area on system SF, COP and annual backup heater energy consumption are shown in Figures 9–11 below. This result analysis is based on the fixed storage tank volume of 40 m3 and backup heater capacity of 100 kW.
Figure 9. The impact of the solar collector area on solar fraction.
Figure 9 implies that the monthly SF rises with the increase of the solar collector area. When improving the installed solar collector area from 576 to 684 m2, the average annual SF could boost from
Figure 9. The impact of the solar collector area on solar fraction.
Energies 2017, 10, 849 13 of 21
0.768 to 0.798. This is because the larger the solar collector area, the more energy gains from the sun. It is also noted that in winter seasons from April to August and in some summer periods like November and December, the SF increment is more obvious than in other months. This is because in these months, the useful solar energy increases apparently with the enlargement of the collector area. While in summer seasons from January to March, since the solar energy gain is relatively high enough, increasing the solar collector area will not apparently increase the useful solar utilisation.
Figure 10 shows the impact of the solar collector area on system COP. It indicates that the system COP increases slightly with the growth of the solar collector area, because it results in a reduced total HVAC electrical power consumption, especially for the backup heater. However, the increment is not quite as dramatic as that compared with the impact of changing storage tank volume.
Figure 10. The impact of the solar collector area on system COP.
Figure 11 illustrates the relation of the backup heater energy consumption with the solar collector area. It shows that the backup heater energy consumption decreases as the collector area increases. When changing the collector area from 576 to 612 m2, the backup heater could save 14 GJ electricity energy annually from 119 to 105 GJ. However, when the collector area continues to increase, the backup heater energy savings become smaller, which are about 13 GJ from 612 to 648 m2, and 9 GJ from 648 to 684 m2. In addition, the energy savings effect of increasing the solar collector area is not as dramatic as the effect of increasing the storage tank volume.
Figure 11. The impact of the solar collector area on annual backup heater energy consumption.
Figure 10. The impact of the solar collector area on system COP.
Energies 2017, 10, 849 14 of 22
Energies 2017, 10, 849 13 of 21
0.768 to 0.798. This is because the larger the solar collector area, the more energy gains from the sun. It is also noted that in winter seasons from April to August and in some summer periods like November and December, the SF increment is more obvious than in other months. This is because in these months, the useful solar energy increases apparently with the enlargement of the collector area. While in summer seasons from January to March, since the solar energy gain is relatively high enough, increasing the solar collector area will not apparently increase the useful solar utilisation.
Figure 10 shows the impact of the solar collector area on system COP. It indicates that the system COP increases slightly with the growth of the solar collector area, because it results in a reduced total HVAC electrical power consumption, especially for the backup heater. However, the increment is not quite as dramatic as that compared with the impact of changing storage tank volume.
Figure 10. The impact of the solar collector area on system COP.
Figure 11 illustrates the relation of the backup heater energy consumption with the solar collector area. It shows that the backup heater energy consumption decreases as the collector area increases. When changing the collector area from 576 to 612 m2, the backup heater could save 14 GJ electricity energy annually from 119 to 105 GJ. However, when the collector area continues to increase, the backup heater energy savings become smaller, which are about 13 GJ from 612 to 648 m2, and 9 GJ from 648 to 684 m2. In addition, the energy savings effect of increasing the solar collector area is not as dramatic as the effect of increasing the storage tank volume.
Figure 11. The impact of the solar collector area on annual backup heater energy consumption. Figure 11. The impact of the solar collector area on annual backup heater energy consumption.
Figure 10 shows the impact of the solar collector area on system COP. It indicates that the systemCOP increases slightly with the growth of the solar collector area, because it results in a reduced totalHVAC electrical power consumption, especially for the backup heater. However, the increment is notquite as dramatic as that compared with the impact of changing storage tank volume.
Figure 11 illustrates the relation of the backup heater energy consumption with the solar collectorarea. It shows that the backup heater energy consumption decreases as the collector area increases.When changing the collector area from 576 to 612 m2, the backup heater could save 14 GJ electricityenergy annually from 119 to 105 GJ. However, when the collector area continues to increase, the backupheater energy savings become smaller, which are about 13 GJ from 612 to 648 m2, and 9 GJ from 648 to684 m2. In addition, the energy savings effect of increasing the solar collector area is not as dramatic asthe effect of increasing the storage tank volume.
3.3. The Impacts of Backup Heater Capacity
The backup heater is an important auxiliary component for the solar air conditioning systemwhich is used to provide supplementary thermal power when solar energy is insufficient. The capacityof the backup heater is a key element to the system performance in terms of the backup heater energyconsumption and the backup heater hot water outlet set-point temperature. In order to assess theinfluence of the backup heater capacity on the system performance, four variables of the backup heatercapacity were evaluated: 50, 100, 200 and 300 kW. The maximum of 300 kW was selected based on theassumption that no solar thermal energy is contributed to the system and all thermal heat required forregeneration comes from the backup heater. The backup heater energy consumption and the enteringregeneration heating coil hot water temperature are the two performance indicators. The backup heatercapacity analysis is based on the fixed storage tank volume of 40 m3 and collector area of 576 m2.
Figure 12 demonstrates the monthly backup heater energy consumption with various backupheater capacities. The figure indicates that the backup heater consumes more energy in winterfrom April to August. This is because of low solar energy gains in winter, while at the sametime dehumidifying the outdoor air is still required in Brisbane. The backup heater also consumessubstantial electricity in November. This is due to high dehumidification demand in November.In addition, the 50 kW heater capacity requires the least annual total electrical energy, while the backupheater consumes the most annual electricity when the capacity is 100 kW. However, the backup heater’senergy consumption is quite similar between 100, 200 and 300 kW capacity.
Energies 2017, 10, 849 15 of 22
Energies 2017, 10, 849 14 of 21
3.3. The Impacts of Backup Heater Capacity
The backup heater is an important auxiliary component for the solar air conditioning system which is used to provide supplementary thermal power when solar energy is insufficient. The capacity of the backup heater is a key element to the system performance in terms of the backup heater energy consumption and the backup heater hot water outlet set-point temperature. In order to assess the influence of the backup heater capacity on the system performance, four variables of the backup heater capacity were evaluated: 50, 100, 200 and 300 kW. The maximum of 300 kW was selected based on the assumption that no solar thermal energy is contributed to the system and all thermal heat required for regeneration comes from the backup heater. The backup heater energy consumption and the entering regeneration heating coil hot water temperature are the two performance indicators. The backup heater capacity analysis is based on the fixed storage tank volume of 40 m3 and collector area of 576 m2.
Figure 12 demonstrates the monthly backup heater energy consumption with various backup heater capacities. The figure indicates that the backup heater consumes more energy in winter from April to August. This is because of low solar energy gains in winter, while at the same time dehumidifying the outdoor air is still required in Brisbane. The backup heater also consumes substantial electricity in November. This is due to high dehumidification demand in November. In addition, the 50 kW heater capacity requires the least annual total electrical energy, while the backup heater consumes the most annual electricity when the capacity is 100 kW. However, the backup heater’s energy consumption is quite similar between 100, 200 and 300 kW capacity.
Figure 12. The impact of backup heater capacity on backup heater energy consumption.
Figure 13 shows the impact of backup heater capacity on the regenerative heating coil inlet water temperature , , . The figure illustrates that in cooling and dehumidification dominated months from August to December and from January to April, the regeneration heating coil hot water inlet temperature can meet the design set-point of 75 °C with 5 °C dead band for all capacities. In winter months from May to July, the 50 kW heater capacity could not satisfy the design set-point temperature for the regeneration heating coil hot water inlet due to insufficient heater capacity. However, for the other three heater capacities, the monthly , , is quite similar, all above 72 °C.
Figure 12. The impact of backup heater capacity on backup heater energy consumption.
Figure 13 shows the impact of backup heater capacity on the regenerative heating coil inlet watertemperature Treg,w,in. The figure illustrates that in cooling and dehumidification dominated monthsfrom August to December and from January to April, the regeneration heating coil hot water inlettemperature can meet the design set-point of 75 ◦C with 5 ◦C dead band for all capacities. In wintermonths from May to July, the 50 kW heater capacity could not satisfy the design set-point temperaturefor the regeneration heating coil hot water inlet due to insufficient heater capacity. However, for theother three heater capacities, the monthly Treg,w,in is quite similar, all above 72 ◦C.Energies 2017, 10, 849 15 of 21
Figure 13. The impact of backup heater capacity on , , .
Figure 14 clearly demonstrates the impact of varying backup heater capacities on the annual backup heater energy consumption and the yearly average regeneration heating coil hot water inlet temperature. The figure implies that although 50 kW heater capacity consumes the least backup electricity of only 97.65 GJ annually, the regeneration heating coil hot water inlet temperature could not reach its set-point on the yearly average, which will definitely lower the dehumidifying effect, especially in winter months when dehumidification is still required. This is because in Brisbane, the outdoor humidity ratio in some winter periods is still above the dehumidification trigger set-point of 0.008 kg/kg. Since the 100 kW heater capacity has quite similar performances with bigger capacities on the annual and the yearly averaged , , , considering the backup heater investment cost factor, 100 kW backup heater capacity would probably be the best choice for this system.
Figure 14. The impact of varying backup heater capacity on and , , .
3.4. Economic Optimization of Storage Tank Volume and Solar Collector Area
From the above discussion in Sections 3.1 and 3.2, it is concluded that either increasing the storage tank volume or increasing the solar collector area could lead to increased system SF and system COP while at the same time decrease the backup heater electricity energy consumption. As the storage tank volume and solar collector area are two important parameters that influence the solar desiccant cooling system performance, it is crucial to investigate their impacts as a whole. In addition, considering the investment cost, it is also significantly important to evaluate the optimized storage tank volume and solar collector area configuration from the economic point of view for the SDEC system. Therefore, a LCC analysis for the solar subsystem is also conducted. Figure 15 below illustrates how the storage tank volume and solar collector area together influence the system backup heater energy consumption. The simulations are based on 100 kW backup heater capacity.
Figure 13. The impact of backup heater capacity on Treg,w,in.
Figure 14 clearly demonstrates the impact of varying backup heater capacities on the annualbackup heater energy consumption and the yearly average regeneration heating coil hot water inlettemperature. The figure implies that although 50 kW heater capacity consumes the least backupelectricity of only 97.65 GJ annually, the regeneration heating coil hot water inlet temperature couldnot reach its set-point on the yearly average, which will definitely lower the dehumidifying effect,especially in winter months when dehumidification is still required. This is because in Brisbane,the outdoor humidity ratio in some winter periods is still above the dehumidification trigger set-pointof 0.008 kg/kg. Since the 100 kW heater capacity has quite similar performances with bigger capacitieson the annual EAux and the yearly averaged Treg,w,in, considering the backup heater investment costfactor, 100 kW backup heater capacity would probably be the best choice for this system.
Energies 2017, 10, 849 16 of 22
Energies 2017, 10, 849 15 of 21
Figure 13. The impact of backup heater capacity on , , .
Figure 14 clearly demonstrates the impact of varying backup heater capacities on the annual backup heater energy consumption and the yearly average regeneration heating coil hot water inlet temperature. The figure implies that although 50 kW heater capacity consumes the least backup electricity of only 97.65 GJ annually, the regeneration heating coil hot water inlet temperature could not reach its set-point on the yearly average, which will definitely lower the dehumidifying effect, especially in winter months when dehumidification is still required. This is because in Brisbane, the outdoor humidity ratio in some winter periods is still above the dehumidification trigger set-point of 0.008 kg/kg. Since the 100 kW heater capacity has quite similar performances with bigger capacities on the annual and the yearly averaged , , , considering the backup heater investment cost factor, 100 kW backup heater capacity would probably be the best choice for this system.
Figure 14. The impact of varying backup heater capacity on and , , .
3.4. Economic Optimization of Storage Tank Volume and Solar Collector Area
From the above discussion in Sections 3.1 and 3.2, it is concluded that either increasing the storage tank volume or increasing the solar collector area could lead to increased system SF and system COP while at the same time decrease the backup heater electricity energy consumption. As the storage tank volume and solar collector area are two important parameters that influence the solar desiccant cooling system performance, it is crucial to investigate their impacts as a whole. In addition, considering the investment cost, it is also significantly important to evaluate the optimized storage tank volume and solar collector area configuration from the economic point of view for the SDEC system. Therefore, a LCC analysis for the solar subsystem is also conducted. Figure 15 below illustrates how the storage tank volume and solar collector area together influence the system backup heater energy consumption. The simulations are based on 100 kW backup heater capacity.
Figure 14. The impact of varying backup heater capacity on EAux and Treg,w,in.
3.4. Economic Optimization of Storage Tank Volume and Solar Collector Area
From the above discussion in Sections 3.1 and 3.2, it is concluded that either increasing the storagetank volume or increasing the solar collector area could lead to increased system SF and system COPwhile at the same time decrease the backup heater electricity energy consumption. As the storage tankvolume and solar collector area are two important parameters that influence the solar desiccant coolingsystem performance, it is crucial to investigate their impacts as a whole. In addition, considering theinvestment cost, it is also significantly important to evaluate the optimized storage tank volume andsolar collector area configuration from the economic point of view for the SDEC system. Therefore, aLCC analysis for the solar subsystem is also conducted. Figure 15 below illustrates how the storagetank volume and solar collector area together influence the system backup heater energy consumption.The simulations are based on 100 kW backup heater capacity.Energies 2017, 10, 849 16 of 21
Figure 15. The impacts of tank volume and collector area on annual backup heater energy consumption.
From the figure it is clear that the backup heater energy consumption decreases with the increase of the storage tank volume and solar collector area. In addition, increasing the storage tank volume would result in more backup heater energy conservation than increasing the solar collector area. It points out that boosting the storage tank volume from 10 to 50 m3 would achieve about 83 GJ annual backup heater energy savings while only less than 40 GJ backup heater energy could be saved by increasing the solar collector area from 576 to 684 m2. Therefore, increasing the storage tank volume would contribute to more energy savings than improving the solar collector area. However, with the increment of the storage tank volume, the backup heater energy savings potential becomes less obvious.
Figure 16 demonstrates the life cycle cost of different storage tank volume and solar collector area configurations for the solar subsystem of the SDEC system. The inflation rate is selected as 2.5% [22]. The discount rate is 8% and system lifespan is assumed as 25 years [1]. The commercial electricity fuel cost in Brisbane is 10.48 c/kWh [3]. The maintenance cost is assumed to be 1% of the total investment cost of the solar subsystem [26]. All other economic assumptions including the initial cost of the solar collector, storage tank, backup heater, and solar water pumps are referenced from [35]. The economic parameters for the LCC calculation are summarized in Table 5.
Figure 16. Solar subsystem LCC vs. storage tank volume and collector area.
Table 5. Cost of different components and economic parameters [35].
Components Value Solar collector 423 $/m2 Storage tank 550 $/m3
Backup heater 440 $/kW Solar water pumps $8840 Electricity fuel cost 10.48 c/kWh
System lifespan 25 years Inflation rate 2.5% Discount rate 8%
Figure 15. The impacts of tank volume and collector area on annual backup heater energy consumption.
From the figure it is clear that the backup heater energy consumption decreases with the increaseof the storage tank volume and solar collector area. In addition, increasing the storage tank volumewould result in more backup heater energy conservation than increasing the solar collector area.It points out that boosting the storage tank volume from 10 to 50 m3 would achieve about 83 GJannual backup heater energy savings while only less than 40 GJ backup heater energy could be savedby increasing the solar collector area from 576 to 684 m2. Therefore, increasing the storage tankvolume would contribute to more energy savings than improving the solar collector area. However,
Energies 2017, 10, 849 17 of 22
with the increment of the storage tank volume, the backup heater energy savings potential becomesless obvious.
Figure 16 demonstrates the life cycle cost of different storage tank volume and solar collector areaconfigurations for the solar subsystem of the SDEC system. The inflation rate is selected as 2.5% [22].The discount rate is 8% and system lifespan is assumed as 25 years [1]. The commercial electricity fuelcost in Brisbane is 10.48 c/kWh [3]. The maintenance cost is assumed to be 1% of the total investmentcost of the solar subsystem [26]. All other economic assumptions including the initial cost of the solarcollector, storage tank, backup heater, and solar water pumps are referenced from [35]. The economicparameters for the LCC calculation are summarized in Table 5.
Energies 2017, 10, 849 16 of 21
Figure 15. The impacts of tank volume and collector area on annual backup heater energy consumption.
From the figure it is clear that the backup heater energy consumption decreases with the increase of the storage tank volume and solar collector area. In addition, increasing the storage tank volume would result in more backup heater energy conservation than increasing the solar collector area. It points out that boosting the storage tank volume from 10 to 50 m3 would achieve about 83 GJ annual backup heater energy savings while only less than 40 GJ backup heater energy could be saved by increasing the solar collector area from 576 to 684 m2. Therefore, increasing the storage tank volume would contribute to more energy savings than improving the solar collector area. However, with the increment of the storage tank volume, the backup heater energy savings potential becomes less obvious.
Figure 16 demonstrates the life cycle cost of different storage tank volume and solar collector area configurations for the solar subsystem of the SDEC system. The inflation rate is selected as 2.5% [22]. The discount rate is 8% and system lifespan is assumed as 25 years [1]. The commercial electricity fuel cost in Brisbane is 10.48 c/kWh [3]. The maintenance cost is assumed to be 1% of the total investment cost of the solar subsystem [26]. All other economic assumptions including the initial cost of the solar collector, storage tank, backup heater, and solar water pumps are referenced from [35]. The economic parameters for the LCC calculation are summarized in Table 5.
Figure 16. Solar subsystem LCC vs. storage tank volume and collector area.
Table 5. Cost of different components and economic parameters [35].
Components Value Solar collector 423 $/m2 Storage tank 550 $/m3
Backup heater 440 $/kW Solar water pumps $8840 Electricity fuel cost 10.48 c/kWh
System lifespan 25 years Inflation rate 2.5% Discount rate 8%
Figure 16. Solar subsystem LCC vs. storage tank volume and collector area.
Table 5. Cost of different components and economic parameters [35].
System lifespan 25 yearsInflation rate 2.5%Discount rate 8%
The LCC is calculated using the present value method by introducing a present worth factor(PWF), which is used to compare the future cost of a product to today’s cost taken into account anobligation recurs each year at i inflation rate and d discount rate over N years of lifespan [36]. The LCCis then calculated by the following equations [36,37]:
PWF(N, i, d) = ∑Nj=1
(1 + i)j−1
(1 + d)j =
1d−i
[1−
(1+i1+d
)N]
, i f i 6= dN
i+1 , i f i = d(13)
LCC = IC + PWF×OC (14)
where PWF implies the present worth factor; i is the inflation rate; d is the discount rate; N is thelifetime of the system; IC is the total initial investment cost of the solar subsystem; and OC is theannual operating cost which consists of the annual fuel cost and maintenance cost.
The LCC results indicate that the 576 m2 solar collector configuration has the lowest solarsubsystem LCC regardless of the storage tank volume. The larger the solar collector area, the higherthe LCC. It also indicates that 30 m3 storage tank volume configuration has the lowest LCC for all solar
Energies 2017, 10, 849 18 of 22
collector area configurations. The lowest LCC happens in 30 m3/576 m2 storage capacity configurationwith $405,954.
3.5. The Impacts of Outdoor Air Humidity Ratio Control
The outdoor air humidity ratio control strategy applied to the SDEC system controls the operationof the desiccant dehumidification process. It aims at reducing unnecessary regeneration energyconsumption when dehumidifying is not required. It is accomplished by an actuator on the EMSthat senses the outdoor air humidity ratio. Therefore, to analyse its impact on the SDEC systemperformance, four outdoor air humidity ratio control set-point values have been assessed, which are0.006, 0.008, 0.010 and 0.012 kgWater/kgDryAir. The backup heater energy consumption and indoorthermal conditions are the indicators as illustrated in Figure 17 below. The analysis is based on 576 m2
collector area, 40 m3 storage tank volume, and 100 kW backup heater capacity. The Time Set-point NotMet During Occupied Cooling means the ratio of the unmet indoor cooling set-point hours to the totalHVAC operation hours in a year (3120 h of HVAC operation).Energies 2017, 10, 849 18 of 21
Figure 17. The impact of the outdoor air humidity ratio control on backup heater energy consumption and indoor thermal conditions.
4. Conclusions
This paper has evaluated the factors that influence the SDEC system performance for a typical office building in Brisbane, Australia, in terms of the storage tank volume, solar collector area, backup heater capacity, and outdoor air humidity control set-point. The sensitivity analysis results have indicated that either increasing the storage tank volume or increasing solar collector area could result in improved system SF and system COP, while at the same time reduce backup heater energy consumption. When increasing the storage tank volume from 10 to 50 m3, the annual average system SF was increased by 11.4% from 0.7 to 0.78, and the annual average system electric COP was increased by 32% from 10.0 to 13.2. Meanwhile, the annual backup heater energy consumption was reduced by 43% from about 193 to 110 GJ.
On the other hand, increasing the installed solar thermal collector area from 576 to 684 m2 resulted in 3.9% increase in the annual average system SF and 23% increase in the annual average system electric COP, along with about 30.4% annual backup heater energy savings. These implied that the storage tank volume was more sensitive to the SDEC system energy performance than the solar collector area. In addition, from the economic point of view, the 30 m3/576 m2 storage tank volume to solar collector area ratio has the lowest solar subsystem LCC of $405,954, which was the optimized configuration relating to storage tank volume and solar collector area.
In relation to the backup heater capacity, 100 kW heater capacity appeared to be preferable, which could satisfy the 75 °C design regeneration heating coil hot water inlet temperature set-point with relatively low backup heater electricity consumption of 119 GJ annually. However, more than 100 kW backup heater capacity would not apparently influence the regeneration heating coil hot water inlet temperature and the backup heater energy consumption.
Finally, increasing the outdoor air humidity ratio actuator set-point for dehumidification control would dramatically reduce backup heater energy consumption perhaps at the expense of indoor thermal conditions. An outdoor air humidity ratio control set-point of 0.008 kgWater/kgDryAir was more reasonable, which could achieve both low backup heater energy consumption and good indoor thermal conditions with only 3.7% time set-point not met during occupied cooling.
Acknowledgments: The authors would like to acknowledge that Queensland University of Technology (QUT) provided the funds for covering the costs to publish in open access.
Author Contributions: Yunlong Ma and Lisa Guan conceived the project. Yunlong Ma created the building and system model, and conducted the simulation. Yunlong Ma, Lisa Guan and Wendy Miller analyzed and presented the simulation results data. Yunlong Ma wrote the paper. Suvash C. Saha and Wendy Miller provided revisions and feedback for the paper manuscript. Suvash C. Saha applied for the funds for open access publication.
Figure 17. The impact of the outdoor air humidity ratio control on backup heater energy consumptionand indoor thermal conditions.
It shows that the higher the outdoor air humidity ratio set-point is, the lower the backup heaterelectricity consumption is. When increasing the outdoor air humidity ratio control set-point from0.006 to 0.012 kgWater/kgDryAir, the annual backup heater energy consumption reduces dramaticallyfrom 203 to about 0.33 GJ. This is because of the reduced desiccant dehumidifying operation whenimproving the outdoor air humidity ratio actuator set-point.
However, this will increase the frequency of high indoor temperature events. The indoor coolingset-point unmet time could increase significantly from 3.7 to 11.1% when increasing the outdoor airhumidity ratio control set-point from 0.006 to 0.012 kgWater/kgDryAir. It is quite obvious that whenthe outdoor air humidity ratio control set-point goes above 0.008 kg/kg, the unmet indoor coolingset-point time soars exponentially. While decreasing the outdoor air humidity ratio control set-pointbelow 0.008 kgWater/kgDryAir would not impact the indoor thermal condition but increase thebackup heater energy consumption dramatically. Therefore, the 0.008 kgWater/kgDryAir outdoorair humidity control set-point seems to be the most reasonable value for this SDEC system underBrisbane climate.
Energies 2017, 10, 849 19 of 22
4. Conclusions
This paper has evaluated the factors that influence the SDEC system performance for a typicaloffice building in Brisbane, Australia, in terms of the storage tank volume, solar collector area, backupheater capacity, and outdoor air humidity control set-point. The sensitivity analysis results haveindicated that either increasing the storage tank volume or increasing solar collector area couldresult in improved system SF and system COP, while at the same time reduce backup heater energyconsumption. When increasing the storage tank volume from 10 to 50 m3, the annual average systemSF was increased by 11.4% from 0.7 to 0.78, and the annual average system electric COP was increasedby 32% from 10.0 to 13.2. Meanwhile, the annual backup heater energy consumption was reduced by43% from about 193 to 110 GJ.
On the other hand, increasing the installed solar thermal collector area from 576 to 684 m2 resultedin 3.9% increase in the annual average system SF and 23% increase in the annual average system electricCOP, along with about 30.4% annual backup heater energy savings. These implied that the storagetank volume was more sensitive to the SDEC system energy performance than the solar collector area.In addition, from the economic point of view, the 30 m3/576 m2 storage tank volume to solar collectorarea ratio has the lowest solar subsystem LCC of $405,954, which was the optimized configurationrelating to storage tank volume and solar collector area.
In relation to the backup heater capacity, 100 kW heater capacity appeared to be preferable, whichcould satisfy the 75 ◦C design regeneration heating coil hot water inlet temperature set-point withrelatively low backup heater electricity consumption of 119 GJ annually. However, more than 100 kWbackup heater capacity would not apparently influence the regeneration heating coil hot water inlettemperature and the backup heater energy consumption.
Finally, increasing the outdoor air humidity ratio actuator set-point for dehumidification controlwould dramatically reduce backup heater energy consumption perhaps at the expense of indoorthermal conditions. An outdoor air humidity ratio control set-point of 0.008 kgWater/kgDryAir wasmore reasonable, which could achieve both low backup heater energy consumption and good indoorthermal conditions with only 3.7% time set-point not met during occupied cooling.
Acknowledgments: The authors would like to acknowledge that Queensland University of Technology (QUT)provided the funds for covering the costs to publish in open access.
Author Contributions: Yunlong Ma and Lisa Guan conceived the project. Yunlong Ma created the building andsystem model, and conducted the simulation. Yunlong Ma, Lisa Guan and Wendy Miller analyzed and presentedthe simulation results data. Yunlong Ma wrote the paper. Suvash C. Saha and Wendy Miller provided revisionsand feedback for the paper manuscript. Suvash C. Saha applied for the funds for open access publication.
Conflicts of Interest: The authors declare no conflict of interest.
Nomenclature
Ac Solar collector area (m2)B1−8 Temperature equation coefficients for the desiccant wheelC1−8 Humidity ratio equation coefficients for the desiccant wheelCOP Coefficient of performanceCw Specific heat of the collector working fluid (kJ/kg/K)c0 Solar thermal collector optical efficiencyc1, c2 Solar thermal collector heat loss coefficients (W/m2·K and W/m2·K2)d Discount rate (%)EAux Electricity energy consumption by the backup heater (GJ)ESolar Useful solar thermal energy input for regeneration (GJ)Ein Total energy input for driving the solar desiccant cooling system (GJ)Ehvac Energy input of fans, pumps, backup heater, desiccant wheel, and evaporative coolers (GJ)ho Enthalpy of outside air (kJ/kg)hs Enthalpy of supply air (kJ/kg)
Energies 2017, 10, 849 20 of 22
h·A The air-to-air heat exchanger surface convective heat transfer coefficient multiply by theheat exchanger heat transfer area (W)
I Total incident solar radiation (W/m2)i Inflation rate (%)IC Total initial investment cost of the solar subsystem ($)mo Outside air mass flow rate (kg/s)m Mass flow rate of the working fluid through the collector (kg/s)N Lifespan of the systemOC Annual operating cost of the solar subsystem ($)PTI Process inlet air dry bulb temperature (◦C)PWI Process inlet air humidity ratio (kg/kg)PWF Present worth factorQC System cooling effect (kW)QSolar Solar energy gains from solar thermal collectors (kW)RFV Regeneration (and process) air face velocity (m/s)RWI Regeneration inlet air humidity ratio (kg/kg)RWO Regeneration outlet air humidity ratio (kg/kg)RTI Regeneration inlet air dry bulb temperature (◦C)RTO Regeneration outlet air dry bulb temperature (◦C)SF Solar fractiont1−9 Dry bulb temperature of the air at each point in Figure 1 (◦C)w1−9 Humidity ratio of the air at each point in Figure 1 (kgWater/kgDryAir)Ta Ambient air temperature (◦C)Tdb,in Evaporative cooler inlet air dry bulb temperature (◦C)Tdb,out Evaporative cooler outlet air dry bulb temperature (◦C)Tin Water inlet temperature of the solar collector and backup heater (◦C)Tset Hot water set-point temperature in the backup heater (◦C)Treg,w,in Regenerative heating coil inlet water temperature (◦C)T Mean temperature of Tin and Tset (◦C)Twb,in Evaporative cooler inlet air wet bulb temperature (◦C)UA Overall heat loss coefficient of the backup heater to environment during operation (W/m2·K)Win Total energy input for driving the HVAC system (kW)Whvac Electricity power input of all the HVAC electric components (kW)ε Direct evaporative cooler effectivenessεHX Air-to-air heat exchanger effectivenessηSolar Solar thermal collector’s efficiencyη Backup heater efficiency
References
1. Baniyounes, A.M.; Liu, G.; Rasul, M.G.; Khan, M.M.K. Analysis of solar desiccant cooling system for aninstitutional building in subtropical Queensland, Australia. Renew. Sustain. Energy Rev. 2012, 16, 6423–6431.[CrossRef]
2. Angrisani, G.; Roselli, C.; Sasso, M.; Tariello, F. Assessment of energy, environmental and economicperformance of a solar desiccant cooling system with different collector types. Energies 2014, 2014, 6741–6764.[CrossRef]
3. Ma, Y.; Guan, L.; Brown, R. Techno-economic analysis of a solar desiccant-evaporative cooling system withdifferent collector types for australian office buildings. In Proceedings of the Asia Pacific Solar ResearchConference, Brisbane, Australia, 8–10 December 2015; Egan, R., Passey, R., Eds.; Australian PV Institute:Brisbane, Australia, 2015.
4. Rafique, M.; Rehman, S.; Lashin, A.; Al Arifi, N. Analysis of a solar cooling system for climatic conditions offive different cities of Saudi Arabia. Energies 2016, 9, 75. [CrossRef]
5. Angrisani, G.; Roselli, C.; Sasso, M.; Tariello, F.; Vanoli, G. Performance assessment of a solar-assisteddesiccant-based air handling unit considering different scenarios. Energies 2016, 9, 724. [CrossRef]
6. Li, H.; Dai, Y.J.; Li, Y.; La, D.; Wang, R.Z. Case study of a two-stage rotary desiccant cooling/heating systemdriven by evacuated glass tube solar air collectors. Energy Build. 2012, 47, 107–112. [CrossRef]
7. Ge, T.S.; Ziegler, F.; Wang, R.Z.; Wang, H. Performance comparison between a solar driven rotary desiccantcooling system and conventional vapor compression system (performance study of desiccant cooling).Appl. Therm. Eng. 2010, 30, 724–731. [CrossRef]
8. Goldsworthy, M.; White, S. Optimisation of a desiccant cooling system design with indirect evaporativecooler. Int. J. Refrig. 2011, 34, 148–158. [CrossRef]
9. Henning, H.-M.; Motta, M.; Mugnier, D. Solar Cooling Handbook: A Guide to Solar Assisted Cooling andDehumidification Processes, 3rd ed.; AMBRA: Vienna, Austria, 2013.
10. White, S.D.; Kohlenbach, P.; Bongs, C. Indoor temperature variations resulting from solar desiccant coolingin a building without thermal backup. Int. J. Refrig. 2009, 32, 695–704. [CrossRef]
11. Parmar, H.; Hindoliya, D.A. Performance of solid desiccant-based evaporative cooling system under theclimatic zones of India. Int. J. Low-Carbon Technol. 2012, 8, 52–57. [CrossRef]
12. Hatami, Z.; Saidi, M.H.; Mohammadian, M.; Aghanajafi, C. Optimization of solar collector surface in solardesiccant wheel cycle. Energy Build. 2012, 45, 197–201. [CrossRef]
14. Rafique, M.; Rehman, S.; Alhems, L.; Lashin, A. Parametric analysis of a rotary type liquid desiccant airconditioning system. Energies 2016, 9, 305. [CrossRef]
15. Santori, G.; Sapienza, A.; Freni, A. A dynamic multi-level model for adsorptive solar cooling. Renew. Energy2012, 43, 301–312. [CrossRef]
16. ABCB. ABCB Energy Modelling of Office Buildings for Climate Zoning (Class 5 Climate Zoning Consultancy) Stages1, 2 & 3; Australian Building Codes Board: Canberra, Australia; ACADS-BSG: Glen Iris, Australia, 2002.
17. ABCB. ABCB Energy Modelling of Office Buildings for Climate Zoning (Class 5 Climate Zoning Consultancy) Stages4 & 5; Australian Building Codes Board: Canberra, Australia; ACADS-BSG: Glen Iris, Australia, 2002.
18. Daly, D.; Cooper, P.; Ma, Z. Understanding the risks and uncertainties introduced by common assumptionsin energy simulations for Australian commercial buildings. Energy Build. 2014, 75, 382–393. [CrossRef]
19. Daly, D.; Cooper, P.; Ma, Z. Implications of global warming for commercial building retrofitting in Australiancities. Build. Environ. 2014, 74, 86–95. [CrossRef]
20. Ma, Y.; Guan, L. Performance analysis of solar desiccant-evaporative cooling for a commercial building underdifferent Australian climates. In Proceedings of the 9th International Symposium on Heating, Ventilationand Air Conditioning (ISHVAC)—The 3rd International Conference on Building Energy and Environment(COBEE), Tianjin, China, 12–15 July 2015; Sun, Y., Pei, J., Eds.; Procedia Engineering: Tianjin, China, 2015;Volume 121, pp. 528–535.
21. Bannister, P. Australian Building Codes Board: Class 5 Benchmarking; Exergy Australia Pty Limited: Belconnen,Australia, 2004.
22. Donnelly, E. Economic Analysis of Energy Provisions for Base Building Fabric Elements of Air-Conditioned OfficeSpaces; Australian Building Codes Board: Canberra, Australia, 2004.
23. ABCB. National Construction Code 2016 Building Code of Australia—Volume One; The Australian BuildingCodes Board: Canberra, Australia, 2016.
24. Egan, A.M. Air tightness of Australian offices buildings: Reality versus typical assumptions used in energyperformance simulation. In Proceedings of the 12th Conference of International Building PerformanceSimulation Association, Sydney, Australia, 14–16 November 2011.
25. Feng, X.; Yan, D.; Peng, C.; Jiang, Y. Influence of residential building air tightness on energy consumption.HVAC 2014, 44, 5–14.
27. Selke, T.; Frein, A. Collection of Good Practices for DEC Design and Installation; IEA Solar Heating and CoolingProgram: 2015, Task 48—Activity B2 Final Report, November 2015; Daniel Mugnier: Perpignan, France;Available online: http://task48.iea-shc.org/publications (accessed on 4 May 2017).
28. SOLAVIS. Flat Plate Collectors v Evacuated Tubes—A Brief Overview. 2008. Available online: www.solarvis.com.au (accessed on 4 May 2017).
29. DOE. EnergyPlus Engineering Reference. Available online: https://energyplus.net/documentation(accessed on 5 January 2016).
30. Desiccant Rotors International Pvt. Ltd. Technical Specification of ECO-DRY Desiccant Cassette. Availableonline: http://www.drirotors.com/ (accessed on 17 September 2015).
31. Dezfouli, M.M.S.; Mat, S.; Pirasteh, G.; Sahari, K.S.M.; Sopian, K.; Ruslan, M.H. Simulation analysis ofthe four configurations of solar desiccant cooling system using evaporative cooling in tropical weather inMalaysia. Int. J. Photoenergy 2014, 2014, 1–14. [CrossRef]
32. Baniyounes, A.M.; Liu, G.; Rasul, M.G.; Khan, M.M.K. Comparison study of solar cooling technologies foran institutional building in subtropical Queensland, Australia. Renew. Sustain. Energy Rev. 2013, 23, 421–430.[CrossRef]
33. Guangzhou Jiema Heat Exchange Equipment Co., Ltd. Air to Air Heat Exchanger. Available online:www.jiema-heatexchangers.com (accessed on 5 January 2016).
34. Henning, H.-M. Solar assisted air conditioning of buildings—An overview. Appl. Therm. Eng. 2007, 27,1734–1749. [CrossRef]
35. Ma, Y. Investigation of Advanced Solar-assisted Cooling for Australian Commercial Buildings. Master’Thesis, Queensland University of Technology, Brisbane, Australia, 2016.
36. Duffie, J.A.; Beckman, W.A. Solar Engineering of Thermal Processes., 4th ed.; John Wiley & Sons, Inc.: Hoboken,NJ, USA, 2013.
37. Abdel-Salam, A.H.; Ge, G.; Simonson, C.J. Thermo-economic performance of a solar membrane liquiddesiccant air conditioning system. Sol. Energy 2014, 102, 56–73. [CrossRef]

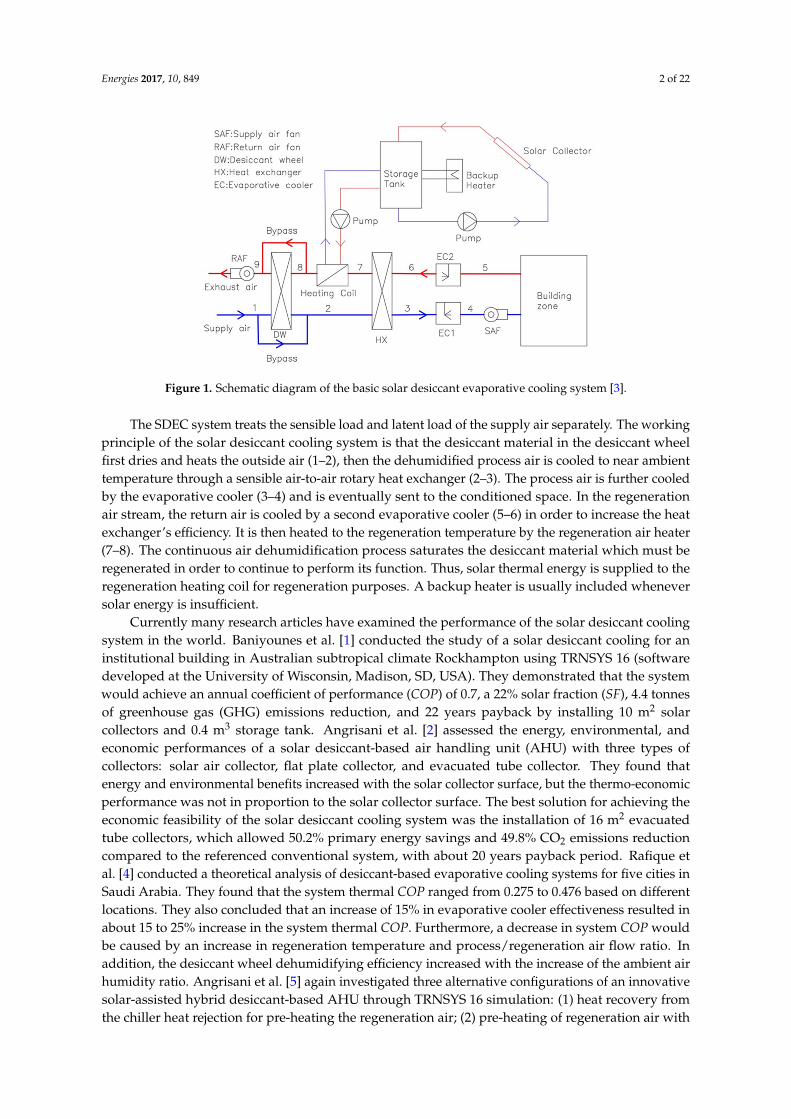
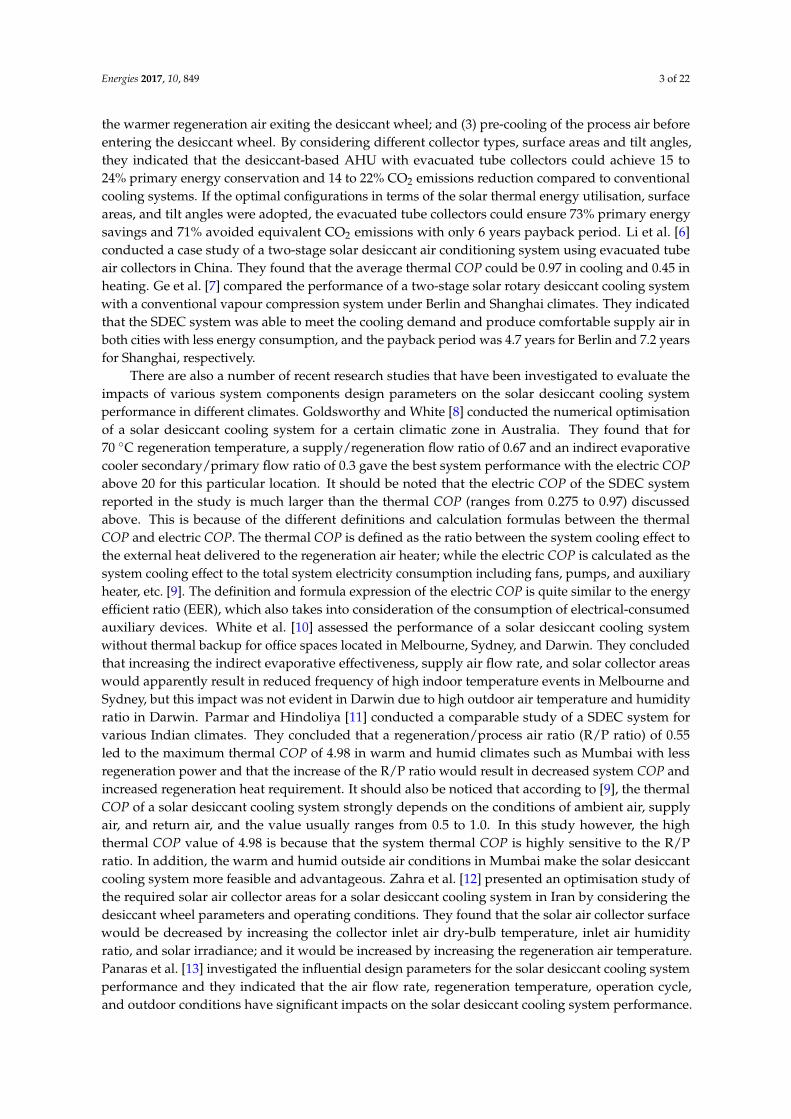
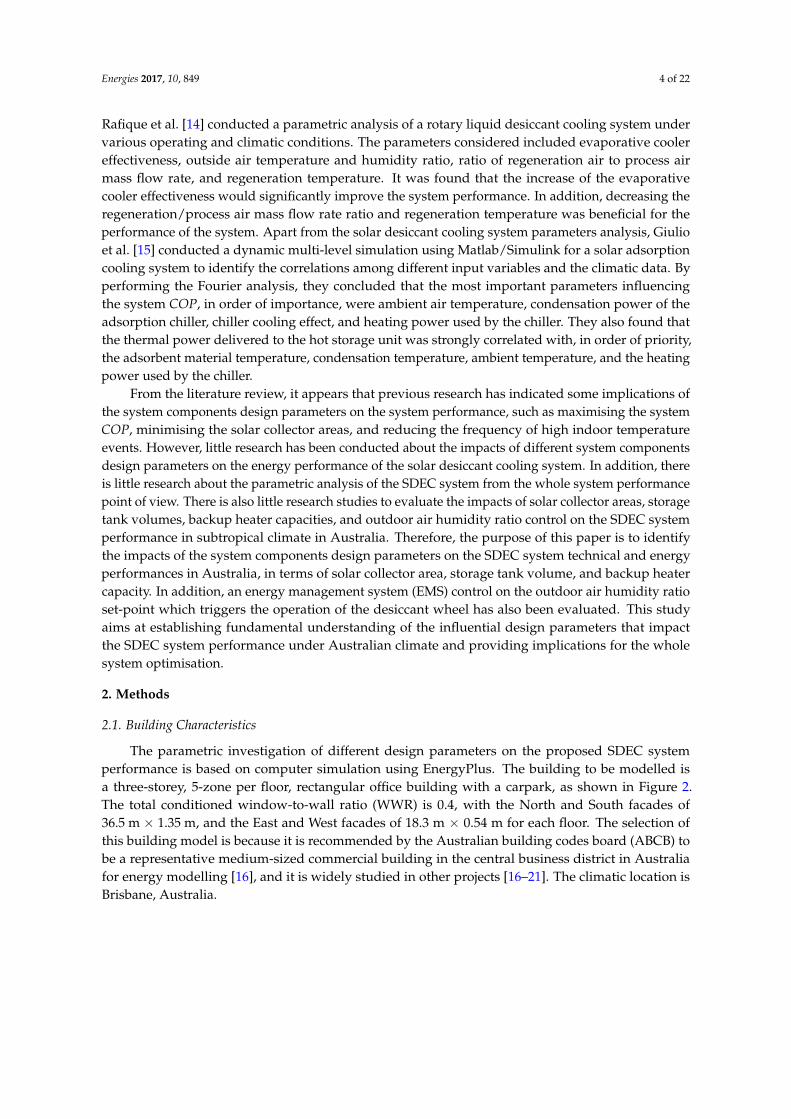
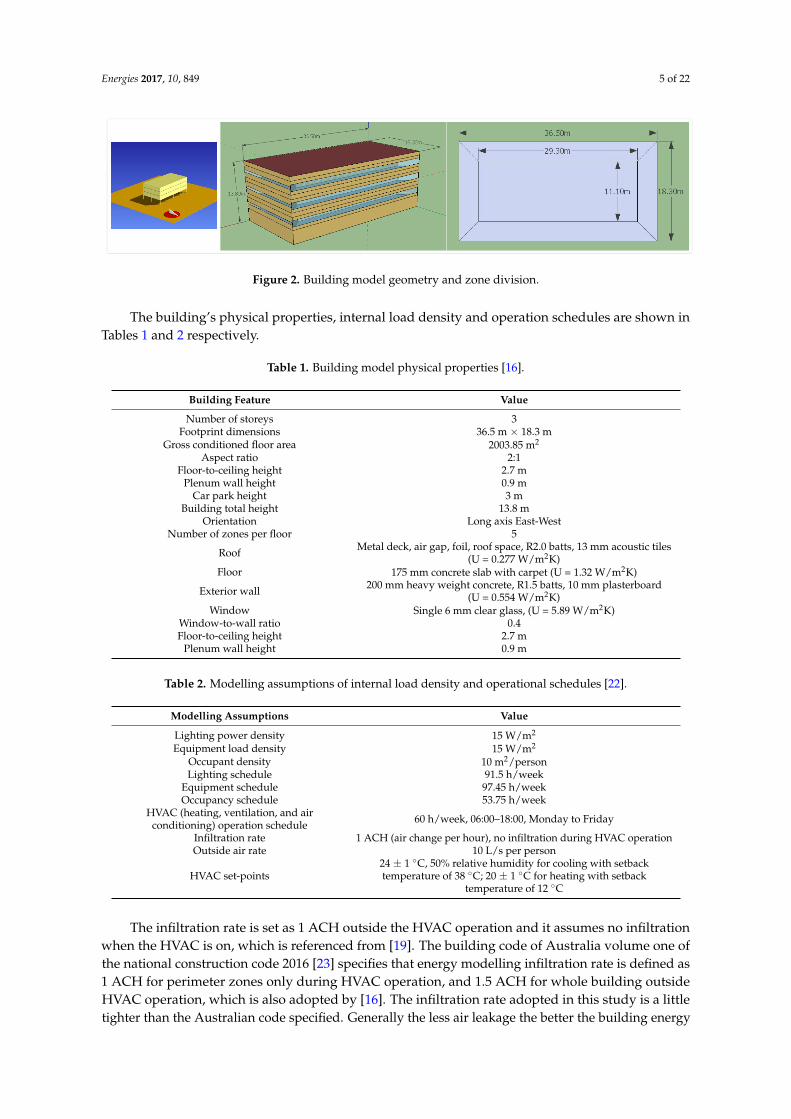
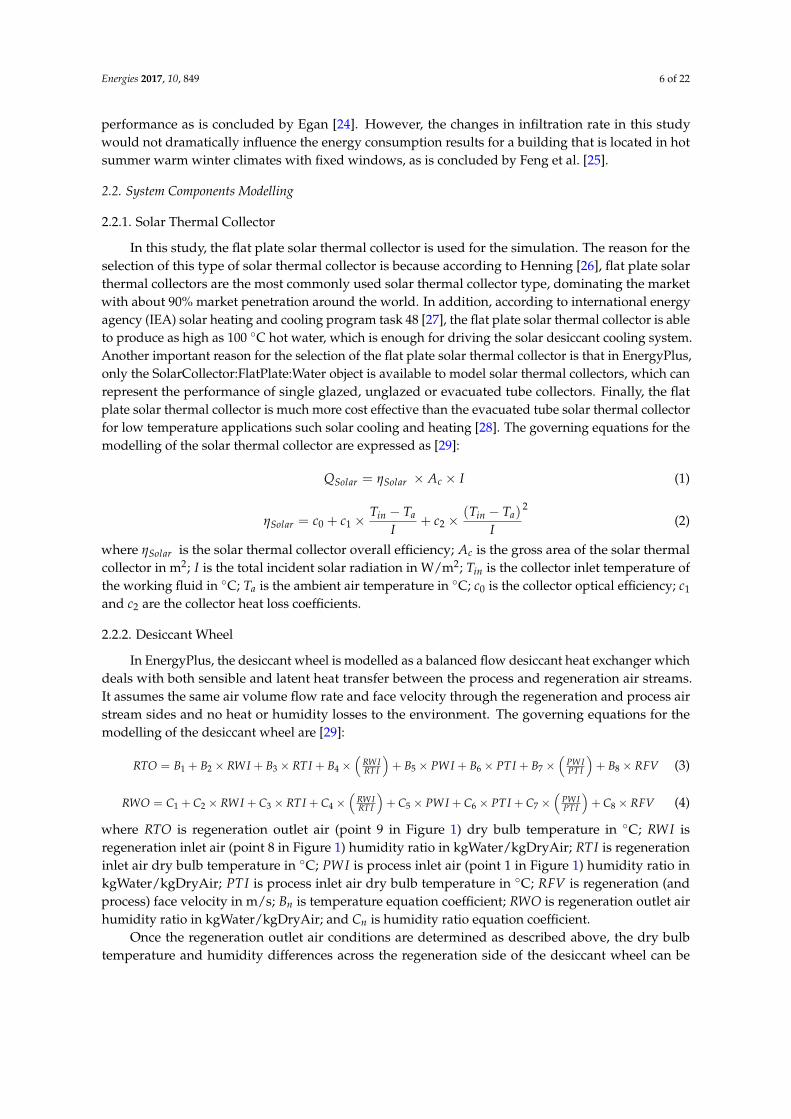
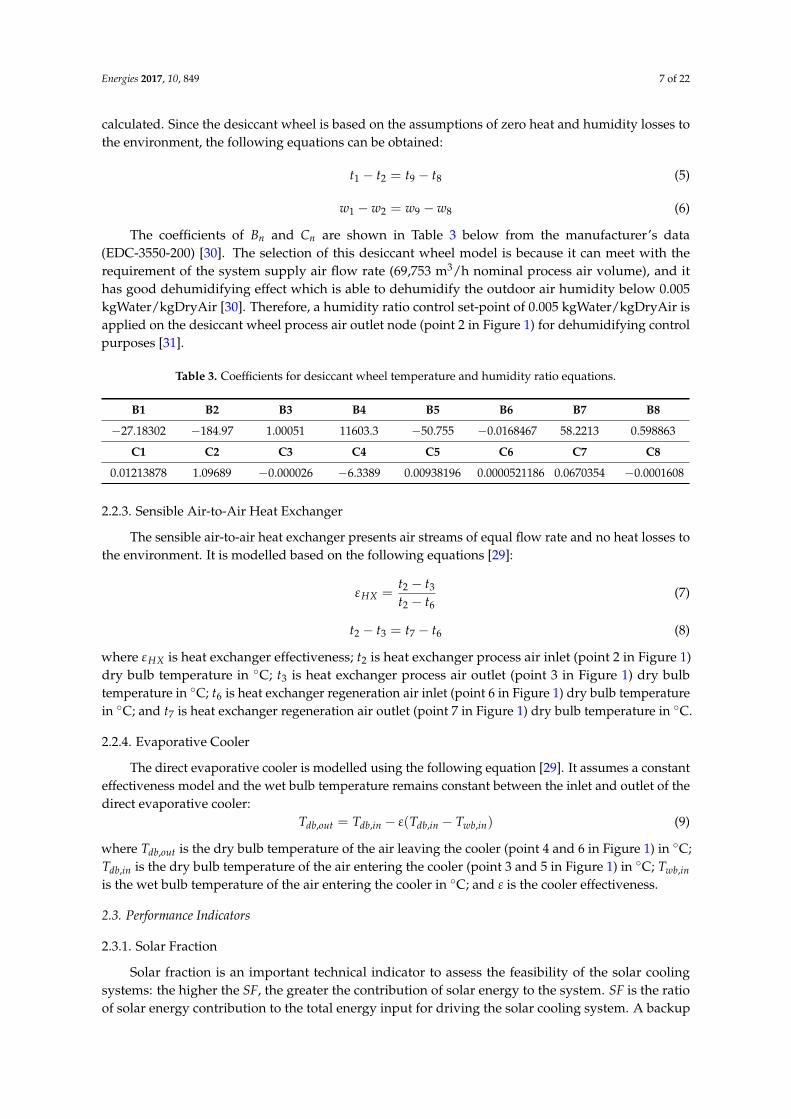
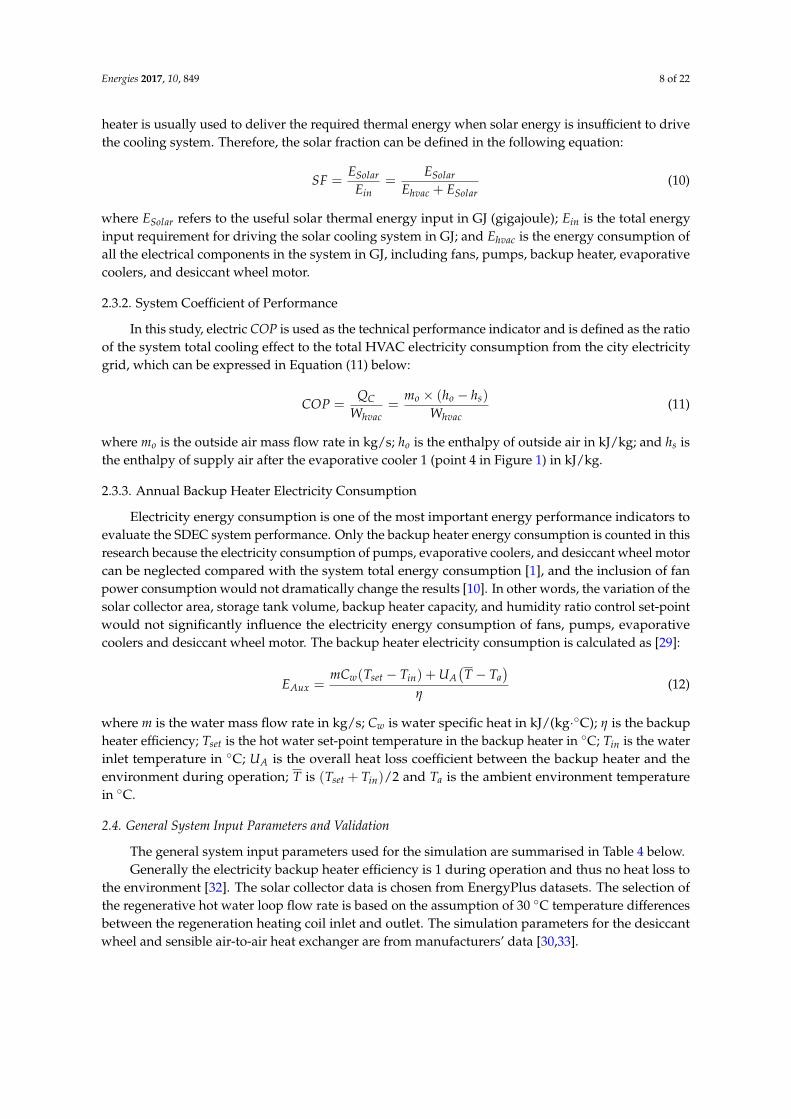
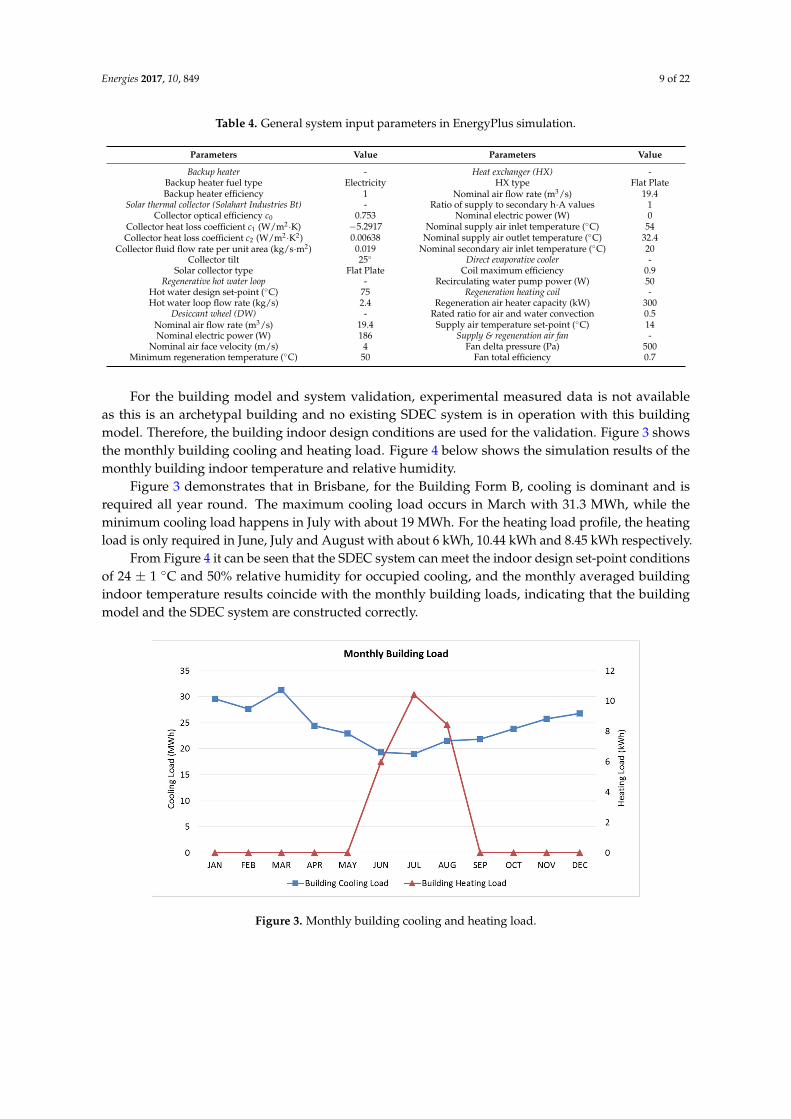
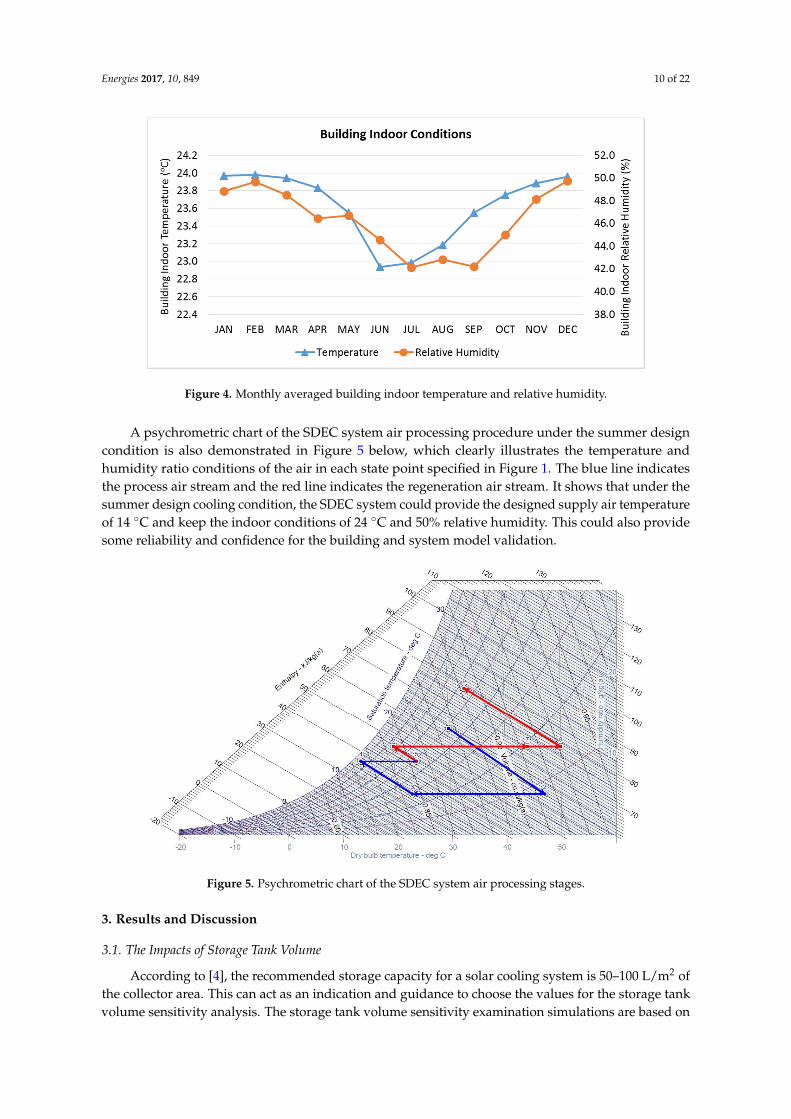
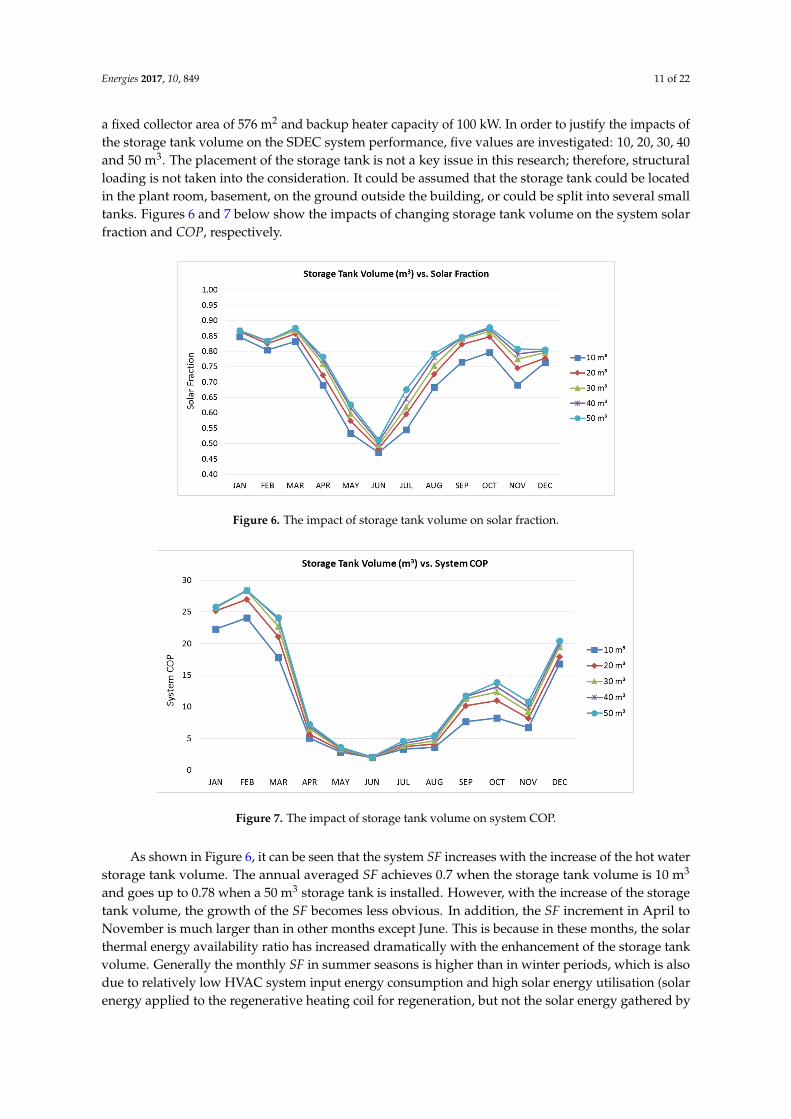
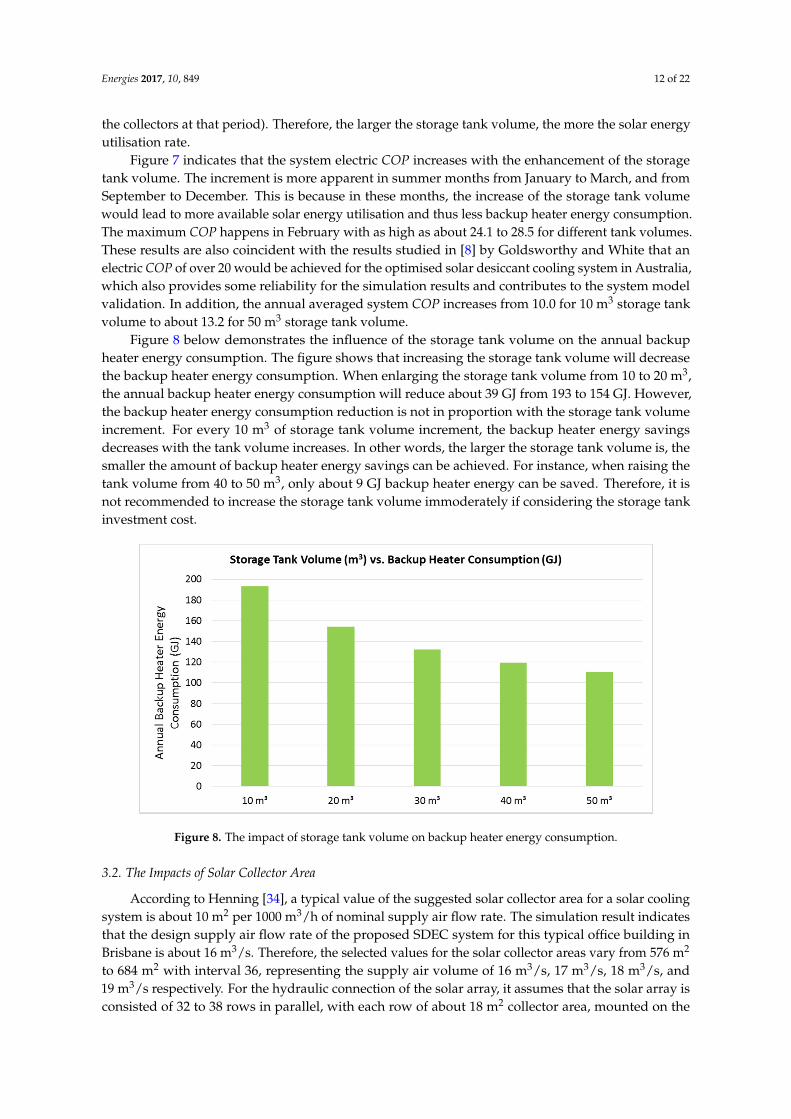
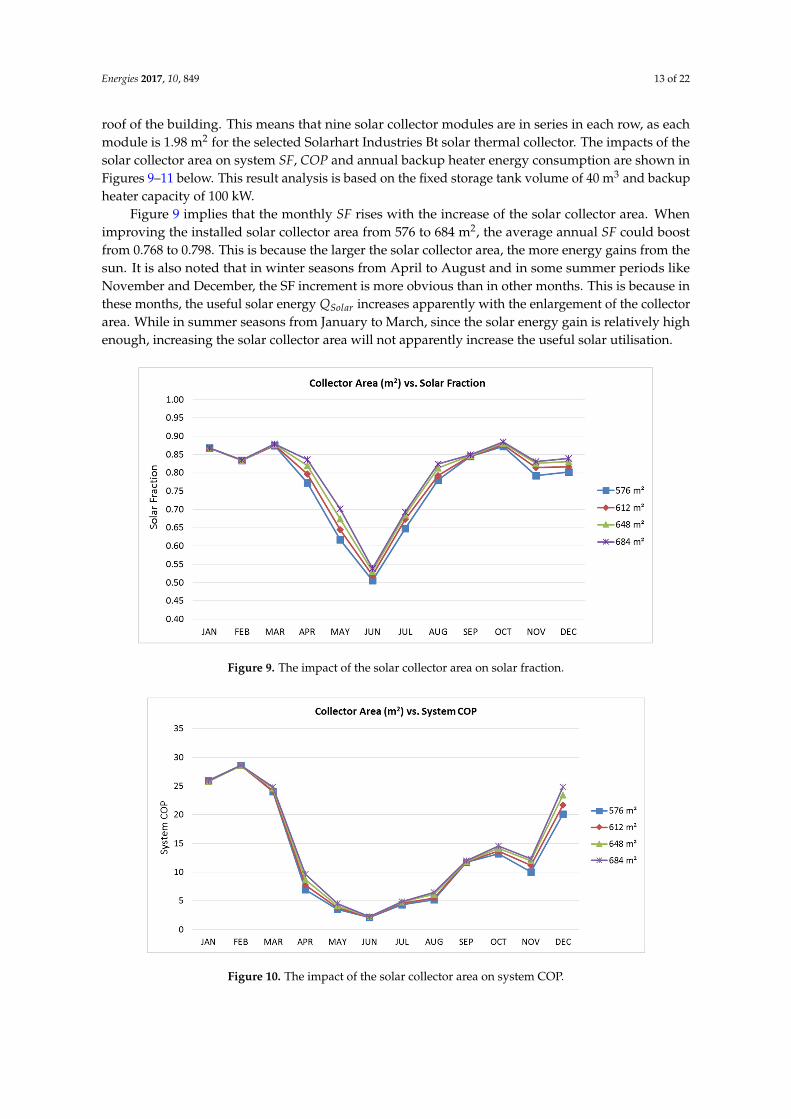
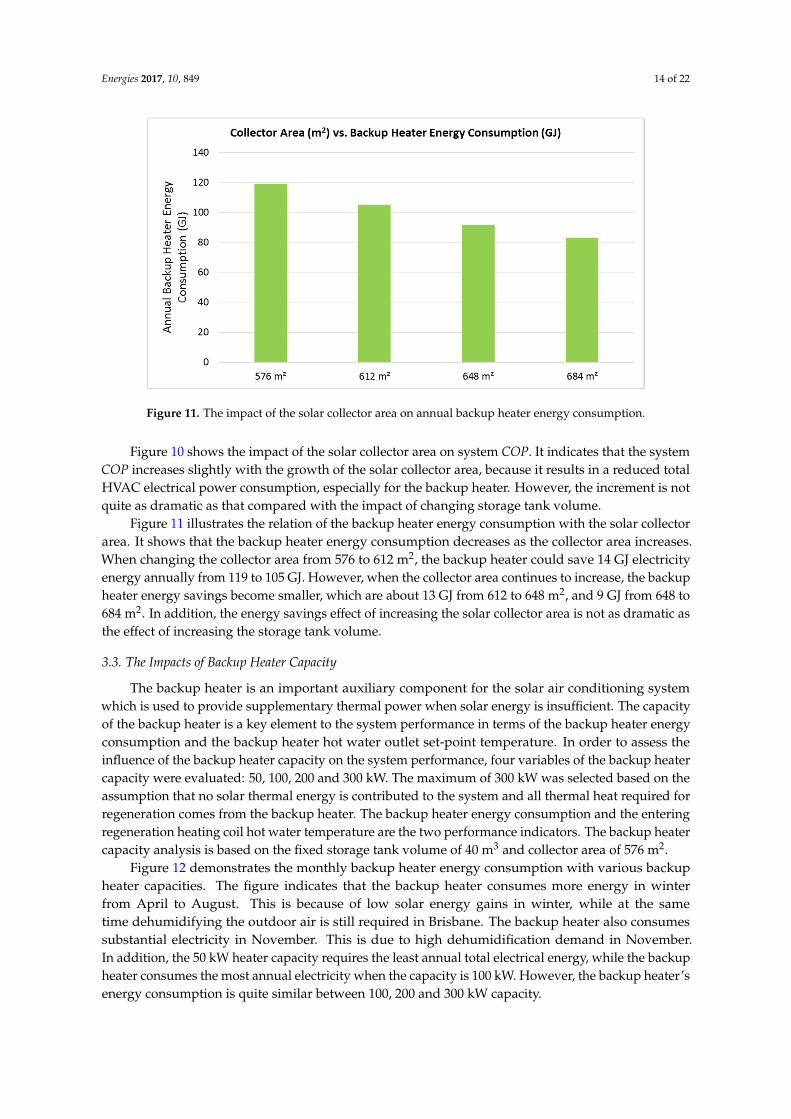
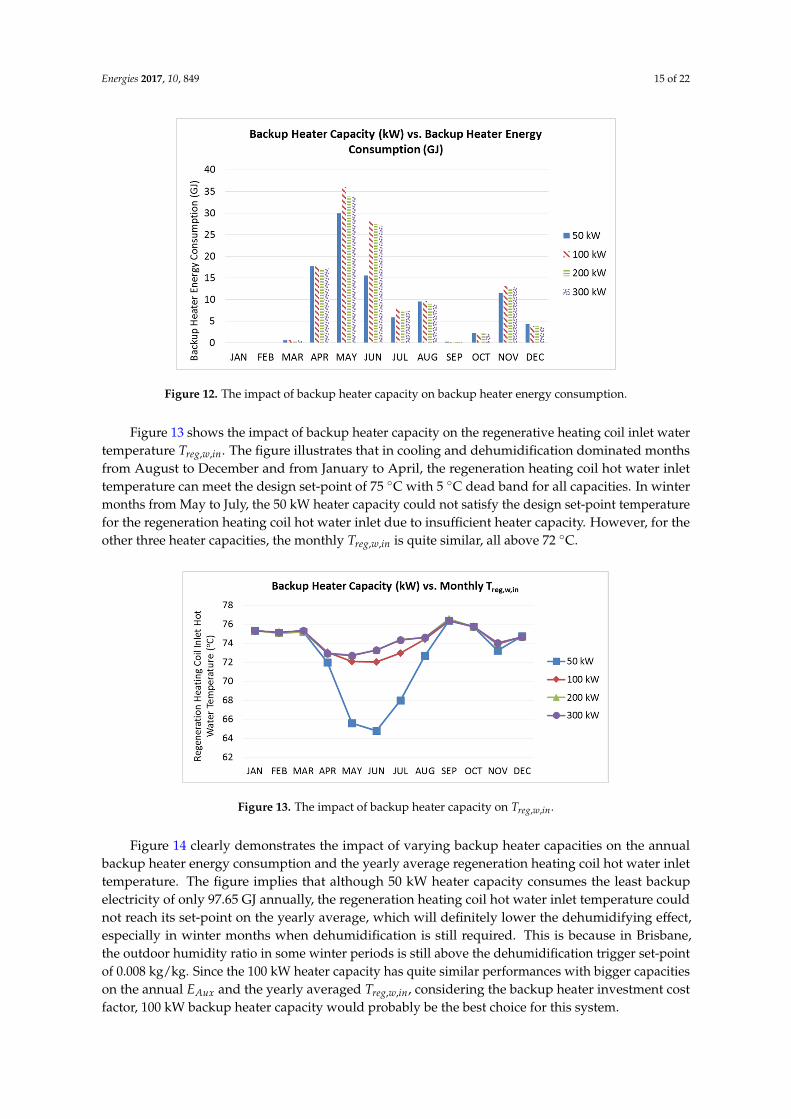
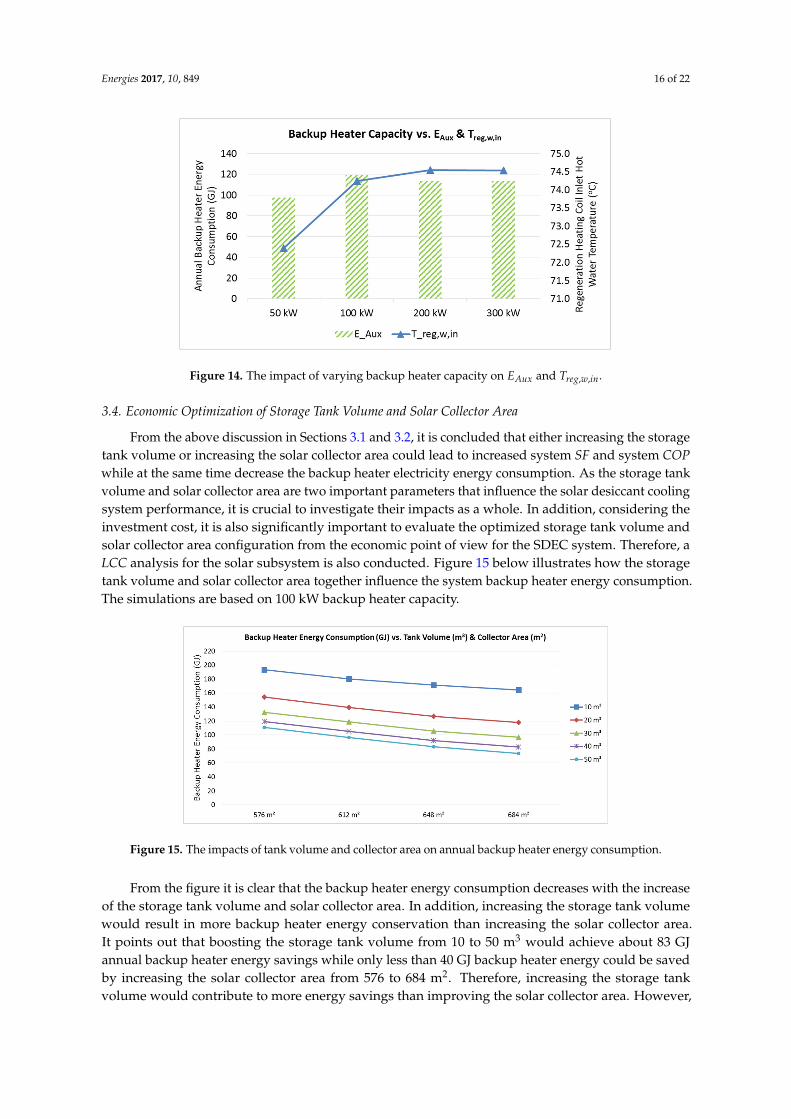
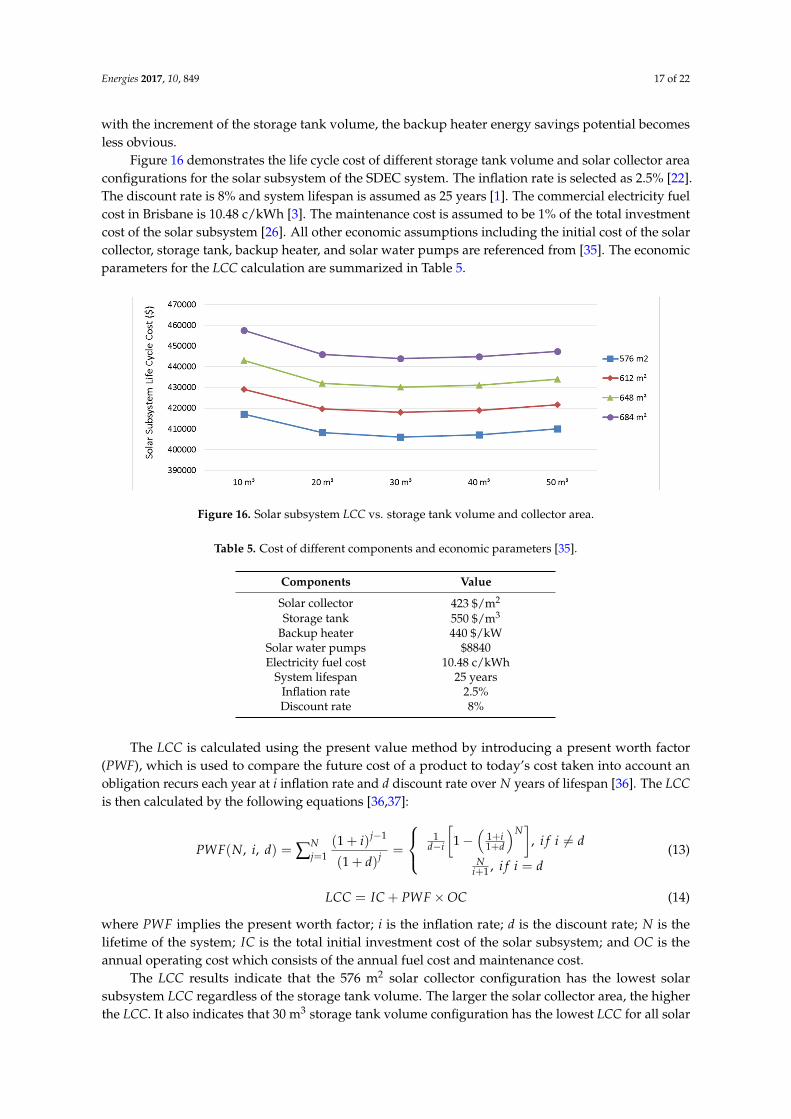
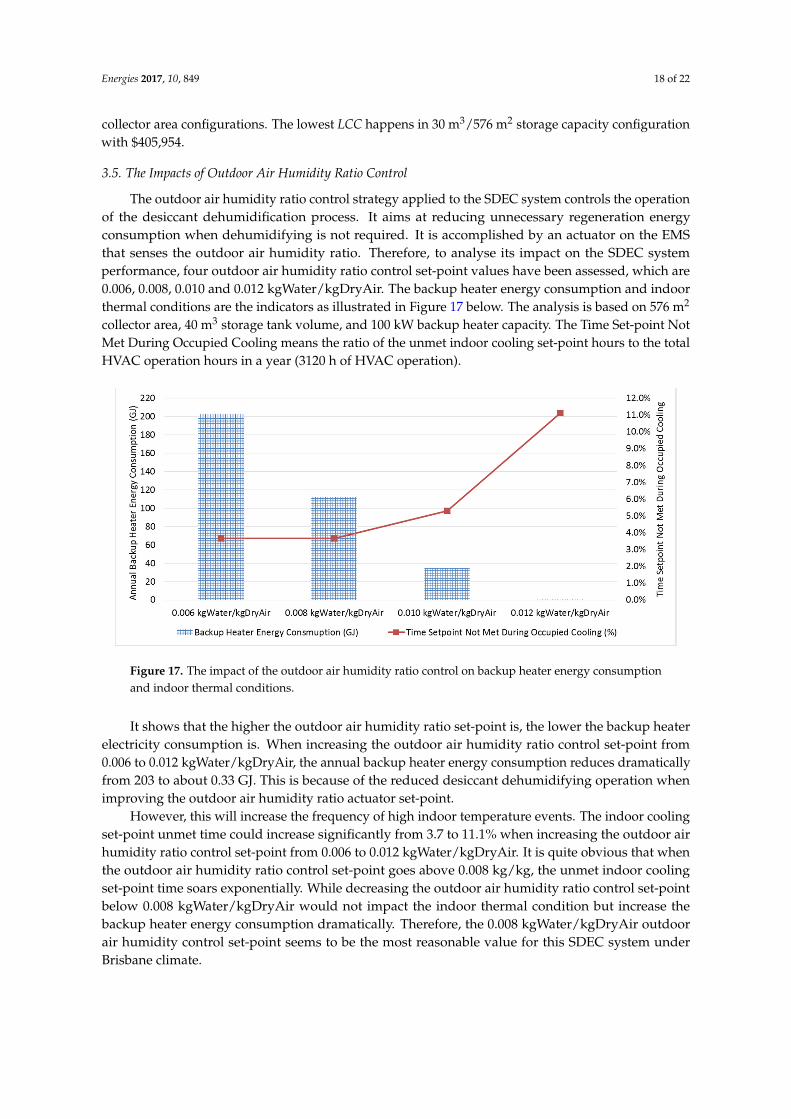


![Parametric reversible data hiding in encrypted images ... · parametric reversible data hiding method in encrypted images (PRDHEI). When parameter ε = 1 (ε∈[1, 255]), PRDHEI is](https://static.documents.pub/doc/80x56/5f38f6212c686b4a6a792e01/parametric-reversible-data-hiding-in-encrypted-images-parametric-reversible.jpg)


