59
Mathematics Stage 5 PAS5.1.2 Coordinate geometry Part 2 Graphing lines

Mathematics Stage 5
PAS5.1.2 Coordinate geometry
Part 2 Graphing lines

All reasonable efforts have been made to obtain copyright permissions. All claims will be settled in goodfaith.
Published byCentre for Learning Innovation (CLI)51 Wentworth RdStrathfield NSW 2135_________________________________________________________________________Copyright of this material is reserved to the Crown in the right of the State of New South Wales.Reproduction or transmittal in whole, or in part, other than in accordance with provisions of the CopyrightAct, is prohibited without the written authority of the Centre for Learning Innovation (CLI).
© State of New South Wales, Department of Education and Training 2005.
AcknowledgmentsThis publication is copyright New South Wales Department of Education and Training (DET), however itmay contain material from other sources which is not owned by DET. We would like to acknowledge thefollowing people and organisations whose material has been used:
Extracts from Mathematics Syllabus Years 7-10 © Board of Studies 2003 Unit overviewpp iii-vPart 1 p.4, 5 Part 2p. 3, Part 3 p. 4.
Photograph Velodrome, courtesy of Cycling Australia. Part 1 p. 3Photograph Mount Hotham Victoria, courtesy of Bob Lees Part 1 p. 4Photograph Casio CFX 9850GB Graphic calculator, courtesy of Casio Computer Co,.LTD
Part 3 p. 37
COMMONWEALTH OF AUSTRALIA
Copyright Regulations 1969
WARNING
This material has been reproduced and communicated to you on behalf of theNew South Wales Department of Education and Training
(Centre for Learning Innovation)pursuant to Part VB of the Copyright Act 1968 (the Act).
The material in this communication may be subject to copyright under the Act.Any further reproduction or communication of this material by you may be the
subject of copyright protection under the Act.
CLI Project Team acknowledgement:
Writer: Janine AngoveIllustrators: Thomas Brown, Tim HutchinsonEditor: Ric MoranteDesktop Publishing: Gayle ReddyVersion Date: November 8, 2004Revision Date: August 25, 2005
Part 2 Graphing lines 1
Contents – Part 2
Introduction – Part 2..........................................................3
Indicators ...................................................................................3
Preliminary quiz.................................................................5
Vertical lines......................................................................9
Gradients of vertical lines..........................................................9
Graphing vertical lines ............................................................11
Horizontal lines................................................................17
Gradients of horizontal lines ...................................................17
Graphing horizontal lines ........................................................18
Intercepts .......................................................................23
Graphing lines .................................................................29
How many points?...................................................................31
Suggested answers – Part 2 ...........................................41
Exercises – Part 2 ...........................................................49
2 PAS5.1.2 Coordinate geometry

Part 2 Graphing lines 3
Introduction – Part 2
Each line on the number plane can be described using an equation.
In this part you will explore these equations and how they relate to
the graph.
Indicators
By the end of part 2, you will have been given the opportunity to work
towards aspects of knowledge and skills including:
• understanding terms such as algebra, substitute, coordinate, horizontal,
vertical, oblique, equation, intercept, linear and intersect
• using coordinates to graph vertical and horizontal lines
• identifying the x-axis as the line y = 0
• identifying the y-axis as the line x = 0
• identifying the x- and y-intercepts of graphs
• constructing tables of values for a variety of linear equations
• graphing a variety of linear equations on the number plane.
By the end of part 2, you will have been given the opportunity to work
mathematically by:
• describing vertical and horizontal lines and their properties
• explaining why the axes have equations.Source: Adapted from outcomes of the Mathematics Years 7–10 syllabus
<www.boardofstudies.nsw.edu.au/writing_briefs/mathematics/mathematics_710_syllabus.pdf > (accessed 04 November 2003).© Board of Studies NSW, 2002.

4 PAS5.1.2 Coordinate geometry

Part 2 Graphing lines 5
Preliminary quiz
Before you start this part, use this preliminary quiz to revise some skills you
will need.
Activity – Preliminary quiz
Try these.
1 Plot these points on the number plane below and label each with its
capital letter.
0
1
2
3
4
5
6
–1
–2
–3
–4
–5
–6
1 2 3 4 5 6–1–2–3–4–5–6 x
y
A (–1, 5)
B (4, –4)
C (0, 0)
D (5, 0)
E (0, –3)
2 If k = 10 find the value of these expressions.
a k + 5 _______________________________________________
___________________________________________________
b 5k _________________________________________________
___________________________________________________
c 8 −k
2 ______________________________________________
___________________________________________________
6 PAS5.1.2 Coordinate geometry
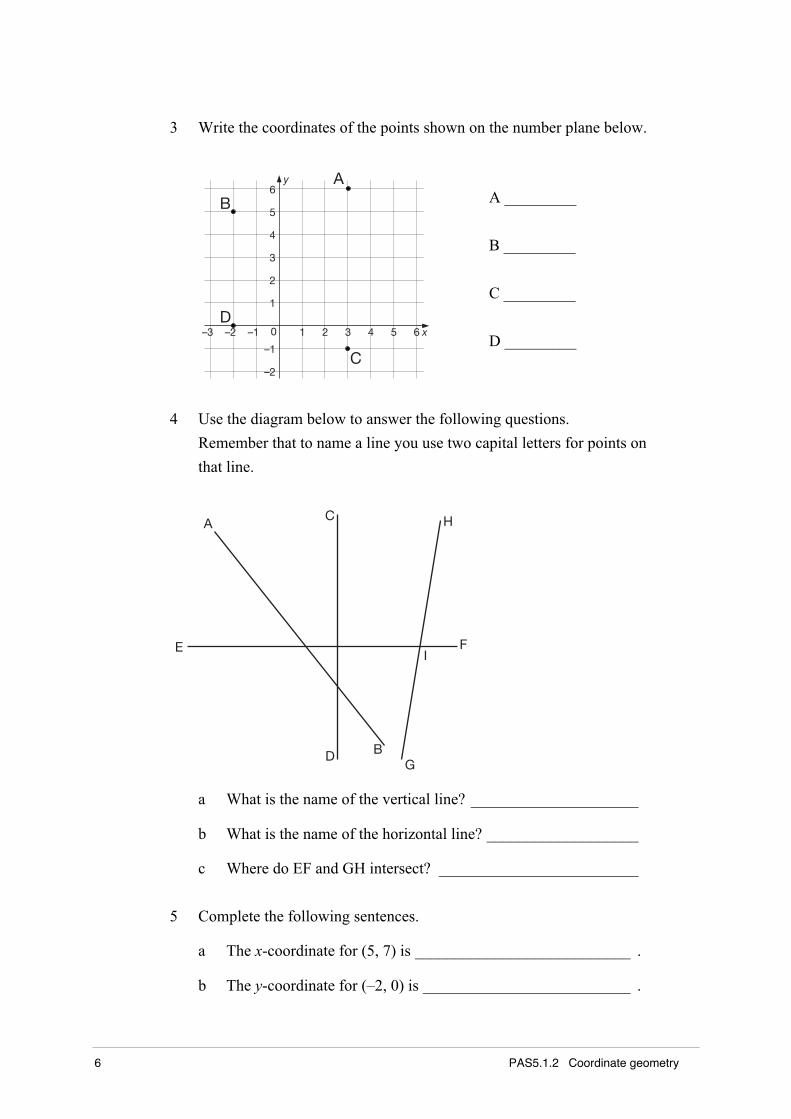
3 Write the coordinates of the points shown on the number plane below.
0
1
2
3
4
5
6
–1
–2
1 2 3 4 5 6–1–2–3
A
B
C
Dx
y
A _________
B _________
C _________
D _________
4 Use the diagram below to answer the following questions.
Remember that to name a line you use two capital letters for points on
that line.
A
B
C
D
E F
G
H
I
a What is the name of the vertical line? _____________________
b What is the name of the horizontal line? ___________________
c Where do EF and GH intersect? _________________________
5 Complete the following sentences.
a The x-coordinate for (5, 7) is ___________________________ .
b The y-coordinate for (–2, 0) is __________________________ .

Part 2 Graphing lines 7
6 Evaluate these number sentences. (Evaluate means find the answer.)
a 6 – –2 ______________________________________________
___________________________________________________
b−4 +10
2 ____________________________________________
___________________________________________________
7 Solve these equations by finding the number that the pronumeral stands
for.
a x + 7 = 9
___________________________________________________
___________________________________________________
b 5y = 30
___________________________________________________
___________________________________________________
c 7 − y = 9
___________________________________________________
___________________________________________________
dx
3= 10
___________________________________________________
___________________________________________________
Check your response by going to the suggested answers section.

8 PAS5.1.2 Coordinate geometry

Part 2 Graphing lines 9
Vertical lines
Lines can be described as either:
• horizontal (straight across)
• vertical (straight up and down)
• oblique (at an angle, not vertical or horizontal).
In this section you will explore aspects of vertical lines. The first feature
that will be discussed about vertical lines is their gradient.
Gradients of vertical lines
On the number plane, oblique lines are said to have a positive gradient
if they go up the graph from left to right, or a negative gradient if they
go down.
0
1
2
3
4
5
6
–1
–2
1 2 3 4 5 6–1–2–3 0
1
2
3
4
5
6
–1
–2
1 2 3 4 5 6–1–2–3
Positive gradients Negative gradients
x
y
x
y
But what about vertical lines?
Work though the following task to explore this question.

10 PAS5.1.2 Coordinate geometry
For this task, you will need a pencil and a ruler.
Use the vertical line shown on the graph below to complete this activity.
0
1
2
3
4
5
–1
1 2 3 4 5 6–1 x
y
Form earlier work you know that gradient = (+ or –)rise
run.
The first thing to consider is whether the slope is positive or negative. Does
the line go up or down the graph as it moves from left to right?
Since the line doesn’t move left to right, the first problem that arises in
finding the gradient of a vertical line is that you cannot decide whether it is
positive or negative.
Ok, put this problem aside for the moment and move on.
Next you need to calculate the number part of the gradient. Use the two
points marked on the vertical line above to find the rise and the run.
rise = __________ run = __________
The rise is easy. You need to move 4 units from one point to the other.
But what is the run? Strictly speaking, the run is zero because you do not
need to move across at all to get from one point to the other.
Therefore, gradient = 4
0
Oops, another big problem! You cannot divide by zero. Even on a
calculator the answer comes up as an error.

Part 2 Graphing lines 11
Summarising what you have found:
• the gradient is neither positive nor negative
• the run is zero so the number for the gradient cannot be calculated.
So the gradient of a vertical line cannot be calculated using the
usual technique.
In fact, vertical lines are said to have an undefined gradient.
This means that you cannot give a number for their gradient.
The next section explores other aspects of vertical lines.
Graphing vertical lines
The points that make up a vertical line have something in common.
Find what that is by completing the following activity.
For this activity you will need a pen and ruler.
Use the diagram below to list the coordinates of all the points marked on the
vertical line.
1
2
3
4
5
6
–1
–2
1 2 3 4 5 6–1–2–3
A
B
C
D
x
y
0
A ____________
B ____________
C ____________
D ____________
What have all the points got in common?
___________________________________________________________
___________________________________________________________

12 PAS5.1.2 Coordinate geometry
You should have found that all the points on a vertical line have the same x-
coordinate of 3. In fact, any vertical line you draw will have the same
property, that is, all the points will share the same x-coordinate.
This means that to describe which vertical line you want to draw, all you
have to do is describe the x-coordinate.
Algebra is a tool in mathematics that is used to write general rules without
using words.
To describe the vertical line in this
diagram using English you can say
‘the line where all the points have
an x-coordinate of 3’.
To describe this line using algebra
you can just write ‘the line x = 3’.0
1
2
3
4
5
6
–1
–2
1 2 3 4 5 6–1–2–3 x
y
This equation, x = 3, is said to be the equation for the line. It is really
saying that the y-coordinate can be anything as long as the x-coordinate is 3.
When you are not talking about number planes and equations for lines,
using x = 3 might mean something very different.
Look at the following example.
Follow through the steps in this example. Do your own working in the
margin if you wish.
a Graph the line x = 1.
b Does the point (4, 1) lie on this line?

Part 2 Graphing lines 13
Solution
a To draw the line you need to recognise the equation as a
vertical line then use a ruler to draw it at the correct place
on the graph.
For this example, the line goes through 1 on the x-axis.
The graph below shows the line.
0
1
2
3
4
5
6
–1
–2
1 2 3 4 5 6–1–2–3 x
y
b The point (4, 1) does not lie on the line. The x-coordinate
(the first one) is not 1.
You can also see this easily if you find the point on the
graph above.
Continue to explore vertical lines by completing the following activity.
Activity – Vertical lines
Try these.
1 How do you know that (15, 9), (15, 0) and (15, –2) all lie on the same
vertical line?
_______________________________________________________
_______________________________________________________
_______________________________________________________

14 PAS5.1.2 Coordinate geometry
2 a Plot these points on the number plane and draw a line to show that
they all lie on the same vertical line.
0
1
2
3
4
5
6
–1
–2
–3
–4
–5
–6
1 2 3 4 5 6–1–2–3–4–5–6 x
y (–1, 6)
(–1, 3)
(–1, 1)
(–1, –2)
(–1, –5)
b Complete the equation for this line. x = __________
3 Write the equation for each of these vertical lines.
a
0
1
2
3
–1
1 2 3 4 5 6–1 x
y
b
0 1 2 3–1–2–3–4–5–6
2
3
–1
–2
–3
–4
1
–7–8–9 x
y

Part 2 Graphing lines 15
4 Graph these vertical lines on the number plane provided.
Write the equation along each line on the graph.
a x = 2
b x = –3
c (Harder) x = 41
2
0
1
2
3
4
5
6
–1
–2
–3
–4
–5
–6
1 2 3 4 5 6–1–2–3–4–5–6 x
y
Check your response by going to the suggested answers section.
You have seen that the points on vertical lines have one thing in common:
they all have the same first coordinate.
You have also seen that you can describe each vertical line using a simple
equation: x = a where a is a number.
But there is one special vertical line that has not been discussed and that is
the y-axis. This line also has an equation to describe it, x = 0. So even the
vertical axis can be described using algebra.
Continue to explore your understanding of vertical lines on the number
plane by completing this exercise.
Go to the exercises section and complete Exercise 2.1 – Vertical lines.

16 PAS5.1.2 Coordinate geometry

Part 2 Graphing lines 17
Horizontal lines
In this section you will explore features of horizontal lines on the
number plane.
Gradients of horizontal lines
What is the gradient of a horizontal line?
Explore this question by completing the following activity.
For this activity you will need a pen.
Use the graph of the horizontal lines below to complete this activity.
0
1
2
3
4
5
–1
1 2 3 4 5 6–1 x
y
Answer these three questions before reading further.
a Is the gradient positive, negative or neither? ___________________
b What is the rise between the two points shown? ________________
c What is the run between the two points shown? _________________

18 PAS5.1.2 Coordinate geometry
Your answers to these questions should have been.
a The gradient is neither positive nor negative (because the horizontal line
does not go up or down the graph)
b The rise is 0 (because you do not move up or down to travel from one
point to another)
c The run is 5.
Using this information, you can determine the gradient of this
horizontal line.
gradient = (+ or −) rise
run
= (+ or −) 0
5= (+ or −) 0
Since zero is neither positive nor negative, the problem of not being able to
decide on the sign of the gradient is solved.
Horizontal lines have a gradient of zero because they are perfectly flat.
And this is true for all horizontal lines.
Graphing horizontal lines
You have already seen that vertical lines can be described using equations
like x = 4 or x = –7. This means that all the points on a vertical line have the
same x coordinate.
In this section you will consider if a similar equation can be written for
horizontal lines.
Part 2 Graphing lines 19
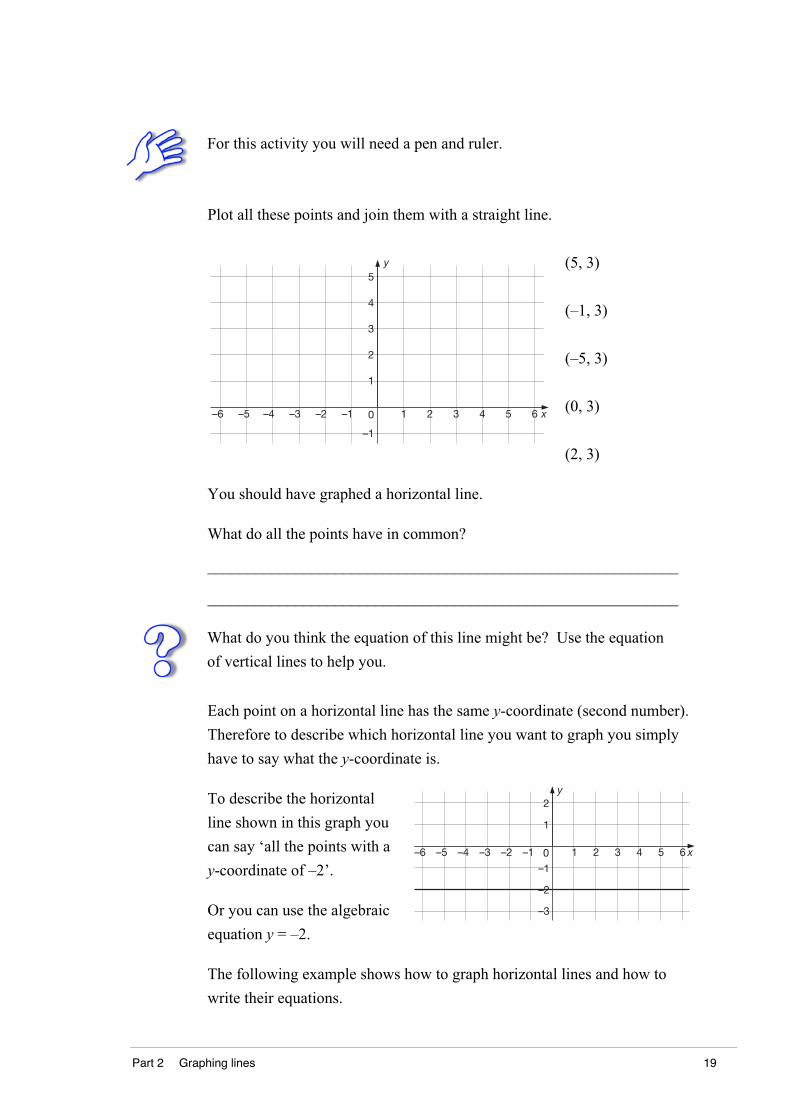
For this activity you will need a pen and ruler.
Plot all these points and join them with a straight line.
0
1
2
3
4
5
–1
1 2 3 4 5 6–1–2–3–4–5–6 x
y (5, 3)
(–1, 3)
(–5, 3)
(0, 3)
(2, 3)
You should have graphed a horizontal line.
What do all the points have in common?
___________________________________________________________
___________________________________________________________
What do you think the equation of this line might be? Use the equation
of vertical lines to help you.
Each point on a horizontal line has the same y-coordinate (second number).
Therefore to describe which horizontal line you want to graph you simply
have to say what the y-coordinate is.
To describe the horizontal
line shown in this graph you
can say ‘all the points with a
y-coordinate of –2’.
Or you can use the algebraic
equation y = –2.
–3
0
1
2
–1
–2
1 2 3 4 5 6–1–2–3–4–5–6 x
y
The following example shows how to graph horizontal lines and how to
write their equations.
20 PAS5.1.2 Coordinate geometry
Follow through the steps in this example. Do your own working in the
margin if you wish.
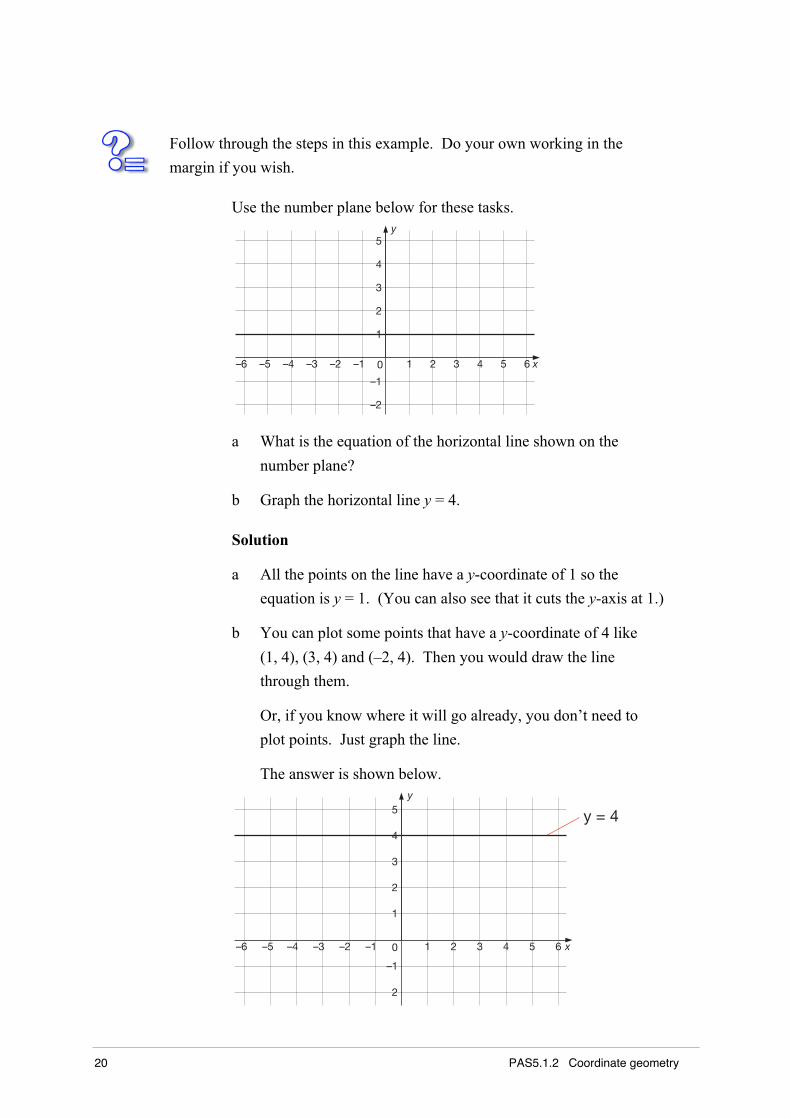
Use the number plane below for these tasks.
0
1
2
3
4
5
–1
–2
1 2 3 4 5 6–1–2–3–4–5–6 x
y
a What is the equation of the horizontal line shown on the
number plane?
b Graph the horizontal line y = 4.
Solution
a All the points on the line have a y-coordinate of 1 so the
equation is y = 1. (You can also see that it cuts the y-axis at 1.)
b You can plot some points that have a y-coordinate of 4 like
(1, 4), (3, 4) and (–2, 4). Then you would draw the line
through them.
Or, if you know where it will go already, you don’t need to
plot points. Just graph the line.
The answer is shown below.
y = 4
2
0
1
2
3
4
5
–1
1 2 3 4 5 6–1–2–3–4–5–6 x
y
Part 2 Graphing lines 21
Practise graphing horizontal lines and finding their equations by completing
this activity.
Activity – Horizontal lines
Try these.
1 Without graphing these points, explain how you know they will all lie
on the same horizontal line.
(5, 6), (–1, 6), (20, 6) and −31
5, 6
⎛⎝⎜
⎞⎠⎟
_______________________________________________________
_______________________________________________________
_______________________________________________________
_______________________________________________________
_______________________________________________________
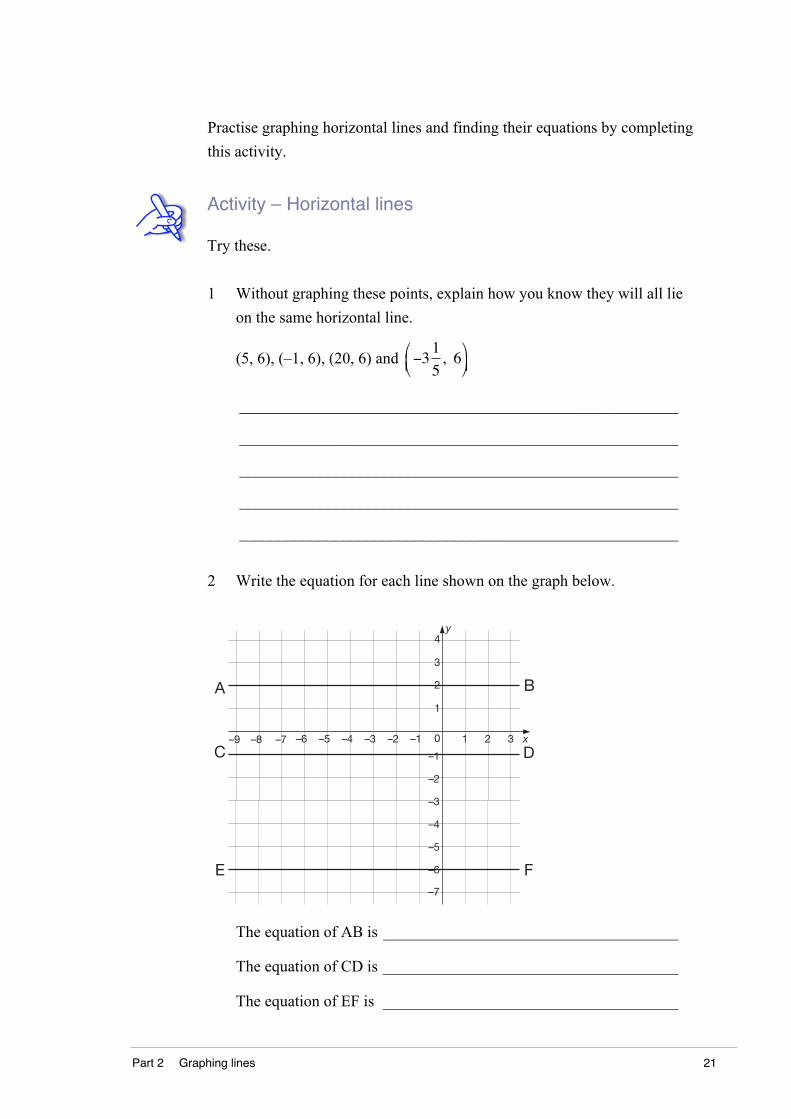
2 Write the equation for each line shown on the graph below.
0 1 2 3–1–2–3–4–5–6
–1
–2
–3
–4
–5
–6
1
–7
–7–8–9
2
3
4
A B
C D
E F
x
y
The equation of AB is _____________________________________
The equation of CD is _____________________________________
The equation of EF is _____________________________________

22 PAS5.1.2 Coordinate geometry
3 The x-axis is a horizontal line so you can describe it using an equation.
What would its equation be? _______________________________
4 Graph and label these lines on the number plane below.
MN is y = 5 and PQ is y = −1
2
0
1
2
3
4
5
–1
–2
1 2 3 4 5 6–1–2–3 x
y
6
Check your response by going to the suggested answers section.
Now you know how to describe horizontal and vertical lines in both English
and using the language of algebra. You have seen the patterns on the graph
and what all the points have in common.
The following website provides you with more practice plotting points and
writing equations for both vertical and horizontal lines.
Access an interactive site dealing with vertical and horizontal lines on the
number plane by visiting the CLI webpage
<http://www.cli.nsw.edu.au/Kto12>. Select Mathematics then Stage 5.2 and
follow the links to resources for this unit Patterns and algebra, PAS5.1.2
Coordinate geometry, Part 2.
Show your understanding of this work by completing the following exercise.
Go to the exercises section and complete Exercise 2.2 – Horizontal lines.

Part 2 Graphing lines 23
Intercepts
In English, the word intercept means ‘to take or seize on the way from one
place to another’, like when you intercept a messenger who is taking a note
to someone else.
In mathematics, the term intercept is used to describe the place where a
curve or line meets the axes. The place where it cuts the x-axis is called the
x-intercept, and not surprisingly the place where it cuts the y-axis is called
the y-intercept.
two x-intercepts
0 1 2 3–1–2–3–4–5–6
2
3
–1
–2
–3
–4
–5
1
–7–8–9
y-intercept
x
y
0 1 2 3–1–2–3–4–5–6
2
3
–1
–2
–3
–4
–5
1
–7–8–9
y-intercept
x-intercept
x
y
Sometimes the intercept cannot be seen on the graph because the number
plane is not drawn large enough. Sometimes curves or lines don’t have both
types of intercepts because they don’t actually meet the axes.
0
1
2
3
–1
–2
1 2 3 4 5 6–1–2–3–4–5–6
The y-intercept does exist butit is off the graph.
0
1
2
3
4
5
6
–1
1 2 3 4–1–2–3
This curve never meets the x-axisso there are no x-intercepts.
x
y
x
y
The following example shows how to describe intercepts on a
number plane.

24 PAS5.1.2 Coordinate geometry
Follow through the steps in this example. Do your own working in the
margin if you wish.
What are the intercepts of the lines shown on the graph below?
0
1
2
3
4
5
6
–1
–2
–3
–4
–5
–6
1 2 3 4 5 6–1–2–3–4–5–6 x
yC
D
B
A
Solution
For the line AB, the x-intercept is –3 and the y-intercept is 4.
You could also write the answer as:
The intercepts for AB are x = –3 and y = 4.
The line CD goes through the origin (0, 0). Therefore it cuts both
axes at the same point. The answer to this question would be:
The x- and y-intercepts are both 0.
You normally talk about points on a number plane by writing their two
coordinates. But with these special intercepts you just have to use one
number for each because you already know they are on an axis.
Intercepts can also be used to describe where a line is.
Look at the following example.
Part 2 Graphing lines 25
Follow through the steps in this example. Do your own working in the
margin if you wish.
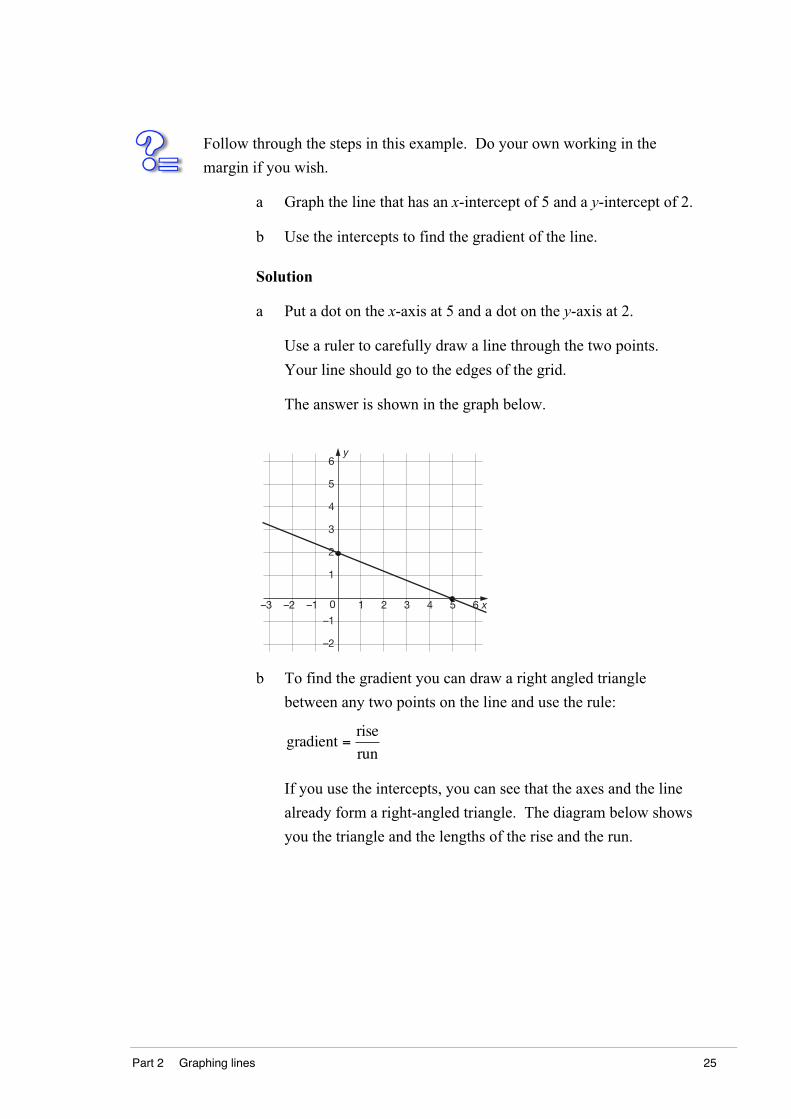
a Graph the line that has an x-intercept of 5 and a y-intercept of 2.
b Use the intercepts to find the gradient of the line.
Solution
a Put a dot on the x-axis at 5 and a dot on the y-axis at 2.
Use a ruler to carefully draw a line through the two points.
Your line should go to the edges of the grid.
The answer is shown in the graph below.
0
1
2
3
4
5
6
–1
–2
1 2 3 4 5 6–1–2–3 x
y
b To find the gradient you can draw a right angled triangle
between any two points on the line and use the rule:
gradient =rise
run
If you use the intercepts, you can see that the axes and the line
already form a right-angled triangle. The diagram below shows
you the triangle and the lengths of the rise and the run.

26 PAS5.1.2 Coordinate geometry
0
1
2
3
4
5
6
–1
–2
1 2 3 4 5 6–1–2–3 x
y
The gradient isnegative becausethe line slopes down.
2
5
gradient = −2
5
Using the intercepts to find the gradient is only useful when the intercepts
are whole numbers.
Now it is your turn to identify and use intercepts.
Activity – Intercepts
Try these.
1 Use the following graph to complete these sentences.
0
1
2
3
4
5
6
–1
–2
–3
–4
–5
–6
1 2 3 4 5 6–1–2–3–4–5–6 x
yC
D
B
A
a The intercepts of AB are x = __________ and y = __________.
b For the line CD, the x-intercept is __________ and the y-intercept
is __________.

Part 2 Graphing lines 27
2 a Graph the line with an x-intercept of –2 and y-intercept of –4.
0
1
2
3
–1
–2
–3
–4
–5
–6
1 2 3 4 5 6–1–2–3–4–5–6 x
y
b (Harder) Use the intercepts to calculate the gradient of your line.
___________________________________________________
___________________________________________________
___________________________________________________
3 (Harder) What type of straight line will not have a y-intercept?
_______________________________________________________
Check your response by going to the suggested answers section.
Continue to practise using intercepts by completing the following exercise.
Go to the exercises section and complete Exercise 2.3 – Intercepts.

28 PAS5.1.2 Coordinate geometry

Part 2 Graphing lines 29
Graphing lines
All lines on the number plane can be described by an algebraic equation.
This equation describes how to find points on the line. It does this by
describing the rule that links the two coordinates (the x and y numbers).
For example, the equation y = 2x says that the y-coordinate is double the
x-coordinate. Some of the points that fit this pattern are (3, 6), (5, 10) and
(–2, –4). If you graphed these three points you would find that you could
draw a straight line through them, as in the diagram below.
0
1
2
3
4
5
6
–1
–2
–3
–4
–5
–6
1 2 3 4 5 6–1–2–3–4–5–6
7
8
9
10
11
x
y
In fact, you can pick any other point on this line, and you would find that
the y-coordinate is double the x-coordinate. Try it!
The easiest way to find a point that fits a pattern is to substitute an x value
into the equation and work out the y value.
30 PAS5.1.2 Coordinate geometry
You can collect your x and y values into a neat table like those below for theequation y = 2x . The table can be horizontal with the x values going
across, or vertical with the x values going down.
x 3 5 –2 x y
y 6 10 –4 3 6
5 10
–2 –4
Both these tables show the three points from the earlier graph: (3, 6), (5, 10)
and (–2, –4).
In this section you will complete tables of coordinates for a variety of
equations, then graph the pattern. All the patterns in this section will form a
straight line when graphed. Patterns or equations that form straight lines
when graphed are called linear.
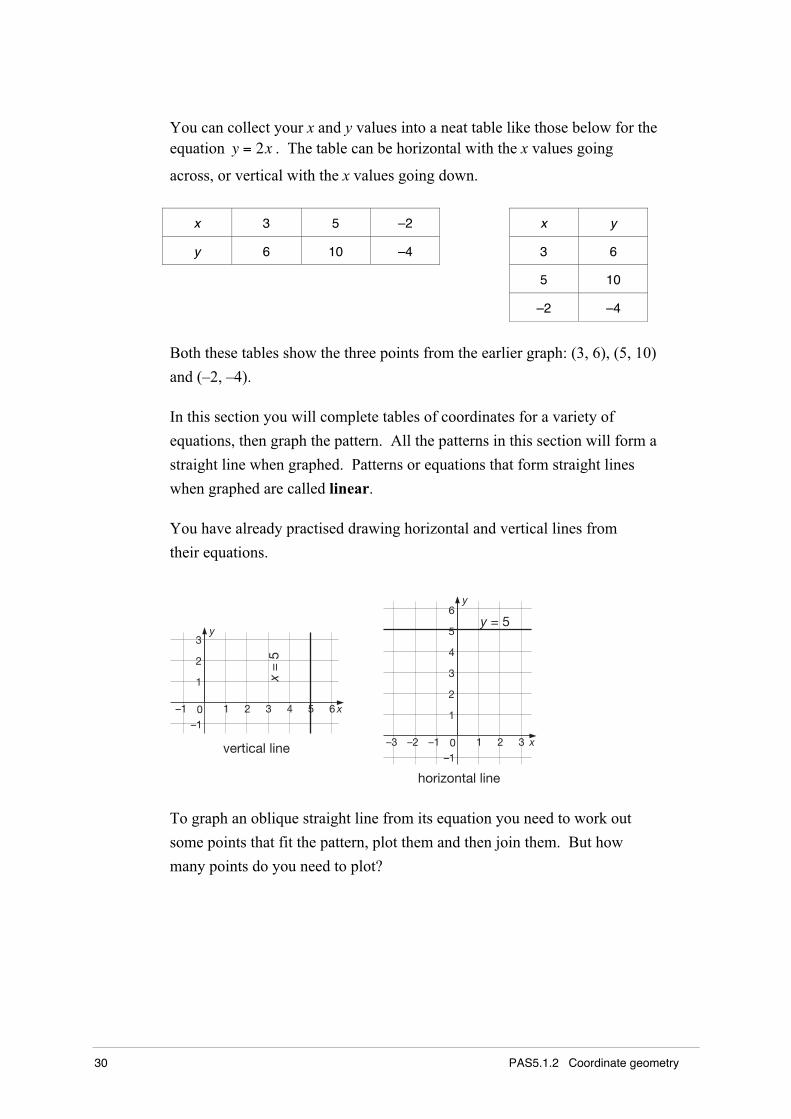
You have already practised drawing horizontal and vertical lines from
their equations.
y = 5
0
1
2
3
4
5
6
–1
1 2 3–1–2–3 x
y
horizontal line
0
1
2
3
–1
1 2 3 4 5 6–1 x
y
x =
5
vertical line
To graph an oblique straight line from its equation you need to work out
some points that fit the pattern, plot them and then join them. But how
many points do you need to plot?

Part 2 Graphing lines 31
How many points?
How many points do you need to plot before you know which line to draw
for an equation?
There are an infinite number of straight lines that you can draw through any
single point so only plotting one point will not be enough.
Once you plot two points, there is only one straight line that can be drawn
through them both. So you really only need to know two points to draw
the line.
However, it is best to plot three points just to make sure you haven’t made a
mistake. If the three points are all in the one line, then you are probably
right. If they are not in a straight line, then you know that you have to check
your working.
Look at this example.
Follow through the steps in this example. Do your own working in the
margin if you wish.
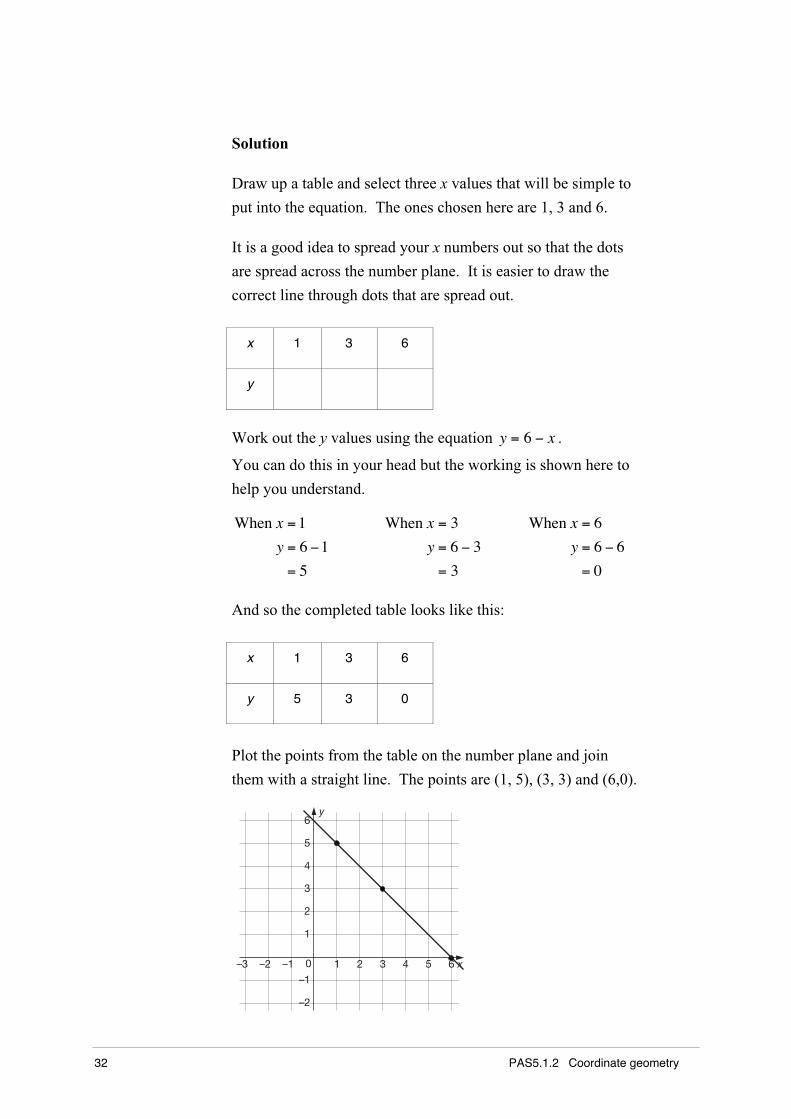
Graph the line y = 6 − x .
32 PAS5.1.2 Coordinate geometry
Solution
Draw up a table and select three x values that will be simple to
put into the equation. The ones chosen here are 1, 3 and 6.
It is a good idea to spread your x numbers out so that the dots
are spread across the number plane. It is easier to draw the
correct line through dots that are spread out.
x 1 3 6
y
Work out the y values using the equation y = 6 − x .
You can do this in your head but the working is shown here to
help you understand.
When x =1
y = 6 −1
= 5
When x = 3
y = 6 − 3
= 3
When x = 6
y = 6 − 6
= 0
And so the completed table looks like this:
x 1 3 6
y 5 3 0
Plot the points from the table on the number plane and join
them with a straight line. The points are (1, 5), (3, 3) and (6,0).
0
1
2
3
4
5
6
–1
–2
1 2 3 4 5 6–1–2–3 x
y

Part 2 Graphing lines 33
You can select other values for x in the example above, but you would still
graph the same line. Try some other values yourself and plot them on the
number plane above.
Now it is your turn to graph a straight line in the following activity.
Activity – Graphing lines
Try these.
1 Complete the table given then graph y =x
2 on the number plane below.
There is space below the graph for your working.
Remember that x
2 means x ÷ 2 .
x 4 0 –2
y
0
1
2
3
4
–1
–2
–3
–4
1 2 3 4 5 6–1–2–3–4–5–6 x
y

34 PAS5.1.2 Coordinate geometry
Check your response by going to the suggested answers section.
Sometimes you have to solve an algebraic equation to find the y value.
You can do this using the guess and check method, or by working
backwards. The following example shows you both methods.
Follow through the steps in this example. Do your own working in the
margin if you wish.
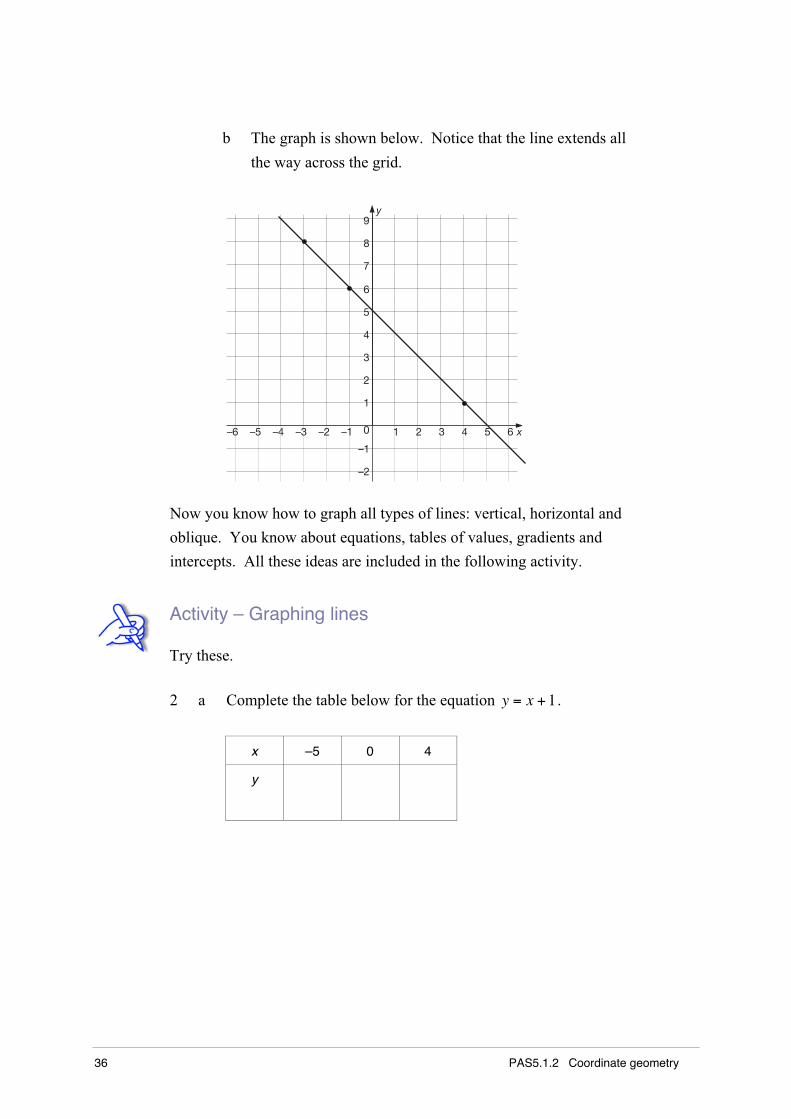
a Complete the following table for the equation x + y = 5.
x 4 –3 –1
y
b Use the table to graph the line x + y = 5.
Solution
When you substitute the x values you get an algebraic equation
that needs to be solved.
You can solve them in your head or you might need to use other
methods. Each student below explains a different way they
solved each one.
When x = 4 the equation is 4 + y = 5.
This says 4 plus what gives 5.
I just knew the answer is y = 1.

Part 2 Graphing lines 35
I put x = –3 into the equation and got
–3 + y = 5.
I guessed y = 2 and checked in my head.
–3 + 2 = –1
That didn’t work. I needed a much biggernumber.
So I tried y = 8.
–3 + 8 = 5
y = 8 worked.
I put x = –1 into the equation and got
–1 + y = 5.
I had no idea what to guess so I decidedto work backwards.
The opposite of –1 is +1 so I added 1 toboth sides of the equal sign.
–1+1 + y = 5 + 1
The answer is y = 6.
The completed table is:
x 4 –3 –1
y 1 8 6
36 PAS5.1.2 Coordinate geometry
b The graph is shown below. Notice that the line extends all
the way across the grid.
0
1
2
3
–1
–2
1 2 3 4 5 6–1–2–3–4–5–6
4
5
6
7
8
9
x
y
Now you know how to graph all types of lines: vertical, horizontal and
oblique. You know about equations, tables of values, gradients and
intercepts. All these ideas are included in the following activity.
Activity – Graphing lines
Try these.
2 a Complete the table below for the equation y = x +1 .
x –5 0 4
y

Part 2 Graphing lines 37
b Graph y = x +1 on the number plane below.
0
1
2
3
4
5
6
–1
–2
–3
–4
–5
–6
1 2 3 4 5 6–1–2–3–4–5–6 x
y
c What are the intercepts of this line?
The x-intercept is __________.
The y-intercept is __________.
d Calculate the gradient of the line y = x +1 by drawing a
right-angled triangle between two of your points.
___________________________________________________
___________________________________________________
___________________________________________________

38 PAS5.1.2 Coordinate geometry
3 a Graph each of these lines on the number plane below.
x = 2
y = –3
y − x = 5
Write the equation along each line to identify it. Space is provided
below the graph for any working needed.
0
1
2
3
4
5
6
–1
–2
–3
–4
–5
–6
1 2 3 4 5 6–1–2–3–4–5–6 x
y
b What is the gradient of the line y = –3 on the graph above?
___________________________________________________

Part 2 Graphing lines 39
c (Harder) Use the intercepts for x + y = 5 to find its gradient?
___________________________________________________
___________________________________________________
___________________________________________________
___________________________________________________
4 (Harder) Colin tried to graph the line x − y = 1 .
0
1
2
3
4
5
6
–1
–2
–3
–4
–5
–6
1 2 3 4 5 6–1–2–3–4–5–6 x
y
Oops!
x
y
a Explain how Colin knew he had made a mistake.
___________________________________________________
___________________________________________________
___________________________________________________
___________________________________________________

40 PAS5.1.2 Coordinate geometry
b Correct the table and then graph the correct line.
0
1
2
3
4
5
6
–1
–2
–3
–4
–5
–6
1 2 3 4 5 6–1–2–3–4–5–6 x
y
x
y
5 2 0
Check your response by going to the suggested answers section.
Combine all your knowledge about graphing straight lines to complete the
following activity.
Go to the exercises section and complete Exercise 4.5 – Graphing lines.

Part 2 Graphing lines 41
Suggested answers – Part 2
Check your responses to the preliminary quiz and activities against these
suggested answers. Your answers should be similar. If your answers are very
different or if you do not understand an answer, contact your teacher.
Activity – Preliminary quiz
1 Compare your points with the ones shown below. Did you remember to
label each point with its capital letter?
0
1
2
3
4
5
6
–1
–2
–3
–4
–5
–6
1 2 3 4 5 6–1–2–3–4–5–6 x
y
E
C D
B
A
2 For each question, you needed to substitute (replace) the pronumeral k
with the number 10 then work out the answer. You can do the working
in your head but the full solution is shown to help you understand.
a k + 5 = 10 + 5
= 15

42 PAS5.1.2 Coordinate geometry
b 5k = 5 ×10
= 50Remember to putthe × sign in.
c 8 −k
2= 8 −
10
2= 8 − 5
= 3
A fraction line meansdivide.
Then order of operationsays do the division first.
3 The coordinates are the numbers that show the position. The first
number tells you how far to go across and the second number tells you
how far to go up or down.
The coordinates are A (3, 6), B (–2, 5), C (3, –1) and D (–2, 0).
4 a CD (vertical means straight up and down)
b EF (horizontal means straight across)
c I (intersect means to cross)
5 a 5 b 0
6 The working is shown to help you to understand.
a 6 − −2 = 6 + 2
= 8
b −4 +10
2=
6
2= 3
7 There are many methods for solving equations. You can just know the
answer, you can guess the answer and check it by putting it into the
equation, or you can work backwards by using opposite operations.
The answers are given below.
a x = 2 b y = 6 c y = –2 d x = 30

Part 2 Graphing lines 43
Activity – Vertical lines
1 You should have written something about the x-coordinates all being
the same number, 15. (You could also plot them on a graph.)
2 a
0
1
2
3
4
5
6
–1
–2
–3
–4
–5
–6
1 2 3 4 5 6–1–2–3–4–5–6 x
y
b x = –1
3 a x = 5 b x = –8
4 The equation of each line is written along it.
0
1
2
3
4
5
6
–1
–2
–3
–4
–5
–6
1 2 3 4 5 6–1–2–3–4–5–6 x
y
x =
–3
x =
2
x =
41 2

44 PAS5.1.2 Coordinate geometry
Activity – Horizontal lines
1 You should have written something about all the points having the same
y-coordinate, 6.
2 AB is y = 2.
CD is y = –1.
EF is y = –6.
3 y = 0 (all the points on the x-axis have a y-coordinate of zero)
4
0
1
2
3
4
5
6
–1
–2
1 2 3 4 5 6–1–2–3 x
y
M N
P Q
Activity – Intercepts
1 a x = 3 and y = –1
b The x-intercept is –2 and the y-intercept is −21
2
2 a
0
1
2
3
–1
–2
–3
–4
–5
–6
1 2 3 4 5 6–1–2–3–4–5–6 x
y

Part 2 Graphing lines 45
b The diagram below shows the right-angled triangle to be used.
0
1
2
3
–1
–2
–3
–4
–5
–6
1 2 3 4 5 6–1–2–3–4–5–6 x
y
2
4
gradient =rise
run
= −4
2= −2
The gradient isnegative becausethe line goes downthe graph.
3 A vertical line, but not the y-axis y = 0.
Activity – Graphing lines
1
x 4 0 –2
y 2 0 –1
Your graph should look like this no matter which points you chose
to use.
0
1
2
3
4
–1
–2
–3
–4
1 2 3 4 5 6–1–2–3–4–5–6 x
y

46 PAS5.1.2 Coordinate geometry
2 a
x –5 0 4
y –4 1 5
b
0
1
2
3
4
5
6
–1
–2
–3
–4
–5
–6
1 2 3 4 5 6–1–2–3–4–5–6 x
y
c The x-intercept is –1.
The y-intercept is 1.
d You could use any two points on the line. The gradient is 1.
3 The answers to parts a are shown on the graph.
y = –3
x =
2y – x
= 5
0
1
2
3
4
5
6
–1
–2
–3
–4
–5
–6
1 2 3 4 5 6–1–2–3–4–5–6 x
y

Part 2 Graphing lines 47
b The gradient is 0. (All horizontal lines have a gradient of zero.)
c The x-intercept is –5 so the run is 5. The y-intercept is 5 so the rise
is also 5. The gradient is positive so:
gradient =5
5= 1
4 a You should have written something about the dots not being in a
straight line.
b The last y value was wrong.
x 5 2 0
y 4 1 –1
0
1
2
3
4
5
6
–1
–2
–3
–4
–5
–6
1 2 3 4 5 6–1–2–3–4–5–6 x
y

48 PAS5.1.2 Coordinate geometry

Part 2 Graphing lines 49
Exercises – Part 2
Exercises 2.1 to 2.4 Name ___________________________
Teacher ___________________________
Exercise 2.1 – Vertical lines
1 Write the equation for each of these vertical lines.
a
0 1 2 3–1–2–3–4–5–6
2
3
–1
–2
–3
–4
1
–7–8–9 x
y
b
0
1
2
3
–1
1 2 3 4 5 6–1 x
y
c (Harder)
0
1
2
3
4
5
6
–1
1 2 3 4–1–2–3 x
y
50 PAS5.1.2 Coordinate geometry
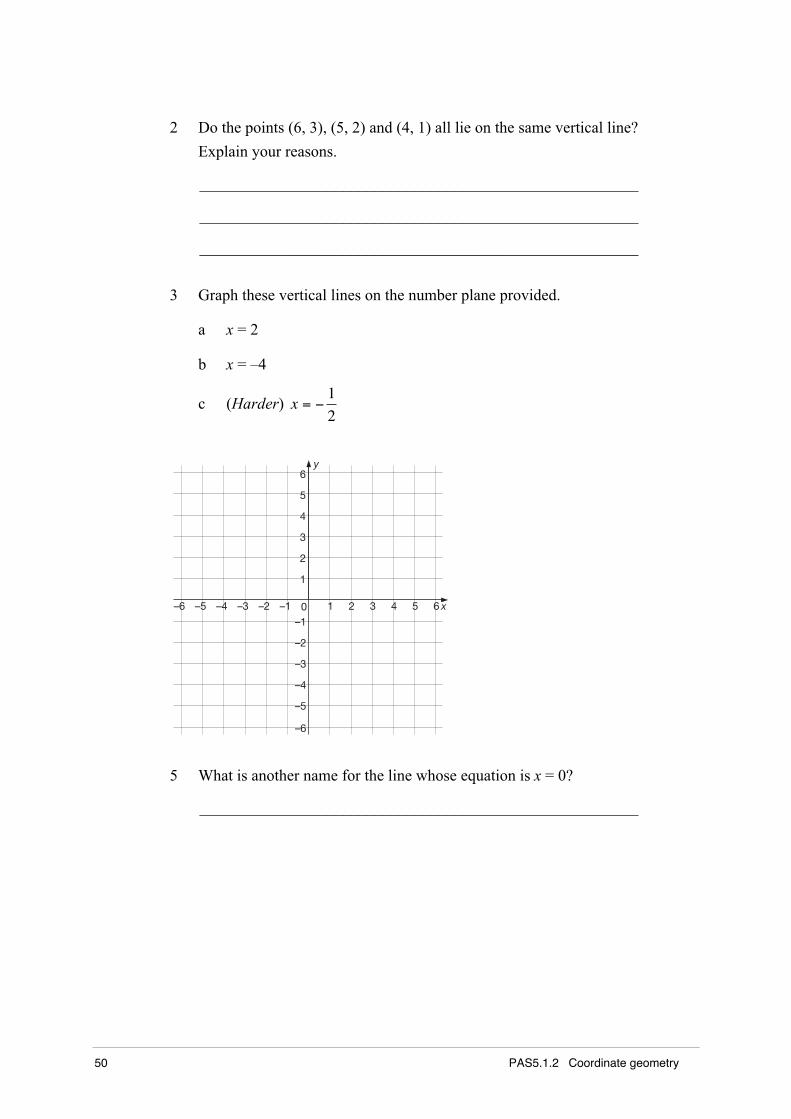
2 Do the points (6, 3), (5, 2) and (4, 1) all lie on the same vertical line?
Explain your reasons.
_______________________________________________________
_______________________________________________________
_______________________________________________________
3 Graph these vertical lines on the number plane provided.
a x = 2
b x = –4
c (Harder) x = −1
2
0
1
2
3
4
5
6
–1
–2
–3
–4
–5
–6
1 2 3 4 5 6–1–2–3–4–5–6 x
y
5 What is another name for the line whose equation is x = 0?
_______________________________________________________

Part 2 Graphing lines 51
Exercise 2.2 – Horizontal lines
1 Write the equation of each line shown on the graph below.
0 1 2 3–1–2–3–4–5–6
2
3
–1
–2
–3
–4
–5
–6
1
–7
–8
–9
–7–8–9
A B
C D
FEx
y
The equation of AB is _____________________________________
(Harder) The equation of CD is ____________________________
(Harder) The equation of EF is _____________________________
2 Graph and label these lines on the number plane below.
JK is x = –3 and LM is x = 21
2
0 1 2 3–1–2–3–4–5–6
2
3
–1
–2
–3
–4
–5
1
–7–8–9 x
y

52 PAS5.1.2 Coordinate geometry
3 (Harder) If you draw a line through the two points (1, 7) and (1, 10)
will the line be horizontal, vertical or oblique (neither horizontal nor
vertical)? Explain your reasons.
_______________________________________________________
_______________________________________________________
_______________________________________________________
_______________________________________________________
_______________________________________________________
_______________________________________________________

Part 2 Graphing lines 53
Exercise 2.3 – Intercepts
1 Use the following graph to complete these sentences.
C
A
B
D
0
1
2
3
4
5
6
–1
–2
–3
1 2 3 4 5 6–1–2–3–4–5–6 x
y
a The intercepts of AB are x = __________ and y = __________.
b For the line CD, the x-intercept is __________ and the y-intercept
is __________.
2 Complete the following sentence.
If a straight line has an x-intercept of 0 then it must have a y-intercept of
__________.

54 PAS5.1.2 Coordinate geometry
3 a Graph the line with an x-intercept of 4 and y-intercept of –5.
0
1
2
3
–1
–2
–3
–4
–5
–6
1 2 3 4 5 6–1–2–3–4–5–6 x
y
b Use the intercepts to calculate the gradient of your line.
___________________________________________________
___________________________________________________
___________________________________________________
4 What type of straight line will not have an x-intercept?
_______________________________________________________

Part 2 Graphing lines 55
Exercise 2.4 – Graphing lines
1 Rachel was asked to graph the line y = x − 2 . Her table of values is
shown below.
x
y
I wonder if theseare right.
a Plot her points and explain why you know she has made a mistake.
0
1
2
3
4
5
6
–1
–2
–3
–4
–5
–6
1 2 3 4 5 6–1–2–3–4–5–6 x
y
___________________________________________________
___________________________________________________
___________________________________________________
b Correct the error in the table. Space is given here for any working.
Plot the correct points and draw the line on the number
plane above.
___________________________________________________
___________________________________________________

56 PAS5.1.2 Coordinate geometry
2 a Complete the table below for the line y =x
3.
Space is provided for working if needed.
x 6 3 –6
y
___________________________________________________
___________________________________________________
___________________________________________________
b Use the table to graph the line on the number plane below.
0
1
2
3
4
5
6
–1
–2
–3
–4
–5
–6
1 2 3 4 5 6–1–2–3–4–5–6 x
y
c Is the line vertical, horizontal or oblique? __________________
d Calculate the gradient by drawing a right-angled triangle between
two points on the line.
___________________________________________________
___________________________________________________
___________________________________________________
e What are the x and y intercepts of the line?
___________________________________________________
___________________________________________________

Part 2 Graphing lines 57
3 a (Harder) Graph the lines x = 4 and x + y = 6 on the number plane
below. Space is provided below the graph for any working and any
tables you may want to draw.
0
1
2
3
4
5
6
–1
–2
–3
8
7
1 2 3 4 5 6–1–2–3–4–5–6 x
y9
b Write the coordinates of the point where these two lines intersect
(cross). _____________________________________________
___________________________________________________


