Part D. Chapter 5: Food Sustainability and Safety Scientific Report of the 2015 Dietary Guidelines Advisory Committee 1 Part D. Chapter 5: Food Sustainability and Safety 1 INTRODUCTION 2 In this chapter, the DGAC addresses food and nutrition issues that will inform public health 3 action and policies to promote the health of the population through sustainable diets and food 4 safety. An important reason for addressing sustainable diets, a new area for the DGAC, is to have 5 alignment and consistency in dietary guidance that promotes both health and sustainability. This 6 also recognizes the significant impact of food and beverages on environmental outcomes, from 7 farm to plate to waste disposal, and, therefore, the need for dietary guidance to include the wider 8 issue of sustainability. Addressing this complex challenge is essential to ensure a healthy food 9 supply will be available for future generations. The availability and acceptability of healthy and 10 sustainable food choices will be necessary to attain food security for the U.S. population over 11 time. Integral to this issue is how dietary guidance and individual food choices influence the 12 nation’s capacity to meet the nutritional needs of the U.S. population. Food sustainability and 13 food safety are also interrelated in generating a secure food supply. This chapter focuses on both 14 sustainable diets and food safety. 15 16 Food Sustainability 17 18 Two definitions are relevant to the material presented in this chapter. These terms were slightly 19 modified from the Food and Agriculture Organization (FAO) definitions to operationalize them 20 for the Committee’s work. 1, 2 21 22 Sustainable diets : Sustainable diets are a pattern of eating that promotes health and well-being 23 and provides food security for the present population while sustaining human and natural 24 resources for future generations. 25 26 Food security : Food security exists when all people now, and in the future, have access to 27 sufficient, safe, and nutritious food to maintain a healthy and active life. 28 29 The topic of current food security was addressed in Chapter 3 and to some extent in Chapter 4, 30 where federal food programs were discussed. The topic of long-term food security was addressed 31 within this chapter through examination of the evidence on sustainable diets. 32 33 The environmental impact of food production is considerable and if natural resources such as 34 land, water and energy are not conserved and managed optimally, they will be strained and 35 potentially lost. The global production of food is responsible for 80 percent of deforestation, 36 more than 70 percent of fresh water use, and up to 30 percent of human-generated greenhouse 37 gas (GHG) emissions. 3 It also is the largest cause of species biodiversity loss. 3 The capacity to 38
Transcript
Part D. Chapter 5: Food Sustainability and Safety
Scientific Report of the 2015 Dietary Guidelines Advisory Committee 1
Part D. Chapter 5: Food Sustainability and Safety 1
INTRODUCTION 2
In this chapter, the DGAC addresses food and nutrition issues that will inform public health 3 action and policies to promote the health of the population through sustainable diets and food 4 safety. An important reason for addressing sustainable diets, a new area for the DGAC, is to have 5 alignment and consistency in dietary guidance that promotes both health and sustainability. This 6 also recognizes the significant impact of food and beverages on environmental outcomes, from 7 farm to plate to waste disposal, and, therefore, the need for dietary guidance to include the wider 8 issue of sustainability. Addressing this complex challenge is essential to ensure a healthy food 9 supply will be available for future generations. The availability and acceptability of healthy and 10 sustainable food choices will be necessary to attain food security for the U.S. population over 11 time. Integral to this issue is how dietary guidance and individual food choices influence the 12 nation’s capacity to meet the nutritional needs of the U.S. population. Food sustainability and 13 food safety are also interrelated in generating a secure food supply. This chapter focuses on both 14 sustainable diets and food safety. 15 16 Food Sustainability 17 18 Two definitions are relevant to the material presented in this chapter. These terms were slightly 19 modified from the Food and Agriculture Organization (FAO) definitions to operationalize them 20 for the Committee’s work.1, 2 21 22 Sustainable diets: Sustainable diets are a pattern of eating that promotes health and well-being 23 and provides food security for the present population while sustaining human and natural 24 resources for future generations. 25 26 Food security: Food security exists when all people now, and in the future, have access to 27 sufficient, safe, and nutritious food to maintain a healthy and active life. 28 29 The topic of current food security was addressed in Chapter 3 and to some extent in Chapter 4, 30 where federal food programs were discussed. The topic of long-term food security was addressed 31 within this chapter through examination of the evidence on sustainable diets. 32 33 The environmental impact of food production is considerable and if natural resources such as 34 land, water and energy are not conserved and managed optimally, they will be strained and 35 potentially lost. The global production of food is responsible for 80 percent of deforestation, 36 more than 70 percent of fresh water use, and up to 30 percent of human-generated greenhouse 37 gas (GHG) emissions.3 It also is the largest cause of species biodiversity loss.3 The capacity to 38
Part D. Chapter 5: Food Sustainability and Safety
Scientific Report of the 2015 Dietary Guidelines Advisory Committee 2
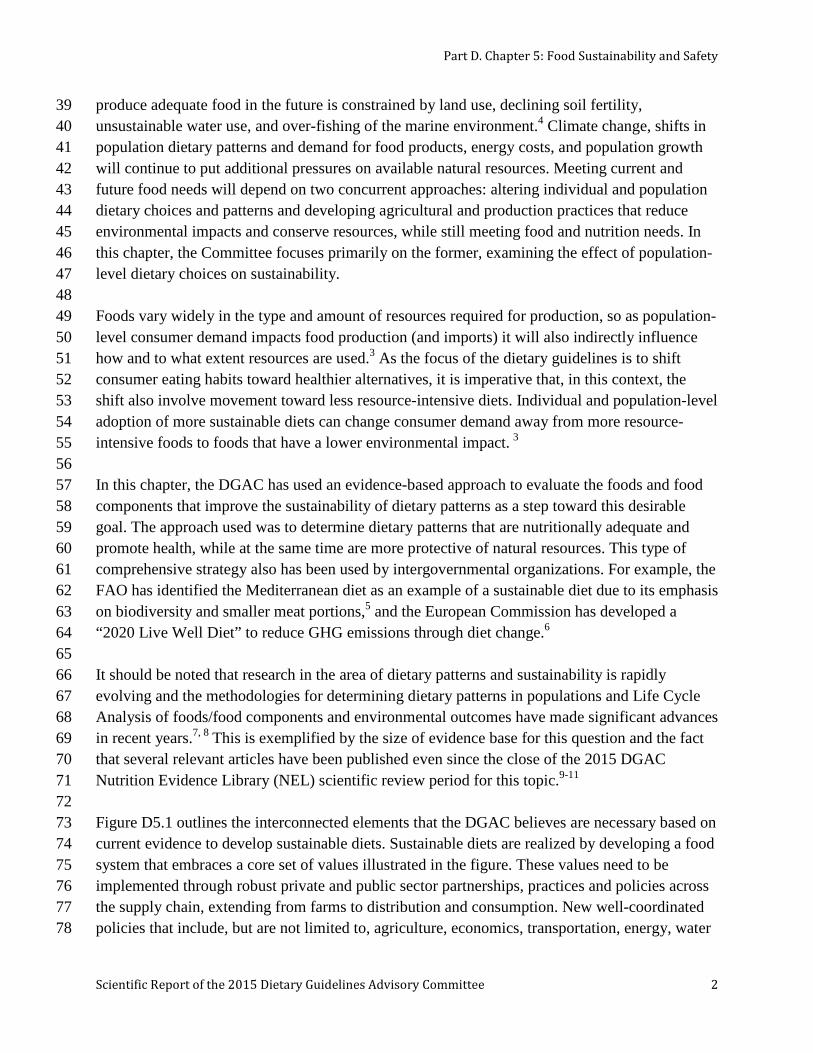
produce adequate food in the future is constrained by land use, declining soil fertility, 39 unsustainable water use, and over-fishing of the marine environment.4 Climate change, shifts in 40 population dietary patterns and demand for food products, energy costs, and population growth 41 will continue to put additional pressures on available natural resources. Meeting current and 42 future food needs will depend on two concurrent approaches: altering individual and population 43 dietary choices and patterns and developing agricultural and production practices that reduce 44 environmental impacts and conserve resources, while still meeting food and nutrition needs. In 45 this chapter, the Committee focuses primarily on the former, examining the effect of population- 46 level dietary choices on sustainability. 47 48 Foods vary widely in the type and amount of resources required for production, so as population-49 level consumer demand impacts food production (and imports) it will also indirectly influence 50 how and to what extent resources are used.3 As the focus of the dietary guidelines is to shift 51 consumer eating habits toward healthier alternatives, it is imperative that, in this context, the 52 shift also involve movement toward less resource-intensive diets. Individual and population-level 53 adoption of more sustainable diets can change consumer demand away from more resource-54 intensive foods to foods that have a lower environmental impact. 3 55 56 In this chapter, the DGAC has used an evidence-based approach to evaluate the foods and food 57 components that improve the sustainability of dietary patterns as a step toward this desirable 58 goal. The approach used was to determine dietary patterns that are nutritionally adequate and 59 promote health, while at the same time are more protective of natural resources. This type of 60 comprehensive strategy also has been used by intergovernmental organizations. For example, the 61 FAO has identified the Mediterranean diet as an example of a sustainable diet due to its emphasis 62 on biodiversity and smaller meat portions,5 and the European Commission has developed a 63 “2020 Live Well Diet” to reduce GHG emissions through diet change.6 64 65 It should be noted that research in the area of dietary patterns and sustainability is rapidly 66 evolving and the methodologies for determining dietary patterns in populations and Life Cycle 67 Analysis of foods/food components and environmental outcomes have made significant advances 68 in recent years.7, 8 This is exemplified by the size of evidence base for this question and the fact 69 that several relevant articles have been published even since the close of the 2015 DGAC 70 Nutrition Evidence Library (NEL) scientific review period for this topic.9-11 71 72 Figure D5.1 outlines the interconnected elements that the DGAC believes are necessary based on 73 current evidence to develop sustainable diets. Sustainable diets are realized by developing a food 74 system that embraces a core set of values illustrated in the figure. These values need to be 75 implemented through robust private and public sector partnerships, practices and policies across 76 the supply chain, extending from farms to distribution and consumption. New well-coordinated 77 policies that include, but are not limited to, agriculture, economics, transportation, energy, water 78
Part D. Chapter 5: Food Sustainability and Safety
Scientific Report of the 2015 Dietary Guidelines Advisory Committee 3
use, and dietary guidance need to be developed. Behaviors of all participants in the food system 79 are central to creating and supporting sustainable diets. 80 81 82 Figure D5.1: Elements needed for sustainable diets 83
84 85 86 87 Although the addition of sustainability topics in the Scientific Report of the 2015 Dietary 88 Guidelines Advisory Committee is new in 2015 it was acknowledged as a topic of strong 89 relevance but not addressed by the 2010 DGAC. It has been a widely discussed aspect of 90 nutrition policy for the past decade in countries such as Germany, Sweden and other Nordic 91 countries, the Netherlands, Australia, and Brazil. For example, in the Netherlands, the Advisory 92 report, Guidelines for a Healthy Diet: The Ecological Perspective focused on guidelines that 93 inform both health and ecological benefits using an evidence-based strategy.12 Nordic countries, 94 such as Sweden, have been researching sustainability and dietary choice since the late 1990s 95 with the most recent edition of the Nordic Nutrition Recommendations (NNR) including an 96 emphasis on the environmental impact of dietary recommendations.13 The German Dietary 97 Guidelines developed a “sustainable shopping basket,” which is a consumer guide for shopping 98 in a more sustainable way.14 Overall, the environmentally sustainable dietary guidance from 99 these countries includes elements identified in this DGAC report as consistent with the extant 100 data: a focus on decreasing meat consumption, choosing seafood from non-threatened stocks, 101
Part D. Chapter 5: Food Sustainability and Safety
Scientific Report of the 2015 Dietary Guidelines Advisory Committee 4
eating more plants and plant-based products, reducing energy intake, and reducing waste. Non-102 governmental and international organizations, such as the United Nations, the FAO, the 103 Sustainable Development Commission in the United Kingdom (UK), the Institute of Medicine 104 (IOM), the Academy of Nutrition and Dietetics, and the National Research Council have all 105 convened working groups and commissioned reports on sustainable diets.2, 15-19 Overall, it is 106 clear that environmental sustainability adds further dimensions to dietary guidance; not just what 107 we eat but where and how food production, processing, and transportation are managed, and 108 waste is decreased. 109 110 The DGAC focused on two main topic areas related to sustainability: dietary patterns and 111 seafood. The identification of dietary patterns that are sustainable is a first step toward driving 112 consumer behavior change and demand and supply-chain changes. Furthermore, dietary patterns 113 were an overall focus area of the 2015 DGAC and allow for a more comprehensive approach to 114 total diet and health. This approach is particularly well suited for assessing overall environmental 115 impacts of food consumption, as all food components of a dietary pattern are identified, and 116 keeping within the context of health outcomes that have been documented for different dietary 117 patterns. The topic area of seafood was chosen because consumption has well-established health 118 benefits and the 2010 DGAC report highlighted the concern for seafood sustainability and called 119 for a better understanding of the environmental impact of aquaculture on seafood contaminants. 120 Meeting these recommendations, however, increases demand for seafood production and this, in 121 turn, poses challenges, as certain seafood species are depleted and marine waters are over fished, 122 while most other species are at the limits of sustainable harvesting. To meet these challenges, as 123 world capture fisheries production has leveled off, aquaculture production has increased to meet 124 demand.20 Therefore, building upon the 2010 DGAC report, the 2015 DGAC addressed the 125 health benefits (nutrients) versus the risks (contaminants) of farm-raised (aquaculture) compared 126 to wild-caught seafood and reviewed the evidence on the worldwide capacity to produce enough 127 seafood to meet dietary guidelines. Overall, promoting sustainable fishing and aquaculture can 128 provide an example for broader ecosystem stewardship.20 129 130 Food Safety 131
Food safety was first introduced in the 2000 Dietary Guidelines for Americans, and the 132 recognition of the importance of food safety continued through the 2010 report. This chapter 133 updates the 2010 DGAC report related to food safety behaviors in the home environment and 134 evaluates new topics of food safety concern with very current and/or updated evidence. The 135 current/updated topics include the safety of beverages, specifically coffee and caffeine, and food 136 additives, specifically aspartame, in the U.S. food supply. 137 138 In 2015, the DGAC addressed new topics of concern. For the first time, the DGAC addressed the 139 safety of coffee/caffeine consumption, as well as the safety of consuming higher doses of 140 caffeine in products such as some energy drinks. The food additive, aspartame, has been the only 141
Part D. Chapter 5: Food Sustainability and Safety
Scientific Report of the 2015 Dietary Guidelines Advisory Committee 5
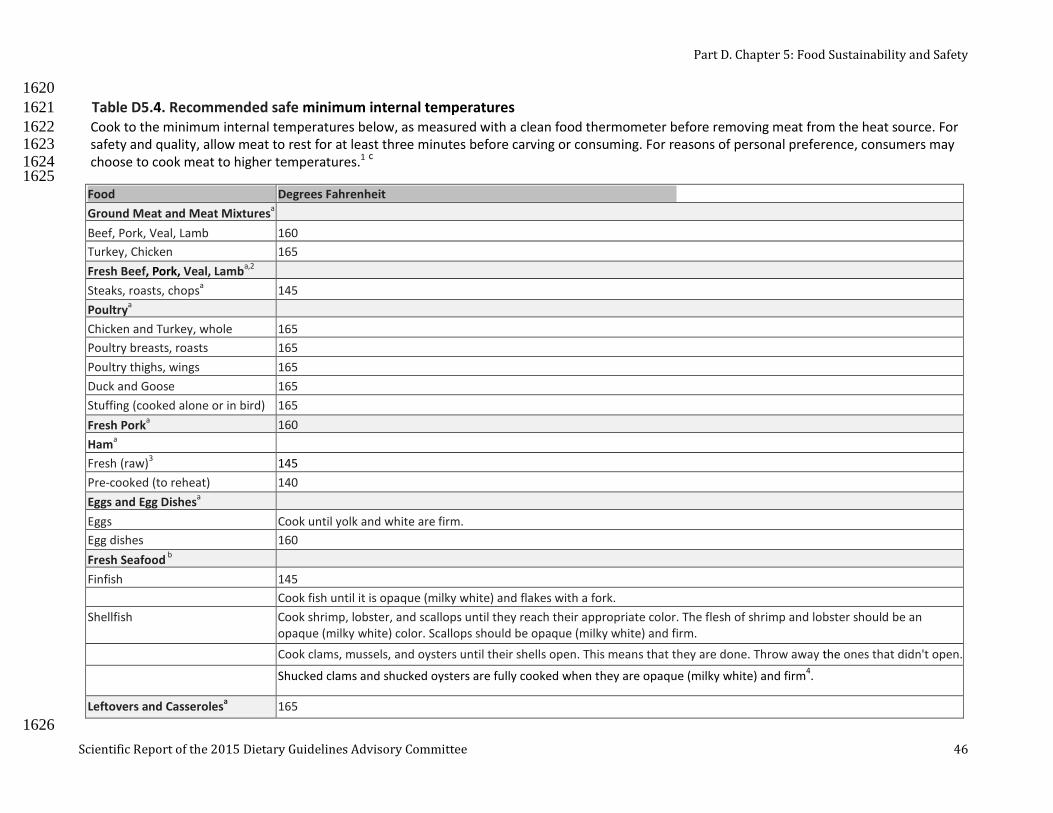
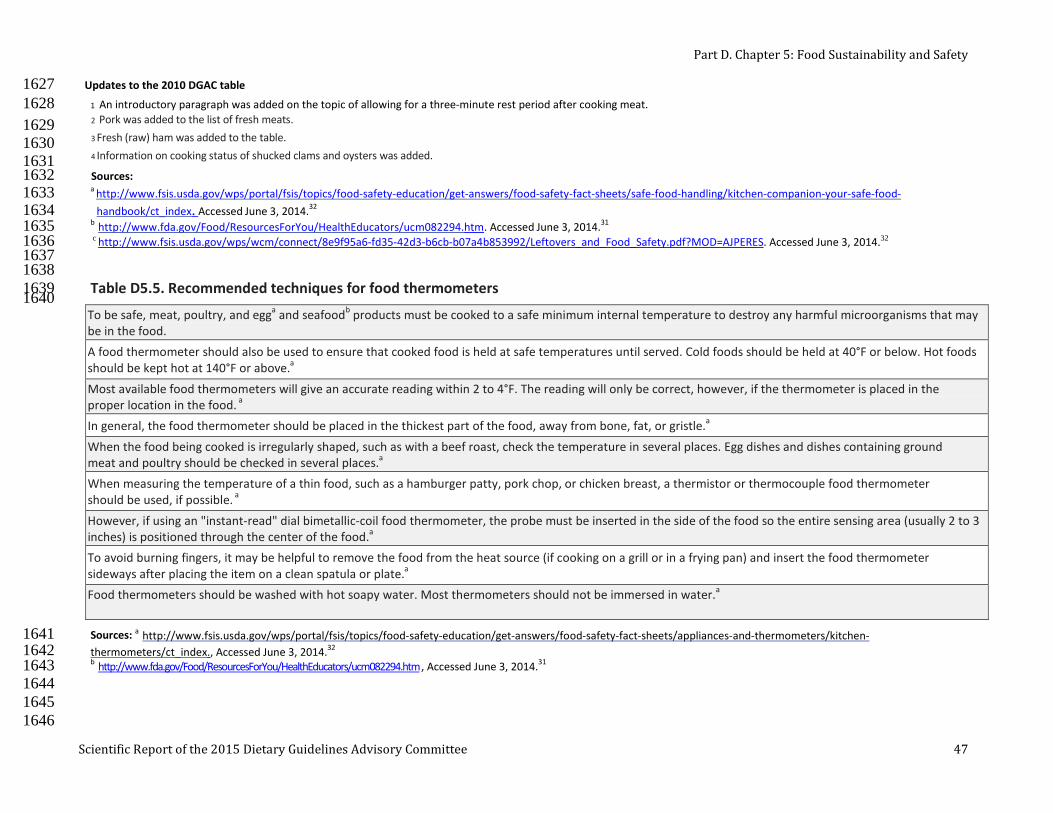
non-nutritive sweetener to be completely re-evaluated in recent years and the results of this 142 reevaluation were deemed important because it includes the most recent science on aspartame 143 and health. These topic areas were chosen for consideration because they are of high public 144 health concern and very recent evidence has been published that significantly updates the 145 knowledge base on health aspects related to caffeine and aspartame in the diet. 146 147 For 2015, the DGAC brought forward the updated food safety principles to reduce risk of 148 foodborne illnesses. These principles—Clean, Separate, Cook and Chill—are cornerstones of the 149 Fight BAC! (www.fightbac.org) educational messages developed by the Partnership for Food 150 Safety Education, a collaboration with the Federal government. These messages are reinforced 151 by other USDA educational materials, including the Be Food Safe (www.befoodsafe.gov) 152 efforts; Is it Done Yet? (www.isitdoneyet.gov); and Thermy (www.fsis.usda.gov/thermy), which 153 outline key elements in thermometer use and placement to ensure proper cooking of meat, 154 poultry, seafood, and egg products. Additional consumer-friendly information on food safety is 155 available at www.foodsafety.gov. The DGAC brought forward the guidance for consumers that 156 has been updated since 2010 on recommended procedures for hand sanitation, washing fresh 157 produce, preventing cross-contamination, and safe meat, poultry, seafood and egg cooking 158 temperatures and thermometer use from the FDA, the Center for Disease Control (CDC) and the 159 Food Safety and Inspection Service (FSIS). The updated food safety tables are located at the end 160 of this chapter. 161 162 163 LIST OF QUESTIONS 164
Sustainable Diets 165
Dietary Patterns 166
1. What is the relationship between population-level dietary patterns and long-term food 167 sustainability? 168
169 Seafood 170
2. What are the comparative nutrient profiles of current farm-raised versus wild caught 171 seafood? 172
3. What are the comparative contaminant levels of current farm-raised versus wild caught 173 seafood? 174
4. What is the worldwide capacity to produce farm-raised versus wild-caught seafood that is 175 nutritious and safe for Americans? 176
177 Food Safety 178
5. What is the relationship between usual coffee/caffeine consumption and health? 179
Scientific Report of the 2015 Dietary Guidelines Advisory Committee 6
6. What is the relationship between high-dose caffeine consumption and health? 180
7. What is the relationship between aspartame consumption and health? 181
8. What consumer behaviors prevent food safety problems? (Topic update from 2010 DGAC) 182
183
METHODOLOGY 184
Sustainable Diets 185
The topic of Question 1 is new for a DGAC review and involves an emerging area of scientific 186 investigation that is not readily addressed by traditional study designs such as randomized 187 controlled trials and prospective cohort studies. The literature related to sustainable diets and 188 dietary patterns involves a combination of food pattern modeling, Life Cycle Assessment (LCA) 189 methodology (examines all processes in the life cycle of each food component - from farm to 190 plate to waste), and determination of the environmental outcomes of the full LCA inventory. 191 Because of the unique nature of these studies, a modified NEL systematic review was conducted 192 for Question 1 on dietary patterns and sustainability. Databases included PubMed, Cochrane, 193 Navigator, and Embase and the search covered from January 2000 to March 2014. For this topic 194 and question, it was necessary to use different methods from those described in an original NEL 195 protocol because not all methods in the protocol could be applied. This is sometimes necessary, 196 according to the Cochrane Collaboration, but requires that methods from the original protocol 197 that could not be implemented in the current review be summarized.21 Due to the nature of the 198 evidence, the NEL 6-step process was tailored for the purposes of this systematic review, with 199 modifications to step 3 – extract data and assess the risk of bias. A description of the NEL 200 systematic review process is provided in Part C: Methodology. A new data extraction grid was 201 developed with emphasis on modeling studies, LCA methodology, and environmental outcomes. 202 The LCA is a standardized methodological framework for assessing the environmental impact 203 (or load) attributable to the life cycle of a food product. The customized grid was then used by 204 NEL abstractors to extract data from the included articles and this informed the evidence 205 synthesis (see Appendix E-2.37 Evidence Portfolio). In addition, NEL abstractors used a 206 different tool to assess individual study quality, not the NEL Bias Assessment Tool (BAT). This 207 alternative tool, the Critical Appraisal Checklist used by the British Medical Journal, was 208 appropriate for studies that used a modeling design. This checklist assesses studies that use 209 modeling to extrapolate progression of clinical outcomes, transform final outcomes from 210 intermediate measures, examine relations between inputs and outputs to apportion resource use, 211 and extrapolate findings from one clinical setting or population to another. To attain a high score, 212 studies must report the variables that have been modeled rather than directly observed; what 213 additional variables have been included or excluded; what statistical relations have been 214 assumed; and what evidence supports these assumptions.22-24 The checklist included key 215 components of the British Medical Journal checklist for economic evaluations, together with the 216
Part D. Chapter 5: Food Sustainability and Safety
Scientific Report of the 2015 Dietary Guidelines Advisory Committee 7
Eddy checklist on mathematical models. This Critical Appraisal Checklist was reviewed and 217 tested for applicability by two sustainability experts who served as consultants to the DGAC. 218 219 Question 2 on nutrient profiles in farm-raised versus wild-caught seafood was addressed using 220 data analysis from the USDA-Agricultural Research Service (ARS) National Nutrient Database 221 for Standard Reference, Release 27 (http://www.ars.usda.gov/ba/bhnrc/ndl).25 The section on 222 finfish and shellfish products included nutrient profiles for both farm-raised and wild-caught 223 seafood for some species. These data were augmented using a USDA-funded report on fatty-acid 224 profiles of commercially available fish∗ in the United States that assessed additional farmed 225 species and compared results with the USDA-ARS NND.26 Because this question was answered 226 using data analysis, it was not graded (as described in Part C: Methodology). For Question 3 on 227 contaminants in farm-raised versus wild-caught seafood, the DGAC used an expert report, the 228 Report of the Joint Food and Agriculture Organization of the United Nations (FAO) and the 229 World Health Organization (WHO) Expert Consultation on the Risks and Benefits of Fish 230 Consumption, 2011.27 This report was chosen as the most updated and comprehensive source of 231 scientific information on the net health assessment of seafood consumption, including a 232 comparison between wild-caught and farm-raised seafood related to contaminants. Data on levels 233 of chemical contaminants (methyl mercury and dioxins) in a large number of seafood species 234 were reviewed, as well as recent scientific literature covering the risks and benefits of seafood 235 consumption. The sections of the report that were used to address the question were “Data on the 236 composition of fish” and “Risk-benefit comparisons.” Lastly, to address Question 4 on the 237 worldwide capacity to produce enough nutritious seafood, the Committee used the FAO’s report 238 on the State of World Fisheries and Aquaculture, 2012.20 This was considered the most current 239 and comprehensive source on this topic, specifically the sections on “Selected Issues in Fisheries 240 and Aquaculture” and the “Organization for Economic Cooperation and Development (OECD)-241 FAO Agricultural Outlook: chapter on fish.” The DGAC focused on matters that directly address 242 world production as it affects the supply of seafood for the U.S. population, particularly as the 243 U.S. relies on significant amounts of imported seafood (~90 percent). 244 245 246 Food Safety 247
For Question 5, the DGAC used an overview of systematic reviews (SRs)/meta-analyses (MA) to 248 address the relationship between usual caffeine/coffee consumption and health. This approach 249 allowed the DGAC to address the broad scope of the evidence on usual caffeine and health, 250 which heretofore had not been addressed by a DGAC. The DGAC used a modification of the 251 method described by the Cochrane Collaboration to conduct the review.28 The steps included 252 development of analytical framework, determination of inclusion/exclusion criteria, description 253 of search strategy and databases used, determination of methodological quality using the 254
∗ The term “fish” in this chapter refers to finfish, which includes aquatic species such as salmon, tuna, and trout.
Scientific Report of the 2015 Dietary Guidelines Advisory Committee 8
Assessment of Multiple Systematic Reviews (AMSTAR) tool, data extraction, summary of 255 results and key findings, and development of conclusion and grade for each outcome, as well as 256 implications of the evidence and research recommendations. Overlap of studies included across 257 the SRs/MA for the same health outcome was determined and recorded; however, SRs/MA were 258 not excluded for overlap. This approach allowed the Committee to assess and consider whether 259 SRs/MA on the same topic independently assessed similar results and arrived at generally similar 260 conclusions. The focus of this review was to summarize the existing SRs/MA on this question, 261 not to re-synthesize the evidence or to conduct a new meta-analysis or meta-synthesis. 262 263 For the overview on usual caffeine/coffee consumption and health, the target population was 264 healthy adults and adults at risk of chronic disease, as well as youth ages 2 years and older. The 265 intervention or exposure was caffeine/coffee consumption. The outcomes were clinical 266 endpoints: 1) chronic diseases, including cardiovascular, type 2 diabetes, and cancer, and total 267 mortality, 2) neurologic and cognitive diseases, including Alzheimer’s and Parkinson’s disease, 268 and 3) pregnancy outcomes, including miscarriage and low birth weight. The included studies 269 were SRs/MA and qualitative SRs; the date range was from 2000 to 2014. Data were extracted 270 for all SRs/MA with emphasis on MA results, including categorical and dose-response MA, 271 fixed or random effects models, heterogeneity and sources of heterogeneity, sub-group analysis, 272 and publication bias (see Appendix E-2.39b Systematic Review/Meta-Analysis Data Table). The 273 methodological quality of the included SRs/MA was determined using AMSTAR. Overlap of 274 studies included across the SRs/MA for the same health outcomes was determined and recorded; 275 however, SRs/MA were not excluded for overlap. Rather, the emphasis was to determine 276 consistency across studies. 277 278 For Question 6 on high-dose caffeine and health, a duplication assessment found two SRs and 279 these were used in lieu of conducting a full NEL SR. The details of duplication assessment are 280 provided in Part C: Methodology, and the Review of the Evidence for this question provide 281 further detail. 282 283 For Question 7 on aspartame and health, the European Food Safety Authority (EFSA) Scientific 284 Opinion on the Re-evaluation of Aspartame as a Food Additive was used. This was conducted by 285 the EFSA Panel of Food Additives and Nutrient Sources Added to Food (ANS).29 The Panel 286 based its evaluation on original study reports and information submitted following public calls 287 for data as well as previous evaluations and additional literature that was available up to 288 February 2013. The 2015 DGAC considered only the human studies and related conclusions 289 from the EFSA report; animal studies and in vitro studies were not considered. 290 Lastly, this chapter provides a topic update from the 2010 DGAC on consumer behaviors and 291 food safety. Tables on this topic were updated to include the most recent recommendations. 292 Federal sources that were used for the update include: 1) Centers for Disease Control and 293 Prevention (CDC) - Hand washing: Clean Hands Save Lives;30 2) Food and Drug Administration 294
Part D. Chapter 5: Food Sustainability and Safety
Scientific Report of the 2015 Dietary Guidelines Advisory Committee 9
(FDA) - Food Facts, Raw Produce: Selecting It and Serving It Safely, 2012; Food Safety for 295 Moms-to-Be: Safe Eats - Meat, Poultry & Seafood;31 and 3) USDA/Food Safety and Inspection 296 Service (FSIS) – Food Safety Fact Sheets.32 297 298
SUSTAINABLE DIETS 299
Evaluating the link between sustainability and dietary guidance will inform policies and practice 300 to ensure food security for present and future generations. The DGAC concentrated its review on 301 the inter-relatedness between human health and food sustainability, with a focus on dietary 302 patterns, a theme of the 2015 DGAC. 303 304 Dietary Patterns and Sustainability 305
Question 1: What is the relationship between population-level dietary patterns 306 and long-term food sustainability? 307
Source of Evidence: Modified NEL systematic review 308
Conclusion 309
Consistent evidence indicates that, in general, a dietary pattern that is higher in plant-based 310 foods, such as vegetables, fruits, whole grains, legumes, nuts, and seeds, and lower in animal-311 based foods is more health promoting and is associated with lesser environmental impact (GHG 312 emissions and energy, land, and water use) than is the current average U.S. diet. A diet that is 313 more environmentally sustainable than the average U.S. diet can be achieved without excluding 314 any food groups. The evidence consists primarily of Life Cycle Assessment (LCA) modeling 315 studies or land-use studies from highly developed countries, including the United States. 316 DGAC Grade: Moderate 317 318 Implications 319
A moderate to strong evidence base supports recommendations that the U.S. population move 320 toward dietary patterns that generally increase consumption of vegetables, fruits, whole grains, 321 legumes, nuts and seeds, while decreasing total calories and some animal-based foods. This can 322 be achieved through a variety of dietary patterns, including the Healthy USDA-style Pattern, the 323 Healthy Vegetarian Pattern, and the Healthy Mediterranean-style Pattern (for more details on the 324 patterns, see Part D. Chapter 1: Food and Nutrient Intakes, and Health: Current Status and 325 Trends). Each of these patterns provides more plant-based foods and lower amounts of meat than 326 are currently consumed by the U.S. population. 327 328
Part D. Chapter 5: Food Sustainability and Safety
Scientific Report of the 2015 Dietary Guidelines Advisory Committee 10
Sustainability considerations provide an additional rationale for following the Dietary Guidelines 329 for Americans and should be incorporated into federal and local nutrition feeding programs when 330 possible. Using sustainability messaging in communication strategies should be encouraged. The 331 application of environmental and sustainability factors to dietary guidelines can be accomplished 332 because of the compatibility and degree of overlap between favorable health and environmental 333 outcomes. 334 335 Much has been done by the private and public sectors to improve environmental policies and 336 practices around production, processing, and distribution within individual food categories. It 337 will be important that both a greater shift toward healthful dietary patterns and an improved 338 environmental profile across food categories are achieved to maximize environmental 339 sustainability now and to ensure greater progress in this direction over time. 340 341 Consumer friendly information that facilitates understanding the environmental impact of 342 different foods should be considered for inclusion in food and menu labeling initiatives. 343 344 Careful consideration will need to be made to ensure that sustainable diets are affordable for the 345 entire U.S. population. 346 347 Promoting healthy diets that also are more environmentally sustainable now will conserve 348 resources for present and future generations, ensuring that the U.S. population has access to a 349 diet that is healthy as well as sustainable and secure in the future. 350 351 352 Review of the Evidence 353
A total of 15 studies met the inclusion criteria for this systematic review.33-48 The body of 354 evidence consisted primarily of dietary pattern modeling studies that assessed related 355 environmental outcomes. These studies were conducted between the years 2003 and 2014 in the 356 U.S., the UK, Germany, the Netherlands, France, Spain, Italy, Australia, Brazil, and New 357 Zealand. Dietary patterns that were examined included vegetarian, lacto-ovo vegetarian, and 358 vegan dietary patterns; the average and dietary guidelines-related dietary patterns of respective 359 countries examined; Mediterranean-style dietary patterns; and sustainable diets. The most 360 frequent comparison diet was the average dietary pattern of the country, although numerous 361 studies made additional comparisons across many of the above dietary patterns. Another 362 approach was to examine diet “scenarios” that modeled different percentage replacements of 363 meat and dairy foods with plant-based foods. The modeling studies used cross-sectional 364 assessment of dietary intake from national nutrition surveys of representative adult populations; 365 for example, the British National Diet and Nutrition Survey (NDNS) from studies in the UK,34, 39 366 the National Nutrition Surveys (NNS) in Germany,40 or the Australian National Nutrition 367 Survey38 were used to determine the observed average dietary patterns. The average dietary 368
Part D. Chapter 5: Food Sustainability and Safety
Scientific Report of the 2015 Dietary Guidelines Advisory Committee 11
patterns were then compared with other modeled dietary patterns, such as vegetarian or 369 Mediterranean- style patterns, as described in detail below. All of the countries were highly 370 developed countries with dietary guidelines and, therefore, generalizable to the U.S. population. 371 The study quality for the body of evidence ranged from scores of 7/12 to 12/12 (indicating the 372 evidence was of high quality) using a modified Critical Appraisal Checklist (see Appendix E-373 2.37 Evidence Portfolio). 374 375 Health outcomes associated with the dietary patterns were most often documented based on 376 adherence to dietary guidelines-related patterns, variations on vegetarian dietary patterns, or 377 Mediterranean-style dietary patterns. Diet quality was assessed in some studies using an a priori 378 index, such as the Healthy Eating Index (HEI) or the WHO Index. In some studies, health 379 outcomes also were modeled. For example Scarborough et al. used the DIETRON model to 380 estimate deaths delayed or averted for each diet pattern.46 One study assessed the synergy 381 between health and sustainability scores using the WHO Index and the LCA sustainability score 382 to assess combined nutritional and ecological value.46 383 384 The environmental impacts that were most commonly modeled were GHG emissions and use of 385 resources such as agricultural land, energy, and water. In many studies, the environmental impact 386 for each food/food category was obtained using the LCA method. The LCA is a standardized 387 methodological framework for assessing the environmental impact (or load) attributable to the 388 life cycle of a food product. The life cycle for a food typically includes agricultural production, 389 processing and packaging, transportation, retail, use, and waste disposal.33, 49-51 An inventory of 390 all stages of the life cycle is determined for each food product and a “weight” or number of 391 points is then attributed to each food or food category, based on environmental impacts such as 392 resource extraction, land use, and relevant emissions. These environmental impact results can be 393 translated into measures of damage done to human health, ecosystem quality, and energy 394 resources using programs such as Eco-Indicator.52 In addition to the health assessment 395 approaches listed above, some studies used LCA analysis with a standardized approach to 396 determine damages from GHG emissions and use of resources; these damage outcome included 397 human health as an environmental damage component, such as the number and duration of 398 diseases and life years lost due to premature death from environmental causes. 399 400 Few studies assessed food security. These studies assessed food security in terms of the cost 401 difference between an average dietary pattern for the country studied and a sustainable dietary 402 pattern for that population.36, 39, 48 The basic food basket concept was used in some studies, 403 representing household costs for a two-adult/two-child household. 404 405
Part D. Chapter 5: Food Sustainability and Safety
Scientific Report of the 2015 Dietary Guidelines Advisory Committee 12
Identified Dietary Patterns and Health and Sustainability Outcomes 406
Vegetarian and Meat-based Diets 407 Several studies examined variations on vegetarian diets, or a spectrum from vegan to omnivorous 408 dietary patterns, and associated environmental outcomes.34, 35, 37, 41 Peters et al. examined 42 409 different dietary patterns and land use in New York, with patterns ranging from low-fat, lacto-410 ovo vegetarian diets to high fat, meat-rich omnivorous diets; across this range, the diets met U.S. 411 dietary guidelines when possible.41 They found that, overall, increasing meat in the diet increased 412 per capita land requirements; however, increasing total dietary fat content of low-meat diets (i.e. 413 vegetarian alternatives) increased the land requirements compared to high-meat diets. In other 414 words, although meat increased land requirements, diets including meat could feed more people 415 than some higher fat vegetarian-style diets. Aston et al. assessed a pattern that was modeled on a 416 feasible UK population in which the proportion of vegetarians in the survey was doubled, and the 417 remainder adopted a diet pattern consistent with the lowest category of red and processed meat 418 (RPM) consumers. They found the combination of low RPM + vegetarian diet had health 419 benefits of lowering the risk of diabetes and colorectal cancer, determined from risk relationships 420 for RPM and CHD, diabetes, and colorectal cancer from published meta-analyses.53-55 421 Furthermore, the expected reduction in GHG for this diet was ~3 percent of current total carbon 422 dioxide (CO2) emissions for agriculture. De Carvalho et al. also examined a high RPM dietary 423 pattern with diet quality assessed using the Brazilian Healthy Eating Index.37 They found that 424 excessive meat intake was associated not only with poorer diet quality but also with increased 425 projected GHG emissions (~ 4 percent total CO2 emitted by agriculture). Taken together, the 426 results on RPM intake indicate that reduced consumption is expected to improve some health 427 outcomes and decrease GHG emissions, as well as land use compared to current RPM 428 consumption. Baroni et al. examined vegan, vegetarian, and omnivorous diets, both organically 429 and conventionally grown, and found that the organically grown vegan diet had the most 430 potential health benefits; whereas, the conventionally grown average Italian diet had the least.37 431 The organically grown vegan diet also had the lowest estimated impact on resources and 432 ecosystem quality, and the average Italian diet had the greatest projected impact. Beef was the 433 single food with the greatest projected impact on the environment; other foods estimated to have 434 high impact included cheese, milk, and seafood. 435 436 Vegetarian diets, dietary guidelines-related diets, and Mediterranean-style diets were variously 437 compared with the average dietary patterns in selected countries.38, 40, 42, 46 Overall, the estimated 438 greater environmental benefits, including reduced projected GHG emissions and land use, 439 resulted from vegan, lacto-ovo vegetarian, and pesco-vegetarian diets, as well as dietary 440 guidelines-related and Mediterranean-style dietary patterns. These diets had higher overall 441 predicted health scores than the average diet patterns. Moreover, for the most part, the high 442 health scores of these dietary patterns were paralleled by high combined estimated sustainability 443 scores. According to van Doreen et al., the synergy measured across vegetarian, Mediterranean-444 style, and dietary guidelines-related scores could be explained by a reduction in consumption of 445
Part D. Chapter 5: Food Sustainability and Safety
Scientific Report of the 2015 Dietary Guidelines Advisory Committee 13
meat, dairy, extras (i.e., snacks and sweets), and beverages, as well as a reduction in overall food 446 consumption.42 447 448 Mediterranean-Style Dietary Patterns 449 The Mediterranean-style dietary pattern was examined in both Mediterranean and non-450 Mediterranean countries.44, 46 In all cases, adherence to a Mediterranean-style dietary pattern—451 compared to usual intake—reduced the environmental footprint, including improved GHG 452 emissions, agricultural land use, and energy and water consumption. Both studies limited either 453 red and processed meat40 or meat and poultry42 to less than 1 serving per week, and increased 454 seafood intake. The authors concluded that adherence to a Mediterranean-style dietary pattern 455 would make a significant contribution to increasing food sustainability, as well as increasing the 456 health benefits that are well-documented for this type of diet (see Part D. Chapter 2: Dietary 457 Patterns, Foods and Nutrients, and Health Outcomes). 458 459 Diet Scenarios 460 Other studies examined different diet “scenarios” that generally replaced animal foods in various 461 ways with plant foods.43, 45, 47 Scarborough et al. found that a diet with 50 percent reduced total 462 meat and dairy replaced by fruit, vegetables, and cereals contributed the most to estimated 463 reduced risk of total mortality and also had the largest potential positive environmental impact.13 464 This diet scenario increased fruit and vegetable consumption by 63 percent and decreased 465 saturated fat and salt consumption; micronutrient intake was generally similar with the exception 466 of a drop in vitamin B12. 467 468 Pradhan et al. examined 16 global dietary patterns that differed by food and energy content, 469 grouped into four categories with per capita intake of low, moderate, high, and very high kcal 470 diets. They assessed the relationship of these patterns to GHG emissions.43 Low-energy diets had 471 less than 2,100 kcal/cap/day and were composed of more than 50 percent cereals or more than 70 472 percent starchy roots, cereals, and pulses. Animal products were minor in this group (<10 473 percent). Moderate, high, and very high energy diets had 2,100-2,400, 2,400-2,800, and greater 474 than 2,800 kcal/cap/day, respectively. Very high calorie diets had high amounts of meat and 475 alcoholic beverages. Overall, very high calorie diets, common in the developed world, exhibited 476 high total per capita CO2eq emissions due to high carbon intensity and high intake of animal 477 products; the low-energy diets, on the other hand, had the lowest total per capita CO2eq emissions. 478 479 Lastly, Vieux et al. examined dietary patterns with different indicators of nutritional quality and 480 found that despite containing large amounts of plant foods, not all diets of the highest nutritional 481 quality were those with the lowest GHG emissions.47 For this study, the diet pattern was assessed 482 by using nutrient-based indicators; high quality diets had energy density below the median, mean 483 adequacy ratio above the median, and a mean excess ratio (percentage of maximum 484 recommended for nutrients that should be limited – saturated fat, sodium, and free sugars) below 485
Part D. Chapter 5: Food Sustainability and Safety
Scientific Report of the 2015 Dietary Guidelines Advisory Committee 14
the median. Four diet patterns were identified based on compliance with these properties to 486 generate one high quality diet, two intermediate quality diets, and one low quality diet. In this 487 study, the high quality diets had higher GHG emissions than did the low quality diets. Regarding 488 the food groups, a higher consumption of starches, sweets and salted snacks, and fats was 489 associated with lower diet-related GHG emissions and an increased intake of fruit and 490 vegetables, was associated with increased diet-related GHG emissions. However, the strongest 491 positive association with GHG emissions was still for the ruminant meat group. Overall, this 492 study used a different approach from the other studies in this review, as nutritional quality 493 determined the formation of dietary pattern categories. 494 495
Sustainable Diets and Costs 496 Three studies examined sustainable diets and related costs.36, 39, 48 Barosh et al. examined food 497 availability and cost of a health and sustainability (H&S) food basket, developed according to the 498 principles of the Australian dietary guidelines as well as environmental impact.36 The food 499 basket approach is a commonly used method for assessing and monitoring food availability and 500 cost. The typical food basket was based on average weekly food purchases of a reference 501 household made up of two adults and two children. For the H&S basket, food choices were based 502 on health principles and environmental impact. The H&S basket was compared to the typical 503 Australian basket and it was determined that the cost of the H&S basket was more than the 504 typical basket in five socioeconomic areas; the most disadvantaged spent 30 percent more for the 505 H&S basket. The authors concluded that the most disadvantaged groups at both neighborhood 506 and household levels experienced the greatest inequality in accessing an affordable H&S basket. 507 Macdiarmid et al. examined a sustainable diet (met all energy and nutrient needs and maximally 508 decreased GHG emissions), a “sustainable with acceptability constraints” diet (added foods 509 commonly consumed in the UK; met energy, nutrient, and seafood recommendations as well as 510 recommended minimum intakes for fruits and vegetables and did not exceed the maximum 511 recommended for red and processed meat), and the average UK diet.7 They found that the 512 sustainable diet that was generated would decrease GHG emissions from primary production (up 513 to distribution) by 90 percent, but consisted of only seven foods. The acceptability constraints 514 diet included 52 foods and was projected to reduce GHG emissions by 36 percent. This diet 515 included meat and dairy but less than the average UK diet. The cost of the sustainable + 516 acceptability diet was comparable to that of the average UK diet. These results showed that a 517 sustainable diet that meets dietary requirements and has lower GHG can be achieved without 518 eliminating meat or dairy products completely, or increasing the cost to the consumer. Lastly, 519 Wilson et al. examined 16 dietary patterns modeled to determine which patterns would minimize 520 estimated risk of chronic disease, cost, and GHG emissions.48 These patterns included low-cost 521 and low-cost + low GHG diet patterns, as well as healthy patterns with high vegetable intakes 522 including Mediterranean or Asian patterns, as well as the average New Zealand pattern. The 523 authors found that diets that aimed to minimize cost and estimated GHG emissions also had 524 health advantages, such as the simplified low-cost Mediterranean-style and simplified Asian-525
Part D. Chapter 5: Food Sustainability and Safety
Scientific Report of the 2015 Dietary Guidelines Advisory Committee 15
style diets, both of which would lower cardiovascular disease and cancer risk, compared to the 526 average New Zealand diet. However, dietary variety was limited and further optimization to 527 lower GHG emissions increased cost. 528 529 Overall, the studies were consistent in showing that higher consumption of animal-based foods 530 was associated with higher estimated environmental impact, whereas consumption of more plant-531 based foods as part of a lower meat-based or vegetarian-style dietary pattern was associated with 532 estimated lower environmental impact compared to higher meat or non-plant-based dietary 533 patterns. Related to this, the total energy content of the diet was also associated with estimated 534 environmental impact and higher energy diets had a larger estimated impact. For example, for 535 fossil fuel alone, one calorie from beef or milk requires 40 or 14 calories of fuel, respectively, 536 whereas one calorie from grains can be obtained from 2.2 calories of fuel.42 Additionally, the 537 evidence showed that dietary patterns that promote health also promote sustainability; dietary 538 patterns that adhered to dietary guidelines were more environmentally sustainable than the 539 population’s current average level of intake or pattern. Taken together, the studies agreed on the 540 environmental impact of different dietary patterns, despite varied methods of assessing 541 environmental impact and differences in components of environmental impact assessed (e.g. 542 GHG emissions or land use). The evidence on whether sustainable diets were more or less 543 expensive than typically consumed diets in some locations was limited and inconsistent. 544 545 Three additional reports on the relationship between dietary patterns and sustainability were 546 published after this systematic review was completed. Two of these reports were consistent with, 547 and provided more evidence to support the Committee’s findings that dietary guidelines-related 548 diets, Mediterranean-style diets, and vegetarian (and variations) diets are associated with 549 improved environmental outcomes. Tilman and Clark showed that following a Mediterranean, 550 vegetarian (lacto-ovo), or pesco-vegetarian dietary pattern would decrease both current and 551 projected GHG emissions and land use.11 Eshel et al. reported on the five main animal-based 552 categories in the U.S. diet – dairy, beef, poultry, pork, and eggs – and their required feeds 553 including crops, byproducts, and pasture. They found that beef production required more land 554 and irrigation water and produced more GHG emissions than dairy, poultry, pork, or eggs.9 In 555 addition, as a standard comparator, staple plant foods had lower land use and GHG emissions 556 than did dairy, poultry, pork, or eggs. In contrast, a report from Heller and Keoleian suggests that 557 an isocaloric shift from the average U.S. diet (at current U.S. per capita intake of 2,534 kcals/day 558 from Loss-Adjusted Food Availability (LAFA) data) to a pattern that adheres to the 2010 Dietary 559 Guidelines for Americans would result in a 12 percent increase in diet-related GHG emissions.10 560 This result was modified, however, by their finding that if Americans consumed the 561 recommended pattern within the recommended calorie intake level of 2,000 kcal/day, there 562 would be a 1 percent decrease in GHG emissions. This finding reinforces the overriding 2010 563 DGA recommendation that all of the guidelines need to be followed, including appropriate 564 calorie intake levels for age, gender, and activity level. Furthermore, in contrast to the findings of 565
Part D. Chapter 5: Food Sustainability and Safety
Scientific Report of the 2015 Dietary Guidelines Advisory Committee 16
Eshel et al. regarding dairy, Heller and Keoleian suggest that increases in dairy to follow 2010 566 DGA recommendations contribute significantly to increased GHG emissions and counters the 567 modeled benefits of decreased meat consumption.10 568 569 For additional details on this body of evidence, visit: Appendix E-2.37 570 571
Seafood Sustainability 572
Background 573
Seafood is recognized as an important source of key macro- and micronutrients. The health 574 benefits of seafood, including support of optimal neurodevelopment and prevention of 575 cardiovascular disease, are likely due in large part to long-chain n-3 polyunsaturated fatty acids 576 (PUFA), docosahexaenoic acid (DHA) and eicosapentaenoic acid (EPA), although seafood also 577 are good sources of other nutrients including protein, selenium, iodine, vitamin D, and choline.27 578 Currently, seafood production is in the midst of rapid expansion to meet growing worldwide 579 demand, but the collapse of some fisheries due to overfishing in past decades raises concerns 580 about the ability to produce safe and affordable seafood to supply the U.S. population and meet 581 current dietary intake recommendations of at least 8 ounces per week.20, 56 Capture fisheries 582 (wild caught) production has leveled-off as a proportion of fully exploited stocks, and this is due 583 in part to national and international efforts on seafood sustainably (e.g., the U.S. Magnuson-584 Stevens Fishery Conservation and Management Act (2006) mandating annual catch limits, 585 managed by the U.S. National Oceanographic and Atmospheric Administration). In contrast, the 586 increased productivity of worldwide aquaculture (farm-raised) is expected to continue and will 587 play a major role in expanding the supply of seafood.20 Expanding farm-raised seafood has the 588 potential to ensure sufficient amounts of seafood to allow the U.S. population to consume levels 589 recommended by dietary guidelines.57 Productivity gains should be implemented in a sustainable 590 manner with greater attention to maintaining or enhancing the high nutrient density characteristic 591 of captured seafood. Consistent with overall sustainability goals, farm-raised finfish (e.g., 592 salmon and trout) is more sustainable than terrestrial animal production (e.g., beef and pork) in 593 terms of GHG emissions and land/water use.58, 59 Currently, the United States imports the 594 majority of its seafood (~90 percent), and approximately half of that is farmed.60 The major 595 groups commonly referred to as finfish, shellfish, and crustaceans include more than 500 species, 596 and thus, generalizations to all seafood must be made with caution. 597
Part D. Chapter 5: Food Sustainability and Safety
Scientific Report of the 2015 Dietary Guidelines Advisory Committee 17
598
Question 2: What are the comparative nutrient profiles of current farm-raised 599 versus wild caught seafood? 600
Source of evidence: USDA Agriculture Research Service (ARS) National Nutrient Database 601 (NND)25 updated with USDA-funded survey of most commonly consumed species in the United 602 States.26 603 604 Conclusion 605
For commonly consumed fish species in the United States, such as bass, cod, trout, and 606 salmon, farmed-raised seafood has as much or more of the omega-3 fatty acids EPA and DHA 607 as the same species captured in the wild. In contrast, farmed low-trophic species, such as 608 catfish and crawfish, have less than half the EPA and DHA per serving than wild caught, and 609 these species have lower EPA and DHA regardless of source than do salmon. Farm-raised 610 seafood has higher total fat than wild caught. Recommended amounts of EPA and DHA can 611 be obtained by consuming a variety of farm-raised seafood, especially high-trophic species, 612 such as salmon and trout. 613 614 Implications 615
The U.S. population should be encouraged to eat a wide variety of seafood that can be wild 616 caught or farmed, as they are nutrient-dense foods that are uniquely rich sources of healthy fatty 617 acids. It should be noted that low-trophic farm-raised seafood, such as catfish and crayfish, have 618 lower EPA and DHA levels than do wild-caught. Nutrient profiles in popular low-trophic farmed 619 species should be improved through feeding and processing systems that produce and preserve 620 nutrients similar to those of wild-caught seafood of the same species. 621 622 Review of the Evidence 623
The USDA-Agricultural Research Service (ARS) National Nutrient Database (NND) for 624 Standard Reference, Release 27 was used to address this question 625 (http://www.ars.usda.gov/ba/bhnrc/ndl).25 The section on finfish and shellfish products included 626 nutrient profiles for both farm-raised and wild-caught seafood for some species. These data were 627 augmented using a USDA-funded report on fatty-acid profiles of commercially available fish in 628 the United States that assessed additional farmed species and compared results26 with the USDA-629 ARS NND.25 The samples collected were from different regions of the United States during 630 different seasons. For wild-caught species, the nutrient profile is determined by changes in 631 environmental conditions, whereas, for farmed species, the nutrient profile is dependent on the 632 amount, timing, and composition of the feed.26 Because aquaculture diets can be continually 633 modified, updates are important to monitor EPA and DHA in commercial seafood species, to 634
Scientific Report of the 2015 Dietary Guidelines Advisory Committee 18
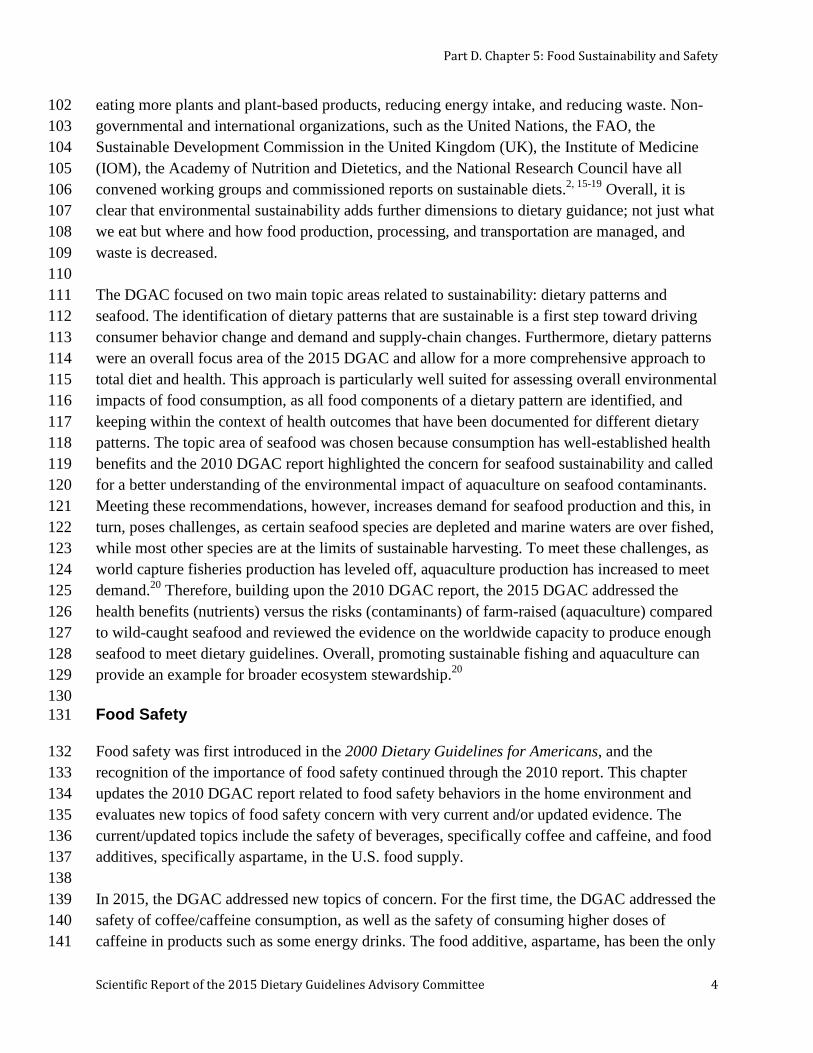
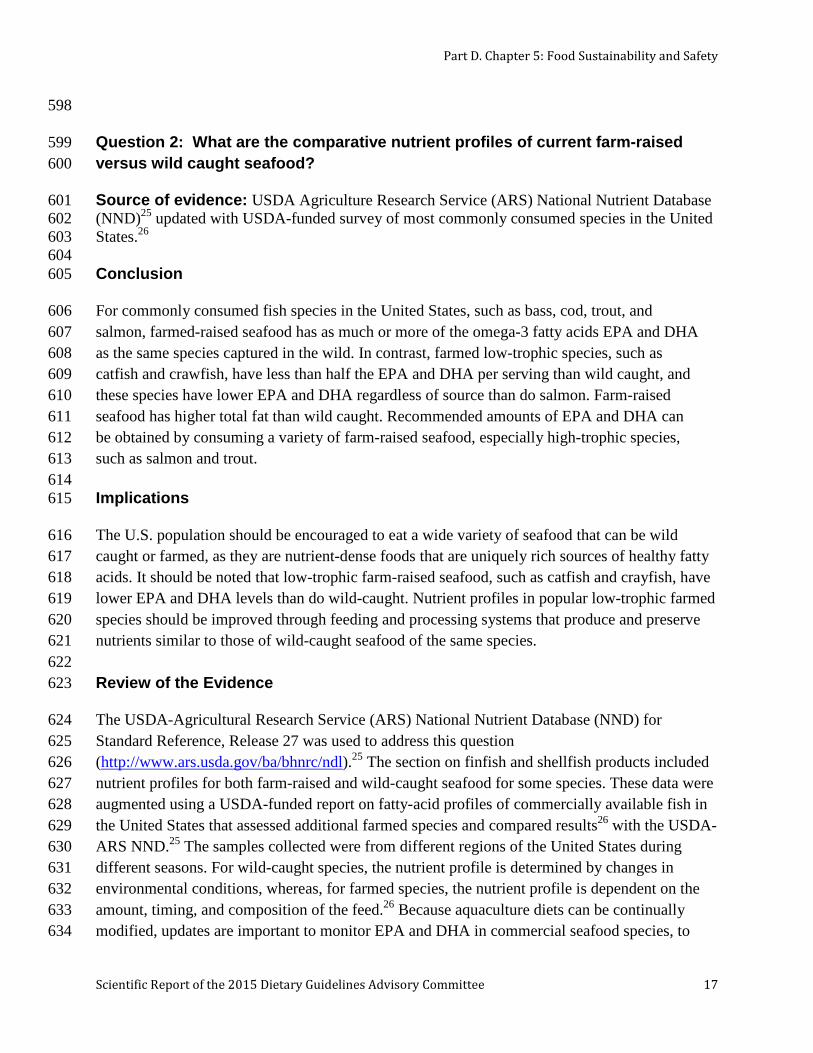
provide consumers with the most accurate information. The NND provided nutrient profiles for 635 six seafood species with data on both wild-caught and farm-raised versions: four fish (rainbow 636 trout, Atlantic and Coho salmon, and catfish), eastern oysters, and mixed species crayfish. The 637 key nutrients EPA and DHA were on average comparable or greater for farmed trout, salmon, 638 and oysters compared to wild capture, reflecting the higher total fat content of these farmed 639 species. On the other hand, low-trophic species, such as catfish and crayfish, when farmed, were 640 lower in EPA and DHA compared to wild capture. Cladis et al. determined EPA and DHA levels 641 for five farmed and wild fish species (rainbow trout, white sturgeon, Chinook salmon, Atlantic 642 cod, striped bass), providing an update and comparison for some of these species (Figure 643 D5.2)26. Farmed Atlantic salmon was similar between the NND and the update and most other 644 species compared well; however, Chinook salmon and sturgeon showed differences in EPA and 645 DHA content (although farmed and wild were not distinguished in the NND). Overall, these data 646 showed that existing DGAC recommendations to consume a variety of seafood can be met by 647 consuming a diverse range of species, including farmed species. 648 649 Figure D5.2. Comparison of EPA and DHA drawn from data in USDA National Nutrient 650 Database25 and update from Cladis et al.26 651 652
653 654 For additional details on this body of evidence, visit: Appendix E-2.38 Evidence Portfolio and 655 http://www.ars.usda.gov/ba/bhnrc/ndl 656 657 658
Scientific Report of the 2015 Dietary Guidelines Advisory Committee 19
Question 3. What are the comparative contaminant levels of current farm-raised 659 versus wild caught seafood? 660
Source of evidence: Report of the Joint United Nations Food and Agriculture 661 Organization/World Health Organization Expert Consultation on the Risks and Benefits of Fish 662 Consumption. Rome, 25–29 January 2010. FAO Fisheries and Aquaculture Report No. 978.27 663 664 Conclusion 665
The DGAC concurs with the Consultancy that, for the majority of commercial wild and farmed 666 species, neither the risks of mercury nor organic pollutants outweigh the health benefits of 667 seafood consumption, such as decreased cardiovascular disease risk and improved infant 668 neurodevelopment. However, any assessment evaluates evidence within a time frame and 669 contaminant composition can change rapidly based on the contamination conditions at the 670 location of wild catch and altered production practices for farmed seafood. DGAC Grade: 671 Moderate 672 673 Implications 674
Based on risk/benefit comparisons, either farmed or wild-caught seafood are appropriate choices 675 to consume to meet current Dietary Guidelines for Americans for increased seafood 676 consumption. The DGAC supports the current FDA and EPA recommendations that women who 677 are pregnant (or those who may become pregnant) and breastfeeding should not eat certain types 678 of seafood—tilefish, shark, swordfish, and king mackerel—because of their high methyl mercury 679 contents. Attention should be paid to local seafood advisories when eating seafood caught from 680 local rivers, streams, and lakes. 681 682 Based on the most current evidence on mercury levels in albacore tuna provided in the Report of 683 the Joint United Nations Food and Agriculture Organization/World Health Organization Expert 684 Consultation on the Risks and Benefits of Fish Consumption, 2010,27 the DGAC recommends 685 that the EPA and FDA re-evaluate their current recommendations61 for women who are pregnant 686 (or for women who may become pregnant) or breastfeeding to limit white albacore tuna to not 687 more than 6 ounces a week. 688 689 Review of the Evidence 690
The Report of the FAO/WHO Expert Consultation on the Risks and Benefits of Fish 691 Consumption27 was used to address this question. This report was chosen as the most current and 692 comprehensive source on contaminants in wild-caught and farm-raised seafood, and the DGAC 693 focused on data that addressed the specific comparison between the two. The sections of the 694 report that were used to address the question were “Data on the composition of fish” and “Risk-695 benefit comparisons.” The consultancy took a net effects approach, balancing benefits of 696
Part D. Chapter 5: Food Sustainability and Safety
Scientific Report of the 2015 Dietary Guidelines Advisory Committee 20
seafood, especially benefits associated with EPA and DHA, against the adverse effects of 697 mercury and persistent organic pollutants (POPs), including polychlorinated biphenyls, 698 polychlorinated dibenzo-p-dioxins, and polychlorinated dibenzofurans, collectively referred to as 699 dioxins. The Expert Consultancy compiled EPA and DHA, mercury, and dioxins compositional 700 data from national databases of the United States, France, Norway, and Japan, as well as an 701 international database. Together, these provided information on total fat, EPA and DHA, total 702 mercury, and dioxins for a large number of seafood species, including three farmed and wild 703 species (salmon, rainbow trout, and halibut). Two specific outcomes were considered for 704 risk/benefit: 1) prenatal exposure and offspring neurodevelopment, and 2) mortality from 705 cardiovascular diseases and cancer. 706 707 Overall, for the species examined, levels of mercury and dioxins were in the same range for 708 farmed and wild seafood. Related to risk/benefit, at the same level of mercury content (lowest [≤ 709 0.1 µg/g] and 2nd lowest [0.1 - 0.5 µg/g] levels), farmed seafood had the same or higher levels of 710 EPA and DHA as wild-caught. At the same level of dioxin content (2nd lowest [0.5 – 4 pg toxic 711 equivalents (TEQ)/g] level), farmed seafood had the same or higher levels of EPA and DHA as 712 wild-caught. Only wild-caught Pacific salmon had the lowest level of dioxins (<0.5 pg TEQ/g). 713 Overall, the quantitative risk/benefit analysis was not different for farmed compared to wild-714 caught seafood. For both, using the central estimate for benefits of DHA and for harm from 715 mercury, the neurodevelopmental risks of not eating seafood exceeded the risks of eating 716 seafood. Similarly, for coronary heart disease (CHD) in adults, there were CHD mortality 717 benefits from eating seafood and CHD risks from not eating seafood, except for seafood in the 718 highest dioxin category and lowest EPA and DHA category, which did not include any of the 719 farm-raised species considered. 720 721 Albacore tuna, produced only from wild marine fisheries, is a special case of a popular fish 722 highlighted by the 2004 FDA and EPA advisory.61, 62 For all levels of intake including more 723 than double the 12 ounces per week recommendation, all evidence was in favor of net benefits 724 for infant development and CHD risk reduction. 725 726 Limitations in the evidence included the small number of farmed and wild seafood species 727 comparisons considered by the Expert Consultancy, and the possibility of rapid change that may 728 occur in the concentration of contaminants locally. In addition, seafood contaminants are closely 729 linked to levels of contaminants in feed. 730 731 For additional details on this body of evidence, visit: Report of the Joint Food and Agriculture 732 Organization of the United Nations (FAO) and the World Health Organization (WHO) Expert 733 Consultation on the Risks and Benefits of Fish Consumption, 2011. Available at 734 http://www.fao.org/docrep/014/ba0136e/ba0136e00.pdf 735 736
Scientific Report of the 2015 Dietary Guidelines Advisory Committee 21
Question 4: What is the worldwide capacity to produce farm-raised versus wild-737 caught seafood that is nutritious and safe for the U.S. population? 738
Source of evidence: United National (UN) Food and Agriculture Organization (FAO) report 739 on The State of World Fisheries and Agriculture.20 740 741 Conclusions 742
The DGAC concurs with the FAO report that consistent evidence demonstrates that capture 743 fisheries increasingly managed in a sustainable way have remained stable over several decades. 744 However, on average, capture fisheries are fully exploited and their continuing productivity 745 relies on careful management to avoid over-exploitation and long-term collapse. DGAC Grade: 746 Strong 747 748 The DGAC endorses the FAO report that capture fisheries production plateaued around 1990 749 while aquaculture has increased since that time to meet increasing demand. Evidence suggests 750 that expanded seafood production will rely on the continuation of a rapid increase in aquaculture 751 output worldwide, projected at 33 percent increase by 2021, which will add 15 percent to the 752 total supply of seafood.20 Distributed evenly to the world’s population, this capacity could in 753 principle meet Dietary Guidelines recommendations for consumption of at least 8 ounces of 754 seafood per week. Concern exists that the expanded capacity may be for low-trophic level 755 seafood that has relatively low levels of EPA and DHA compared to other species. Under the 756 current production, Americans who seek to meet U.S. Dietary Guidelines recommendations must 757 rely on significant amounts of imported seafood (~90 percent). DGAC Grade: Moderate 758 759 Implications 760 761 Both wild and farmed seafood are major food sources available to support DGAC 762 recommendations to regularly consume a variety of seafood. Responsible stewardship over 763 environmental impact will be important as farmed seafood production expands. Availability of 764 these important foods is critical for future generations of Americans to meet their needs for a 765 healthy diet. Therefore, strong policy, research, and stewardship support are needed to 766 increasingly improve the environmental sustainability of farmed seafood systems. From the 767 standpoint of the dietary guidelines this expanded production needs to be largely in EPA and 768 DHA rich species and supporting production of low-trophic level species of similar nutrient 769 density as wild-caught. 770 771 Review of the Evidence 772
The UN FAO report on The State of World Fisheries and Agriculture issued in 2012 formed the 773 basis of the DGAC’s evidence review on this topic.20 The FAO report addresses a wide variety 774 of issues affecting capture fisheries and aquaculture, including economics, infrastructure, and 775
Part D. Chapter 5: Food Sustainability and Safety
Scientific Report of the 2015 Dietary Guidelines Advisory Committee 22
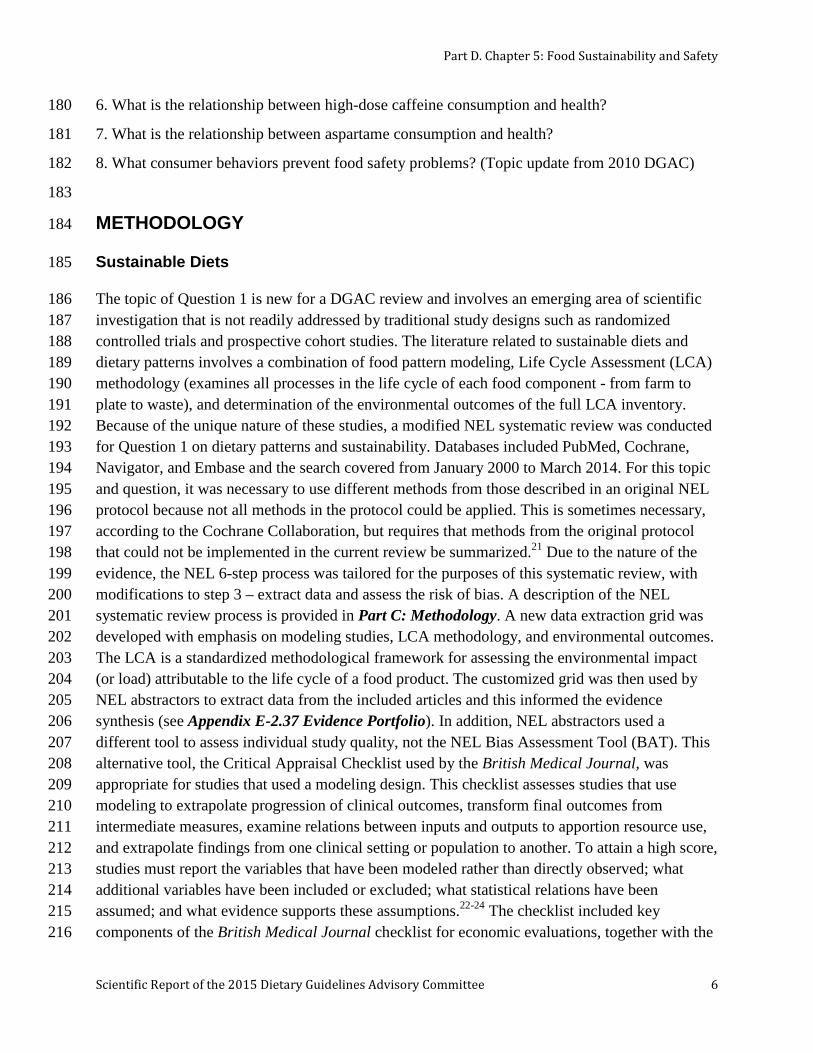
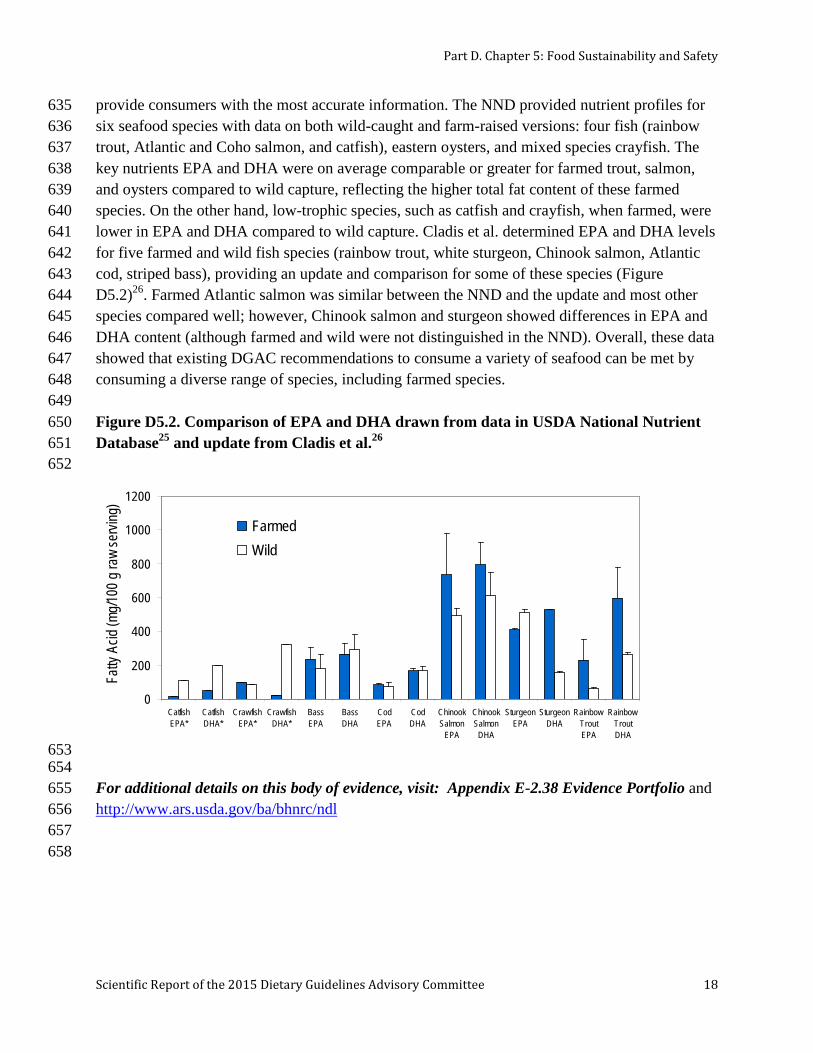
labor and government policies. The DGAC focused on matters that directly address the world 776 production of one important food—seafood—as a first attempt by a DGAC committee to 777 consider the implications of dietary guidelines for production of a related group of foods. 778 779 The production of capture fisheries has remained stable at about 90 million tons from 1990-2011 780 (Figure D5.3).20 At the same time, aquaculture production is rising and will continue to increase. 781 FAO model projections indicate that in response to the higher demand for seafood, world 782 fisheries and aquaculture production is projected to grow by 15 percent between 2011 and 2021. 783 This increase will be mainly due to increased aquaculture output, which is projected to increase 784 33 percent by 2021, compared with only 3 percent growth in wild capture fisheries over the same 785 period. It is predicted that aquaculture will remain one of the fastest growing animal food-786 producing sectors and will exceed that of beef, pork, or poultry. Aquaculture production is 787 expected to expand on all continents with variations across countries and regions in terms of the 788 seafood species produced. Currently, the United States is the leading importer of seafood 789 products world-wide, with imports making up about 90 percent of seafood consumption. 790 Continuing to meet Americans needs for seafood will require stable importation or substantial 791 expansion of domestic aquaculture. 792 793 Figure D5.3. Comparison of fishery production and aquaculture, 1950-2010 794 795
812 For additional details on this body of evidence, visit: UN FAO report on The State of World 813 Fisheries and Agriculture, 2012. Available at http://www.fao.org/fishery/sofia/en 814 815
Scientific Report of the 2015 Dietary Guidelines Advisory Committee 23
FOOD SAFETY 816
The DGAC reviewed evidence of food safety topics was limited to usual coffee/caffeine 817 consumption, high dose caffeine consumption, and aspartame. Coffee is one of the most widely 818 consumed beverages in the U.S. and represents a major source of caffeine.63 The effects of 819 coffee/caffeine consumption have not been evaluated by any prior DGAC. The Committee 820 reviewed the evidence on normal and excessive coffee/caffeine intake and health outcomes. In 821 addition, the DGAC reviewed evidence on health outcomes and aspartame; the most widely used 822 nonnutritive sweetener. 823 824 Given the importance of food-borne illness prevention, the Committee reviewed the 2010 DGAC 825 report content related to consumer behaviors and updated the key food safety behavior 826 principles. 827 828 Question 5: What is the relationship between usual coffee/caffeine consumption 829 and health? 830
Source of Evidence: Overview of systematic reviews and meta-analyses 831 832 Coffee/Caffeine and Chronic Disease 833
Conclusion 834
Strong and consistent evidence shows that consumption of coffee within the moderate range (3 to 835 5 cups/d or up to 400 mg/d caffeine) is not associated with increased risk of major chronic 836 diseases, such as cardiovascular disease (CVD) and cancer and premature death in healthy 837 adults. DGAC Grade: Strong 838 839 Consistent observational evidence indicates that moderate coffee consumption is associated with 840 reduced risk of type 2 diabetes and cardiovascular disease in healthy adults. In addition, 841 consistent observational evidence indicates that regular consumption of coffee is associated with 842 reduced risk of cancer of the liver and endometrium, and slightly inverse or null associations are 843 observed for other cancer sites. DGAC Grade: Moderate 844 845 Implications 846
Moderate coffee consumption can be incorporated into a healthy lifestyle, along with other 847 behaviors, such as refraining from smoking, consuming a nutritionally balanced diet, maintaining 848 a healthy body weight, and being physically active. However, it should be noted that coffee, as it 849 is normally consumed, frequently contains added calories from cream, milk, and added sugars. 850 Care should be taken to minimize these caloric additions. Furthermore, individuals who do not 851 consume caffeinated coffee should not start to consume it for health benefits alone. 852
Part D. Chapter 5: Food Sustainability and Safety
Scientific Report of the 2015 Dietary Guidelines Advisory Committee 24
Review of the Evidence 853
Total Mortality 854
Evidence suggests a significant inverse relationship between coffee consumption of 1 to 4 855 cups/day with total mortality, especially CVD mortality. This evidence is based on three meta-856 analyses of more than 20 prospective cohort studies.64-66 In general, results were similar for men 857 and women. The risk reduction associated with each cup of coffee per day was between 3 to 4 858 percent. In addition, Je and Giovannucci found a significant inverse association between coffee 859 consumption and CVD mortality.65 This association was stronger in women (16 percent lower 860 risk) than in men (8 percent lower risk). However, no association was found for cancer mortality. 861 Crippa et al. found that the lowest risk was observed for 4 cups/day for all-cause mortality (16%, 862 95% CI: 13, 18) and 3 cups/day for CVD mortality (21%, 95% CI: 16, 26).64 863 864 Cardiovascular Disease 865
A large and current body of evidence directly addressed the relationship between normal coffee 866 consumption and risk of CVD. The evidence included 12 systematic reviews with meta-analyses, 867 all of which had high quality ratings (AMSTAR scores 8/11 – 11/11). CVD incidence and 868 mortality, as well as CHD, stroke, heart failure, and hypertension were assessed by meta-869 analyses that consisted primarily of prospective cohort studies. Intermediate outcomes such as 870 blood pressure, blood lipids, and blood glucose were assessed by meta-analyses of randomized 871 controlled trials. 872 873 CVD risk was assessed by a current meta-analysis of 36 prospective cohort studies on long-term 874 coffee consumption.67 This analysis showed a non-linear association, such that the lowest risk of 875 CVD was seen with moderate coffee consumption (3 to 5 cups/day), but higher intakes (>5 876 cups/day) were neither protective nor harmful. Overall, moderate consumption of caffeinated, 877 but not decaffeinated, coffee was associated with a 12 percent lower risk of CVD. 878 879 Results from the assessment of CHD risk in three meta-analyses were not entirely consistent.67-69 880 Ding et al. found 10 percent lower CHD risk with moderate coffee consumption (3 to 5 881 cups/day) in a meta-analysis of 30 prospective cohort studies, whereas Wu et al. and Sofi et al. in 882 meta-analyses of 21 and 10 prospective cohort studies, respectively, found no association 883 between coffee consumption and CHD risk. 67-69 However, in sub-group analysis, Wu et al. 884 found that habitual moderate coffee consumption (1 to 4 cups/day) was associated with an 18 885 percent lower risk of CHD among women.69 Overall, the meta-analyses of Sofi et al. and Wu et 886 al. were conducted with smaller bodies of evidence and Ding et al. assessed several more recent 887 studies.67-69 Of note, coffee brewing methods have changed over time and the filter method has 888 become more widely used, replacing unfiltered forms of coffee such as boiled coffee that were 889 more widely reported by participants in earlier studies. Thus, the findings by Ding et al. are 890 more up to date, reflecting health effects of coffee consumed in recent cohorts. 891
Part D. Chapter 5: Food Sustainability and Safety
Scientific Report of the 2015 Dietary Guidelines Advisory Committee 25
Risk of stroke was assessed in two systematic reviews with meta-analyses of prospective cohort 892 studies with consistent findings.70, 71 Kim et al. found that coffee intake of 4 or more cups/day 893 had a protective association on risk of stroke.70 Larsson et al. documented a non-linear 894 association such that coffee consumption ranging from 1 to 6 cups/day was associated with an 8 895 percent to 13 percent lower risk of stroke, and higher intakes were not associated with decreased 896 or increased risk.71 The inverse associations were limited to ischemic stroke and no association 897 was seen with hemorrhagic stroke. 898 899 Regarding blood pressure, three meta-analyses evaluated the effect of coffee and caffeine on 900 systolic and diastolic blood pressure using controlled trials.72-74 The most recent meta-analysis of 901 10 randomized controlled trials by Steffen et al. showed no effect of coffee on either systolic or 902 diastolic blood pressure. Similarly, in another meta-analysis of 11 coffee trials and 5 caffeine 903 trials, caffeine doses of <410 mg/day had no effect on systolic and diastolic blood pressure, 904 while doses of 410 or more mg/day resulted in a net increase.73 A third meta-analysis showed 905 that among individuals with hypertension, 200 to 300 mg of caffeine (equivalent to ~2 to 3 cups 906 filtered coffee) resulted in an acute increase of systolic and diastolic blood pressure.72 907 Additionally, two meta-analyses quantified the effect of coffee on incidence of hypertension74, 75 908 and found no association between habitual coffee consumption and risk of hypertension. 909 However, Zhang et al. documented a slightly elevated risk for light to moderate consumption (1 910 to 3 cups/day) of coffee compared to less than 1 cup/day.75 911 912 Regarding blood lipids, meta-analyses of short-term randomized controlled trials revealed that 913 coffee consumption contributed significantly to an increase in total cholesterol and LDL-914 cholesterol, but cholesterol-raising effects were primarily limited to unfiltered coffee and filtered 915 coffee appeared to have minimal effects on serum cholesterol levels.76, 77 916 917 In a meta-analysis of observational study data, including prospective, retrospective, and case-918 control studies, higher amounts of coffee or caffeine had no association with risk of atrial 919 fibrillation, but low doses of caffeine (<350 mg/day) appeared to have a protective association.78 920 In addition, coffee consumption of 1 to 5 cups/day was found to be inversely associated with risk 921 of heart failure in a meta-analysis of five prospective studies.79 A non-linear association was 922 documented and the lowest risk was observed for 4 cups/day.79 923 924 Type 2 Diabetes 925
Coffee consumption has consistently been associated with a reduced risk of type 2 diabetes. In 926 four meta-analyses of prospective cohort studies80-83 and cross-sectional studies,83 coffee 927 consumption was inversely associated with risk of type 2 diabetes in a dose-response manner. 928 Compared to non-drinkers, risk for type 2 diabetes was 33 percent lower for those consuming 6 929 cups/day in the analysis by Ding et al. while the risk was 37 percent lower for those consuming 930 10 cups/day in the analysis by Jiang et al.67, 82 Using a sub-set of the prospective cohorts in the 931
Part D. Chapter 5: Food Sustainability and Safety
Scientific Report of the 2015 Dietary Guidelines Advisory Committee 26
Ding et al. and Jiang et al. meta-analyses, Huxley et al. documented that each cup of coffee was 932 associated with a 7 percent lower risk of type 2 diabetes.81 Similarly, van Dam and Hu noted that 933 consumption of ≥6 or ≥7 cups/day was associated with a 35 percent lower risk of type 2 934 diabetes.83 Three meta-analyses80-82 also found protective associations for decaffeinated coffee. 935 Moderate decaffeinated coffee consumption (3 to 4 cups/day) was associated with a 36 percent 936 lower risk of type 2 diabetes.81 Each cup of decaffeinated coffee was associated with a 6 percent 937 lower risk80 while every 2 cups were associated with a 11 percent lower risk.82 Both reports also 938 documented a dose-response association between caffeine and type 2 diabetes risk such that 939 every 140 mg/day was associated with an 8 percent lower risk in the Ding et al. meta-analysis, 940 while every 200 mg/day was associated with a 14 percent lower risk in the analysis by Jiang et 941 al.80, 82 However, it remains unclear if this inverse association is independent of coffee 942 consumption, as Ding et al. indicated that none of the studies included in the caffeine dose-943 response analysis adjusted for total coffee. 944 945 Only one systematic review of nine randomized controlled trials examined the effects of caffeine 946 on blood glucose and insulin concentrations among those with type 2 diabetes.84 Ingestion of 200 947 to 500 mg of caffeine acutely increased blood glucose concentrations by 16 to 28 percent of the 948 area under the curve and insulin secretions by 19 to 48 percent of the area under the curve when 949 taken before a glucose load. At the same time, these trials also noted a decrease in insulin 950 sensitivity by 14 to 37 percent. Although no study has examined whether the effects of caffeine 951 on blood glucose and insulin persist in the long term, evidence from prospective cohorts 952 indicates that the acute effects of caffeine do not translate into long-term risk of type 2 diabetes. 953 Furthermore, the inverse association between decaffeinated coffee and diabetes risk suggests that 954 the observed benefit is likely to be due to other constituents in coffee rather than caffeine. 955 956 Cancer 957
Several systematic reviews and meta-analyses examined the association between coffee 958 consumption and risk of cancer. Types of cancer examined by the DGAC included total cancer, 959 cancers of the lung, liver, breast, prostate, ovaries, endometrium, bladder, pancreas, upper 960 digestive and respiratory tract, esophagus, stomach, colon, and rectum. 961 962 In a quantitative summary of 40 prospective cohort studies with an average follow-up of 14.3 963 years, Yu et al. found a 13 percent lower risk of total cancer among coffee drinkers compared to 964 non-drinkers or those with lowest intakes.85 Risk estimates were similar for men and women. In 965 sub-group analyses, the authors noted that coffee drinking was associated with a reduced risk of 966 bladder, breast, buccal and pharyngeal, colorectal, endometrial, esophageal, hepatocellular, 967 leukemic, pancreatic, and prostate cancers. 968 969 Tang et al. evaluated five prospective cohorts and eight case-control studies and found that, 970 overall, those with the highest levels of coffee consumption had a 27 percent higher risk for lung 971
Part D. Chapter 5: Food Sustainability and Safety
Scientific Report of the 2015 Dietary Guidelines Advisory Committee 27
cancer compared to never drinkers or those with least consumption.86 An increase in coffee 972 consumption of 2 cups/day was associated with a 14 percent higher risk of developing lung 973 cancer. However, because smoking is an important confounder, when analyses were stratified by 974 smoking status, coffee consumption was marginally protective in non-smokers and was not 975 associated with lung cancer among smokers. When estimates from two studies that examined 976 decaffeinated coffee were summarized, a protective association with lung cancer was seen. No 977 association was seen with lung cancer when only case-control studies were considered. 978 979 Results from two meta-analyses indicate that coffee consumption is associated with a 40 to 50 980 percent lower risk of liver cancer,87 88 when considering both cohort and case-control studies. In 981 one meta-analysis, the associations were significant in men but not in women.87 982 983 Three meta-analyses of observational studies found no association between coffee 984 consumption,89-91 caffeine consumption, or decaffeinated coffee consumption and risk of breast 985 cancer. In all three reports, each 2 cup/day of coffee was marginally associated with a 2 percent 986 lower risk of breast cancer. However, in sub-group analyses, coffee consumption was protective 987 against breast cancer risk in postmenopausal women,89 BRCA1 mutation carriers,89 and women 988 with estrogen receptor negative breast tumors .90 989 990 The association between coffee consumption and risk of prostate cancer was mixed. Cao et al. 991 and Zhong et al. found that regular or high coffee consumption, compared to non- or lowest 992 levels of consumption, was associated with a 12 percent to 17 percent lower risk of prostate 993 cancer in prospective cohort studies.92, 93 Further, each 2 cups of coffee per day was associated 994 with a 7 percent lower risk of prostate cancer. However, no associations were seen with case-995 control data alone or when these studies were examined together with prospective cohort studies. 996 Using a combination of both prospective cohort and case-control data, Discacciati et al. found 997 that each 3 cups/day of coffee was associated with a 3 percent lower risk of localized prostate 998 cancer and an 11 percent lower risk of mortality from prostate cancer.94 On the other hand, after 999 summarizing data from 12 prospective cohort and case-control studies, Park et al. found a 16 1000 percent higher risk of prostate cancer.95 However, in sub-group analyses by study design, the 1001 higher risk was observed in case-control but not in cohort studies. 1002 1003 Consumption of coffee was not associated with risk of ovarian cancer in a meta-analysis of seven 1004 prospective cohort studies with more than 640,000 participants.96 Two meta-analyses confirmed 1005 an inverse association between coffee consumption and risk of endometrial cancer.97, 98 In the 1006 most recent and updated meta-analysis of prospective cohort and case-control studies, compared 1007 to those in the lowest category of coffee consumption, those with the highest intakes of coffee 1008 had a 29 percent lower risk of endometrial cancer.98 Each cup of coffee per day was associated 1009 with an 8 percent lower risk of endometrial cancer. Similar results were found in the meta-1010 analysis by Bravi et al. that included a sub-set of the studies in Je et al. and documented a 20 1011
Part D. Chapter 5: Food Sustainability and Safety
Scientific Report of the 2015 Dietary Guidelines Advisory Committee 28
percent lower risk of endometrial cancer overall, and a 7 percent decrease for each cup of coffee 1012 per day.97, 98 However, the association was significant only in case-control studies but not in 1013 cohort studies, most likely due to lower statistical power. 1014 1015 A recent meta-analysis of 23 case-control studies by Zhou et al. found coffee was a risk factor 1016 for bladder cancer. There was a smoking-adjusted increased risk of bladder cancer for those in 1017 the highest (45 percent), second highest, (21 percent), and third highest (8 percent) groups of 1018 coffee consumption, compared to those in the lowest intake group.99 No association was, 1019 however, seen in cohort studies. 1020 1021 Two meta-analyses of coffee consumption and pancreatic cancer risk provided mixed results.85, 1022 100 Using both prospective cohort and case-control studies, Turati et al. found that coffee 1023 consumption was not associated with risk of pancreatic cancer.100 However, an increased risk 1024 was seen in case-control studies that did not adjust for smoking. Using a sub-set of prospective 1025 cohorts included in the Turati et al. meta-analysis, Dong et al. found that coffee drinking was 1026 inversely associated with pancreatic cancer risk but did not separate studies based on their 1027 adjustment for smoking status.101 Sub-group analyses revealed a protective association in men, 1028 but not in women. 1029 1030 Turati et al. quantified the association between coffee consumption and various upper digestive 1031 and respiratory tract cancers using data from observational studies.102 Coffee consumption was 1032 associated with a 36 percent lower risk of oral and pharyngeal cancer but not with risk of 1033 laryngeal cancer, esophageal squamous cell carcinoma, or esophageal adenocarcinoma. In a 1034 meta-analysis of prospective cohort and case-control studies, Zheng et al. noted that coffee was 1035 inversely, but non-significantly, associated with risk of esophageal cancer.103 Regarding gastric 1036 cancer, no association between coffee consumption and risk was seen in a meta-analysis of 1037 observational studies by Botelho et al.104 1038 1039 Three meta-analyses on the association between coffee consumption and colorectal cancer risk 1040 have yielded mixed findings.105-107 Results from case-control studies suggested coffee 1041 consumption was associated with lower risk of colorectal (15 percent lower) and colon cancer 1042 (21 percent lower), especially in women. However, this inverse association was non-significant 1043 for cohort studies. Using all but one of the case-control studies, Galeone et al. arrived at similar 1044 conclusions as a Li et al. analysis, although associations were in general stronger.105, 107 Galeone 1045 et al. also provided suggestive evidence for a dose-response relationship between coffee and 1046 colorectal cancer such that each cup of coffee was associated with a 6 percent lower risk of 1047 colorectal cancer, 5 percent lower risk of colon cancer, and 3 percent lower risk of rectal 1048 cancer.105 Using several prospective cohort studies, as in the Li et al. meta-analysis, Je et al. 1049 found no significant association of coffee consumption with risk of colorectal cancer.106, 107 1050 Interestingly, no differences were seen by sex but the suggestive inverse associations were 1051
Part D. Chapter 5: Food Sustainability and Safety
Scientific Report of the 2015 Dietary Guidelines Advisory Committee 29
slightly stronger in studies that adjusted for smoking and alcohol. 1052 1053 For additional details on this body of evidence, visit: Appendix E-2.39a Evidence Portfolio, 1054 Appendix E-2.39b Systematic Review/Meta-Analysis Data Table, and References 64-107 1055 1056 Caffeine and Neurodegenerative Disease 1057
Conclusion 1058
Consistent evidence indicates an inverse association between caffeine intake and risk of 1059 Parkinson’s disease. DGAC Grade: Moderate 1060 1061 Limited evidence indicates that caffeine consumption is associated with a modestly lower risk of 1062 cognitive decline or impairment and lower risk of Alzheimer’s disease. DGAC Grade: Limited 1063 1064 Implications 1065
Moderate coffee consumption can be incorporated into a healthy lifestyle, along with other 1066 behaviors, such as refraining from smoking, consuming a nutritionally balanced diet, maintaining 1067 a healthy body weight, and being physically active. However, it should be noted that coffee as it 1068 is normally consumed can contain added calories from cream, milk, and added sugars. Care 1069 should be taken to minimize these caloric additions. Furthermore, individuals who do not 1070 consume caffeinated coffee should not start to consume it for health benefits alone. 1071 1072 Review of the Evidence 1073
Parkinson’s Disease 1074
Evidence from two systematic reviews108, 109 and one quantitative meta-analysis110 confirmed an 1075 inverse association between coffee, caffeine, and risk of Parkinson’s disease. Qi et al. evaluated 1076 six case-control studies and seven prospective articles and documented a non-linear relationship 1077 between coffee and risk of Parkinson’s disease, overall.110 The lowest risk was observed at about 1078 3 cups/day (smoking-adjusted risk reduction was 28 percent). For caffeine, a linear dose-1079 response was found and every 200 mg/day increment in caffeine intake was associated with a 17 1080 percent lower risk of Parkinson’s disease. Using a combination of cohort, case-control, and 1081 cross-sectional data, Costa et al. summarized that the risk of Parkinson’s disease was 25 percent 1082 lower among those consuming the highest versus lowest amounts of caffeine.108 Like Qi et al., 1083 Costa et al. documented a linear dose-response with caffeine intake such that every 300 mg/day 1084 was associated with a 24 percent lower risk of Parkinson’s disease. In both reports, associations 1085 were weaker among women than in men. 1086 1087
Part D. Chapter 5: Food Sustainability and Safety
Scientific Report of the 2015 Dietary Guidelines Advisory Committee 30
Cognition 1088
Two systematic reviews111, 112 and one meta-analysis112 examined the effects of caffeine from 1089 various sources, including coffee, tea, and chocolate, on cognitive outcomes. Arab et al. 1090 systematically reviewed six longitudinal cohort studies evaluating the effect of caffeine or 1091 caffeine-rich beverages on cognitive decline.111 Most studies in this review used the Mini Mental 1092 State Examination Score as a global measure of cognitive decline. The review concluded that 1093 estimates of cognitive decline were lower among caffeine consumers, although there was no 1094 clear dose-response relationship. Studies also showed stronger associations among women than 1095 men. In a meta-analysis of nine cohort and two case-control studies, caffeine intake from various 1096 sources was associated with a 16 percent lower risk of various measures of cognitive 1097 impairment/decline. Specifically, data from four studies indicate that caffeine is associated with a 1098 38 percent lower risk of Alzheimer’s disease. 1099 1100 For additional details on this body of evidence, visit: Appendix E-2.39a Evidence Portfolio, 1101 Appendix E-2.39b Systematic Review/Meta-Analysis Data Table, and References 108-112 1102 1103 Caffeine and Pregnancy Outcomes 1104
Conclusion 1105
Consistent evidence from observational studies indicates that moderate caffeine intake in 1106 pregnant women is not associated with risk of preterm delivery. DGAC Grade: Moderate 1107 1108 Higher caffeine intake is associated with a small increased risk of miscarriage, stillbirth, low 1109 birth weight, and small for gestational age (SGA) births. However, these data should be 1110 interpreted cautiously due to potential recall bias in the case-control studies and confounding by 1111 smoking and pregnancy signal symptoms. The DGAC recognizes that there is limited data to 1112 identify a level of caffeine intake beyond which risk increases. Based on the existing data, the 1113 risk of miscarriage, stillbirth, low birth weight, and SGA births is minimal given the average 1114 caffeine intake of pregnant women in the United States. DGAC Grade: Limited 1115 1116 Implications 1117
Overall, the evidence supports current recommendations to limit caffeine intake during 1118 pregnancy as a precaution. Based on existing evidence, women who are pregnant or planning to 1119 become pregnant should be cautious and adhere to current recommendations of the American 1120 Congress of Obstetricians and Gynecologists regarding caffeine consumption, and not consume 1121 more than 200 mg caffeine per day (approximately two cups of coffee per day). 1122 1123
Part D. Chapter 5: Food Sustainability and Safety
Scientific Report of the 2015 Dietary Guidelines Advisory Committee 31
Review of the Evidence 1124
Two SRs/MA assessed observational studies on the association of caffeine intake with adverse 1125 pregnancy outcomes.113, 114 The pregnancy outcomes included miscarriage, pre-term birth, 1126 stillbirth, SGA, and low birth weight. The most recent SR/MA by Greenwood et al. quantified 1127 the association between caffeine intake and adverse pregnancy outcomes from 60 publications 1128 from 53 separate cohort (26) and case-control (27) studies.113 The evidence covered a variety of 1129 countries with caffeine intake categories that ranged from non-consumers to those consuming 1130 more than 1,000 mg/day. They found that an increment of 100 mg caffeine was associated with a 1131 14 percent increased risk of miscarriage, 19 percent increased risk of stillbirth, 10 percent 1132 increased risk of SGA, and 7 percent increased risk of low birth weight. The risk of pre-term 1133 delivery was not increased significantly. The magnitude of these associations was relatively 1134 small within the range of caffeine intakes of the majority women in the study populations, and 1135 the associations became more pronounced at higher range (>300 mg/day). The authors also note 1136 the substantial heterogeneity observed in the meta-analyses shows that interpretation of the 1137 results should be cautious. In addition, the results from prospective cohort studies and case-1138 control studies were mixed together. Because coffee consumption is positively correlated with 1139 smoking, residual confounding by smoking may have biased the results toward a positive 1140 direction. 1141 1142 The other SR/MA assessed pre-term birth and the results were in agreement with Greenwood et 1143 al.113 Maslova et al. reviewed 22 studies (15 cohort and 7 case-control studies) and found no 1144 significant association between caffeine intake and risk of pre-term birth in either case-control or 1145 cohort studies.114 For all of the observational studies assessed across the SRs/MA, most studies 1146 did not adequately adjust for the pregnancy signal phenomenon, i.e. that nausea, vomiting, and 1147 other adverse symptoms are associated with a healthy pregnancy that results in a live birth, 1148 whereas pregnancy signal symptoms occur less frequently when the result is miscarriage. Coffee 1149 consumption decreases with increasing pregnancy signal symptoms, typically during the early 1150 weeks of pregnancy, and this severely confounds the association.115 Greenwood et al. state that 1151 this potential bias is the most prominent argument against a causal role for caffeine in adverse 1152 pregnancy outcomes.113 Only one randomized controlled trial of caffeine/coffee reduction during 1153 pregnancy has been conducted to date.116 The study found that in pregnant women who 1154 consumed at least three cups of coffee a day and were less than 20 weeks pregnant, a reduction 1155 of 200 mg of caffeine intake (~ 2 cups) per day did not significantly influence birth weight or 1156 length of gestation, compared to those with no decrease in caffeine consumption. The trial did 1157 not examine other outcomes. 1158 1159 For additional details on this body of evidence, visit: Appendix E-2.39a Evidence Portfolio, 1160 Appendix E-2.39b Systematic Review/Meta-Analysis Data Table, and References 113, 114 1161 1162 1163
Part D. Chapter 5: Food Sustainability and Safety
Scientific Report of the 2015 Dietary Guidelines Advisory Committee 32
Question 6: What is the relationship between high-dose coffee/caffeine 1164 consumption and health? 1165
Source of Evidence: Systematic reviews117, 118 1166 1167 Conclusion 1168
Evidence on the effects of excessive caffeine intake on the health of adults or children (>400 1169 mg/day for adults; undetermined for children and adolescents) is limited. Some evidence links 1170 high caffeine intake in the form of energy drinks to certain adverse outcomes, such as caffeine 1171 toxicity and cardiovascular events. Randomized controlled trials (RCTs) on the relationship 1172 between high-caffeine energy drinks and cardiovascular risk factors and other health outcomes 1173 report mixed results. Evidence also is limited on the health effects of mixing alcohol with energy 1174 drinks, but some evidence suggests that energy drinks may mask the effects of alcohol 1175 intoxication, so an individual may drink more and increase their risk of alcohol-related adverse 1176 events. DGAC Grade: Limited 1177 1178 Implications 1179
Early safety signals consisting of case reports of adverse events associated with high-caffeine 1180 drink consumption, including increased emergency room visits, indicate a potential public health 1181 problem. The DGAC agrees with the American Academy of Pediatrics and the American 1182 Medical Association that until safety has been demonstrated, limited or no consumption of high-1183 caffeine drinks, or other products with high amounts of caffeine, is advised for vulnerable 1184 populations, including children and adolescents. High-caffeine energy drinks and alcoholic 1185 beverages should not be consumed together, either mixed together or consumed at the same 1186 sitting. This is especially true for children and adolescents. 1187
Background 1188
According to the FDA, the upper limit of moderate caffeine intake in healthy adult populations 1189 (barring pregnant women) is 400 mg/day, with intakes higher than this being considered 1190 excessive caffeine consumption. The FDA has not defined moderate and excessive intake levels 1191 for children and adolescents. However, according to Health Canada, children should not 1192 consume more than 2.5 mg of caffeine per kg bodyweight per day.119 Although this guideline 1193 pertains only to children up to the age of 12 years, in the literature it is usually applied to 1194 children and adolescents of all ages. A caffeine threshold of 2.5 mg/kg/day would translate into 1195 around 37.5 mg/day for children ages 2 to 5 years with an average weight of 15 kg, 75 mg/day 1196 for youth ages 6 to 12 years with an average weight of 30 kg, and 137.5 mg/day for youth ages 1197 13 to 17 years with an average weight of 55 kg. 1198
1199
Part D. Chapter 5: Food Sustainability and Safety
Scientific Report of the 2015 Dietary Guidelines Advisory Committee 33
The main sources of caffeine among both adults and children are coffee, tea, and carbonated soft 1200 drinks. Another product, which has received a lot of attention recently as a potential source of 1201 excessive caffeine intake, especially among younger populations, is energy drinks.120 An energy 1202 drink is a beverage that contains caffeine as its active ingredient, along with other ingredients 1203 such as taurine, herbal supplements, vitamins, and sugar. It is usually marketed as a product that 1204 can improve energy, stamina, athletic performance, or concentration.121 Energy drinks are 1205 relatively new to the market and have evaded oversight and regulation by the FDA due to their 1206 classification as dietary supplements, or because their components are generally recognized as 1207 safe.121 Overall, these drinks are highly variable in caffeine content and some products have 1208 excessively high caffeine content (from 50 to 505 mg per can/bottle, with caffeine concentrations 1209 anywhere between 2.5 to 171 mg per fluid ounce).122 1210
1211 Health organizations including the American Academy of Pediatrics, the International Society of 1212 Sports Nutrition, and the American Medical Association have issued position statements on 1213 energy drinks, advising limited or no consumption among children and adolescents. Given the 1214 increasing evidence pointing toward harmful effects of excessive caffeine consumption,105-107 1215 the FDA requested the IOM to convene a workshop examining the science behind safe levels of 1216 caffeine intake. A report summarizing this workshop was recently published.123 Its main 1217 conclusions were: 1) Children and adolescents are a potential vulnerable group, in whom 1218 caffeine intake could have detrimental health consequences. This is particularly important given 1219 insufficient data on caffeine consumption in this demographic, which is increasingly getting 1220 exposed to new modes of caffeine intake such as energy drinks, 2) not enough is understood 1221 about potential interactions between caffeine and other ingredients commonly found in caffeine-1222 containing foods and beverages, and 3) more research is needed to identify individual differences 1223 in reactions to caffeine, especially in vulnerable populations, including children with underlying 1224 heart conditions and individuals with genetic predispositions to heart conditions. 1225
1226 The Center for Disease Control (CDC) recently reported on trends in caffeine intake over the 1227 past decade (1999-2010) among U.S. children, adolescents, and young adults.124 The CDC found 1228 that although energy drinks were not widely available before 1999, energy drinks made up nearly 1229 6 percent of caffeine intake in 2009-2010, indicating fast growth in U.S. consumption over a 1230 short period of time. When energy drink consumption was assessed in a nationally representative 1231 sample of U.S. secondary school students,125 35 percent of 8th graders, 30 percent of 10th graders, 1232 and 31 percent of 12th graders consumed energy drinks or shots, and consumption was higher for 1233 adolescent boys than girls. Furthermore, energy drink use was associated with higher prevalence 1234 of substance use, as assessed for all grades of U.S. secondary students. 1235
1236 Furthermore, a serious issue of public health concern has been the popular trend of combining 1237 energy drinks with alcoholic beverages. In 2010, the FDA determined that caffeine added to 1238 alcoholic beverages was not generally recognized as safe (GRAS), leading to withdrawal of 1239
Part D. Chapter 5: Food Sustainability and Safety
Scientific Report of the 2015 Dietary Guidelines Advisory Committee 34
premixed, caffeinated alcoholic beverages from the market.126 Currently, Health Canada caps 1240 caffeine levels for energy drinks at 100 mg/250 ml (~1 cup) and has determined that an energy 1241 drink container that cannot be resealed be treated as a single-serving container, because the total 1242 volume is usually consumed. They also have mandated that manufacturers add a warning to 1243 labels that energy drinks should not be combined with alcohol. Recently, the CDC has made 1244 public statements on the dangers of mixing alcohol and energy drinks. They indicate that high 1245 amounts of caffeine in energy drinks can mask the intoxicating effects of alcohol, while at the 1246 same time having no effect on the metabolism of alcohol by the liver. Therefore, high amounts of 1247 caffeine in energy drinks may result in an “awake” state of intoxication, thus increasing the risk 1248 of alcohol-related harm and injury (http://www.cdc.gov/alcohol/fact-sheets/cab.htm, March 1249 2014).127 1250 1251
Review of the Evidence 1252
Several case reports of adverse events related to energy drink use have been published. A recent 1253 systematic review of case reports of adverse cardiovascular events related to consumption of 1254 energy drinks documented 17 such published case reports.118 The cardiovascular events 1255 documented included atrial fibrillation, ventricular fibrillation, supraventricular tachycardia, 1256 prolonged QT, and ST elevation. In 41 percent of the cases, the person had consumed large 1257 amounts of energy drinks, and 29 percent of the cases were associated with consumption of 1258 energy drinks together with alcohol or other drugs. In 88 percent of the cases, no underlying 1259 cardiac condition was found that could potentially explain the cardiovascular event, although 1260 other cardiovascular risk factors co-occurred with energy drink consumption before the onset of 1261 the event in most cases. Of the cases that presented with serious adverse events, including 1262 cardiac arrest, the majority occurred with either acute heavy consumption of energy drinks or 1263 consumption in combination with alcohol or other drugs. Overall, the authors concluded that 1264 causality cannot be inferred from this case series, but physicians should routinely inquire about 1265 energy drink consumption in relevant cases and vulnerable consumers should be cautioned 1266 against heavy consumption of energy drinks or concomitant alcohol (or drug) ingestion. This 1267 systematic review is consistent with a recent report from the Drug Abuse Warning Network 1268 (DAWN) on energy drink-related emergency room visits that showed U.S. emergency room 1269 visits temporally related to energy drink consumption doubled between 2007 and 2011.128 These 1270 visits were attributed mainly to adverse reactions to energy drinks, but also to combinations with 1271 alcohol or drugs. It is generally agreed that adverse events associated with energy drink 1272 consumption are underreported. 1273
1274 Several short-term RCTs have examined the health effects of energy drink consumption. All of 1275 these have been carried out in adult populations, probably due to ethical constraints in providing 1276 energy drinks to children. Burrows et al. recently published a systematic review of RCTs 1277 examining this question.117 They found 15 such RCTS, examining the effect of variable doses of 1278
Scientific Report of the 2015 Dietary Guidelines Advisory Committee 35
energy drinks (mean dose: one and a half 250 ml cans per study session) with differing 1279 ingredient combinations and concentrations on a number of different health outcomes. The high 1280 variability in exposure and outcome definitions made a meta-analysis infeasible. Overall, they 1281 found no consistent effects of energy drinks on cardiorespiratory outcomes (heart rate, 1282 arrhythmias, blood pressure), pathological outcomes (blood glucose, blood lactate, free fatty 1283 acids, clinical safety markers), and body composition, with some studies showing positive, some 1284 inverse, and some no associations. For many of these outcomes, consistent results could not be 1285 stated due to only one study reporting on them. There was a slight indication of a potential 1286 positive effect of energy drinks on physiological outcomes (run time to exhaustion, peak oxygen 1287 uptake, resting energy expenditure). However, the authors concluded that more studies were 1288 needed before arriving at a definitive conclusion. Two of the studies assessed the simultaneous 1289 ingestion of alcohol and energy drinks.129, 130 One found that when compared with the ingestion 1290 of alcohol alone, the addition of an energy drink reduced individuals’ perception of impairment 1291 from alcohol, while at the same time, objective measures indicated ongoing deficits in motor 1292 coordination and visual acuity.129 Nor did energy drinks reduce breath alcohol concentration, 1293 indicating no change or increase in alcohol metabolism by the liver. Another study on energy 1294 drinks in combination with alcohol and exercise showed that during post-exercise recovery there 1295 was no effect on arrhythmias within 6 hours of energy drink ingestion in healthy young adults.130 1296
1297 Many of the these studies have methodological limitations, such as lack of a true control group 1298 (water or no drink), a very short follow-up duration of only a few hours, and small sample sizes, 1299 which could explain the inconsistent findings. In addition, many of these studies did not report 1300 whether they were commercially funded. Several of those that did report funding sources had 1301 financial conflicts of interest. Lastly, the doses of energy drinks used in these studies were not 1302 too high, resulting in caffeine intake levels that fell within the normal range. It is possible that 1303 excessive caffeine intake due to heavy energy drink consumption adversely affects several health 1304 outcomes, but this hypothesis was not clearly addressed by these studies. Hence it is difficult to 1305 ascertain the impact of excessive caffeine intake on health outcomes on the basis of these RCTs. 1306 In addition, very little data are available on the health effects of excessive caffeine consumption 1307 in pediatric populations. 1308
1309 For additional details on this body of evidence, visit: Appendix E-2.40 Evidence Portfolio and 1310 References 117, 118 1311
1312 1313
Question 7: What is the relationship between consumption of aspartame and 1314 health? 1315
Source of Evidence: Scientific Opinion on the re-evaluation of aspartame (E 951) as a food 1316 additive (2013), European Food Safety Authority (EFSA) Panel on Food Additives and Nutrient 1317 Sources added to Food 29 1318
Part D. Chapter 5: Food Sustainability and Safety
Scientific Report of the 2015 Dietary Guidelines Advisory Committee 36
Conclusion 1319
The DGAC generally concurs with the European Food Safety Authority (EFSA) Panel on Food 1320 Additives that aspartame in amounts commonly consumed is safe and poses minimal health risk 1321 for healthy individuals without phenylketonuria (PKU). DGAC Grade: Moderate 1322 1323 Limited and inconsistent evidence suggests a possible association between aspartame and risk of 1324 some hematopoietic cancers (non-Hodgkin lymphoma and multiple myeloma) in men, indicating 1325 the need for more long-term human studies. In addition, limited and inconsistent evidence 1326 indicates a potential for risk of preterm delivery. Due to very limited evidence it is not possible 1327 to draw any conclusions on the relationship between aspartame consumption and headaches. 1328 DGAC Grade: Limited 1329 1330 Implications 1331
If individuals choose to drink beverages that are sweetened with aspartame, they should stay 1332 below the aspartame Acceptable Daily Intake (ADI) of no more than 50 mg/kg/day (a 12-ounce 1333 diet beverage contains approximately 180 mg of aspartame).131 To be cautious, adults and 1334 children should be aware of the amount of aspartame they are consuming, given the need for 1335 more long-term human studies. Currently, most Americans are well below the ADI.132 1336 1337 Background 1338
Aspartame is the most common low-calorie sweetener used in the United States. It is found in 1339 numerous dietary sources. Although most commonly associated with low-calorie/low-sugar 1340 versions of carbonated and non-carbonated beverages, it also is found in low-calorie/low-sugar 1341 versions of canned fruits and juices; instant cereals; baked goods; ice cream and frozen ices; 1342 candy and chocolate products; jams, jellies, syrups, and condiments; yogurt; and beer. Non-1343 nutritive sweeteners are regulated by the FDA. The FDA has concluded that aspartame is safe as 1344 a general purpose sweetener in food.133 Given the high interest of the public in the safety of 1345 aspartame, the DGAC reviewed the EFSA report on the sweetener and health outcomes. 1346 1347 Review of the Evidence 1348
The most recent European Food Safety Authority report on the re-evaluation of aspartame as a 1349 food additive was used to address this question.29 The EFSA report based its evaluation on 1350 original study reports and information submitted following public calls for data, previous 1351 evaluations, and additional literature that became available up until the end of public consultation 1352 on November 15, 2013. The DGAC focused on results from human studies, not animal studies or 1353 studies conducted in vitro. The Mode of Action (MoA) analysis on reproductive and 1354
Part D. Chapter 5: Food Sustainability and Safety
Scientific Report of the 2015 Dietary Guidelines Advisory Committee 37
developmental toxicity of aspartame also was included. Although the EFSA report considered 1355 both published and unpublished studies, the DGAC considered only published studies. 1356 1357 Cancer 1358
A relatively limited body of evidence on human studies has directly addressed the relationship 1359 between aspartame consumption and cancer risk. The most consistent finding in six U.S. and 1360 European case-control studies134-139 was the absence of an adverse relationship between 1361 consumption of low-calorie sweeteners, including aspartame, and risk of some cancers. An 1362 exception was one study in Argentina that found a positive association between long-term use 1363 (≥10 y) of artificial sweeteners and risk of urinary tract tumors (UTT), compared to non-users; 1364 although for short-term users, no association was observed.134 1365 1366 The findings of two prospective cohort studies140, 141 were not consistent. Lim et al. examined a 1367 large cohort of men and women from the NIH-AARP Diet and Health study and found no 1368 association between consumption of aspartame-containing beverages and risk of overall 1369 hematopoietic cancers, brain cancers, or their subtypes.140 A second large prospective cohort 1370 study by Shernhammer et al. involved the Nurses’ Health Study (NHS) and Health Professionals 1371 Follow-up Study (HPFS) cohorts followed over 22 years with dietary intake measured every 4 1372 years.141 In this study, the highest category of aspartame intake (≥143 mg/day from diet soda and 1373 aspartame packets) was associated with significantly elevated risk of non-Hodgkin lymphoma 1374 (NHL) and of multiple myeloma in men, but not in women. Both of the prospective cohort 1375 studies that addressed cancer risk had limitations regarding generalizability. The NIH-AARP 1376 cohort had an age range of 50 to 71 years and was, therefore, not generalizable to the overall 1377 adult population. Additionally, the Panel considered the positive findings in Shernhammer et al. 1378 to be preliminary and require replication in other populations because the positive association 1379 between aspartame consumption and NHL was limited to men and lacked a clear dose-response 1380 relationship.29 1381 1382 Further investigation should be considered to ensure that no association exists between 1383 aspartame consumption and specific cancer risk. 1384 1385 Preterm Delivery 1386
Two European cohort studies were used in this evaluation. A large prospective cohort study by 1387 Halldorsson et al.142 from the Danish National Birth Cohort investigated associations between 1388 consumption of artificially sweetened and sugar-sweetened soft drinks during pregnancy and 1389 subsequent pre-term delivery. Also, a large prospective cohort study of Norwegian women by 1390 Englund-Ögge et al.143 investigated the relationship between consumption of artificially 1391 sweetened and sugar-sweetened soft drinks during the first 4 to 5 months of pregnancy and 1392 subsequent pre-term delivery. In addition, La Vecchia combined these two studies in a meta-1393 analysis that the Panel considered.144 1394
Part D. Chapter 5: Food Sustainability and Safety
Scientific Report of the 2015 Dietary Guidelines Advisory Committee 38
Regarding the Halldorsson study, significant trends in risk of pre-term delivery with increasing 1395 consumption of artificially sweetened drinks (carbonated and non-carbonated) were found, but 1396 not for sugar-sweetened drinks.142 In the highest exposure groups (≥ 4 servings/d) the odds ratios 1397 relative to non-consumption were 1.78 (95% CI: 1.19-2.66) and 1.29 (95% CI: 1.05-1.59), 1398 respectively, for carbonated and non-carbonated artificially sweetened drinks. Associations with 1399 consumption of artificially sweetened carbonated drinks did not differ according to whether 1400 delivery was very early (less than 32 weeks) or only moderately or late pre-term.142 The EFSA 1401 Panel noted that the prospective design and large size of the study sample were major strengths, 1402 and that the methods used had no important flaws.29 The Panel agreed with the authors who 1403 concluded that replication of their findings in another setting was warranted. 1404 1405 Regarding the Englund-Ögge study, no significant trends were found in risk of pre-term delivery 1406 with increasing consumption of artificially sweetened drinks or sugar-sweetened drinks.143 Small 1407 elevations of risk were observed with higher consumption of artificially sweetened soft drinks, 1408 but after adjustment for covariates, these reached significance only when categories of 1409 consumption were aggregated to four levels, and then the odds ratio for the highest category (≥ 1 1410 serving/day) was 1.11 (95% CI: 1.00-1.24) compared with non-consumption. This was driven by 1411 an increase in spontaneous but not medically induced pre-term delivery. Associations with sugar-1412 sweetened soft drinks tended to be stronger, with an adjusted odds ratio of 1.25 (95% CI: 1.08-1413 1.45) for consumption of at least 1 serving per day. The Panel noted that effects may have been 1414 underestimated because of inaccuracies in the assessment of dietary exposures, but the method 1415 was similar to that used by Halldorsson et al., and the same for sugar-sweetened as for artificially 1416 sweetened soft drinks.29 1417 1418 Behavior and Cognition 1419
Children 1420 Two RCTs145, 146 and two non-randomized controlled trials147, 148 conducted in the United States 1421 were included in the evidence on effects of aspartame on behavior and cognition in children. 1422 Wolraich et al. compared diets high in sucrose to diets high in aspartame in 25 preschool and 23 1423 primary school-age children and found that even when intake exceeded typical dietary levels, 1424 neither dietary sucrose nor aspartame affected children’s behavior or cognitive function.146 1425 Shaywitz et al. examined the effect of large doses of aspartame (10 times usual consumption) on 1426 behavioral/cognitive function in children with attention deficit disorder (ages 5 to 13 years) and 1427 found no effect of aspartame on cognitive, attentive, or behavioral testing.146 Roshon and Hagan 1428 examined 12 preschool children on alternate experimental days with a challenge of sucrose- or 1429 aspartame-containing drinks and found no significant differences in locomotion, task orientation, 1430 or learning.148 Lastly, Kruesi et al. investigated the effect of sugar, aspartame, saccharin, and 1431 glucose on disruptive behavior in 30 preschool boys on four separate experimental days.147 There 1432 was no significant difference in scores of aggression or observer’s ratings of behavior in 1433 response to any of the treatments. The limitations of this evidence were that all of the trials were 1434
Part D. Chapter 5: Food Sustainability and Safety
Scientific Report of the 2015 Dietary Guidelines Advisory Committee 39
approximately 20 to 30 years old, all had small sample sizes, and all were conducted over the 1435 short-term (1 day to 3 weeks). Overall, the Panel noted that no effects of aspartame on behavior 1436 and cognition were observed in children in these studies.29 1437 1438 Adults 1439 Seven studies on the effect of aspartame on adult behavior and cognition were included in this 1440 body of evidence. Five RCTs, one non-randomized controlled trial, and one case-control study 1441 were conducted in the United States. Two of these trials examined a single experimental dose of 1442 aspartame on one day.149, 150 Lapierre et al. examined 15 mg aspartame/kg body weight in 10 1443 healthy adults and found no significant differences between aspartame and placebo in cognition 1444 or memory during the study.149 Ryan-Harshman et al. tested 13 healthy adult men and found no 1445 change in any behavioral effects measured.150 A third randomized crossover trial examined 48 1446 adults over 20 days; half of the participants were given high dose aspartame (45 mg/kg/d) and 1447 half were given low dose aspartame (15 mg/kg/d).151 This study found no neuropsychologic, 1448 neurophysiologic, or behavioral effects linked to aspartame consumption. Two trials were 1449 conducted with pilots or college students to test cognitive abilities related to aviation tasks.152, 153 1450 In the first study, 12 pilots were given aspartame (50 mg/kg) or placebo and tested for aviation-1451 related information processing after a single treatment on one day. The authors detected no 1452 performance decrements associated with exposure to aspartame. In the follow-up study, college 1453 students were given repeated dosing of aspartame (50 mg/kg for 9 days) and tested for aviation-1454 related cognitive tasks. No impaired performance was observed. One non-randomized crossover 1455 trial examined the effects of aspartame on mood and well-being in 120 young college women 1456 and found no difference in changes in mood after consuming a 12-ounce water or aspartame-1457 sweetened beverage on a single day.154 Lastly, a case-control study was conducted with 40 adults 1458 with unipolar depression and a similar number of subjects without a psychiatric history.155 1459 Participants were given aspartame (30 mg/kg) or placebo for 7 days and individuals with 1460 depression reported an increase in severity of self-scored symptoms between aspartame and 1461 placebo; whereas the non-depressed matched subjects reported no difference. This suggested that 1462 individuals with mood disorders may be sensitive to aspartame. Overall, the Panel noted the 1463 limited number of participants, the short duration of the studies, and the inconsistency of the 1464 reporting of the results in all adult studies. However, despite these limitations, the Panel 1465 concluded that there was no evidence that aspartame affects behavior or cognitive function in 1466 adults.29 1467 1468 Other (Headaches, Seizures) 1469
Several studies examined headaches and seizures. A number of RCTs were conducted to assess 1470 the incidence of headache after consumption of aspartame. One RCT tested the effects of 1471 aspartame within 24 hours of consumption (30 mg/kg) on 40 subjects with a history of headache 1472 and found no difference in the incidence rate of headaches.156 Another RCT looked at the effect 1473 of aspartame on frequency and intensity of migraine headaches in 10 subjects with medical 1474
Part D. Chapter 5: Food Sustainability and Safety
Scientific Report of the 2015 Dietary Guidelines Advisory Committee 40
diagnosis of migraine headaches over 4 weeks.157 The authors found an increase in the frequency 1475 of migraine headaches with the aspartame treatment. In an RCT of 18 subjects with self-1476 described sensitivity to aspartame, the participants reported headaches on 33 percent of the days, 1477 compared with 24 percent with placebo.158 The authors concluded that a subset of the population 1478 may be susceptible to headaches induced by aspartame. Lastly, in a survey study of 171 patients 1479 at a headache unit, 8 percent reported that aspartame was a trigger of headaches compared to 2.3 1480 percent for carbohydrates and 50 percent for alcohol.159 Overall, the Panel concluded the 1481 possible effect of aspartame on headaches had been investigated in various studies which 1482 reported conflicting results, ranging from no effect to the suggestion that a small subset of the 1483 population may be susceptible to aspartame-induced headaches.29 The number of existing studies 1484 was small and not recent and several studies had high dropout rates. The Panel noted that 1485 because of the limitations of the studies, it was not possible to draw a conclusion on the 1486 relationship between aspartame consumption and headaches. 1487 1488 Several small studies assessed seizures. One RCT in children investigated whether aspartame 1489 would induce the occurrence of petit mal seizures.160 Ten children were given one treatment of 1490 aspartame at the ADI of 40 mg/kg and that treatment exacerbated the number of 1491 electroencephalogram spike waves per hour for these children without a history of seizures. In a 1492 second RCT, aspartame (34 mg/kg) was administered to 10 epileptic children over 2 weeks to 1493 examine the induction of seizures.145 No difference was found in the occurrence of seizures 1494 between aspartame and placebo exposure. Another RCT studied 18 subjects who claimed to have 1495 experienced epileptic seizures due to aspartame.161 One treatment (50 mg/kg) was administered 1496 on a single day and the authors reported no seizures or other adverse effect from aspartame 1497 treatment in this group. Overall, the Panel concluded that the available data do not provide 1498 evidence for a relationship between aspartame consumption and seizures.29 1499 1500 Pregnancy Outcomes: Mode of Action (MoA) analysis 1501
The EFSA Panel considered that adverse effects on reproduction and development reported for 1502 aspartame in animal studies could be attributed to the metabolite phenylalanine.29 They 1503 undertook a formal Mode of Action (MoA) analysis of the putative role of phenylalanine in 1504 developmental toxicity (as seen in animal studies). 1505 1506 Risk characterization was based on comparison of plasma phenylalanine levels following 1507 aspartame administration with plasma phenylalanine levels associated with developmental 1508 effects in children born from mothers with PKU. Current clinical practice guidelines recommend 1509 PKU patients restrict dietary intake of phenylalanine to keep plasma levels below 360μM. The 1510 EFSA Panel noted that intakes of aspartame as a food additive could occur at the same time as 1511 other dietary phenylalanine sources. Therefore, they considered the threshold used for 1512 comparisons should be lowered to allow for simultaneous intake of aspartame with meals. So 1513 plasma phenylalanine from the diet (120μM) was subtracted from 360μM to determine the 1514
Part D. Chapter 5: Food Sustainability and Safety
Scientific Report of the 2015 Dietary Guidelines Advisory Committee 41
maximum safe plasma concentration of phenylalanine that can be derived from aspartame 1515 (240μM). 1516 1517 The Panel considered that given these conservative assumptions, realistic dietary intake of 1518 aspartame and the confidence intervals provided by the modeling, the peak plasma phenylalanine 1519 levels would not exceed the clinical target threshold of 240μM when a normal individual 1520 consumed aspartame at or below the current ADI of 40 mg/kg body weight/day. Therefore, the 1521 Panel concluded there would not be a risk of adverse effects on pregnancy in the general 1522 population at the current ADI.29 1523 1524 For additional details on this body of evidence, visit: Appendix E-2.41 Evidence Portfolio and 1525 Scientific Opinion on the re-evaluation of aspartame (E 951) as a food additive (2013), 1526 European Food Safety Authority (EFSA) Panel on Food Additives and Nutrient Sources added to 1527 Food. Available at www.efsa.europa.eu/efsajournal 1528 1529 Question 8: What Consumer Behaviors Prevent Food Safety Problems? (Topic 1530 update from 2010) 1531
Introduction and Methods 1532
Food safety continues to be an issue of public health importance. Foodborne illness is a 1533 preventable, yet common issue affecting the U.S. population. Each year, approximately 1 in 6 1534 people in the U.S. population become ill, 128,000 are hospitalized, and 3,000 die of foodborne 1535 illness.162 It is critical to educate consumers and food producers on good techniques and 1536 behaviors for preventing food borne illness. 1537 1538 The 2010 DGAC conducted NEL systematic reviews for the Food Safety and Technology 1539 chapter and provided in-depth guidance on foodborne illness prevention. The 2015 DGAC 1540 reviewed the content related to consumer behavior and the prevention of food safety problems. 1541 The Committee determined that the majority of the 2010 food safety guidance was current and 1542 that only minor updates were necessary. For more information on the evidence review on food 1543 safety, refer to the DGAC 2010 report, Food Safety and Technology Section: 1544 (http://origin.www.cnpp.usda.gov/Publications/DietaryGuidelines/2010/DGAC/Report/D-8-1545 FoodSafety.pdf). 1546 1547 The four food safety principles—Clean, Separate, Cook, and Chill are the foundation of the Fight 1548 BAC!® campaign (www.fightbac.org) and are reemphasized in this report. Data from the Centers 1549 for Disease Control and Prevention,30 Food and Drug Administration,31 and the Food Safety and 1550 Inspection Service32 were used to update the 2010 DGAC tables on the following topics related 1551 to consumer behavior and food safety: 1552 1553
Scientific Report of the 2015 Dietary Guidelines Advisory Committee 42
CLEAN and SEPARATE (Tables D5.1, D5.2, D5.3) 1554 • Techniques for hand sanitation, washing fresh produce, and preventing cross-contamination. 1555
1556 COOK and CHILL (Table D5.4) 1557 • Temperature control during food preparation and storage. 1558
1559 Table D5.3 includes updated guidance on preventing cross-contamination from shopping to 1560 serving foods. Table D5.4 lists recommended internal temperatures for meat, seafood, eggs, and 1561 leftovers. Additionally, Tables D5.5 and D5.6 provide recommended techniques for using food 1562 and refrigerator/freezer thermometers. Specific changes made to the 2010 tables are detailed in 1563 the footnotes of the tables. 1564
Part D. Chapter 5: Food Sustainability and Safety
Scientific Report of the 2015 Dietary Guidelines Advisory Committee 43
Food Safety—Tables 1565 1566
Table D5.1. Recommended procedures for hand sanitation 1567 1568 When washing hands with soap and water:
• Wet your hands with clean, running water (warm or cold), turn off the tap, and apply soap.1
• Lather your hands by rubbing them together with the soap. Be sure to lather the backs of your hands, between your fingers, and under your nails.2
• Scrub your hands for at least 20 seconds. Need a timer? Hum the “Happy Birthday” song from beginning to end twice.3
• Rinse your hands well under clean, running water.
• Dry your hands using a clean towel or air dry them.4
If soap and clean, running water are not available, use an alcohol-based hand sanitizer that contains at least 60% alcohol5. Hand sanitizers are not as effective when hands are visibly dirty or greasy.6 How do you use hand sanitizer:7
• Apply the product to the palm of one hand (read the label to learn the correct amount).
• Rub your hands together.
• Rub the product over all surfaces of your hands and fingers until your hands are dry. 1569
Updates to the 2010 DGAC table 1570 1 Water temperature “warm or cold” and a conservation recommendation of ‘turn off the tap’ were added. 1571 2 The soap is to be help while lathering one’s hands, then rub all together. “Scrub all surfaces” was clarified to “the backs of hands, between fingers, and under nails.” 1572 3 “At least” was added to the 20 seconds time frame. To give a time reference, the suggestion to” hum the Happy Birthday song…” was added. 1573 4 The word ‘paper’ was removed as a modifier for towel, and instead it was specified to be a ‘clean’ towel. The option to ‘air dry them’ was added and the option of using an air 1574
dryer was removed from the phrase. Also removed was the direction to use your paper towel to turn off the faucet. 1575 5 The words ‘clean’ and ‘running’ were inserted in the directions for when water is not available. ‘Hand sanitizer that contains at least 60% alcohol’ replaces ‘gel’. 1576 6 This guidance was added. 1577
7 The following step was added, “Read the label to learn the correct amount.” 1578 1579
Source: Adapted from http://www.cdc.gov/handwashing/when-how-handwashing.html. Accessed June 2, 2014.30 1580 1581 1582
Scientific Report of the 2015 Dietary Guidelines Advisory Committee 44
Table D5.2. Recommended techniques for washing produce 1587 1588
When preparing any fresh produce, begin with clean hands. Wash your hands for at least 20 seconds with soap and warm water before and after preparation. Cut away any damaged or bruised areas on fresh fruits and vegetables before preparing and/or eating. Produce that looks rotten should be discarded. Wash all produce thoroughly under running water before eating, cutting or cooking. This includes produce grown conventionally or organically at home, or purchased from a grocery store or farmer's market. Washing fruits and vegetables with soap or detergent or using commercial produce washes is not recommended. Even if you plan to peel the produce before eating, it is still important to wash it first so dirt and bacteria are not transferred from the peel via the knife to the fruit or vegetable 1.
Scrub firm produce, such as melons and cucumbers, with a clean produce brush. Dry produce with a clean cloth towel or paper towel to further reduce bacteria that may be present. Many pre-cut, bagged, or packaged produce items like lettuce are pre-washed and ready-to-eat. If so, it will be stated on the package and you can use the product without further washing.
If you do choose to wash a product marked “pre-washed” and “ready-to-eat,” be sure to use safe handling practices to avoid any cross-contamination (see Table D5.3).
1589 Updates to the 2010 DGAC table 1590 1 The following explanation was provided: “. . . so dirt and bacteria aren’t transferred from the knife onto fruit or vegetable.” 1591 Source: Adapted from http://www.fda.gov/downloads/Food/ResourcesForYou/Consumers/UCM174142.pdf. Accessed June 2, 201431 1592 1593 1594 1595 1596 1597 1598 1599 1600 1601 1602 1603 1604 1605 1606 1607 1608 1609
Scientific Report of the 2015 Dietary Guidelines Advisory Committee 45
1610 Table D5.3. Recommended techniques for preventing cross-contamination 1611
1612 When Shopping: Separate raw meat, poultry, and seafood from other foods in your grocery-shopping cart. Place these foods in plastic bags to prevent their juices from dripping onto other foods. It is also best to separate these foods from other foods at check out and in your grocery bags. When Refrigerating Food1: Place raw meat, poultry, and seafood in containers or sealed plastic bags to prevent their juices from dripping onto other foods. Raw juices often contain harmful bacteria. Store eggs in their original carton and refrigerate as soon as possible. When Preparing Food: Washing raw poultry, beef, pork, lamb, or veal before cooking it is not recommended. Bacteria in raw meat and poultry juices can be spread to other foods, utensils, and surfaces. Wash hands and surfaces often. Harmful bacteria can spread throughout the kitchen and get onto cutting boards, utensils, and countertops. To prevent this:
• Wash hands with soap and warm water for 20 seconds before and after handling food, and after using the bathroom, changing diapers; or handling pets.
• Use hot, soapy water and paper towels or clean cloths to wipe up kitchen surfaces or spills. Wash cloths often in the hot cycle of your washing machine.
• Wash cutting boards, dishes, and counter tops with hot, soapy water after preparing each food item and before you go on to the next item.
• A solution of 1 tablespoon of unscented, liquid chlorine bleach per gallon of water may be used to sanitize surfaces and utensils.
Cutting Boards: Always use a clean cutting board. If possible, use one cutting board for fresh produce and a separate one for raw meat, poultry, and seafood. Once cutting boards become excessively worn or develop hard-to-clean grooves, they should be replaced. Marinating Food: Always marinate food in the refrigerator, not on the counter. Sauce that is used to marinate raw meat, poultry, or seafood should not be used on cooked foods, unless it is boiled just before using. When Serving Food: Always use a clean plate. Never place cooked food back on the same plate or cutting board that previously held raw food.
1613 Updates to the 2010 DGAC table 1614 1This sentence was deleted, ““When not possible, store raw animal foods below ready-to-eat foods and separate different types of raw animal foods, such as meat, poultry, 1615 and seafood from each other so that they do not cross-contaminate each other.” 1616 Source: Adapted from http://www.fsis.usda.gov/wps/portal/fsis/topics/food-safety-education/get-answers/food-safety-fact-sheets/safe-food-handling/washing-food-does-it-1617 promote-food-safety/washing-food and http://www.fsis.usda.gov/wps/portal/fsis/topics/food-safety-education/get-answers/food-safety-fact-sheets/safe-food-handling/be-1618 smart-keep-foods-apart/ct_index Accessed June 3, 2014.32 1619
Scientific Report of the 2015 Dietary Guidelines Advisory Committee 46
1620 Table D5.4. Recommended safe minimum internal temperatures 1621 Cook to the minimum internal temperatures below, as measured with a clean food thermometer before removing meat from the heat source. For 1622 safety and quality, allow meat to rest for at least three minutes before carving or consuming. For reasons of personal preference, consumers may 1623 choose to cook meat to higher temperatures.1 c 1624 1625
145 Poultrya Chicken and Turkey, whole 165 Poultry breasts, roasts 165 Poultry thighs, wings 165 Duck and Goose 165 Stuffing (cooked alone or in bird) 165 Fresh Porka 160 Hama Fresh (raw)3 145 Pre-cooked (to reheat) 140 Eggs and Egg Dishesa Eggs Cook until yolk and white are firm. Egg dishes 160 Fresh Seafood b Finfish 145 Cook fish until it is opaque (milky white) and flakes with a fork. Shellfish Cook shrimp, lobster, and scallops until they reach their appropriate color. The flesh of shrimp and lobster should be an
opaque (milky white) color. Scallops should be opaque (milky white) and firm. Cook clams, mussels, and oysters until their shells open. This means that they are done. Throw away the ones that didn't open.
Shucked clams and shucked oysters are fully cooked when they are opaque (milky white) and firm4.
Leftovers and Casserolesa 165 1626
Part D. Chapter 5: Food Sustainability and Safety
Scientific Report of the 2015 Dietary Guidelines Advisory Committee 47
Updates to the 2010 DGAC table 1627 1 An introductory paragraph was added on the topic of allowing for a three-minute rest period after cooking meat. 1628 2 Pork was added to the list of fresh meats. 1629 3 Fresh (raw) ham was added to the table. 1630 4 Information on cooking status of shucked clams and oysters was added. 1631 Sources: 1632 a http://www.fsis.usda.gov/wps/portal/fsis/topics/food-safety-education/get-answers/food-safety-fact-sheets/safe-food-handling/kitchen-companion-your-safe-food- 1633
handbook/ct_index. Accessed June 3, 2014.32 1634 b http://www.fda.gov/Food/ResourcesForYou/HealthEducators/ucm082294.htm. Accessed June 3, 2014.31 1635 c http://www.fsis.usda.gov/wps/wcm/connect/8e9f95a6-fd35-42d3-b6cb-b07a4b853992/Leftovers_and_Food_Safety.pdf?MOD=AJPERES. Accessed June 3, 2014.32 1636
1637 1638
Table D5.5. Recommended techniques for food thermometers 1639 1640
To be safe, meat, poultry, and egga and seafoodb products must be cooked to a safe minimum internal temperature to destroy any harmful microorganisms that may be in the food. A food thermometer should also be used to ensure that cooked food is held at safe temperatures until served. Cold foods should be held at 40°F or below. Hot foods should be kept hot at 140°F or above.a Most available food thermometers will give an accurate reading within 2 to 4°F. The reading will only be correct, however, if the thermometer is placed in the proper location in the food. a In general, the food thermometer should be placed in the thickest part of the food, away from bone, fat, or gristle.a
When the food being cooked is irregularly shaped, such as with a beef roast, check the temperature in several places. Egg dishes and dishes containing ground meat and poultry should be checked in several places.a
When measuring the temperature of a thin food, such as a hamburger patty, pork chop, or chicken breast, a thermistor or thermocouple food thermometer should be used, if possible. a
However, if using an "instant-read" dial bimetallic-coil food thermometer, the probe must be inserted in the side of the food so the entire sensing area (usually 2 to 3 inches) is positioned through the center of the food.a
To avoid burning fingers, it may be helpful to remove the food from the heat source (if cooking on a grill or in a frying pan) and insert the food thermometer sideways after placing the item on a clean spatula or plate.a
Food thermometers should be washed with hot soapy water. Most thermometers should not be immersed in water.a
Sources: a http://www.fsis.usda.gov/wps/portal/fsis/topics/food-safety-education/get-answers/food-safety-fact-sheets/appliances-and-thermometers/kitchen-1641 thermometers/ct_index., Accessed June 3, 2014.32 1642 b http://www.fda.gov/Food/ResourcesForYou/HealthEducators/ucm082294.htm , Accessed June 3, 2014.31 1643 1644 1645 1646
Scientific Report of the 2015 Dietary Guidelines Advisory Committee 48
Table D5.6. Recommended techniques for using refrigerator/freezer thermometers 1647 1648
For safety, it is important to verify the temperature of refrigerators and freezers. Refrigerators should maintain a temperature no higher than 40°F. Frozen food will hold its top quality for the longest possible time when the freezer maintains 0°F or below.
To measure the temperature in the refrigerator: Put the thermometer in a glass of water and place in the middle of the refrigerator. Wait 5 to 8 hours. If the temperature is not 38 to 40°F, adjust the refrigerator temperature control. Check again after 5 to 8 hours. To measure the temperature in the freezer: Place the thermometer between frozen food packages. Wait 5 to 8 hours. If the temperature is not 0 to 2°F, adjust the freezer temperature control. Check again after 5 to 8 hours. An appliance thermometer can be kept in the refrigerator and freezer to monitor the temperature at all times. This can be critical in the event of a power outage. When the power goes back on, if the refrigerator is still 40°F and the freezer is 0°F or below, the food is safe1.
1649 Updates to the 2010 DGAC table 1650 1 When referring to the correct freezer temperature, ‘or below’ was added after ‘zero degrees Fahrenheit.’ 1651 1652 Source: http://www.fsis.usda.gov/wps/portal/fsis/topics/food-safety-education/get-answers/food-safety-fact-sheets/appliances-and-thermometers/appliance-1653 thermometers/appliance-thermometers. , Accessed June 3, 2014.32 1654
Scientific Report of the 2015 Dietary Guidelines Advisory Committee 49
CHAPTER SUMMARY 1675 Access to sufficient, nutritious, and safe food is an essential element of food security for the U.S. 1676 population. A sustainable diet is one that assures this access for both the current population and 1677 future generations. This chapter focused on evaluating the evidence around sustainable diets and 1678 several topic areas of food safety. 1679 1680 The major findings regarding sustainable diets were that a diet higher in plant-based foods, such 1681 as vegetables, fruits, whole grains, legumes, nuts, and seeds, and lower in calories and animal-1682 based foods is more health promoting (as discussed in Part B. Chapter 2: 2015 DGAC Themes 1683 and Recommendations: Integrating the Evidence) and is associated with less environmental 1684 impact than is the current U.S. diet. This pattern of eating can be achieved through a variety of 1685 dietary patterns, including the “Healthy U.S.-style Pattern,” the “Healthy Mediterranean-style 1686 Pattern,” and the “Healthy Vegetarian Pattern” (see Part D. Chapter 1: Food and Nutrient 1687 Intakes, and Health: Current Status and Trends for a description of these patterns). All of these 1688 dietary patterns are aligned with lower predicted environmental impacts and provide food 1689 options that can be adopted by the U.S. population. Current evidence shows that the average U.S. 1690 diet has a potentially larger environmental impact in terms of increased GHG emissions, land 1691 use, water use, and energy use, compared to the above dietary patterns. This is because the 1692 current U.S. population intake of animal-based foods is higher and the plant-based foods are 1693 lower, than proposed in these three dietary patterns. Of note is that no food groups need to be 1694 eliminated completely to improve food sustainability outcomes. 1695 1696 A moderate amount of seafood is an important component of two of three of these dietary 1697 patterns, and has demonstrated health benefits. The seafood industry is in the midst of rapid 1698 expansion to meet worldwide demand, although capture fishery production has leveled off while 1699 aquaculture is expanding. The collapse of some fisheries due to overfishing in the past decades 1700 has raised concern about the ability to produce a safe and affordable supply. In addition, concern 1701 has been raised about the safety and nutrient content of farm-raised versus wild-caught seafood. 1702 To supply enough seafood to support meeting dietary recommendations, both farm-raised and 1703 wild caught seafood will be needed. The review of the evidence demonstrated, in the species 1704 evaluated, that farm-raised seafood has as much or more EPA and DHA per serving than wild 1705 caught. Low-trophic seafood, such as catfish and crawfish, regardless of whether wild caught or 1706 farm-raised seafood, have less than half the EPA and DHA per serving than high-trophic 1707 seafood, such as salmon and trout. 1708 1709 Regarding contaminants, for the majority of wild caught and farmed species, neither the risks of 1710 mercury nor organic pollutants outweigh the health benefits of seafood consumption. Consistent 1711 evidence demonstrated that wild caught fisheries that have been managed sustainably have 1712 remained stable over the past several decades; however, wild caught fisheries are fully exploited 1713 and their continuing productivity will require careful management nationally and internationally 1714
Part D. Chapter 5: Food Sustainability and Safety
Scientific Report of the 2015 Dietary Guidelines Advisory Committee 50
to avoid long-term collapse. Expanded supply of seafood nationally and internationally will be 1715 dependent upon the increase of farm-raised seafood worldwide. 1716 1717 The impact of food production, processing, and consumption on environmental sustainability is 1718 an area of research that is rapidly evolving. As further research is conducted and best practices 1719 evaluated, additional evidence will inform both supply-side participants and consumers on how 1720 best to shift behaviors locally, nationally, and globally to support sustainable diets. Linking 1721 health, dietary guidance and the environment will promote human health and the sustainability of 1722 natural resources and ensure current and long-term food security. 1723 1724 In regards to food safety, updated and previously unexamined areas of food safety were studied. 1725 No previous DGACs have reported on coffee/caffeine consumption and health. Currently, strong 1726 evidence shows that consumption of coffee within the moderate range (3 to 5 cups per day or up 1727 to 400 mg/d caffeine) is not associated with increased long-term health risks among healthy 1728 individuals. In fact, consistent evidence indicates that coffee consumption is associated with 1729 reduced risk of type 2 diabetes and cardiovascular disease in healthy adults. Moreover, moderate 1730 evidence shows a protective association between coffee/caffeine intake and risk of Parkinson’s 1731 disease. Therefore, moderate coffee consumption can be incorporated into a healthy dietary 1732 pattern, along with other healthful behaviors. To meet the growing demand of coffee, there is a 1733 need to consider sustainability issues of coffee production in economic and environmental terms. 1734 However, it should be noted that coffee as it is normally consumed can contain added calories 1735 from cream, milk, and added sugars. Care should be taken to minimize the amount of calories 1736 from added sugars and high-fat dairy or dairy substitutes added to coffee. 1737 1738 The marketing and availability of high-caffeine beverages and products is on the rise. 1739 Unfortunately, only limited evidence is currently available to ascertain the safety of high caffeine 1740 intake (greater than 400 mg/day for adults and undetermined for children and adolescents), that 1741 may occur with rapid consumption of large-sized energy drinks. The limited data suggest adverse 1742 health outcomes, such as caffeine toxicity and cardiovascular events. Concern is heightened 1743 when caffeine is combined with alcoholic beverages. Limited or no consumption of high caffeine 1744 drinks, or other products with high amounts of caffeine, is advised for children and adolescents. 1745 Energy drinks with high levels of caffeine and alcoholic beverages should not be consumed 1746 together, either mixed together or consumed at the same sitting. 1747 1748 The DGAC also examined the food additive aspartame. At the level that the U.S. population 1749 consumes aspartame, it appears to be safe. However, some uncertainty continues about increased 1750 risk of hematopoietic cancers in men, indicating a need for more research. 1751 1752
Part D. Chapter 5: Food Sustainability and Safety
Scientific Report of the 2015 Dietary Guidelines Advisory Committee 51
Individual behaviors along with sound government policies and responsible private sector 1753 practices are all needed to reduce foodborne illnesses. To that end, the DGAC updated the 1754 established recommendations for handling foods at home. 1755 1756 1757 NEEDS FOR FUTURE RESEARCH 1758
Dietary Patterns and Sustainability 1759
1. Conduct research to determine whether sustainable diets are affordable and accessible to all 1760 sectors of the population and how this can be improved, including how policy strategies 1761 could influence the supply chain (all steps from farm to plate) to affect this improvement. 1762
Rationale: Ensuring that sustainable diets are accessible and affordable to all sectors of the 1763 population is important to promote food security. 1764
1765 2. Develop, conduct, and evaluate in-depth analyses of U.S. domestic dietary patterns and 1766
determine the degree to which sustainability practices, domestically and internationally, are 1767 important to food choice and how to increase public awareness of the impact of food choices 1768 on environmental outcomes. 1769
Rationale: Understanding consumer choice across demographic groups and the degree to 1770 which either health and/or sustainability is a significant decisional criterion as well as the 1771 degree to which choice theory can be used to improve choices will be important to helping 1772 drive change. 1773
1774 3. Develop a robust understanding of how production practices, supply chain decisions, 1775
consumer behaviors, and waste disposal affect the environmental sustainability of various 1776 practices across the USDA food components of MyPlate. 1777
Rationale: Developing sustainable production and supply chain practices for all parts of 1778 MyPlate, especially meat and dairy products will be important to reduce their environmental 1779 impact. 1780
1781 4. Determine the potential economic benefits and challenges to supply chain stakeholders in 1782
relationship to findings in Research Recommendation 3. 1783
Rationale: Experience demonstrates that many practices over the past few decades that 1784 improve the environmental footprint of, for example, production practices, also have led to 1785 improved profit (e.g., Integrated Pest Management to reduce pesticide use in many fruit and 1786 vegetables). It is important to know how changes will affect profit to help enable future 1787 policy in both the private and public spheres. 1788
1789
Part D. Chapter 5: Food Sustainability and Safety
Scientific Report of the 2015 Dietary Guidelines Advisory Committee 52
Seafood Sustainability 1790
5. Conduct research on methods to ensure the maintenance of nutrient profiles of high-trophic 1791 level farmed seafood and improve nutrient profiles of low-trophic farmed seafood 1792 concurrently with research to improve production efficacy. 1793
Rationale: The evidence supporting healthfulness of seafood consumption is based on 1794 consumption of predominantly wild caught species. Many popular low-trophic level farmed 1795 seafood have nutrient profiles that depend on feeds. Efficient production of seafood with 1796 nutrient profiles that are known to be healthful should be emphasized. 1797
1798 6. Conduct research to develop methods to ensure contaminant levels in all seafood remain at 1799
levels similar to or lower than at present. Maintain monitoring of contaminant levels for 1800 capture fisheries to ensure that levels caused by pollution do not rise appreciably. This 1801 research should include developing effective rapid response approaches if the quality of 1802 seafood supply is acutely affected. 1803
Rationale: Current research findings support the contention that contaminant levels are 1804 generally well below those that significantly alter the healthfulness of seafood. As industry 1805 naturally improves efficiency, feeds and environmental conditions should be monitored to 1806 maintain or reduce priority contaminants and insure significant new contaminants do not 1807 enter the seafood supply. 1808
1809 1810
Usual Caffeine/Coffee Intake 1811
7. Evaluate the effects of coffee on health outcomes in vulnerable populations, such as women 1812 who are pregnant (premature birth, low birth weight, spontaneous abortion). 1813
Rationale: Given the limited evidence of the effects of coffee/caffeine consumption on 1814 pregnancy outcomes, future studies need to establish safe levels of coffee/caffeine 1815 consumption during pregnancy. 1816 1817
8. Examine the effects of coffee on sleep patterns, quality of life, and dependency and 1818 addiction. 1819
Rationale: Because coffee is a known stimulant, future research should examine the effect of 1820 coffee/caffeine on sleep quality, dependency, addiction, and overall quality of life measures. 1821 1822
9. Evaluate the prospective association between coffee/caffeine consumption and cancer at 1823 different sites. 1824
Rationale: Large well-conducted prospective cohort studies that adequately control for 1825 smoking (status and dosage) and other potential confounders are needed to understand the 1826
Part D. Chapter 5: Food Sustainability and Safety
Scientific Report of the 2015 Dietary Guidelines Advisory Committee 53
association of coffee (caffeinated and decaffeinated) with cancer at different sites. 1827 1828
10. Examine prospectively the effects of coffee/caffeine on cognitive decline, neurodegenerative 1829 diseases, and depression. 1830
Rationale: Neurodegenerative diseases affect millions of people worldwide and more than 1831 five million Americans are living with Alzheimer’s disease. Given the limited evidence of 1832 coffee/caffeine on neurodegenerative diseases, well-designed prospective studies should 1833 examine the association of coffee/caffeine consumption on cognitive decline, depression, and 1834 Alzheimer’s disease. 1835 1836
11. Understand the mechanisms underlying the protective effects of coffee on diabetes and CVD. 1837
Rationale: Evidence for a biological plausibility for coffee on risk of type 2 diabetes and 1838 CVD stems primarily from animal studies. Randomized controlled trials in humans should 1839 evaluate the effect of coffee/caffeine on measures of glycemia, insulin sensitivity, endothelial 1840 dysfunction, and inflammation. 1841 1842
12. Understand the association between coffee and health outcomes in individuals with existing 1843 CVD, diabetes, cancer, neurodegenerative diseases, or depressive symptoms. 1844
Rationale: Strong evidence supports a protective effect of moderate coffee consumption on 1845 chronic disease risk in healthy adults, but its association among those with existing diseases 1846 has been less studied. Given that a substantial number of people suffer from these chronic 1847 diseases, the role of coffee in preventing other health outcomes in such groups remains 1848 understudied. 1849 1850
High-dose Caffeine Intake 1851
13. Define excessive caffeine intake and safe levels of consumption for children, adolescents, 1852 and young adults. 1853
Rationale: Current research on caffeine and health outcomes has focused primarily on 1854 adults. Given the increasing prevalence of energy drink consumption among children, 1855 adolescents, and young adults, research is needed to identify safe levels of consumption in 1856 these groups. 1857 1858
14. Determine the prevalence of excessive caffeine intake in children and adults beyond intake of 1859 energy drinks. 1860
Rationale: Data on the sources (other than energy drinks) and doses of caffeine intake in 1861 children and adults are limited. Identifying the sources and safe levels of consumption will 1862 help in formulating policy and framing recommendations. 1863
Part D. Chapter 5: Food Sustainability and Safety
Scientific Report of the 2015 Dietary Guidelines Advisory Committee 54
1864 15. Examine the effect of excessive consumption of caffeine and energy drinks on health 1865
outcomes in both children and adults. 1866
Rationale: Prospective studies of associations of excessive caffeine and energy drink intake 1867 with health outcomes in children and adults are necessary, as randomized controlled trials are 1868 not be feasible given ethical constraints. 1869 1870
16. Conduct observational studies to examine the health effects of alcohol mixed with energy 1871 drinks. 1872
Rationale: In recent years, consumption of alcohol energy drinks by adolescents has resulted 1873 in emergency room admissions and deaths. No data exist on the prospective association 1874 between consumption of alcohol energy drinks and health outcomes in both adolescents and 1875 adults. 1876 1877
Aspartame 1878
17. Examine the risks of aspartame related to some cancers, especially hematopoietic ones, and 1879 pregnancy outcomes. 1880
Rationale: Limited and inconsistent evidence suggests a possible association between 1881 aspartame and risk of hematopoietic cancers (non-Hodgkin lymphoma and multiple 1882 myeloma) in men, indicating the need for long-term human studies. Additionally, limited and 1883 inconsistent evidence indicates a potential for risk of preterm delivery, which warrants 1884 further research. 1885
1886 1887 REFERENCES 1888 1889 1. Food and Agriculture Organization of the United Nations. Rome Declaration on World 1890
Food Security and World Food Summit Plan of Action. Rome, Italy,1996. Available 1891 from: http://www.fao.org/docrep/003/w3613e/w3613e00.htm. 1892
2. Food And Agriculture Organization Of The United Nations. International Scientific 1893 Symposium Biodiversity And Sustainable Diets United Against Hunger. Rome,2010. 1894 Available from: http://www.fao.org/ag/humannutrition/28506-1895 0efe4aed57af34e2dbb8dc578d465df8b.pdf. 1896
3. United Nations Environment Programme. UNEP Year Book: Emerging Issues In Our 1897 Global Environment 2012. Available from: www.unep.org/yearbook/2012/. 1898
4. Nellemann C, MacDevette, M., Manders, T., Eickhout, B., , Svihus B, Prins, A. G., 1899 Kaltenborn, B. P. (Eds). The environmental food crisis – The environment’s role in 1900 averting future food crises. A UNEP rapid response assessment United Nations 1901 Environment Programme, GRID-Arendal; 2009. Available from: www.grida.no. 1902
Part D. Chapter 5: Food Sustainability and Safety
Scientific Report of the 2015 Dietary Guidelines Advisory Committee 55
5. Burlingame B, Dernini S. Sustainable diets: the Mediterranean diet as an example. Public 1903 Health Nutr. 2011;14(12A):2285-7. PMID: 22166185. 1904 http://www.ncbi.nlm.nih.gov/pubmed/22166185. 1905
6. World Wildlife Federation. Livewell: a balance of healthy and sustainable food choices 1906 2011. Available from: http://assets.wwf.org.uk/downloads/livewell_report_jan11.pdf. 1907
7. Heller MC, Keoleian GA, Willett WC. Toward a life cycle-based, diet-level framework 1908 for food environmental impact and nutritional quality assessment: a critical review. 1909 Environ Sci Technol. 2013;47(22):12632-47. PMID: 24152032. 1910 http://www.ncbi.nlm.nih.gov/pubmed/24152032. 1911
8. United States Department of Agriculture. A Series of Systematic Reviews on the 1912 Relationship Between Dietary Patterns and Health Outcomes 2014. Available from: 1913 http://www.nel.gov/vault/2440/web/files/DietaryPatterns/DPRptFullFinal.pdf. 1914
9. Eshel G, Shepon A, Makov T, Milo R. Land, irrigation water, greenhouse gas, and 1915 reactive nitrogen burdens of meat, eggs, and dairy production in the United States. Proc 1916 Natl Acad Sci U S A. 2014;111(33):11996-2001. PMID: 25049416. 1917 http://www.ncbi.nlm.nih.gov/pubmed/25049416. 1918
10. Heller MCaK, G. A. . Greenhouse Gas Emission Estimates of U.S. Dietary Choices and 1919 Food Loss. Journal of Industrial Ecology. 2014. 1920
11. Tilman D, Clark M. Global diets link environmental sustainability and human health. 1921 Nature. 2014. PMID: 25383533. http://www.ncbi.nlm.nih.gov/pubmed/25383533. 1922
12. Health Council of the Netherlands. Guidelines for a healthy diet: the ecological 1923 perspective. 2011. publication no. 2011/08E. ISBN 978-90-5549-845-1:[Available from: 1924 http://www.gezondheidsraad.nl/sites/default/files/201108E.pdf. 1925
13. Nordic Council of Ministers. Nordic Council of Ministers Secretariat. Nordic Nutrition 1926 Recommendations 2012: Integrating nutrition and physical activity. Available from: 1927 http://norden.diva-portal.org/smash/get/diva2:704251/FULLTEXT01.pdf. 1928
14. German Council for Sustainable Development. The Sustainable Shopping Basket: A 1929 guide to better shopping. 2013. Available from: 1930 http://www.nachhaltigkeitsrat.de/uploads/media/Brochure_Sustainable_Shopping_Basket1931 _01.pdf. 1932
15. Institute of Medicine. Sustainable Diets: Food for Healthy People and a Healthy Planet: 1933 Workshop Summary. Washington, DC: The National Academies Press; 2014. Available 1934 from: http://www.nap.edu/openbook.php?record_id=18578&page=R2. 1935
16. National Research Council. Toward sustainable agricultural systems in the 21st century 1936 Washington, DC: The National Academies Press; 2010. Available from: 1937 http://www.nap.edu/openbook.php?record_id=12832. 1938
17. Nordin SM, Boyle M, Kemmer TM, Academy of N, Dietetics. Position of the academy of 1939 nutrition and dietetics: nutrition security in developing nations: sustainable food, water, 1940 and health. J Acad Nutr Diet. 2013;113(4):581-95. PMID: 23522578. 1941 http://www.ncbi.nlm.nih.gov/pubmed/23522578. 1942
18. Sustainable Development Commission, editor. Looking back, Looking Forward: 1943 Sustainability and UK food policy 2000 – 20112011. 1944
19. United Nations DfSD. Open Working Group proposal for Sustainable Development 1945 Goals 2014. Available from: 1946 http://sustainabledevelopment.un.org/content/documents/1579SDGs%20Proposal.pdf. 1947
Part D. Chapter 5: Food Sustainability and Safety
Scientific Report of the 2015 Dietary Guidelines Advisory Committee 56
20. FAO Fisheries and Aquaculture Department Food and Agriculture Organization of the 1948 United Nations. The State of World Fisheries and Aquaculture Rome,2012. Available 1949 from: http://www.fao.org/docrep/016/i2727e/i2727e.pdf. 1950
21. Higgins JPT GSe. Cochrane Handbook for Systematic Reviews of Interventions Version 1951 5.1.0: The Cochrane Collaboration; 2011. Available from: www.cochrane-handbook.org. 1952
22. Drummond MF, Jefferson TO. Guidelines for authors and peer reviewers of economic 1953 submissions to the BMJ. The BMJ Economic Evaluation Working Party. BMJ. 1954 1996;313(7052):275-83. PMID: 8704542. 1955 http://www.ncbi.nlm.nih.gov/pubmed/8704542. 1956
23. Eddy D. The role of mathematical modelling in Assessing medical technology,. 1957 Technology Assessment. 1985:144-54. 1958
24. Stevenson M, Lloyd-Jones M, Morgan MY, Wong R. Non-invasive diagnostic 1959 assessment tools for the detection of liver fibrosis in patients with suspected alcohol-1960 related liver disease: a systematic review and economic evaluation. Health Technol 1961 Assess. 2012;16(4):1-174. PMID: 22333291. 1962 http://www.ncbi.nlm.nih.gov/pubmed/22333291. 1963
25. U.S. Department of Agriculture ARS. USDA National Nutrient Database for Standard 1964 Reference, Release 27. Nutrient Data Laboratory Home Page2014. 1965
26. Cladis DP, Kleiner AC, Freiser HH, Santerre CR. Fatty Acid Profiles of Commercially 1966 Available Finfish Fillets in the United States. Lipids. 2014. PMID: 25108414. 1967 http://www.ncbi.nlm.nih.gov/pubmed/25108414. 1968
27. Food and Agriculture Organization of the United Nations; Geneva WHO. Report of the 1969 Joint FAO/WHO Expert Consultation on the Risks and Benefits of Fish Consumption. 1970 Rome. 2011. 1971
28. Aromataris E, Pearson A. The systematic review: an overview. Am J Nurs. 1972 2014;114(3):53-8. PMID: 24572533. http://www.ncbi.nlm.nih.gov/pubmed/24572533. 1973
29. European Food Safety Authority (EFSA). Food Additives and Nutrient Sources Added 1974 to food Panel. Scientific Opinion on the re-evaluation of aspartame (E 951) as a food 1975 additive. Parma, Italy,2013. Available from: 1976 http://www.efsa.europa.eu/en/efsajournal/doc/3496.pdf. 1977
30. Centers for Disease Control and Prevention. Handwashing: Clean Hands Save Lives 1978 2013. Available from: http://www.cdc.gov/handwashing/. 1979
31. Food and Drug Administration. Food Safety for Moms-to-Be: Safe Eats - Meat, Poultry 1980 & Seafood 2014 [cited 2014 June 3]. Available from: 1981 http://www.fda.gov/Food/ResourcesForYou/HealthEducators/ucm082294.htm. 1982
32. United States Department of Agriculture. Food Safety Inspection Service. Food Safety 1983 Fact Sheets 2013 [cited 2014 June 3]. Available from: 1984 http://www.fsis.usda.gov/wps/portal/fsis/topics/food-safety-education/get-answers/food-1985 safety-fact-sheets. 1986
33. International Organisation for Standardisation. Environmental management – Life cycle 1987 assessment – principles and framework, Geneva, Switzerland 2006a. 1988
34. Aston LM, Smith JN, Powles JW. Impact of a reduced red and processed meat dietary 1989 pattern on disease risks and greenhouse gas emissions in the UK: a modelling study. BMJ 1990 Open. 2012;2(5). PMID: 22964113. http://www.ncbi.nlm.nih.gov/pubmed/22964113. 1991
35. Baroni L, Cenci L, Tettamanti M, Berati M. Evaluating the environmental impact of 1992 various dietary patterns combined with different food production systems. Eur J Clin 1993
Part D. Chapter 5: Food Sustainability and Safety
Scientific Report of the 2015 Dietary Guidelines Advisory Committee 57
36. Barosh L, Friel S, Engelhardt K, Chan L. The cost of a healthy and sustainable diet--who 1996 can afford it? Aust N Z J Public Health. 2014;38(1):7-12. PMID: 24494938. 1997 http://www.ncbi.nlm.nih.gov/pubmed/24494938. 1998
37. de Carvalho AM, Cesar CL, Fisberg RM, Marchioni DM. Excessive meat consumption in 1999 Brazil: diet quality and environmental impacts. Public Health Nutr. 2013;16(10):1893-9. 2000 PMID: 22894818. http://www.ncbi.nlm.nih.gov/pubmed/22894818. 2001
38. Hendrie GA, Ridoutt BG, Wiedmann TO, Noakes M. Greenhouse gas emissions and the 2002 Australian diet--comparing dietary recommendations with average intakes. Nutrients. 2003 2014;6(1):289-303. PMID: 24406846. http://www.ncbi.nlm.nih.gov/pubmed/24406846. 2004
39. Macdiarmid JI, Kyle J, Horgan GW, Loe J, Fyfe C, Johnstone A, et al. Sustainable diets 2005 for the future: Can we contribute to reducing greenhouse gas emissions by eating a 2006 healthy diet? Am J Clin Nutr. 2012;96(3):632-9. PMID: 22854399. 2007 http://www.ncbi.nlm.nih.gov/pubmed/22854399. 2008
40. Meier T, Christen O. Environmental impacts of dietary recommendations and dietary 2009 styles: Germany as an example. Environ Sci Technol. 2013;47(2):877-88. PMID: 2010 23189920. http://www.ncbi.nlm.nih.gov/pubmed/23189920. 2011
41. Peters CJ, Wilkins JL, Fick GW. Testing a complete-diet model for estimating the land 2012 resource requirements of food consumption and agricultural carrying capacity: The New 2013 York State example. Renewable agriculture and food systems. 2007;22(2):145-53. 2014 http://journals.cambridge.org/action/displayAbstract?fromPage=online&aid=1091328&fi2015 leId=S1742170507001767. 2016
42. Pimentel D, Pimentel M. Sustainability of meat-based and plant-based diets and the 2017 environment. Am J Clin Nutr. 2003;78(3 Suppl):660S-3S. PMID: 12936963. 2018 http://www.ncbi.nlm.nih.gov/pubmed/12936963. 2019
43. Pradhan P, Reusser DE, Kropp JP. Embodied greenhouse gas emissions in diets. PLoS 2020 One. 2013;8(5):e62228. PMID: 23700408. 2021 http://www.ncbi.nlm.nih.gov/pubmed/23700408. 2022
44. Saez-Almendros S, Obrador B, Bach-Faig A, Serra-Majem L. Environmental footprints 2023 of Mediterranean versus Western dietary patterns: beyond the health benefits of the 2024 Mediterranean diet. Environ Health. 2013;12:118. PMID: 24378069. 2025 http://www.ncbi.nlm.nih.gov/pubmed/24378069. 2026
45. Scarborough P, Allender S, Clarke D, Wickramasinghe K, Rayner M. Modelling the 2027 health impact of environmentally sustainable dietary scenarios in the UK. Eur J Clin 2028 Nutr. 2012;66(6):710-5. PMID: 22491494. 2029 http://www.ncbi.nlm.nih.gov/pubmed/22491494. 2030
46. van Dooren C, Marinussen M, Blonk H, Aiking H, Vellinga P. Exploring dietary 2031 guidelines based on ecological and nutritional values: A comparison of six dietary 2032 patterns. Food Policy. 2014;44(0):36-46. 2033 http://www.sciencedirect.com/science/article/pii/S0306919213001620. 2034
47. Vieux F, Soler LG, Touazi D, Darmon N. High nutritional quality is not associated with 2035 low greenhouse gas emissions in self-selected diets of French adults. Am J Clin Nutr. 2036 2013;97(3):569-83. PMID: 23364012. http://www.ncbi.nlm.nih.gov/pubmed/23364012. 2037
48. Wilson N, Nghiem N, Ni Mhurchu C, Eyles H, Baker MG, Blakely T. Foods and dietary 2038 patterns that are healthy, low-cost, and environmentally sustainable: a case study of 2039
Part D. Chapter 5: Food Sustainability and Safety
Scientific Report of the 2015 Dietary Guidelines Advisory Committee 58
optimization modeling for New Zealand. PLoS One. 2013;8(3):e59648. PMID: 2040 23544082. http://www.ncbi.nlm.nih.gov/pubmed/23544082. 2041
49. Bellows AC, Alcaraz VG, Hallman WK. Gender and food, a study of attitudes in the 2042 USA towards organic, local, U.S. grown, and GM-free foods. Appetite. 2010;55(3):540-2043 50. PMID: 20851727. http://www.ncbi.nlm.nih.gov/pubmed/20851727. 2044
50. Blonk H, Ponsioen, T., Kool, A., Marinussen, M. The Agri-Foorprint Method; 2045 Methodological LCA Framework, Assumptions and Applied Data, Version 1.0. 2011. 2046
51. International Organisation for Standardisation. ISO 14044: Environmental management – 2047 Life cycle assessment – requirements and guidelines 2006b. Available from: 2048 http://www.iso.org/iso/catalogue_detail?csnumber=38498. 2049
52. Goedkoop M SR. The Eco-Indicator 99, A Damage Oriented Method for Life Cycle 2050 Assessment Methodology Report 2000. Available from: 2051 http://teclim.ufba.br/jsf/indicadores/holan%20ecoindicator%2099.pdf. 2052
53. Micha R, Wallace SK, Mozaffarian D. Red and processed meat consumption and risk of 2053 incident coronary heart disease, stroke, and diabetes mellitus: a systematic review and 2054 meta-analysis. Circulation. 2010;121(21):2271-83. PMID: 20479151. 2055 http://www.ncbi.nlm.nih.gov/pubmed/20479151. 2056
54. Norat T CD, Lau R, Aune D, Vieira R. WCRF/AICR Systematic Literature Review 2057 Continuous Update Project Report:The Associations between Food, Nutrition and 2058 Physical Activity and the Risk of Colorectal Cancer, 2010. Available from: 2059 http://www.dietandcancerreport.org/cancer_resource_center/downloads/cu/Colorectal-2060 Cancer-SLR-2010.pdf. 2061
55. Wiseman M. The second World Cancer Research Fund/American Institute for Cancer 2062 Research expert report. Food, nutrition, physical activity, and the prevention of cancer: a 2063 global perspective. Proc Nutr Soc. 2008;67(3):253-6. PMID: 18452640. 2064 http://www.ncbi.nlm.nih.gov/pubmed/18452640. 2065
56. U.S. Department of Agriculture and U.S. Department of Health and Human Services. 2066 Dietary Guidelines for Americans, 2010. 7th ed. Washington, DC: U.S. Government 2067 Printing Office; December 2010. 2068
57. National Oceanic and Atmospheric Administration. Fisheries of the United States 2011. 2069 Available from: http://www.st.nmfs.noaa.gov/st1/fus/fus11/FUS_2011.pdf. 2070
58. Bouman AF BA, Overbeek CC, D. P. Bureau, M. Pawlowski,, Gilbert. aPM. Hindcasts 2071 and future projections of global inland and coastal nitrogen and phosphorus loads due to 2072 finfish aquaculture. Reviews in Fisheries Science. 2013;21(2):112-56. 2073
59. Hall S, Delaporte A, Phillips MJ, Beveridge M, O’Keefe, M. Blue frontiers: Managing 2074 the Environmental Costs of Aquaculture. WorldFish Center, 2011. 2075
60. National Oceanic and Atmospheric Administration. Fish Watch: US Seafood Facts [cited 2076 2014 June 14]. Available from: 2077 http://www.fishwatch.gov/farmed_seafood/outside_the_us.htm. 2078
61. Food and Drug Administration. Fish: What Pregnant Women and Parents Should Know: 2079 Draft Updated Advice by FDA and EPA 2014. Available from: 2080 http://www.fda.gov/Food/FoodborneIllnessContaminants/Metals/ucm393070.htm. 2081
62. United States Environmental Protection Agency. What You Need to Know about 2082 Mercury in Fish and Shellfish 2004. Available from: 2083 http://water.epa.gov/scitech/swguidance/fishshellfish/outreach/advice_index.cfm. 2084
Part D. Chapter 5: Food Sustainability and Safety
Scientific Report of the 2015 Dietary Guidelines Advisory Committee 59
63. LaComb RP SR, Wilkinson Enns C, Goldman JD. Beverage Choices of U.S. Adults: 2085 What We Eat In America, NHANES 2007-2008. 2011. 2086
64. Crippa A, Discacciati A, Larsson SC, Wolk A, Orsini N. Coffee consumption and 2087 mortality from all causes, cardiovascular disease, and cancer: a dose-response meta-2088 analysis. Am J Epidemiol. 2014;180(8):763-75. PMID: 25156996. 2089 http://www.ncbi.nlm.nih.gov/pubmed/25156996. 2090
65. Je Y, Giovannucci E. Coffee consumption and total mortality: a meta-analysis of twenty 2091 prospective cohort studies. Br J Nutr. 2014;111(7):1162-73. PMID: 24279995. 2092 http://www.ncbi.nlm.nih.gov/pubmed/24279995. 2093
66. Malerba S, Turati F, Galeone C, Pelucchi C, Verga F, La Vecchia C, et al. A meta-2094 analysis of prospective studies of coffee consumption and mortality for all causes, 2095 cancers and cardiovascular diseases. Eur J Epidemiol. 2013;28(7):527-39. PMID: 2096 23934579. http://www.ncbi.nlm.nih.gov/pubmed/23934579. 2097
67. Ding M, Bhupathiraju SN, Satija A, van Dam RM, Hu FB. Long-term coffee 2098 consumption and risk of cardiovascular disease: a systematic review and a dose-response 2099 meta-analysis of prospective cohort studies. Circulation. 2014;129(6):643-59. PMID: 2100 24201300. http://www.ncbi.nlm.nih.gov/pubmed/24201300. 2101
68. Sofi F, Conti AA, Gori AM, Eliana Luisi ML, Casini A, Abbate R, et al. Coffee 2102 consumption and risk of coronary heart disease: a meta-analysis. Nutr Metab Cardiovasc 2103 Dis. 2007;17(3):209-23. PMID: 17156982. 2104 http://www.ncbi.nlm.nih.gov/pubmed/17156982. 2105
69. Wu JN, Ho SC, Zhou C, Ling WH, Chen WQ, Wang CL, et al. Coffee consumption and 2106 risk of coronary heart diseases: a meta-analysis of 21 prospective cohort studies. Int J 2107 Cardiol. 2009;137(3):216-25. PMID: 18707777. 2108 http://www.ncbi.nlm.nih.gov/pubmed/18707777. 2109
70. Kim B, Nam Y, Kim J, Choi H, Won C. Coffee Consumption and Stroke Risk: A Meta-2110 analysis of Epidemiologic Studies. Korean J Fam Med. 2012;33(6):356-65. PMID: 2111 23267421. http://www.ncbi.nlm.nih.gov/pubmed/23267421. 2112
71. Larsson SC, Orsini N. Coffee consumption and risk of stroke: a dose-response meta-2113 analysis of prospective studies. Am J Epidemiol. 2011;174(9):993-1001. PMID: 2114 21920945. http://www.ncbi.nlm.nih.gov/pubmed/21920945. 2115
72. Mesas AE, Leon-Munoz LM, Rodriguez-Artalejo F, Lopez-Garcia E. The effect of coffee 2116 on blood pressure and cardiovascular disease in hypertensive individuals: a systematic 2117 review and meta-analysis. Am J Clin Nutr. 2011;94(4):1113-26. PMID: 21880846. 2118 http://www.ncbi.nlm.nih.gov/pubmed/21880846. 2119
73. Noordzij M, Uiterwaal CS, Arends LR, Kok FJ, Grobbee DE, Geleijnse JM. Blood 2120 pressure response to chronic intake of coffee and caffeine: a meta-analysis of randomized 2121 controlled trials. J Hypertens. 2005;23(5):921-8. PMID: 15834273. 2122 http://www.ncbi.nlm.nih.gov/pubmed/15834273. 2123
74. Steffen M, Kuhle C, Hensrud D, Erwin PJ, Murad MH. The effect of coffee consumption 2124 on blood pressure and the development of hypertension: a systematic review and meta-2125 analysis. J Hypertens. 2012;30(12):2245-54. PMID: 23032138. 2126 http://www.ncbi.nlm.nih.gov/pubmed/23032138. 2127
75. Zhang Z, Hu G, Caballero B, Appel L, Chen L. Habitual coffee consumption and risk of 2128 hypertension: a systematic review and meta-analysis of prospective observational studies. 2129
Part D. Chapter 5: Food Sustainability and Safety
Scientific Report of the 2015 Dietary Guidelines Advisory Committee 60
Am J Clin Nutr. 2011;93(6):1212-9. PMID: 21450934. 2130 http://www.ncbi.nlm.nih.gov/pubmed/21450934. 2131
76. Cai L, Ma D, Zhang Y, Liu Z, Wang P. The effect of coffee consumption on serum 2132 lipids: a meta-analysis of randomized controlled trials. Eur J Clin Nutr. 2012;66(8):872-7. 2133 PMID: 22713771. http://www.ncbi.nlm.nih.gov/pubmed/22713771. 2134
77. Jee SH, He J, Appel LJ, Whelton PK, Suh I, Klag MJ. Coffee consumption and serum 2135 lipids: a meta-analysis of randomized controlled clinical trials. Am J Epidemiol. 2136 2001;153(4):353-62. PMID: 11207153. http://www.ncbi.nlm.nih.gov/pubmed/11207153. 2137
78. Caldeira D, Martins C, Alves LB, Pereira H, Ferreira JJ, Costa J. Caffeine does not 2138 increase the risk of atrial fibrillation: a systematic review and meta-analysis of 2139 observational studies. Heart. 2013;99(19):1383-9. PMID: 24009307. 2140 http://www.ncbi.nlm.nih.gov/pubmed/24009307. 2141
79. Mostofsky E, Rice MS, Levitan EB, Mittleman MA. Habitual coffee consumption and 2142 risk of heart failure: a dose-response meta-analysis. Circ Heart Fail. 2012;5(4):401-5. 2143 PMID: 22740040. http://www.ncbi.nlm.nih.gov/pubmed/22740040. 2144
80. Ding M, Bhupathiraju SN, Chen M, van Dam RM, Hu FB. Caffeinated and decaffeinated 2145 coffee consumption and risk of type 2 diabetes: a systematic review and a dose-response 2146 meta-analysis. Diabetes Care. 2014;37(2):569-86. PMID: 24459154. 2147 http://www.ncbi.nlm.nih.gov/pubmed/24459154. 2148
81. Huxley R, Lee CM, Barzi F, Timmermeister L, Czernichow S, Perkovic V, et al. Coffee, 2149 decaffeinated coffee, and tea consumption in relation to incident type 2 diabetes mellitus: 2150 a systematic review with meta-analysis. Arch Intern Med. 2009;169(22):2053-63. PMID: 2151 20008687. http://www.ncbi.nlm.nih.gov/pubmed/20008687. 2152
82. Jiang X, Zhang D, Jiang W. Coffee and caffeine intake and incidence of type 2 diabetes 2153 mellitus: a meta-analysis of prospective studies. Eur J Nutr. 2014;53(1):25-38. PMID: 2154 24150256. http://www.ncbi.nlm.nih.gov/pubmed/24150256. 2155
83. van Dam RM, Hu FB. Coffee consumption and risk of type 2 diabetes: a systematic 2156 review. Jama. 2005;294(1):97-104. PMID: 15998896. 2157 http://www.ncbi.nlm.nih.gov/pubmed/15998896. 2158
84. Whitehead N, White H. Systematic review of randomised controlled trials of the effects 2159 of caffeine or caffeinated drinks on blood glucose concentrations and insulin sensitivity 2160 in people with diabetes mellitus. J Hum Nutr Diet. 2013;26(2):111-25. PMID: 23331476. 2161 http://www.ncbi.nlm.nih.gov/pubmed/23331476. 2162
85. Yu X, Bao Z, Zou J, Dong J. Coffee consumption and risk of cancers: a meta-analysis of 2163 cohort studies. BMC Cancer. 2011;11:96. PMID: 21406107. 2164 http://www.ncbi.nlm.nih.gov/pubmed/21406107. 2165
86. Tang N, Wu Y, Ma J, Wang B, Yu R. Coffee consumption and risk of lung cancer: a 2166 meta-analysis. Lung Cancer. 2010;67(1):17-22. PMID: 19362749. 2167 http://www.ncbi.nlm.nih.gov/pubmed/19362749. 2168
87. Sang LX, Chang B, Li XH, Jiang M. Consumption of coffee associated with reduced risk 2169 of liver cancer: a meta-analysis. BMC Gastroenterol. 2013;13:34. PMID: 23433483. 2170 http://www.ncbi.nlm.nih.gov/pubmed/23433483. 2171
88. Bravi F, Bosetti C, Tavani A, Gallus S, La Vecchia C. Coffee reduces risk for 2172 hepatocellular carcinoma: an updated meta-analysis. Clin Gastroenterol Hepatol. 2173 2013;11(11):1413-21.e1. PMID: 23660416. 2174 http://www.ncbi.nlm.nih.gov/pubmed/23660416. 2175
Part D. Chapter 5: Food Sustainability and Safety
Scientific Report of the 2015 Dietary Guidelines Advisory Committee 61
89. Jiang W, Wu Y, Jiang X. Coffee and caffeine intake and breast cancer risk: an updated 2176 dose-response meta-analysis of 37 published studies. Gynecol Oncol. 2013;129(3):620-9. 2177 PMID: 23535278. http://www.ncbi.nlm.nih.gov/pubmed/23535278. 2178
90. Li XJ, Ren ZJ, Qin JW, Zhao JH, Tang JH, Ji MH, et al. Coffee consumption and risk of 2179 breast cancer: an up-to-date meta-analysis. PLoS One. 2013;8(1):e52681. PMID: 2180 23308117. http://www.ncbi.nlm.nih.gov/pubmed/23308117. 2181
91. Tang N, Zhou B, Wang B, Yu R. Coffee consumption and risk of breast cancer: a 2182 metaanalysis. Am J Obstet Gynecol. 2009;200(3):290.e1-9. PMID: 19114275. 2183 http://www.ncbi.nlm.nih.gov/pubmed/19114275. 2184
92. Cao S, Liu L, Yin X, Wang Y, Liu J, Lu Z. Coffee consumption and risk of prostate 2185 cancer: a meta-analysis of prospective cohort studies. Carcinogenesis. 2014;35(2):256-2186 61. PMID: 24343360. http://www.ncbi.nlm.nih.gov/pubmed/24343360. 2187
93. Zhong S, Chen W, Yu X, Chen Z, Hu Q, Zhao J. Coffee consumption and risk of prostate 2188 cancer: an up-to-date meta-analysis. Eur J Clin Nutr. 2014;68(3):330-7. PMID: 2189 24300907. http://www.ncbi.nlm.nih.gov/pubmed/24300907. 2190
94. Discacciati A, Orsini N, Wolk A. Coffee consumption and risk of nonaggressive, 2191 aggressive and fatal prostate cancer--a dose-response meta-analysis. Ann Oncol. 2192 2014;25(3):584-91. PMID: 24276028. http://www.ncbi.nlm.nih.gov/pubmed/24276028. 2193
95. Park CH, Myung SK, Kim TY, Seo HG, Jeon YJ, Kim Y. Coffee consumption and risk 2194 of prostate cancer: a meta-analysis of epidemiological studies. BJU Int. 2010;106(6):762-2195 9. PMID: 20590551. http://www.ncbi.nlm.nih.gov/pubmed/20590551. 2196
96. Braem MG, Onland-Moret NC, Schouten LJ, Tjonneland A, Hansen L, Dahm CC, et al. 2197 Coffee and tea consumption and the risk of ovarian cancer: a prospective cohort study 2198 and updated meta-analysis. Am J Clin Nutr. 2012;95(5):1172-81. PMID: 22440851. 2199 http://www.ncbi.nlm.nih.gov/pubmed/22440851. 2200
97. Bravi F, Scotti L, Bosetti C, Gallus S, Negri E, La Vecchia C, et al. Coffee drinking and 2201 endometrial cancer risk: a metaanalysis of observational studies. Am J Obstet Gynecol. 2202 2009;200(2):130-5. PMID: 19110217. http://www.ncbi.nlm.nih.gov/pubmed/19110217. 2203
98. Je Y, Giovannucci E. Coffee consumption and risk of endometrial cancer: findings from 2204 a large up-to-date meta-analysis. Int J Cancer. 2012;131(7):1700-10. PMID: 22190017. 2205 http://www.ncbi.nlm.nih.gov/pubmed/22190017. 2206
99. Zhou Y, Tian C, Jia C. A dose-response meta-analysis of coffee consumption and bladder 2207 cancer. Prev Med. 2012;55(1):14-22. PMID: 22564775. 2208 http://www.ncbi.nlm.nih.gov/pubmed/22564775. 2209
100. Turati F, Galeone C, Edefonti V, Ferraroni M, Lagiou P, La Vecchia C, et al. A meta-2210 analysis of coffee consumption and pancreatic cancer. Ann Oncol. 2012;23(2):311-8. 2211 PMID: 21746805. http://www.ncbi.nlm.nih.gov/pubmed/21746805. 2212
101. Dong J, Zou J, Yu XF. Coffee drinking and pancreatic cancer risk: a meta-analysis of 2213 cohort studies. World J Gastroenterol. 2011;17(9):1204-10. PMID: 21448427. 2214 http://www.ncbi.nlm.nih.gov/pubmed/21448427. 2215
102. Turati F, Galeone C, La Vecchia C, Garavello W, Tavani A. Coffee and cancers of the 2216 upper digestive and respiratory tracts: meta-analyses of observational studies. Ann Oncol. 2217 2011;22(3):536-44. PMID: 20943597. http://www.ncbi.nlm.nih.gov/pubmed/20943597. 2218
103. Zheng JS, Yang J, Fu YQ, Huang T, Huang YJ, Li D. Effects of green tea, black tea, and 2219 coffee consumption on the risk of esophageal cancer: a systematic review and meta-2220
Part D. Chapter 5: Food Sustainability and Safety
Scientific Report of the 2015 Dietary Guidelines Advisory Committee 62
104. Botelho F, Lunet N, Barros H. Coffee and gastric cancer: systematic review and meta-2223 analysis. Cad Saude Publica. 2006;22(5):889-900. PMID: 16680342. 2224 http://www.ncbi.nlm.nih.gov/pubmed/16680342. 2225
105. Galeone C, Turati F, La Vecchia C, Tavani A. Coffee consumption and risk of colorectal 2226 cancer: a meta-analysis of case-control studies. Cancer Causes Control. 2227 2010;21(11):1949-59. PMID: 20680435. 2228 http://www.ncbi.nlm.nih.gov/pubmed/20680435. 2229
106. Je Y, Liu W, Giovannucci E. Coffee consumption and risk of colorectal cancer: a 2230 systematic review and meta-analysis of prospective cohort studies. Int J Cancer. 2231 2009;124(7):1662-8. PMID: 19115212. http://www.ncbi.nlm.nih.gov/pubmed/19115212. 2232
107. Li G, Ma D, Zhang Y, Zheng W, Wang P. Coffee consumption and risk of colorectal 2233 cancer: a meta-analysis of observational studies. Public Health Nutr. 2013;16(2):346-57. 2234 PMID: 22694939. http://www.ncbi.nlm.nih.gov/pubmed/22694939. 2235
108. Costa J, Lunet N, Santos C, Santos J, Vaz-Carneiro A. Caffeine exposure and the risk of 2236 Parkinson's disease: a systematic review and meta-analysis of observational studies. J 2237 Alzheimers Dis. 2010;20 Suppl 1:S221-38. PMID: 20182023. 2238 http://www.ncbi.nlm.nih.gov/pubmed/20182023. 2239
109. Ishihara L, Brayne C. A systematic review of nutritional risk factors of Parkinson's 2240 disease. Nutr Res Rev. 2005;18(2):259-82. PMID: 19079910. 2241 http://www.ncbi.nlm.nih.gov/pubmed/19079910. 2242
110. Qi H, Li S. Dose-response meta-analysis on coffee, tea and caffeine consumption with 2243 risk of Parkinson's disease. Geriatr Gerontol Int. 2014;14(2):430-9. PMID: 23879665. 2244 http://www.ncbi.nlm.nih.gov/pubmed/23879665. 2245
111. Arab L, Khan F, Lam H. Epidemiologic evidence of a relationship between tea, coffee, or 2246 caffeine consumption and cognitive decline. Adv Nutr. 2013;4(1):115-22. PMID: 2247 23319129. http://www.ncbi.nlm.nih.gov/pubmed/23319129. 2248
112. Santos C, Costa J, Santos J, Vaz-Carneiro A, Lunet N. Caffeine intake and dementia: 2249 systematic review and meta-analysis. J Alzheimers Dis. 2010;20 Suppl 1:S187-204. 2250 PMID: 20182026. http://www.ncbi.nlm.nih.gov/pubmed/20182026. 2251
113. Greenwood DC, Thatcher NJ, Ye J, Garrard L, Keogh G, King LG, et al. Caffeine intake 2252 during pregnancy and adverse birth outcomes: a systematic review and dose-response 2253 meta-analysis. Eur J Epidemiol. 2014;29(10):725-34. PMID: 25179792. 2254 http://www.ncbi.nlm.nih.gov/pubmed/25179792. 2255
114. Maslova E, Bhattacharya S, Lin SW, Michels KB. Caffeine consumption during 2256 pregnancy and risk of preterm birth: a meta-analysis. Am J Clin Nutr. 2010;92(5):1120-2257 32. PMID: 20844077. http://www.ncbi.nlm.nih.gov/pubmed/20844077. 2258
115. Peck JD, Leviton A, Cowan LD. A review of the epidemiologic evidence concerning the 2259 reproductive health effects of caffeine consumption: a 2000-2009 update. Food Chem 2260 Toxicol. 2010;48(10):2549-76. PMID: 20558227. 2261 http://www.ncbi.nlm.nih.gov/pubmed/20558227. 2262
116. Bech BH, Obel C, Henriksen TB, Olsen J. Effect of reducing caffeine intake on birth 2263 weight and length of gestation: randomised controlled trial. BMJ. 2007;334(7590):409. 2264 PMID: 17259189. http://www.ncbi.nlm.nih.gov/pubmed/17259189. 2265
Part D. Chapter 5: Food Sustainability and Safety
Scientific Report of the 2015 Dietary Guidelines Advisory Committee 63
117. Burrows T, Pursey K, Neve M, Stanwell P. What are the health implications associated 2266 with the consumption of energy drinks? A systematic review. Nutr Rev. 2013;71(3):135-2267 48. PMID: 23452281. http://www.ncbi.nlm.nih.gov/pubmed/23452281. 2268
118. Goldfarb M, Tellier C, Thanassoulis G. Review of published cases of adverse 2269 cardiovascular events after ingestion of energy drinks. Am J Cardiol. 2014;113(1):168-2270 72. PMID: 24176062. http://www.ncbi.nlm.nih.gov/pubmed/24176062. 2271
119. Government of Canada. Health Canada Health Products. Food Branch. Food Directorate. 2272 Caffeine in Foods 2012 [updated 2012-02-16]. Available from: http://www.hc-2273 sc.gc.ca/fn-an/securit/addit/caf/food-caf-aliments-eng.php. 2274
120. Pomeranz JL, Munsell CR, Harris JL. Energy drinks: an emerging public health hazard 2275 for youth. J Public Health Policy. 2013;34(2):254-71. PMID: 23486464. 2276 http://www.ncbi.nlm.nih.gov/pubmed/23486464. 2277
121. Seifert SM, Schaechter JL, Hershorin ER, Lipshultz SE. Health effects of energy drinks 2278 on children, adolescents, and young adults. Pediatrics. 2011;127(3):511-28. PMID: 2279 21321035. http://www.ncbi.nlm.nih.gov/pubmed/21321035. 2280
123. Institute of Medicine. Caffeine in Food and Dietary Supplements: Examining Safety: 2284 Workshop Summary. Washington, DC: The National Academies Press; 2014. Available 2285 from: http://www.nap.edu/openbook.php?record_id=18607. 2286
124. Branum AM, Rossen LM, Schoendorf KC. Trends in caffeine intake among U.S. children 2287 and adolescents. Pediatrics. 2014;133(3):386-93. PMID: 24515508. 2288 http://www.ncbi.nlm.nih.gov/pubmed/24515508. 2289
125. Terry-McElrath YM, O'Malley PM, Johnston LD. Energy drinks, soft drinks, and 2290 substance use among United States secondary school students. J Addict Med. 2291 2014;8(1):6-13. PMID: 24481080. http://www.ncbi.nlm.nih.gov/pubmed/24481080. 2292
126. Arria AM, O'Brien MC. The "high" risk of energy drinks. Jama. 2011;305(6):600-1. 2293 PMID: 21266673. http://www.ncbi.nlm.nih.gov/pubmed/21266673. 2294
127. Centers for Disease Control and Prevention. Caffeine and Alcohol. 2014. Available 2295 from: http://www.cdc.gov/alcohol/fact-sheets/cab.htm. 2296
128. Substance Abuse Mental Health Services Administration. Drug Abuse Warning Network 2297 (DAWN), 2011: National Estimates of Drug-Related Emergency Department 2298 Visits.HHS. Publication No. (SMA) 13-4760, DAWN Series D-39 Rockville, MD2013. 2299 Available from: http://www.samhsa.gov/data/2k13/DAWN2k11ED/DAWN2k11ED.htm. 2300
129. Ferreira SE, de Mello MT, Pompéia S, de Souza-Formigoni ML. Effects of energy drink 2301 ingestion on alcohol intoxication. Alcohol Clin Exp Res. 2006;30(4):598-605. PMID: 2302 16573577. http://www.ncbi.nlm.nih.gov/pubmed/16573577. 2303
130. Wiklund U, Karlsson M, Ostrom M, Messner T. Influence of energy drinks and alcohol 2304 on post-exercise heart rate recovery and heart rate variability. Clin Physiol Funct 2305 Imaging. 2009;29(1):74-80. PMID: 19016812. 2306 http://www.ncbi.nlm.nih.gov/pubmed/19016812. 2307
131. Food and Drug Administration. Food additives permitted for direct addition to food for 2308 human consumption: aspartame. Federal Register1984. 2309
132. Magnuson BA, Burdock GA, Doull J, Kroes RM, Marsh GM, Pariza MW, et al. 2310 Aspartame: a safety evaluation based on current use levels, regulations, and toxicological 2311
Part D. Chapter 5: Food Sustainability and Safety
Scientific Report of the 2015 Dietary Guidelines Advisory Committee 64
133. Food And Drug Administration. Food Additives Permitted for Direct Addition to Food 2314 for Human Consumption 2014. Available from: 2315 http://www.accessdata.fda.gov/scripts/cdrh/cfdocs/cfcfr/cfrsearch.cfm?fr=172.804. 2316
134. Andreatta MM, Munoz SE, Lantieri MJ, Eynard AR, Navarro A. Artificial sweetener 2317 consumption and urinary tract tumors in Cordoba, Argentina. Prev Med. 2008;47(1):136-2318 9. PMID: 18495230. http://www.ncbi.nlm.nih.gov/pubmed/18495230. 2319
135. Bosetti C, Gallus S, Talamini R, Montella M, Franceschi S, Negri E, et al. Artificial 2320 sweeteners and the risk of gastric, pancreatic, and endometrial cancers in Italy. Cancer 2321 Epidemiol Biomarkers Prev. 2009;18(8):2235-8. PMID: 19661082. 2322 http://www.ncbi.nlm.nih.gov/pubmed/19661082. 2323
136. Bunin GR, Kushi LH, Gallagher PR, Rorke-Adams LB, McBride ML, Cnaan A. 2324 Maternal diet during pregnancy and its association with medulloblastoma in children: a 2325 children's oncology group study (United States). Cancer Causes Control. 2005;16(7):877-2326 91. PMID: 16132798. http://www.ncbi.nlm.nih.gov/pubmed/16132798. 2327
137. Cabaniols C, Giorgi R, Chinot O, Ferahta N, Spinelli V, Alla P, et al. Links between 2328 private habits, psychological stress and brain cancer: a case-control pilot study in France. 2329 J Neurooncol. 2011;103(2):307-16. PMID: 20835749. 2330 http://www.ncbi.nlm.nih.gov/pubmed/20835749. 2331
138. Gallus S, Scotti L, Negri E, Talamini R, Franceschi S, Montella M, et al. Artificial 2332 sweeteners and cancer risk in a network of case-control studies. Ann Oncol. 2333 2007;18(1):40-4. PMID: 17043096. http://www.ncbi.nlm.nih.gov/pubmed/17043096. 2334
139. Hardell L, Mild KH, Pahlson A, Hallquist A. Ionizing radiation, cellular telephones and 2335 the risk for brain tumours. Eur J Cancer Prev. 2001;10(6):523-9. PMID: 11916351. 2336 http://www.ncbi.nlm.nih.gov/pubmed/11916351. 2337
140. Lim U, Subar AF, Mouw T, Hartge P, Morton LM, Stolzenberg-Solomon R, et al. 2338 Consumption of aspartame-containing beverages and incidence of hematopoietic and 2339 brain malignancies. Cancer Epidemiol Biomarkers Prev. 2006;15(9):1654-9. PMID: 2340 16985027. http://www.ncbi.nlm.nih.gov/pubmed/16985027. 2341
141. Schernhammer ES, Bertrand KA, Birmann BM, Sampson L, Willett WC, Feskanich D. 2342 Consumption of artificial sweetener- and sugar-containing soda and risk of lymphoma 2343 and leukemia in men and women. Am J Clin Nutr. 2012;96(6):1419-28. PMID: 2344 23097267. http://www.ncbi.nlm.nih.gov/pubmed/23097267. 2345
142. Halldorsson TI, Strom M, Petersen SB, Olsen SF. Intake of artificially sweetened soft 2346 drinks and risk of preterm delivery: a prospective cohort study in 59,334 Danish pregnant 2347 women. Am J Clin Nutr. 2010;92(3):626-33. PMID: 20592133. 2348 http://www.ncbi.nlm.nih.gov/pubmed/20592133. 2349
143. Englund-Ogge L, Brantsaeter AL, Haugen M, Sengpiel V, Khatibi A, Myhre R, et al. 2350 Association between intake of artificially sweetened and sugar-sweetened beverages and 2351 preterm delivery: a large prospective cohort study. Am J Clin Nutr. 2012;96(3):552-9. 2352 PMID: 22854404. http://www.ncbi.nlm.nih.gov/pubmed/22854404. 2353
144. La Vecchia C. Low-calorie sweeteners and the risk of preterm delivery: results from two 2354 studies and a meta-analysis. J Fam Plann Reprod Health Care. 2013;39(1):12-3. PMID: 2355 23296849. http://www.ncbi.nlm.nih.gov/pubmed/23296849. 2356
Part D. Chapter 5: Food Sustainability and Safety
Scientific Report of the 2015 Dietary Guidelines Advisory Committee 65
145. Shaywitz BA, Anderson GM, Novotny EJ, Ebersole JS, Sullivan CM, Gillespie SM. 2357 Aspartame has no effect on seizures or epileptiform discharges in epileptic children. Ann 2358 Neurol. 1994;35(1):98-103. PMID: 7506878. 2359 http://www.ncbi.nlm.nih.gov/pubmed/7506878. 2360
146. Wolraich ML, Lindgren SD, Stumbo PJ, Stegink LD, Appelbaum MI, Kiritsy MC. 2361 Effects of diets high in sucrose or aspartame on the behavior and cognitive performance 2362 of children. N Engl J Med. 1994;330(5):301-7. PMID: 8277950. 2363 http://www.ncbi.nlm.nih.gov/pubmed/8277950. 2364
147. Kruesi MJ, Rapoport JL, Cummings EM, Berg CJ, Ismond DR, Flament M, et al. Effects 2365 of sugar and aspartame on aggression and activity in children. Am J Psychiatry. 2366 1987;144(11):1487-90. PMID: 3674234. http://www.ncbi.nlm.nih.gov/pubmed/3674234. 2367
149. Lapierre KA, Greenblatt DJ, Goddard JE, Harmatz JS, Shader RI. The neuropsychiatric 2371 effects of aspartame in normal volunteers. J Clin Pharmacol. 1990;30(5):454-60. PMID: 2372 2347957. http://www.ncbi.nlm.nih.gov/pubmed/2347957. 2373
150. Ryan-Harshman M, Leiter LA, Anderson GH. Phenylalanine and aspartame fail to alter 2374 feeding behavior, mood and arousal in men. Physiol Behav. 1987;39(2):247-53. PMID: 2375 3575461. http://www.ncbi.nlm.nih.gov/pubmed/3575461. 2376
151. Spiers PA, Sabounjian L, Reiner A, Myers DK, Wurtman J, Schomer DL. Aspartame: 2377 neuropsychologic and neurophysiologic evaluation of acute and chronic effects. Am J 2378 Clin Nutr. 1998;68(3):531-7. PMID: 9734727. 2379 http://www.ncbi.nlm.nih.gov/pubmed/9734727. 2380
152. Stokes AF, Belger A, Banich MT, Bernadine E. Effects of alcohol and chronic aspartame 2381 ingestion upon performance in aviation relevant cognitive tasks. Aviat Space Environ 2382 Med. 1994;65(1):7-15. PMID: 8117231. http://www.ncbi.nlm.nih.gov/pubmed/8117231. 2383
153. Stokes AF, Belger A, Banich MT, Taylor H. Effects of acute aspartame and acute alcohol 2384 ingestion upon the cognitive performance of pilots. Aviat Space Environ Med. 2385 1991;62(7):648-53. PMID: 1898300. http://www.ncbi.nlm.nih.gov/pubmed/1898300. 2386
154. Pivonka EE, Grunewald KK. Aspartame- or sugar-sweetened beverages: effects on mood 2387 in young women. J Am Diet Assoc. 1990;90(2):250-4. PMID: 2303661. 2388 http://www.ncbi.nlm.nih.gov/pubmed/2303661. 2389
155. Walton RG, Hudak R, Green-Waite RJ. Adverse reactions to aspartame: double-blind 2390 challenge in patients from a vulnerable population. Biol Psychiatry. 1993;34(1-2):13-7. 2391 PMID: 8373935. http://www.ncbi.nlm.nih.gov/pubmed/8373935. 2392
156. Schiffman SS, Buckley CE, 3rd, Sampson HA, Massey EW, Baraniuk JN, Follett JV, et 2393 al. Aspartame and susceptibility to headache. N Engl J Med. 1987;317(19):1181-5. 2394 PMID: 3657889. http://www.ncbi.nlm.nih.gov/pubmed/3657889. 2395
157. Koehler SM, Glaros A. The effect of aspartame on migraine headache. Headache. 2396 1988;28(1):10-4. PMID: 3277925. http://www.ncbi.nlm.nih.gov/pubmed/3277925. 2397
158. Van den Eeden SK, Koepsell TD, Longstreth WT, Jr., van Belle G, Daling JR, McKnight 2398 B. Aspartame ingestion and headaches: a randomized crossover trial. Neurology. 2399 1994;44(10):1787-93. PMID: 7936222. http://www.ncbi.nlm.nih.gov/pubmed/7936222. 2400
Part D. Chapter 5: Food Sustainability and Safety
Scientific Report of the 2015 Dietary Guidelines Advisory Committee 66
159. Lipton RB, Newman LC, Cohen JS, Solomon S. Aspartame as a dietary trigger of 2401 headache. Headache. 1989;29(2):90-2. PMID: 2708042. 2402 http://www.ncbi.nlm.nih.gov/pubmed/2708042. 2403
160. Camfield PR, Camfield CS, Dooley JM, Gordon K, Jollymore S, Weaver DF. Aspartame 2404 exacerbates EEG spike-wave discharge in children with generalized absence epilepsy: a 2405 double-blind controlled study. Neurology. 1992;42(5):1000-3. PMID: 1579221. 2406 http://www.ncbi.nlm.nih.gov/pubmed/1579221. 2407
161. Rowan AJ, Shaywitz BA, Tuchman L, French JA, Luciano D, Sullivan CM. Aspartame 2408 and seizure susceptibility: results of a clinical study in reportedly sensitive individuals. 2409 Epilepsia. 1995;36(3):270-5. PMID: 7614911. 2410 http://www.ncbi.nlm.nih.gov/pubmed/7614911. 2411
162. Centers for Disease Control and Prevention. CDC Estimates of Foodborne Illness in the 2412 United States 2014. Available from: http://www.cdc.gov/foodborneburden/estimates-2413 overview.html. 2414