27
Part I: Vaccines, Variants, and Asia’s Uneven Recovery 22 September 2021
Part I: Vaccines, Variants, and Asia’s Uneven Recovery22 September 2021

ADO Update 2021: Key messages
• Amid renewed outbreaks and uneven progress on vaccination, COVID-19 continues to besiegedeveloping Asia
• Regional growth paths are diverging—economies that have successfully contained the pandemicand actively rolled out vaccines are benefiting more than others from the recovery in globaldemand
• The region’s output is forecast to expand by 7.1% in 2021 and 5.4% in 2022. Inflation is projectedat 2.2% in 2021 and 2.7% in 2022
• A resurgence in the COVID-19 pandemic—possibly due to new virus variants, waningeffectiveness of vaccines, or slow progress on vaccination—remains the main risk
• The theme chapter examines how Asian agriculture must respond to three ongoing shifts:changing demand, changing demographics, and a changing and fragile environment
2
3
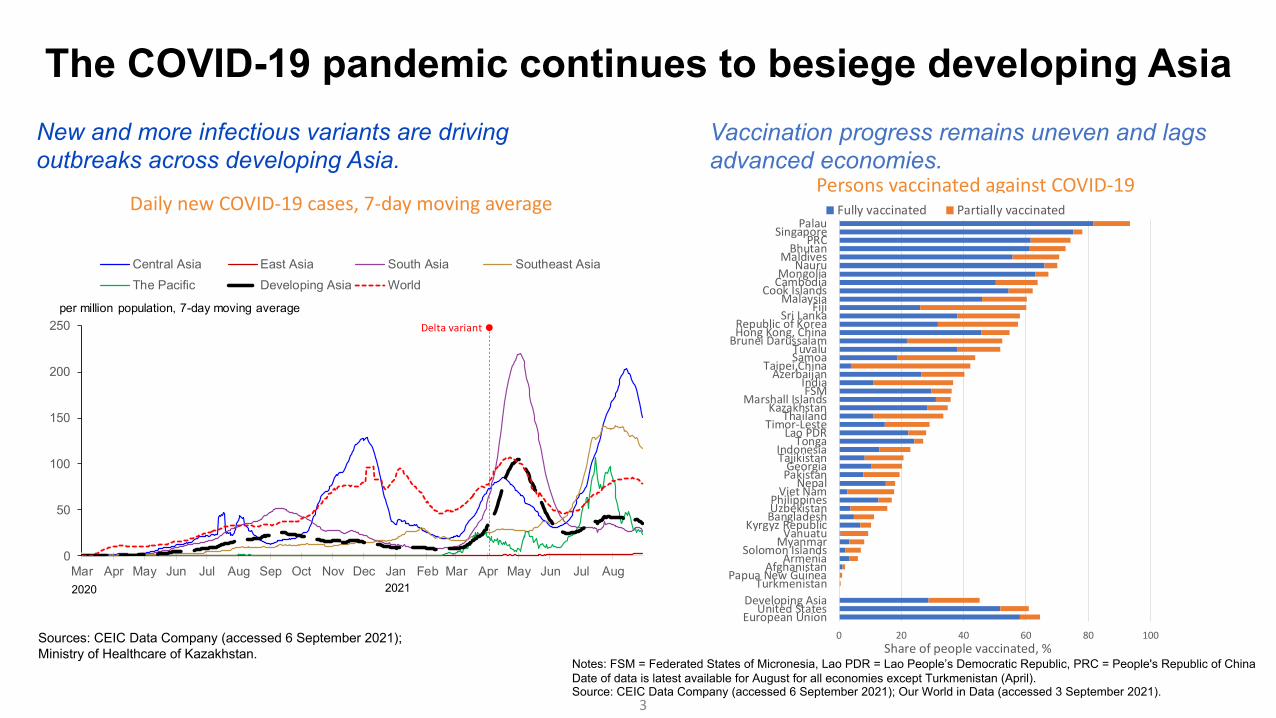
The COVID-19 pandemic continues to besiege developing AsiaNew and more infectious variants are driving outbreaks across developing Asia.
Sources: CEIC Data Company (accessed 6 September 2021); Ministry of Healthcare of Kazakhstan.
Vaccination progress remains uneven and lags advanced economies.
Persons vaccinated against COVID-19
Notes: FSM = Federated States of Micronesia, Lao PDR = Lao People’s Democratic Republic, PRC = People's Republic of China Date of data is latest available for August for all economies except Turkmenistan (April).Source: CEIC Data Company (accessed 6 September 2021); Our World in Data (accessed 3 September 2021).
Daily new COVID-19 cases, 7-day moving average
0 20 40 60 80 100
European UnionUnited States
Developing AsiaTurkmenistan
Papua New GuineaAfghanistan
ArmeniaSolomon Islands
MyanmarVanuatu
Kyrgyz RepublicBangladeshUzbekistanPhilippines
Viet NamNepal
PakistanGeorgia
TajikistanIndonesia
TongaLao PDR
Timor-LesteThailand
KazakhstanMarshall Islands
FSMIndia
AzerbaijanTaipei,China
SamoaTuvalu
Brunei DarussalamHong Kong, ChinaRepublic of Korea
Sri LankaFiji
MalaysiaCook Islands
CambodiaMongolia
NauruMaldives
BhutanPRC
SingaporePalau
Share of people vaccinated, %
Fully vaccinated Partially vaccinated
0
50
100
150
200
250
Mar Apr May Jun Jul Aug Sep Oct Nov Dec Jan Feb Mar Apr May Jun Jul Aug
Central Asia East Asia South Asia Southeast AsiaThe Pacific Developing Asia World
per million population, 7-day moving average
2020 2021
Delta variant
4
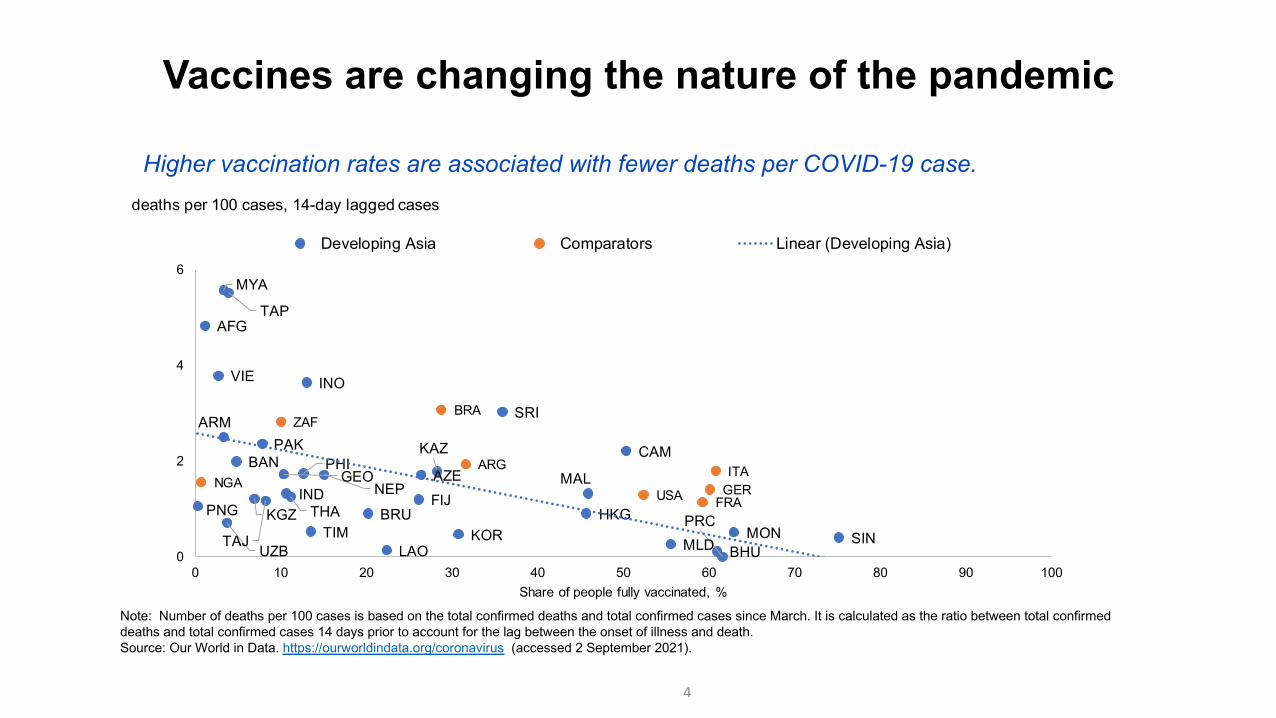
Note: Number of deaths per 100 cases is based on the total confirmed deaths and total confirmed cases since March. It is calculated as the ratio between total confirmed deaths and total confirmed cases 14 days prior to account for the lag between the onset of illness and death.Source: Our World in Data. https://ourworldindata.org/coronavirus (accessed 2 September 2021).
Vaccines are changing the nature of the pandemic
Higher vaccination rates are associated with fewer deaths per COVID-19 case.
AFG
ARM
AZEBAN
BHU
BRU
CAM
PRCFIJ
GEO
HKGIND
INO
KAZ
KGZ
LAO
MAL
MLDMON
MYA
NEP
PAK
PNG
PHI
SINKOR
SRI
TAP
TAJ
THATIM
UZB
VIE
ARG
BRA
NGA
ZAF
FRAGERITA
USA
0
2
4
6
0 10 20 30 40 50 60 70 80 90 100Share of people fully vaccinated, %
Developing Asia Comparators Linear (Developing Asia)
deaths per 100 cases, 14-day lagged cases

5
The strength of the recovery in the first half of 2021has varied across economies
Economies that did better with vaccination and pandemic control tended to have better economic performance.
GDP = gross domestic product, H = half, PRC = People’s Republic of China, ROK = Republic of Korea, yoy = year on year.Note: H1 in India refers to first half of the calendar year. Source: CEIC Data Company (accessed 8 September 2021).
5.7
13.1
-3.5
9.3
-3.2
7.8
-1.0
3.9
-4.1
7.74.7
8.3
-2.8
3.1
-3.1
7.1
-9.8
3.7
-5.3
2.0
-20
-15
-10
-5
0
5
10
15
20
H22020
H12021
H22020
H12021
H22020
H12021
H22020
H12021
H22020
H12021
H22020
H12021
H22020
H12021
H22020
H12021
H22020
H12021
H22020
H12021
PRC India Hong Kong,China
ROK Singapore Taipei,China Indonesia Malaysia Philippines Thailand
Percentage points Net exports Investment Consumption H2 2020 GDP growth, yoy H1 2021 GDP growth, yoy

6
Activity has slowed in recent months amid renewed outbreaks
PMI = Purchasing managers’ index PRC = People’s Republic of China, Q = quarter.Note: a For Malaysia, the series is adjusted by adding 3 points, as historical experience suggests that value above 47 are consistent with expansion. Manufacturing PMI and doses administered represent the averages of July and August 2021.Source: CEIC Data Company (accessed 6 September 2021).
Falling purchasing managers’ indexes in Q3 of 2021 demonstrate the recovery’s fragile nature.
Manufacturing performance has tended to be better in economies with higher vaccination rates.
Manufacturing PMI, seasonally adjusted
Jan Feb Mar Apr May Jun Jul AugPRC 51.5 50.9 50.6 51.9 52.0 51.3 50.3 49.2India 57.7 57.5 55.4 55.5 50.8 48.1 55.3 52.3Indonesia 52.2 50.9 53.2 54.6 55.3 53.5 40.1 43.7Malaysiaa 51.9 50.7 52.9 56.9 54.3 42.9 43.1 46.4Philippines 52.5 52.5 52.2 49.0 49.9 50.8 50.4 46.4Republic of Korea 53.2 55.3 55.3 54.6 53.7 53.9 53.0 51.2Taipei,China 60.2 60.4 60.8 62.4 62.0 57.6 59.7 58.5Thailand 49.0 47.2 48.8 50.7 47.8 49.5 48.7 48.3Viet Nam 51.3 51.6 53.6 54.7 53.1 44.1 45.1 40.2
Services PMI, seasonally adjustedPRC 52.0 51.5 54.3 56.3 55.1 50.3 54.9 46.7India 52.8 55.3 54.6 54.0 46.4 41.2 45.4 56.7
Economy2021
Q1 Q2 Q3
Note: The manufacturing PMI and doses administered per hundred persons are the average of July and August 2021.Sources: CEIC Data Company (accessed 6 September 2021); IHS Markit; Haver Analytics (accessed 1 September 2021); Bloomberg. Covid-19 Vaccine Tracker (accessed 1 September 2021).

7
After a continuous decline in 2020, headline inflation edged up in the first half of 2021.
Inflation has picked up across developing Asia, with rising global commodity prices a possible factor
Inflation in developing Asia
Note: The Pacific is excluded because data is not available.Source: CEIC Data Company (accessed 3 September 2021)
Commodity prices have surged since the second half of 2020.
Commodity prices
-3
0
3
6
9
Jan2019
Mar May Jul Sep Nov Jan2020
Mar May Jul Sep Nov Jan2021
Mar May Jul
%, year on year Central Asia East AsiaSouth Asia Southeast AsiaDeveloping Asia
30
60
90
120
150
180
Dec2019
Mar2020
Jun2020
Sep2020
Dec2020
Mar2021
Jun2021
Sep2021
Food Brent crude oil price Copper Gold
$, December 2019 = 100
Source: World Bank. Commodity Markets, Pink Sheet data (accessed 7 September 2021)
8
70
80
90
100
110
120
130
140
Jan 2019 Jul 2019 Jan 2020 Jul 2020 Jan 2021 Jul 2021
World PRC Developing Asia excluding PRC
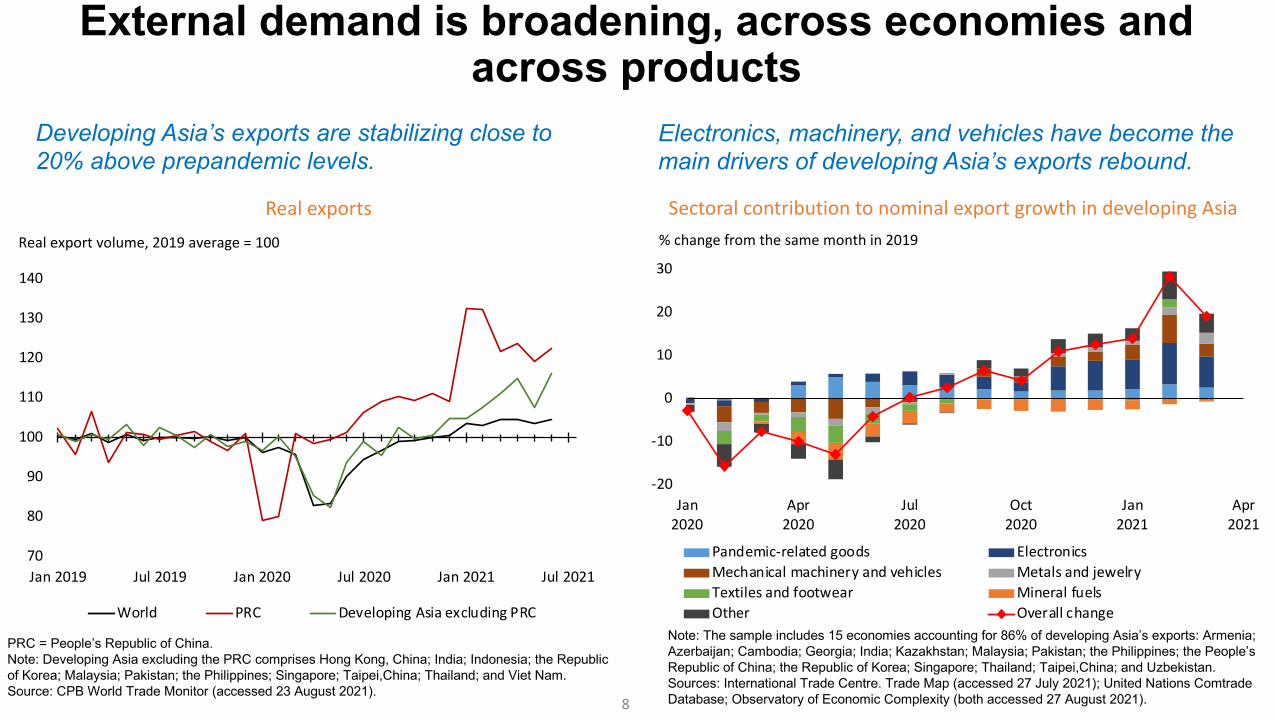
Real export volume, 2019 average = 100
External demand is broadening, across economies and across products
Real exports
Developing Asia’s exports are stabilizing close to 20% above prepandemic levels.
Sectoral contribution to nominal export growth in developing Asia
PRC = People’s Republic of China.Note: Developing Asia excluding the PRC comprises Hong Kong, China; India; Indonesia; the Republic of Korea; Malaysia; Pakistan; the Philippines; Singapore; Taipei,China; Thailand; and Viet Nam.Source: CPB World Trade Monitor (accessed 23 August 2021).
Note: The sample includes 15 economies accounting for 86% of developing Asia’s exports: Armenia; Azerbaijan; Cambodia; Georgia; India; Kazakhstan; Malaysia; Pakistan; the Philippines; the People’s Republic of China; the Republic of Korea; Singapore; Thailand; Taipei,China; and Uzbekistan.Sources: International Trade Centre. Trade Map (accessed 27 July 2021); United Nations ComtradeDatabase; Observatory of Economic Complexity (both accessed 27 August 2021).
Electronics, machinery, and vehicles have become the main drivers of developing Asia’s exports rebound.
-20
-10
0
10
20
30
Jan2020
Apr2020
Jul2020
Oct2020
Jan2021
Apr2021
Pandemic-related goods ElectronicsMechanical machinery and vehicles Metals and jewelryTextiles and footwear Mineral fuelsOther Overall change
% change from the same month in 2019
9
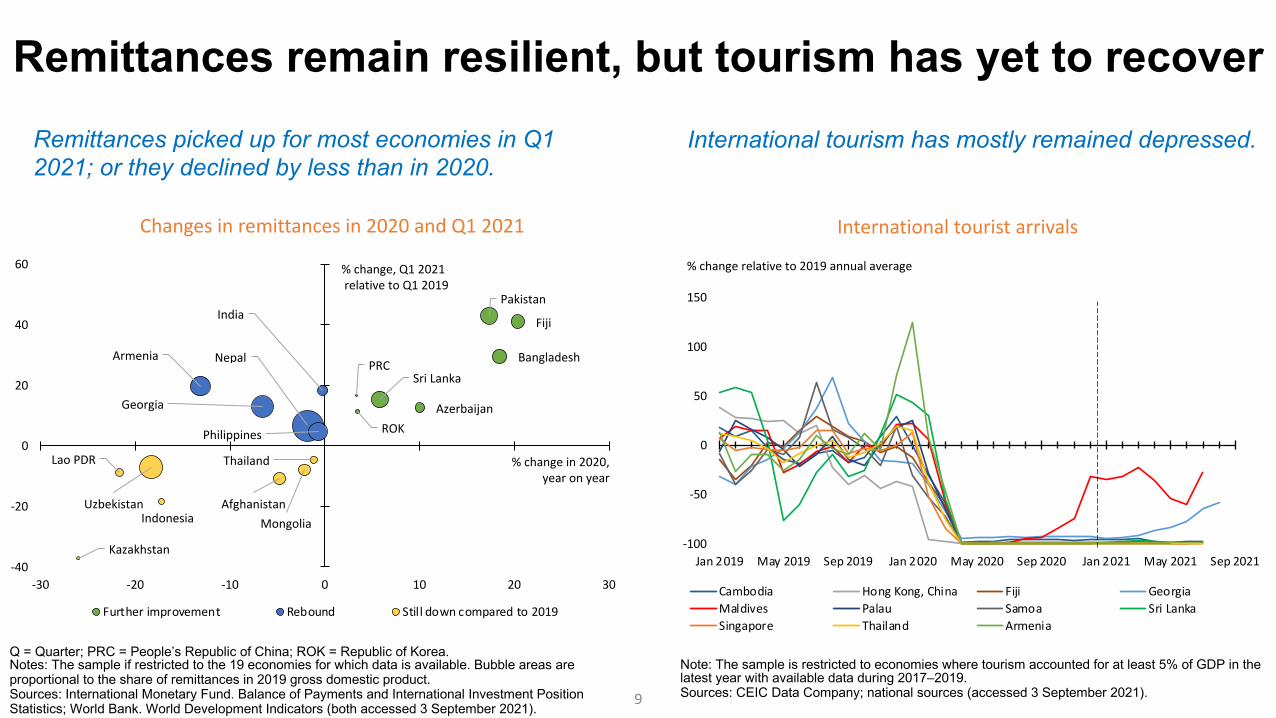
International tourism has mostly remained depressed.
Remittances remain resilient, but tourism has yet to recover
International tourist arrivals
Note: The sample is restricted to economies where tourism accounted for at least 5% of GDP in the latest year with available data during 2017–2019.Sources: CEIC Data Company; national sources (accessed 3 September 2021).
Q = Quarter; PRC = People’s Republic of China; ROK = Republic of Korea.Notes: The sample if restricted to the 19 economies for which data is available. Bubble areas are proportional to the share of remittances in 2019 gross domestic product.Sources: International Monetary Fund. Balance of Payments and International Investment Position Statistics; World Bank. World Development Indicators (both accessed 3 September 2021).
Changes in remittances in 2020 and Q1 2021
Remittances picked up for most economies in Q1 2021; or they declined by less than in 2020.
-100
-50
0
50
100
150
Jan 2019 May 2019 Sep 2019 Jan 2020 May 2020 Sep 2020 Jan 2021 May 2021 Sep 2021
Cambodia Hong Kong, China Fiji GeorgiaMaldives Palau Samoa Sri LankaSingapore Thailand Armenia
% change relative to 2019 annual average
Azerbaijan
PRC
ROK
Bangladesh
Pakistan
Sri Lanka
Fiji
Armenia
Georgia
India
Nepal
Philippines
Kazakhstan
UzbekistanMongolia
AfghanistanIndonesia
Lao PDR Thailand
-40
-20
0
20
40
60
-30 -20 -10 0 10 20 30
Further improvement Rebound Still down compared to 2019
% change, Q1 2021relative to Q1 2019
% change in 2020,year on year

10
Fiscal policy continues to support the recovery
Notes: BAN=Bangladesh, BRU=Brunei Darussalam, CAM=Cambodia, HKG=Hong Kong, China, IND=India, INO=Indonesia, KOR=Republic of Korea, LAO=Lao PDR, MAL=Malaysia, MON=Mongolia, MYA=Myanmar, PAK=Pakistan, PHI=Philippines, PRC=People's Republic of China, SIN=Singapore, SRI=Sri Lanka, TAP=Taipei,China, THA=Thailand, VIE=Viet Nam.
Fiscal impulse is defined as the change in the fiscal balance, expressed as percentage of GDP, from the previous year. Positive changes in the fiscal balance indicate fiscal consolidation; negative changes indicate fiscal expansion. Data for 2021 and 2022 are forecasts.
Sources: Focus Economics Forecast, September 2021. Authors’ calculations.
Fiscal impulse over 2020-2022, selected Asian economies
The fiscal stance will remain accommodative in several economies this year; a general shift to consolidation is projected for 2022 and beyond
11
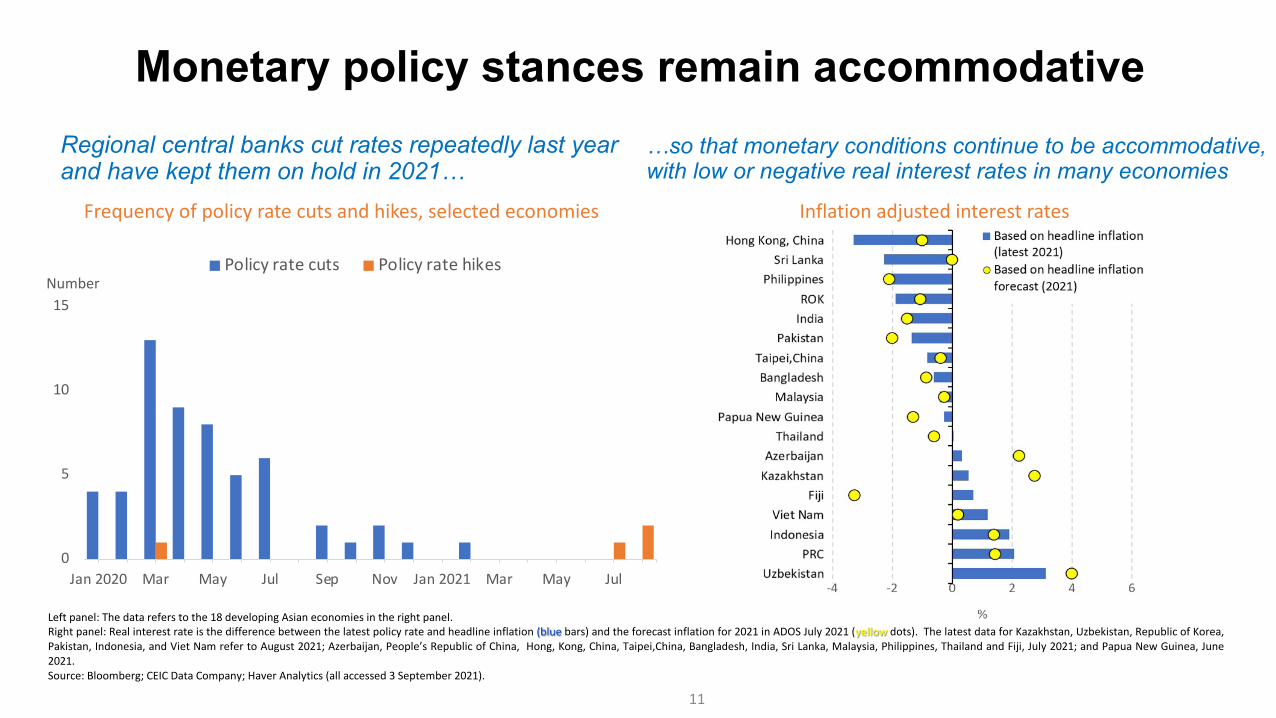
Monetary policy stances remain accommodative
Frequency of policy rate cuts and hikes, selected economies Inflation adjusted interest rates
Regional central banks cut rates repeatedly last year and have kept them on hold in 2021…
…so that monetary conditions continue to be accommodative, with low or negative real interest rates in many economies
0
5
10
15
Jan 2020 Mar May Jul Sep Nov Jan 2021 Mar May Jul
NumberPolicy rate cuts Policy rate hikes
Left panel: The data refers to the 18 developing Asian economies in the right panel.Right panel: Real interest rate is the difference between the latest policy rate and headline inflation (blue bars) and the forecast inflation for 2021 in ADOS July 2021 (yellow dots). The latest data for Kazakhstan, Uzbekistan, Republic of Korea,Pakistan, Indonesia, and Viet Nam refer to August 2021; Azerbaijan, People’s Republic of China, Hong, Kong, China, Taipei,China, Bangladesh, India, Sri Lanka, Malaysia, Philippines, Thailand and Fiji, July 2021; and Papua New Guinea, June2021.Source: Bloomberg; CEIC Data Company; Haver Analytics (all accessed 3 September 2021).
12
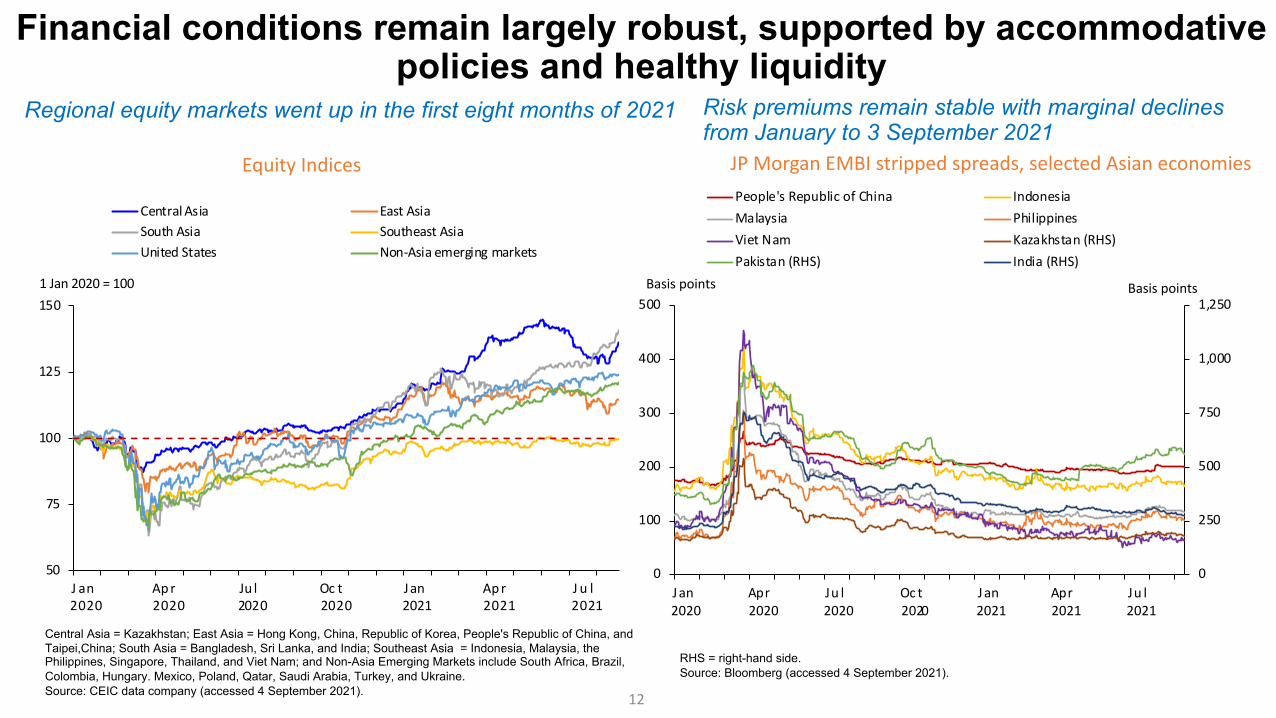
Financial conditions remain largely robust, supported by accommodative policies and healthy liquidity
Central Asia = Kazakhstan; East Asia = Hong Kong, China, Republic of Korea, People's Republic of China, and Taipei,China; South Asia = Bangladesh, Sri Lanka, and India; Southeast Asia = Indonesia, Malaysia, the Philippines, Singapore, Thailand, and Viet Nam; and Non-Asia Emerging Markets include South Africa, Brazil, Colombia, Hungary. Mexico, Poland, Qatar, Saudi Arabia, Turkey, and Ukraine.Source: CEIC data company (accessed 4 September 2021).
RHS = right-hand side.Source: Bloomberg (accessed 4 September 2021).
Risk premiums remain stable with marginal declines from January to 3 September 2021
Regional equity markets went up in the first eight months of 2021
Equity Indices JP Morgan EMBI stripped spreads, selected Asian economies
50
75
100
125
150
J2
a0
n20
A2
p0
r20
J2u0
l20
O2
c0
t20
J2
a0
n21
A2
p0
r21
J2
u0
l21
1 Jan 2020 = 100
Central Asia East AsiaSouth Asia Southeast AsiaUnited States Non-Asia emerging markets
0
250
500
750
1,000
1,250
0
100
200
300
400
500
J2
a0
n20
A2
p0
r20
J2
u0
l20
O2
c0
t20
J2
a0
n21
A2
p0
r21
J2
u0
l21
People's Republic of China IndonesiaMalaysia PhilippinesViet Nam Kazakhstan (RHS)Pakistan (RHS) India (RHS)
Basis points Basis points
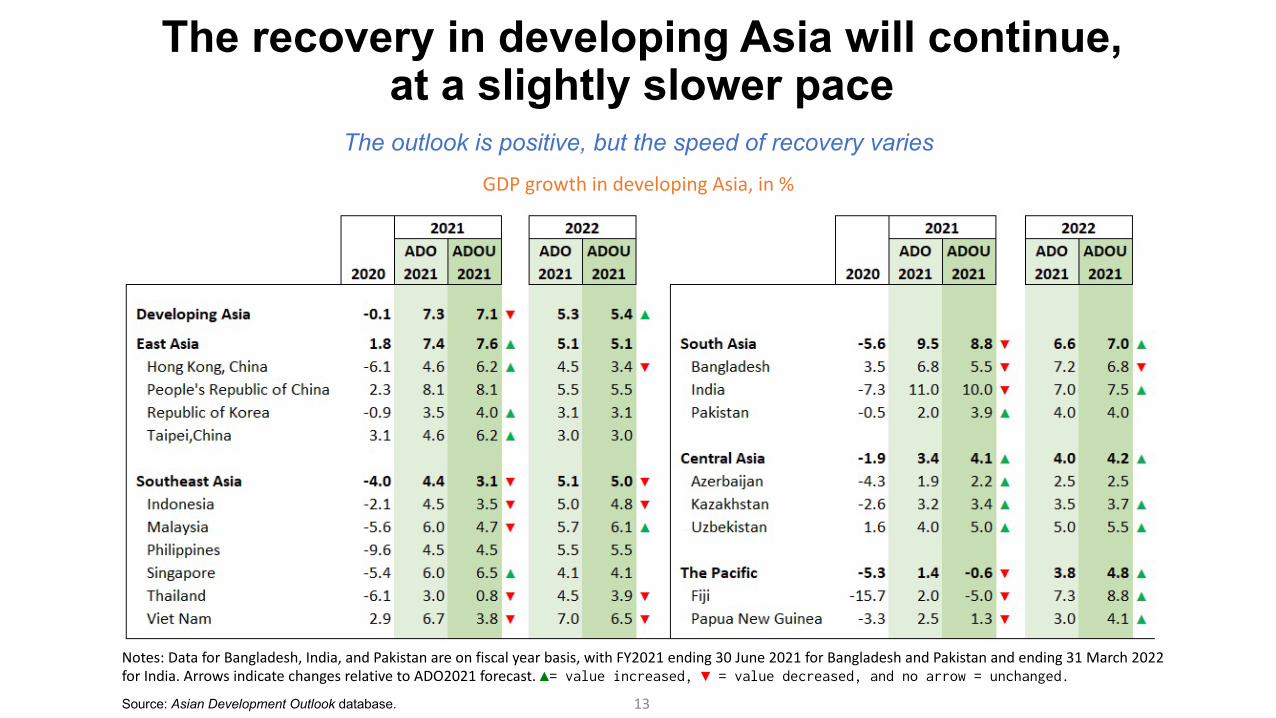
13Source: Asian Development Outlook database.
The recovery in developing Asia will continue, at a slightly slower pace
GDP growth in developing Asia, in %
The outlook is positive, but the speed of recovery varies
Notes: Data for Bangladesh, India, and Pakistan are on fiscal year basis, with FY2021 ending 30 June 2021 for Bangladesh and Pakistan and ending 31 March 2022 for India. Arrows indicate changes relative to ADO2021 forecast. ▲= value increased, ▼ = value decreased, and no arrow = unchanged.
14
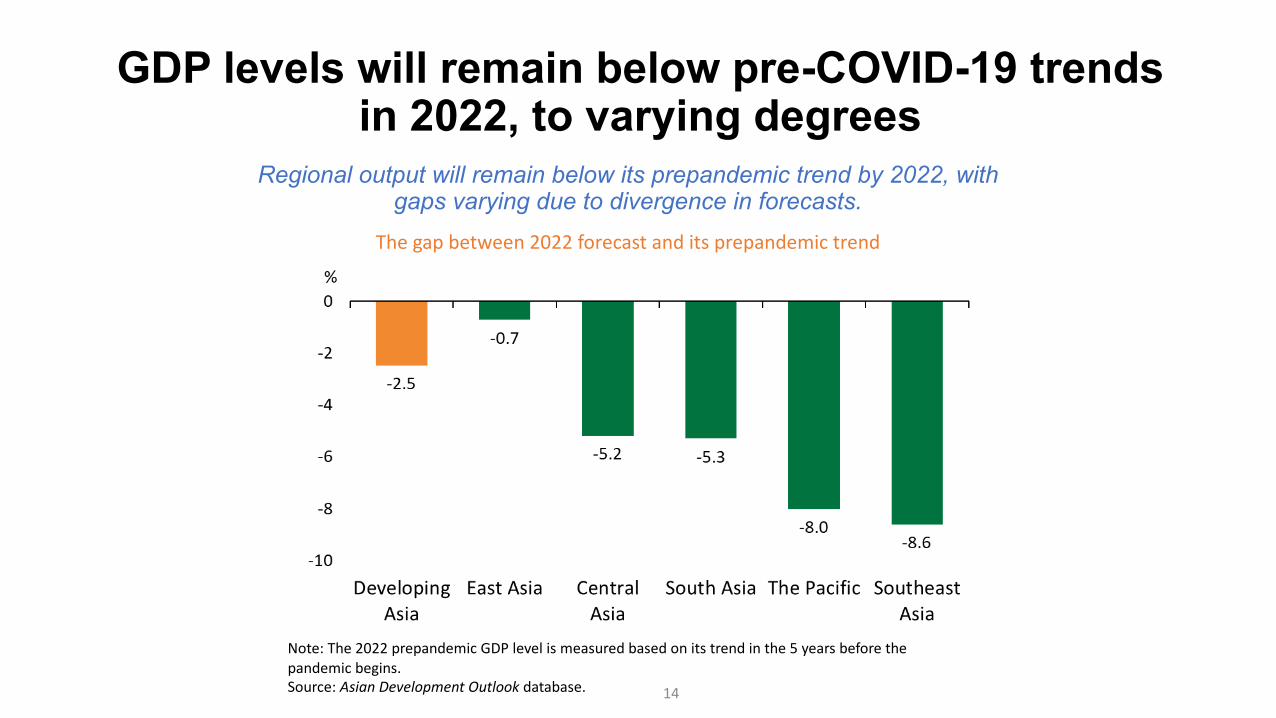
GDP levels will remain below pre-COVID-19 trends in 2022, to varying degrees
Note: The 2022 prepandemic GDP level is measured based on its trend in the 5 years before the pandemic begins. Source: Asian Development Outlook database.
The gap between 2022 forecast and its prepandemic trend
Regional output will remain below its prepandemic trend by 2022, with gaps varying due to divergence in forecasts.

15
Risks remain tilted to the downside
• The main threats to the outlook come from COVID-19, including delayedvaccine rollouts, the emergence of new variants and waning vaccineeffectiveness.
• Additional downside risks are possible geopolitical tensions, global supplychain disruptions, and financial-market turbulence as US monetary policynormalizes.
• As economies recover from the pandemic, medium-term risks will return tocenter stage—chiefly among these, natural disasters and extreme weatherevents linked to climate change as well as the fall-out from rising foodinsecurity.

16
Part II: Transforming Agriculture in Asia22 September 2021
17
Asia’s agriculture must adapt if it is to thrive
• In developing Asia, one-third of workers are still employed in agriculture, and an estimated four out of five poor people live in rural areas.
• Sustainable food production and agricultural systems that are resilient to climate change will be crucial for developing Asia.
• To transform agriculture, regional economies must tackle challenges from three ongoing shifts: changing demand, changing demographics, and a changing and more fragile environment.
18
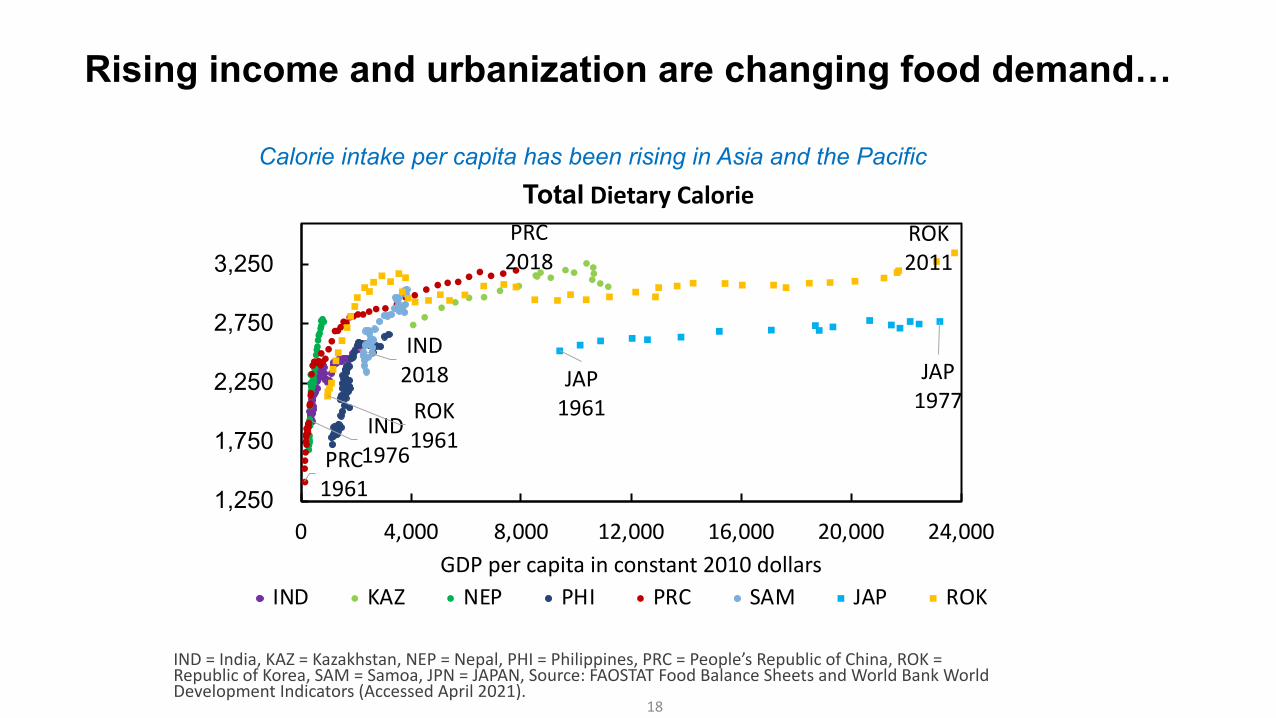
Rising income and urbanization are changing food demand…
IND1976
IND2018
PRC1961
PRC 2018
JAP1961
JAP1977ROK
1961
ROK2011
1,250
1,750
2,250
2,750
3,250
0 4,000 8,000 12,000 16,000 20,000 24,000GDP per capita in constant 2010 dollars
IND KAZ NEP PHI PRC SAM JAP ROK
IND = India, KAZ = Kazakhstan, NEP = Nepal, PHI = Philippines, PRC = People’s Republic of China, ROK = Republic of Korea, SAM = Samoa, JPN = JAPAN, Source: FAOSTAT Food Balance Sheets and World Bank World Development Indicators (Accessed April 2021).
Total Dietary Calorie Calorie intake per capita has been rising in Asia and the Pacific

Animal Meat Seafood
...and shifting it towards meat and seafood
Animal meat includes bovine meat, mutton & goat meat, pigmeat, poultry meat, and other meats.Seafood fish includes freshwater fish, demersal fish, pelagic fish, marine fish, other crustaceans, cephalopods, and other molluscs.Source: FAOSTAT Food Balance Sheets.
Meat consumption in the region remains significantly lower than in advanced economies outside of Asia, while fish consumption has surpassed it.
19
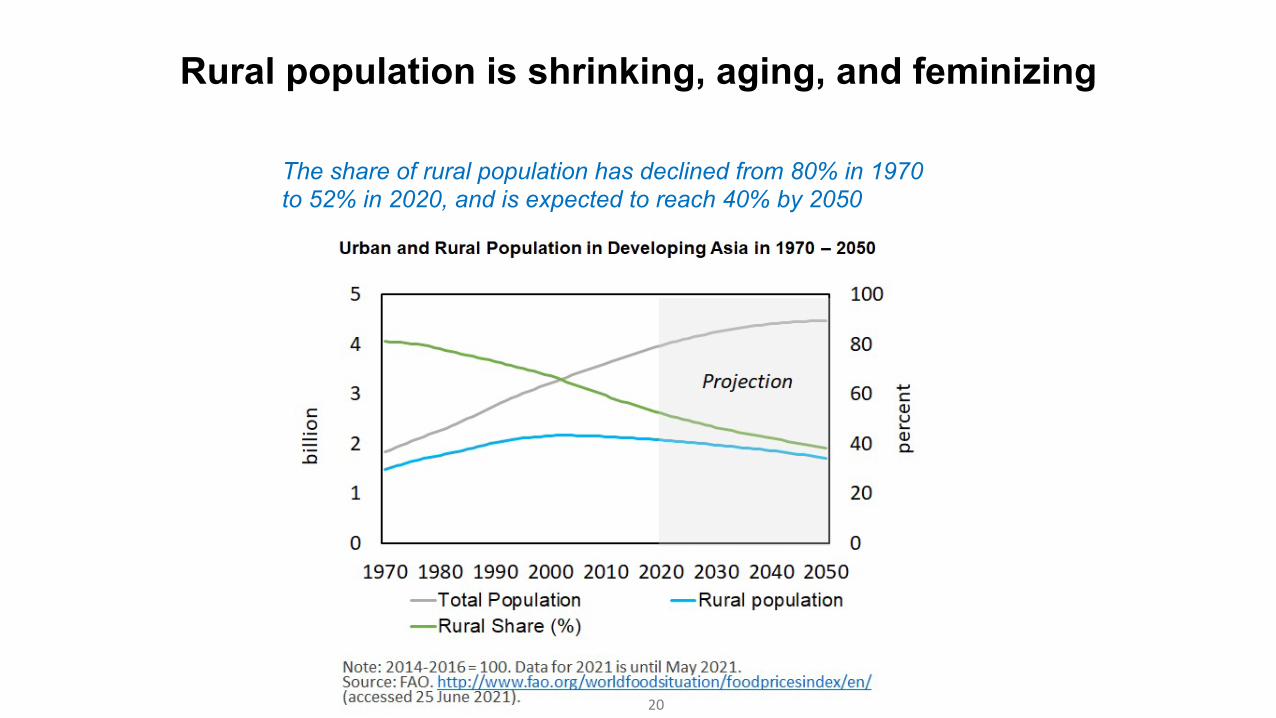
Rural population is shrinking, aging, and feminizing
The share of rural population has declined from 80% in 1970 to 52% in 2020, and is expected to reach 40% by 2050
20

21
Precipitation Change in Asia,1958-2019(millimeters)
Source: Gumma (2021) based on climate data from Abatzoglou et al. (2018)
Climate change poses ever greater challenges to agriculture in Asia
Asia has experienced significant changes in precipitation

22
Transforming agriculture needs a multipronged approach
• Innovation to boost productivity
• Regulation to ensure sustainability
• Better, more comprehensive support systems for farmers
23
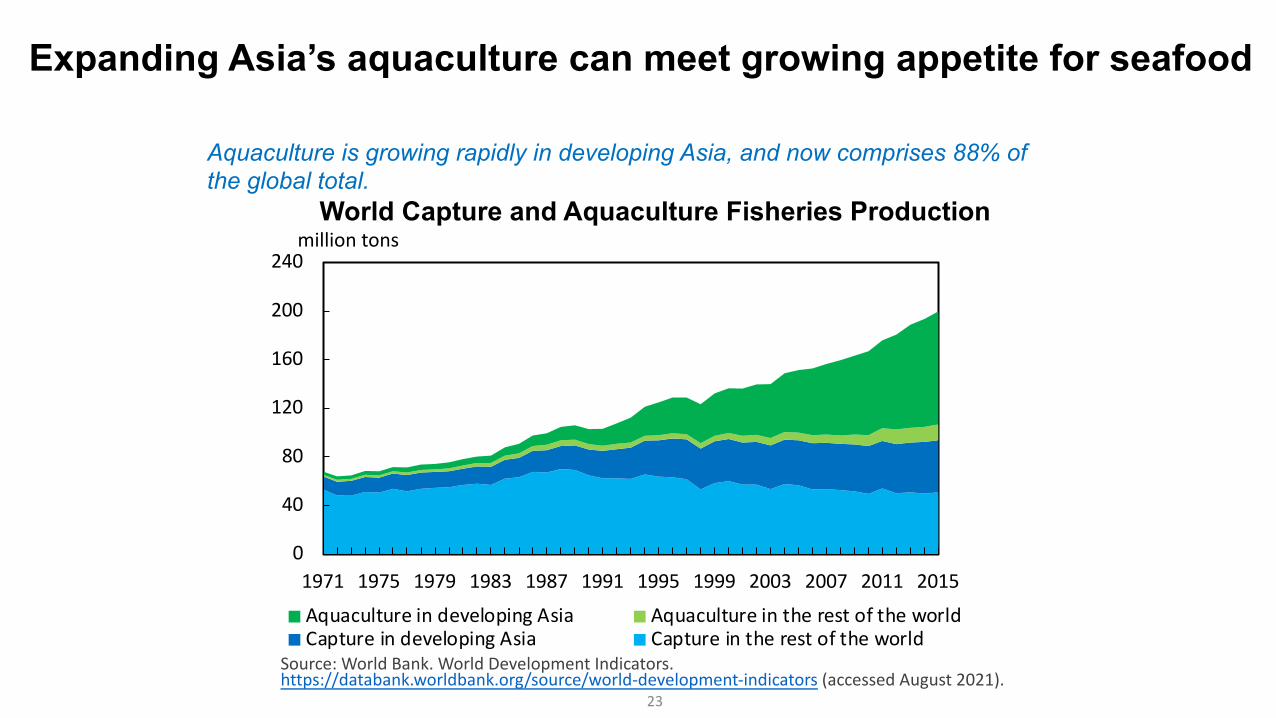
Expanding Asia’s aquaculture can meet growing appetite for seafood
World Capture and Aquaculture Fisheries Production
Source: World Bank. World Development Indicators. https://databank.worldbank.org/source/world-development-indicators (accessed August 2021).
0
40
80
120
160
200
240
1971 1975 1979 1983 1987 1991 1995 1999 2003 2007 2011 2015
million tons
Aquaculture in developing Asia Aquaculture in the rest of the worldCapture in developing Asia Capture in the rest of the world
Aquaculture is growing rapidly in developing Asia, and now comprises 88% of the global total.
24
MAL1961
MAL1990
MAL2014
PRC1961
PRC 2014
VIE 1961
VIE2014
IND 1961
IND2014
BAN1961
BAN 2014
INO 1961
INO2014
4
5
6
7
8
9
5 6 7 8 9 10Log of gross output in 2005 US dollars per economically active adult
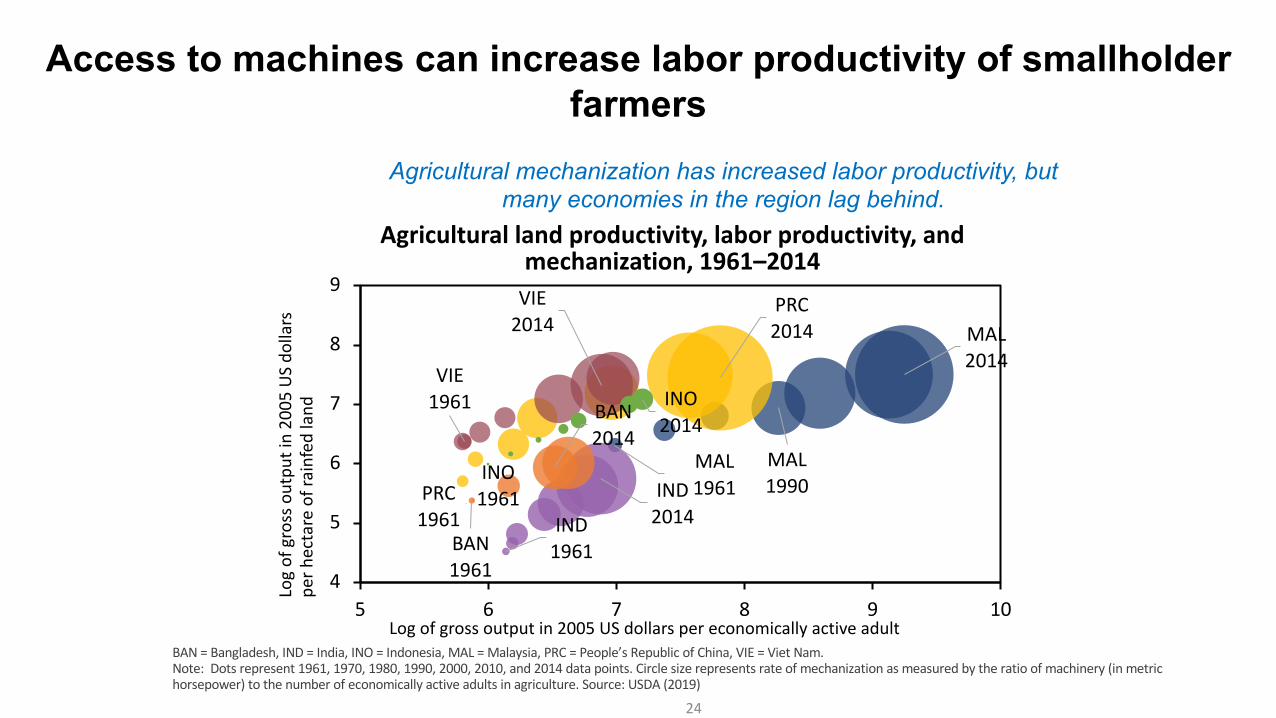
Agricultural land productivity, labor productivity, and mechanization, 1961–2014
BAN = Bangladesh, IND = India, INO = Indonesia, MAL = Malaysia, PRC = People’s Republic of China, VIE = Viet Nam.Note: Dots represent 1961, 1970, 1980, 1990, 2000, 2010, and 2014 data points. Circle size represents rate of mechanization as measured by the ratio of machinery (in metric horsepower) to the number of economically active adults in agriculture. Source: USDA (2019)
Access to machines can increase labor productivity of smallholder farmers
Log
of g
ross
out
put i
n 20
05 U
S do
llars
pe
r hec
tare
of r
ainf
ed la
nd
Agricultural mechanization has increased labor productivity, but many economies in the region lag behind.

25
Crop insurance can protect farmers’ livelihood and build climate resilience
Madhya Pradesh State Crop Stress Map (October 2020)
Source: Gumma et al. 2021
Spatial information systems can help insurance programs rapidly assess crop damage and expedite settlement claims.

26
Innovative practices and solutions on the farm
Comprehensive systems to support agricultural
production
v Promote well-regulated aquaculture to meet growing demand for seafood.
v Expand access to machines for smallholders using innovative arrangements
v Improved technologies and practices for sustainable farming
v invest in early warning systems and climate-resilient infrastructure.
v hasten development of national crop insurance schemesincluding the use of spatial information systems
v Focus agricultural policy away from production support and more on market-oriented and innovation-encouraging policy
Policies to Transform Agriculture in Asia
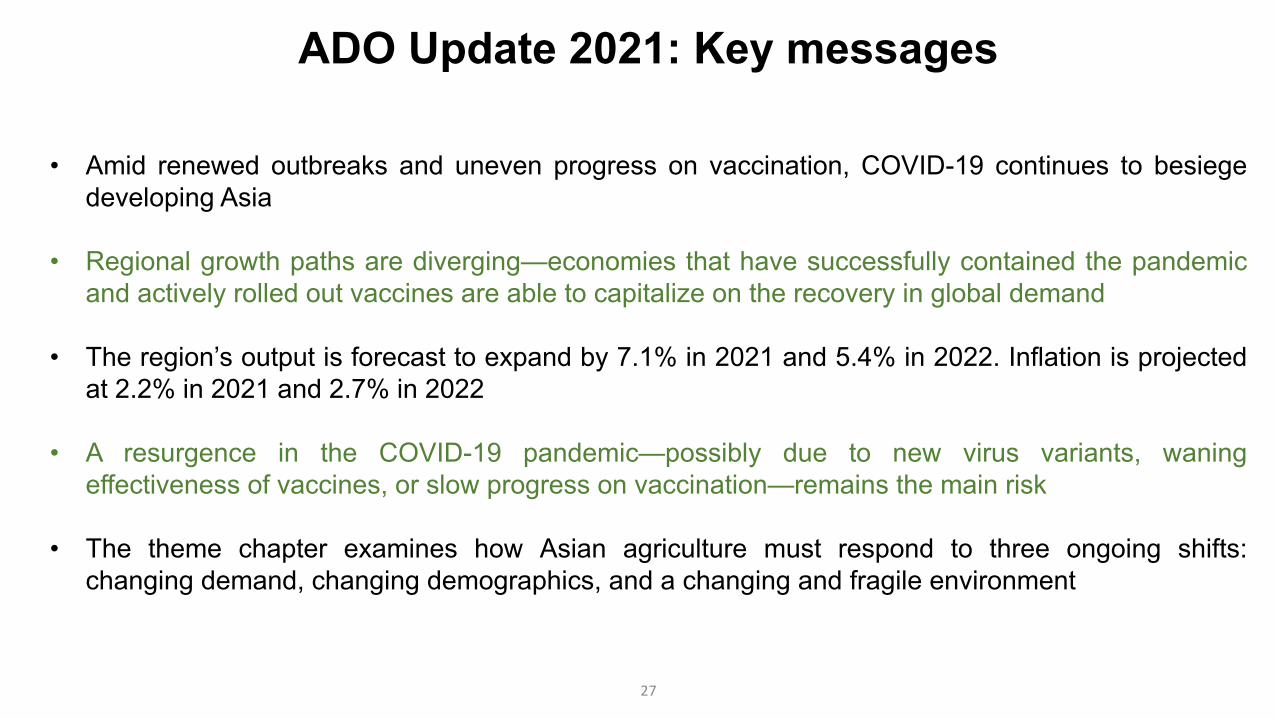
ADO Update 2021: Key messages
• Amid renewed outbreaks and uneven progress on vaccination, COVID-19 continues to besiegedeveloping Asia
• Regional growth paths are diverging—economies that have successfully contained the pandemicand actively rolled out vaccines are able to capitalize on the recovery in global demand
• The region’s output is forecast to expand by 7.1% in 2021 and 5.4% in 2022. Inflation is projectedat 2.2% in 2021 and 2.7% in 2022
• A resurgence in the COVID-19 pandemic—possibly due to new virus variants, waningeffectiveness of vaccines, or slow progress on vaccination—remains the main risk
• The theme chapter examines how Asian agriculture must respond to three ongoing shifts:changing demand, changing demographics, and a changing and fragile environment
27


