54
Part One Fundamentals of Fluidization COPYRIGHTED MATERIAL
Part One
Fundamentals of Fluidization
COPYRIG
HTED M
ATERIAL

Chapter 1
A Description of Fluidized Bed Behaviour
An introduction to fl uidization
Consider a bed of particulate solids or powder, say of a size similar to table salt. When a fl uid, either a gas or a liquid, is passed upwards through the bed, the bed particles remain stationary or packed at low fl uid velocities. This is a packed or fi xed bed. If now the velocity of the fl uid is increased, the particles will begin to separate and move away from one another; the bed is said to expand. On increasing the velocity further, a point will be reached at which the drag force exerted by the fl uid on a particle is balanced by the net weight of the particle. The particles are now suspended in the upward-moving stream of fl uid. This is the point of minimum fl uidization, or incipient fl uidization, at and beyond which the bed is said to be fl uidized.
The superfi cial fl uid velocity in the bed at the point of incipient fl u-idization is called the minimum fl uidizing velocity umf and is of crucial importance in characterising the behaviour of a fl uidized bed. Superfi cial velocity is defi ned as the volumetric fl ow rate of fl uid divided by the cross-sectional area of the bed. In other words, super-fi cial velocity is equal to the mean fl uid velocity assuming that the particles are not present; the actual interstitial fl uid velocity will, of course, be somewhat higher. At velocities in excess of that required for minimum fl uidization one of two phenomena will occur. First, the bed may continue to expand and the particles space themselves uniformly. This is known as particulate, or homogeneous, fl uidization (Figure 1.1) and in general occurs when the fl uidizing medium is a liquid. Alternatively, the excess fl uid, beyond that required to achieve fl uidiza-tion, may pass through the bed in the form of bubbles. The particles are agitated and mixed, violently so at higher velocities, and the bubbles rise through the bed to break at the surface. This is called aggregative, bubbling or heterogeneous fl uidization and usually occurs where the fl uidizing medium is a gas. It is this type of behaviour which gives rise to the analogy of a boiling liquid (Figure 1.2).

4 Applications of Fluidization to Food Processing
Increasing superficial velocity
Figure 1.1 Particulate fl uidization.
mfuu =mfuu <mfuu >
Figure 1.2 Aggregative fl uidization.

A Description of Fluidized Bed Behaviour 5
Thus fl uidization is a technique which enables solid particles to take on some of the properties of a fl uid. For example, solids fl uidized by a gas will adopt the shape of the container in which they are held and can be made to fl ow, under pressure, from an orifi ce or overfl ow a weir. If the wall of the bed is punctured by a series of apertures aligned vertically the fl uidized solids will behave just as if the bed were fi lled with liquid; a stream of solids will issue from each aperture, that from the highest point in the bed will travel only a short horizontal distance whereas the stream from the lowest aperture will travel furthest. Gibilaro (2001) refers to a demonstration rig in the Department of Chemical Engineering at UCL in which a plastic toy duck buried in a bed of sand exchanges place with a brass duck on the bed surface when the bed is fl uidized with air.*
It is possible to operate a fl uidized bed in either batch or continuous mode. Strictly, most batch applications are in fact operated in semi-batch mode where the solids are treated as a batch but the fl uidizing medium enters and leaves the bed continuously. In the case of gas-solid beds used in fermentation (see Chapter 6), the fl uidizing gas is recir-culated although reactants and products fl ow continuously. In true continuous operation the solids may be fed into a fl uidized bed via screw conveyors, weigh feeders or pneumatic conveying lines and can be withdrawn from the bed via standpipes or by fl owing over weirs.
Essentially aggregative fl uidization is a two-phase system: there is a dense phase (sometimes referred to as the emulsion phase), which is continuous, and a discontinuous phase called the lean or bubble phase. The simplifi ed assumption that all the gas over and above that required for minimum fl uidization fl ows up through the bed in the form of bubbles is known as the two-phase theory. If the total volumetric fl ow of gas is Q then
Q Q Qmf B= + 1.1
where Qmf is the volumetric fl ow of gas at minimum fl uidization and QB is the volumetric fl ow rate of gas in the bubbles. The interstitial gas fl ows up through the dense phase of the bed in streamline fl ow. The particle Reynolds number (defi ned by equation 1.42) has a value between unity and about 10 for most fi ne particles, such as spray-dried
* I recall attempting to impress prospective undergraduates with this demonstration when I was a research student at UCL. From memory, rather than ducks, there were two plastic fi sh, one blue and weighted with sand and one pink. The demonstration purported to show how fl uidized beds were able to change the colour of plastic fi sh . . . !

6 Applications of Fluidization to Food Processing
food powders, but increases by two or three orders of magnitude for large particles such as vegetable pieces in a fl uidized bed freezer.
However, the rather idealised picture of a fl uidized bed which has been described so far is not observed in all cases. There can be very different patterns of behaviour across a range of particle and fl uid properties. For example, some solids are capable of being fl uidized far more easily than others; Richardson (1971) suggests that a well-fl uidized system is likely to result if the particles are fi ne, of low density, with an approximately spherical shape and narrow size dis-tribution, and when the fl uid is of high density. Although gas-solid systems normally give rise to aggregative fl uidization and liquid-solid systems to particulate behaviour, in extreme cases particulate fl uidiza-tion can occur with very small particles of low density which are fl uid-ized by a dense gas at high pressure. In such cases increasing the gas velocity beyond umf results in signifi cant bed expansion before bub-bling begins and a minimum bubbling velocity umb may be defi ned as the gas velocity at which bubbles fi rst appear. In the idealised two-phase theory, however, umf = umb.
Wilhelm and Kwauk (1948), in one of the earliest papers on fl uidiza-tion, suggested that the Froude number, written for the minimum fl u-idizing condition, could be used to indicate the prevalent fl uidization behaviour. Thus
Frugd
mf=2
1.2
where d is the mean diameter of the bed particles. Values of Fr below unity suggest particulate fl uidization and values greater than unity suggest aggregative behaviour.
At velocities above those at which bubbling fl uidization occurs, the nature of the contact between gas and solids changes signifi cantly. As the gas velocity increases, especially in deep beds, the bubbles grow to the size of the bed container and push plugs of material up the bed as they rise. This condition is known as slugging, in which the bed particles stream past the slugs at the bed wall on their downward path. Beyond slugging, when the terminal falling velocity of the particles is exceeded, particles are entrained in the gas stream and considerable elutriation occurs. At this point large discrete bubbles are absent (Yerushalmi and Avidan, 1985) and the bed is said to be turbulent. Kunii and Levenspiel (1991) defi ne a dense-phase bed as one in which there is a reasonably clearly defi ned bed surface, whether the fl uidizing medium is gas or liquid. Further increase in the gas velocity beyond the turbulent fl uidized condition leads ultimately to lean-phase fl uidi-zation and pneumatic conveying of the solids. However, if particles

A Description of Fluidized Bed Behaviour 7
which have been elutriated are recycled to the bed at a suffi ciently high rate then a relatively high concentration of solids can be maintained in the bed. This is the condition of fast fl uidization (Yerushalmi and Avidan, 1985).
Although the majority of food applications exploit the characteristics of either the dense-phase beds or particulate beds which have been described so far, there are food applications of two other phenomena: spouted beds and centrifugal fl uidization. A spouted bed is a method of allowing intimate gas-solid contact for larger particles, with a minimum diameter of perhaps 1 or 2 mm, and a more regular circula-tion pattern than is observed in aggregative fl uidization (Mathur and Epstein, 1974). Spouted beds are covered in more detail in the section on Other Types of Fluidization, below. In the centrifugal fl uidized bed (see section below entitled Centrifugal Fluidization) particles enter a perforated horizontal cylinder which rotates inside a plenum with air blown across the outside of the cylinder and perpendicular to the axis of rotation. The perforated surface of the cylinder acts as the distributor plate and the centrifugal action keeps the particle bed in place close to the cylinder wall. Its particular advantage is that fl uidization requires higher gas velocities than normal, thus allowing, for example, signifi -cant heat input to the bed at lower temperatures than would otherwise be possible.
A number of brief but comprehensive descriptions of basic fl uidized bed behaviour are available (Richardson, 1971; Botterill, 1975; Couderc, 1985) which are recommended as an introduction to the subject.
Industrial applications of fl uidization
The phenomena of rapid particle movement and the intimate contact between solids and at least a portion of the gas give rise to a series of characteristics of aggregative fl uidization such as good mixing, near isothermal conditions and high rates of heat and mass transfer which are exploited in a wide range of unit operations.
The fi rst signifi cant industrial use of fl uidization was in the catalytic cracking of hydrocarbons in the 1940s and arguably the most wide-spread use today is as a reactor for heterogeneous catalytic reactions such as the production of acrylonitrile, maleic anhydride, low-density polythene and phthalic anhydride, amongst others (Yates, 1983; Kunii and Levenspiel, 1991). Other applications have included the calcination of uranyl nitrate and radioactive aluminium nitrate wastes (Jonke et al., 1957), coal gasifi cation, adsorption, drying of particulate solids (Kunii and Levenspiel, 1991), mixing (Geldart, 1992) and granulation (Sherrington and Oliver, 1981; Smith and Nienow, 1983) including the agglomeration of pharmaceutical powders (Rankell et al., 1964). Epstein
8 Applications of Fluidization to Food Processing
(2003) has reviewed the uses of liquid-fl uidized beds and these include particle classifi cation, washing, adsorption and ion exchange, fl occula-tion, electrolytic recovery of metals, bioreactions and liquid-fl uidized bed heat exchangers where the fl uidized particles enhance fi lm heat transfer coeffi cients and reduce the fouling of heat transfer surfaces.
Applications of fl uidization in the food industry
Minimum fl uidizing velocity is approximately proportional to the square of particle diameter and to the difference in density between the particles and the fl uidizing medium. The majority of the applications of aggregative fl uidization in the chemical processing industries involve inorganic solids of relatively high density but particle sizes at most of the order of 1 or 2 mm. Jowitt (1977) suggested that the applications of fl uidization in the food industry fall into two broad categories. In the fi rst group, food pieces are fl uidized directly and because the density of food materials, particularly vegetable matter, is only a little greater than that of water it is possible to fl uidize relatively large particles such as potato chips, peas, sprouts and diced vegetables even with a gas as the fl uidizing medium. Jowitt’s second group of applications are those where a packaged food is placed in a fl uidized bed of inert solids. The heating of sealed containers in this way (i.e. cans or jars in a sterilisation operation) has a number of advantages including improved thermal economy, better control of temperature and a reduction in the consump-tion of process water for cooling. In a development of this idea, Rios et al. (1985) described a ‘fl uidized fl otation cell’ in which larger lighter objects are fl uidized in a bed of denser fi ne particles. Optimum opera-tion occurs at object-to-bed density ratios between 0.5 and 0.9, object-to-bed volume ratios less than 0.4 and gas velocities two or three times greater than the minimum fl uidizing velocity of the fi nes. Outside these conditions, the objects tend either to fl oat on the bed surface or sink. Such systems also require separation of the fl oating objects from the fi nes; this is a possible disadvantage although the authors suggest that in some cases this can be accomplished easily by simple screening.
Many of the uses of gas-solid fl uidized beds in the chemical and processing industries, for example as driers, mixers, granulators and reactors, are relevant also in food processing but in addition there are a number of food-specifi c applications such as freezing, blanching, cooking and roasting (Jowitt, 1977; Smith, 2003) and the sterilisation of canned foods (Jowitt, 1977). Shilton and Niranjan (1993) have reviewed the uses of fl uidization in food processing. In fl uidized bed freezing the solids to be frozen are fl uidized by refrigerated air at temperatures of −30ºC or below and the particles are frozen independently and very rapidly to give a free-fl owing IQF (Individually Quick Frozen) product;

A Description of Fluidized Bed Behaviour 9
in a fl uidized bed drier the enthalpy of vaporisation is supplied by the fl uidizing gas which is usually air, although submerged heating ele-ments can also be used; in mixing applications the bed particles are moved rapidly by the action of rising bubbles; granulation covers those processes which produce granules or instantised products from a solu-tion or slurry and again the heat for evaporation of the solvent is usually supplied by the fl uidizing gas. A related process is fl uidized bed coating where the objective is to coat particles or tablets with a solid material such as lactose but avoid particle growth by agglomera-tion (Vinter, 1982).
Rios et al. (1985) reported the use of a fl uidized bed for the roasting of coffee beans, resulting in improved quality compared to traditional rotating drum methods. However, the fl uidized bed technique involved increased costs and higher levels of pollution due to the rejection of hot exhaust gases. Rios and co-workers have also proposed the use of a ‘whirling bed apparatus’ in which a wedge placed on the gas dis-tributor plate induces a cyclical particle motion and high-intensity mixing (Rios et al., 1985). Coupled with gas recycle, this experimental coffee roasting method allowed for aroma recovery and reduced energy consumption and gave an improved product quality. Roasting times were reduced from the 10–15 minutes in the conventional drum method to between 2 and 4 minutes in the whirling bed apparatus (Arjona et al., 1980). The blanching of vegetables with a mixture of air and water vapour in a combined fl uidized bed conveyor belt system has been reported to give a reduction in energy consumption of over 20% com-pared to water blanching, a signifi cant reduction in the loss of vitamin C and reduced waste water treatment costs (Rios et al., 1978, 1985).
Liquid fl uidization is the basis of both the Oslo (or Krystal) continu-ous crystalliser (Mullin, 1993) which is used in the production of, for example, sugar or citric acid, and the bioreactors in which immobilised cells or enzymes are fl uidized by the reactant solution (Epstein, 2003). It is used in the leaching of vegetable oils from seeds (Rios et al., 1985; Epstein, 2003) and in physical operations such as the washing and preparation of vegetables.
The details of food processing applications are covered in Chapters 3–7; the remainder of this chapter deals with a detailed description of fl uidized bed behaviour.
Gas-solid fl uidized bed behaviour
Infl uence of gas velocity
The relationship between bed pressure drop and superfi cial fl uidiz-ing velocity is shown in Figure 1.3. As the gas velocity increases, the

10 Applications of Fluidization to Food Processing
pressure drop increases in the fi xed bed, or packed bed, region and then levels out as the bed becomes fl uidized. Ideally, the pressure drop then remains constant as the weight of the particles is supported by the fl uid. However, if the velocity is then reduced, marked hysteresis is observed. This is because the bed voidage remains at the minimum fl uidizing value whereas with increasing gas velocity considerable vibration of the particles takes place, the voidage is lower and the pressure drop corre-spondingly is slightly greater. In practice, too, there will be a maximum pressure drop through which the curve passes because of particle inter-locking. Also, as the velocity is reduced, the transition between the fl u-idized and fi xed curves is gradual rather than sudden.
As the superfi cial gas velocity is increased beyond the minimum fl uidizing velocity, a greater proportion of gas passes through the bed in the form of bubbles, the bubbles grow larger, particle movement is more rapid and there is a greater degree of ‘turbulence’. Fluidizing gas velocity is the single most important variable affecting the behaviour of a bed of given particles and it is expressed usually as either:
(1) multiples of umf
e.g. u
umf
= 3 implies that the gas velocity is three times that required
for minimum fl uidization, or as
Superficial velocity
Bed
pre
ssur
e dr
op
mfu
Experimental points
Figure 1.3 Relationship between bed pressure drop and superfi cial fl uidizing velocity.

A Description of Fluidized Bed Behaviour 11
(2) excess gas velocity, u − umf
e.g. u − umf = 1.2 m s−1 implies that the gas velocity is 1.2 m s−1 greater than that required for minimum fl uidization.
In practice, proportionately more gas fl ows interstitially (i.e. between the particles) as the velocity is increased than at umf . In addition, there is a limited interchange of gas between the bubble phase and the dense phase. As the gas velocity is increased further the very smallest parti-cles are likely to be carried out of the bed in the exhaust stream. This is because at any realistic fl uidizing gas velocity, the terminal falling velocity of the very smallest particles will be exceeded. The loss of bed material in this way is known as elutriation and will increase as
uumf
increases. Further increases in gas velocity result in greater
elutriation and a more dilute concentration of the solids remaining in the bed. Eventually all the particles will be transported in the gas stream at the onset of pneumatic conveying.
The section above the fl uidized bed surface is often referred to as the freeboard. This section may have a gradually increasing column diameter, rather like an inverted cone, which is designed to reduce the gas velocity and thus disengage gas and particles. Particles then fall back to a level where the superfi cial gas velocity is suffi cient to support their weight.
Geldart’s classifi cation
Fluidized bed behaviour is affected not only by gas velocity but also by particle size and density. Based upon observations of fl uidized bed behaviour in air at ambient conditions and at velocities below
uumf
= 10 , Geldart (1973) suggested classifying fl uidized particles into
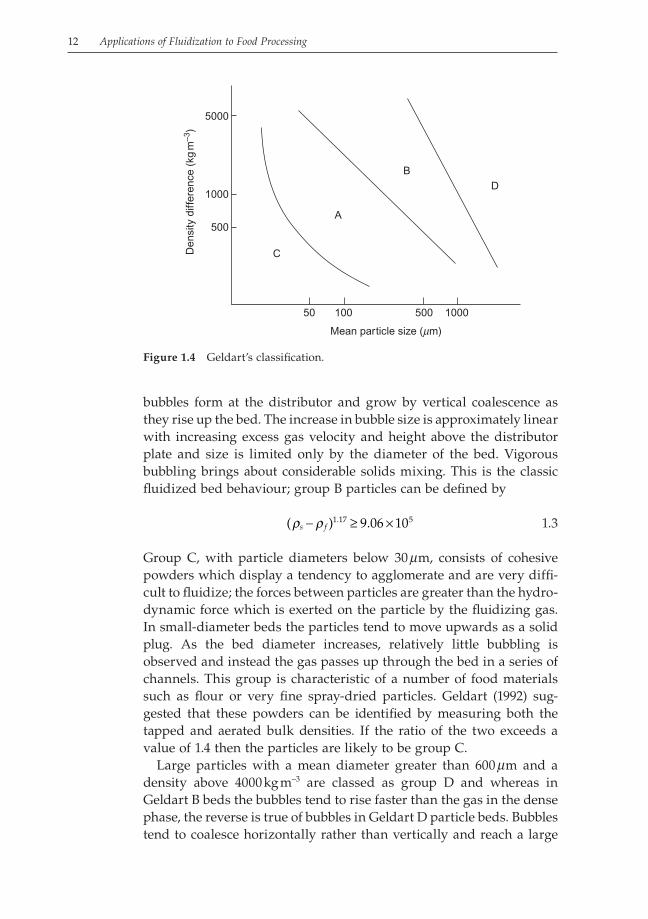
four groups: C (cohesive), A (aeratable), B (sand-like) and D (spoutable). This classifi cation is shown diagrammatically in Figure 1.4 in the form of a plot of the density difference between particle and fl uid against mean particle size.
Group A particles are typically between 20 mm and 100 mm in diam-eter with a particle density less than 1400 kg m−3. These particles exhibit considerable bed expansion as the fl uidizing velocity increases and collapse only slowly as the velocity is decreased. In other words, they tend to retain the fl uidizing gas. The bubbles are limited in size and frequently split up and coalesce as they rise through the bed. On the other hand, the larger and denser group B particles (40–500 mm, parti-cle density in the range 1400–4000 kg m−3) form freely bubbling fl uid-ized beds at or slightly above the minimum fl uidizing velocity. Small
12 Applications of Fluidization to Food Processing
bubbles form at the distributor and grow by vertical coalescence as they rise up the bed. The increase in bubble size is approximately linear with increasing excess gas velocity and height above the distributor plate and size is limited only by the diameter of the bed. Vigorous bubbling brings about considerable solids mixing. This is the classic fl uidized bed behaviour; group B particles can be defi ned by
( ) ..ρ ρs f− ≥ ×1 17 59 06 10 1.3
Group C, with particle diameters below 30 mm, consists of cohesive powders which display a tendency to agglomerate and are very diffi -cult to fl uidize; the forces between particles are greater than the hydro-dynamic force which is exerted on the particle by the fl uidizing gas. In small-diameter beds the particles tend to move upwards as a solid plug. As the bed diameter increases, relatively little bubbling is observed and instead the gas passes up through the bed in a series of channels. This group is characteristic of a number of food materials such as fl our or very fi ne spray-dried particles. Geldart (1992) sug-gested that these powders can be identifi ed by measuring both the tapped and aerated bulk densities. If the ratio of the two exceeds a value of 1.4 then the particles are likely to be group C.
Large particles with a mean diameter greater than 600 mm and a density above 4000 kg m−3 are classed as group D and whereas in Geldart B beds the bubbles tend to rise faster than the gas in the dense phase, the reverse is true of bubbles in Geldart D particle beds. Bubbles tend to coalesce horizontally rather than vertically and reach a large
5000
A
Den
sity
diff
eren
ce (
kg m
–3)
B
C
D1000
500
50 100 500 1000
Mean particle size (mm)
Figure 1.4 Geldart’s classifi cation.

A Description of Fluidized Bed Behaviour 13
size. The resulting solids mixing is poorer than in Geldart B beds. Slugging occurs if the bubble size approaches the bed diameter and large Geldart D beds are prone to spouting (see section on Spouted Beds below). Such particles display very little bed expansion and gen-erally give unstable fl uidization; channelling of the gas is prevalent. Food examples include seeds and vegetables pieces. Group D particles can be defi ned by
( )ρ ρs f d− ≥2 910 1.4
Bubbles and particle movement
Bubble formation at the distributor
The growth of a typical bubble at a small aperture in the distributor plate was described by Zenz (1971) and is illustrated in Figure 1.5 which shows the changes in the interface between the fl uidizing gas entering the bed through an aperture in the distributor plate and the dense phase of the bed. The velocity u of gas passing through the aperture and into the bed will be greater than the minimum fl uidizing velocity of the bed particles umf by at least an order of magnitude and therefore will be suffi cient to lift the interface between gas and bed particles into the position shown in Figure 1.5b. As the void grows (Figure 1.5c), the mean velocity of gas passing through the interface will decrease by a factor equal to the ratio of the aperture area to the area of the interface. Zenz suggested that if this mean velocity is still greater than umf then the interface will remain stable and the void will grow still further, as in Figure 1.5c. At some point the void is large enough that the velocity through the interface decreases to the value of umf and therefore the void reaches its maximum size. The pressure exerted by the fl uidized particles is greater at the base of the void than at its uppermost point, due simply to the depth of ‘fl uid’; that is, the depth of the dense phase. Thus the interface collapses at the base of the void, cutting off the incoming gas into a bubble with a more stable and near-spherical shape. A new interface between the inlet gas and bed particles is then formed and the process is continually repeated. Consequently the volumetric fl ow rate of gas and the minimum fl uid-izing velocity of the bed particles infl uence the initial size of bubbles formed at the distributor (Zenz, 1971).
Bubble growth and bubble shape
The bubbles in a fl uidized bed have a distinct shape and there is a distinct boundary between the gas in the bubble and the

14 Applications of Fluidization to Food Processing
surrounding dense phase although the boundary tends to oscillate. A single bubble, rising in a bed where the bubble diameter is much less than the bed diameter, is essentially spherical but with a slight indentation at the base. However, the shape can be infl uenced and distorted by close proximity to either the bed walls and or submerged surfaces such as heat transfer coils or the nozzles used for injecting liquid in some applications. Both the shape and size are affected when the bubble diameter becomes greater than about half the bed diameter. Rowe (1971) suggested that the minimum size of a bubble is 1–2 orders of magnitude greater than the size of the particles in the bed, which implies a minimum diameter of about 0.005 m in fi ne powders and 0.10 m in beds of coarse particles with a diameter of several mm.
u
(a)
(d) (e)
(b) (c)
u
umf
u
u u
Figure 1.5 Bubble formation at the distributor. Reprinted from Davidson, J.F. and Harrison, D., Fluidization, Academic Press, 1971, with permission from Elsevier.

A Description of Fluidized Bed Behaviour 15
Bubbles grow as they rise through the bed and, although there is some interchange of gas between bubbles and the dense phase, growth is due mainly to coalescence. Small bubbles are overtaken by larger ones, which rise at a greater velocity, and coalescence takes place at the base of the larger bubble, as in Figure 1.6. Vertical indentations often develop downwards from the roof of the bubble which then grow to split the bubble in half vertically but growth by coalescence is far more signifi cant than any size reduction. As they grow, the size of the inden-tation at the base of a bubble increases and they take on the character-istic kidney-shape shown in Figure 1.7. The total volumetric fl ow rate of gas in the bubble phase is approximately constant and consequently the number of bubbles at any bed cross-section decreases with bed height.
As Rowe (1971) has shown in a series of experiments using a tracer gas in a two-dimensional bed, the interstitial gas in a bubbling bed enters the base of a bubble and emerges through the bubble roof, result-ing in some interchange of gas between the dense and bubble phases. However, if the rise velocity of a bubble exceeds umf, on leaving the bubble the gas is swept down the side of the bubble and re-enters at the base. Thus an approximately spherical cloud of gas surrounds the bubble and moves with it up through the bed. In other words, there are in effect two phases formed within the bubble gas. This
Figure 1.6 Coalescence of bubbles. Reprinted from Davidson, J.F. and Harrison, D., Fluidization, Academic Press, 1971, with permission from Elsevier.

16 Applications of Fluidization to Food Processing
phenomenon has signifi cant consequences for the degree of gas inter-change in aggregative fl uidization and much effort has been expended in modelling it in terms of the performance of fl uidized bed chemical reactors. As yet this appears to have little relevance to the food applica-tions of fl uidization although it may become signifi cant in fl uidized bed fermentation when this operation is better understood.
Minimum bubbling velocity
Minimum bubbling velocity umb is defi ned as the gas velocity at which bubbles fi rst appear in aggregative fl uidization. For coarse uniformly-sized particles, for example those in Geldart group B, it is usually the case that umb ≅ umf . However, very fi ne non-uniformly sized particles such as those in group A exhibit smooth bed expansion and no bubbling until a gas velocity considerably in excess of the minimum
fl uidizing velocity is reached. The ratio uu
mb
mf
, which indicates the
degree to which bed expansion occurs, is a strong function of mean particle size and increases to values greater than unity, and perhaps as high as 2 or 3, as the particle size falls below about 100 mm. According
Figure 1.7 Characteristic bubble shapes.

A Description of Fluidized Bed Behaviour 17
to Abrahamson and Geldart (1980), this ratio depends particularly on the fraction of fi nes below 45 mm. They measured the minimum bub-bling velocity for a wide range of fi ne particles in the range 20–72 mm
and proposed the following correlation to predict uu
mb
mf
uu d
mb
mf
f
s f
=−
2300 0 720 13 0 5245
0 8 0 93
ρ µ ωρ ρ
. .
. .
exp( . )( )
1.5
where the mean particle size d, gas viscosity m and the gas and solid densities rf and rs respectively are quoted in SI units and w45 is the mass fraction of fi nes less than 45 mm in diameter.
Bubble rise velocity
The phenomenon of a gas bubble rising in a fl uidized bed is similar to that of a gas bubble rising in a liquid; bubbles rise through the bed at a constant velocity for a given size, this velocity being proportional to bubble diameter. The general relationship for a single bubble is of the form
u k gdSB B= 1.6
where, using SI units, it is usually assumed that k has a value of approximately 0.67 although for fi ne particles this underestimates velocity somewhat and Botterill (1975) suggests that k should be about 50% higher. Kunii and Levenspiel (1991) suggest k = 0.71 and that, based on a theory due to Davidson and Harrison (1963), the rise veloc-ity for bubbles in a bubbling bed uB is equal to the rise velocity of a single bubble plus the excess gas velocity, hence
u u u uB SB mf= + −( ) 1.7
To give an example of likely bubble rise velocities, take a fi ne powder with a mean particle diameter of 200 mm and a particle density of 1500 kg m−3. The Ergun equation (see equation 1.48) gives the minimum fl uidizing velocity as umf = 0.05 m s−1. Now calculating uSB, the rise veloc-ity of a single bubble, from equation 1.6 with k = 0.71, and the rise velocity in a bubbling bed from equation 1.7, gives the data in Table 1.1. Combinations of two fl uidizing gas velocities and two bubble diame-ters have been assumed. This calculation suggests that in a bubbling bed of the given powder, bubbles are likely to rise at velocities in the approximate range 0.5–1 m s−1.

18 Applications of Fluidization to Food Processing
Particle movement due to bubble motion
Particle mixing in a fl uidized bed is brought about solely by the move-ment of bubbles. The space between the indented base of a bubble and the bubble sphere is known as the wake and is occupied by particles. As a bubble rises in the bed (Figure 1.8) it carries with it this wake of particles and then draws up a spout of particles behind it. The wake grows as the bubble rises but a proportion of the wake may also be shed before the bubble reaches the bed surface. Thus the wake fraction, the fraction of the bubble sphere occupied by the wake, varies with time as a bubble rises to the bed surface. The wake fraction also varies with particle size in the approximate range 0.15–0.4 for a variety of (non-food) particles in the size range 60–600 mm; larger wake fractions have been observed with smaller particles but there is no clear relation-ship. Growth and shedding of the wake may be repeated several times in the life of a single bubble. Overall, a quantity of particles equal to one bubble volume is moved through a distance of 1.5 bubble diame-ters by a single rising bubble. Because of the large numbers of bubbles present in a fl uidized bed, the particle mixing pattern is highly complex and extremely rapid.
Based upon these observations, Rowe (1977) derived an expression for the average particle circulation time t around a bed in terms of excess gas velocity and bed height at minimum fl uidization
tHu u
mf
mf
=−0 6. ( )
1.8
Although this expression may not accurately predict circulation time, and in any case particles do not follow a simple predetermined circuit around the bed, it serves to illustrate the signifi cance of the excess gas velocity in determining particle mixing rates. The excess gas fl ow rate, proportional to the excess gas velocity, is essentially the bubble fl ow rate. A greater bubble fl ow generates more bubbles and therefore
Table 1.1 Calculated rise velocity of bubbles.
Velocity (m s−1) u
umf
= 3 u
umf
= 10
dB = 0.025 m dB = 0.075 m dB = 0.025 m dB = 0.075 m
u 0.15 0.15 0.50 0.50(u − umf) 0.10 0.10 0.45 0.45uSB 0.35 0.61 0.35 0.61uB 0.45 0.71 0.80 1.06

A Description of Fluidized Bed Behaviour 19
greater particle movement in unit time and more rapid particle circula-tion. The rapid particle movement in a fl uidized bed leads to its use in particle mixing but is also essential in all other applications of fl uidiza-tion. However, the mixing mechanism is opposed by segregation, where the concentration of one component increases at the bottom of the bed. Particle size has only a slight infl uence upon segregation
Inlet gas
Figure 1.8 Mechanism of particle mixing in a fl uidized bed. From Smith, P.G., Introduction to food process engineering, Kluwer, 2003, fi gure 13.15. With kind permission of Springer Science and Business Media.

20 Applications of Fluidization to Food Processing
(unlike in mechanical mixers). However, segregation increases mark-edly with the difference in density between two components. When the density ratio reaches a value of about 7, almost no mixing occurs in a fl uidized bed. Three main mechanisms can be identifi ed by which particles move in a bed and thus bring about either mixing or segregation:
• particles rising in bubble wakes• large, dense particles falling through bubbles• small, dense particles percolating downwards through the inter-
stices of the dense phase of the bed.
Particle mixing is covered at greater length in Chapter 2.
Distributor plate design
A fl uidized bed requires a distributor plate which supports the bed when it is not fl uidized, prevents particles from passing through and promotes uniform fl uidization by distributing the fl uidizing medium evenly. In aggregative fl uidization the nature of the distributor plate signifi cantly infl uences the number and size of bubbles formed. A wide variety of distributors can be used including porous or sintered plates, manufactured from either ceramic or metal, layers of wire mesh, drilled plates, nozzles, tuyeres, bubble caps or pipe grids. Whatever the struc-ture of the distributor plate, it must have many small orifi ces to allow gas to be injected at a multitude of points; a coarse distributor results in high gas rates at localised points and thus channelling in the bed (Richardson, 1971). Botterill (1975) summarised the requirements of a distributor which should:
(1) promote uniform and stable fl uidization(2) minimise the attrition of bed particles(3) minimise erosion damage, and(4) prevent the fl ow-back of bed material during normal operation and
on interruption of fl uidization when the bed is shut down.
Generally the pressure drop across the plate should be high to promote even gas distribution and is usually some fraction of the pressure drop across the fl uidized bed; porous distributors tend to have much higher pressure drops than other types of plate.
Porous or sintered plates are the ideal and are used in small-scale studies of fl uidized bed behaviour (Kunii and Levenspiel, 1991) and form a highly expanded unstable gas-solid dispersion directly above the distributor which rapidly divides into a large number of small bubbles plus an emulsion phase. Bubbles grow rapidly thereafter by coalescence. Kunii and Levenspiel (1991) also suggest that other

A Description of Fluidized Bed Behaviour 21
materials offer similar properties to porous plates, including fi lter cloths, compressed fi bres, compacted wire plates and even thin beds of small particles. According to Richardson (1971), porous plates are best in terms of the quality of fl uidization but become expensive for large beds and also suffer from poor mechanical strength. Other dis-advantages include the high pressure drop across the plate leading to increased power requirements and operating costs; sensitivity to thermal stresses; and blockage of the plate by fi ne particles or by the products of corrosion.
Perforated plate distributors are widely used in industry because they are cheap and relatively easy to manufacture. Simple perforated plate-type distributors suffer from particles passing back through to the plenum despite mean gas velocities well above the settling velocity for the particles. This is because of imbalances in gas fl ow between the orifi ces, which is diffi cult to eliminate. Hence, such plates take the form of either a layer of mesh sandwiched between two perforated plates or two staggered perforated plates without a mesh screen (Kunii and Levenspiel, 1991). However, these structures often lack rigidity and need to be reinforced or sometimes curved (concave to the bed) to withstand heavy loads. The diameter of the orifi ces in a perforated plate distributor varies from 1 or 2 mm in small beds used for research or very small-scale production to 50 mm in very large chemical reactors. Most food applications are likely to use apertures of inter-mediate size.
Perforated plate distributors cannot be used under severe operating conditions, such as high temperature or a highly reactive or corrosive environment. This is unlikely to be a disadvantage for food applica-tions of fl uidization, but in such circumstances tuyeres, nozzles or bubble caps are used. There is a very wide variety of designs (Kunii and Levenspiel, 1991) from open nozzles to complex bubble caps. The latter have small orifi ces around the periphery of a cap which rises or falls depending on the balance between the pressure of gas below and the back-pressure from above. The use of bubble caps can prevent the back-fl ow of solids (Botterill, 1975) and they may be designed to allow stagnant defl uidized solids to lie between the caps, for example to provide thermal insulation for the protection of the distributor in high temperature processes. However, the potential disadvantages include the settling of particles between tuyeres or nozzles, the need to ensure that the incoming gas is free of fi ne particles which may clog the dis-tributor, and the considerable expense of construction.
The pressure drop across the plate ∆Pd should be high to promote even gas distribution and stable fl uidization and is usually some frac-tion of bed pressure drop ∆P although Kunii and Levenspiel (1991) point out that an excessive ∆Pd has the disadvantage of signifi cantly

22 Applications of Fluidization to Food Processing
increased power consumption and construction costs for the compres-sor. The pressure drop across a porous plate distributor increases in proportion to the superfi cial gas velocity whilst that for a perforated plate or a tuyere or nozzle type increases in proportion to the square of the gas velocity. It is important therefore to design for the minimum pressure drop that gives acceptable fl uidization quality.
For a shallow bed, the pressure drop across the distributor should be of the same order as the bed pressure drop (Richardson, 1971).
Hiby (1964) suggested ∆∆PP
d = 0 15. at low gas velocities of uumf
≅ −1 2
and ∆∆PP
d = 0 015. for u
umf
>> 2 . This stability of fl uidization with a
relatively low plate pressure drop at higher gas velocities is because the fl uidized bed behaves effectively as its own distributor and explains why ∆Pd can be a smaller fraction of ∆P with deeper beds. Siegel (1976)
proposed a minimum value of 0.14 for ∆∆PP
d whilst Shi and Fan (1984)
suggested the same fi gure for porous plates and a value of 0.07 for perforated plates.
Characterisation of particulate solids
A knowledge of the minimum fl uidizing velocity of fl uidized solids is essential for the effective design and operation of fl uidized beds which may be used for mixing, drying, freezing or other unit operations. The available predictive equations for minimum fl uidizing velocity require a knowledge of the size, and sometimes the shape, of particles as well as the properties which characterise the particle bed. Some models require a knowledge of the terminal falling velocity of the particles. Therefore it is appropriate at this point to outline the ways in which particulate solids can be characterised and their bulk behaviour described, and in addition to give an elementary coverage of the inter-action of a particle with a fl uid before proceeding to the prediction of minimum fl uidizing velocity.
Particle size distribution
Any sample of particulate food solids, whether naturally occurring or the result of a manufacturing process, will contain a distribution of particle sizes. However, despite the fact that the existence of a distribu-tion of sizes can affect fl uidized bed behaviour very signifi cantly, pre-dictive models, especially those which have been proposed for the prediction of minimum fl uidizing velocity, usually require a single

A Description of Fluidized Bed Behaviour 23
value of particle size. Two expressions of ‘average’ size can be obtained from particle size distribution curves (Allen, 1981; Smith, 2003). The mode size is the most frequently occurring size and is represented by the peak of the frequency distribution curve, i.e. a plot of the frequency with which a given particle size occurs against that size (Figure 1.9). The frequency distribution curve also shows clearly the overall shape of a particle size distribution and the presence of very large or very small particles. Particle size data can also be plotted as a cumulative distribution in which either the cumulative percentage undersize or cumulative percentage oversize is plotted against size. These two curves are mirror images of each other (Figure 1.10) and the median particle size is the 50% point on either of the cumulative curves, which in turn must be the intersection of the undersize and oversize curves. In other words, it is that particle size which cuts the area under the frequency distribution curve in half. Although each of these quantities gives an indication of the average size, neither takes account of the spread of the distribution and it is possible to obtain the same mode or median with either a very narrow or a very wide distribution. These diffi culties can be overcome by a using a carefully defi ned mean par-ticle size.
Mode particle size
Particle size
Freq
uenc
y %
Figure 1.9 Frequency distribution curve.

24 Applications of Fluidization to Food Processing
Mean particle size
The characteristics of a particle size distribution can be defi ned as the total number, total length, total surface area and total volume of the particles. A distribution of particle sizes can be represented by a set of uniformly-sized particles which retains two characteristics of the orig-inal distribution. The mean particle size of a distribution is then equal to the size of the uniform particles with respect to the two character-istics. Thus, for the defi nition of mean particle size, Mugele and Evans (1951) proposed
x
xdNdx
dx
xdNdx
dxq pq p
q
x
x
p
x
xl
u
l
u,− =
∫
∫ 1.9
where N is the number of particles of size x and p and q are parameters representing the characteristics of a distribution; xl and xu are the lower and upper limits of the size distribution respectively. Values of 0 for number, 1 for length, 2 for area and 3 for volume are assigned to the parameters p and q. Most methods of determining particle size
Particle size
Oversize
Undersize
Median0
50
Cum
ula
tive
%
100
Figure 1.10 Cumulative percentage undersize and oversize curve.

A Description of Fluidized Bed Behaviour 25
generate data in the form of the number of particles within a given size band. The mean size is then obtained by summing over all the band widths and the model becomes
xx N
x Nq pq p
q
p,− = ∑
∑( )
( ) 1.10
Substituting all the possible combinations of characteristics, i.e. values of p and q, into equation 1.10 gives rise to a number of different defi ni-tions of the mean size of a distribution. At minimum fl uidization the drag force acting on a particle due to the fl ow of fl uidizing gas over the particle is balanced by the net weight of the particle. The former is a function of surface area and the latter is proportional to particle volume. Consequently the surface-volume mean diameter, with p = 2 and q = 3, is the most appropriate particle size to use in expressions for minimum fl uidizing velocity. It is defi ned by equation 1.11
xx N
x N3 2
3
2, = ∑∑
( )
( ) 1.11
Of the many ways of measuring or deducing the size of particles, sieving remains one of the easiest and cheapest and is very widely used. Although time consuming, it is the only method which gives a mass distribution and the only method which can be used for a reason-ably large sample of particles which are not in suspension. A sieve analysis is carried out by placing a sample on the coarsest of a set of standard sieves made from woven wire. Below this sieve the other sieves are arranged in order of decreasing aperture size. The sample is then shaken for a fi xed period of time, and the material on each sieve collected and weighed. For particularly fi ne or cohesive powders, air swept sieving can be used in which an upward fl ow of air from a rotating arm underneath the mesh prevents blockage of the sieve apertures.
The defi nition of the surface-volume mean diameter given by equa-tion 1.11 must be modifi ed for use with data from a sieve analysis. By assuming that the shape and density of the particles are constant for all size fractions, a number distribution can be transformed to a mass distribution (Smith, 2003) and therefore the surface-volume diameter becomes
x
x
3 21
, =( )∑ ω 1.12
26 Applications of Fluidization to Food Processing
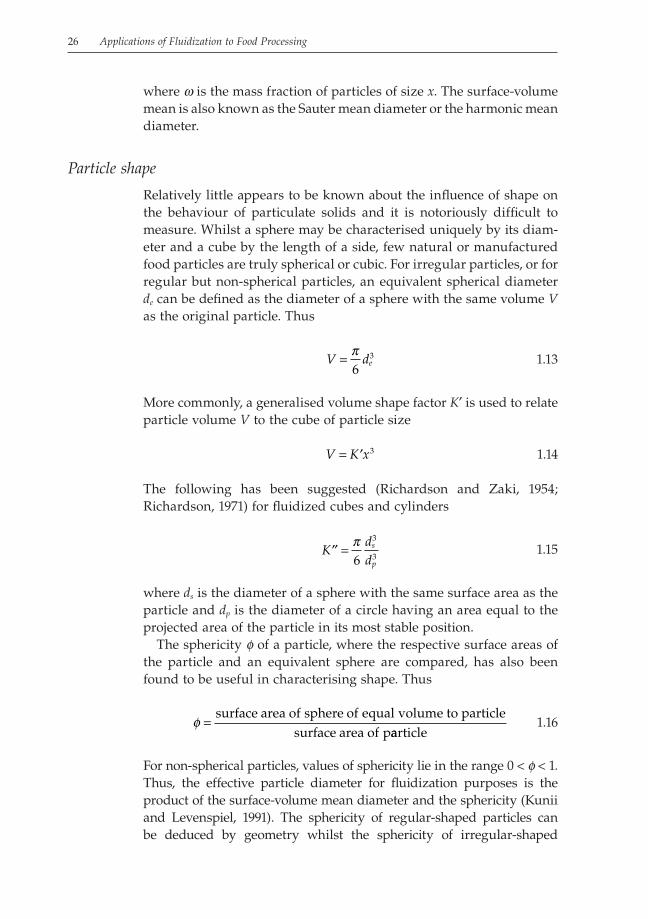
where w is the mass fraction of particles of size x. The surface-volume mean is also known as the Sauter mean diameter or the harmonic mean diameter.
Particle shape
Relatively little appears to be known about the infl uence of shape on the behaviour of particulate solids and it is notoriously diffi cult to measure. Whilst a sphere may be characterised uniquely by its diam-eter and a cube by the length of a side, few natural or manufactured food particles are truly spherical or cubic. For irregular particles, or for regular but non-spherical particles, an equivalent spherical diameter de can be defi ned as the diameter of a sphere with the same volume V as the original particle. Thus
V de= π6
3 1.13
More commonly, a generalised volume shape factor K′ is used to relate particle volume V to the cube of particle size
V K x= ′ 3 1.14
The following has been suggested (Richardson and Zaki, 1954; Richardson, 1971) for fl uidized cubes and cylinders
′′ =Kdd
s
p
π6
3
3 1.15
where ds is the diameter of a sphere with the same surface area as the particle and dp is the diameter of a circle having an area equal to the projected area of the particle in its most stable position.
The sphericity f of a particle, where the respective surface areas of the particle and an equivalent sphere are compared, has also been found to be useful in characterising shape. Thus
φ =surface area of sphere of equal volume to particle
surface area of paarticle 1.16
For non-spherical particles, values of sphericity lie in the range 0 < f < 1. Thus, the effective particle diameter for fl uidization purposes is the product of the surface-volume mean diameter and the sphericity (Kunii and Levenspiel, 1991). The sphericity of regular-shaped particles can be deduced by geometry whilst the sphericity of irregular-shaped
A Description of Fluidized Bed Behaviour 27
particles has to be determined by experiment. This is achieved by passing gas upwards through a packed bed of the particles at gas velocities below the minimum fl uidizing velocity and measuring the packed bed interparticle voidage and frictional pressure drop. Kunii and Levenspiel (1991) suggest inserting these, and other appropriate values, into the Ergun equation (see equation 1.48) to obtain an average value for the sphericity. This procedure was used by Mishra et al. (1982) to estimate the sphericity for packed beds of grated yeast pellets.
Bulk particle properties
Expressions for minimum fl uidizing velocity can be derived by exam-ining the relationship between the velocity of a fl uid passing through a packed bed of particles and the resultant pressure drop across the bed. Consequently it is necessary to defi ne a number of bulk particle properties which infl uence fl uidized bed behaviour.
The solids density rs is the density of the solid material from which the particle is made and excludes any pore spaces within the particle. It can be measured using a specifi c gravity bottle and a liquid in which the particle does not dissolve. The envelope density of a particle is that which would be measured if an envelope covered the external particle surface, i.e. it is equal to the particle mass divided by the external volume. In most analyses the envelope and solids densities are assumed to be equivalent. The bulk density of a powder rB is the effective density of the particle bed defi ned by
ρB =mass of solids
total bed volume 1.17
The bulk density will be considerably smaller than the solids density because the bed volume includes the volume of the spaces between particles.
Intraparticle porosity refers to the fraction of the particle volume which is occupied by internal pores; most manufactured food particles are porous. However, it is important to distinguish this quantity from bed voidage. The interparticle voidage e is the fraction of the packed bed occupied by the void spaces between particles and is defi ned as
ε =void volume
total bed volume 1.18
This can be written as
ε =−total bed volume particle volume
total bed volume 1.19

28 Applications of Fluidization to Food Processing
or
ε = −1particle volume
total bed volume 1.20
Volume is inversely proportional to density and therefore equation 1.20 becomes
ε ρρ
= −
1 B
s
1.21
The specifi c surface S is the external surface area of a particle per unit
particle volume and for a sphere this is equal to 6d
. The total surface
area of a porous particle, including that of the internal pore spaces, can be measured by gas adsorption techniques and may be of the order of several hundred square metres per gram of material.
Terminal falling velocity and particle drag coeffi cient
Figure 1.11 represents the cross-section through a spherical particle over which an ideal non-viscous fl uid fl ows. The fl uid is at rest at points 1 and 3 but the fl uid velocity is a maximum at points 2 and 4. There is a corresponding decrease in pressure from point 1 to point 2 and from 1 to 4. However, the pressure rises to a maximum again at point 3. If the ideal fl uid is replaced with a real viscous fl uid then, as the pressure increases towards point 3, the boundary layer next to the particle surface becomes thicker and then separates from the surface as in Figure 1.12. This separation of the boundary layer gives rise to
1
2
3
4
Figure 1.11 Fluid fl ow over a spherical particle. From Smith, P.G., Introduction to food process engineering, Kluwer, 2003, fi gure 13.3. With kind permission of Springer Science and Business Media.

A Description of Fluidized Bed Behaviour 29
turbulent eddies within which energy is dissipated and which creates a force on the particle known as form drag. The total force acting on the particle because of the fl uid fl ow is then the sum of form drag and the viscous drag over the surface.
A particle falling from rest, through a fl uid, under gravity, will accelerate until it reaches a constant velocity known as the terminal falling velocity ut. This velocity can be determined by balancing the product of particle mass and acceleration, the particle weight (mg) which pulls the particle down under gravity, the upthrust due to the fl uid displaced as the particle falls (m′g) and the drag force (F) acting against the particle weight. Therefore
mg m g F mdudt
− ′ − = 1.22
At its terminal falling velocity the particle no longer accelerates and dudt
= 0 . Substituting for this condition, for the mass (m) of a particle
of diameter d and density rs and for the mass of displaced fl uid (m′) of density rf the drag force becomes
F g ds f= −π ρ ρ6
3( ) 1.23
Stokes (1851) fi rst showed that the drag force F on a sphere was given by
F d u= 3π µ 1.24
where u is the relative velocity between the sphere and the fl uid. Thus
Figure 1.12 Separation of the boundary layer. From Smith, P.G., Introduction to food process engineering, Kluwer, 2003, fi gure 13.4. With kind permission of Springer Science and Business Media.

30 Applications of Fluidization to Food Processing
36
3π µ π ρ ρd u g ds f= −( ) 1.25
and, putting u = ut, the terminal falling velocity becomes
ug d
ts f=−( )ρ ρ
µ
2
18 1.26
This is Stokes’ law which is valid in the particle Reynolds number range 10−4 < Re < 0.20 where the Reynolds number is defi ned by
Reu df t=
ρµ
1.27
and assumes that the particle is a single smooth, rigid sphere falling in a homogeneous fl uid, that it is unaffected by the presence of any other particles and that the walls of the vessel do not exert a retarding effect on the particle.
A particle drag coeffi cient cD can now be defi ned as the drag force divided by the product of the dynamic pressure acting on the particle (i.e. the velocity head expressed as an absolute pressure) and the cross-sectional area of the particle. This defi nition is analogous to that of a friction factor in conventional fl uid fl ow. Hence
cF
d uDf
=π ρ2 2
4 2
1.28
On substituting for the drag force from equation 1.24, this gives
cRe
D = 24 1.29
for the Stokes region.At Reynolds numbers beyond the Stokes region the boundary layer
separates from the particle surface at a point just forward of the centre line of the sphere. A wake is formed containing vortices which results in larger frictional losses and a signifi cantly increased drag force. This is known as the transition region (0.20 < Re < 500) where no analytical solution for the drag force is possible and empirical equations must be used to describe the relationship between drag coeffi cient and Reynolds number. One of the most convenient and widely used of these is that due to Schiller and Naumann (1933)

A Description of Fluidized Bed Behaviour 31
cRe
ReD = +( )241 0 15 0 687. . 1.30
As the Reynolds number increases further, vortex shedding takes place (Figure 1.13) in what is known as the Newton region, in the range 500 < Re < 2 × 10⁵, where the drag coeffi cient has a value of approxi-mately 0.44. Consequently equation 1.28 gives the drag force as
F d uf= 0 055 2 2. π ρ 1.31
which, on substitution into equation 1.23, gives the terminal falling velocity as
udg
ts f
f
=−
1 74.( )ρ ρ
ρ 1.32
At still greater Reynolds numbers the boundary layer itself becomes turbulent and separation occurs at the rear of the sphere and closer to the particle. In this fully turbulent region, beyond Re = 2 × 10⁵, the drag coeffi cient falls further to a value of about 0.10.
Minimum fl uidizing velocity in aggregative fl uidization
The superfi cial velocity of gas in a fl uidized bed, relative to the minimum fl uidizing velocity, is the quantity which has the greatest infl uence on the behaviour of a given particle bed. Consequently, a knowledge of minimum fl uidizing velocity is vital to the operation of fl uidized beds and much research effort has been expended in attempting to predict it.
Figure 1.13 Vortex shedding. From Smith, P.G., Introduction to food process engineering, Kluwer, 2003, fi gure 13.4. With kind permission of Springer Science and Business Media.

32 Applications of Fluidization to Food Processing
Voidage and pressure drop at incipient fl uidization
At the point of incipient fl uidization the drag force exerted on a particle is equal to its net weight. For the whole particle bed the drag force can be equated to the product of bed pressure drop ∆P and bed cross-sectional area A. The net bed weight is then the product of bed volume, net density, the fraction of the bed (1 − e) which is occupied by particles and the acceleration due to gravity. Thus, at minimum fl uidizing velocity
∆P A AH gmf mf s f mf= − −( )( )ρ ρ ε1 1.33
or, eliminating the cross-sectional area
∆P gHmf s f mf mf= − −( )( )ρ ρ ε1 1.34
Alternatively equation 1.34 may be thought of as equating the hydro-static pressure at the base of a column of fl uid to the product of bed height, density and the acceleration due to gravity. However, in the case of fl uidized solids the density is equal to the difference in density between the particle and the fl uidizing medium, the term (1 − e) being included because it is only the particles which contribute signifi cantly to the pressure drop. Equation 1.34 allows bed voidage to be deter-mined from experimental measurements of bed pressure drop and bed height. In practice, bed voidage is a function of particle size, particle shape and particle size distribution. Richardson (1971) suggests an approximate value of emf = 0.4 for spherical particles. This is perhaps a little low, with values being closer to 0.5 for many particles (Leva, 1959; Kunii and Levenspiel, 1991).
Carman-Kozeny equation
Minimum fl uidizing velocity can be predicted from a knowledge of the relationship between the velocity of a fl uid passing through a bed of particles and the consequent pressure drop across the bed. However, modelling this relationship is inherently diffi cult because of the irregu-lar nature of the void spaces in a bed of irregular non-uniformly sized particles; an exact solution is not possible because of the tortuous fl ow paths followed by the fl uid (Figure 1.14). The Carman-Kozeny model is based upon the idea that a packed bed can be modelled by a series of capillaries (Figure 1.15), to which the Hagan-Poiseuille relationship for laminar fl ow in a tube is applied. By using an equivalent diameter d′ and length L′ to represent the void spaces, the interstitial velocity u′ (i.e. the velocity between the particles in a packed bed) is given by

A Description of Fluidized Bed Behaviour 33
′ = ′′
uPdL
∆ 2
32 µ 1.35
If now the cross-sectional area which determines the interstitial veloc-ity for a given volumetric fl ow rate is proportional to the interparticle voidage, it follows that
′ =uuε
1.36
Kozeny further suggested that the equivalent pore space diameter d′ is given by
Figure 1.14 Flow path through a packed bed of irregular non-uniformly sized particles.

34 Applications of Fluidization to Food Processing
′ =dSB
ε 1.37
where SB is the particle surface area per unit bed volume which comes into contact with the fl uid passing through the bed. In turn, this quan-tity is related to the specifi c surface by the fraction of the bed occupied by particles (1 − e). Thus
S SB = −( )1 ε 1.38
Substituting each of these assumptions into equation 1.35, and further assuming that the equivalent pore space length is proportional to the bed depth H, results in the Carman-Kozeny equation
uP
KS H=
−( )
εε µ
3
2 21∆ 1.39
which relates superfi cial fl uid velocity and pressure drop for a bed of incompressible particles, i.e. for cases where the bed voidage is constant.
The Carman-Kozeny expression for minimum fl uidizing velocity is obtained by substituting for the pressure drop at minimum fl uidiza-tion from equation 1.34 and therefore
L′
d ′
Figure 1.15 Carman-Kozeny model of a packed bed.

A Description of Fluidized Bed Behaviour 35
ug
KSmf
mf s f
mf
=−−
ε ρ ρε µ
3
2 1( )( )
1.40
The dimensionless constant K is known as Kozeny’s constant and has a value of approximately 5.0 although strictly it is a function of both intraparticle porosity and particle shape. Assuming now that the bed
particles are spherical for which the specifi c surface is equal to 6d
, and
that K = 5, the minimum fl uidizing velocity is given by
ugd
mfmf s f
mf
=−−( )
ε ρ ρε µ
3 2
180 1( )
1.41
This relationship is based on an assumption of laminar fl ow between particles in a packed bed. Consequently the particle Reynolds number is limited to Remf < 20 (Kunii and Levenspiel, 1991) where
Reu d
mff mf=
ρµ
1.42
This corresponds to relatively fi ne particles, certainly below 500 mm in diameter and perhaps smaller, and thus can be used only for fi ne food powders, perhaps those encountered in drying and mixing operations, and not for the larger particulates such as vegetable pieces in fl uidized bed freezers or large agglomerates in granulation systems. Note that equation 1.41 suggests that umf is proportional to the difference in density between particle and fl uid, proportional to the square of par-ticle diameter and inversely proportional to fl uid viscosity.
Ergun equation
The Carman-Kozeny equation works well for fi ne particles. However, for large particles, greater than about 600 or 700 mm, the Carman-Kozeny relationship is inadequate and predicts far too low a pressure drop. For larger particles, for example peas in a fl uidized bed freezer, the minimum fl uidizing velocity is high and the kinetic energy losses are signifi cant. In these circumstances the Carman-Kozeny equation vastly overestimates umf and the Ergun equation is more accurate. This is a semi-empirical equation for the pressure drop per unit bed depth, containing two terms. Ergun’s equation may be expressed as
∆PH
ud
ud
f= −( )+
−( )150 1 1 75 12
3 2 2
2
3
ε µε φ
ε ρε φ
. 1.43
36 Applications of Fluidization to Food Processing
The fi rst term represents the pressure loss due to viscous drag (this is essentially the Carman-Kozeny equation) whilst the second term rep-resents kinetic energy losses, which are signifi cant at higher velocities (kinetic energy being proportional to velocity squared). Equation 1.43 is valid in the range 1 < Re < 2000 where the Reynolds number is defi ned by
Reu
S=
−( )
ρε µ1
1.44
Writing Ergun’s equation for minimum fl uidizing conditions, and assuming the particles to be spherical (f = 1), gives
∆PH
ud
udmf
mf mf
mf
mf f mf
mf
=−
+−150 1 1 75 12
3 2
2
3
( ) . ( )ε µε
ε ρε
1.45
and substituting for pressure drop from equation 1.34 gives
( )( ) .
ρ ρε µ
ερ
εs fmf mf
mf
f mf
mf
gu
du
d− =
−+
150 1 1 753 2
2
3 1.46
This expression is rather unwieldy but can be simplifi ed con-
siderably. Multiplying through by ρµf d3
2 results in
ρ ρ ρ
µε ρ
ε µρ
ε µf s f mf mf f
mf
f mf
mf
d g u d d u−( )=
−( )+
3
2 3
2 2 2
3 2
150 1 1 75. 1.47
which can be put into the form
Ga ReRemf
mfmf
mf
mf
=−( )
+150 1 1 75
3
2
3
εε ε
. 1.48
This is a quadratic equation in Remf where the Galileo number Ga is defi ned by
Gad gf s f=
−( )ρ ρ ρµ
3
2 1.49
and the particle Reynolds number at minimum fl uidization by equa-tion 1.42. The Galileo number is also known as the Archimedes number which is usually given the symbol Ar.
Knowledge of the size and density of the particles to be fl uidized, of the density and viscosity of the fl uidizing gas (at the relevant

A Description of Fluidized Bed Behaviour 37
temperature) as well as a knowledge of the interparticle voidage at minimum fl uidizing conditions (which can be obtained from equation 1.34) allows the Ergun equation to be solved for Remf . This in turn will permit umf to be found with the already known values of d, m and rf . For very large particles the fi rst (viscous drag) term is dominated by the kinetic energy term and it can safely be ignored. Equation 1.48 then reduces to
ReGa
mfmf23
1 75=
ε.
1.50
a slightly more convenient relationship. Kunii and Levenspiel (1991) suggest that such a procedure is valid for Remf > 1000. Smith (2003) and Jackson and Lamb (1981) give worked examples illustrating how both the Ergun and Carman-Kozeny equations can be used to determine the minimum fl uidizing velocity of food particulates. Smith demon-strates that for particles with diameters of several millimetres (such as peas or small vegetable pieces), the Carman-Kozeny equation vastly overestimates minimum fl uidizing velocity. Further, for such particles, the error in leaving out the viscous drag term in the Ergun equation is small and of the order of 2%.
Minimum fl uidizing velocity as a function of terminal falling velocity
Richardson (1971) summarises a method of predicting minimum fl uid-izing velocity as a function of the terminal falling velocity of a particle. This requires the terminal falling velocity ut to be expressed in terms of the Galileo number. Thus, treating the Stokes, transition and Newton regions in turn:
(1) For the Stokes region, if equation 1.26 is multiplied by ρµf d the
result is
ρ
µρ ρ ρ
µf t s f fu d g d
=−( ) 3
218 1.51
which in terms of the Galileo number (equation 1.49) is
ReGa
t =18
1.52
or
Ga Ret= 18 1.53

38 Applications of Fluidization to Food Processing
Stokes’ law is valid for Reynolds numbers below 0.20 which becomes, for equation 1.53, Ga < 3.6.
(2) For the transition region, substituting for the defi nitions of drag coeffi cient (equation 1.28) and drag force (equation 1.24) in the Schiller and Naumann equation for drag coeffi cient gives
π ρ ρ π ρ6 4 2
241 0 153
2 20 687g d
d uRe
Res ff
tt( ) . .− = +( ) 1.54
When multiplied by 6
2
ρµ
f this results in
ρ ρ ρ
µρµ
f s f f
tt
g d d uRe
Re( )
. .−= +( )
3
2
2 2 2
20 68718 1
1 0 15 1.55
which in turn becomes
Ga Re Ret t= +( )18 1 0 15 0 687. . 1.56
and which is valid in the range 3.6 < Ga < 105.(3) Finally, for the Newton region, at Reynolds numbers greater than
2 × 10⁵, squaring equation 1.32 and multiplying by ρµf d2 2
2 yields
u d d dgt f f s f
f
2 2 2
22
2 2
21 74ρµ
ρµ
ρ ρρ
=−
( . )( )
1.57
In terms of the Reynolds number this becomes
Red g
tf s f2 2
3
21 74=−
( . )( )ρ ρ ρµ
1.58
and hence
Ga Ret= 0.33 2 1.59
for Galileo numbers greater than about 105. If now the voidage at minimum fl uidizing conditions emf is known, then for a given value of the Galileo number Ga the ratio of terminal falling velocity to minimum
fl uidizing velocity u
uRe
Ret
mf
t
mf
=
can be calculated from the Ergun
equation and one of equations 1.53, 1.56 or 1.59 respectively. Richardson
presents a plot of u
uRe
Ret
mf
t
mf
=
against Ga for commonly

A Description of Fluidized Bed Behaviour 39
encountered values of voidage (i.e. 0.38, 0.40 and 0.42 respectively) (Figure 1.16). Thus a knowledge of fl uid density and viscosity, particle density and diameter allows the calculation of Ga and thus umf . The
values of u
ut
mf
are constant for Ga < 3.6 and for Ga > 105; the proce-
dure is rather less convenient in the transition region.
Semi-empirical correlations
Probably the most useful and accurate of the many semi-empirical equations available is that due to Leva
ud
mfs f=−
0 00791 82 0 94
0 88.( ). .
.
ρ ρµ
1.60
This equation allows the prediction of minimum fl uidizing velocity from a knowledge of the mean particle diameter, the particle density, the density of fl uidizing medium and the viscosity of fl uidizing medium (SI units). Couderc (1985) quotes data which show that the inaccuracy of Leva’s equation increases signifi cantly outside the range 2 < Re < 30.
10–20
10
20
30
40
50
60
70
80
90
100
110
120
10–1 100 101 102
Ga – Galileo number
Ut /
Um
f or
Re t
/Re m
fUmf for spheres from
Rowe (1961)Rowe and Partridge (1965)
Pinchbeck and Popper (1956)
Richardson and Zaki (1954)
Wilhelm and Kwauk (1948)Godard and Richardson (1968)
emf = 0.38
emf = 0.40
emf = 0.42
103 104 105 106 107 108
Figure 1.16 Ratio of terminal falling velocity to minimum fl uidizing velocity as a function of Galileo number. Reprinted from Davidson, J.F. and Harrison, D., Fluidization, Academic Press, 1971, with permission from Elsevier.

40 Applications of Fluidization to Food Processing
A number of empirical variations on the Ergun equation have been proposed. It can be seen that equation 1.48 is of the form
α βRe Remf mf Ga2 + − = 0 1.61
This can be rearranged to give
RemfGa= ( ) + ( )
− ( )βα α
βα2 2
2 0 5.
1.62
Recognising that a and b change very little over a very wide range of conditions, a number of workers have fi tted experimental data for minimum fl uidizing velocity to the Ergun form (Kunii and Levenspiel, 1991). The resulting correlations require neither a knowledge of emf nor of f in order for them to be used to predict umf . Two examples widely used are those due to Wen and Yu (1966) and to Saxena and Vogel (1977), equations 1.63 and 1.64 respectively
Remf Ga= + −[( . ) ( . )] ..33 7 0 0408 33 72 0 5 1.63
Remf Ga= + −[( . ) ( . )] ..25 3 0 0571 25 32 0 5 1.64
Experimental measurement
The standardised procedure for measuring minimum fl uidizing veloc-ity is to fl uidize a bed of particles vigorously for some minutes and then reduce gas velocity in small increments to overcome the hysteresis arising from frictional forces in the bed, recording the bed pressure drop each time. This may be done with a simple water manometer with one leg open to atmosphere and one leg connected to a narrow tube placed in the bed and just below the bed surface. The data are then interpreted as in Figure 1.3; umf corresponds to the intersection of the straight lines representing the fi xed and fl uidized beds.
Fluidized bed behaviour at high gas velocities
Slugging
As the superfi cial gas velocity increases, the nature of the bubbles changes. Especially in beds of small diameter or in deep beds, i.e. those with a bed depth to diameter ratio greater than unity, and with fi ne particles, the bubbles grow to the size of the bed container and push plugs of material up the bed as they rise. The particles then stream past
A Description of Fluidized Bed Behaviour 41
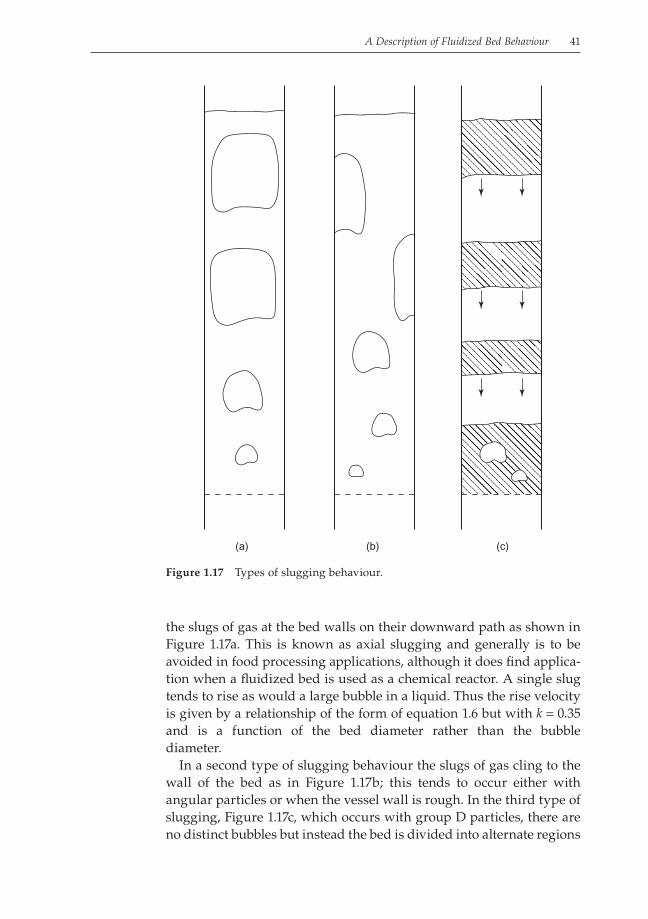
the slugs of gas at the bed walls on their downward path as shown in Figure 1.17a. This is known as axial slugging and generally is to be avoided in food processing applications, although it does fi nd applica-tion when a fl uidized bed is used as a chemical reactor. A single slug tends to rise as would a large bubble in a liquid. Thus the rise velocity is given by a relationship of the form of equation 1.6 but with k = 0.35 and is a function of the bed diameter rather than the bubble diameter.
In a second type of slugging behaviour the slugs of gas cling to the wall of the bed as in Figure 1.17b; this tends to occur either with angular particles or when the vessel wall is rough. In the third type of slugging, Figure 1.17c, which occurs with group D particles, there are no distinct bubbles but instead the bed is divided into alternate regions
(a) (b) (c)
Figure 1.17 Types of slugging behaviour.

42 Applications of Fluidization to Food Processing
of dense phase and disperse phase with approximately horizontal interfaces. Particles rain down from one slice of dense phase through a region of disperse phase to the next slice of dense phase below.
Baeyens and Geldart (1974), in an experimental study using a wide range of particle sizes and bed diameters, suggested that generally slugging does not occur below a bed height of Hs given by
H DS bed= 0 6 0 175. . 1.65
where Dbed is the bed diameter.
Turbulent fl uidization and fast fl uidization
As the superfi cial gas velocity is increased still further the two-phase bed structure, of a bubble or slug phase plus a dense phase, begins to break down and the bed is characterised by signifi cant pressure fl uc-tuations. The bed is now referred to as a turbulent bed where discrete bubbles or slugs are no longer present. There is far more particle ejec-tion into the freeboard and a far less distinct interface between the dense-phase bed and the freeboard. The upper limit of turbulent fl u-idization is the point where particles are transported out of the column. Elutriated or transported solids must now be recycled to the bed via a cyclone if any solids are to be retained in the fl uidized column. If the return feed rate to the bed is low then the solid concentration which results in the bed gives rise to a dilute phase of low concentration which is similar to that found in pneumatic conveying. However, if the solids feed rate is high then a higher concentration of solids can be maintained in the bed and this is known as fast fl uidization; gas veloci-ties are very high, at least an order of magnitude greater than the ter-minal falling velocity. There is an extensive literature on so-called high velocity fl uidization, which includes both turbulent and fast fl uidiza-tion. However, as with slugging, there are few if any applications involving food materials and these regimes are relevant only to het-erogeneous chemical reactors.
Elutriation and entrainment
In any fl uidized bed operating with a gas velocity above umf some par-ticles will be transported into the gas stream above the bed surface; this is called entrainment. Some of these particles will be transported suffi ciently so as to leave the fl uidized bed column entirely and this mass of solids is then referred to as carry-over. However, the phenom-enon is a little more complex. Fractionation or preferential separation of the bed particles occurs and this changes with height above the bed

A Description of Fluidized Bed Behaviour 43
surface; it is this phenomenon which is called elutriation. In a bed with a distribution of particle sizes, and most fl uidized beds of real interest come into this category, only the smallest particles are removed and form a disperse phase which occupies the freeboard. The freeboard is the term given to the space between the surface of the dense phase and the point at which gas exits the column. It is important to differentiate, however, between the disperse phase and so-called dilute-phase fl uidization where all the particulate solids are carried in the gas stream and which corresponds to one of the regimes of pneumatic conveying.
Elutriation is important in most industrial fl uidized beds and is generally thought of as a disadvantage. In addition to the small parti-cles which may be present in the initial particle size distribution, fi nes may be created in the course of operation by the attrition of bed parti-cles. Elutriated particles usually need to be collected and recovered either because they represent the loss of product particles of a given size, because they must be separated from the exhaust gas for environ-mental reasons, or because of safety concerns; there is a considerable risk of a dust explosion with very fi ne particles and perhaps especially so with many food particulates. Therefore the fl uidized bed plant will require ancillary gas cleaning equipment such as a cyclone, fi lter or electrostatic precipitator to separate the fi nes from the gas. The loss of a particular size fraction from the bed may change fl uidized bed behaviour and it then becomes important to return the fi nes to the bed continuously.
Elutriation can occur only if the terminal falling velocity of a particle is exceeded. Particles are brought to the surface of the bed by the rising gas bubbles which carry particles up the bed in the bubble wake and the eruption of the bubbles at the dense phase surface then throws particles up into the freeboard where the local velocity is at least approximately equal to the superfi cial velocity and possibly higher. In addition, gas bubbles rise through the bed at a velocity higher than that of the surrounding dense phase and also the pressure in the bubble is very slightly higher than the surrounding interstitial gas. These factors explain why the particles in the bubble wake material are thrown into the freeboard as packets of particles. The fi nes are then carried up in the gas stream and the larger particles fall back.
There is, however, considerable variation across a bed diameter in the velocity of the gas leaving the surface of the bed simply because any given bed cross-section contains both bubble phase and lean phase (Figure 1.18). As the gas travels up the column these variations in veloc-ity become less pronounced and therefore the larger particles fall back as the local velocity falls below their terminal falling velocity. The height above the bed surface at which the larger particles disengage is

44 Applications of Fluidization to Food Processing
Variation in local gas velocity and elutriation rate
Constant local gas velocity and elutriation rate
TDH
Dense phase
Freeboard
Length of arrow indicates local gas velocity
Figure 1.18 Elutriation and transport disengaging height (TDH).
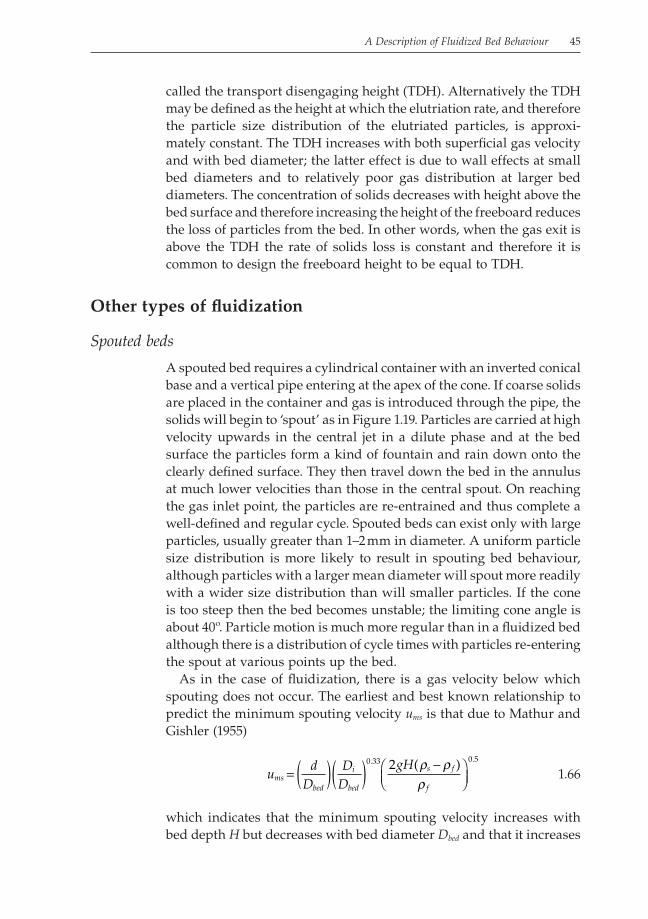
A Description of Fluidized Bed Behaviour 45
called the transport disengaging height (TDH). Alternatively the TDH may be defi ned as the height at which the elutriation rate, and therefore the particle size distribution of the elutriated particles, is approxi-mately constant. The TDH increases with both superfi cial gas velocity and with bed diameter; the latter effect is due to wall effects at small bed diameters and to relatively poor gas distribution at larger bed diameters. The concentration of solids decreases with height above the bed surface and therefore increasing the height of the freeboard reduces the loss of particles from the bed. In other words, when the gas exit is above the TDH the rate of solids loss is constant and therefore it is common to design the freeboard height to be equal to TDH.
Other types of fl uidization
Spouted beds
A spouted bed requires a cylindrical container with an inverted conical base and a vertical pipe entering at the apex of the cone. If coarse solids are placed in the container and gas is introduced through the pipe, the solids will begin to ‘spout’ as in Figure 1.19. Particles are carried at high velocity upwards in the central jet in a dilute phase and at the bed surface the particles form a kind of fountain and rain down onto the clearly defi ned surface. They then travel down the bed in the annulus at much lower velocities than those in the central spout. On reaching the gas inlet point, the particles are re-entrained and thus complete a well-defi ned and regular cycle. Spouted beds can exist only with large particles, usually greater than 1–2 mm in diameter. A uniform particle size distribution is more likely to result in spouting bed behaviour, although particles with a larger mean diameter will spout more readily with a wider size distribution than will smaller particles. If the cone is too steep then the bed becomes unstable; the limiting cone angle is about 40º. Particle motion is much more regular than in a fl uidized bed although there is a distribution of cycle times with particles re-entering the spout at various points up the bed.
As in the case of fl uidization, there is a gas velocity below which spouting does not occur. The earliest and best known relationship to predict the minimum spouting velocity ums is that due to Mathur and Gishler (1955)
ud
DD
DgH
msbed
i
bed
s f
f
= ( )( ) −
0 33 0 52. .( )ρ ρρ
1.66
which indicates that the minimum spouting velocity increases with bed depth H but decreases with bed diameter Dbed and that it increases

46 Applications of Fluidization to Food Processing
slightly with the diameter of the gas inlet Di. The pressure drop down the bed is not uniform; it is small at the base and reaches a maximum at the surface where it approaches the pressure drop needed to support the solids. If the gas velocity is suffi cient to fl uidize the particles then the spouted bed becomes unstable; thus there is a maximum spoutable depth Hsm beyond which spouting behaviour breaks down and the bed becomes fl uidized. Mathur (1971) suggests that ums is approximately equal to the minimum fl uidizing velocity when the bed depth is close to the maximum spoutable depth. However, because in practical situ-ations the bed depth would be considerably less than this maximum, gas velocities required for spouting are somewhat less than those required for fl uidization. Data are available (Mathur, 1971) for a variety of solids, including wheat, mustard seed, rape seed, millet and peas, for all of which equation 1.66 has been shown to be valid. The simplest way to determine Hsm is to calculate, or measure, the minimum fl uid-izing velocity of the bed particles and then substitute this fi gure for ums in equation 1.66, solving for H. Predicted values of maximum spoutable depth obtained with this approach are in agreement with experimental data (Mathur, 1971). The applications of spouted beds
Particle fountain
High gas velocity spout
Inlet gas
Annulus of slowlymoving particles
Figure 1.19 Spouted bed.

A Description of Fluidized Bed Behaviour 47
include drying, particularly the drying of wheat, granulation and the coating of seeds and large particles.
Centrifugal fl uidization
The so-called centrifugal fl uidized bed has found application in the drying of foods and is claimed to give stable and smooth fl uidization of large irregular particles at velocities well above those required for pneumatic transport. Its particular advantage is that high gas velocities allow signifi cant heat input to the bed at lower temperatures than would otherwise be needed and hence the high rates of heat transfer which become possible in the constant drying rate zone of a drying process allow the centrifugal bed to be used for the reduction of initial moisture in sticky, high-moisture, heat-sensitive foods (Carlson et al., 1976).
Hanni et al. (1976) described a continuous fl uidized bed drier using the centrifugal principle. It consisted of a perforated horizontal cylin-der rotating inside a plenum with hot air blown across the outside of the cylinder and perpendicular to the axis of rotation (Figure 1.20). Vanes placed in the air inlet allowed the incident angle of the air fl ow to be varied from 0º to 45º to the perpendicular. Particles were fl uidized inside the Tefl on-coated stainless steel cylinder which could be tilted by up to 6º in order to control particle residence time. The cylinder, of
Plenum
Vanes Baffles
Tilt
Air
Chute
Chute
Damper
DrierDrier
Product flow
Productflow
Figure 1.20 Centrifugal fl uidized bed. From Hanni et al. (1976), by permission of the Institute of Food Technologists, USA.

48 Applications of Fluidization to Food Processing
diameter 0.25 m and length 2.5 m, was perforated with 2.4 mm diameter holes giving an open area of 45% and rotated at speeds up to 350 rpm (5.8 Hz). The plenum was divided into two equal lengths, allowing different drying conditions in the feed zone and the discharge zone of the bed respectively. Air passed through the perforations of the drying cylinder and left the plenum to be reheated and recirculated. Mechanical details of sealing the air fl ow and the control of air velocity are also given.
Hanni et al. (1976) used the centrifugal fl uidized bed for drying diced vegetables of approximately 10 mm in size with the wet feed being blown into the fl uidized bed with air. The perforated surface of the cylinder acted as the distributor plate and the centrifugal action kept the particle bed in place close to the cylinder wall. They suggested that the feed end of the bed was characterised by dense-phase fl uidization with partially dried material being displaced by fresh feed and passing on to the second half or discharge end of the cylinder. Here the particle bed approached spouted bed conditions before the particles were dis-charged radially from the bed by pneumatic transport (Figure 1.21).
Particulate fl uidization
Particulate fl uidization, where the fl uidizing medium is usually a liquid, is characterised by a smooth expansion of the bed. Liquid-solid fl uidized beds are used in continuous crystallisers, as bioreactors in which immobilised enzyme beads are fl uidized by the reactant solu-tion and in physical operations such as the washing and preparation of vegetables. The empirical Richardson–Zaki equation (Richardson
Air
flow
Packed bed
Fc > Drag force Fc ≤ Drag force Fc << Drag force
Dense fluidized bed Spouted bed
Air
flow
Figure 1.21 Fluidization regimes in a centrifugal fl uidized bed. From Hanni et al. (1976), by permission of the Institute of Food Technologists, USA.

A Description of Fluidized Bed Behaviour 49
and Zaki, 1954) describes the relationship between the superfi cial fl uid velocity and bed voidage
uu
n
0
= ε 1.67
where u0 is the superfi cial velocity at a voidage of unity and n is an index which depends on the particle Reynolds number. Figure 1.22 shows the form of a logarithmic plot of velocity against voidage. The vertical line represents the packed bed where the bed voidage does not change with velocity. The inclined section of the plot represents the fl uidized bed, described by equation 1.67, and has a gradient equal to n. The minimum fl uidizing velocity is found at the intersection of the two lines. The value of n is usually in the range 2.4–5.0, with smaller values at higher Reynolds numbers. There is a degree of similarity between the fl uidization of a particle and the settling of a particle in a fl uid. For sedimentation u0 = ut, i.e. the velocity at a voidage of unity is equal to the terminal falling velocity. However, in particulate fl uidiza-tion a wall effect exists and
lnu ud
Dt
bed0 = −ln 1.68
ln voidage
ln s
uper
fici
al v
eloc
ity
mfu
0u
mfε 1=ε
Figure 1.22 Richardson–Zaki plot: measurement of minimum fl uidizing velocity for particulate fl uidization.

50 Applications of Fluidization to Food Processing
where Dbed is the bed diameter. Thus as the bed diameter increases relative to the particle diameter, fl uidization behaviour approaches that of a sedimenting particle. Richardson and Zaki (1954) proposed a series of empirical equations for the relationship between n and Reynolds number; these are listed in Table 1.2. For non-spherical par-ticles, for example vegetable pieces, the value of n will be higher than for spheres; here Richardson and Zaki suggested
n K Re= ′′ >2 7 0 16. . (for 500) 1.69
where the shape factor K″ is defi ned by equation 1.15.The Richardson–Zaki equation has been found to agree with experi-
mental data over a wide range of conditions. Equally, it is possible to use a pressure drop–velocity relationship such as Ergun to determine minimum fl uidization velocity, just as for gas-solid fl uidization. An alternative expression, which has the merit of simplicity, is that of Riba et al. (1978)
Remfs f
f
Ga= ×−
−1 54 10 2 0 660 7
. ..ρ ρ
ρ 1.70
which is valid in the Reynolds number range 10 < Re < 1000.
Nomenclature
A bed cross-sectional areacD drag coeffi cientd mean particle diameterdB bubble diameterde equivalent spherical diameterds diameter of a sphere with the same surface area as particledp diameter of a circle having an area equal to the projected area
of particle in its most stable position
Table 1.2 Richardson–Zaki index as a function of Reynolds number.
Re < 0.2 nd
Dbed
= +4 65 20.
0.2 < Re < 1 nd
Dbed
= +( ) −4 4 18 0 03. .Re
1 < Re < 200 nd
Dbed
= +( ) −4 4 18 0 1. .Re
200 < Re < 500 n = 4.4 Re−0.1
Re > 500 n = 2.4
A Description of Fluidized Bed Behaviour 51
d′ equivalent diameter of void spacesDbed bed diameterDi diameter of spouted bed gas inletF drag forceFr Froude numberg acceleration due to gravityGa Galileo numberH bed heightHmf bed height at minimum fl uidizationHS minimum bed height for sluggingHsm maximum spoutable bed depthk constant in equation 1.6K Kozeny’s constantK′ volume shape factorK″ shape factor defi ned by equation 1.15L′ equivalent length of void spacesm particle massm′ mass of displaced fl uidn index in Richardson–Zaki equationN number of particles of size xp parameter representing characteristic of a particle size
distributionq parameter representing characteristic of a particle size
distributionQ total volumetric gas fl ow rateQB volumetric bubble fl ow rateQmf volumetric gas fl ow rate at minimum fl uidizationRe Reynolds numberRet Reynolds number at terminal falling velocityS specifi c surfaceSB particle surface area per unit bed volume in contact with fl uidt time; average particle circulation timeu superfi cial velocity; velocity through aperture of distributor
plate; relative velocity between sphere and fl uiduB bubble rise velocityumb minimum bubbling velocityumf minimum fl uidizing velocityums minimum spouting velocityuSB rise velocity of a single bubbleut terminal falling velocityu′ interstitial velocityu0 superfi cial velocity at a voidage of unityV particle volumex particle size
52 Applications of Fluidization to Food Processing
xl lower limit of size distributionxu upper limit of size distributionx3,2 surface–volume mean diameter
Greek symbols
a coeffi cient in generalised Ergun equationb coeffi cient in generalised Ergun equation∆P bed pressure drop∆Pd pressure drop across distributor platee interparticle voidagem viscosityrB bulk densityrf gas densityrs particle densityf sphericityw mass fraction of particles of a given size
Subscripts
f fl uidmf minimum fl uidizing conditionss solid
References
Abrahamson, A.R. and Geldart, D., Behaviour of gas-fl uidized beds of fi ne powders part I. Homogeneous expansion, Powder Tech., 26 (1980) 35–46.
Allen, T., Particle size measurement, Chapman and Hall, London, 1981.Arjona, J.L., Rios, G.M. and Gibert, H., Two new techniques for quick roasting
of coffee, Lebensmittel Wissenschaft Technologie, 13 (1980) 285–290.Baeyens, J. and Geldart, D., An investigation into slugging fl uidized beds,
Chem. Eng. Sci., 29 (1974) 255–265.Botterill, J.S.M., Fluid-bed heat transfer, Academic Press, London, 1975.Carlson, R.A., Roberts, R.L. and Farkas, D.F., Preparation of quick-cooking rice
products using a centrifugal fl uidized bed, J. Food Sci., 41 (1976) 1177–1179.Couderc, J.-P., Incipient fl uidization and particulate systems, in: Davidson, J.F.,
Clift, R. and Harrison, D., (eds.), Fluidization, 2nd ed., Academic Press, London, 1985.
Davidson, J.F. and Harrison, D., Fluidised particles, Cambridge University Press, Cambridge, 1963.
Davidson, J.F. and Harrison, D., (eds.), Fluidization, Academic Press, London, 1971.
Davidson, J.F., Clift, R. and Harrison, D., (eds.), Fluidization, 2nd ed., Academic Press, London, 1985.

A Description of Fluidized Bed Behaviour 53
Epstein, N., Applications of liquid-solid fl uidization, Int. J. Chem. Reactor Eng., 1 (2003) 1–16.
Geldart, D., Types of gas fl uidization, Powder Tech., 7 (1973) 285–292.Geldart, D., Mixing in fl uidized beds, in: Harnby, N., Edwards, M.F. and
Nienow, A.W., (eds.), Mixing in the process industries, Butterworth-Heinemann, Oxford, 1992.
Gibilaro, L.G., Fluidization-dynamics: the formulation and applications of a predictive theory for the fl uidized state, Butterworth-Heinemann, Oxford, 2001.
Hanni, P.F., Farkas, D.F. and Brown, G.E., Design and operating parameters for a centrifugal fl uidized bed drier, J. Food Sci., 41 (1976) 1172–1176.
Hiby, J.W., Untersuchungen über den kritischen Mindestdruckverlust des Anströmbodens bei Fluidalbetten (Fließbetten) [Examination of the critical minimum pressure loss in a fl uidised bed], Chem. Ing. Techn., 36 (1964) 228–229.
Jackson, A.T. and Lamb, J., Calculations in food and chemical engineering, Macmillan, Basingstoke, 1981.
Jonke, A.A., Petkus, E.J., Loeding, J.W. and Lawroski, S., Calcination of dis-solved nitrate salts, Nucl. Sci. Eng., 2 (1957) 303–319.
Jowitt, R., Heat transfer in some food processing applications of fl uidisation, Chem. Engnr., November (1977) 779–782.
Kunii, D. and Levenspiel, O., Fluidization engineering, Butterworth-Heinemann, Oxford, 1991.
Leva, M., Fluidization, McGraw-Hill, New York, 1959.Mathur, K.B., Spouted beds, in: Davidson, J.F. and Harrison, D., (eds.),
Fluidization, Academic Press, London, 1971.Mathur K.B. and Epstein, N., Spouted beds, Academic Press, New York,
1974.Mathur, K.B. and Gishler, P.E., A technique for contacting gases with coarse
solid particles, A.I.Chem.E.J., 1 (1955) 157–164.Mishra, I.M., El-Temtamy, S.A. and Schugerl, K., Growth of Saccharomyces cere-
visiae in gaseous fl uidized beds, Eur. J. Appl. Microbiol. Biotechnol., 16 (1982) 197–203.
Mugele, R.A. and Evans, H.D., Droplet size distribution in sprays, Ind. Eng. Chem., 43 (1951) 1317–1324.
Mullin, J.W., Crystallization, 3rd ed., Butterworth-Heinemann, Oxford, 1993.Rankell, A.S., Scott, M.W., Lieberman, H.A., Chow, F.S. and Battista, J.V.,
Continuous production of tablet granulations in a fl uidized bed II. Operation and performance of equipment, J. Pharm. Sci., 53 (1964) 320–324.
Riba, J.P., Routie, R. and Couderc, J.P., Conditions minimales de mise en fl uidi-sation per une liquide [Minimum conditions for initiation of fl uidisation with a liquid], Can. J. Chem. Eng., 56 (1978) 26–34.
Richardson, J.F., Incipient fl uidization and particulate systems, in: Davidson, J.F. and Harrison, D., (eds.), Fluidization, Academic Press, London, 1971.
Richardson, J.F. and Zaki, W.N., Sedimentation and fl uidisation. Part 1, Trans. Inst. Chem. Engrs., 32 (1954) 35–52.
Rios, G.M., Gibert, H. and Baxerres, J.L., Factors infl uencing the extent of enzyme inactivation during fl uidized bed blanching of peas, Lebensmittel Wissenschaft Technologie, 11 (1978) 176–180.

54 Applications of Fluidization to Food Processing
Rios, G.M., Gibert, H. and Baxerres, J.L., Potential applications of fl uidisation to food preservation, in: Thorne, S., (ed.), Developments in food preserva-tion, volume 3, Elsevier, Amsterdam, 1985, 273–304.
Rowe, P.N., Experimental properties of bubbles, in: Davidson, J.F. and Harrison, D., (eds.), Fluidization, Academic Press, London, 1971.
Rowe, P.N., Estimation of solids circulation rate in a bubbling fl uidised bed, Chem. Eng. Sci., 28 (1977) 979–980.
Saxena, S.C. and Vogel, G. J., The measurement of incipient fl uidisation veloci-ties in a bed of coarse dolomite at temperature and pressure, Trans. Inst. Chem. Engrs., 55 (1977) 184–189.
Schiller, L. and Naumann, A.Z., Uber die grundlegenden Berechnungen bei der Schwerkraftaufbereitung [A fundamental drag coeffi cient correlation], Z. Ver. Deut. Ing., 77 (1933) 318–320.
Sherrington, P.J. and Oliver, R., Granulation, Heyden, London, 1981.Shi, Y.F. and Fan, L.T., Effect of distributor to bed resistance ratio on uniformity
of fl uidization, A.I.Ch.E.J., 30 (1984) 860–865.Shilton, N.C. and Niranjan, K., Fluidization and its applications to food pro-
cessing, Food Structure, 12 (1993) 199–215.Siegel, R., Effect of distributor plate-to-bed resistance ratio on onset of fl uid-
ized bed channelling, A.I.Ch.E.J., 22 (1976) 590–592.Smith, P.G., Introduction to food process engineering, Kluwer Academic, New
York, 2003.Smith, P.G. and Nienow, A.W., Particle growth mechanisms in fl uidised bed
granulation – part I. The effect of process variables, Chem. Eng. Sci., 38 (1983) 1223–1231.
Stokes, G.G., On the effect of the internal friction of fl uids on the motion of pendulums, Trans. Cambridge Phil. Soc., 9 (1851) 8–106.
Vinter, H., Aqueous (and organic) fi lm-coating by fl uidisation technology, Proceedings of an International Conference on Fluidisation Technology for Pharmaceutical Manufacturers, Powder Advisory Centre, London, 1982, 1–11.
Wen, C.J. and Yu, Y.H., A generalized method for predicting the minimum fl uidization velocity, A.I.Ch.E.J., 12 (1966) 610–612.
Wilhelm, R.H. and Kwauk, M., Fluidization of solid particles, Chem. Eng. Prog., 44 (1948) 201–218.
Yates, J.G., Fundamentals of fl uidized-bed chemical processes, Butterworth, London, 1983.
Yerushalmi, J. and Avidan, A., High-velocity fl uidization, in: Davidson, J.F., Clift, R. and Harrison, D., (eds.), Fluidization, 2nd ed., Academic Press, London, 1985.
Zenz, F.A., Regimes of fl uidized behaviour, in: Davidson, J.F. and Harrison, D., (eds.), Fluidization, Academic Press, London, 1971.


