1870 CLINICAL CHEMISTRY, Vol. 30, No. 11, 1984 The specificity of ethanol methodologies is of concern in both clinical and forensic applications. Some current meth- ods have significant cross reactivity with other alcohol compounds, such as isopropanol, which are occasionally encountered concurrently with ethanol in biological fluids. Our evaluation of the REA method indicated no cross reactivity toward methanol, isopropanol, or acetone at con- centrations that might be expected in toxic situations. We did not determine the assay’s cross reactivity toward other alcoholcompounds; however, the incidence of such volatiles in biological fluids is extremely rare. The REA assay for ethanol requires no instrument modi- fication of the TDx analyzer. However, because ethanol reagent is retained in the probe after analysis, the manufac- turer recommends an automated wash protocol before sub- sequent use of the analyzer for other assays. We conclude from our evaluation of the REA ethanol method that the assay gives reproducible and accurate results that compare well with those obtained with a commonly used GLC method and the Du Pont aca. The REA method on the TDx analyzer is generally easier and faster than GLC and, unlike the Du Pont aca, allows automated analysis of whole blood without pretreatment. We found the TDx REA assay for ethanol a useful method for quantifying ethanol in blood, serum, and urine in clinical and forensic specimens. We acknowledge support from Abbott Diagnostics, who provided the resources to perform this evaluation. We also thank Dr. David CLIN,CHEM.30/11, 1870-1874 (1984) Yost, Research Biochemist, Abbott Laboratories,for his assistance and time, and Dr. Brian Pape, New England Pathology Services, for review of this manuscript and for many helpful discussions. References 1. Lu-Steffes M, Pittluck GW, Jolley ME, et al. Fluorescence polarization immunoassay IV. Determination of phenytoin and phenobarbital in human serum and plasma. Clin Chem 28, 2278- 2282 (1982). 2. Jolley ME. Fluorescence polarization immunoassay for the de- termination of therapeutic drug levels in human plasma. J Anal Toxicol 5, 236-240 (1981). 3. Jolley ME, Stroupe SD, Wang CHJ, et al. Fluorescence polari.za- tion immunoassay I. Monitoring aminoglycoside antibiotics in serum and plasma. Clin Chem 27, 1190-1197 (1981). 4. Jam NC. Direct blood injection method for gas chromatographic determination of alcohols and other volatile compounds. Clin Chem 17, 82-85 (1971). 5. Neter J, Wasserman W. Applied Linear Statistical Models; Regression, Analysis of Variance and Experimental Designs, R. D. Irwin, PubI., Homewood, IL 60430, 1974, p 160. 6. Toxicology Series 2, 1983 Survey, Set T-D, Referee and Partici- pant Summary. College of American Pathologists, Traverse City, MI 49685, p 2. 7. Yost DA, Boehnlein L, Shaffar M. A novel assay to determine ethanol in whole blood on the Abbott TDx. Clin Chem 30, 1029 (1984). Abstract. 8. Poklis A, MacKell MA. Use of gas chromatography and alcohol dehydrogenase for determination of ethanol in postmortem blood. J Anal Toxicol 3, 183-186 (1979). Particle-Enhanced Turbidimetric InhibitionImmunoassay for Theophylline Evaluated with the Du Pont aca Kent E. Opheim,1 Melvin R. Giick,2 Ching-Nan Ou,3 Kenneth W. Ryder,2 Lydia Chen Hood,1 Vernon Ainardi,1 Laura A. Coilymore,3 Wilsa DeArmas,3 Vicki L. Frawley,3 Juliene Hutchlnson,’ Sheila A. Jackson,2 Jan L. Trent,2 Donna K. Taylor,2 John C. Baenziger,2and Tjien 0. Oei2 We evaluated the Du Pont Particle-EnhancedTurbidimetric Inhibition Immunoassay (PETINIA) for theophylline. The impre- cision (CV) of the assay was <4.7% between-run and <3.6% within-run for theophylline concentrations between 5 and 30 mg/L. Standard curves for the assay were linear for theophyl- line concentrations from 0 to 46 mg/L and were stable throughout the study (i.e., for at least three months). The monoclonalantibodyagainsttheophyllineused in this assay increasesspecificity;ofthepossiblyinterferingdrugs,metab- olites, and anticoagulants tested, only 1,3-dimethyluric acid and EDTA showed measurable effects. Bilirubin (<300 mg/L), hemoglobin (<6 gIL), or Iipemia (triglycerides <6 g/L) does affect the quality of the assay. Analytical recovery of theophylline added to serum (5 to 40 mg/L) averaged 98% (range 93% to 112%). Comparison of results for patients’ 1 Department of Laboratories, Children’s Orthopedic Hospital & Medical Center, P.O. Box C-5371, Seattle, WA 98105. 2Department of Pathology, Indiana University School of Medi- cine, Indianapolis, IN 46223. 3Department of Pathology, Texas Children’s Hospital and Baylor College of Medicine, Houston, TX 77030. Received Feb. 9, 1984; acceptedJune 7, 1984. sera by the PETINIAmethod with those by enzyme immunoas- say (EMIT) and by “high-performance” liquid chromatography yieldedslopes and interceptsnot significantlydifferentfrom 1.0 and 0.0, respectively,andcorrelationcoefficientsranging from 0.986 to 0.995. AddItIonal Keyphrases: enzymeimmunoassay,liquidchromatog- raphy compared . monitoringtherapy . asthma . apnea in neonates ‘ turbidimetry PETINIA Theophylline (1,3-dimethylxanthine) is a widely used drug. Its pharmacological properties include relaxation of bronchi- al smooth muscle and stimulation of the central nervous system, actions important for treating asthma and neonatal apnea, respectively. For treating asthma, theophylline con- centrations between 10 and 20 mg/L in serum are effective (1). Lower concentrations (5-10 mgIL) will reduce the fre- quency of neonatal apnea (2); however, in neonates this therapeutic range is complicated by theophylline being metabolized to caffeine (1,3,7-trimethylxanthine), which is active in the same way (3). As theophylline concentrations increase above the therapeutic range, adverse effects be-
Transcript
1870 CLINICAL CHEMISTRY, Vol. 30, No. 11, 1984
The specificity of ethanol methodologies is of concern inboth clinical and forensic applications. Some current meth-ods have significant cross reactivity with other alcoholcompounds, such as isopropanol, which are occasionallyencountered concurrently with ethanol in biological fluids.Our evaluation of the REA method indicated no crossreactivity toward methanol, isopropanol, or acetone at con-centrations that might be expected in toxic situations. Wedid not determine the assay’s cross reactivity toward otheralcoholcompounds;however, the incidence of such volatilesin biological fluids is extremely rare.
The REA assay for ethanol requires no instrument modi-fication of the TDx analyzer. However, because ethanolreagent is retained in the probe after analysis, the manufac-turer recommends an automated wash protocol before sub-sequent use of the analyzer for other assays.
We concludefrom our evaluation of the REA ethanolmethod that the assay gives reproducible and accurateresults that compare well with those obtained with acommonly used GLC method and the Du Pont aca. The REAmethod on the TDx analyzer is generally easier and fasterthan GLC and, unlike the Du Pont aca, allows automatedanalysis of whole blood without pretreatment. We found theTDx REA assay for ethanol a useful method for quantifyingethanol in blood, serum, and urine in clinical and forensicspecimens.
We acknowledge support from Abbott Diagnostics, who providedthe resources to perform this evaluation. We also thank Dr. David
CLIN,CHEM.30/11, 1870-1874 (1984)
Yost, Research Biochemist, Abbott Laboratories,for his assistanceand time, and Dr. Brian Pape,New England Pathology Services, forreview of this manuscript and for many helpful discussions.
References1. Lu-Steffes M, Pittluck GW, Jolley ME, et al. Fluorescencepolarization immunoassay IV. Determination of phenytoin andphenobarbital in human serum and plasma. Clin Chem 28, 2278-2282 (1982).2. Jolley ME. Fluorescence polarization immunoassay for the de-termination of therapeutic drug levels in human plasma. J AnalToxicol 5, 236-240 (1981).3. Jolley ME, Stroupe SD, Wang CHJ, et al. Fluorescence polari.za-tion immunoassay I. Monitoring aminoglycoside antibiotics inserum and plasma. Clin Chem 27, 1190-1197 (1981).4. Jam NC. Direct blood injection method for gas chromatographicdetermination of alcohols and othervolatile compounds. Clin Chem17, 82-85 (1971).5. Neter J, Wasserman W. Applied Linear Statistical Models;Regression, Analysis of Variance and Experimental Designs, R. D.Irwin, PubI., Homewood, IL 60430, 1974, p 160.6. Toxicology Series 2, 1983 Survey, Set T-D, Referee and Partici-pant Summary. College of American Pathologists, Traverse City,MI 49685, p 2.7. Yost DA, Boehnlein L, Shaffar M. A novel assay to determineethanol in whole blood on the Abbott TDx. Clin Chem 30, 1029(1984). Abstract.8. Poklis A, MacKell MA. Use of gas chromatography and alcoholdehydrogenase for determination of ethanol in postmortem blood. JAnal Toxicol 3, 183-186 (1979).
Particle-Enhanced Turbidimetric InhibitionImmunoassay for TheophyllineEvaluated with the Du Pont acaKent E. Opheim,1 Melvin R. Giick,2 Ching-Nan Ou,3 Kenneth W. Ryder,2Lydia Chen Hood,1 Vernon Ainardi,1Laura A. Coilymore,3 Wilsa DeArmas,3 Vicki L. Frawley,3 Juliene Hutchlnson,’ Sheila A. Jackson,2 Jan L.Trent,2 Donna K. Taylor,2 John C. Baenziger,2and Tjien 0. Oei2
We evaluated the Du Pont Particle-EnhancedTurbidimetricInhibition Immunoassay (PETINIA) for theophylline. The impre-cision (CV) of the assay was <4.7% between-run and <3.6%within-run for theophylline concentrations between 5 and 30mg/L. Standard curves for the assay were linear for theophyl-line concentrations from 0 to 46 mg/L and were stablethroughout the study (i.e., for at least three months). Themonoclonalantibodyagainsttheophyllineused in this assayincreasesspecificity;ofthe possiblyinterferingdrugs,metab-olites, and anticoagulants tested, only 1,3-dimethyluric acidand EDTA showed measurable effects. Bilirubin (<300mg/L), hemoglobin (<6 gIL), or Iipemia (triglycerides <6 g/L)does affect the quality of the assay. Analytical recovery oftheophylline added to serum (5 to 40 mg/L) averaged 98%(range 93% to 112%). Comparison of results for patients’
1 Department of Laboratories, Children’s Orthopedic Hospital &Medical Center, P.O. Box C-5371, Seattle, WA 98105.
2Department of Pathology, Indiana University School of Medi-cine, Indianapolis, IN 46223.
3Department of Pathology, Texas Children’s Hospital and BaylorCollege of Medicine, Houston, TX 77030.
ReceivedFeb. 9, 1984; acceptedJune 7, 1984.
sera by the PETINIAmethod with those by enzyme immunoas-say (EMIT) and by “high-performance” liquid chromatographyyieldedslopes and interceptsnot significantlydifferentfrom1.0 and 0.0, respectively,and correlationcoefficientsrangingfrom 0.986 to 0.995.
Theophylline (1,3-dimethylxanthine) is a widely used drug.Its pharmacological properties include relaxation of bronchi-al smooth muscle and stimulation of the central nervoussystem, actions important for treating asthma and neonatalapnea, respectively. For treating asthma, theophylline con-centrations between 10 and 20 mg/L in serum are effective(1). Lower concentrations (5-10 mgIL) will reduce the fre-quency of neonatal apnea (2); however, in neonates thistherapeutic range is complicated by theophylline beingmetabolized to caffeine (1,3,7-trimethylxanthine), which isactive in the same way (3). As theophylline concentrationsincrease above the therapeutic range, adverse effects be-
00
0-
00 +00.9.0
B. Sample with high theophylline concentration
0
#{176}Oo
o.9o
0 0
IIlatex particle with theophylline covalently attached
= monoclonal antibody against theophylline
0 = theophylline in patient sample or calibrator
Fig. 1. Principleof the present techniqueA low concentrationof theophylline in the sample increases latex-particleagglutinationwith the antibody and increasesturbidity: a high concentration oftheophylline results in decreasedagglutinationandturbidity
CLINICALCHEMISTRY,Vol.30, No.11,1984 1871
come more frequent and severe and can result in life-threatening cardiac arrhythmias or seizures.
Theophylline concentrationsin serum may be measuredby (e.g.) homogeneous enzyme irmnunoassay (4), fluores-cence polarization immunoassay (5), “high-performance”liquid chromatography (HPLC) (6-8), substrate-labeled flu-orescence immunoassay (9), nephelometric inhibition im-munoassay (10), and radioimmunoassay (11).
The present assay, the Particle-Enhanced TurbidimetricInhibition Immunoassay (PETINIA) for theophylline, wasevaluatedat three medical centers’-3. It can be used with DuPont’sAutomated Clinical Analyzers (aca) II, III, or N.
Materials and MethodsThe participating medical centers are designated Lab A,’
Lab B,2 and Lab C.
Reagents
aca THEO assay. This assay for theophylline (aca rnEo) is anonisotopic competitive-binding immunoassay based on theinhibition of agglutination of latex particles, coated withcovalently-bound theophylline, by a monoclonal antibodyagainst theophylline; the degreeof inhibition of the latex-theophylline particle agglutination is proportional to theamount of theophylline in the patient’s sample or thecalibrator (Figure 1). The rate of agglutination is monitoredat 340 rim by measuring the change in turbidity after theparticle-bound theophylline, antibody, and patient’s sampleare mixed. The reagents for this assay, which in addition toparticle-bound theophylline and antibody include surfac-tants, polyethylene glycol, and protein-denaturing agents,are supplied in a plastic pack designed to be used with theaca discrete analyzer. Serum-based calibrators and aca T1IEOreagent packs were furnished by the Du Pont Co.
Control materials. Serum-based quality-control materialscontaining theophylline were “Stratus TDM Controls I andifi” (Dade Division, American Hospital Supply Corp., Mi-ami, FL 33152) and ‘TheraChem Anticonvulsant’Theophyl-line Control, Low and High” (Fisher Scientific Co., Orange-burg, NY 10962).
A. Sample with low theophylline concentration
Procedures
Cakulations. The relation between the rate of change ofturbidity during an assay and the theophylline concentra-tion can be converted to a linear expression by using thefollowing logit function:
Theophylline concn, mg/L =
C0 - 1)1c2 - 0.5]
Constants C0and C1are related to the slope and intercept ofthe standard curve (milliabsorbance units vs concn. oftheophylline calibrator) and are calculated for each new lotof reagent by the user; C2 and C3 are lot-specific lineariza-tion constants, determined by the supplier and included inthe product insert; mA is the rate of change of turbidity inmilliabsorbance units per 17.0 s. The aca ifi and IV calcu-late the theophylline concentration with the above function.For use with the aca II, Du Pont supplies a special graphpaper incorporating the above logit function; the rate ofturbidity change (mA) is plotted against the correspondingconcentrations of the theophylline calibrators, and valuesfor patients’ samples are determined by interpolation fromthis standard curve.
In this evaluation, Lab A used the aca ifi, Lab B the aca Hand HI, and Lab C the aca II. The aca runo determinationsat each evaluation site were obtained from a calibrationcurve derived at the start of the study from the average offive replicate measurementsof five concentrationsof theo-phylline (2, 6, 10, 21, and 40 mg/L). At the conclusionof thisstudy the Du Pont Co. recalculated all theophylline mea-surements at each institution, using three replicates of the2, 10, and 40 mg/L concentrations; their results wereidentical to thoseobtained from the standard curves basedonfive theophylline concentrations.The product insert nowrecommendscalibration basedon only these three calibra-tors, assayed in triplicate.
EMIT assays. Reagents for use in the Enzyme-MultipliedImmunoassay Technique (EruT) were purchased from SyvaCo., Palo Alto, CA 94303. EMIT assays were performed atLabs A and B with the Syva Lab 6000 system according tothe manufacturer’s instructions. Lab C performedthe EMIT
assays with a Roche Cobas-Biocentrifugal analyzer, usingthe method of Ou et al. (12).
HPLC assays. Lab A usedthe HPLC method of Butrimo-vita and Raisys (6), with the following modifications: themobile phase was tetrahydrofuranlmethanollsodium acetatebuffer (10 mmol/L, pH 5.0), 1/7/92 (by vol), and the RCM-100system included a column of 5-jim Radial-Pak C18 (bothfrom Waters Associates, Milford, MA 01757). With thesemodifications theophylline could be separated from thecaffeine metabolite, paraxanthine (1,7-dimethylxanthine).At a flow rate of 5 mb/mm the retention times for para-xanthine, theophylline, and /3-hydroxyethyltheophylline(the internal standard) were 5.2, 5.8, and 6.7 mm, respec-tively. No commonly administered drugs or other methyl-xanthine or methyluric acid derivatives interfere with thisanalysis for theophylline. Between-run precision (CV) forthis assay is 5.1% and 4.2% for control samples containing5.0 and 29.2 mgfL of theophylline, respectively.
Lab B used the HPLC assay of Sample et al. (7), with aModel ALC 200 system with a column of 1-Bondapak C18(both from Waters Associates). Theophylline was extractedfrom serum into an equivolume mixture of chloroform andisopropanol, which contained /3-hydroxyethyltheophyllineas the internal standard. The organic (lower) layer was
1872 CLINICAL CHEMISTRY, Vol.30, No. 11, 1984
removed after centrifugation, the solvent was evaporated,and the residue, redissolved in methanol, was injected intothe HPLC system. Between-run precision (CV) for thisassay was 6.6% and 5.1% for control samples containing 10and 30 mg/L of theophylline, respectively.
Lab C performed the HPLC assays by the method of Onand Frawley (8). Between-run precision (CV) for this proce-dure was 3% for a control sample containing 13.7 mg oftheophylline per liter.
Evaluationof Analytical Variables
Calibration curve stability. During the course of this study(two months at Lab A, three months at Labs B and C), thecalibration curve in each laboratory was validated weeklyby assaying the five calibrators in triplicate. Linear regres-sion statistics were calculated from the average assayedvalue of each calibrator vs its assigned value; acceptablelimits for this comparison were slope = 1.00 ± 0.05 andintercept = ±0.8 mg/L. None of the laboratories needed torecalibrate the assay during the study.
Linearity. Linearity of the standard curve for the aca THEO
assay was confirmed over the range 2 to 40 mg/L byassaying dilutions, in triplicate, of a patient’s specimencontaining about 40 mg of theophylline per liter. At eachevaluation site this high-concentration theophylline speci-men was diluted with a drug-free serum pool, the dilutionratios (high-concentration sample: drug-free serum) were1.0:0.0, 0.9:0.1, 0.8:0.2, 0.7:0.3, 0.6:0.4, 0.5:0.5, 0.4:0.6,0.3:0.7, 0.2:0.8, 0.1:0.9. Lab A did not use the 0.3:0.7 and0.5:0.5 dilutions but included a 0.05:0.95 sample.
Precision. Precision both within-nm and between-nm wasdetermined at several theophyllmneconcentrations between5 and 30 mg/L. Over a 20-day period, duplicate samples ofthe commercial serum-based controls and pooled patients’sera containing theophylline were assayed by the aca THEO
method and by the comparison methods. Within-run andbetween-run precision were calculated from these resultswith an ANOVA technique (13).
Analytical recovery. In each laboratory four different drug-free serum pools were split into four parts, which weresupplemented with theophylline to give final concentrationsof 5, 10, 20, or 40 mg/L. Each sample was assayed intriplicate by the aca THEO method, and analytical recovery oftheophylline was calculated.
Correlation Studies
At each evaluation site, results by the aca ‘ri*o methodwere compared with those by the EMIT assay and by HPLC.Patients’ theophylline samples were split and analyzed induplicate by the aca TEEO and EMIT methods, and the resultswere averaged; single aliquots of the same samples wereanalyzed by HPLC. Results were compared statistically bylinear-regression analysis.
Potentially Interfering Substances
Pooled serum containing final concentrations of bilirubinof 170 mg/L (Lab A) and 300 mg/L (Lab B), or of hemoglobin(from lysed erythrocytes) of 6.0 g/L (Lab A) and 5.5 g/L (LabB) were used. Turbid specimens were pooled lipemic serum(Lab A, triglyceride concentration = 35 g/L) and (Lab B)serum supplemented with 6 g of”Intralipid” (Cutter Labora-tories, Emeryville, CA 94608) per liter. Each of these poolswas serially diluted with serum containing very lowconcen-trations of the three endogenous substances to yield sixconcentrations of each potentially interfering substance.Each of these samples was then supplemented with theo-phylline (10 and 40 mg/L) and assayed by the aca TNEO
method.
Effects of some commonly administered drugs were deter-mined by assaying commercial serum controls containingthe respective drug at concentrations exceeding its thera-peutic range. The effects of several chemically relatedxanthine and uric acid derivatives (caffeine, theobromine,paraxanthine, 3-methylxanthine, 1-methyluric acid, and1,3-dimethyluric acid) were determined by assaying a se-rum pool containing 10 mg of theophylline per liter, towhich an equal concentration of the potentially interferingsubstance was added. The cross reactivity of these com-pounds was calculated as the increase in apparent theophyl-line concentration when the interfering substance was pre-sent.
The effects of heparin (lithium and sodium salts) andEDTA anticoagulants and of the serum separator materialsin “Corvac Tubes” (Monoject Div., Sherwood Medical, St.Louis, MO 83103), “SST Tubes” (Becton-Dickinson Labora-tory Div., Rutherford, NJ 07070), and “SureSep Tubes”(General Diagnostics, Morris Plains, NJ 07950) were alsoevaluated. The effect of freezing and thawing of samples wasdetermined by measuring theophylline concentrations insamples before and after four freeze-thaw cycles.
Results and DiscussionTable 1 summarizes results of the linearity study. The aca
TREO assay showed a linear response over a wide range ofconcentrations (0-46 mg/L), in agreement with the productinsert. This encompasses the concentrations found in thevast majority of clinical specimens: in only one of 348clinical samples we studied did theophylline exceed 40 mg/L(43.3 mg/L). Samples with concentrations exceeding 40mg/L may validly be diluted with drug-free serum or waterand re-assayed.
Table 2 shows results for within-nm precision of the acarao and EMIT methods. The very small within-nm CV ofthe aca THEO method (<3.6%) obviates the need to assaysamples in duplicate. In general, this CV was less than forthe EMIT method. The mean, SD, and CV data were calculat-ed from 20 paired-sample measurements assayed on 20separate days. The between-run precision results (Table 2)were obtained by the ANOVA technique (13) from the same20 paired measurements used to determine the within-nmprecision; again the imprecision was less than for the EMIT
Lab 6000 system. In addition, the HPLC method used byLab A showed higher CVs (5.1% and 4.2% for the Stratus Iand HI control samples, respectively) than the aca TI-lEO
method.Table 3 gives the analytical recovery of theophylline
added to drug-free serum, with the mean for all laboratoriesat each concentration indicated at the bottom. Recoveriesover the concentration range of 5 to 40 mg of theophyllineper liter averaged 98% (range 93% to 112%).
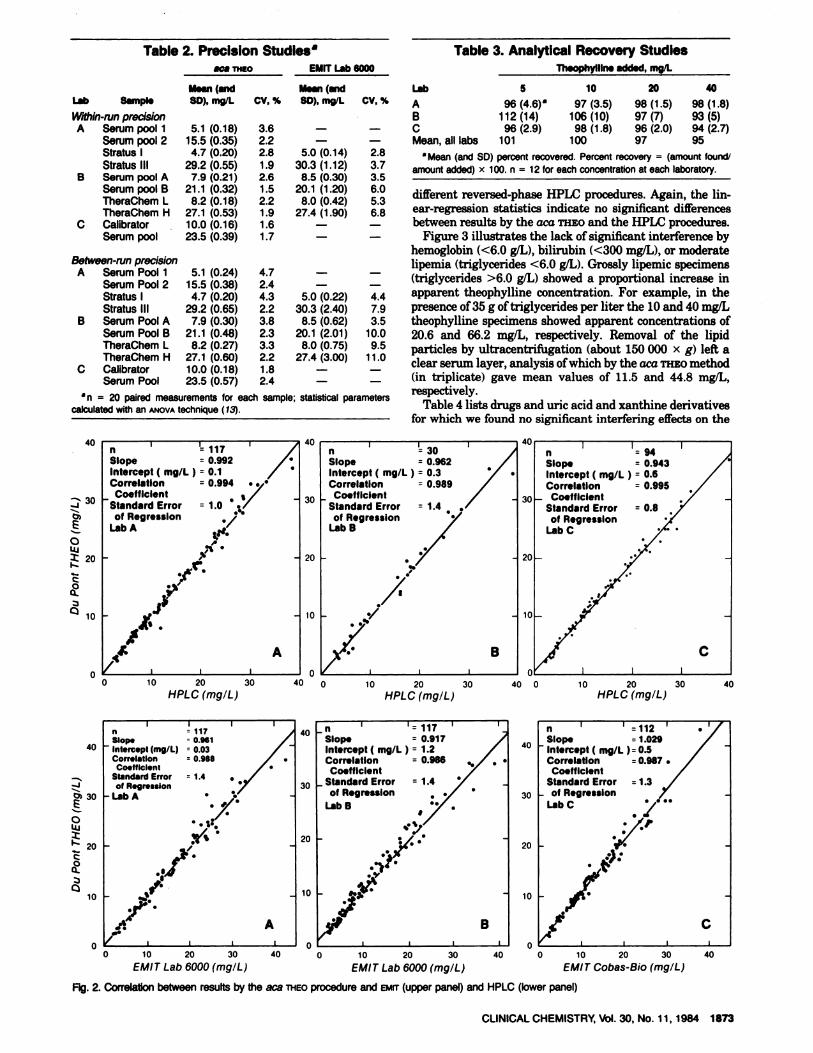
The good correlation between the aca THEO method andthe EMIT methods are shown in the upper panel of Figure 2.No significantly discrepant values (>30% difference) werenoted with any of the EMIT procedures. In the lower panel ofFigure 2 the aca THEO method is compared with three
Table 1. LInearity of the aca Standard Curve forTheophylline
a Mean (andSD) percent recovered. Percentrecovery (amount tound/
amountadded) x 100. n = 12 for each concentration at each laboratory.
different reversed-phase HPLC procedures. Again, the lin-ear-regression statistics indicate no significant differencesbetweenresultsby the aca THEO and the HPLC procedures.
Figure 3 illustrates the lack of significant interference byhemoglobin(<6.0 g/L), bilirubin (<300 mg/L), or moderatelipemia (triglycerides <6.0 gIL). Grossly lipemic specimens(triglycerides >6.0 gIL) showeda proportional increaseinapparent theophylline concentration. For example, in thepresence of 35 g of triglyceridesper liter the 10 and 40 mg/Ltheophylline specimens showed apparent concentrations of20.6 and 66.2 mg/L, respectively. Removal of the lipidparticles by ultracentrifugation (about 150000 x g) left aclear serum layer, analysis of which by the aca THEO method(in triplicate) gave mean values of 11.5 and 44.8 mg/L,respectively.
Table 4 lists drugsand uric acid and xanthine derivativesfor which we found no significant interfering effects on the
calculated with an ANOVA technique (13).= 20 paired measurements for each sample; statistical parameters
aca THEO assay. 1,3-Dimethyluric acid, a theophylline me-tabolite, measurably crossreacts in the assay: a serum poolcontaining 10 mg of theophylline per liter, supplementedwith an equal concentration of 1,3-dimethyluric acid, gave a13% increase in apparent theophylline. This theophyllinemetabolite may be present in the serum of patients in renalfailure who are taking theophylline (14).
Neither sodium nor lithium salts of heparmnaffected theassay of theophylline-containing plasma samples containingtheseanticoagulants. In contrast, when EDTA was used asan anticoagulant, there was an average 25% increase inapparent theophylline concentration.Serum separatorma-terials-Corvac, SST, and SureSep- had no effect on theo-phylline measurement with the aca mao, nor didfour cyclesof freezing and thawing.
In summary, we found this method to have precision andaccuracythat representsthe state of the art. As with othertests used on the Du Pont aca systems (H, ifi, and W) thismethod is rapid and simple to perform. Calibration needonly be performed, on the average, every three months, andfewer quality-control samples need be assayed than in otherimmunoassay methods, such as EMIT. The precision of thisassay is such that samples can validly be assayed singlyrather than in duplicate. The monoclonal antibody used inthis assay offers a high degree of specificity; the commonlyadministered drugs we tested did not affect the assay. Thereis crossreactivity with 1,3-dimethyluric acid, a theophyllinemetabolite, as in some other theophylline immunoassaymethods(14). For this reason we recommend that samplesfrom renal-failure patients who are taking theophylline beanalyzed by some alternative procedure such as HPLC.
Either serum or heparinized plasma may be used in theassay, but use of EDTA results in a false increase inapparent theophylline concentration. This procedure re-quires only 40 L of serum. It is unaffected by highconcentrations of bilirubin, hemoglobin, and triglycerides(lipemia). These features make the method attractive forpediatric use.
We thank Dr. Albert L. Caffo, Du Pont Co., Wilmington DE, forhis valuable assistance and suggestions during this study. We alsogratefully acknowledge financial support and technical help fromthe Du Pont Co. in conducting this study.
References1. Hendeles L, Weinberger M, Johnson G. Monitoring serumtheophylline levels. Clin Pharm.acoki net 3, 294-312 (1978).2. Aranda JV, Turmen T. Methylxanthines in apnea of prematuri-ty. Clin Perinatol 6, 87-108 (1979).3. Bory C, Baltassat P, Porthault M, et al. Metabolism of theophyl-line to caffeine in premature newborn infants. J Pediatr 94, 988-993 (1979).
4. Chang J, Gotcher S, Gushaw JB. Homogeneous enzyme immu-noassay for theophylline in serum and plasma. Clin Chem 28, 361-367 (1982).5. Jolley ME, Stroupe SD, Schwenzer, KS, et al. Fluorescencepolarization immunoassay. III. An automated system for therapeu-tic drug determination. Clin Chem 27, 1575-1579 (1981).
6. Butrimovitz GP, Raisys VA. An improved micromethod fortheophylline determination by reversed-phase liquid chromatogra-phy. Clin Chem 25, 1461-1464 (1979).
7. Sample RHB, Glick ME, Oei TO. The influence of a new,unproved theophylline assay procedure on laboratory analyses. JIndiana State Med Assoc 5, 349-352 (1979).8. Ou CN, Frawley VL. Concurrent measurement of theophyllineand caffeine in neonates by an interference-free liquid chromato-graphic method. Clin Chem 29, 1934-1936 (1983).9. Li TM, Benovic JL, Buckler RT, Burd JF. Homogeneous sub-strate-labeled fluorescent immunoassay for theophylline in serum.Clin Chem 27, 22-26 (1981).10. Yatscoff RW, Hayter J. Competitive nephelometric inhibitionimmunoassay of theophylline with the use of monoclonal reagents:Comparison with fluorescence polarization and EMIT procedures.Clin Chem 29, 1857-1858 (1983). Letter.11. Neese AL, Soyka LF. Development of a radioimmunoassay fortheophylline. Application to studies in premature infants. ClinPharmacol Ther 21, 633-641 (1977).12. Ou CN, Frawley VL, Buffone GJ. Optimization of EMITreagent system using a Cobas-Bio centrifugal analyzer. J AnalToxicol 5, 249-252 (1981).13. EPT-3. Tentative guidelines for manufacturers for establishingperformance claims for clinical chemistry methods. Replicationexperiment. National Committee for Clinical Laboratory Stan-dards, Villanova, PA, December 1982.14. Opheim KE, Ainardi V, Raisys VA. Increase in apparenttheophylline concentration in the serum of two uremic patients asmeasured by some immunoassay methods (caused by 1,3-dimethy-luric acid?). Clin Chem 29, 1698-1699 (1983). Letter.