The University of Sussex Geography BSc Third Year Project May 2001 Past and Present Rates of Coastal Chalk Erosion at Peacehaven, Sussex Candidate Number: 26051 School: Biological Sciences A few appendices are missing Word Count: Approx. 8,000
Transcript
The University of Sussex
Geography BSc Third Year Project
May 2001
Past and Present Rates of Coastal Chalk Erosion at Peacehaven, Sussex
1.1 The Location of Peacehaven ............................................................................................................................... 5 1.2 Why and How the Sea Defences were Built ....................................................................................................... 6 1.3 The Geology, Sea and Climate............................................................................................................................ 7 1.4 Existing Knowledge of Cliff Retreat along the Sussex Coast ............................................................................. 8 1.5 Existing Knowledge of Chalk Shore Platform Geomorphology ......................................................................... 9 1.6 Application at Peacehaven ................................................................................................................................ 11 1.7 Potential Areas of Research on the Shore Platform .......................................................................................... 12
3.1 Mapping Past Cliff Retreat................................................................................................................................ 16 3.2 The Micro-Erosion Meter (MEM) Sites............................................................................................................ 17 3.3 The Screw and Washer Sites............................................................................................................................. 18 3.4 The Location, Construction and Frequency of Measurement of the Sites......................................................... 19 3.5 Measurement of the Heights of the Pinnacles Under the Groynes.................................................................... 21
4.0 Data Collection ..................................................................................................................................................... 22 5.0 Analysis and Results ............................................................................................................................................. 26
5.1 Past Cliff Retreat ............................................................................................................................................... 26 5.2 Current Platform Downwearing ........................................................................................................................ 26
5.2.1 Overall Averages........................................................................................................................................ 27 5.2.2 Western Groyne Versus Eastern................................................................................................................. 27 5.2.3 Erosion Over the Months ........................................................................................................................... 27 5.2.4 Erosion along the Lengths of the Groynes ................................................................................................. 28 5.2.5 Runnels versus Ridges & West Sides of Groynes versus East................................................................... 29 5.2.5 The Pinnacles under the Groynes............................................................................................................... 33
6.0 Discussion and Conclusion ................................................................................................................................... 35 6.1 Comparison of the Three Methods.................................................................................................................... 35 6.2 The Hypotheses: Proven or Disproven?............................................................................................................ 35 6.3 So What Do We Now Know? ........................................................................................................................... 35 6.4 Criticisms and Possible Improvements ............................................................................................................. 36
Acknowledgements 'Who helped?' In the process of the project, a large number of people have been a great help to me and I would like to thank: • Rendel Williams for his initial suggestion of the project and overall supervision throughout; • Keith Nie from the Engineering Department for his construction of the MEM; • Cherith Moses for her suggestion and advice on the screw and washer sites; • Yolanda Foot for her recommendations on site construction and other first-hand knowledge; • Paul Saddleton for his help on the construction of my first sites and recommendations of references; • Naomi Thompson and Sue Craske, the previous Physical Geography Laboratory Technicians for their
help in the gathering of the field work tools. • Eveyln Dodds, the Geography Resource Centre Map Curator for help in the gathering together and
processing of the maps and photographs for the cliff retreat analysis; • Hazel Lintott and Sue Rowland for their help with the scanning, manipulating and printing the cliff
retreat analysis; • David Hitchin for his extensive help with SPSS in the statistical analysis of the downwearing results.
Page 3
Abstract 'Preliminary summary' At Peacehaven, in East Sussex, a classic example of a chalk shore platform is found at the foot of cliffs defended by concrete sea walls and groynes. Two sites on the platform were studied in this document, based around two groynes at the west and east of the town. The cliffs behind these sites were found to be retreating at 0.332m per year until the defences were constructed, as many of the houses were close to cliff edge. The platform is continually downwearing via a variety of processes but in this document, it is found that it is greater in the runnels (water and shingle filled gullies) than on the ridges. Longshore drift causes the eastern sides of groynes to be more exposed, increasing erosion due to the continual removal of the coarse material. On the western sides, material tends to build-up, protecting the platform surface. Along the lengths of the groynes (which vary between 35 and 50 meters long), erosion is fastest close to the sea wall and approximately 20 to 25 meters from the sea wall. It tends to be slowest approximately 15 to 20 meters from the sea wall. Three methods were used for measuring the downwearing: a micro-erosion meter (MEM), screw and washers attached to the platform and designed to block denudation beneath them and the groyne structures themselves, which have blocked the denudation since they were installed 18 to 24 years ago.
Page 4
Introduction 'Peacehaven and its chalk erosion'
1.1 The Location of Peacehaven Peacehaven, in East Sussex, on the south coast of England, is a small cliff-top town located between the major towns of Brighton and Eastbourne (figures 1 and 2). It is a fairly new development, with the first home built in 1921 when Charles Neville bought land with the aim of creating 'an attractive seaside garden city' (Dickens, 1975). At first acting as a weekend retreat, it quickly became favoured by retired people from London. As a result, many of the buildings are bungalows. Unfortunately, Neville's idea never really came true. In reality, Peacehaven is just a sprawl of low-rise buildings in regimented rows. It has been referred to by Sir Nicholas Pevnser (1932 in Dickins, 1975) as a 'disgusting blot on the landscape'.
Figure 1: Map showing the location of Peacehaven in East Sussex. Source: Microsoft Encarta World Atlas 1998.
0 7
Kilometres
1 0
Figure 2: OS Map extract showing Peacehaven. Source: OS Explorer Map 122.
Kilometres
Page 5
The built up areas of Peacehaven/Telscombe are perched upon 4.73km (Stammers, 1982a) of the famous 'white cliffs of Sussex' (Robinson & Williams, 1983). These consist primarily of chalk (calcium carbonate), a sedimentary rock laid down under water from the skeletons of coccoliths: calcareous algae between 72 and 100 million years ago (Mortimore, 1983 in Cleeve and Williams, 1987).
However, chalk is extremely soft and its chemical composition means that it is very susceptible to dissolution from the natural acids in water. Wave attack therefore erodes such cliffs very rapidly at 0.45m per annum (prior to the construction of the sea defences) (Stammers, 1982a). As the retreat continues and the eroded chalk debris is removed by the 'near-shore currents', 'the stump' of the old cliff face is left behind in the form of a 'shore' or 'wave-cut' platform (Pethick, 1984). Such shore platforms are therefore a common feature of Southeast England.
1.2 Why and How the Sea Defences were Built Due to the rapid and rather unplanned development of the town, many bungalows at Peacehaven were located too close to the collapsing cliff edge and as the years progressed, residents and the council began to worry. It would have been more economical to abandon the houses and compensate the residents but it was under the advice of the chief technical officer, Richard Stammers, that 'Peacehaven was too large and important a place to be abandoned strip by strip to the sea' (Cleeve & Williams, 1987). As a result, work began in 1976 on the extensive sea defences which took the form of a substantial reinforced concrete sea wall topped with an under-cliff walk and concrete groynes extending out at right angles across the shore platform (figure 3). The cliff face was also cut back from its near-vertical angle to a supposedly more stable 70 to 80 degrees (figure 4). However, sub-aerial weathering (mainly the action of frost and precipitation) still occurs and as a result, some debris accumulates on the under-cliff walk. In February and March 2001, two major cliff falls occurred, the more eastern of which in phase 4 completely blocked the under-cliff walk and forced it's closure to the public.
Figure 3: Photograph showing the arrangement of the sea defences (looking east).
Groyne
Sea wall
Under-cliff walk
Page 6
Figure 4: Diagram showing a cross-section of how typical sea defences at Peacehaven were constructed. Source: Stammers, 1982 in Cleeve & Williams, 1987.
The phases over which they were built can be outlined in table 1. Table 1: The phases of sea defence construction at Peacehaven. Phase Date Started and
Completed Other details such as cost, etc.
1 1976 to 1977 Cost £900,000. Built to protect houses closest to edge. 2 1978 to 1980 Cost £1,100,000. Furthest west. 3 1981 to 1983 Cost £1,700,000. Filled in the gaps other than the very middle. 4 1996 to 1997 Cost approximately £1,400,000. Final section which lacks the
groynes which are characteristic of all the others. Appendix 1 shows a map outlining these 4 phases.
1.3 The Geology, Sea and Climate Originating from the Cretaceous era, the chalk at Peacehaven is in relative thin layers averaging ½ mile in thickness, overlying igneous and metamorphic rocks (Stammers, 1982a). Most is of the 'upper' type which was formed more recently and contains less clay and more flint than the 'lower' (Cleeve and Williams, 1987). It varies considerably in composition and hardness due to the varying degrees of fragmentation and fissuring, as shown by figure 5 to the west of the Bastion Steps (end of Steyning Avenue, Peacehaven). Interspersed amongst the chalk are near-horizontal layers of marls (greyer, less-pure chalk tending to be more crumbly) and flint. The substantial flint layers occur at 1-3 m intervals up the cliff face and also extend out across the shore platform.
Page 7
Figure 5: Sketch cross-section of typical weathering profile beneath a small chalk dry-valley west of Bastion Steps. Source: Mortimore, 1997.
The chalk in the cliffs and platforms are subject to semi-diurnal tides with a range of between 3 and 6m. The prevailing winds are from the Southwest and West. The climate is generally milder than adjacent inland areas in winters but cooler in summer. Average mid-winter temperatures are 5o to 6 o whilst mid-summer averages at 16 o to 17 o (Southern Water Authority records in Ellis, 1986). 'Air frosts are very uncommon in winter and ground frosts, though more common, are seldom severe' (Ellis, 1986).
1.4 Existing Knowledge of Cliff Retreat along the Sussex Coast Chalk cliffs erode very rapidly at their base due to the action of waves and this keeps them near vertical. Basal notches occur and as they grow larger, a failure plane develops which causes the cliff top above to become more and more unstable. Eventually, the cliff fails and a fall occurs (Cleeve and Williams, 1987).
Detailed surveys of chalk cliff retreat are comparatively rare (May, 1971). Most notable being those of May (1966, 1971) and Wood (1968) (Ellis, 1986). Those that have been carried out in the past have produced measurements quoted and re-quoted in many documents relating to sea defences, rising sea levels and geological, geomorphological or ecological interest. In particular, such studies have focused on areas of the most rapid retreat, such as Birling Gap, to the eastern end of the Seven Sisters (Workshop Notes, 1999). As already stated, Stammers uses a value of 0.45m of retreat per annum. This value is similar along the rest of the East Sussex coast as between 1873 and 1962, the Seven Sisters, to the east of Peacehaven, was recorded as retreating at an average of 0.5 meters per year, one of the fastest rates along the south coast (May, 1971). However, more recent studies by the European Shore Platform Dynamics Project (2000) using data from between 1873 and 1983 suggests a slower retreat rate at Peacehaven of between 0.24 and 0.38m per year. This may be due to measurements taken at different locations - the softer areas eroding faster than the harder. However, trying to work on the history of past cliff retreat is fraught with error. Cartographic evidence was, up until around 1750, highly inaccurate with decoration often more important than accuracy (Carr, 1962 in Baily and Nowell, 1996). Many maps are a 'composite of data collected over a significant amount of time' (Baily and Nowell, 1996) and knowing when the actual cliff line was surveyed is difficult. In addition, there are aerial photographs, which represent the real line at a set date. However, many are poor quality and distorted. Generally, cliff retreat occurs very spasmodically and in a variety of forms, from frequent small falls of a few stones to the rare occurrence of large mass movements as well as continuous granular disintegration.
Page 8
1.5 Existing Knowledge of Chalk Shore Platform Geomorphology Commonly defined as 'a horizontal or near-horizontal rock surface at the shore line' (Stephenson & Kirk, 1998), shore platforms have been described by Trenhaile (1980) as a 'neglected coastal feature'. It was his opinion that literature regarding these rocky littoral zones was not large and that it tended to focus on a few well studied areas, especially around Australia, New Zealand, Hawaii, Southern Britain and Southern Japan. They were first commented on in the mid-19th century (Ramsey, 1846 and Dana, 1849 in Ellis, 1986) but it was not until 1960 that the study progressed beyond looking at the processes operating on them. Most early studies concentrated on whether platforms were formed primarily from the processes of wave erosion or sub-aerial weathering. The results caused the term 'shore platform' to replace 'wave-cut platform' as only some are caused by this process. The shore platform acts as an energy buffer for the waves. As a result, it's width remains fairly constant (approximately 200m) as a narrow platform would cause more energy to be focused on the cliff base, enhancing retreat, whereas a wide platform would cause more friction on the platform from the waves, thus causing denudation (or downwearing) of the surface. It is therefore in a state of dynamic equilibrium (Cleeve & Williams, 1987). This theory is supported by studies that show platform width being greatest on coastlines exposed to the most vigorous wave action (Tenhaile, 1980). Sunamura (1975) explains in recent studies that they are only formed by certain types of waves. Shore platforms are now believed to be divided into two types: those found in Australia, New Zealand and certain Pacific Islands and those found in the Northern Hemisphere, especially in Britain (Hill, 1972). In this part of the world they can usually be roughly divided into 3 sections: Upper, Middle and Lower. Appendix 2 shows the 3 sections of shore platform as drawn by Ellis, 1986.
Movement of shingle and sand by longshore drift as well as falls from the cliff face usually ensure that the upper part is hidden beneath a narrow beach. Lower down, however, in the middle and lower zones, 'the platform is bare and often dissected by a network of runnels along which water is channelled during the rise and fall of the tide' (Cleeve and Williams, 1987). Logically, these tend to deepen with offshore distance. Also referred to as 'gullies', flint nodules from the horizontal layers in the chalk tend to accumulate here and are thought to increase the denudation through scouring (Williams, 2000). At Peacehaven, Wallingford (1999) explains that where beach deposits are absent the runnels extend up to the base of the sea wall. In contrast, where pockets of pebbles tend to accumulate, the chalk is badly scoured. In some places the platform is smoothly sloping but elsewhere it descends in a series of steps up to 1m in height. These steps back-wear as the platform surface lowers and the cliff retreats. More recent studies, such as Ellis (1986), Robinson and Jerwood (1987), Stephenson & Kirk (1998) have focused on this rate of platform lowering and the processes that cause it. As well as the effects of the breaking waves, a wide variety of sub-aerial processes have been discovered which cause or enhance the denudation, as can be outlined in table 2. Table 2: Sub-aerial processes that cause or enhance denudation on the shore platform. Process: Explanation: Scouring (sediment abrasion)
Sand, shingle and boulders rolled across the platform (especially in the runnels) or carried in the currents gradually erode the chalk as they rub or hit against it.
Biological activity (flora and fauna)
Limpets, barnacles, mussels, winkles and piddocks all have an impact. Certain animals burrow into the chalk surface such as polydora, whilst others gradually erode the surface, such as limpets as they move about algae grazing (figure 6). Sea weeds such as Enteromorpha attach themselves to the chalk surface and when ripped off remove chalk fragments. Amounts of sea weed and algae vary considerably between the seasons, being killed off from October through to May.
Page 9
Solution Chalk is very soluble in the natural acids of water. This includes the effects of rain and fresh water seepage.
Frost action (freeze-thaw) Cracking and 'spalling' occurs commonly in winter when temperatures drop below a certain level and the water in the chalk freezes and expands (Robinson & Jerwood, 1986/87) (figure 7).
Salt crystallisation Crystallisation, hydration and thermal expansion causes granular disintegration, flaking, scaling and blistering of the chalk. Frost damage is increased by the presence of salts in seawater (Robinson & Jerwood, 1986). Also causes honeycomb weathering through the salt in sea spray (Mottershead, 1989).
Hydraulic action Water is forced into cracks. Dissolved air comes out of solution and expands, cracking and weakening the chalk.
Wetting and drying Hydration and the effects of 'ordered' water exert physical stresses on the chalk.
Other chemical weathering processes
Includes hydrolysis, oxidation, carbonation and chelation.
Sta T
Figure 6: Photograph showing the grazing by a cluster of limpets.
White marks left by limpets
Figure 7: Photograph showing fresh chalk exposed by 'spalling' in cold, frosty conditions.
tudies involving measurement of the surface denudation have used a variety of methods, as outlined in ble 3.
able 3: Methods of measuring chalk denudation on shore platforms.
Page 10
Name of Method Description Indirect Measures: Weighed limestone tablets Exposed to the environment and re-weighed at
intervals. Can be suspended in open air, laid on the surface or buried at various depths.
Direct Measures: Micro erosion-meter (MEM)
(original design by High and Hanna, 1970)
Studs are secured into the limestone surface and these stay where they are whilst erosion occurs. The MEM sits on these studs and probes attached to gauges move down and measure the level of the surface.
Traversing micro-erosion meter (TMEM)
Similar to the MEM but a new design where the probes can be moved to many positions to take many readings.
Laser scanners These construct detailed maps or models of the rock surface microrelief (Williams et al., 2000).
Natural and artificial pinnacles
Items which block denudation - both natural such as glacial erratics and man-made such as concrete or metal.
Weighed limestone tablets are a possibility but they must be well secured to avoid them being washed away. Removal can thus be difficult when weighing is required and weighing equipment must be either carried to the site or the tablets taken away. A tablet, although close, does not totally represent the natural chalk surface. As a result, shore platform downwearing has mainly been measured using MEMs, TMEMs, laser scanners and pinnacles. A study by Ellis in 1986 (in Robinson & Williams, 1983) using an MEM, discovered that between Brighton and Newhaven, rates of platform downwearing varied between 1mm and 10 mm per year, with an average of 3 mm per year. More recently, but far away from British shore platforms, Stephenson & Kirk (1998) used an MEM and a TMEM to measure lowering on the Kaikoura Peninsula, South Island, New Zealand. Different rock types and lithologies were tried. Sloping mudstone eroded at a rate of 1.983mm per year whilst almost horizontal mudstone eroded at a slower rate of 0.733mm per year. On limestone, the lowering rate was 0.875 mm per year, slower than that discovered by Ellis in 1986. Current projects such as the European Shore Platform Erosion Dynamics (ESPED) are helping considerably to heighten the international knowledge of the processes and rates of shore platform downwearing, as well as the link with the retreat of cliffs.
1.6 Application at Peacehaven At Peacehaven, all of the methods outlined in table 3 have or are currently being used. This is due to the: • Lithology of the chalk being relatively constant (Mortimore, 1979); • Coast almost uniformly facing south-south-west and therefore it is not subjected to local climatic or
meteorological variations; • Relative ease of access. (Ellis, 1986). The concrete groynes, installed in the three phases have blocked the denudation beneath them, creating pinnacles. Most are between 35 and 50 meters long and have concrete plinths on top of their foundations. These plinths were originally at the same level as the chalk surface (figure 8). However, the chalk has denuded, slowly exposing the foundations and in some place has gone further, beginning to eat under the concrete, leaving overhanging and unsupported ledges (figure 9).
Page 11
Figure Photogrphase 2groyne way erotaking punderneconcrete
Part oconcreleft hamid-aplatfohave obeen aheight
1.7 Po There a Firstly,conside Ap
As can to the msuch ascomparin soft 'the platthe uppvary alsto a mu
Figure 8: Diagram showing a typical section through a mass concrete groyne at Peacehaven. Source: Stammers, 1982a.
9:
aph of a (1980) showing the sion is now lace ath the base.
f the te plinth is nging in ir - level of rm would riginally t this . Severely exposed foundations
tential Areas of Research on the Shore Platform
re particular areas of shore platform erosion, which have still had little or no study.
there is the difference in rate between runnels and the higher 'ridges' in-between. Runnels vary rably in their depth and have been classified by Ellis (1986).
pendix 3 shows the different types of platform surface featuring the different runnels.
be seen, they range from anything up to 1m deep on the 'type 4' terrain (confined almost entirely id and lower platforms) which is quite 'rugged' (figure 10). However, on shallow, smoothed areas, that shown in the 'type 2' and 'type 3' terrains, they can be just a few centimetres in depth in ison to the ridges by their side (figure 11). In this case, they are often known as having developed griottes' and the occurrence of fluting may also be visible on the chalk surface (commonly seen on form near the access ramp at Telscombe, far West Peacehaven). Such terrain occurs commonly in er platform zone close to the sea wall within five or six meters of the edge of a beach. Width does o, but generally they are no more than 30 cm. Sea and rainwater flows up and down these runnels ch greater extent than the ridges, increasing solution as well as rolling stones and carrying shingle
Page 12
which increase abrasion. However, ridges are more exposed to the forces of the waves and to sub-aerial weathering such as frost shattering as they protrude above a lot of the surrounding relief. Many runnels are continuously full of water and hence they tend to lack a number of organisms which prefer to live in environments that are periodically wet and dry depending on the tide (intertidal) such as limpets. Taking all these factors into account, it is probably logical to hypothesis that denudation of the chalk surface is faster in the runnels.
Figure 10: Photograph showing some of the deeper runnels. These were located to the west of a groyne near the base of the sea defences.
Secondly, erosion rates on either side of the groynes foundI thought required further research. Initial thoughts werecause waves to hit the western sides of the groynes with of the chalk on this side. In contrast, the eastern side is energy would cause slower erosion. However, this was bconstructions contribute towards the retention of beaceastwards along the platform (longshore drift) tending to bof the groynes. They are steepest here, forming a 'high peof the groyne becoming narrower (Wallingford, 1999).particles, and therefore sand is often found to the west of gamount of fine stable sediment to the western sides of thelikely to protect the surface of the shore platform. On the ethe platform is exposed to the full extent of the waves. In is likely to help scour the surface as it is moved eastwarhypothesis that denudation of the chalk surface is likelwestern. Thirdly, erosion along the length of the groynes (i.e. fromvary. It has been outlined by Ellis (1986) that erosion is gwave quarrying is dominant and deep runnels form. It is awaves hitting them 'to rise higher than usual, and plunge d(Cleeve & Williams, 1987) which has the effect of increas
Page 13
Figure 11: Photograph showing some of the shallower runnels. Here coarse beach material moves frequently, 'smoothing' the surface. Marks can be seen (but not in this photograph) where this occurs.
in phases 1 to 3 particularly interested me and that the prevailing south-south-westerly winds greater force, which would increase the erosion in a wave shadow and as a result the reduced
efore the shingle was considered, as the groyne h material. Sand and shingle generally shift uild up in greater volumes on the western sides
rmeable storm ridge' but flatten out further west Preferential movement is usually of smaller roynes and coarse shingle to the east. The large groynes, the base of which is rarely moved, is astern sides, where there is often little material,
addition, the coarse material that is present here ds by longshore drift. It is therefore logical to y to be greater on the eastern sides than the
the sea defences towards the sea) is likely to reater on the lower parts of the platform where lso known that concrete sea defences cause the own at the base of the walls with greater force' ed scouring at the foundations. This is likely to
occur in two places: at the ends of the groynes, which are the first concrete obstacles to the oncoming waves and at the base of the sea walls. As a result, it is likely that denudation will be fast at the two extremes: high up the platform, close to the sea wall and lower down the platform, near the ends of the groynes. In the middle, it is logical to hypothesis that erosion will be slowest (figure 12).
Under-cliffwalk CLIFF
Groyne - 35 to 50m long SEA
Slowest erosion possibly occurs here
Sea wall
Figure 12: Diagram showing my hypothesis for rates of chalk denudation around the groyne structures on the shore platform.
Fastest erosion possibly occurs here
Page 14
2.0 Aims 'So what will be achieved in this project?' Using a methodical and planned approach, the aims of this study can be outlined in table 4. Table 4: The aims of the project. Aim Explanation • Map and work out the rate of past cliff retreat
before the sea defences were constructed.
Before present day erosion is looked at, it is important to understand how the Peacehaven cliffs retreated in the past. This will be carried using Ordnance Survey maps and aerial photography.
• Study the rate of chalk erosion on the shore platform using three methods:
1) MEM
The standard tried and tested method using a device to be constructed for the task.
2) Create pinnacles by screwing metal washers onto the chalk surface and letting the chalk erode down around but not underneath the washer.
An alternative method, more basic but capable of providing useful results.
3) Measurement of the pinnacles under the groynes.
The date that the groynes were built is known and hence the amount of erosion per year can be calculated.
• Compare these three methods
The MEM is trusted by many people as a standard method for measuring such erosion. I felt it would be interesting to try the two 'less technical' approaches as both a back-up and to see if they give the same results.
• Map how erosion occurs over the months and how the seasons effects it
Graphs of erosion rates can be drawn using the data collected for the first two methods.
• Compare erosion on the west and east of the groynes
Through the use of graphs and statistics, prove or disprove the hypothesis: Erosion is greater on the eastern sides of the groynes.
• Compare erosion rates in ridges and runnels
Through the use of graphs and statistics, prove or disprove the hypothesis: Erosion is greater in runnels than it is on ridges.
• Map erosion rates along the length of the groynes
Through the use of graphs, prove or disprove the hypothesis: Erosion is greatest at either end of the groynes and least in the middle.
Page 15
3.0 Methods 'How were these aims achieved?' The full length of sea defences were firstly analysed in detail to find the most suitable locations for the investigations to take place, taking into account: • The accessibility to the groyne - for practical and safety reasons; • The phase that the groyne was built in - ideally the different groynes chosen would in different phases; • The level of development of the ridges and runnels - well developed means that confusion over
ridge/runnel is avoided and means that the shore platform 'layout' can be remembered and thus sites returned to and located easily;
• The amount of sand/shingle around the groyne - too much and the shore platform is hidden; • The level of platform in relation to the tide - a low area of platform is quickly covered by the tide
reducing the amount of time in which measurements can be taken. It was decided after careful consideration that the platform surrounding two groynes was to be studied. The first is located to the far west of Peacehaven, in phase 2 near to the Malines Avenue (South) access ramp. It is approximately 50 metres long. The second is to the far east, in phase 1 near to the Friars Bay access steps. It is approximately 35 metres long. From now on these will be referred to as the western groyne and the eastern groyne. Appendix 4 shows the locations of the western and eastern groyne. Appendix 5 shows the view from the sea defences over the western groyne. Appendix 6 shows the view from the sea defences over the eastern groyne.
3.1 Mapping Past Cliff Retreat The Geography Resource Centre at the University of Sussex has a large map and aerial photographic collection which was used to map the past cliff retreat at Peacehaven. In addition, the East Sussex Records office based in Lewes was used to obtain a few extra maps and photographs to effectively 'fill in the gaps'. Only the retreat of the cliffs directly behind the two chosen groynes would be measured, not all of the cliffs at Peacehaven as this would complicate matters and be irrelevant in this study. Appendix 7 shows tables outlining the details of the maps and photographs that were obtained from
these two sources. The maps and photographs were scanned into a Macintosh computer and then enlarged, reduced, moved and rotated in the Freehand 8 graphics software until they were placed exactly on top of one another. Roads, landmarks and gridlines were used to do this as accurately as possible. 1928 was used as the base map for the western site against which the others were aligned, whereas the 1959 photograph was used as the base for the eastern site. The top of the cliffs as indicated by the maps, or by the end of the grass on the photographs, was then drawn as a separate line for each of the years obtained. A different colour was used for each year and a scale was scanned in from one of the later maps in order to ensure accuracy within the computer. The year that the photograph was taken, or that the map was published (the edition date), was then placed next to the line. The edition date is obviously not the exact date that the cliff line was measured - this would have been the 'surveyed', 'revised' or 'levelled' date. However, most maps are published within 2 or 3 years after they were surveyed and so to avoid further confusion, the edition date was used on the cliff lines in the computer. Cliff lines could thus be reconstructed from the maps and photographs shown in table 5.
Page 16
Table 5: The years for which cliff lines were constructed. Western Groyne Eastern Groyne 1879 (map surveyed 1873) 1879 (surveyed 1873) 1899 (map surveyed 1873) No equivalent to 1899 found 1910 (map revised 1908) 1910 (map revised 1908) 1928 (map revised 1926) 1928 (map revised 1926) 1938 (map revised 1938) 1937 (map revised 1937/38) 1957 (photo - actual date) 1957 (photo - actual date) 1960 (photo - actual date) 1963 (map revised 1962) 1963 (map revised 1962) 1972 (map surveyed 1971) 1976 (map revised 1974) 1976 (map revised 1974) 1983 (map revised 1982) 1983 (map revised 1982) Near current line from OS digital maps Near current line from OS digital maps
Using the moveable scale on screen, like a ruler and making use of the ability to zoom in and out, the distance between each of the cliff lines was then estimated.
3.2 The Micro-Erosion Meter (MEM) Sites The MEM was constructed from stainless steel in a very similar design to the original by High and Hanna (1970 in Goudie, 1990). Two engineer's gauges, which measure to an accuracy of 0.001mm and have a vertical probe range of 82mm, are attached to the three legged, triangular frame. The probes from the engineer's gauges are spring loaded so that their natural position is down as far as they can go. This means that they naturally rest on the chalk surface. Unfortunately, this design increases the chance that the probes themselves will cause erosion of the sites as outlined by Spate et al. (1985), Mottershead (1989) and Williams et al. (2000). In an effort to reduce this, ordinary clothes pegs were clipped around the tops of the probes whilst the MEM was being positioned on the three studs at each site. Once stable, the pegs were released and the probes where allowed to move slowly down on to the chalk surface. As the legs are placed at the corners of equilateral triangle, the frame can be turned around 3 times and thus 6 readings can be taken. In an effort to design an MEM that is easier to use in runnels, each of the two probes has 4 positions on the frame, of varying heights. In their lowest position, the legs of the MEM could essentially sit high up in the runnel (almost on the ridges) and the probes would reach down to the base of the runnel. This allows it to be used in areas much narrow than the actually width of the MEM as the bulk of the frame is higher up where the runnel is wider. In addition, it helps keep the bulk of the frame out of any salty, corrosive water. However, the probes were kept at their highest position for the entire use of the MEM as the base proved small enough to fit into the most narrow of runnels. If the probes had been changed position in the field for use on various sites, then readings would have been more inaccurate. Also made with the MEM was a brass base plate that is used for calibration purposes. See figure 13 for a photograph of the MEM on its bass plate.
Page 17
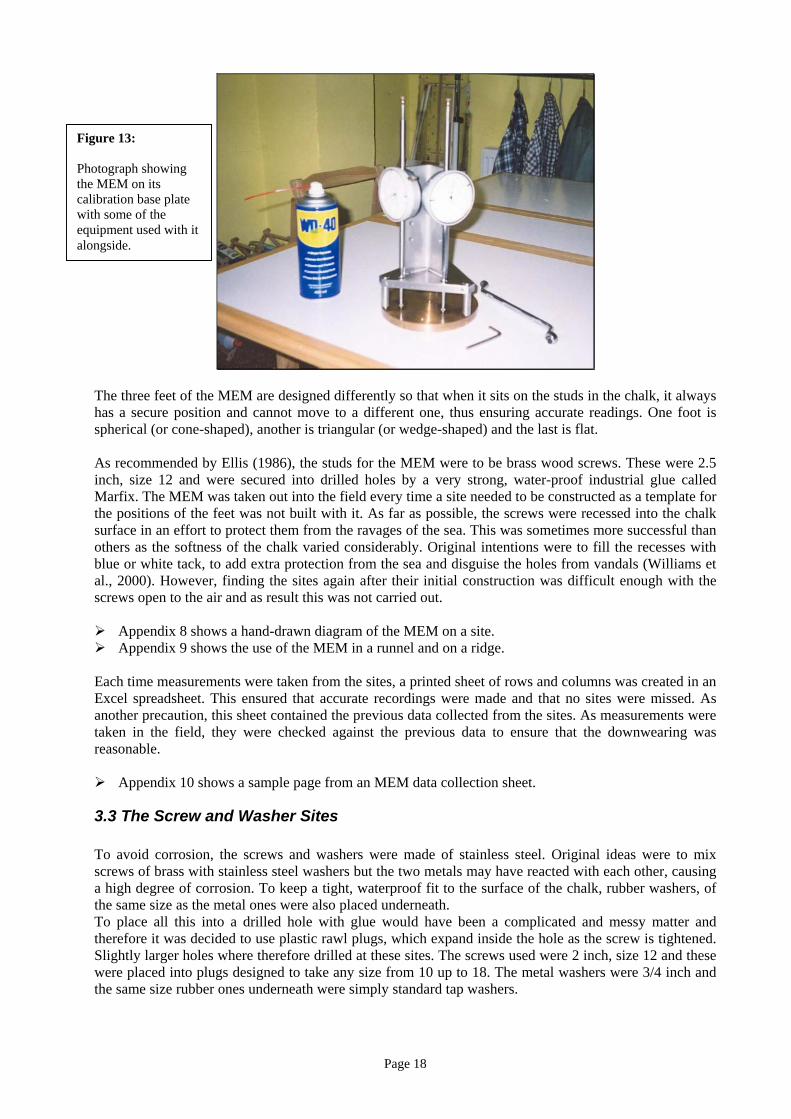
Figure 13: Photograph showing the MEM on its calibration base plate with some of the equipment used with it alongside.
The three feet of the MEM are designed differently so that when it sits on the studs in the chalk, it always has a secure position and cannot move to a different one, thus ensuring accurate readings. One foot is spherical (or cone-shaped), another is triangular (or wedge-shaped) and the last is flat. As recommended by Ellis (1986), the studs for the MEM were to be brass wood screws. These were 2.5 inch, size 12 and were secured into drilled holes by a very strong, water-proof industrial glue called Marfix. The MEM was taken out into the field every time a site needed to be constructed as a template for the positions of the feet was not built with it. As far as possible, the screws were recessed into the chalk surface in an effort to protect them from the ravages of the sea. This was sometimes more successful than others as the softness of the chalk varied considerably. Original intentions were to fill the recesses with blue or white tack, to add extra protection from the sea and disguise the holes from vandals (Williams et al., 2000). However, finding the sites again after their initial construction was difficult enough with the screws open to the air and as result this was not carried out. Appendix 8 shows a hand-drawn diagram of the MEM on a site. Appendix 9 shows the use of the MEM in a runnel and on a ridge.
Each time measurements were taken from the sites, a printed sheet of rows and columns was created in an Excel spreadsheet. This ensured that accurate recordings were made and that no sites were missed. As another precaution, this sheet contained the previous data collected from the sites. As measurements were taken in the field, they were checked against the previous data to ensure that the downwearing was reasonable. Appendix 10 shows a sample page from an MEM data collection sheet.
3.3 The Screw and Washer Sites To avoid corrosion, the screws and washers were made of stainless steel. Original ideas were to mix screws of brass with stainless steel washers but the two metals may have reacted with each other, causing a high degree of corrosion. To keep a tight, waterproof fit to the surface of the chalk, rubber washers, of the same size as the metal ones were also placed underneath. To place all this into a drilled hole with glue would have been a complicated and messy matter and therefore it was decided to use plastic rawl plugs, which expand inside the hole as the screw is tightened. Slightly larger holes where therefore drilled at these sites. The screws used were 2 inch, size 12 and these were placed into plugs designed to take any size from 10 up to 18. The metal washers were 3/4 inch and the same size rubber ones underneath were simply standard tap washers.
Page 18
Appendix 11 shows a diagram of such a site. To measure the downwearing, a contour gauge was used. This device consisted of a line of parallel sliding pins in which an impression is made when it is pushed down onto any hard surface. The gauge can then be taken away and drawn onto pieces of carpet, tiles or in this case, graph paper. When pushing the gauge onto the screw and washer sites, an impression is made which includes both the surface of the screw/washer and the surface of the chalk, which each time should be slightly lower as it downwears. The distance from the screw/washer top to the chalk surface was then measured off the graph paper when no longer in the field. A metal gauge was my first consideration, but this would have rusted extremely quickly and therefore a plastic one was used. This did not have such fine pins, but in my opinion, did not matter as long as the top of the screw and the chalk surface was obtained in each graph. To ensure that the line copied onto the graph paper was as accurate as possible, a propelling pencil was used with a very fine lead. Appendix 12 shows a diagram of how this is supposed to work. Appendix 13 shows the use of the contour gauge on screw/washer sites in a runnel and on a ridge.
It was important that the contour gauge was laid onto the screw and washer at exactly the same position each time to ensure that the same part of the chalk surface was measured. Therefore a diagram was made of each site in September, showing the directions, main features in the chalk around the screw and how exactly the gauge was laid onto it (e.g. if it followed the groove in the screw top). Appendix 14 shows a contour line and diagram taken in September.
Out of the field, the graphs were enlarged by 141% (A4 up to A3 size) so that measurements would be more accurate and these were then divided by 1.41 to get the real measurement in millimetres. The most obvious point on each of the graphs was the screw top and so it was from this point that measurements were made.
3.4 The Location, Construction and Frequency of Measurement of the Sites The arrangement of the measurement sites was a difficult decision, as they need to be in many different locations to test the aims explained above. Sites are sometimes permanently lost due to the bending or movement of a screw, or temporarily lost through being buried or flooded (Williams et al., 2000). Sometimes, the worker cannot find the site due to disorientation. Out of Ellis' (1986) 44 major sites established in August 1981, only 15 actually operated for the full 3 years. As a result, many sites are required at the beginning to make up for loses towards the end. Having virtually identical sites at two different groynes meant that if a site is lost at one groyne, then an equivalent could be found at the other. The intention was to have transects on the shore platform positioned along each side of the groynes, which are between 35 and 50 meters long. This would cover the upper and part of the middle platform but not touch the lower part. Sites needed to be located in both ridges and runnels and there needed to be a mixture of MEM and screw/washer sites. The aim was to have transects following one particular runnel along the shore platform. Thus sites in that runnel would all be located in the same type of chalk and have the same water running over them. The landward ends of some runnels are located under rainfall runoff pipes from the under-cliff wall. Hence the water in these may run more frequently and will be of a different chemical constituency than sea water. If sites were located in different runnels then these conditions may vary and make conclusions less reliable. After careful consideration, it was decided that there would be a total of 4 MEM sites along each runnel transect and on the accompanying ridges, a corresponding MEM site (making a total of 8). On the western groyne, there will also be screw/washer sites in-between the MEM runnel sites and on the eastern groyne there will be screw/washer sites in-between the MEM ridge sites. Therefore there will be 12 sites on either side of the groynes (making 24 sites at each groyne and a total of 48 sites overall). There are less screw/washer sites as these are likely to be more unreliable. Figure 14 shows the basic layout of the sites.
Page 19
Figure 14: Diagram showing the basic layout of the MEM and screw/washer sites around the groynes at Peacehaven.
Screw/washer site MEM site
This worked out that MEM sites were found within approximately 6 to 9 meters of each other, with the screw and washer sites found more-or-less in-between. Due to the nature of the shore platform, it is difficult to place a site at an exact measured distance. A fairly flat, chalky (i.e. little flint) surface must be found which will not be easily flooded or covered by excessive amounts of sediment. Finding such an area in a runnel was often difficult. It was also especially difficult to place sites close to the groynes as runnels there were often extremely deep and water filled or the accumulation of shingle to their west meant that a lot of the back of the platform was covered. As a result the average distance from the groyne for a site was 7 meters, slightly larger than originally intended. The sites were numbered in the order in which they were constructed which unfortunately was not completely logical. However, to avoid my own confusion, I decided not to renumber them. Appendix 15 and 16 show graphs of the layout of the sites.
After the construction of each site, photographs were taken of it close to and from a distance at a set point (e.g. the end of the groyne) so that they could be relocated. To the east of the western groyne, the runnels are very shallow and hence the platform is very similar. As a result, careful measurements were taken of the distance from the sea wall and from the groyne so that on returning, the sites could be located within a few 10s of cms or so. This method proved to work very well. Towards the end of the measurements, a diagram of each transect was drawn to allow the reader to picture more easily the runnel in question. Appendices 17 and 18 show the hand-drawn diagrams of the transects along the runnels. Appendices 19 and 20 show photographs looking towards the sea defences, the pink and blue bags
marking the approximate positions of the different types of measurement site on the platform. The construction of 48 measurement sites took quite some time and so beginning in early August, they were not complete until the beginning of September when the first proper measurements were taken. Erosion is fairly rapid but not worth measuring at intervals any less than one month. Having finished construction and taken the first initial measurements in a low tide 'window' around the 7th/8th of September, I then aimed to returned every month in the same window (which gets about a day earlier with each month) until the beginning of March. This would give 6 months worth of data. Two days each month were required for data collection. Generally, this was divided between the MEM and the screw/washer sites. However, the second day also gave the opportunity to find sites that were buried or flooded on the first, as the platform is very much a continuously changing environment. After returning from the field on the first day, the MEM data was input into the Excel spreadsheet and checked, so that if mistakes were found, the site in question could be measured again on the second day.
Page 20
3.5 Measurement of the Heights of the Pinnacles Under the Groynes As already stated, different parts of the sea defences were built at different stages. These dates, roughly 3 years apart are 1977, 1980 and 1983. Originally, I intended to focus on just the two groynes in question (and thus just 2 phases) for this task but I decided that this would not provide enough data to make the analysis accurate. If there was an abnormality in the downwearing around one or both of the groynes then conclusions for all the groynes for those phases would be wrong. Therefore, I took measurements from 3 groynes in each phase (a total of 9 groynes). My first intentions were to use levelling equipment for this task, so that the rest of the platform, rather than just the parts next to the groynes, could be taken into account. However, alongside the cliff retreat analysis, there was simply not enough time available to learn the techniques involved. In addition the latest equipment, the tachometer, had proved difficult to understand to previous users in the department. Therefore, measurements with just a simple tape measure were taken. The distance between the top of concrete plinth and the surface of the shore platform represents the amount of denudation that has occurred since the groynes were first constructed. This was measured at 8 meter intervals starting from the front, closest to the sea. Depending on the amount of shingle accumulation at the back of the groyne, a maximum of 4 measurements were usually made along each side.
Page 21
4.0 Data Collection 'What happened over the 6 months?' The site construction and data collected took place over the periods outlined in table 6. Table 6: The calendar of events in the chalk erosion measurements. Time Period: Task Achieved: Problems Encountered: Early July Preliminary analysis of the sea
defences and groynes at Peacehaven allowing a decision on the two sites to be made.
Lack of knowledge of the tides and the size of the area made decisions difficult.
9th to 11th August: Started on western groyne: Construction of: MEM sites 1 to 7 and 9. Screw/washer sites 8 and 10 to 16.
Initial lack of knowledge of drill, glue, MEM and shore platform made work slow.
23rd to 26th August: Site 9 reconstructed due to misplaced screws. Construction of: MEM sites 17 to 24. Moved over to the eastern groyne: Construction of: MEM sites 26 to 33 + 38, 39. Screw/washer sites 25, 34 to 37, 40 + 41.
Rechargeable hand-drill batteries ran out frequently.
6th September: Construction of: MEM sites 42 to 44, 46 to 48. Screw/washer sites 45.
Reconstruction of site 25 as old one was covered with shingle.
7th and 8th September: Measurements taken for all sites. These do not give any erosion values yet as they are the base level.
Reconstruction of site 5 as misplaced screws. Screw/washer site 12 broken and replaced.
7th and 8th October: All measurements taken for sites that were found. Great storms occurred in this month.
Right-hand probe on MEM rusted up in mid September. Whilst in repair, the probe had to be removed from the frame and then replaced. However, the calibration plate indicated that little had changed. Screw/washer site 10 was buried beneath an accumulation of shingle at the back of the east side of the western groyne.
5th and 6th November: All measurements taken for sites that were found. Great storms occurred in this month.
MEM site 20 lost due to bent/moved screws. Site 9 looked as if it could go that way soon. Large accumulation of shingle in the middle of the platform to the east of the western groyne buried MEM sites 5 + 18 and screw/washer sites 12 + 13. Also caused a build up of water behind which flooded MEM sites 4 + 19. MEM sites also buried: 28, 30, 38, 39, 42 + 48.
Page 22
Similarly, accumulation of shingle pocket at back of east site of eastern groyne also buried screw/washer site 37.
5th and 6th December: All measurements taken for sites that were found.
Fell over with MEM and as a result the left-hand probe moved on the frame (luckily no other damage). After adjustment, the calibration plate showed that there was little difference. Accumulation of shingle at the back of east side of the western groyne buried MEM site 9 and screw/washer site 10. MEM site 28 also buried. Screw/washer site 37 also buried due to November's reason.
3rd and 5th January: All measurements taken for sites that were found.
Again, accumulation of shingle at back of east side of the western groyne buried MEM site 9 and screw/washer sites 10 + 11. MEM sites 28, 29 and 30 also buried. Screw/washer site 13 buried as well as 37 (due to November's reason).
2nd and 3rd February: All measurements taken for sites that were found. Measurement of the height of the pinnacles under a selection of 9 groynes (3 from each phase).
Accumulation of shingle at back of east side western groyne largest yet - buried MEM site 9 and screw/washer sites 10 + 11. The movement of this shingle is moving and bending the screws of MEM sites 4 + 19. These are likely to be lost very soon. MEM sites 28 + 30 also buried.
2nd and 3rd March: All measurements taken for sites that were found. End of data collection.
Accumulation of shingle at back of east side of western groyne - buried MEM site 9 and screw/washer sites 10 + 11. MEM site 19 lost as suspected in February.
Whole period from October through to March:
The maps and photographs for use in the cliff retreat analysis were slowly gathered together, scanned, processed and finally, when all the appropriate cliff lines had been drawn, measured and printed.
As can be seen, in table 6, data was able to be collected for every month, although a number of problems were encountered. Returning with the MEM and contour gauge, each site had to be located, cleaned and measured. Unfortunately, finding some of the sites was often difficult as they were either flooded by dammed water or, more frequently, buried. Digging for the sites occasionally led to success, but with particularly deep layers of shingle, water is soon reached which again obscures the chalk surface. In some circumstances, bailing the water out was possible using a combination of a small cup and a syringe. White tack was occasionally used to create dams in an effort to stop the water flowing back so quickly (figure 15).
Page 23
Each month, within a week of returning from the field, the engineers dial gauges on the MEM would rust up and stop working, despite avoiding excessive contact with salt water (which on the shore is extremely difficult). Cleaning of the gauges with a moist rag directly after returning from the field and then spraying with WD40 every day was the only way to free them up again. During the summer months (August and September), there had been little shingle material to the east of the western groyne, at the back of the shore platform. Longshore drift had ensured that all the material was moved to the eastern ends of the 'sections' in-between the groynes. However, as the autumn and winter approached and the wettest weather ever recorded occurred, storms moved this material into a variety of positions along the length of the groyne, causing many of the sites on the shallow relief to be covered by many inches of stones, sand and water. At the beginning of November, shingle accumulating in the middle of the groyne buried a number of sites and dammed a large 'pool' of water which flooded others (figure 16). By the beginning of February, this shingle had been moved back against the sea wall into a very steep 'storm ridge' which spread out to about 14 meters from the sea wall (figure 17). This stayed like this until March when data collection ceased.
Figure 15: Photograph showing the use of white tack to try and stem the flow of water through this shallow runnel. Not surprisingly the screws at this site began to move within a couple of months of construction.
Figure 16: Photograph showing the build-up of shingle in the middle of the eastern side of the western groyne. Water has been dammed behind it.
White tack
Accompanying ridge site
Bare platform Bank of shingle
Pool of water
Page 24
Figure 17: Photograph showing the build-up of shingle at the back of the east side of the western groyne.
This continuous movement of shingle caused rapid downwearing and exposed a number of the MEM screws, which were then moved or bent. Site 20, the ridge MEM site located closest to the sea wall, was the first to be lost in November (figure 18), followed by 19 (also on a ridge) in March. Site 9 (20's runnel 'partner') may have been lost after November, but was never uncovered by the shingle again.
Figure 18: Photograph showing MEM site 20. Denudation has been so fast that the chalk surface is now far beneath the tops of the screws, exposing them to the elements. As a result the screws have moved and do not line up with the feet of the MEM at all. Leg of MEM misses screw
completely.
Unfortunately, MEM site 28 was constructed in a rather bad location and as a result it was either buried or flooded for most of the months of the year.
Page 25
5.0 Analysis and Results 'What can be done with this data?'
5.1 Past Cliff Retreat Appendices 21 and 22 show the final cliff lines, excluding all the maps and photographs used to
construct them except for the basic OS digital map. Using these, it can be seen that between 1879 (actual date 1873) and 2000, the cliffs at the western groyne have retreated by about 54 meters and the cliffs at the eastern groyne have retreated by about 42.5 meters. As described in the methods, the on screen scale was used to measure the amount of cliff retreat between each of the years obtained. The annual rate of retreat between these time periods can then be worked out. Appendix 23 shows the calculation of these annual retreat rates.
Using the dates from the column headed 'Actual date that cliff top was likely to have been measured', it can be seen that the greatest rate of retreat was between 1974 and 1982. Presumably this is due to the works which artificially cutback the cliff face between these periods. After this, retreat slows down again, particularly at the eastern groyne with a rate of 0.056m per year. Ignoring the retreat rates during and after the defence construction, the average rate at the western groyne is 0.351m per year. At the eastern groyne this is very slightly less at 0.312m per year. Together these make an average of 0.332m per year. This ties in well with the values calculated by ESPED (2000) of between 0.24 and 0.38m per year. Looking at erosion over time, back in the 1800s it was fairly fast at around 0.5m per year. However, due to the age of these maps and the potential lack of landmarks, these are probably the least trustworthy of them all. At the western site, retreat then slows down into the 1900s to a steady 0.2 to 0.3m per year until 1957 where the mapping becomes untrustworthy and the cliff appears to grow by 2.5m in 3 years! After this cliff retreat generally slowed down to a high 0.2m per year until the defences were constructed in 1980. At the eastern site, the trend is very similar. However, the 1900s start off with a slower rate of 0.03m per year, increasing to 0.5m per year in the decade after 1926 and then returning to a slower rate again of 0.08m per year. Again, the values around 1957 to 1962 appear to be suspect, with an extremely high rate of 1.2m per year. Up until the sea defences were built in 1977, rates stayed at around 0.13m. Generally, values for the eastern groyne are slower than that for the western, presumably because the chalk here is harder. This would also provide a good explanation for the existence of the headland.
5.2 Current Platform Downwearing Data provided by the MEM was much more successful than that from the screw/washer method. Results using the contour gauge appear more random and unreliable, many actually showing the surface of the chalk rising (negative erosion) than eroding. Most of the MEM measurements recorded downward movement of the chalk surface. As there were 6 measurements at each MEM site, any negative values were generally cancelled out when the average of these was found. However, a number of MEM readings, especially those taken at the beginning of October and February still gave negative results. This occurrence has been outlined in detail by Mottershed (1989) where she describes it as 'episodic occurrence of elevations of the surface' and later as a 'swelling'. Her MEM readings in Devon seemed to suffer from a peak in April/May but that there was no real evidence to support the summer/winter difference. Although the least occurrences of 'swelling' were in the data collection at the beginning of November, December and January, they may have not been obvious due to the extensive erosion that occurred over these winter months.
Page 26
Original ideas were to combine the data obtained from the screw/washer sites with that of the MEM, allowing more detailed transects. However, the two methods produced such different data that the only way to use them is separately. Although it would be easier at this stage to perform more analysis on the MEM data, in the process of fairness, I will perform the same on both. The missing data for sites which were lost or buried/flooded provides the largest problem to analysis as the erosion results obtained are no longer monthly but anything from just 2 months up to (in one case) 5 months. The only way I could see to deal with this in Excel was to divide the values obtained by the number of months missed.
5.2.1 Overall Averages 5.2.1.1 MEM Results: Using the MEM values, the average platform downwearing for all areas studied over the entire 6 months is 1.09mm per month. 5.2.1.2 Screw/Washer Results: Using the values produced from the contour gauge, the average platform downwearing for all areas studied over the entire 6 months is 0.178mm per month. This is much smaller than that recorded by the MEM, due to the large amount of negative values obtained. In my opinion the MEM result is a lot more accurate.
5.2.2 Western Groyne Versus Eastern Using the MEM data, the values work out at 1.19mm per month for the western groyne whereas it is 1.00mm per month for the eastern groyne, showing that both shore platform denudation and cliff retreat are slower at this eastern location. The screw/washer data cannot reliably be used to back this conclusion as only runnel sites were set up at the western groyne (which are hypothesised to erode faster) and only ridge sites were set up at the eastern groyne (which are hypothesised to erode slower).
5.2.3 Erosion Over the Months Erosion varied considerably over the months, especially from the winter into the spring and as result, it would be unwise to predict the average annual downwearing from these monthly rates. 5.2.3.1 MEM Averages: See table 7. Table 7: The average denudation over the months for MEM sites. Month: Average Amount of Erosion (mm) September: 1.19 October: 1.08 November: 1.26 December: 1.66 January: 0.72 February: 0.69
Page 27
5.2.3.2 Screw/Washer Averages: See table 8. Table 8: The average denudation over the months for screw/washer sites. Month: Average Amount of Erosion (mm) September: 0.209 October: 0.128 November: 0.330 December: -0.103 (growth!) January: 0.416 February: 0.051 5.2.3.3 Graphs: Appendix 24 shows the MEM data from table 7 in a graphical format. Appendix 25 shows the screw/washer data from table 8 in a graphical format.
As can be seen from the MEM data (appendix 20), the greatest rate of erosion occurred during November and December, when some of the worst storms occurred and the most shingle was moved around, scouring the platform. This high rate in November is supported by the screw/washer data. However, in contrast it shows that in December the surface supposedly raised more than it eroded. The MEM data shows that the least occurred in January and February, despite this being the middle of the winter and the occurrence of frost action. This may be partly due to the expansion of the chalk as explained before. It must be also noted that these averages are taken from the sites that were found at the time and that hadn't been lost. Sites that experienced the greatest erosion were thus lost towards the end and therefore these averages are perhaps smaller than they should be. The screw/washer data indicates that the greatest erosion occurred in January, which does tie in with the frost action. However, again, I would trust the MEM data more than the screw/washer.
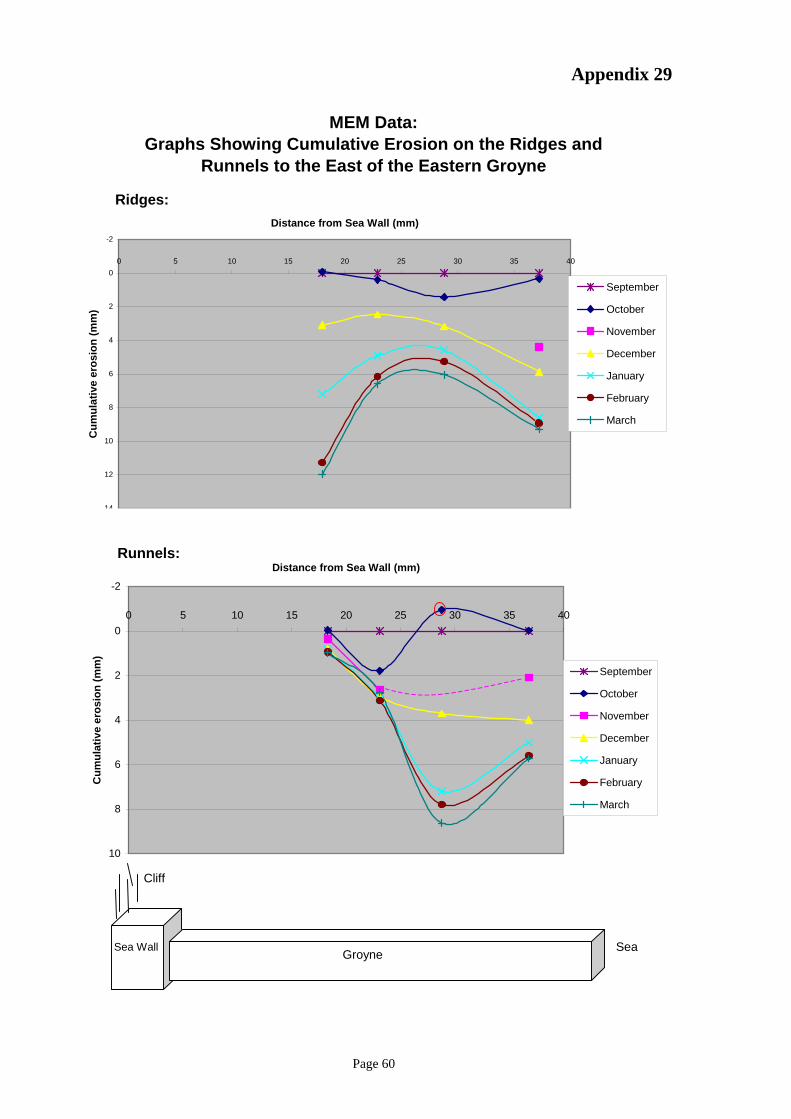
5.2.4 Erosion along the Lengths of the Groynes 5.2.4.1 MEM Results: Appendices 26 to 29 show graphically the cumulative erosion over the months against distance from
the sea wall for each of the groynes. Although the shore platform is not flat, these graphs assume that it is - the base readings at the beginning of September follow the 0mm cumulative erosion along the X axis. Lines predicted by me are dotted. Obvious errors are circled in red.
West Side of the Western Groyne (Appendix 26) Probably the clearest of the graphs, there is a distinct peak (and hence a lack of erosion) at between 15 and 20m from the sea wall. All lines dip closest to the sea wall (and hence fast erosion). However, the pattern is disrupted when comparing ridges with runnels. Looking at the scale, erosion is always faster in runnels than on ridges (as predicted by my original hypothesis). In comparison to the rest of the transect, ridges tend to erode fairly slowly close to the end of the groyne (at about 30m from the sea wall) whereas runnels erode fairly fast. This supports the theory that runnels deepen towards the sea (section 1.5). East Side of the Western Groyne (Appendix 27) The unfortunate fact about these graphs is that they lack the data close to the sea wall. Due to the combination of accumulating shingle and lost sites, this part of the graph has to be imagined. However, some data for October and in the case of the runnels, September, is available showing very rapid erosion. Between September and October, 12mm eroded off the platform surface at 5m from the sea wall. Most of
Page 28
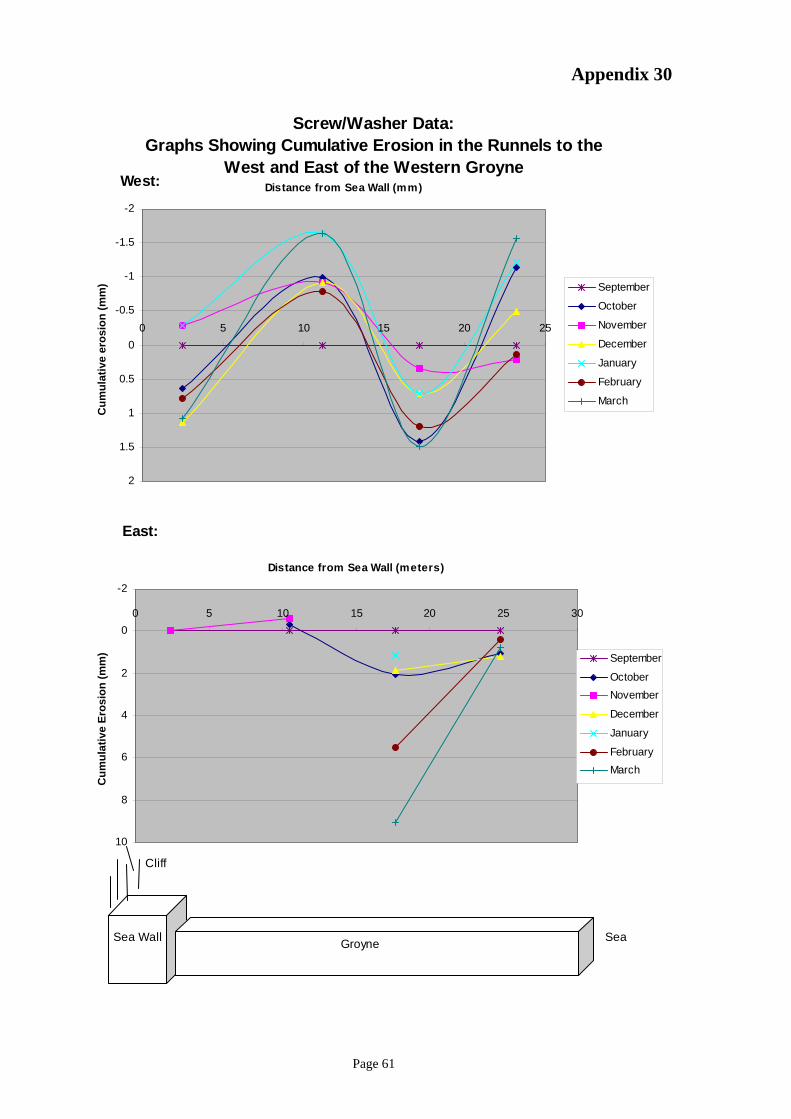
the sites were lost due to this rapid rate of erosion and thus it is probably fair to say that if this data were available, all the lines would rise from the left to the right. As stated before, this area of the platform was very shallow with little distinction between the ridges and runnels (figure 11). As a result, the ridges were probably almost exposed as much to erosion as the runnels. This is probably the explanation for the steep incline of the graph lines for the ridges rather than the runnels. West Side of the Eastern Groyne (Appendix 28) Due to the distinct amount of shingle accumulation around the backs of the eastern groyne, sites here could not be placed as close to the sea wall as I really intended. However, even so, they show very similar patterns to that seen on the west of the western groyne. There is a peak (slow erosion rates) around 20m from the sea wall, with a dip (fast erosion) closest to the sea wall. Closest to the end of the groyne, erosion is a lot faster in the runnels than on the ridges. East Side of Eastern Groyne (Appendix 29) Further away still from the sea wall, the beginning of this transect is likely to start in the middle of the 15 - 20m peak demonstrated to the west. The line for October is incorrect at 30m from the sea wall but otherwise, erosion in the runnels is much faster at this distance. However, at 40m this reverses again with erosion on the ridges taking precedence. 5.2.4.2 Screw/Washer Results: Appendices 30 and 31 show graphically, in the same way as the MEM results, the cumulative erosion
over the months against distance from the sea wall for each of the groynes. Despite the inaccuracies with this data, it still produces some length of groyne erosion patterns very similar to that of the MEM data. Due to the negative values, the monthly lines cross a lot. I have therefore not bothered circling potential errors or filling in the gaps with predictions. Western Groyne (Runnels Only) (Appendix 30) Ironically, the patterns for the west and east complement precisely that of the MEM ridge data (appendix 26), rather than the runnel data. To the west there is the peak just before 15m, a dip close to the sea wall as well as just before 20m and then rising again up to 25m. To the east, the majority of lines rise steeply from left (around 17m) up to the right (around 25m). Eastern Groyne (Ridges only) (Appendix 31) The erosion lines to the west of the groyne show a vague similarity to that of the MEM ridge data (appendix 24). The October and November lines bear the same peak just before 20m and all the lines bear the dip just after 25m. To the east of the groyne, however, little patterns are shown except erosion gets less (a peak), further away from the sea wall. This does not complement the MEM ridge data, which shows the reverse.
5.2.5 Runnels versus Ridges & West Sides of Groynes versus East 5.2.5.1 Averages: Averages can be used to 'hint' at the true conclusions but cannot really prove anything without proper statistical tests.
Page 29
MEM: The average rate of erosion for both groynes is 1.36mm per month for ridges and it is 1.55mm per month for runnels. The difference of 0.19mm is fairly small but hints at the fact that runnels erode faster than ridges. Similarly, the average rate of erosion for both groynes is 0.92mm per month for the west sides whilst it is 2.17mm per month for the east sides. A greater difference of 1.25mm indicates slightly more concrete evidence that the east sides erode faster than the west. Screw/Washer: The average rate of erosion for both groynes is 0.129mm per month for ridges whilst it is 0.239mm per month for runnels. The difference of 0.11mm is again fairly small but hints at the fact that runnels erode faster than ridges. Unfortunately, as stated in the beginning of section 5.2.2, only ridge sites were set up at the eastern groyne and only runnel sites where set up at the western groyne, making it difficult to draw accurate conclusions. The average rate of erosion for both groynes is 0.087mm per month for the west sides whilst it is 0.330mm per month for the east sides. The difference of 0.243mm indicates that the east erodes faster than the west. 5.2.5.2 Graphs: The graphs, in many ways, are the most convincing proof of the two hypotheses. MEM: Appendix 32 shows the amount of erosion across the months distinguishing between west and east of
groynes and ridges and runnels. Note how runnels always erode faster than ridges and east sides always erode faster than west sides. Appendix 33 shows the cumulative erosion across the months distinguishing between west and east
of groynes and ridges and runnels. Note how the lines for ridges and runnels do not cross at any time with each other, although they follow a similar pattern, slowing in erosion after January. The same applies to the west sides and east sides of the groynes. Screw/Washer: Appendix 34 shows the amount of erosion across the months distinguishing between west and east of
groynes and ridges and runnels. Very little can be interpreted from this graph, accept that for September, October, January and February, the sites to the east of the groynes experienced greater erosion than the west. Appendix 35 shows the cumulative erosion across the months distinguishing between west and east
of groynes and ridges and runnels. This graph supports the two hypotheses, although strictly the lines for ridges and runnels should not be trusted as they may mimic the difference in chalk around the western and eastern groynes.
Page 30
5.2.5.3 Statistics: We are looking to test if the erosion rates are significantly different to suggest that they are from different populations or from the same population i.e. if ridges are different from runnels and if west of the groynes is different from the east. However, a number of other factors are also involved: • Changing effects within different months; • Which groyne was being studied; • The distance from the sea wall. As a result, a simple student T-test, which takes into account only one factor at a time, would be very laborious. Thus an Analysis of Variance (ANOVA) (repeated measures type) is required. This allows more accurate judgement of how the above criteria interact (Williams, 1986). The computer package, SPSS is very good at handling large amounts of data in these statistical tests. The data was therefore transferred from Excel so that each row represented one of the 6 probe readings (an average of these was not taken as this causes data loss) and each column represented the months. Unlike displaying graphs and creating averages, the missing values from the buried or lost sites cannot just be calculated by dividing by the number of missing months. This would lead to inaccurate and misleading statistics as it is likely that the rate of erosion differs between covered and uncovered data points. As a result, the missing values were predicted using the Expectation Likelihood Maximisation (EM) algorithm (part of the multivariate analysis). I discarded observations in which the final point is missing (i.e. March) as extrapolation is an unstable process (Hitchin, 2001). Taking into account all the different factors, these were predicted and then merged with the existing values. It is logical to assume that the data will fit into a linear model and therefore the General Linear Model (GLM) option was used (Hitchin, 2001). To the standard 0.5% significance level, an ANOVA was carried out. Two possibly useful tables are produced in this analysis: tests of within-subjects effects and tests of between-subjects effects from which a choice must be made. Within-subjects is 'sphericity assured' which assumes that there is no difference in erosion between the months. However, this is not the case and therefore the between-subjects is used.
Page 31
MEM Data: See table 9. Table 9: The output from SPSS for the MEM data.
As can be seen, ridgerun (ridges versus runnels) produces a significance value of 0.000. This value can range from anything between 0 and 1 and the smaller it is, the less likely it is that it occurred by chance. At 0.000 and to a 0.5% significance level, this is essentially conclusive proof that runnels erode faster than ridges. Similarly, the value for EW (East versus West) produces a very low significance value of 0.021. To a 0.5% significance level, this is conclusive proof that eastern sides of groynes erode faster than western. Screw/Washer Data: See table 10. Table 10: The output from SPSS for the screw/washer data.
In this testing, the fact that runnel sites were only located at the western groyne and that ridge sites were only located at the eastern groyne is taken into account. The result, as can be seen, is that ridgerun (ridges versus runnels) does not have a significance (i.e. it was at or close to 1). This tells us that to a 0.5% significance level, any difference in erosion between the ridges and runnels occurred solely by chance. However, the value for EW (East versus West) is 0.095 (i.e. almost 0.1) which is still quite low. As a result, this tells us that to a 0.5% significance level, the eastern sides of groynes erode faster than western. This is the second lot of conclusive proof for this hypothesis. Appendix 36 shows the results that are produced by SPSS but in a graphical format.
5.2.5 The Pinnacles under the Groynes Appendix 37 shows the calculations involved for this part.
As can be seen, the average pinnacle height for each of the phases becomes larger as the completion date is earlier. For phase 1, 1977, the average pinnacle height is 0.734m; for phase 2, 1980, the average pinnacle height is 0.629m; and for phase 3, 1983, the average pinnacle height is 0.411m. Using the number of years since each phase was completed, the average annual downwearing can be worked out. The average of the 3 phases is 2.77mm per year. Unfortunately, it is difficult to relate this to the monthly rates of downwearing as it is likely that erosion is greater in the Autumn and Winter months than in the Spring and Summer. Allowing for this however, it would be 0.231mm per month, much less than that measured by the MEM during the 6 months at 1.20mm and greater than that measured from the screw/washers at 0.178mm. Using this data, the average annual rate of downwearing for the west of the groynes can be worked out as 0.029mm whilst it is 0.027mm for the east. This does not support the west versus east hypothesis. Perhaps the two groynes in question are unusual in that erosion is greater to their east. However, one of the groynes from which data was taken (in phase 2 to the far west) had a large outfall pipe to its west, which is very likely to have increased the erosion here. This single groyne is not likely to have completely changed the results when there were another 8 involved. A number of groynes show higher pinnacles to the east than to the west as in figures 19 and 20.
Figure 19: Photograph showing the west side of a phase 3 (1983) groyne. Erosion is slower here as the build up of fine shingle protects the surface from downwearing.
Plinth is almost at
the same level as the platform on this side.
Page 33
Figure 20: Photograph showing the east side of the same groshown in figure 19.
yne
Erosion here is much faster as there is less shingle protecting the chalk surface. Remaining shingle is coarse and actually scours the surface.
Plinth is a lot further above platform surface than in figure 10.
Page 34
6.0 Discussion and Conclusion 'So what have we seen?'
6.1 Comparison of the Three Methods The MEM, being the tried and tested method of measuring downwearing is, in my opinion, the best of the three. The screw and washer method, although producing some measurable results, did not work at all well. The values were very different from that of the MEM. Perhaps water was able to get underneath the rubber washer and cause erosion after all - then the washer would have moved downwards as the denudation occurred, or perhaps the currents produced by the obstruction left a layer of deposition around the washer. Perhaps using the contour gauge and reading off graphs was simply too inaccurate. The third method, the measurement of the pinnacles, is quick and easy in comparison but is based on too many assumptions (see table 11 below). However, for a rough estimate of the maximum annual rate of downwearing around the groynes, it is useful but it cannot be accurately used for monthly measurement. Although it is probably more accurate than the screw/washer method.
6.2 The Hypotheses: Proven or Disproven? As can be seen from the results, the first two of my hypotheses are well proven and therefore, at least for the two groynes in question, I would be confident to conclude that: • Erosion in runnels is faster than erosion on ridges. • Erosion to the east of groynes is faster than erosion to the west. However, it is not so clear for the third hypothesis: 'Erosion is greatest at either end of the groynes and least in the middle.' The graphs shown in appendices 25 to 30 do not show this effectively. Most graphs show that erosion is greatest close to the sea wall and at a distance of about 20 to 25m from the sea wall (except for the east of the western groyne). They also show that it is slowest at about 15 to 20m from the sea wall (except for the east of the western groyne) and generally slower near the ends of the groynes. The obstruction is either not great enough to increase the rate of erosion through wave scouring or it is too far away (at about 7m) to make a difference.
6.3 So What Do We Now Know? The cliffs at the far west and far east of Peacehaven were retreating up until the sea defences were built at an average of 0.332m per year. However, this was faster at the western end than the eastern end, due to the type and geology of the chalk. In 1977, the defences built at the eastern end practically arrested the cliff retreat and three years later, the same was done with the western end. However, although cliff retreat has stopped, platform downwearing continues, which, like the cliff retreat, is faster at the western end. Using the groynes constructed as part of those defences, the platform has downworn by an average of 2.77mm per year. Currently, rates of downwearing using the MEM are 1.09mm per month but this was recorded from the Autumn through to early Spring when downwearing is at its greatest. Little downwearing is supposed to occur during the Summer months (Robinson, 1977 in Ellis, 1986). Around the groynes on the platform, erosion is greater in the runnels than it is on the ridges due to the amount of shingle and water which scours these channels. Also erosion is faster to the east of the groynes than to the west, due to the exposure of the chalk from the process of longshore drift. Theoretically, runnels will continue to deepen as time goes on. However, there must be a limit, as the platform remains fairly constant in its relief over time: runnels cannot simply deepen indefinitely. It
Page 35
seems likely that erosion on the ridges occurs less frequently, but in greater amounts and this was not picked up in the 6 months of the project. As the ridges become increasingly raised above the surrounding relief, they also become more exposed. Large 'chunks' are likely to break off when hit by waves, during winter via frost spalling and even when people walk over them. The cross-section of an average deep runnel appears more U-shaped than bell-shaped, indicating that erosion does not occur excessively into the bases of the ridges (although this changes where the runnel meanders). Even so, it is still likely that particularly tall ridges become increasingly unstable as runnel downwearing continues around them and will eventually collapse. Current plans are to continue MEM data collection until September 2001 for use in the ESPED project. All of the lost or unsatisfactory sites will be replaced beforehand in April. As further evidence, 8 out of the 11 sites which require replacement at this stage are in runnels. Along the length of the groynes, erosion is greatest close to the sea wall due to the 'plunging effect of the waves' (Cleeve & Williams, 1987) and at a distance of about 20 to 25m from the sea wall. Whether this is due to the groyne structures themselves or the geology/lithology of the chalk is unknown. If large accumulations of scouring shingle are absent, such areas tend to demonstrate the deepest runnels. As a result, it is likely that these will be first areas to deteriorate on the groyne structures and it will occur faster on the eastern sides than the west. The chalk will downwear the quickest exposing the foundations to attack from the sea. It is estimated that the sea defences will be in need of reconstruction work within the next 5 or 10 years (Beckett, 2000). The movement of shingle material appears to cause a lot of downwearing, both in the runnels and at the back of the platform. Stable material, such as that found mixed usually with sand to the west of the groynes (although not at the western groyne in this study) actually helps protects the upper platform surface. This is rarely moved except in large storms. However, thin accumulations (or 'pockets') of coarse material, found frequently to the eastern sides of the groynes, are very mobile and cause intense scouring of the chalk. Such scouring lowers the relief and as a result, it becomes more difficult for the stones to leave their 'sink' on the platform. As platform downwearing continues, the width available to absorb the force of the waves before they reach the sea defences will decrease. As a result, it is likely that the waves hitting the concrete structures will have more energy. As the defences grow older, the rate of downwearing at their base will increase.
6.4 Criticisms and Possible Improvements Throughout this project, a large number of criticisms were noted, many of which were beyond my control. However, some could be improved if the experiment was repeated again with a greater amount of time. These are outlined in table 11. Table 11: Criticisms, explanations and ways of improving. Criticism Explanation and ways of improving Lack of data • Within the current sites, more measurements could have been taken and
over a greater period of time. It would have very useful to have data for a year rather than just 6 months.
• Within the transects, more sites could have been constructed, both of the MEM and the screw/washer type. These could have extended further down the platform, providing information on the middle and lower parts. However, much more than 2 days a month would be required for data collection in this case, as the lower parts are covered more often by the tide.
• More transects could be carried out on a greater number of groynes. • On the pinnacle downwearing, measurements could have been taken at
smaller intervals and on a greater number of groynes. • Within the cliff retreat analysis, more maps and aerial photographs
Page 36
could have been used. However, often this means that the lines become too close together and 'jumbled' and the chance of 'cliff growth' occurring is increased.
• If more time had been available, then use of weather and tide data may have made useful comparisons with the monthly downwearing rates. Temperature records over January and February periods would have been useful to see if these months were mild enough to avoid frost action and thus explain the slow erosion.
Inaccuracies associated with the cliff retreat analysis.
• Many of the older maps do not make it clear which line is the top of the cliff. In some there were two lines. In an effort to reduce this error, the lower of the two lines was used in such a situation.
• Many of the maps do not make it clear when the surveying of the cliff line was carried out. It is possible with a few that it was taken from a previous survey. Deciding which date to use, such as the survey date, the revision date, etc. was often difficult. As a result, the dates for the cliff lines introduce a small degree of inaccuracy.
• Superimposing the maps was often very difficult. Some aerial photographs often did not line up with the maps, no matter how much they were manipulated, leading to the conclusion that they had been somehow distorted. Clouds also affect the interpretation of the cliff top.
• Using the edge of the grass in an aerial photograph as an indication of the cliff top is not entirely accurate.
Inaccuracies when measuring the rate of downwearing using the pinnacles under groynes.
• It is a big assumption that the concrete in-fills on the groynes were exactly the same height as the platform - it must have varied in places.
• The groynes themselves are likely to cause turbulence in the water currents around them, which probably increases the amount of downwearing around them. This is not representative of the whole platform, which is likely to be slower. Levelling over the whole platform and groynes would have solved this problem but time and other factors were not favourable. In future, this would be carried out with a tachometer.
• Shingle, pieces of concrete and water often obscure the chalk surface next to the groyne so that measurements are estimates.
Inaccuracies associated with the MEM
• The calibration plate was not really used as often as it should have been, except for when the probes had been moved on the frame. However, I was told that in the period of 6 months, it was not really necessary anyway (Foot, 2001). In future, this would be used more often and changes to the accuracy adjusted within the field results.
• Each time the engineer's gauges rusted up and were subsequently freed, their accuracy may have been affected. The gauges were fairly old and is probably the reason why this frequently occurred. In future, new gauges would been fitted and used.
• The excessive use of WD40 meant that the probes themselves were very greasy. Prolonged use may have meant grease getting onto the chalk surface in the field and hence reducing the erosion (Mottershed, 1989).
• As time passed many of the site's studs began to fit the legs less and less precisely. However, many were still able to be used, even if it means that the MEM must sit totally on 2 legs and partially on another. In future, such sites would be abandoned immediately and new sites constructed.
• Measurement of erosion has been proven to be overestimated when the MEM is at angle other than parallel to the surface of the chalk i.e. when the probes hit the chalk at an angle rather than at 90o. (Robinson, 1967 in Ellis 1986). This is likely to have occurred at a number of the sites on
Page 37
the beach, especially in the less flat areas of measurement. Unfortunately, there is no way to improve upon this as ridges and runnels have many curved edges and little flat areas.
• The spring-loaded action of the probes probably increased the possible erosion of the chalk surface, although this was reduced by clipping the probes with pegs whilst positioning the legs.
Inaccuracies associated with the screw/washers.
• The use of the screw and washer method is useless in areas other than fairly flat surfaces, as otherwise water can get in underneath and erode the chalk. This may have caused some of the inaccuracy here.
• A rubber washer may not be sufficient to keep the water and grit out, no matter how much the screw above is tightened. The use of a grease such as Vaseline is a possibility but this has been proven to reduce the erosion (Mottershed, 1989).
Inaccuracies with the use of contour gauge and graph paper.
• The contour gauge may not have enough sliding parallel pins to measure the base of the chalk surface next to the washer.
• Dirt and chalk trapped in-between the pins often obstructed their ease of movement. This was reduced by frequent washing and greasing of the pins with Vaseline. However, as time continued, Vaseline may have been transferred onto the chalk surface and as a result the erosion reduced.
• Use of the contour gauge in its intended way on screws/washers in deep hollows is impossible. The pins are pushed down by sliding the central 'handle' down towards the chalk surface. However, the pins will only move as far as this handle will go, which, when it reaches the edges of the hollow, is not as far as the screw/washer (figure 21). The only way to solve this was to manually push the individual pins down with your fingers around the screw/washer, which exerts excessive pressure on the chalk surface and is not as accurate, as some pins may be missed out.
• Accuracy is only as good as the thickness of the pencil lead, the steadiness of the hands (which in the cold and wet is not good) and the difficulty in measuring the distance between the top of the screw and the surface of the chalk reproduced on the graph paper.
• If the line on the graph, which is the actual surface of the chalk, is not noted before the leaving the field, it is sometimes difficult to decide. This occasionally (but rarely, especially after experience early on) happened and may have introduced a few large degrees of inaccuracy.
• If the impression on the contour gauge on the two flat sides of the washer is not drawn parallel to the lines on the graph paper, it is extremely difficult to accurately measure the distance between the top of the screw and the surface of the chalk.
Inaccuracies with the data analysis.
• The absence of measured data for the lost or buried sites means that averages and graphs are inaccurate. It is likely that such sites erode quicker than the functioning, uncovered sites. As a result, passes the erosion rates probably become less than the true value over a period of time.
• If a site has been covered for a number of months and is then uncovered, the erosion that has occurred is over a period greater than just one month. In Excel, no predictive methods were used and the monthly rate of erosion was calculated by simply dividing the amount of erosion by the number of months missed. For the graphs, this really does not matter but for the averages is makes them more inaccurate. However, short of importing the values into SPSS, predicting the missing ones using the expectation maximisation algorithm (as with the statistics) and then exporting them back to Excel again, there is little that can be done to solve this.
Page 38
• It was difficult to decide what to do with the negative values. If they were set as zero, then this would be false As a result, they were used at face value and many of the graphs, especially those for the screw/washer data show this. They affect the statistics but little can be done to avoid this. I can add little more on this matter than Mottershed (1989).
• The screw/washer data could not be reliably used to test the ridges versus runnels hypothesis as only runnels sites were set up at the western groyne and only ridge sites were set up at the eastern groyne. This was a mistake that should have been seen ahead of time and could be avoided by varying the locations of the sites (i.e. at one groyne having some on ridges and some in runnels).
No link analysed between cliff retreat and shore platform downwearing.
• If time had been more favourable, then the link between cliff retreat and shore platform downwearing may have been researched. However, current platform downwearing is not accompanied by natural cliff retreat due to the protection by the sea defences and therefore only old cliff retreat values could be used.
The only solution is to
push down the pins individually by hand
Impression of ridges is made Figure 21:
Diagram showing how the intended use of the contour gauge across even fairly shallow hollows is impossible. Measurement is still possible when used parallel to the flow of a fairly flat-bottomed runnel. Most problems like this were encountered on ridges (eastern groyne).
Ridges stop handle from going any lower
Screw and washer is missed completely
Page 39
References: 'What was read to say this?' • Baily B. & Nowell, D. (1996) Techniques for monitoring coastal change: a review and case study,
Ocean & Coastal Management, Vol. 32, No. 2, pp. 85 - 95. • Beckett, T.R. (2000) The Final Countdown for Cliffs, Sussex Express On-Line!
http://www.sussexexpress.co.uk, accessed January 2001. • Cleeve, J. & Williams, R.B.G. 1987 Cliff Erosion in East Sussex: Sussex Studies No. 5, Geographical
Education Material for Schools, University of Sussex. • Dickens, P. 1975 'A disgusting blot on the landscape', New Society, No. 33 (17th July), pp. 127 - 129. • Ellis, N. 1986 Morphology, process and rates of denudation on the chalk shore platform of East
Sussex, Unpublished Ph.D (CNAA), Brighton University (former Polytechnic). • European Shore Platform Erosion Dynamics (ESPED) Project (Contract No. MAS3-CT98-0173)
Preliminary Report: Work Package 3, Cliff retreat measurements along the Sussex coast by Paul Saddleton, University of Sussex (2000).
• Foot, Y. (2001), Personal communication at the University of Sussex. • Goudie, A.S. (1990) Geomorphological Techniques: Second Edition. Routledge, London. • Hill, S.E. (1972) Shore platforms and wave ramps, Geological Magazine, Vol. 109, No. 2, pp. 81-
192. • Hitchin, D. (2001) Personal communication at the University of Sussex. • Lewes District Council (1996) A brief summary of coastal defence in the district, pp. 21. • Marques, F. (part of the European Shore Platform Erosion Dynamics (ESPED) project) (2000) Task 3
- Cliff Retreat Measurements. • May, V.J. 1971 The Retreat of Chalk Cliffs, The Geographical Journal, Vol. CXXXVII, pp. 203 -
206. • Mortimore, R.N. 1997 The Chalk of Sussex and Kent, The Geologist's Association, London. • Mottershead, D.N. (1989) Rates and Patterns of Bedrock Denudation by Coastal Salt Spray
Weathering: a Seven-year Record, Earth Surface Processes and Landforms, Vol. 14, pp. 383-398. • Pethick, J. (1984) An Introduction to Coastal Geomorphology, Edward Arnold, Maryland, USA. • Robinson, D.A & Jerwood, L.C. (1987a) Sub-aerial Weathering of Chalk Shore Platforms during
Harsh Winters in Southeast England, Marine Geology, Vol. 77, pp. 1-14. • Robinson, D.A & Jerwood, L.C. (1987b) Frost and salt weathering of chalk shore platforms near
Brighton, Sussex, U.K., Transactions of the Institute of British Geographers, Vol. 12, pp. 217-226. • Robinson, D.A. & Williams, R.B.G. (1983) The Sussex coast past and present. In: Sussex:
Environment, Landscape and Society, Alan Sutton Publishing Ltd, Gloucester. • Spate, A.P., Jennings, J.N., Smith, D.I. and Greenaway, M.A. (1985). The Micro-Erosion Meter:
Use and Limitations, Earth Surface Processes and Landforms. Vol. 10, pp 427-440. • Stammers, R.L. (1982a) Coast defence engineering in East Sussex - Part I. Municipal Engineer, 109,
pp. 278-286. • Stammers, R.L. (1982b) Coast defence engineering in East Sussex - Part I. Municipal Engineer, 109,
pp. 353-359. • Stephenson, W.J. and Kirk, R.M., (1998) Rates and Patterns of Erosion on Inter-tidal Shore
Platforms, Kaikoura Peninsula, South Island, New Zealand, Earth Surface Processes and Landforms, Vol. 23, pp. 1071-1085.
• Sunamura, T. (1975) A Laboratory Study of Wave-Cut Platform Formation. Journal of Geology, Vol. 83, pp. 389-397.
• The Argus (2001) Millions to repair cliff faces, Thursday 25 January, pp. 1 and 5. • Trenhaile, A. S. (1980) Shore Platforms: a neglected coastal feature. Progress in Physical
Geography, Vol. 4, pp. 1-23. • Wallingford, H.R. (1999) Portobello Wastewater Treatment Works and Sludge Recycling Centre
Report, pp. 24. • Williams, R.B.G. (1986) Intermediate Statistics: for Geographers and Earth Scientists, MacMillan
• Williams, R.B.G., Swantesson, J.O.H. & Robinson, D.A. (2000) Measuring rates of surface downwearing and mapping microtopography: The use of micro-erosion meters and laser scanners in rock weathering studies, Z. Geomorph. N.F. No. 12o, pp. 51 - 66.
• Williams, R.B.G. (2000) Personal communication at the University of Sussex. • Workshop Notes (1999) The Changing Coastline of Sussex Symposium, Saturday 13 November.
Page 41
Appendix (in red = missing) Appendix Number
Title
1 Map showing the different phases of protection at Peacehaven. 2 Diagram Showing the Theoretical divisions of the chalk shore platform 3 Types of platform surface. 4 The Locations of the Two Groynes Studied 5 The Western Groyne from the Sea Defences 6 The Eastern Groyne from the Sea Defences 7 (2 Pages) Map and Aerial Photograph Information 8 (2 Pages) Diagram showing the use of the MEM in a runnel. The same method was used on ridges.
Top view of the MEM, showing the different shaped legs. 9 Photographs of the MEM in Use in the Field 10 Sample: MEM Site Data Collection Sheet January 2001 11 Diagrams showing how the screw, washer and rawl plug method works 12 Diagram showing how the Contour Gauge can be used to measure the amount of chalk down-
wearing 13 Photographs of the Contour Gauge in Use in the Field 14 Sample: September Contour Lines and Diagrams 15 Graph Showing Map of Western Groyne Sites 16 Graph Showing Map of Eastern Groyne Sites 17 Diagram of the Western Groyne Transects 18 Diagram of the Eastern Groyne Transects 19 The Western Groyne Transects 20 The Eastern Groyne Transects 21 Map showing lines of cliff retreat from 1879 until 2000 (coastal defences for this area were
finished around 1980) (Western Groyne) 22 Map showing lines of cliff retreat from 1879 until 2000 (coastal defences for this area were
finished around 1977) (Eastern Groyne) 23 Cliff Retreat Calculations 24 MEM Data: Bar Chart Showing the Average Amount of Erosion Across the Months 25 Screw/Washer Data: Bar Chart Showing the Average Amount of Erosion Across the Months 26 MEM Data: Graphs Showing Cumulative Erosion on the Ridges and Runnels to the West of
the Western Groyne 27 MEM Data: Graph Showing Cumulative Erosion on the Ridges and Runnels to the East of
the Western Groyne 28 MEM Data: Graph Showing Cumulative Erosion on the Ridges and Runnels to the West of
the Eastern Groyne 29 MEM Data: Graph Showing Cumulative Erosion on the Ridges and Runnels to the East of
the Eastern Groyne 30 Screw/Washer Data: Graphs Showing Cumulative Erosion in the Runnels to the West and
East of the Western Groyne 31 Screw/Washer Data: Graphs Showing Cumulative Erosion on the Ridges to West and East of
the Eastern Groyne 32 MEM Data: Histogram Showing Erosion Across the Months Distinguishing between West
and East of Groynes and Ridges and Runnels 33 MEM Data: Graph Showing Cumulative Erosion Across the Months Distinguishing between
West and East of Groynes and Ridges and Runnels 34 Screw/Washer Data: Histogram Showing Erosion Rates Across the Months Distinguishing
between West and East of Groynes and Ridges and Runnels 35 Screw/Washer Data: Graph Showing Cumulative Erosion Across the Months Distinguishing
between West and East of Groynes and Ridges and Runnels 36 Graphs Output from the Statistical Analysis in SPSS 37 Pinnacle Calculations
Page 42
Aüüendix 4 The Locations of the Two Groynes Studied For a full map of Peacehaven's sea defences, see appendix 1.
Page 44 This groyne wthan the easterbeing 50 meter
East
Coarse material which moves and changes frequently. Photograph taken after February when the material accumulated in mass at the back of the groyne. When the site was first chosen in July, this was not the case. Such a 'beach' is unusual for the east side of a groyne due to removal by longshore drift.
Shallow runnels
The only deep runnels found on this side were near the end of the groyne.
f besho
as ln grs.
D(dto
ach re
onger oyne
West
eep runnels eepest closest sea wall).
No beach material builds up to the west side of this groyne at all. This is unusual but useful as it avoids sites being buried.
Appendix 5
The Eastern Groyne from the Sea Defences
Shallow 'pocket' of coarse material that moves and changes frequently.
This groyne is shorterthan the western groybeing 35 meters.
Deep runnels (deepest closest to sea wall).
Shallow runnels
Net movement of beachmaterial i.e. longshore drift.
East
Page 45
Build-up of beach material, small particles and sometimes sand. Grows and shrinks but always present in one form or another.
ne
Deep runnels West
Map and Aerial Photograph Information Source: University of Sussex - Geography Resource Centre Appendix 7
Ordnance Survey Maps: OS Square Code Edition Surveyed Revised Levelling Revised Used for Lines of Retreat
(if not, why) Scale For West or
East Site No code given 78 (entire) 1879 1873 N/A N/A Yes 6 inches to 1 mile Both SH LXXVIII.1 78-1 1910 1872 1908 N/A No - Coast guard station
used as reference point to line up 78-5.
25.344 inches to 1 mile
West
SH LXXVIII.5 78-5 1910 1872 1908 N/A Yes 25.344 inches to 1 mile
West
SH LXVIII.6 78-6 1910 1872 1908 N/A Yes 25.344 inches to 1 mile
LXXVIII.5 78-5 Rev 1938 1872 1938 N/A No - repeat of 78-1. 25.344 inches to 1 mile
West
TQ 40 Teaching set 18
1959 1959 1908/40 Systematic revision 1937 - 57
No - found too late to include.
25.344 inches to 1 mile
Both
TQ 4000 + TQ 4100 77/78 1961 N/A 1960 Levelled 1948/49 No - too close to 1963 and photo of 1960.
1 to 2500 West
TQ 40 SW N/A 1963 1962 1962 N/A Y 1 to 10,560 Both TQ 40 SW N/A 1976 1968/71 1974 Contours surveyed 1962 Y 1 to 10,000 Both TQ 40 SW N/A 1983 1980/81 1982 Contours surveyed
1973/78 Y 1 to 10,000 Both
Page 46
Aerial Photographs: Date Code Used for Lines of Retreat For West or East Site 09/06/1950 RAF570 No - cliff line appeared behind that of 1957 and 60 (cliff growth!). West
1957 0048 Yes West 1957 0045 Yes East1959 0034 No - too close to 1957. East
Source: Lewes District Council Records Office (The Maltings, Lewes)
Ordnance Survey Maps: OS Square Code Edition Surveyed Revised Levelling Revised Used for Lines of Retreat Scale For West or
East Site LXXVIII.5 78/5 1873 Failed to
obtain Failed to
obtainFailed to obtain this. No - cliff line appeared
exactly as that of 1879. 25.344 inches to 1 mile
West
LXXVIII.6 78/6 1874 1861 1873 Rezincographed + printed in 1882.
No - to be consistent with that above.
25.344 inches to 1 mile
East
LXXVIII.5 78/5 1899 (onmicrofiche)
1873 1897 N/A Yes 25.344 inches to 1 miles
West
TQ 4200 SW N/A 1972 1971 N/A 1967 Yes 1:1250 East
Aerial Photographs: Date Code Used for Lines of Retreat For West or East Site20/04/1950 C/P63/5 3010 No - cliff line appeared behind that of 1957 and 60 (cliff growth!). West
" C/P63/5 3009 No - almost duplicate of above. West " C/P63/5 3007 No - to be consistent with that above. East
5/11/1960 C/P63/10 F22 58/RAF/3915
Yes West
Page 47
Appendix 9
Photographs of the MEM in Use in the Field
MEM in use in a runnel: Photograph of site 39 taken in February. This is located to the east of the eastern groyne.
MEM in use on a ridge: Photograph of site 22 taken in December. This is located to the west of the western groyne.
Appendix 13
Photographs of the Contour Gauge in Use in the Field
Contour gauge in use in a runnel: Photograph of site 14 taken in December. This is located to the west of the western groyne.
Contour gauge in use on a ridge: Photograph of site 44 taken in December. This is located to the east of the eastern groyne.
Page 49
Appendix 15
Graph Showing Map of Western Groyne Sites
2 24
16
23 115
22 6
14
21 3
8 10
920
11
419
12
518
13
177
0
5
10
15
20
25
30
35
-10 -8 -6 -4 -2 0 2 4 6 8
Distance from Groyne (meters)
Dis
tanc
e fr
om S
ea W
all (
met
ers)
RuRi RiRuRiRi
Appendix 16
Graph Showing Map of Eastern Groyne Sites
31
41
37
42
29
36
43
28
35
44
33
34
3227
45
38
30
46
39
25
47
40
48
26
0
5
10
15
20
25
30
35
40
-14 -12 -10 -8 -6 -4 -2 0 2 4 6 8 10
Distance from Groyne (meters)
Dis
tanc
e fr
om S
ea W
all (
met
ers)
RuRi
RiRu
Ri Ri
Page 51
The Western Groyne Transects Appendix 19
West Side:
MEM Sites: Screw/Washer Sites in Runnels:
Site 8 - the deepest runnel studied by a screw/washer site.
Sites 21 and 3 - the deepest runnel studied by an MEM site.
Site 14
Site 15
Slightly shallower runnels than back of transect.
East Side:
MEM Sites: Screw/Washer Sites in Runnels:
Sites 2 and 24
Slightly shallower runnels than back of transect.
Sites 22 and 6
Sites 23 and 1
Very shallow runnels - fluting.
Sites 20 and 9 - buried at time of photo.
Sites 19 and 4
Sites 18 and 5
Slightly deeper runnels than middle of transect.
Site 16
Site 10 -buried at time of photo.
Very shallow runnels - fluting.
Site 12
Site 11 - buried at time of photo.
Site 13 - on edge of deeper runnels.Sites 7 and 17
- in deeper runnels.
Deeper runnels at end of groyne.
Page 52
The Eastern Groyne Transects Appendix 20
West Side:
MEM Sites: Screw/Washer Sites on Ridges: Fairly deep runnels.
Sites 26 and 33
Sites 27 and 32
Site 25
Site 34
Site 35
Sites 28 and 29 - shallow runnels.
Sites 31 and 30
Fairly deep runnels but not as deep as back of transect.
Site 36
East Side:
MEM Sites: Screw/Washer Sites on Ridges:
Site 37
Site 40
Shallow runnels.
Sites 46 and 38
Sites 47 and 39
Sites 42 and 48
Fairly deep runnels.
Site 41
Sites 43 and 44
Site 45
Page 53
Western Groyne Appendix 23
Part of Phase 2 - Construction finished in 1980 Edition of Map/Year of photograph Actual date that cliff top was
likely to have been measuredNo of Years between this and last
Histogram Showing Erosion Rates Across the Months Distinguishing between West and East of Groynes and Ridges and Runnels
0.00
0.50
1.00
1.50
2.00
2.50
3.00
Sept Oct Nov Dec Jan Feb
Month
Am
ount
of E
rosi
on (m
m)
Sites to the West of Groynes
Site to the East of Groynes
Sites on Ridges
Sites in Runnels
Appendix 33
MEM Data:Graph Showing Cumulative Erosion Across the Months Distinguishing between West and East of
Groynes and Ridges and Runnels
0
1
2
3
4
5
6
7
8
9
10
Sept Oct Nov Dec Jan Feb March
Month
Cum
ulat
ive
Eros
ion
(mm
)
Sites to the West of GroynesSite to the East of GroynesSites on RidgesSites in Runnels
Page 64
Appendix 34
Screw/Washer Data:Histogram Showing Erosion Rates Across the Months Distinguishing between West and East of
Groynes and Ridges and Runnels
-1
-0.5
0
0.5
1
1.5
Sept Oct Nov Dec Jan Feb
Month
Am
ount
of E
rosi
on (m
m)
Sites to the West of GroynesSite to the East of GroynesSites on RidgesSites in Runnels
Appendix 35
Screw/Washer Data:Graph Showing Cumulative Erosion Across the Months Distinguishing between West and East of
Groynes and Ridges and Runnels
-0.5
0
0.5
1
1.5
2
Sept Oct Nov Dec Jan Feb
Month
Cum
ulat
ive
Eros
ion
(mm
)
Sites to the West of GroynesSite to the East of GroynesSites on RidgesSites in Runnels
Page 65
Appendix 36
Graphs Output from the Statistical Analysis in SPSS • Months 1 to 6 are equivalent to September through to February.
MEM Data:
West of Groyne Versus East: Ridges Versus Runnels:
Estimated Marginal Means of MEASURE_1
MONTH
654321
Estim
ated
Mar
gina
l Mea
ns
2.5
2.0
1.5
1.0
.5
0.0
EW
E
W
Estimated Marginal Means of MEASURE_1
MONTH
654321
Estim
ated
Mar
gina
l Mea
ns
2.5
2.0
1.5
1.0
.5
0.0
TYPE:
Ri
Ru
Screw/Washer Data:
West of Groyne Versus East: Ridges Versus Runnels:
Estimated Marginal Means of MEASURE_1
MONTH
654321
Estim
ated
Mar
gina
l Mea
ns
1.0
.5
0.0
-.5
-1.0
-1.5
EW
E
W
Estimated Marginal Means of MEASURE_1
MONTH
654321
Estim
ated
Mar
gina
l Mea
ns
1.5
1.0
.5
0.0
-.5
-1.0
-1.5
-2.0
TYPE:
Ri
Ru
Page 66
Appendix 37
Phase 1 Groynes - completed in 1977 My Groyne: Next one to West: One to East of
Bastion Steps: West East West East West East Shingle 0.6
Shingle Shingle
0.75 Shingle
0.7 0.6 Shingle 0.35 1.2 0.9 0.8 0.75 0.55 0.55 0.8 1.1 0.9 1 0.4 0.35 0.8 0.85 Average Height of Pinnacle = 0.734m Number of years since construction = 24 ∴ Average rate of downwearing = 0.031m per year = 3.1mm per year
Phase 2 Groynes - completed in 1980 My Groyne: Next one to West: One to East of Mine: West East West East West East
0.35 0.5 0.35 0.8 0.4 0.6 Average Height of Pinnacle = 0.629m Number of years since construction = 21 ∴ Average rate of downwearing = 0.03m per year = 3mm per year
Phase 3 Groynes - completed in 1983 Furthest Western: Next one to East: One to East of
Average Height of Pinnacle = 0.4m Number of years since construction = 18 ∴ Average rate of downwearing = 0.022m per year = 2.2mm per year Overall average of downwearing for all phases = 2.77mm per year