65
Ajit S. Narang, Ph.D. Bristol-Myers Squibb, Co. IFPAC Annual Meeting Arlington, VA January 24 - 27, 2016 PAT for Wet Granulation 1

Ajit S. Narang, Ph.D.Bristol-Myers Squibb, Co.
IFPAC Annual MeetingArlington, VA
January 24-27, 2016
PAT for Wet Granulation
1

Overview Integrated Application of Mechanistic understanding Define CMAs that may be monitored and controlled
In silico modeling Predict effect of PPs on particle flow dynamics > DEM Predict process outcomes based on first principles > PBM
Utilize PAT tools to monitor process & to inform and confirm models: granule (a) size > FBRM and (b) density > DFF sensor
To Inform control strategy Batch monitoring, control, scale-up, interchangeability
Construct in silico design space Decisions and changes informed by modeling Process control & scale-up informed by material attributes
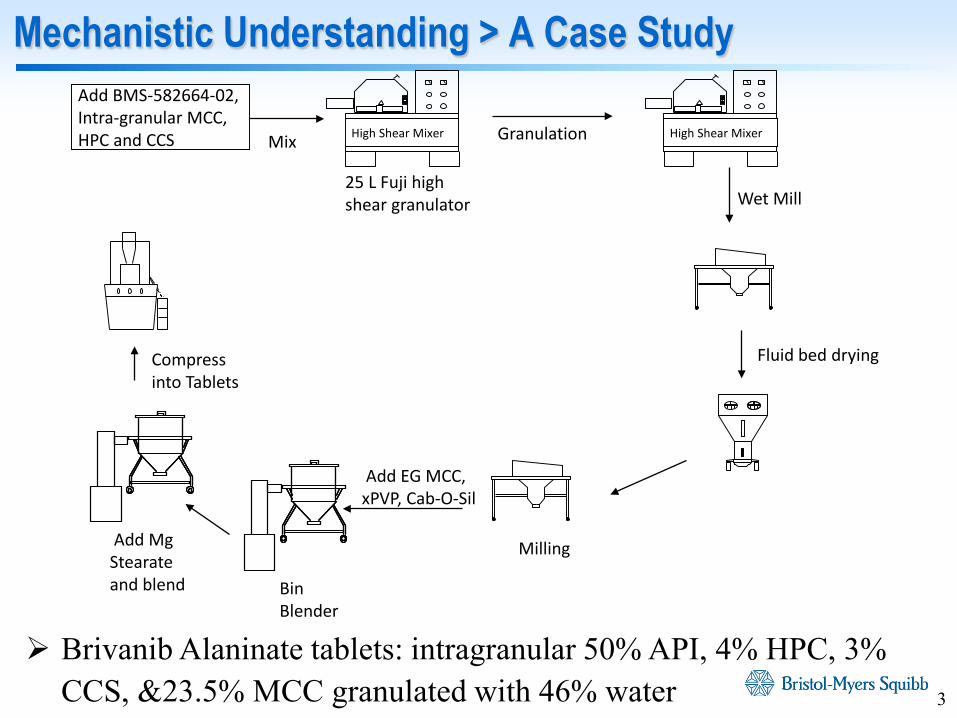
Mechanistic Understanding > A Case Study
Mix
Add BMS-582664-02, Intra-granular MCC, HPC and CCS High Shear Mixer
25 L Fuji high shear granulator
Granulation High Shear Mixer
Wet Mill
Fluid bed drying
Milling
Add EG MCC, xPVP, Cab-O-Sil
Bin Blender
Add Mg Stearate and blend
Compress into Tablets
Brivanib Alaninate tablets: intragranular 50% API, 4% HPC, 3% CCS, &23.5% MCC granulated with 46% water 3

QbD Methodology
RA• Perform product risk analysis to identify CQAs
PPs & MAs
• List relevant material attributes and process parameters that can potentially impact CQAs
Unit Ops
• Perform process risk analysis to identify attributes and parameters to be studied
DoE etc.• Conduct development studies
CQAs & CPPs
• Identify critical attributes and parameters
CS• Establish control strategy
4

Quality Attributes Potency
Content uniformity
Appearance
Impurities
Dissolution
Process Parameters Each unit operation
Interactions
In-process material attributes
Mechanistic process understanding
Mechanistic product understanding
- Basis of effect of process parameters

Formulation Ruggedness Study Design
23 split plot design
Center Point
1.5%
1.5%
4.5%
4.5%
HPC
CCS
Mg Stearate
1.5%
0.5%
2.5 kg batch size
Key Responses
Granulation: -Particle size -Flow-Compaction properties-Adhesion tendency
Tablets:-Visual defects -Dissolution-Friability -Disintegration
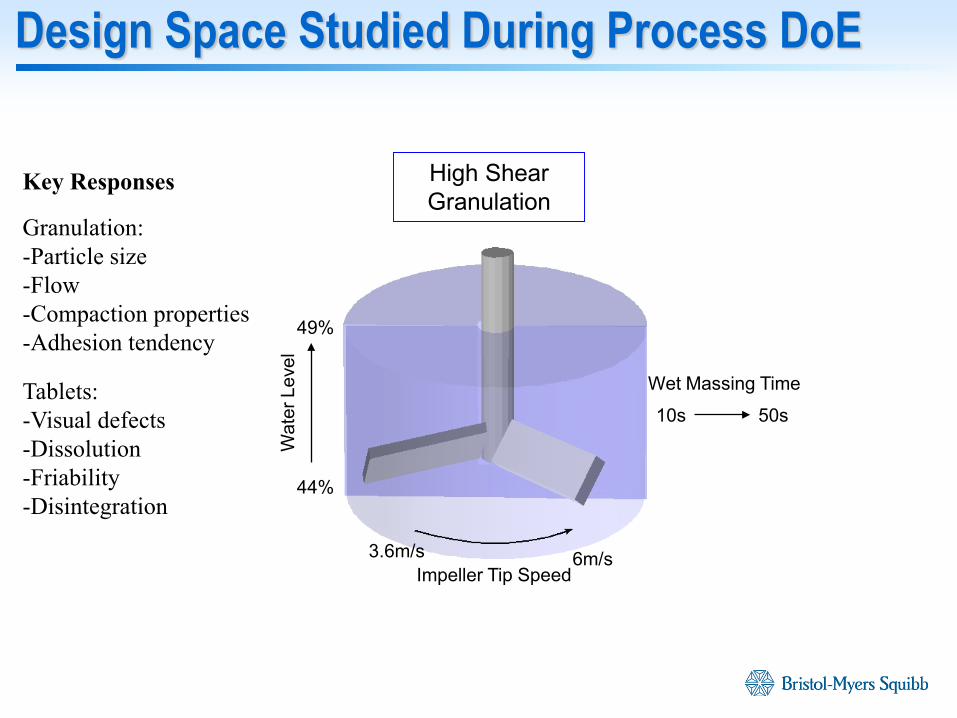
Design Space Studied During Process DoE
Impeller Tip Speed
44%
49%
Wat
er L
evel
10s 50s
3.6m/s 6m/s
Wet Massing Time
High Shear Granulation
Key Responses
Granulation: -Particle size -Flow-Compaction properties-Adhesion tendency
Tablets:-Visual defects -Dissolution-Friability -Disintegration

Probe Tip Enlargement
• Rotating focused-laser measures chord length• Proven technology for particles suspended in liquids• Measures particles in contact with probe sapphire tip• Probe placed directly in solution or powder flow
Lasentech FBRM C35 Probe “Chord Length”

Probe Tip Enlargement
Lasentech FBRM C35 Probe “Chord Length”
Particles being measured
C35 analog signal outputand threshold
Particle size outputfrom probe
Particle size distributionoutput from mono dispersedspheres

Wet Granulation – PAT Implementation

FBRM: In-line Real-Time PSD: Avicel
BMS Highly Confidential
Different concentrations of binder, same amount of water
0 5 10 15 20 250
0.2
0.4
0.6
0.8
1
1.2
1.4
1.6
1.8
2x 10
4
Time (min)
Squ
are
Wei
ghte
d (M
ass)
Experiment D: Water - 75% HPC - 3%
0 5 10 15 20 250
0.5
1
1.5
2
2.5
3x 10
4
Time (min)
Squ
are
Wei
ghte
d (M
ass)
Experiment C: Water - 75% HPC - 4%
0 5 10 15 20 250
1
2
3
4
5
6x 10
4
Time (min)
Squ
are
Wei
ghte
d (M
ass)
Experiment E: Water - 75% HPC - 5%
0 5 10 15 20 250
0.2
0.4
0.6
0.8
1
1.2
1.4
1.6
1.8
2x 10
4
Time (min)
Squ
are
Wei
ghte
d (M
ass)
Experiment D: Water - 75% HPC - 3%
0 5 10 15 20 250
1
2
3
4
5
6
7x 10
4
Time (min)S
quar
e W
eigh
ted
(Mas
s)
Experiment H: Water - 85% HPC - 3%
0 5 10 15 20 250
0.2
0.4
0.6
0.8
1
1.2
1.4
1.6
1.8
2x 10
4
Time (min)
Squ
are
Wei
ghte
d (M
ass)
Experiment G: Water - 65% HPC - 3%
Different levels of water, same concentrations of binder

Chord Length Distribution by
FBRM
Test 1: 1% HPC batch
Test 3: 5% HPC batch
Test 2: 3% HPC batch
10
100
10000
5
10
15
0
200
400
600
800
Chord Length (um)
y
Time (minutes)
Squa
re W
eigh
ted
(Mas
s)
10
100
10000
5
10
15
0
200
400
600
800
Chord Length (um)
y
Time (minutes)Sq
uare
Wei
ghte
d (M
ass)
10
100
10000
5
10
15
0
200
400
600
800
Chord Length (um)
y
Time (minutes)
Squa
re W
eigh
ted
(Mas
s)1% HPC
3% HPC
5% HPC
12
BMS Highly Confidential
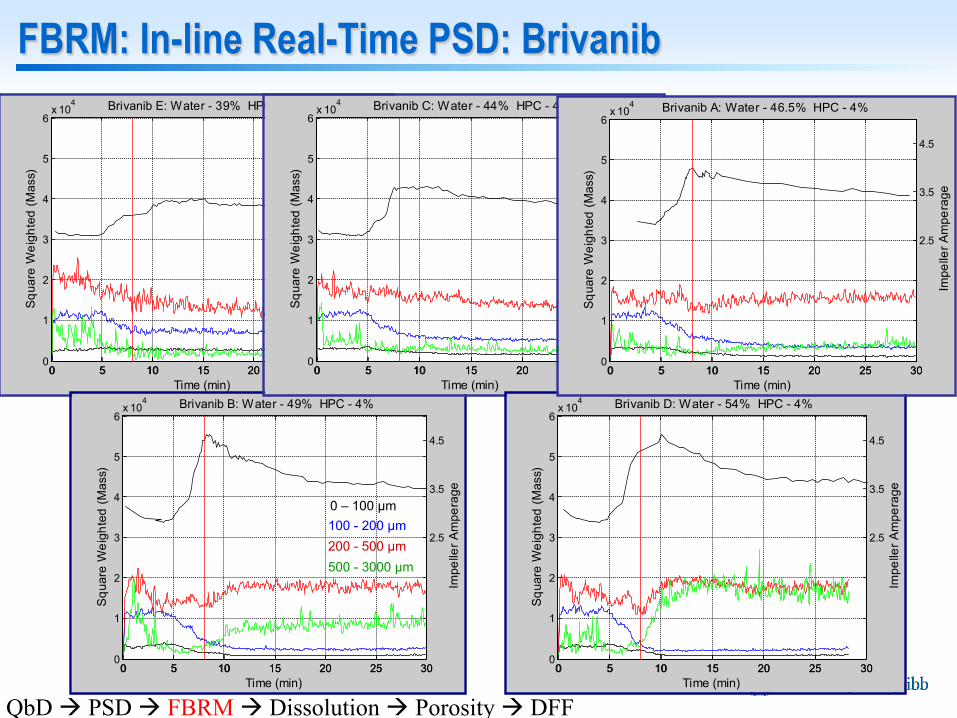
FBRM: In-line Real-Time PSD: Brivanib
0 5 10 15 20 25 300
1
2
3
4
5
6x 10
4
Squ
are
Wei
ghte
d (M
ass)
0 5 10 15 20 25 30
2.5
3.5
4.5
Time (min)Im
pelle
r Am
pera
ge
Brivanib E: Water - 39% HPC - 4%
0 5 10 15 20 25 300
1
2
3
4
5
6x 10
4
Squ
are
Wei
ghte
d (M
ass)
0 5 10 15 20 25 30
2.5
3.5
4.5
Time (min)
Impe
ller A
mpe
rage
Brivanib B: Water - 49% HPC - 4%
0 5 10 15 20 25 300
1
2
3
4
5
6x 10
4
Squ
are
Wei
ghte
d (M
ass)
0 5 10 15 20 25 30
2.5
3.5
4.5
Time (min)
Impe
ller A
mpe
rage
Brivanib C: Water - 44% HPC - 4%
0 5 10 15 20 25 300
1
2
3
4
5
6x 10
4
Squ
are
Wei
ghte
d (M
ass)
0 5 10 15 20 25 30
2.5
3.5
4.5
Time (min)
Impe
ller A
mpe
rage
Brivanib D: Water - 54% HPC - 4%
0 5 10 15 20 25 300
1
2
3
4
5
6x 10
4
Squ
are
Wei
ghte
d (M
ass)
0 5 10 15 20 25 30
2.5
3.5
4.5
Time (min)
Impe
ller A
mpe
rage
Brivanib A: Water - 46.5% HPC - 4%
0 – 100 μm100 - 200 μm200 - 500 μm500 - 3000 μm
QbD PSD FBRM Dissolution Porosity DFF

C35 Probe on 300 L PMA High-Shear Granulator
• Use of this probe during tech transfer provides process data to confirm process parameters chosen and verify successful transfer
- Without the probe, a single post-milling sample must be used to assess transfer
• Collection of data during transfer provides a baseline for future transfers and for troubleshooting or for change controls: for example
- Excipient or API changes- Process deviations
FBRM At Manufacturing Scale in a GMP Facility

Real-Time Release Paradigm
Identify product CQAsIdentify in-process material attributes (IPMA)Factor-response relationships
Critical Process parameters (CPP) IPMAIncoming material properties (IMP) x process IPMA
Established acceptable range of CQAsEstablished operating range of IMP, CPP, IPMATesting to assure consistent compliance
Design Space Paradigm
• Mechanistic understanding of quality drivers (Science)• Real-time measurement and control capability (Technology/PATs)
• Direct measurement• Indirect measurement
Design space+Real-time control+Limited testing
RTR Paradigm
15
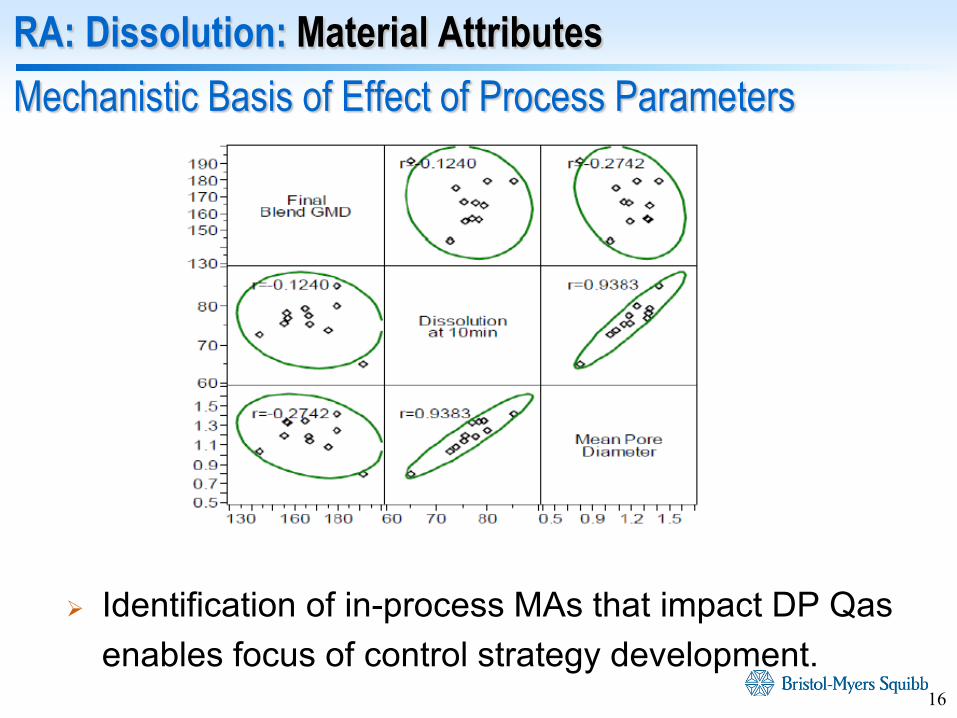
RA: Dissolution: Material AttributesMechanistic Basis of Effect of Process Parameters
Identification of in-process MAs that impact DP Qas enables focus of control strategy development.
16
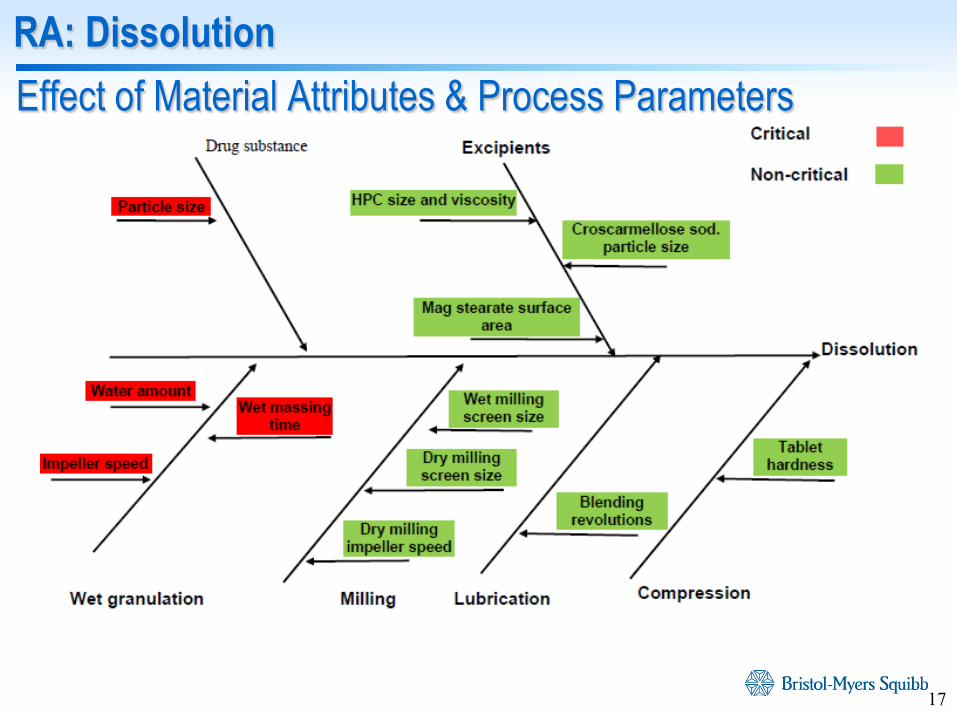
RA: DissolutionEffect of Material Attributes & Process Parameters
17

Mechanisms involved in HSWG can be concurrent but certain mechanisms dominate during specific phases.
Wetting & Nucleation1 Aggregation & Consolidation2
Breakage & Attrition3
(Iveson et al., 2001)
Binder droplets Nuclei
Dry powder
Daughter particles
Granule
Layering4
GranuleFines
Granules
(i) (ii)Consolidated granule
Particle Level Mechanisms
18
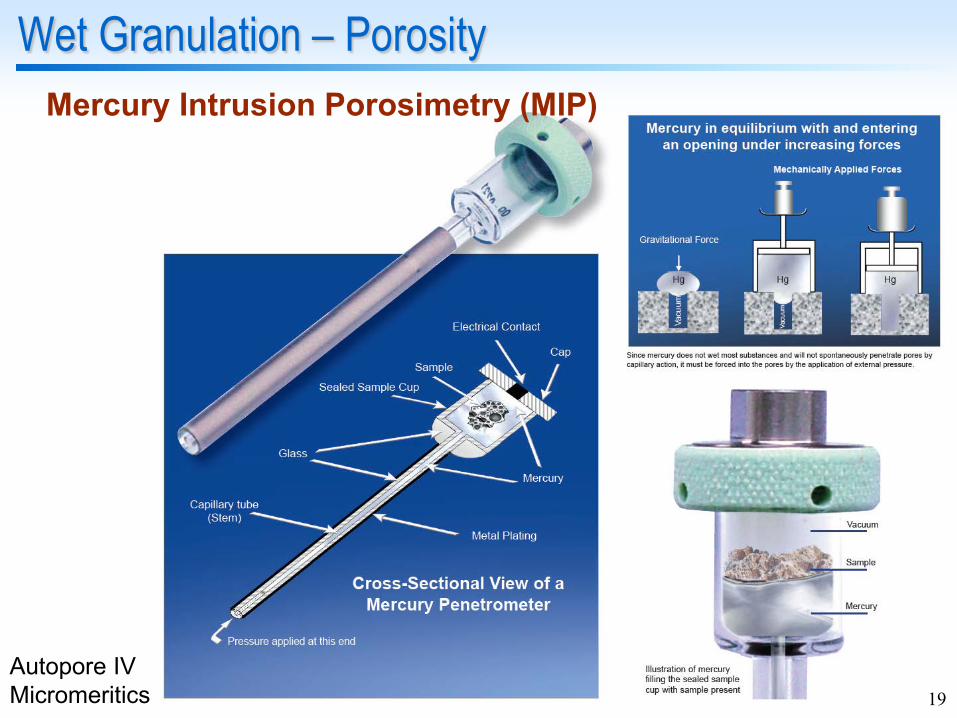
Wet Granulation – PorosityMercury Intrusion Porosimetry (MIP)
Autopore IVMicromeritics 19

Granule Porosity Defines Dissolution Design SpaceCumulative Porosity
0
0.05
0.1
0.15
0.2
0.25
012345678910Pore diameter (micro-m)
Pore
vol
ume
(mL
/g)
2A (30 min)2D (50 sec)1Proc81Proc101Proc131Proc13A1Proc5 HHH1Proc6 LLL
Center Point batches
Low/Low/Low of WG Process Parameters (worst case scenario)
High/High/High of WG Process Parameters (worst case scenario)
Very high wet massing time
20

Granule Porosity Defines Dissolution Design Space
0
3037
5058
64
0
47
65
7480
8590 92
0
20
40
60
80
100
120
0 10 20 30 40 50 60 70
% d
rug
rele
ased
Time (min)
High wet massing time (20 min)High water (67%, outside design space)Lower end of design space (48% water)Center point of design space (58% water)
High/High/High of WG Process Parameters (worst case scenario)Center Point of Design Space
21
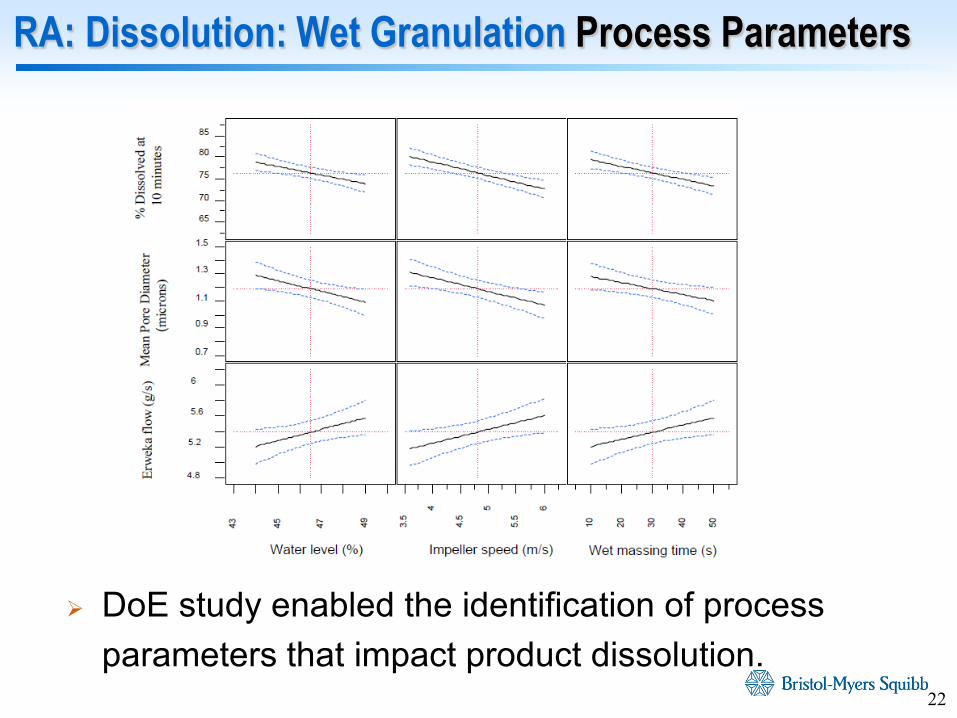
RA: Dissolution: Wet Granulation Process Parameters
DoE study enabled the identification of process parameters that impact product dissolution.
22
BMS Highly Confidential
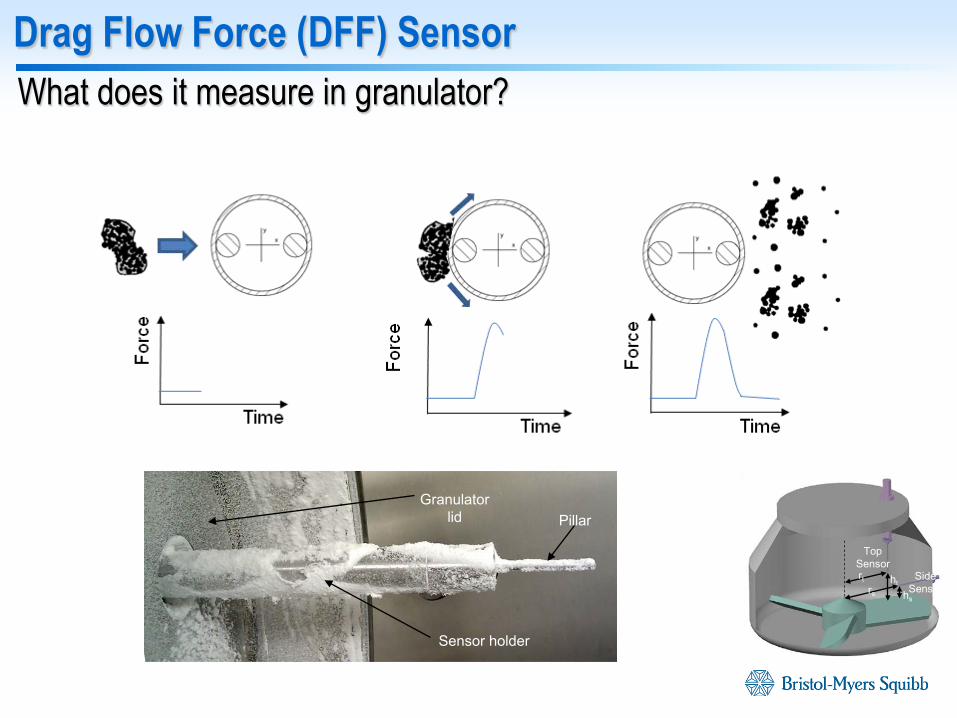
Pillar
Sensor holder
Granulator lid
What does it measure in granulator?
Top Sensor
hs
htrt
rs
Side Sensor
Drag Flow Force (DFF) Sensor

Wall Shear Stress (WSS) Sensor
Drag Force Flow (DFF) Sensor
In-line Real-Time PAT for Granule Porosity/Density
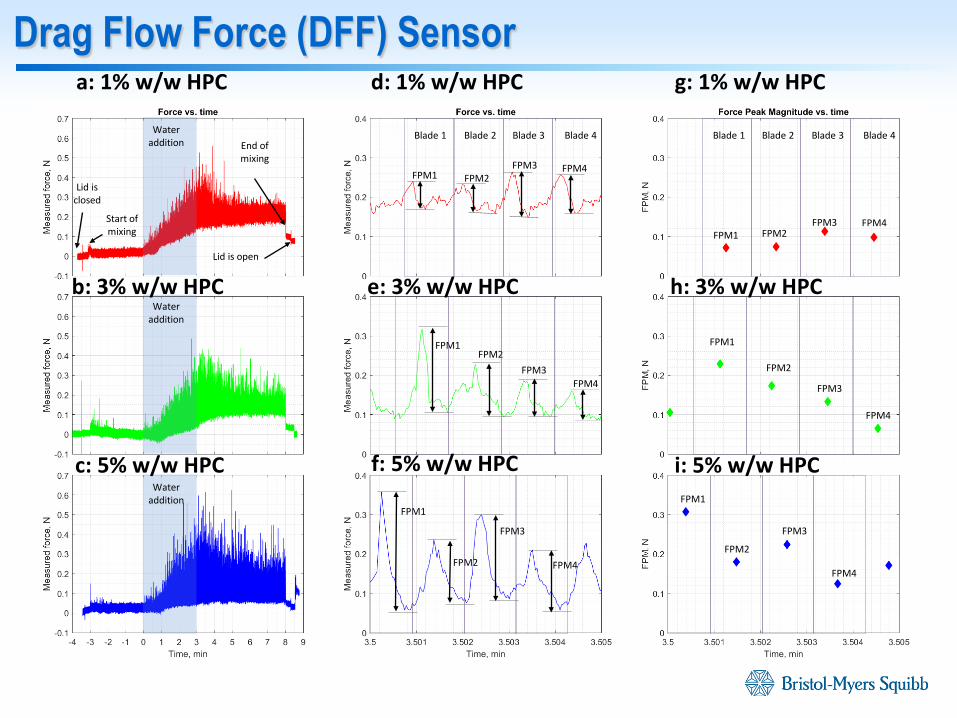
Drag Flow Force (DFF) Sensor
Water addition
a: 1% w/w HPC
Water addition
Water addition
Lid is closed
FPM2
c: 5% w/w HPC
b: 3% w/w HPC
Start of mixing
End of mixing
Lid is open
FPM1
FPM3
FPM4
FPM1FPM2
FPM3FPM4
FPM1 FPM2FPM3 FPM4
FPM1
FPM1
FPM1
FPM2
FPM2
FPM2
FPM3
FPM3
FPM3
FPM4
FPM4
FPM4
Blade 1 Blade 2 Blade 3 Blade 4Blade 2 Blade 3Blade 1 Blade 4
d: 1% w/w HPC
f: 5% w/w HPC
e: 3% w/w HPC
g: 1% w/w HPC
i: 5% w/w HPC
h: 3% w/w HPC

Drag Flow Force (DFF) Sensor: Reproducibility
Water addition
Water addition
Water addition
a: 1% w/w HPC
c: 5% w/w HPC
b: 3% w/w HPC

DFF Sensor Peak
distribution statistics
Test 1: 1% HPC batch
Test 3: 5% HPC batch
Test 2: 3% HPC batch
00.1
0.20.3
0.40.5
0.60
5
10
15
0
10
20
30
40
50
60
70
Force (N)
y
Time (minutes)
Num
ber o
f Pea
ks
00.1
0.20.3
0.40.5
0.60
5
10
15
0
10
20
30
40
50
60
70
Force (N)
y
Time (minutes)N
umbe
r of P
eaks
00.1
0.20.3
0.40.5
0.60
5
10
15
0
10
20
30
40
50
60
70
Force (N)
y
Time (minutes)
Num
ber o
f Pea
ks1% HPC
3% HPC
5% HPC

Water addition
Water addition
In-line DFF Comparison w/FT4 Powder Rheometer
DFF sensor reports wet mass consistency, which is also reflected in the BFE measured by FT4 Powder Rheometer®
BMS Highly Confidential
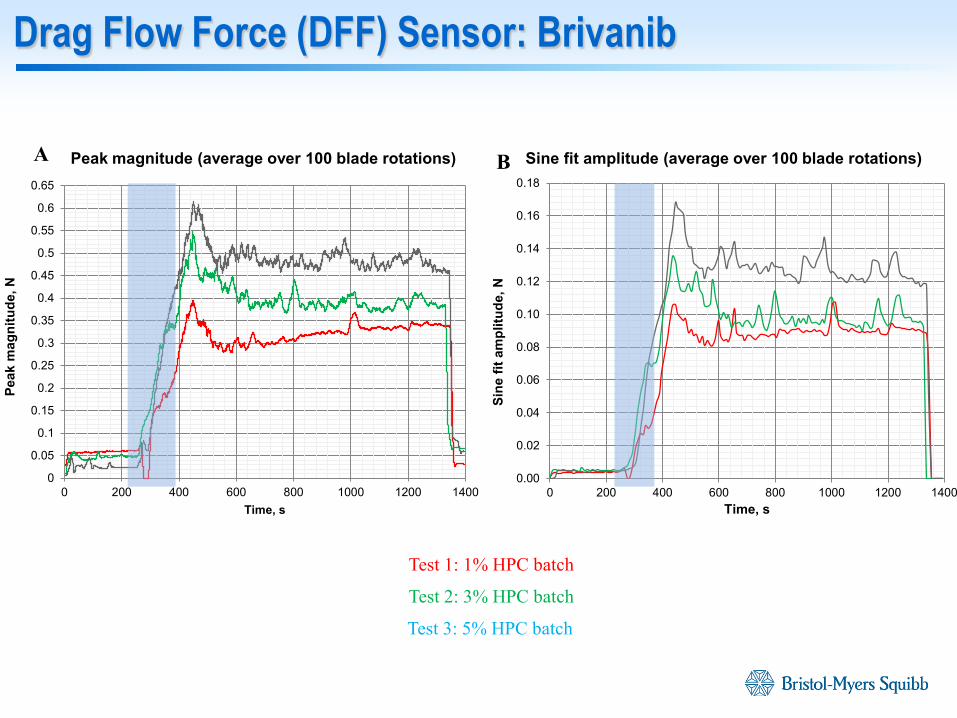
Drag Flow Force (DFF) Sensor: Brivanib
0.00
0.02
0.04
0.06
0.08
0.10
0.12
0.14
0.16
0.18
0 200 400 600 800 1000 1200 1400Si
ne fi
t am
plitu
de, N
Time, s
0
0.05
0.1
0.15
0.2
0.25
0.3
0.35
0.4
0.45
0.5
0.55
0.6
0.65
0 200 400 600 800 1000 1200 1400
Peak
mag
nitu
de, N
Time, s
Peak magnitude (average over 100 blade rotations) Sine fit amplitude (average over 100 blade rotations) A B
Test 3: 5% HPC batch
Test 1: 1% HPC batch
Test 2: 3% HPC batch

DFF Sensor: Facilitates Scale-up & Equipment ChangeComparison of 10L and 60L granulators
Typical end of granulation

Control Strategy
31

Tools for Speed & Quality to Patient, Scale-up, Design Space, and Regulatory Flexibility
High Shear Wet Granulation
Discreet Element ModelingParticle Flow & Collision Frequencies & ForcesScale-up and Interchangeability of Granulators
Population Balance ModelingSimulating Particle Growth and Densification
Process Evolution as a Function of Time
Micro-GranulatorVery Small Scale (<10 g) Batch Manufacture
Mechanistic Investigations & Rank Order Analysis
Focused Beam Reflectance MeasurementReal-Time Particle Size Change
Process Evolution, Monitoring, & ControlGranule Size
Shear & Drag Force SensorReal-Time Wet Mass Consistency ChangeProcess Evolution, Monitoring, & Control
Granule Densification
Modeling & SimulationRe
al Ti
me A
nalyt
ics

DEM Simulations of HSWG
Know the difference between device makes Understand what changes upon scale change Understand high/low shear zones, profiles Evaluate and evolve scale-up/down criteria Attempt correlation between collision rates and agglomeration
rate (PBM) Quantify degree of agitation on the material Understand effect of changing fill level, speed Provide inputs for Population Balance Models

Discrete Element Method Simulations• DEM simulations determine bulk behavior
from particle level interactions• Simulations allow access to quantities
difficult to measure experimentally• Dry, spherical particles as modeled
material ~ 1.8 mm mean diameter with polydisperse size
distributions Calibration of input parameters to match Avicel
101 behavior• Parameters studied:
Effect of fill level Effect of blade speed Effect of scale
• Parameters measured: Particle velocities − Work per unit
mass Residence time distributions Stress profiles
DEM Input Parameters
34
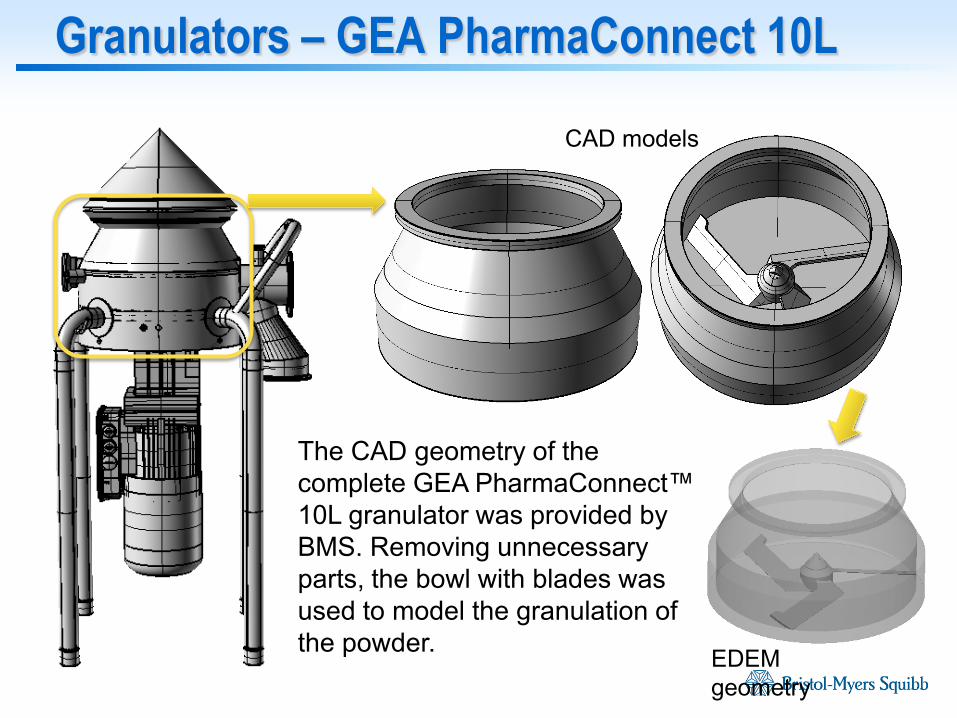
Granulators – GEA PharmaConnect 10L
The CAD geometry of the complete GEA PharmaConnect™ 10L granulator was provided by BMS. Removing unnecessary parts, the bowl with blades was used to model the granulation of the powder. EDEM
geometry
CAD models

Granulators – Diosna 1L and 10L
The CAD models of Diosna 1L and 10L were created by DEM Solutions basing on the pictures of the devices provided by BMS.NOTE: the chopper was removed from the EDEM model
Real granulator CAD modelEDEM geometry

Calibration of Input Parameters• Calibrate material properties
using repose angle tests
• Target repose angle of Avicel 101 (35 degrees)
• Parameters varied:
1. Particle-Particle Restitution
2. Particle-Particle Static Friction
3. Particle-Particle Rolling Friction
4. Particle-Particle 37

Calibration Results
• Particle shape did not have a significant effect on repose angle• Input parameters from calibration results used to run
simulations in this study
ParticleShape
Angle(deg)
Static Friction
Rolling Friction
Coefficient of
Restitution
P-P Cohesion
P-GCohesion
Sphere 35.4 0.9 0.14 0.2 0.0 0.0
38

Instantaneous Stress ProfilesSimulation Experimental
Simulation and Experimental Comparison
• Shear stresses fluctuations follow frequency of blade rotation• DEM simulations consistent with experimental behavior
0 1 2 3 4 50
2000
4000
6000Shear Stress vs. Time
Time (sec)
Shea
r Str
ess
(Pa)
0 10 20 30 400
2
4
6 x 10⁹ Power Spectrum - Shear Stress
Frequency (Hz)
Pow
er
Measurement direction
Blade frequency
39

-0.2 0 0.20
0.05
0.1
0.15
0.2
Vy/Vtip
Prob
abili
ty D
ensit
y
-0.2 0 0.20
0.05
0.1
0.15
0.2
Vr/Vtip
Prob
abili
ty D
ensi
ty0 0.5 10
0.05
0.1
0.15
0.2
Vθ/Vtip
Prob
abili
ty D
ensi
ty
Tangential Velocity
Radial Velocity
Vertical Velocity
Probability distribution
– Particle Velocities
Base Case Analysis 1 L Diosna, 5 m/sec, 60% fill level
40

Time Averaged Stress Profiles
Pressure Shear Stress
Base Case Analysis 1 L Diosna, 5 m/sec, 60% Fill
• Pressure within granulator is higher than shear stresses.• Higher pressure and shear stress observed near bottom plate by
the wall.41
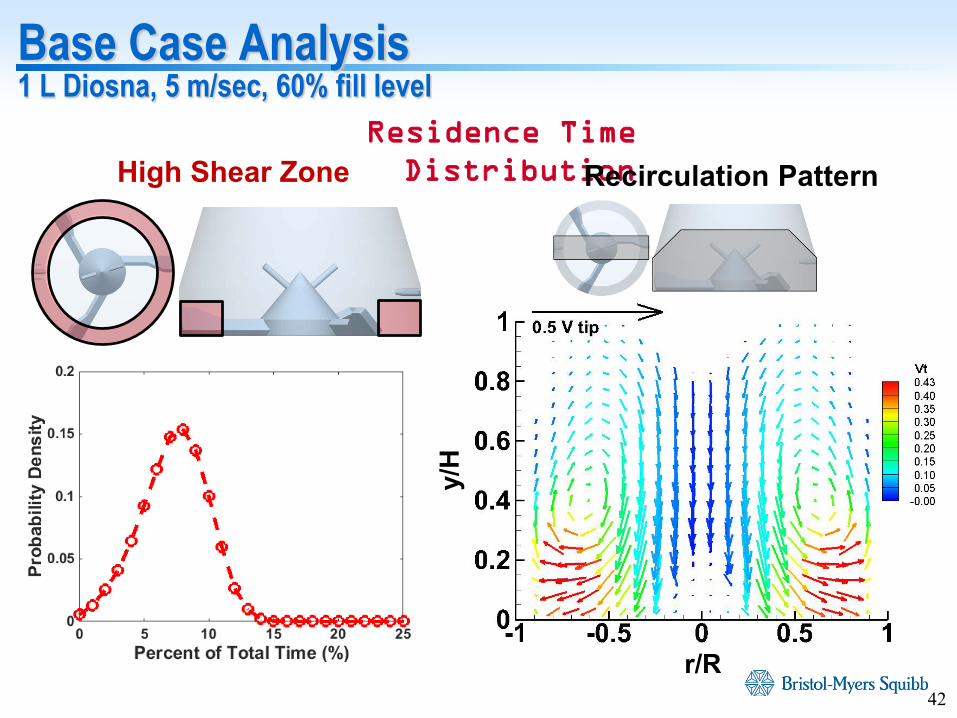
Residence Time Distribution
Base Case Analysis 1 L Diosna, 5 m/sec, 60% fill level
High Shear Zone
r/R
y/H
Recirculation Pattern
42

40% Fill
60% Fill
Time Averaged Pressure Profile
Effect of Fill Level1 L Diosna, 5 m/sec
50% Fill
43
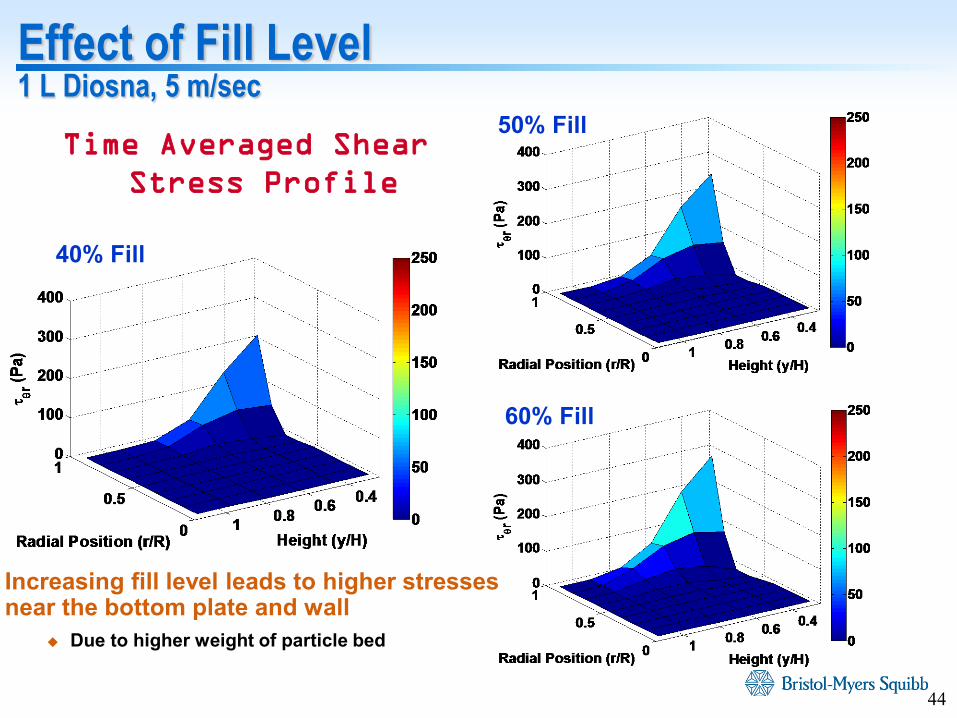
40% Fill
60% Fill
Time Averaged Shear Stress Profile
Effect of Fill Level1 L Diosna, 5 m/sec
50% Fill
Increasing fill level leads to higher stresses near the bottom plate and wall
Due to higher weight of particle bed
44

Effect of Fill Level - Residence Time Distributions
1 L Diosna, 5 m/secHigh Shear Zone Recirculation Patterns
40% Fill
50% Fill
60% Fill
45

Effect of Blade Speed1 L Diosna
Vtip = 2.5 m/sec
Vtip = 5.0 m/sec
• Higher pressures observed at higher tip speed Potential for higher granule consolidation
• Linear increase of pressure observed with tip speed
Time Averaged Pressure Profile
46

Effect of Blade Speed1 L Diosna
Vtip = 2.5 m/sec
Vtip = 5.0 m/sec
• Higher shear stress observed at higher tip speed Potential for higher granule attrition
• Linear increase of shear stress observed with tip speed
Time Averaged Shear Stress Profile
47

Effect of Blade Speed- Residence Time Distributions
1 L Diosna, 40% fillHigh Shear Zone Recirculation Patterns
Vtip = 2.5 m/sec
r/R
y/H
r/R
Vtip = 5.0 m/sec
48

Effect of Scale60% Fill, 5 m/sec
Time Averaged Pressure Profiles
1 L Diosna 10 L Diosna
• Higher pressures observed at 10 L scale Due to higher mass of powder bed Suggest a higher degree of granule consolidation at larger scale
49
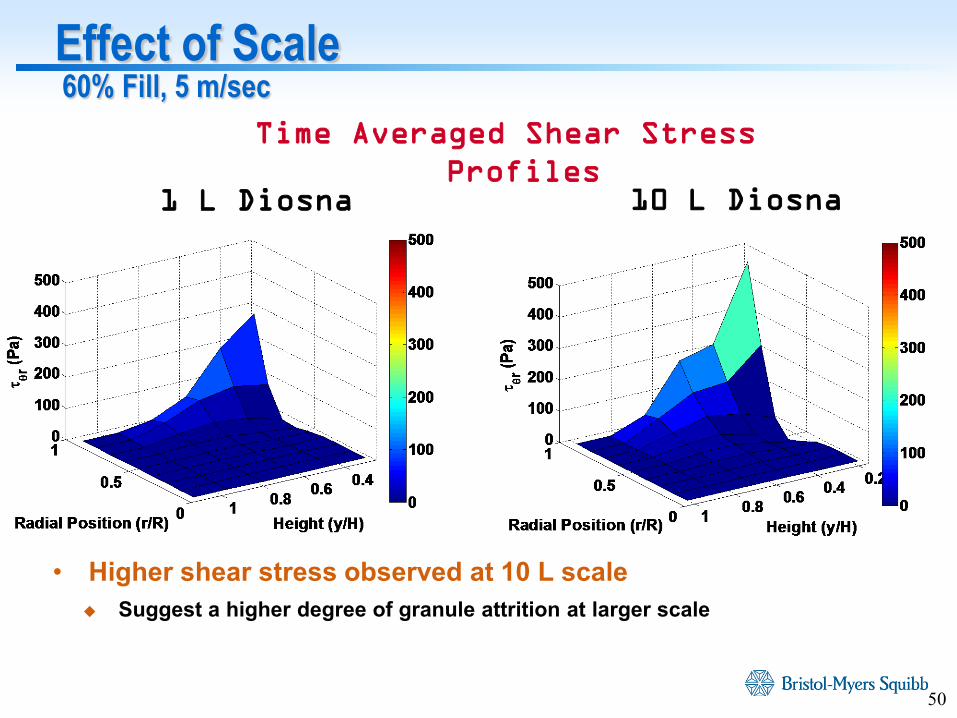
Effect of Scale60% Fill, 5 m/sec
Time Averaged Shear Stress Profiles
1 L Diosna 10 L Diosna
• Higher shear stress observed at 10 L scale Suggest a higher degree of granule attrition at larger scale
50

Effect of Scale- Residence Time Distributions
5 m/sec, 60% fillHigh Shear Zone Recirculation Patterns
r/R r/R
51

Effect of the Blade Design
• Two blade designs were tested for Diosna 1L granulator with the blades being more radial and more tangential
• 60% material fill level was used at tip speed 5m/s

Blade Design vs. Time Averaged Velocity
• Tangential velocities normalized with respect to the tip speed
• The tangential component of the velocity is higher for radial blades near the granulator wall
-0.035
-0.03
-0.025
-0.02
-0.015
-0.01
-0.005
0
0.005
0 0.1 0.2 0.3 0.4 0.5 0.6 0.7 0.8 0.9 1
Tang
entia
l vel
ocity
nor
mal
ized
ag
ains
t tip
spe
ed
Normalized Radial Position
Time Averaged Tangential velocity
Radial blade
Tangential blade
-0.12
-0.1
-0.08
-0.06
-0.04
-0.02
0
0.02
0.04
0 0.1 0.2 0.3 0.4 0.5 0.6 0.7 0.8 0.9 1
Tang
entia
l Vel
ocity
noe
rmal
ized
ag
ains
t tip
spe
ed
Normalized Vertical Position
Time Averaged Tangential Velocity
Radial blade
Tangential blade

Blade Design vs. Time Averaged Velocity
• Radial velocities normalized with respect to the tip speed
• The radial component of the velocity is very similar for different blade designs
-0.05
0
0.05
0.1
0.15
0.2
0.25
0 0.1 0.2 0.3 0.4 0.5 0.6 0.7 0.8 0.9 1
Rad
ial v
eloc
ity n
orm
aliz
ed a
gain
st
tip s
peed
Normalized Radial Position
Time Averaged Radial Velocity
Radial blade
Tangential blade
0
0.05
0.1
0.15
0.2
0.25
0.3
0 0.1 0.2 0.3 0.4 0.5 0.6 0.7 0.8 0.9 1
Rad
ial V
eloc
ity n
orm
aliz
ded
agai
nst t
ip s
peed
Normalized Vertical Position
Time Averaged RadialVelocity
Radial blade
Tangential blade
Radial vel. component
Tangential vel. component

Population Balance Modeling (PBM)
BMS Highly Confidential
0 5 10 15 20 250
0.2
0.4
0.6
0.8
1
1.2
1.4
1.6
1.8x 10
-3
Time (s)
Nor
mal
ized
mas
s fre
quen
cy
Experiment D - 75% water, 3% HPC
0-100100-200200-500500-3000
0 5 10 15 20 250
1
2
3
4
5
6
7x 10
-3
Time (s)
Nor
mal
ized
mas
s fre
quen
cy
Experiment H - 85% water, 3% HPC
0-100100-200200-500500-3000
Different binder concn. Different water amount
0 1 2 3 4 5 6 7 8 9 100
0.005
0.01
0.015
0.02
0.025
0.03
pore size (µm)
cum
ulat
ive
pore
vol
ume
(mL/
g)
Experiment D - 75% water, 3% HPC
experimentalsimulation
0 1 2 3 4 5 6 7 8 9 100
0.005
0.01
0.015
0.02
0.025
0.03
0.035
0.04
0.045
pore size (µm)
cum
ulat
ive
pore
vol
ume
(mL/
g)
Experiment H - 85% water, 3% HPC
experimentalsimulation
Part
icle
Siz
eG
ranu
le P
oros
ity
FBR
MM
IP
Prediction com
pared against experimental data
generated by: E
nabl
es P
redi
ctio
n of

Multi-Dimensional PBM
G
S1+S2 L
13
1 26( )S S L Gdπ
+ + + = 1 2
L GS S L G
ε +=
+ + +
GLLlsat +
=Granule
In this project we will utilize an Seff to take into account multiple solid components (More details on PBM formulation in Telecon 2). We assume viscous regime, layering is ignored. Nucleation can be ignored due to very small time constant.
3

Aggregation and Breakage rates
• Aggregation– Net aggregation rate in each bin depends on properties and number of particles in
all smaller bins.
– Multiple properties result in multiple integrals evaluated for each bin.
– Aggregation rate kernel depends on properties of two colliding particles.
– If bins are not linearly distributed with respect to volume, new particles can form between bins (cell-average method).
• Breakage– Net breakage rate in each bin depends on properties and number of particles in all
larger bins.
– Breakage rate kernel depends on properties of parent particle.
– Breakage distribution describes daughter particles (uniform distribution assumed).
∫−∫ −−=ℜ∞
00')'()()',(')'()'()','(
21)( dxxFxFxxdxxFxxFxxxx
x
agg ββ
)()(')'()',()'()( xFxKdxxFxxbxKx breakx
breakbreak −∫=ℜ∞
Connect Material properties and Process parameters into process model
kernels

Aggregation kernels (high shear focus)
4 main types of kernels
1. Empirical (based on no physics, contains only tuning parameters)2. Semi-empirical (based on some physics, contains several tuning
parameters) (based on 3. Semi-mechanistic (Mechanistic and parametric) (based on physics,
encompasses very few tuning parameters) 4. Mechanistic (Mechanistic and non-parametric) (based on physics, no
tuning parameters)
Empirical: Constant kernel, Additive kernel, Multiplicative, Discrete (Wauters, Adetayo, which are based on certain critical properties such as size) (often no dependency on liquid content), Made.
Madec kernel above has liquid dependency but is still highly empirical)
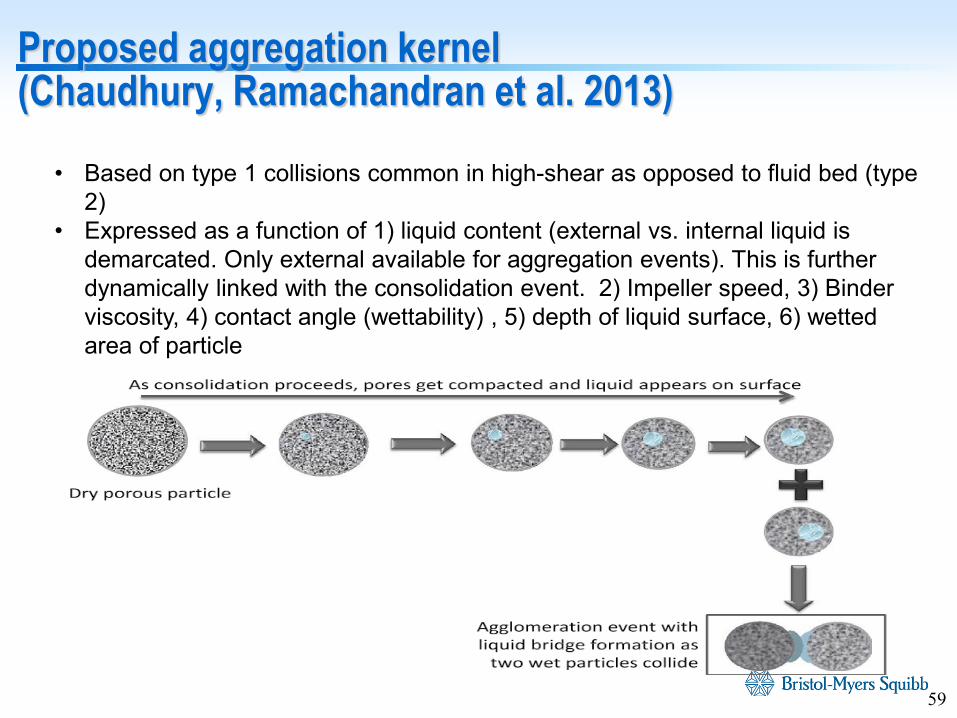
Proposed aggregation kernel (Chaudhury, Ramachandran et al. 2013)
• Based on type 1 collisions common in high-shear as opposed to fluid bed (type 2)
• Expressed as a function of 1) liquid content (external vs. internal liquid is demarcated. Only external available for aggregation events). This is further dynamically linked with the consolidation event. 2) Impeller speed, 3) Binder viscosity, 4) contact angle (wettability) , 5) depth of liquid surface, 6) wetted area of particle
59

Proposed aggregation kernel (Chaudhury, Ramachandran et al. 2013)
0( , , , ', ', ') ( , , , ', ', ') ( , , , ', ', ')aggK s l g s s l l g g B s l g s s l l g g A s l g s s l l g g− − − = Ψ − − − × − − −
*
*
1, if ( , , , ', ', ')
0, if St St
s l g s s l l g gSt St
<Ψ − − − =
≥
*0 122
8 and 2 ln3 a
muSt Sthdλ
πµ= =
( , , ) ( ', ', ')( , , , ', ', ')( , , ) ( ', ', ')
wet wet
total total
A s l g A s s l l g gA s l g s s l l g gA s l g A s s l l g g
− − −− − − = ×
− − −
Kernel formulation
Stokes criterion
Wetted fractional area
0( , , , )( , , ) 1.5( , , , )
ext
wet
V s l g th s l gA s l g t
= ×
Awet is a function of contact angle
60

Proposed breakage kernel (Ramachandran et al. 2009)
• Empirical breakage kernel depends only on the process parameters and neglects the effect of material properties
• A more predictive model accounts for those effects inherently, instead of relying on experimental data and calibration.
• Semi-Mechanistic breakage kernel a function of particle-particle, particle-wall and particle-impeller collisions, contact area and intrinsic strength.
External stress = f(size, density, elastic modulus, Poisson ratio, coefficient of restitution, velocity)
Contact Area = f(Young’s Modulus, radius of particle, Poisson’s ratio)
Intrinsic Strength = f(viscosity, density, surface tension, contact angle, radius of particle)
Overall Kernel formulation: Kbreak=(σimpact/σintrinsic strength )
Note: Test Pandya kernel also depending on extent of breakage 61

Micro-Granulator
Disposable material use API and material requirement < 10g/batch Multiple batches simultaneously, robust statistical analyses Mechanistic investigations and rank-order trend analyses
BMS Highly Confidential

A Vision of the Future State
Formulation & Process Selection
Mechanistic Understandinge.g., Form Conversion
Formulation & Process DoEfor QbD/Design Space
Scale-up & Tech Transfer
Control Strategy & Commercial Manufacture
DE
M
PB
M
Micro-granulator
FBR
M DFF
ToolsStage of DevelopmentRapid, low cost, low API development with high quality
In-silico design space with confirmation of edges experimentally
Real-time monitoring & control enabling scale-up, RTR, no batch failures, and process trending

Acknowledgements & Contributions Population Balance Modeling
Preetanshu Pandey Rohit Ramachandran, Rutgers
Discreet Element Modeling Brenda Remy Richard LaRoche, Mark Cook,
Anna Sosnowska, and Stephen Cole, DEM Solutions
Atul Dubey, Tridiagonal Solutions
Micro-granulator Jaquan Levons, Brian Breza, Alex
Baranowski
Focused Beam Reflectance Measurement Tim Stevens, Kevin Macias Rekha Keluskar, Shruti Gour
Densification (MIP) during HSWG Li Tao, Junshu Zhao, Jinjiang Li Sherif Badawy, Avi Wolf, Summer Intern
Shear & Drag Force Sensor Valery Sheverev and Vadim Stepaniuk,
Lenterra Tim Freeman, Michael Delancy, and Doug
Millington-Smith, Freeman Tech Divyakant Desai, Sherif Badawy, Dilbir Bindra,
Kevin Macias, Tim Stevens, Brian Breza, Douglas Both, & Ganeshkumar Subramanian
BMS Highly Confidential
BMS Leadership and Project TeamDilbir Bindra, Julia Gao, Sherif Badawy, Sailesh Varia, Nancy BarbourKevin Macias, Tim Stevens, Douglas Both, Keirnan LaMarche, Judy Lin, Pankaj Shah
64

Selected Publications• Panakanti R and Narang AS (2012) Impact of excipient interactions on drug bioavailability from solid dosage
forms. Pharm Res 29: 2639.
• Narang A, Yamniuk A, Zhang L, Comezoglu SN, Bindra DS, Varia S, Doyle M, and Badawy S (2012) Reversible and pH-dependent weak drug-excipient binding does not affect oral bioavailability of high dose drugs. J PharmPharmacol 64:553-65.
• Badawy SIF, Narang AS, LaMarche K, Subramanian G, and Varia SA (2012) Mecahnistic basis for the effects of process parameters on quality attributes in high shear wet granulation. Int J Pharm 439: 324-333.
• Narang AS, Badawy S, Ye Q, Patel D, Vincent M, Raghavan K, Huang Y, Yamniuk A, Vig B, Crison J, Derbin G, Xu Y, Ramirez A, Galella M, and Rinaldi F (2015) Role of self-association and supersaturation on oral absorption of a poorly soluble weakly basic drug. Pharm Res 32: 2579-2594.
• Badawy SIF, Narang AS, LaMarche KR, Subramanian G, Varia SA, Lin J, Stevens T, and Shah PA (2015) Integrated application of quality-by-design principles to drug product development: case study of brivanb alaniante film coated tablets. J Pharm Sci (in press).
• Narang AS, Sheverev VA, Stepaniuk V, Badawy S, Stevens T, Macias K, Wolf A, Pandey P, Bindra D, and Varia S (2015) Real-time assessment of granule densification in high shear wet granulation and application to scale-up of a placebo and a Brivanib Alaninate formulation. J Pharm Sci 104: 1019-1034.
• Narang AS, Sheverev V, Freeman T, Both D, Stepaniuk V, Delancy M, Millington-Smith D, Macias K, and Subramanian G (2015) Process analytical technology for high shear wet granulation: wet mass consistency reported by in line drag flow force sensor is consistent with powder rheology measured by at line FT4 powder rheometer®. J Pharm Sci (in press).


![Encyclopedia of Pharmaceutical Technology - mcc … Granulation/Wet Granulation - End-Point... · Encyclopedia of Pharmaceutical Technology ... Probe vibration analysis[21,22] requires](https://static.documents.pub/doc/80x56/5ab6d1b07f8b9a156d8e3299/encyclopedia-of-pharmaceutical-technology-mcc-granulationwet-granulation.jpg)


