Forschungsinstitut zur Zukunft der Arbeit Institute for the Study of Labor DISCUSSION PAPER SERIES Pathways from School to Work in the Developing World IZA DP No. 9456 October 2015 Marco Manacorda Furio Camillo Rosati Marco Ranzani Giuseppe Dachille
Transcript
Forschungsinstitut zur Zukunft der ArbeitInstitute for the Study of Labor
DI
SC
US
SI
ON
P
AP
ER
S
ER
IE
S
Pathways from School to Workin the Developing World
IZA DP No. 9456
October 2015
Marco ManacordaFurio Camillo RosatiMarco RanzaniGiuseppe Dachille
Pathways from School to Work
in the Developing World
Marco Manacorda Queen Mary University of London, CEP (LSE), CEPR and IZA
Furio Camillo Rosati
University of Rome Tor Vergata, ILO, UCW, ICID and IZA
Any opinions expressed here are those of the author(s) and not those of IZA. Research published in this series may include views on policy, but the institute itself takes no institutional policy positions. The IZA research network is committed to the IZA Guiding Principles of Research Integrity. The Institute for the Study of Labor (IZA) in Bonn is a local and virtual international research center and a place of communication between science, politics and business. IZA is an independent nonprofit organization supported by Deutsche Post Foundation. The center is associated with the University of Bonn and offers a stimulating research environment through its international network, workshops and conferences, data service, project support, research visits and doctoral program. IZA engages in (i) original and internationally competitive research in all fields of labor economics, (ii) development of policy concepts, and (iii) dissemination of research results and concepts to the interested public. IZA Discussion Papers often represent preliminary work and are circulated to encourage discussion. Citation of such a paper should account for its provisional character. A revised version may be available directly from the author.
IZA Discussion Paper No. 9456 October 2015
ABSTRACT
Pathways from School to Work in the Developing World1 This paper uses micro data from the ILO-STWT surveys to provide novel evidence on the duration, end point and determinants of the transition from school to work in a sample of 23 low and middle-income countries around the world. The negative effects of low levels of human capital and high levels of population growth on job finding rates, seems to be at least in part offset by widespread poverty and lack of unemployment insurance, leading to overall faster transitions in low income economies compared to middle income economies. By lowering reservation wages and speeding transitions these latter forces lead overall to worse matches, as measured by the probability of attaining stable employment in the long-run. JEL Classification: J64, 057 Keywords: transition duration, hazard model, unemployment, developing countries Corresponding author: Furio Camillo Rosati Department of Economics and Finance University of Rome Tor Vergata via Columbia n. 2 00133 Roma Italy E-mail: [email protected]
1 We are grateful to participants at seminars at the OECD and the World Bank, the ILO Global Research Symposium ‘Labour market Transitions of Young Women and Men: Innovative research from 28 School-to-Work Transition Surveys’ (Geneva, March 2015) and the 10th IZA-WB Conference on Employment and Development (Bonn, June 2015) for useful comments. Funding for this paper was provided by the United States Department of Labor. This report does not necessarily reflect the views or policies of the United States Department of Labor, nor does the mention of trade names, commercial products, or organizations imply endorsement by the United States Government.
2
1. Introduction
In this paper we present novel evidence on transition durations from school to work
and on the probability of ever finding employment and stable employment in a sample
of 23 low and middle-income countries around the world. To do so we exploit unique
and yet unutilized micro data from the ILO School to Work Transition (STWT)
surveys that collect retrospective information on work histories on a sample of around
35,000 individuals aged 15 to 29 around the world.
Young individuals are at particular risk of unemployment and joblessness. This is
true both in developed as well as in the developing world (ILO 2013, 2014). In
addition to joblessness, underemployment, informality, low wages and lack of quality
employment affect youth labor markets, especially in low-income countries.
A critical stage in an individual's working life is the transition leading from
school to the first employment spell. Lengthy transitions impose an array of
individual and possibly social costs and they might potentially lead to worse job
matches, either due to the effects of prolonged unemployment spells on human capital
stock or to employers perceiving long unemployment spells as a signal of low
productivity. Long transitions might even translate into worse labor market outcomes
in the long term, i.e. lower employability, lower wages and/or poor quality jobs.
One should not necessarily assume though that fast transitions are an indication
of good matches or are individually or socially desirable. Short durations might be the
result of low reservation wages or poor prospects of finding decent employment and
in turn lead to long-term underemployment and poor quality employment.
Some evidence exists on the length of transitions from school to work in more
advanced and, to a minor extent, in emerging economies (see for example
Cunningham and Salvagno 2011and OECD 1998, Quintini and Martin 2007, 2014,
Ryan 2001 for high income countries). Much of this evidence points to the role of
lack of adequate skills as an obstacle to timely and successful transitions.
Considerably less is known, however, about the characteristics and key correlates of
transition from school to work in developing countries. As the majority of youth
worldwide live in low and middle income countries, characterizing these transitions
and understanding their determinants is of primary importance.
There is convincing evidence from more advanced economies on the negative
effect of protracted job search and unemployment, especially during youth. Long-
3
term unemployment has itself adverse consequences on the probability of finding
work through negative state dependence (Machin and Manning 1999) and post-
unemployment wages appears to be negatively affected by the length of the
unemployment period (see for example Card, Chetty and Weber 2007, Lalive 2007,
Schmieder, von Wachter and Bender 2014). A number of related studies also show
evidence of the scarring effects of joblessness, which can persist in an individual’s
life (see Ellwood 1982, Gregg and Tominey 2001, Mroz and Savage, 2006, von
Wachter and Bender 2006).
Economic theory rooted in the canonical search and matching model (Pissarrides
2000) suggests that the demographic bulges and the low arrival rate of high quality
wage offers that characterize many developing economies will negatively affect
employment prospects in the long run, although their effects on transition durations
are ambiguous. While demographic pressure and the paucity of decent job
opportunities are likely to mechanically lead to lower job offers arrival rates and
longer transition durations, these will also push workers to accept low wages and low
quality jobs. As better opportunities than the current ones are unlikely to materialize
in the future, there are disincentives to wait when job-to-job mobility is costly,
fostering circles of poor quality employment and underemployment.
Similarly, widespread poverty and lack of unemployment insurance that also
characterize low income economies, will likely lower reservation wages and speed the
transition process, as well as possibly directly lead to worse labor market outcomes in
the log-run.
In order to systematically investigate the length and end-point of the transition
process from school to the labor market and its determinants in low and middle
income countries, in this work we use retrospective data on work histories since the
time of leaving school on a sample of around 35,000 individuals from Africa, Asia,
Latin America and the Caribbean and Eastern Europe. These data are clearly right-
censored, as not all individuals will have transited to employment by the time of the
survey. More importantly, not all of those who are observed not having transited at
the time of the survey will necessarily ever transit to employment, let alone to high
quality employment. In order to account for this, we fit to the data a split cure model
(Schmidt and Witte, 1989) where we simultaneously parameterize the probability of
ever transiting to employment (or stable employment) and the duration of
4
unemployment. This allows us to obtain estimates of baseline hazard rates net of
differences in socioeconomic characteristics of the population across countries.
In our sample of countries, and similar to high-income countries, hazard rates
display pronounced negative duration dependence. While transition durations are on
average not very dissimilar from those observed in high-income countries, this masks
substantial heterogeneity across regions. Transition durations are the lowest in low
income countries in Sub-Saharan Africa and Asia and the Pacific and the highest in
middle income countries in Latin America and the Caribbean and in particular in the
Middle East and North Africa. We also find that in some low and middle-income
countries a substantial fraction of individuals are predicted to never transit to
employment.
We next investigate the determinants of the heterogeneity in the transition
duration and the probability of ever transiting to employment or to stable employment
across individuals and countries. Those with higher levels of education (proxied by
higher school leaving age) and those with work experience while in school transit
faster and are more likely to ever find employment than early school leavers, possibly
pointing to the role of early human capital accumulation and education in shaping
transitions. Women are less likely to transit, and, if they transit, generally do so at a
slower rate than men, although we reaming agnostic on whether this reflects
preferences or constraints.
We also show that, despite the extreme pressure put on labor markets by
demographic bulges that negatively affect job finding rates especially in Sub-Saharan
Africa, transition durations are markedly lower in low income countries compared to
middle and high income countries due to a combination of widespread poverty and
lack of unemployment insurance, both of which negatively affect reservation wages.
These same forces appear to lead to a lower probability of finding employment and
stable employment in the long run. Although one has to be cautious in drawing any
causal inference from this evidence, these results suggest that shorter durations driven
by low reservation wages in low-income countries have potentially long-run welfare
costs in terms of a reduced probability of achieving high quality employment.
The rest of the paper is organized as follows. Section 2 presents the data. Section
3 presents simple descriptive statistics on youths' labor market status across 28
countries for which the ILO survey data are available. Section 4 presents estimates of
the split sample model for 23 (of the 28) countries for which work histories can be
5
reliably derived from the surveys and investigates the individual and macro correlates
of such phenomena. Section 5 concludes.
2. Data: The ILO School to work transition surveys
Through the Work4Youth partnership with The MasterCard Foundation, the
International Labour Organization has recently embarked on an unprecedented data
collection effort on youths' labor market outcomes in a sample of 28 low and middle-
income countries around the world. This effort is in response to the paucity of data, in
particular of systematically comparable data, on labor market outcomes and
transitions from many non-high income countries. The list of countries, including
sample sizes, geographical coverage and sample period is presented in Table A1. The
survey include countries in five regions: from middle income countries in Latin
American and the Caribbean (LAC: Brazil, Colombia, El Salvador, Jamaica, Peru),
Eastern Europe and Central Asia (EECA: Armenia, Kyrgyz Republic, Republic of
Macedonia, Republic of Moldova, Russian Federation, Ukraine) and Middle East and
North Africa (MENA: Egypt, Jordan, Occupied Palestinian Territory, Tunisia) to low
and very low income countries in Asia and the Pacific (AP: Bangladesh, Cambodia,
Nepal, Samoa, Vietnam) and Sub-Saharan Africa (SSA: Benin, Liberia, Madagascar,
Malawi, Tanzania, Togo, Uganda, Zambia).
The surveys were conducted between the third quarter of 2012 and the third
quarter of 2013. The data are nationally representative with the exception of the
Russian Federation, Colombia and Peru.
The surveys collect a large set of information on current labor market status plus
selected retrospective information on labor market experiences for a nationally
representative sample of individuals aged 15-29. Retrospective information is
collected since the time the individuals left school or since the first labor market
experience for those who never attended school. This is integrated with information
on current individual and household-level characteristics (such as age, gender, highest
education level completed, age left education, area of residence, etc.).
Retrospective labor market information covers all past spells of employment and
job search. For each spell the data report the start and end months and years. Note that
the surveys only collect information on past employment spells among individuals not
currently in education. Information on work during school for those not currently in
6
education is limited to a variable for whether or not an individual worked while
attending school; there is no information on labor market experience for those
currently in school.
No information is available on wages or earnings other than for the current
employment spell. There is also little information on individual and household
characteristics in the past or on how they evolved over time.2
As the ILO-STWT surveys only collect information on labor market spells from
the time the individual left school, we cannot identify employment spells that
happened and concluded before leaving school (although, as said, we have an
indicator on whether individuals worked or not while attending school). More
importantly, for each employment spell that started before leaving school but that was
ongoing at the time the individual left school, the survey reports as a start date the
month following the one of leaving school.3 In practice, this means that one cannot
distinguish genuine direct transitions from school to work from apparent transitions,
i.e., transitions that happened before leaving school and that continued after the
individual left school. For this reason, one needs to be very cautious in interpreting
spells recorded as starting just after leaving school as direct transitions from school to
work.
In the following section we present descriptive statistics on current employment
status. In Section 4 we turn to an analysis of the transition from school to work.
Section 5 concludes.
3. Labor market and education outcomes at the time of the survey
Labor market and education outcomes for young individuals aged 15-29 in each of the
28 countries are reported in Table 1. In the remainder of the analysis we weigh
observations for each country by sampling weights. This allows us to obtain estimates
of the population parameters in each of the countries analyzed.
2 For each past employment spell, the data also report the type of employment (whether wage-worker,
unpaid family worker or self-employed), and, for wage workers, the existence and characteristics of the
work contract (whether written or oral and whether temporary or stable) but as said no information on
wages. 3 The only exception is Brazil for which employment spells prior to the time of leaving school are
recorded. For consistency, we artificially left-censor the data for Brazil at the time of leaving school.
7
The average (population weighted) unemployment rate across all countries is 13
percent (column 1). This is in contrast to an average unemployment rate for 15-29
years olds across the OECD of 16.2 percent in 2012 (ILO, 2013). Unemployment is
the lowest in low income countries, in particular SSA and AP (11 and 8 percent,
respectively) and the highest in MENA (18 percent) and LAC (16 percent).4
Unemployment is only one indicator of young persons' fortunes in the labor
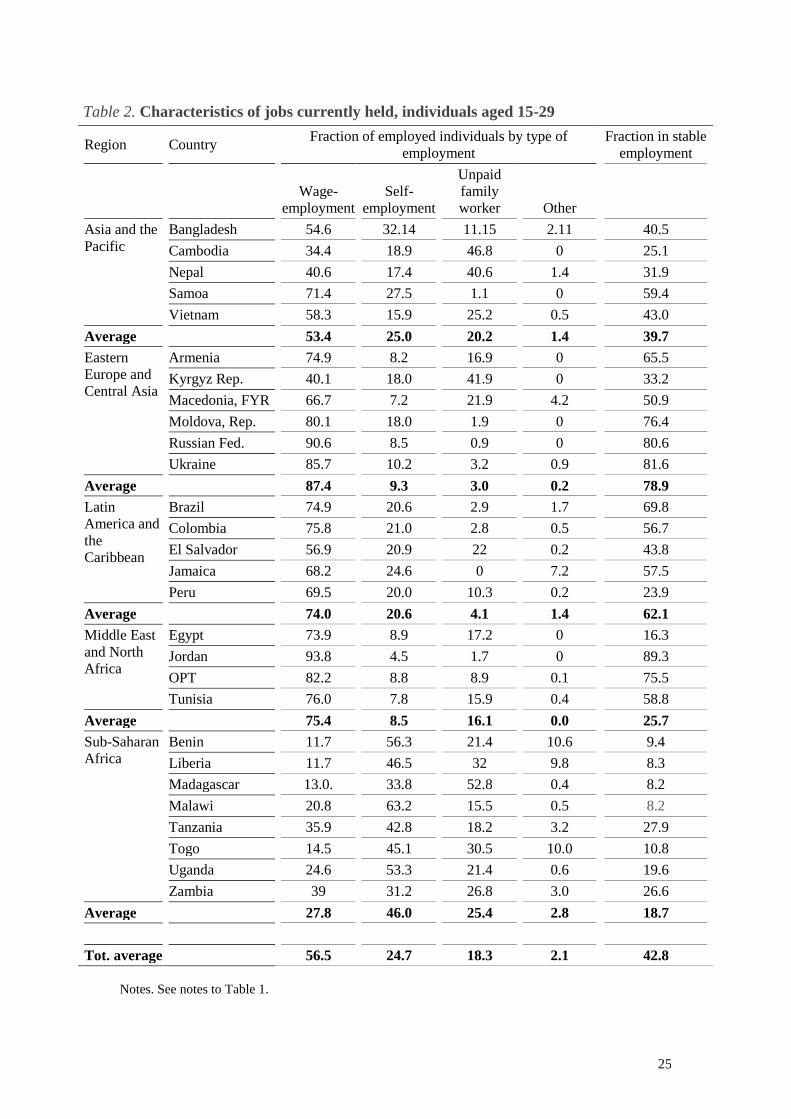
market. Table 2 reports data on the type of jobs held by employed youth. Again, some
regional patterns are apparent: unpaid family work and self-employment are more
prevalent in low income countries (46 and 25 percent, respectively, in SSA relative to
a sample mean of 25 and 18 percent, respectively); and wage employment is less
likely in low income countries (28 percent in SSA relative to a sample mean of 56
percent) compared to high income countries. In contrast, the fraction of young
workers working for a wage is as high as 88 percent in EECA.
In order to complement information on the quality of jobs held, the last column of
Table 2 reports information on the fraction of working youth in stable employment,
defined as wage work with an indefinite contract or with a contract of at least 12
months' duration. 5 Again, not surprisingly, the fraction of youth in stable employment
tends to be higher in middle-income countries than in low-income countries,
reflecting patterns of stable and wage employment in the adult population. EECA
countries in particular show the highest rates of stable employment (79 percent),
followed by countries in LAC (62 percent).
In sum, youth unemployment is widespread in middle-income countries and so
are, comparatively speaking, high quality jobs, while the reverse is true in low-income
countries. These results point to the direction of lack of high quality jobs, widespread
poverty and lack of social insurance possibly driving both low unemployment and
low quality employment among youth in low-income countries. We try to assess the
4 The average employment to population rate across the low and middle countries in our sample in
column (2) of Table 1 is around 51 percent. In contrast to unemployment, there is no obvious pattern
across regions, with employment rates above the sample average in countries in SSA (55 percent) and
LAC (54 percent). 5 The ILO provides an explicit definition of “Decent work“ as work that “sums up the aspirations of
people in their working lives. It involves opportunities for work that is productive and delivers a fair
income, security in the workplace and social protection for families, better prospects for personal
development and social integration, freedom for people to express their concerns, organize and
participate in the decisions that affect their lives and equality of opportunity and treatment for all
women and. Source: ILO (http://ilo.org/global/about-the-ilo/decent-work-agenda/lang--en/index.htm).
8
effect of these variables more formally in the next section through a focus on
transitions from school to work.
4. Transition from school to work
Higher incidence of youth unemployment in middle income countries - and in
particular in MENA countries - compared to low income countries can be due to
lower inflows into employment or higher outflows out of employment and higher
turnover. In the rest of the paper we focus on accession rates and in particular on the
transition to the first employment spell and to the first spell of stable employment. We
focus on individuals who left education; we disregard those who never attended
school, for whom the concept of school to work transition clearly does not apply.6
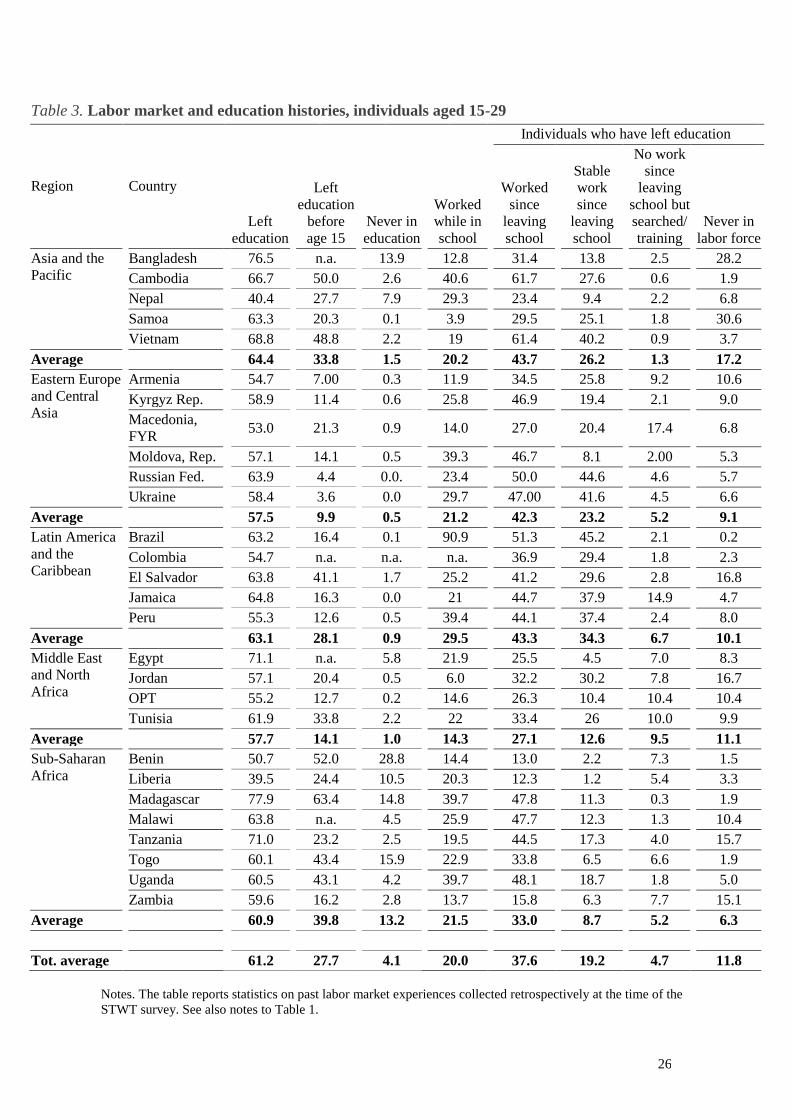
Among those who left education, a sizeable fraction (28 percent, i.e. 45 percent
of those who ever attended) left education before age 15 (see column 2 of Table 3).
As expected, this fraction is particularly high in SSA (65 percent of those who ever
attended).
Table 3 presents also information on completed transitions. On average, 38
percent of youth aged 15-29 report having attended school and having had one work
experience since the time they left education (column 5). This fraction is the lowest in
MENA (27 percent). A substantial fraction of individuals - around 20 percent - also
worked while in school (column 4).
Note that if around 61 percent of those out of school had a job since leaving
education (this is 37.6 in column 5 divided by 61.2 in column 1), only about 31 per
cent of these individuals (=19.2/61.2) had at least one spell of stable employment; this
fraction is unsurprisingly the lowest in SSA (14 percent).
Finally, a substantial share of individuals had no work experience after leaving
school (16.5 percent, this is the sum of columns 7 and 8). 19 percent (=11.8/61.2) of
individuals have been continuously out of the labor force since the time of leaving
school while a small fraction (8 percent = 3.1/65.5) had at least one spell of job search
or training. As illustrated below, youth continuously out of the labor force are
disproportionately women.
6 On average, in the sample of countries under analysis, a significant fraction (4.6 percent) of individuals
never attended school (column 3 of Table 3). This fraction is as high as around 10 percent in Sub-Saharan
Africa and effectively zero in LAC and EECA.
9
4.1 Duration analysis
Data in Table 3 are right-censored as individuals who have not transited to
employment by the time of the survey might do so in the future. To circumvent this
problem, we fit a duration model to the data (see Lancaster 1992 and Jenkins 2005),
separately by country. This allows us to compute duration to employment - overall
and by sub-groups defined on observable characteristics - and to derive baseline
transition probabilities net of compositional effects, i.e. differences in observable
characteristics of the youth population across countries. We can also explore the
determinants of transition duration across countries and we turn to this in the next
section.
As illustrated in Table 3, a relatively large number of out of school youth have
been continuously inactive since the time they left education. This is possibly an
indication that some of these individuals will never transit to employment. Treating
these individuals as if they had extremely long transition durations might lead one to
erroneously conclude that mean transition durations are very high. In order to account
for this possibility, we employ a split-population (also sometimes referred to as spilt-
cure) model (Schmidt and Witte, 1989). This model provides a simultaneous estimate
of the duration of the transition to employment among those who are expected to
transit as well of the probability of never transiting (also sometimes referred to as the
probability of being cured).
Before proceeding to the estimation of the model, we have applied a variety of
sample selection criteria to the data (see Table A1 in the Appendix). The information
provided by the surveys as well as sample sizes vary considerably across countries. In
some countries the data quality is poor or the information provided is scant, making it
necessary to exclude them from the analysis. This applies to Bangladesh, Colombia,
Liberia, Malawi and Zambia, leaving us with a sample of 23 countries out of the 28
for which ILO-STWT surveys are available.7 Note that for Egypt we drop more than
40 percent of the sample while for Macedonia and the OPT we drop about 20 percent
7 For Bangladesh we have no information about the month, but only about the year, of the beginning of
each spell. For Colombia there is no information on the date of leaving school. Missing information on
the date of leaving school also reduces the sample for Malawi by almost 90 percent and, for this reason,
we also exclude this country from the analysis. Moreover we exclude Zambia because of missing date
of starting work for one third of the sample. We also decided to exclude Liberia from the sample
because, once observations with missing variables are excluded, we are left with a very small sample
(around 250 observations).
10
of the observations. We retain these countries in the analysis, but some care should be
exerted in interpreting the estimates, especially in the case of Egypt.
On average we have around 1,500 observations per country. Given the limited
number of observations, highly parameterized models often fail to converge. For this
reason, and after some experimentation, we have decided to parameterize the
probability of never experiencing a failure (i.e., of never transiting to a job) as a log-
log distribution and to constrain the hazard function to follow a proportional hazard
Weibull distribution. The Weibull parameterization constraints the hazard function to
be monotonically increasing or decreasing in duration while the proportional hazard
specification restricts the hazard rate to be parallel across groups with different values
of the covariates.8
Model estimates of the transition to the first employment spell for the 23
countries for which we have data are reported in Appendix. Table A3 contains the
estimates of the probability of never transiting to a job and Table A4 the estimates of
the duration model for individuals expected to eventually transit to a job. The split-
population model fails to converge for Brazil due to a very small number of censored
observations in the data. For this country we decided, therefore, to estimate a standard
proportional hazard Weibull model and hence, while we report model estimates for
the duration of the transition from school to the first job (in Table A4), we do not
report model estimates for the probability of never transiting (Table A3).
We include a number of covariates in the model. Given the limited number of
observations and characteristics available in the survey, and since most of the
characteristics are observed at the time of the survey rather than at the time of leaving
school (i.e., at the onset of risk) we are constrained in the number of variables that we
can include in the model. The model includes a gender dummy, a dummy for
urban/rural location, dummies for father's educational level (up to primary, up to
secondary and higher), dummies for three school leaving age groups (less than 16,
between 16 and 18 and greater than 18),9 a dummy for whether or not the individual
8 Although this parameterization is necessarily restrictive, as it does not allow the hazard function for
example to first decrease and then increase in duration, its advantage is parsimony, as the hazard
function only depends on two parameters. Given the small number of observations available for each
country and the varying quality of the data, we have found that split-population models that allow for a
larger number of parameters fail to converge in most of the countries. 9 We prefer to use age left education rather than highest education level achieved because the latter is
defined only coarsely and the categories of completed education vary across countries. Some degree of
caution is needed here though, as, due to late entry, intermittent attendance and widespread grade
11
ever worked while in school and (a 3-year average of) per capita GDP growth at the
time of leaving school, in order to account for the possible impact of initial labor
market conditions on the subsequent probability of finding employment. Finally, we
include dummies for missing values of all included variables. Note that not all
variables (or not all values of these variables) are available for all the countries in the
sample, so we report associated coefficients for the variables (or the categories of
variables) for which data are available. As for the descriptive statistics, estimates are
weighted by sampling weights.
4.2 Probability of never transiting into employment after leaving school
In order to characterize the transition from school to work across countries we focus
on the predicted probabilities of never transiting and mean durations (among those
expected to transit) based on the estimated split-cure model. These figures are easier
to interpret than the estimates of the model parameters. We also present mean
durations and mean probabilities separately by groups defined based on observable
characteristics in order to characterize heterogeneity across groups.
Table 4, column (1), reports the predicted probability of never transiting to work
in each of the countries analyzed. This fraction ranges from 1 percent in Vietnam to
50 percent in Samoa. On average, across all our sample of countries, around 10
percent of youth out of school are expected to never transit to employment. The
predicted fraction of youth never expected to transit is the highest in the MENA
region, on the order of 10 percent, and it is the lowest in SSA and AP, with a
probability of transition to employment of more than 90 percent.10
Estimates of the transition to stable employment are reported in column (2) of
Table 4. Some caution is needed here, as stable employment is rare is many countries
in our sample and the number of individuals in stable employment in the data is often
very limited, implying that estimates of the model parameters are often imprecise.
The share of youth expected to never transit to a stable job is the lowest in LAC (on
the order of 45 percent) and the highest in MENA (at around 78 percent).
retention individuals with the same age left education might have different levels of completed
education. 10 Note though that, because of data limitations, we are unable to report estimates from three African
countries, two of which (Liberia and Zambia) have remarkably low transition rates, at least based on
censored spells (see column 5 of Table 3).
12
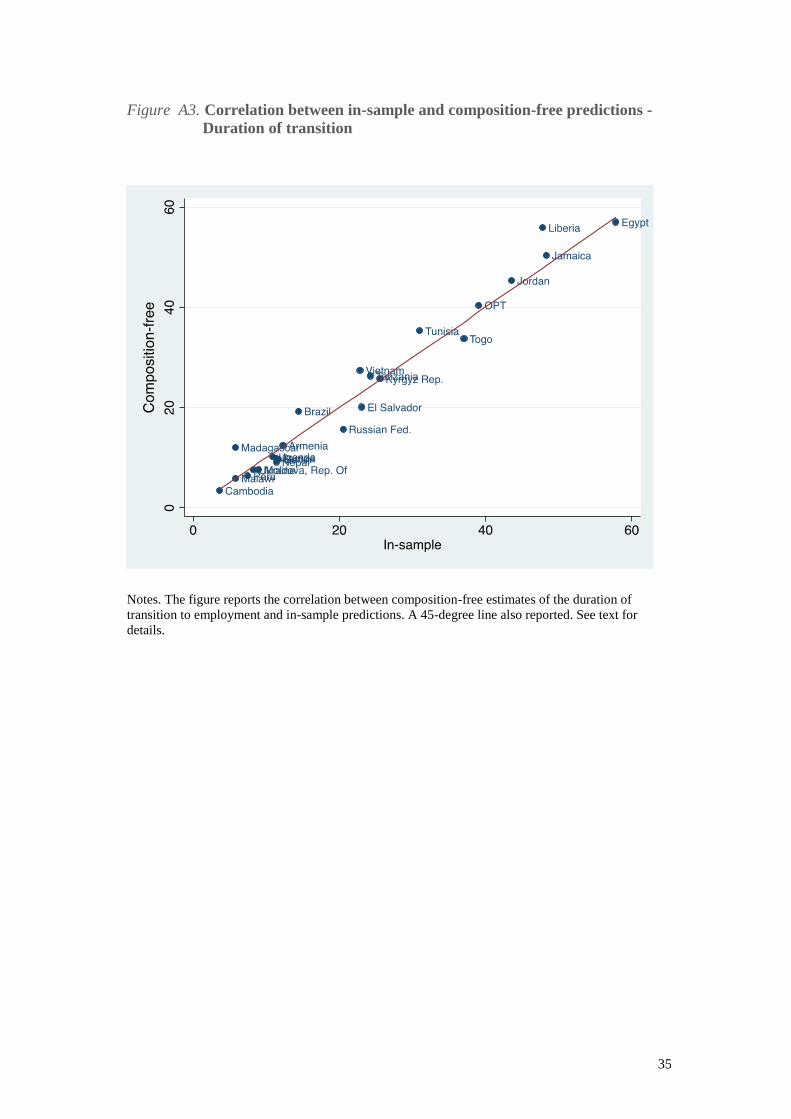
In order to quantify the role of observable characteristics in explaining
differences in transition probabilities across countries, we have recomputed these
probabilities while keeping individual characteristics fixed. To do so, we have
computed predictions from each country-specific model over the entire sample of data
(i.e., for all the individuals in all the countries in our dataset).
Figure A1 plots these composition-free estimates versus in-sample predictions.
The figure shows that these two series line up remarkably well, implying that
observable characteristics play little role in explaining differences across countries in
the probabilities of transition. These differences are most likely due to differences in
structural or cyclical economic factors, although clearly one cannot rule out the
possibility that unobserved individual characteristics, which we cannot account for,
are also responsible for these differences.
4.3 Duration of transitions from school to work
Estimates of the baseline hazard function, i.e., of the probability of finding a job in the
current period conditional on not yet having found one up to the previous period, are
reported in Figure A2 in the appendix. There is evidence across all countries of
negative duration dependence: the probability of finding a job among the survivors
falls as duration increases, in line with findings from the unemployment literature in
more developed economies (e.g. Machin and Manning 1999).
Column (1) of Table 5 reports the average estimated duration of the transition to
the first employment spell among those who are ever expected to transit. Durations
are top-coded at 150 months. Average duration to first employment across all
countries considered is just above two years (i.e., 27 months). This number again
masks substantial heterogeneity across regions and countries. Transitions are the
longest in MENA, with an average duration of 52 months, i.e., four and half years,
and the lowest in EECA, at 17 months, followed by LAC, SSA and AP.
Given that the distribution of durations is highly skewed to the right, median
durations are possibly a better indication of central tendency. Median durations are
reported in column (3) of Table 5. This is effectively the time by which 50 percent of
individuals in each country are predicted to have transited to employment after
leaving school. As expected, median durations are systematically below average
13
durations, especially in countries with high durations (and on average 17 months, i.e.,
almost one and a half year), but the ranking across regions is preserved.
An alternative way to characterize the distribution of durations is to compute the
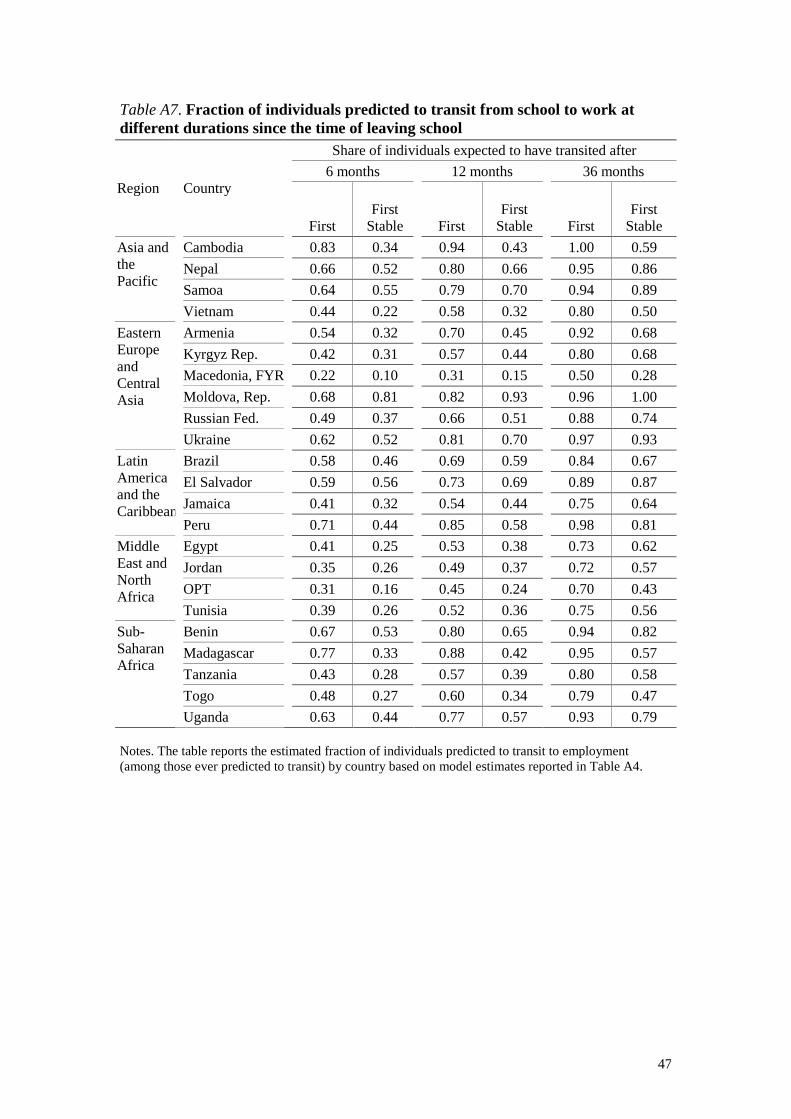
predicted fraction of youth expected to find their first job within 6, 12 or 36 months of
leaving school. These are reported in Appendix Table A7. In most of the countries at
least 50 percent or more of the youth (among those eventually expected to transit to a
job) are expected to be in employment within six months after leaving school, the
exception being countries in the MENA region and a few others such as, for example,
Armenia and Togo. After three years 90 percent of youth have transited to a job in
most countries. In countries from the MENA region and a few from SSA, however,
there are between 20 percent and 25 percent of youth still in transition three years
after leaving school.
As in the case of the probability of ever transiting, we have attempted to assess to
what extent cross-country differences in mean durations can be attributed to
differences in the composition of the population. As shown in Figure A3, there is no
evidence of compositional effects being responsible for a significant share of the
differences in average transition durations across countries.
Column (2) of Table 5 reports average transition durations to the first stable
employment.11 Again figures are top-coded at a value of 150 months. Average
transition duration to stable employment is around 86 months, i.e., just over seven
years. Duration to stable employment is the lowest in AP, LAC and EECA (with an
average duration of between 14 and 42 months) and the highest in SSA (at 103
months).
It is instructive to compare the durations in the low and middle-income countries
under analysis to those in high-income countries. The bottom panel of Table 6 reports
the estimated average transition duration in sample of European countries estimated
by Quintini et al (2007) based on the European Community Household Panel (waves
2 to 8). Despite differences in methodology and data collection instruments, average
transition time to the first job across the EU countries in the sample (23 months) is
very close to the average in our sample of low and middle income countries (27
months). Again, there is variability across EU countries but this is not as pronounced
as the one in our sample.
11 The hazard rates for the duration to stable employment (not shown but available upon request) also
display clear negative duration dependence.
14
In sum, we find that transition durations in low and middle-income countries,
with the notable exception of the MENA region, are slightly shorter than in advanced
economies. This overall conclusion is tempered by the observation that a substantial
fraction of youth in the low and middle income countries under analysis - on average
10 percent - are expected to never transit to employment, let alone to stable
employment. Not only are transitions to stable employment unlikely to occur but also,
when they do in fact occur, they are lengthy.
4.4 Heterogeneity analysis
In this section we investigate differences in the probability of never transiting to work
and in the duration to employment across groups defined based on observable
characteristics.
To do so we compare mean predicted values obtained by varying the values of
the variable of interest, while keeping constant the values of all other variables. For
example, in the case of gender, for each country we compute predicted probabilities
of never transiting and durations assuming that all individuals in that country’s
sample are either all females or all males. A comparison between these two
predictions provides an estimate of the effect of the gender differentials in transitions
durations and probabilities while keeping all other characteristics fixed.
4.4.1. Gender
Gender appears to be a very significant predictor of young persons’ transition status
after leaving education. The first two columns of Table 6 show that the probability of
never transiting to employment is disproportionately high for females (on average 25
percent compared to 9 percent for males); this is particularly true in middle-income
countries in MENA, LAC and EECA. In contrast, there are not very pronounced
gender differences in AP and SSA12.
Not only are females less likely to transit to employment than males, but also
those who do in fact eventually transit are expected to experience substantially longer
12 Although these numbers might seem high, they are not too different from inactivity rates among
prime age individuals in the EU28 (as of 2014 these numbers were 8.5 per cent for males and 20.5 per
cent for males).
15
transition durations than men in several countries. This is shown in columns (1) and
(2) of Table 8 that report average median duration separately for boys and girls. Even
restricting to those eventually expected to transit, females suffer a disadvantage in
terms of duration to employment compared to males of around 13 months, i.e., over a
year (25 months versus 12 for boys).
4.4.2 School leaving age
Column (2) of Table 3 illustrates that in many countries in our sample, especially
from SSA and AP, a substantial fraction (on average 28 percent) of youth leave
school by age 15.
Columns (3) to (5) of Table 6 show that in almost all regions early school leavers
are disadvantaged in terms of the probability of ever transiting to employment relative
to those who stay in school longer (the probability of ever transiting is 86 percent for
early school leavers compared to 92 percent among those who leave education after
age 18). With the exception of MENA, where those with high levels of education tend
to transit at a slower rate, the disadvantage among early school leavers is also evident
in the duration of transition to employment, in columns (3) to (5) of Table 8. While
median transition duration is on the order of almost two years (23 months) for those
who left education by age 15, among those who leave school after age 18 is less than
one year (11 months). If school-leaving age precedes the legal age of employment this
could contribute to explain longer transition durations among early school leavers
compared to those who stay on longer. The circumstance that the probability of ever
transiting to a job is lower for early school leavers suggests some returns from
attending school longer (although unobserved heterogeneity is clearly an alternative
explanation).
4.4.3 Work prior to leaving education
A question that naturally arises in analyzing the transition from school to work is the
impact of involvement in work prior to leaving education. As illustrated in column
(4) of Table 3 the share of youth that worked while school is far from negligible (on
average 20 percent); this fraction is particularly high in low-income countries in SSA
and AP. Although the data do not provide information on the characteristics of work
16
performed (whether continuous or seasonal, its duration, the sector of employment,
whether market work or unpaid occasional work in the family farm/enterprise etc.), in
many cases those combining school and work began doing so prior to the minimum
working age, and therefore were child laborers according to national laws and
international standards.
While early labor market involvement might harm subsequent employability due
to its negative effect on schooling, it could also operate in the opposite direction:
learning-by-doing associated with work early in life might also provide valuable
human capital (in the form of both cognitive and non cognitive skills) and speed the
transition into the labor market. However, one has to be cautious in attaching a causal
interpretation to these estimates, as those with early work experiences might have
persistently low reservation wages, implying that they display persistently high labor
market attachment (see Hotz et al. 2002).
The results in Tables 6 and 7 (columns 6 and 7) show that working while in
school is associated to a greater probability of working later in life and typically
shorter durations. As in fact we are conditioning on school leaving age - hence, albeit
imperfectly, controlling for the detrimental effect of early work on school attainment -
this suggests that either low reservation wages or the experience associated with early
work involvement lead to greater employment in youth. This clearly does not mean
that these youth are better off during their life cycle, as the jobs that they eventually
attain are likely of worse quality relative to the jobs of those who did not work as
children.
4.4.4 Additional covariates
We fail to find consistently signed effects of the other covariates on the duration to
employment and on the probability of ever transiting to employment across the
countries in the sample. While, for example, higher GDP growth at the time of
entering the labor market appears to reduce the length of transition from school to
work in many of the countries analyzed, there are exceptions to this (e.g. in
Tanzania). Possibly higher economic growth, while being associated with stronger
labor demand and hence faster transitions, might also affect reservation wages or the
expectation of finding work in the future and hence increase duration transitions.
17
Mixed results are also found for the rural/urban dummy and for indicators for
father's education. Again, while higher levels of education among fathers might
positively affect the speed of transition or the probability of ever finding employment
through, for example, valuable labor market contacts or intergenerational persistence
in ability and human capital, higher father's education this might also negatively
affect durations and the overall probability of employment through an increase in
reservation wages.
5. Exploring the macro determinants of transition from school to work
In this section we attempt to gauge some evidence about the determinants of the
cross-country dispersion in the fraction of individuals predicted to never transit to the
labor market and in the duration from school to work.
To do so, we regress the estimated mean transition durations and the probabilities
of never transiting to employment or to stable employment (from Tables 4 and 5) on a
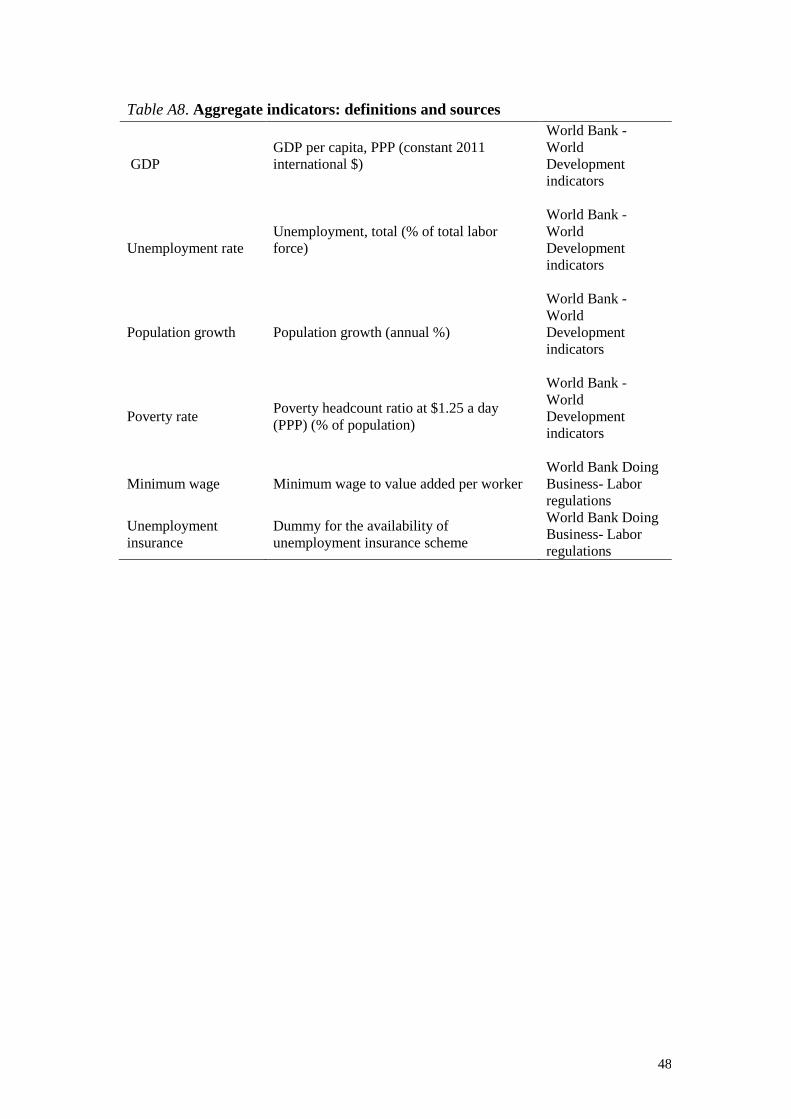
number of country-level characteristics from the World Bank Development
Indicators, the Worldwide Governance Indicators and the Doing Business Indicators.
These datasets provide a very large number of variables on country socio-economic
characteristics, measures of governance and ease of doing business.
Due to the limited number of observations, we are severely restricted in the
number of variables that we are able to include in the model. After some
experimentation we have decided to retain only the variables that have typically
statistically significant effects on the outcomes of interest (see Table A8). First, we
include log per capita GDP as a proxy indicator for country economic development.
As increased supply of labor is likely to affect youth employment at fixed labor
demand, we also include in the model the growth rate of the population. One would
expect higher population growth to increase both the duration of transition to work
and the probability of never transiting.
We also include the national poverty rate, as measured by the fraction of the
population living on less than 1.25 US dollars per day. Greater incidence of poverty is
likely to be associated with lower reservation wages and hence shorter durations.
Alongside these variables we include two variables capturing labor market
policies. First, we include a dummy for the availability of unemployment insurance.
Unemployment insurance schemes might increase durations via their positive effect
18
on the reservation wage, although they might eventually lead to better matches.
Second, in order to control for labor market regulations, we include a measure of
minimum wage bite (the ratio between the minimum wage and value added per
worker). This should capture higher labor costs that might in turn reduce firms'
hiring.13
All these variables are measured in the most recent year in which they are
available (typically between 2012 and 2014). Summary statistics for these variables
are reported in Appendix Table A9. These statistics refer to 22 countries out of the 23
for which duration models can be estimated (excluding the Occupied Palestinian
Territory, for which no information is available from published statistics).
The table clearly shows that population growth is much higher in SSA than in the
rest of the world (although MENA countries also have high population growth) as is
the poverty rate (followed by AP). Perhaps surprisingly, the minimum wage bite is the
highest in AP followed by SSA countries, although clearly this only typically applies
to wage workers in urban areas, i.e., a small share of the labor force. Finally,
unemployment insurance is typically more widespread in middle-income countries in
EECA, MENA and LAC compared to low-income countries in AP and SSA.
Regression results are reported in the top panel of Table 8. Each column refers to
a separate dependent variable and each row to a different regressor. In the model we
include dummies for missing values of the included variables. For ease of
interpretation we express all variables in terms of their standard deviation. We also
weight observations by population weights using GLS.
We start by focusing on average duration to the first employment spell in column
(1).14 Although national economic development, as measured by per capita GDP,
appears to speed the rate of transition, the coefficient is not statistically significant at
conventional levels.
Row 2 illustrates that a one standard deviation increase in the rate of population
growth (around 1, i.e. half of the difference between EECA and SSA) leads to an
increase in average duration of around 17 months. The effect of the poverty rate is the
13 The threat posed by minimum wages to the employment of youths, for whom the statutory minimum
wage is more likely to be binding than for adults, has long been recognized, as employers in
competitive markets are predicted to respond to an increased minimum wage by reducing labor
demand. This prediction however has not found broad empirical support (see seminal work by Card
and Krueger 1994). 14 Results not reported are very similar if we use median as opposed to mean durations.
19
opposite: a one standard deviation increase the poverty rate (20 percentage points,
again not too far from half of the difference between SSA and EECA) leads to a
reduction in transition durations of around 17 months.
We next turn to the policy variables. Both an increase in minimum wage bite and
the availability of unemployment insurance lead to an increase in the length of
transitions, although only the latter displays a statistically significant effect. An
increase in the fraction of the population covered by unemployment insurance of one
standard deviation (0.40, again roughly the difference between SSA and EECA) leads
to a rise in unemployment insurance of around six months.
Column (2) reports results for the average transition duration to the first stable
employment spell. Coefficients have typically the same sign as those for the duration
to the first employment spell (whether stable or not), although they are also typically
larger in magnitude. Overall, it appears that the same factors that explain differentials
in transition durations to employment across countries also explain differentials in
transition durations to stable employment.
Column (3) focuses on the probability of ever transiting to employment.
Regression coefficients are all statistically insignificant, although mostly of the
expected sign. Column (4), that focuses on the probability of attaining stable
employment, is perhaps the most informative. It appears in particular that greater
incidence of poverty hampers young peoples’ probability of finding stable
employment (with a one standard deviation increase in the poverty rate leading to a
rise in the probability of never attaining employment of 14 percentage points).
Unemployment insurance (UI) acts in the opposite direction, with a one standard
deviation increase in the fraction of the population covered by UI leading to a rise in
the probability of finding stable employment over one's life of six percentage points.
Results in the bottom panel of Table 9 include in addition region fixed effects. In
practice we only exploit the variation across countries in the same region for
identification, easing some concerns that the estimates are driven by unobserved
differences across countries with different unobservable characteristics. Although
results are less precise, they are qualitatively similar to those obtained without the
inclusion of region fixed effects in the top panel, lending some credibility to the
estimates discussed above.
Overall, results in Table 8 show that demographic and structural economic
factors are major determinants of the transition from school to work in low and
20
middle-income countries. While greater pressure on the labor markets induced by
higher population growth leads to longer durations in low income countries compared
to middle income countries, these effects are largely compensated by much lower
reservation wages driven by widespread poverty and lack of unemployment insurance
that together speed the transition from school to work. As for MENA, where durations
are remarkably high, it appears that the combination of high population growth and
relatively generous unemployment insurance are largely responsible for long
durations.
Although it appears that unemployment insurance lengthens transition durations,
there is also evidence that the support to the unemployed offered by unemployment
insurance schemes leads to an overall increase in the probability of ever finding
employment and in particular stable employment. Although one has be cautious in
interpreting these estimates as causal, this might point to the negative effects of short
durations on the probability of finding stable employment, highlighting the trade-off
that policy makers face in these countries.
5. Summary and conclusions
This paper uses ILO STWT-survey data to provide novel systematic evidence on
duration and end point of the transition from school to work in a sample of 23 low and
middle income countries around the world, and to investigate some of the
determinants of the differential lengths of transition across these countries.
Although transition durations are on average not very dissimilar from those in
high-income countries, notably Europe, on the order of two years, there is substantial
heterogeneity across the countries in the sample. In particular, countries in the Middle
East and Northern Africa region display markedly longer transition duration than all
other countries, in line with high rates of youth unemployment. Moreover a
substantial fraction of youth in the low and middle-income countries under analysis -
on average 10 percent - are expected to never find employment, let aside quality
employment, over their life cycle.
Durations as well as the risk of never transiting to employment over one's life
cycle are considerably higher among women compared to men, although we remain
agnostic on whether these differentials reflect preferences or constraints. There is also
a clear positive association between levels of human capital, notably school-leaving
21
age and work prior to leaving school, on labor market success, measured by a greater
probability of finding employment and a shorter search spell.
In closing we have assessed the determinants of the durations and end points of
the school-to-work transition across the countries analyzed. Consistent with
predictions from theory, we find that demographic and structural economic factors are
major determinants of the transition from school to work in low and middle-income
countries. While higher population growth leads to longer durations in low income
countries compared to middle income countries, this effect is more than compensated
by widespread poverty and lack of unemployment insurance that together depress
reservation wages, speed the transition from school to work and reduce the probability
of finding quality employment over one's life cycle, especially in Sub -Saharan Africa
and Asia and the Pacific regions.
Although, given the limitation of the data, we are unable to carry out a full
welfare analysis, this evidence is suggestive of the circumstance that in low income
countries short search durations induced by low reservation wages and lack of social
protection lead to poor labor market matches that harm young workers' probability of
finding employment, and in particular stable employment, in the long-run, in turn
contributing to persistent social and economic exclusion.
22
References
Bender, Stefan, and Till von Wachter (2006). “In the Right Place at the Wrong Time:
The Role of Firms and Luck in Young Workers' Careers”, American Economic
Review, 96(5): 1679-1705.
Card, David, Raj Chetty and Andrea Weber (2007). “The Spike at Benefit
Exhaustion: Leaving the Unemployment System or Starting a New Job?”, American
Economic Review, 97(2): 113-118.
Card David, Krueger Alan B., 1994. “Minimum Wages and Employment: A Case
Study of the Fast-Food Industry in New Jersey and Pennsylvania”, American
Economic Review, Vol. 84, No. 4 (September), pp. 772–93.
Cunningham, Wendy, and Javier B. Salvagno (2011). “Youth employment transitions
in Latin America”, World Bank Policy Research Working Paper Series No. 5521.
Ellwood, David T. (1982). “Teenage Unemployment: Permanent Scars or Temporary
Blemishes?”, in The Youth Labor Market Problem: Its Nature, Causes, and
Consequences, Freeman R.B. and D.A. Wise (eds.), pp. 349-390. Chicago: University
of Chicago Press, 1982
Gregg, Paul, and Emma Tominey (2005). “The wage scar from male youth
unemployment”, Labour Economics 12(4): 487-509.
Hotz V.J., Xu, L., Tienda, M., and Ahituv A. (2002), “Are There Returns to the
Wages of Young Men from Working While in School?”, Review of Economics and
Statistics 2002 84:2, 221-236
ILO (2014) Global Employment Trends for Youth 2014: The risk of a jobless
recovery, Geneva.
ILO (2013), Global Employment Trends for Youth 2013: A generation at risk,
Geneva.
Jenkins, Stephen P. (2005). “Survival Analysis” mimeo, Institute for Social and
Economic Research, University of Essex, Colchester
Lancaster, Tony (1992), The econometric analysis of transition data, Cambridge
University Press (CUP).
Lalive, Rafael (2007). “Unemployment Benefits, Unemployment Duration, and Post-
Unemployment Jobs: A Regression Discontinuity Approach”, American Economic
Review, 97(2): 108-112.
Machin, Stephen, and Alan Manning (1999). “The Causes and Consequences of
Longterm Unemployment in Europe”. In Handbook of Labor Economics, Elsevier,
Notes. The table reports estimates of the probability of failure (never transit to employment after leaving school) from a split-cure model, separately by country. A log-log”
specification is adopted. In formulas, the probability of never transiting is modeled as exp(-exp(X'b)), where X denotes the covariates. Estimates of the vector b reported in
the Table. Dummies for missing value of all included characteristics also included (coefficients not reported). Standard errors in brackets. ***,**,*: significant at 1, 5 and 10
percent level respectively.
41
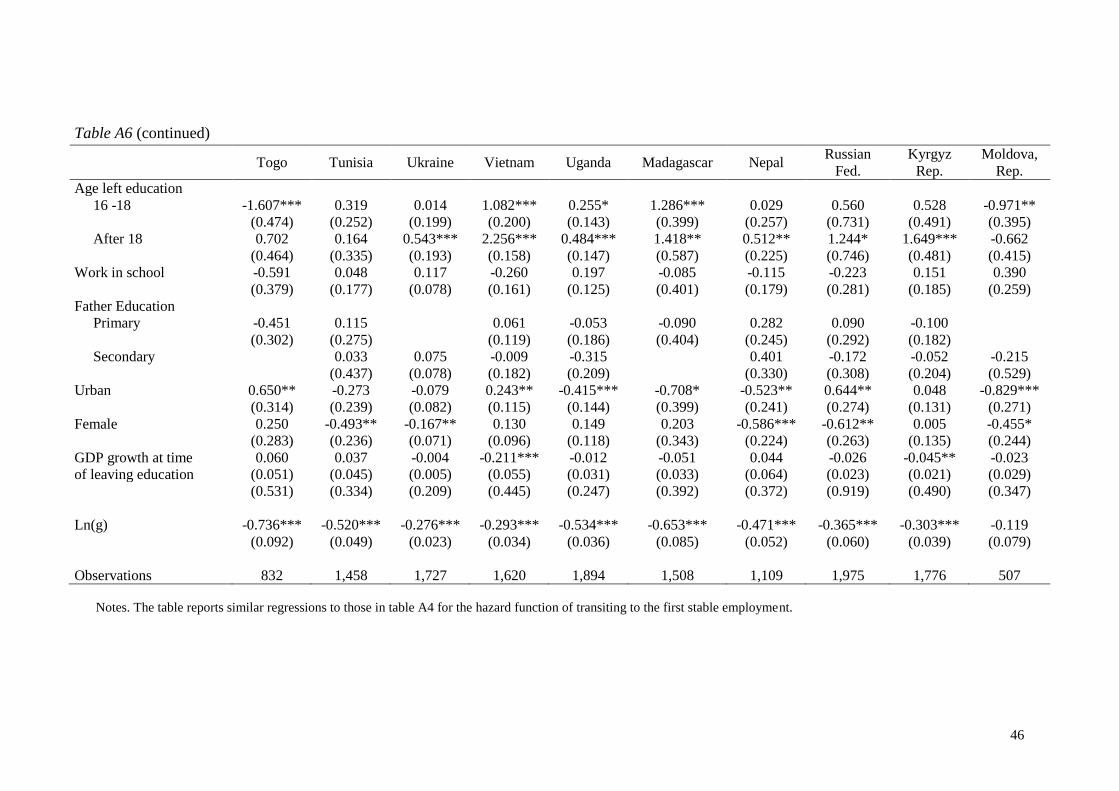
Table A4. Estimates of split-cure model – First employment - Proportional Weibull hazard function
Notes. The table reports estimates of the hazard function of transiting to employment after leaving school from a split-cure model, separately by country, except for Brazil for
which estimates are derived from a standard proportional Weibull hazard model. The hazard function is parameterized as g t g-1 exp(X'm), where t is time elapsed since leaving
school . . Estimates of the vector m and log(g) reported in the Table. See also notes to Table A3.
43
Table A5. Estimates of split-cure model – First stable employment - Probability of never transiting