PATIENT ATTENDANCE AT SOWETO DENTAL CLINICS BEFORE AND AFTER INTRODUCTION OF FREE DENTAL SERVICES Ahmed Bhayat A research report submitted to the Faculty o f Health Sciences, University of the Witwatersrand, Johannesburg, in partial fulfilment of the requirements for the degree of Master of Science in Dentistry. Johannesburg 2000 ■i i
Transcript
PATIENT ATTENDANCE AT SOWETO DENTAL CLINICS BEFORE AND AFTER INTRODUCTION OF FREE DENTAL SERVICES
Ahmed Bhayat
A research report submitted to the Faculty o f Health Sciences, University of the Witwatersrand, Johannesburg, in partial fulfilment of the requirements for the degree of Master of Science in Dentistry.
Johannesburg 2000
■i i
DECLARATION
I, AHMED BHAYAT, declare that this research report is my own work. It is being submitted
in partial fulfilment for the degree o f Master of Science in Dentistry in the University of the
Witwatersrand, Johannesburg. It has not been submitted for any degree or examination at this
or any other University.
A. BHAYAT
The information reported in this report was collected from the Lillian Ngoyi clinic in Soweto
and the report was completed with the help of the Medical Research Council and
University of the Witwatersrand Dental Research Institute, Johannesburg.
DEDICATION
I dedicate this report to my family and
friends and thank the Almighty God for
the patience and strength He has given to me.
ii
Presentation arising from this research report;
First Primary Health Care Conference o f Gauteng, Baragwanath Nursing College, November 1998. Bhayat A, Cleaton-Jones PE. Patient attendances before and after the introduction of free dental treatment in the Soweto clinics.
ABSTRACT
Knowledge of how attendance loads at dental clinics have changed since free dental services
were introduced in April 1996 is vital for the proper implementation of services. The objective
of this study was to compare monthly attendances in Soweto dental clinics one year before and
one year after the introduction of free dental treatment.
Details of the total number of attendances, casual and booked, at all ten dental clinics in
Soweto were noted from the central records at Lillian Ngoyi clinic, as well as the number of
operators. These data were stored in the Wits computer network for analysis with SAS and
Prism3 computer software.
A patient attendance index was defined as the number of attendances per clinic corrected for
the number of operators. Patient attendance fluctuated by day and season throughout the
study period. There was a mean 46% increase in patient attendance when the years before and
after free treatment were compared. Casval patient attendance [pain and sepsis treatment]
increased by a mean of 52% and booked attendance [restorative treatment] increased by 8%.
There was a mean increase of 19% in the patient to operator ratio.
Casual patient attendance has increased the workload on operators and has kept the booked
attendance at a low level. Furthermore, the preventive school programmes can no longer be
maintained as a result of the staff workload. This could have serious consequences for the
future generations and operators alike.
ACKNOWLEDGEMENTS
I wish to thank the following people:
My wife for her patience and help
My parents for their support
All rny colleagues and dental assistants who helped make this research a reality
And last but not least Prof. Cleaton Jones, for his assistance and patience in helping me with
this project.
V
TABLE OF CONTENTS
Page
DECLARATION i
DEDICATION ii
PUBLICATIONS AND PRESENTATIONS iii
ABSTRACT iv
ACKNOWLEDGEMENTS v
TABLE OF CONTENTS vi
LIST OF FIGURES viii
LIST OF TABLES ix
1.0 INTRODUCTION 11.1 Background 11.2 The user fee models 41,3 The primary health care approach 61.4 Oral health in PHC 81.5 Results from countries adopting PHC 91.6 Health policy in South Africa 101.7 Oral health in South Africa 111.8 Points of service delivery 141.9 Definition of free dental care 141.10 Type of dental care being offered 151.11 The operators who work in the clinics 161.12 Barrier to using services 171.13 Objectives of this study 18
2,0 METHODS AND MATERIALS 202.1 Study authorisation 202.2 Research location 202.3 The times and days that the dental services are available 242.4 Research data 252.5 Data management 26
VI
3.0 RESULTS 273.1 Analysis of independent effects on dependent variables 273.2 Total number of patient attendances 273.3 Casual patient attendances 323.4 Booked patient attendances 3 53.5 The casual to booked patient ratio 383.6 Patient index numbers 41
4.0 DISCUSSION 444.1 Data collection 444.2 General remarks 444.3 Results compared to similar studies 454.4 Interpretations 464.5 Conclusion 47
APPENDIX A-Physical addresses of the clinics 48
APPENDIX B-Soweto clinic facilities 49
References 50
vii
LIST OF FIGURESPage
Figure 1.1 An operator, dental assistant and patient in a Soweto clinic 16
Figure 2.1 Location of Soweto in relation to other major cities in Gauteng 20
Figure 2.2 Location of the ten study clinics in Soweto 23
Figure 2,3 Patients waiting for treatment in a dental clinic 24
Figure 3.1 Total number of patients by clinic, month and year 31
Figure 3.2 Number of casual patients by clinic, month and year 34
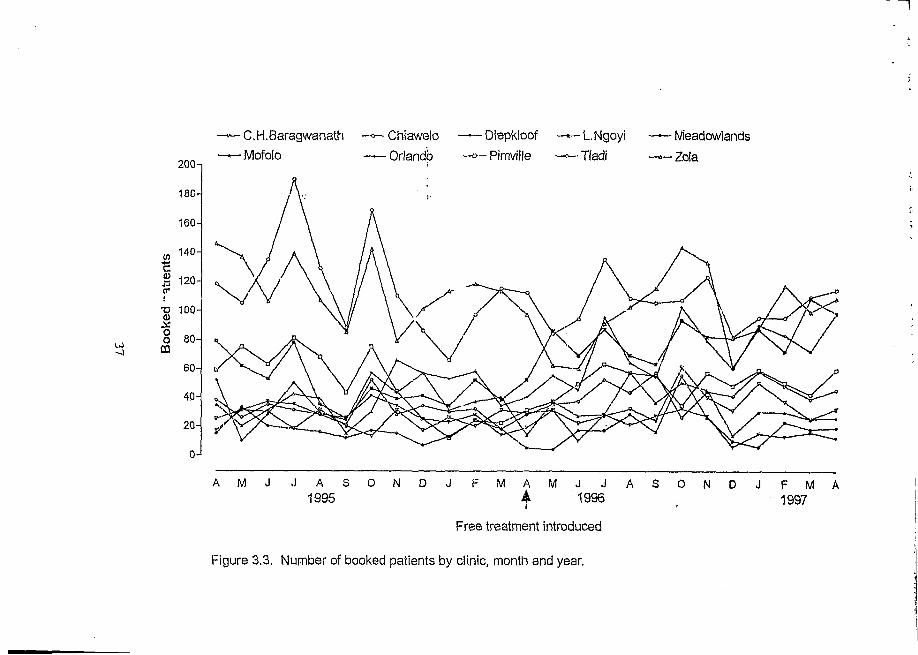
Figure 3.3 Number of booked patients by clinic, month and year 37
Figure 3.4 Casual to booked patient ratio by clinic, month and year 40
Figure 3.5 Mean numbers and standard deviations of patient index 43by clinic before and after the introduction of free treatment
viii
LIST OF TABLES
Page
Table 3.1 General linear model analysis results 28
Table 3.2 The total number of patients seen at the study clinics 30
Table 3.3 The total number of casual patients seen at the clinics 33
Table 3.4 The total number of booked patients seen at the clinics 36
Table 3.5 The casual to booked ratio at the ten study clinics 39
Table 3.6 The number of operators to patient ratio (PI) for all of the clinics 42
ix
CHAPTER ONE
INTRODUCTION
1.1 Background
Health has been defined as state of complete physical, mental and social well-being and not
merely the absence of disease or infirmity [WHO, 1946]. This considers health to be a multi
factorial interaction of different issues. For example, equity may provide quality health care to
all communities, but poverty, sanitation, freshwater and adequate nutrition also play vital roles
in the health of people; medical resources themselves influence health, even accessibility to the
health provider may influence the utilisation of the health service.
Equity in health implies that everyone should have a fair opportunity to attain their full
potential and, more importantly, no one should be prevented from achieving this po^ntial
[WHO, 1986].
Inequity equates to injustice. Despite efforts to try and make health systems more equitable,
in poorer countries and communities, peoples’ health and the access they have to health care
are getting worse [Mautsch et al., 1995].
A high priority is to get international communities and national governments to make a
commitment, through positive actions, towards solving some of the causes of poverty
[Mautsch, 1995]. Mautsch further suggested that once poverty is eradicated, problems
associated with poverty will be reduced. Some of these problems include, unemployment, low
1
income, inadequate diet, limited education and so on. If these situations decline in a certain
community, then other conditions such as overcrowding, lack of fresh water and sanitation,
poor housing and even poor personal hygiene can be improved. This, in turn, can lead to a
healthier lifestyle by the reduction of infectious diseases, pollution, stress, insecurity and so on.
However, poverty is a world wide problem affecting all countries. While it was predicted that
by the year 2000, the number of people, world wide, below the poverty line would be reduced
by 300 million [Mautsch et a l, 1995], the World Bank suggested, that in reality, the numbers
in poverty increased from 1,051 million to 1,133 million between 1985 and 1990
[Mautsch et al., 1995].
Therefore, if poverty is increasing, its consequences regarding health should also be increasing,
therefore means to cope with these problems must be found. Bearing in mind the cost
of health care, different countries have introduced various mechanisms to enable all people,
irrespective of economic status, access to basic health care.
For example, in a developed country like Britain, basic health care is provided by the National
Health Insurance System which is a model for financing and is not tied to any particular model
for provision [Price, 1994]. In this system, the whole population has access to health care
which is funded partly by contributions of the employed and their employers, and partly by
a government subsidy on behalf of the unemployed. The National Health Insurance System
(NHIS) then purchases care either through independent providers or through the public
provider. According to Price [1994], this system which has evolved over a number of years,
is the system that many other countries would like to utilise.
2
i » e • . . . v . • *. e • •» -* * * ( > » < • t1' « tf
In principle this system is funded in the early stages exclusively by contributions of employers
and employees so that only the employees are covered by the NHIS while the rest of the
population receive care via the public sector funded by taxes. As the economy of a country
grows and the employment rate in the formal sector increases, the relative size of the NHIS
increases compared to public-funded health care, until eventually the employed can largely
cross subsidise the unemployed within the same scheme with the government providing only
a modest subsidy. Therefore, in poorer countries with high unemployment rates this system will
take years to implement. Alternative systems must be explored in order to provide
populations in poorer countries with accessible health care.
In countries in which the government is unable to provide free health care for all the people,
other means of gaining revenue in order to sustain the costs of inflating health care must be
used. Many of these countries opt for the user fee system [Nolan and Turbat, 1995].
I f this policy is adopted, questions are: who should determine this fee and will this fee be
accepted by the users of that service ?
User fees and their role in the delivery of health care have always been controversial issues.
Some countries approve while many do not. In this research report I will look at some of these
countries with particular emphasis on African and Commonwealth countries.
A number of African countries, for example Ethiopia and Namibia, have used the user fee
system since the 1960's [Nolan and Turbat 1995]. Since the 1980's, other African countries
have also implemented some form of user fee system; 14/15 African countries surveyed by
Russell and Gilson [1995] and 28/37 African countries surveyed by Nolan and Turbat [1995]
have been found to be utilising the system. However these two articles fail to state which
countries were surveyed.
The reason given by policy makers for introducing a user fee system, is that it aids in raising
revenue needed for improving quality services and extending the coverage of this
service [Nolan and Turbat 1995; Russell and Gilson 1995]. This revenue also ensures
sustainability of the health system which LaFond [1995] defined as “the capacity of the
health system to function effectively over time with a minimum of external inputs.”
Achieving this type of sustainability requires the capacity to:
- secure sufficient resources
- use resources effectively and efficiently to meet health needs
- perform these functions on a continuous basis
- perform these functions with minimal external input [LaFond 1995]
The raising of revenue by introducing the user fee system, is not on its own sufficient, to
ensure the sustainability of health services; additional needs include resources such as
equipment, manpower and facilities. An interesting point is that according to international
analysts a user fee system to improve services actually improves utilisation of the service [Shaw
and Griffin 1995],
1.2 The user fee system models
Nolan and Turbat [ i995] have identified two broad models of user fee systems that have been
utilised in African countries.
4
“The standard model” assumes that the fees produce resources, and benefits to efficiency, as
well as equity. Efficiency benefits because the cost of health care ensures correct utilisation of
the referral systems in place, and allows the reallocation of resources to the more cost-effective
primary health care programmes. Equity benefits result from, first, the utilisation of resources
in ways that benefit the poorest, and secondly., from the use of exemptions within the fee
systems to protect the poor from their full burden [Gilson et al 1995].
In contrast, “the Bamako Initiative (BI) model” emphasises that revenue should be raised and
controlled at the primary level through community-based activities which are national in scope.
Community participation in management is critical in ensuring that revenues are used to address
the persistent quality weaknesses of primary care. In this model, the particular financing
mechanism adopted should be decided by the community.
Countries may use either of the two models, or both of them simultaneously. Kenya initiated
the “BI programme” in 1989 to fund and sustain community level pharmacies within some
districts and a national “cost sharing programme”, which was based on the standard model
[Gilson 1997], The BI programme utilised earlier experience with community-based health care
initiatives while the cost sharing programme reversed the previous policy of no charges at
government facilities and gradually introduced fees at all except lowest level of existing
facilities [Gilson 1997]. From this the Kenyan government has recovered 2,1% of the recurrent
government expenditure on health services.
Having discussed the user fee system, let us consider the types of treatment that people should
5
be paying for remembering that it is generally accepted that a core health care package, like the
Primary Health Care approach, should be provided at a minimum cost or at no cost at all
[Commonwealth 1989].
1.3 The Primary Health Care (PHC) approach
The PHC programme is one of the pillars of public health and consists of core health services
that are essential for the well being of communities. This approach provides three phases of
overlapping support [Mahler, 1981].
-The first phase is the district, where people are in partnership with the state.
-The second phase focuses on the intermediate level; which supervises, controls and
supports the districts technically,
-Finally, during the third phase, the central level provides strategic support to the
intermediate (regional or provincial) level and helps interpret decision-makers’ policy.
The PHC approach is based on five pillars: equitable distribution, community involvement,
focus on prevention, use of appropriate technology and a multi-sectoral approach.
PHC starts with people and requires their involvement in solving multi-faceted health
problems [Gilbert 1995]. PHC can be described as first contact longitudinal care that, is
comprehensive and people- orientated instead of being disease or problem-specific. It addresses
the most common health problems by providing preventive, curative or rehabilitative services.
This then ensures well-being and maximum health [Isman 1993].
PHC should be provided at minimum, or no cost at all, in order to ensure that people from
lower income groups have access to these services. Ideally, governments should be solely
6
financially responsible for providing a core health package for its citizens. However, national
affordability problems may prevent government from fulfilling this requirement and so, at the
very least this essential package should be offered to the poor at little or no cost at all. This
approach will not only preferentially address the needs of the poorest communities but also
improve the cost-effectiveness of public sector provision [Gilson 1998].
For example, in Brazil, Teller and Freedheim (1994) reported an analysis of the success of
a rural preventive health programme. This programme was initiated and implemented in Ceara
State, one of the poorest regions in Brazil in 1987 as part of an emergency employment
creating programme and involved the hiring of “health agents” who received a three month
training programme followed by substantial practical training supervised by nurses. By 1992,
the state had a 36% decrease in infant mortality and had tripled the coverage of measles and
polio vaccinations. This analysis shows that affordable PHC programmes, involving, and
organised by the communities results in the utilisation of those services.
This is the same approach used by the Commonwealth countries. The Commonwealth consists
of fifty independent countries with a population of more than one billion people
[Commonwealth, 1989]. These countries have different nationalities, cultures, religions and are
in different stages of socioeconomic development, therefore the medical and dental conditions
and needs in Commonwealth countries differ significantly. No single policy can be considered
as an ideal policy for all these countries. However, the PHC approach has been selected as the
one health care system that can provide a framework for all these countries [Commonwealth,
Bearing this in mind, the PHC system was also adopted by the African Health Development
Framework after being approved and accepted by the African Health Ministers in 1985. These
ministers perceive this approach as an effective and realistic tool to accelerate the achievement
of “Health for all Africans”[Monekosso 1989],
1.4 Oral Health in PHC
Health is a basic human right and oral health is a significant component of general health
[Mautsch et al., 1995]. Oral health and its impact on individuals and society in terms of pain,
discomfort, social and functional limitation and handicap, and the effect of the quality of life
cannot be overemphasised. Therefore, oral health forms an integral part of the PHC approach.
All countries that utilise this approach have included oral health in their programme. The oral
health is improving in developed countries but getting worse in developing countries. For
example, in the African continent, in which a country like Zambia that had a national DMFT
for 12-year-olds of 0,1 in 1971 increased to 2,3 in 1980 [Pilot 1987]. Another developing
country, Zimbabwe, had a national DMFT for 12-year-olds of 0,6 in 1971 and this increased
to 1,3 in 1991 [Pilot 1987]. Several other articles reporting national surveys have been
published by Cahen et al [1989] and Booth [1989] which indicate that socio-economic status
plays a role in caries prevalence.
The Berlin Declaration announced in 1992, in Berlin, reiterated this by concluding that oral
health is improving in developed countries but deteriorating in developing countries. This
declaration further indicated that the oral health of children in the poorer communities of
affluent countries is not improving. For example, the average prevalence of caries in 12-year-
olds is 53,8% in the urban areas of South Africa compared to 71% in Transkei [Chikte et al,
1990].
The Commonwealth African countries are typical examples of underdeveloped countries and
experience those sentiments expressed at the Berlin Conference. Furthermore, these countries
have a number of barriers and constraints when trying to provide and improve oral health care.
Akpabio [1990], described these as follows:
1) Low priority given to oral health
2) Inappropriate or no oral health policy
3) Inappropriate strategy and technology
4) The oral health manpower
5) Inadequate and scarce resources
6) The ADDS problem
Although many of these problems can be reduced, the need for a realistic oral health budget
cannot be over emphasised. Therefore economic constraints determine the coverage achieved
by the health services.
1.5 Results from countries adopting PHC
Published information to show a convincing effect of oral PHC on dental caries is scanty.
In Indonesia, after the introduction of the PHC approach with commitment to community
health programmes, theDMFT in 12-year-old children dropped from 1,9 in 1979 to 0,7 in 1984
[Be Kien Nio 1992]. The missing teeth component of the DMFT was significantly lower than
the Initial sample group. This indicates that, once the programme was introduced, less teeth
9
were extracted. This could be as a result of better prevention methods, education and an
increases in the number of restored teeth.
Another example is Sri Lanka, also a Commonwealth country with a developing economy.
Here the DMFT for 12-year-olds was 1,9 in 1984. Once the PHC approach was introduced,
the DMFT for that age group reduced to 1,4 by 1994 [Saparamadu 1996].
These examples show that within ten years some developing countries reduced their DMFT
scores, instead of these increasing, according to the trend held to be typical for developing
countries [Pilot 1987].
Hence the PHC approach has potential as an effective tool in promoting oral health in
developing countries.
1.6 Health policy in South Africa
South Africa, having a population o f approximately 44 million people, [National Health Trends
1997] consists of urban and rural communities. Since the election of the African National
Congress (ANC) as the government in April 1994, South Africa has amended its health care
policy. The new government set itself the task of developing a unified health system capable
o f delivering quality health care to all citizens, efficiently and in a caring environment. In order
to achieve these goals, the government decided to implement the PHC approach for all citizens
without any user fee. Evidence of the effect o f this is needed but it resulted in an increased
attendance at many of the free community health centres a trend highlighted by a study done
at Hlabisa Hospital in KwaZulu/Natal by Wilkinson et a$.[1996]. Their assessment of the effect
10
of free health care for children under six years and pregnant women, showed a 77,3% increase
total attendance at the clinic.
1.7 Oral health in South Africa
Oral health is an essential component of general health and consequently is part of the PHC
package. Oral disease is an important public health problem. The reasons are the high
prevalence, the impact it has on individuals in terms of pain, discomfort and handicap and the
effect it has on the quality of life [Mautsch 1992].
Therefore, the introduction of free PHC included free oral health care as well. The decision was
based on recognition that in South Africa, dental caries and periodontal diseases remain the
most common diseases affecting the population. More than 90% of adults suffer from dental
caries while approximately 93,5% have periodontal problems [Technical Committee for
Oral Health National Policy 1997]. Dental caries is common in children too, according to the
only national oral health study done in 1988/89, an average of 55% of 12-year-olds of the
population had caries while among 6-year-olds the prevalence was 62% [National Oral
Health Survey 1992]. What is striking about caries in South African children is that untreated
caries, theD (d) component oftheDMFT (draft) score, predominates. As an example the mean
DT score in 15-year-old South African children is 0,97 [National Oral Health Survey, 1992]
compared to 15-year-olds inBritain who had a mean DT of 0,14 [Booth 1989]. Within South
African population groups the DT scores vary. The DT scores of the white population in all age
groups, although higher than their British counterparts, is considerably lower than that of the
black, coloured and Indian children. The reason for this could be the increased utilisation of
dental services by white children as compared to the other races.
11
)
The M component of the DMFT, which represents missing teeth, also fluctuates between the
races. The black and coloured children have the highest mean value for all age groups [National
Oral Health Survey 1992]. This indicates that extraction was the choice of treatment for them.
The findings of 15-year-olds in South Africa of all race groups is still much higher compared
to those found in 15-year-old British children [Booth 1989].
The F component of the DMFT of South African children show that the white population
has utilised dental services more than any other race. However, 15-year-old British children
when compared to South African 15-year-olds, have on average, more than double the number
of restorations [Booth 1989]. This supports the results obtained from other studies wmch
indicate that developed countries have better oral health compared to developing countries.
In South Africa there is a public/private mix of oral health care delivery so patients may
utilise either the private sector or the public sector, the latter comprising government clinics and
state hospitals. All the services in both sectors are carried out by qualified dentists, dental
therapists, oral hygienists and dental nurses.
Two systems of payment are currently in use in South Africa. Fee-for-item of service is
predominantly in the private sector, whereas in the State sector, salaried services are the
predominant form of payment [Hobdell et al., 1994]. The spread between the two systems is
unbalanced. Approximatedy 68% of dental practitioners are in the private sector [National Oral
Health Survey 1992] which is utilised by 20% of the population; the remaining 80% of the
population uses the state services [Ntsaluba 1995]. This produces a heavy workload for
those employed in the state services.
In the planning of any health services the normative needs of populations must first be
determined. The assessment of such needs has to be based on collaborative efforts between
users and providers. This in effect, should lead to an agreement of goals and targets that reflect
the peoples perceived needs. For oral health the World Health Organisation (WHO) goals for
the year 2000 have been accepted world-w'de as reasonable as are the South African Goals
[National Oral Health Survey 1992]. These goals are:
Goal 1: 6-year age group
To ensure that 50% or more of the children in this age group in South Africa are free of caries.
Goal 2: 12-year age group
To ensure that the mean DMFT of children in this age group in South Africa will be 1,5 or less.
Goal 3: 20-year age group
To ensure that 60% or more of those in tms age group in South Africa will retain all their teeth
(excluding third molars)
Goal 4: 35 to 44-year age group
To reduce the level of the edentulous population to 6%. In addition to this, at least 80% of
those in this age group in South Africa should retain a minimum of 20 functional teeth.
Goal 5: 60 to 64-year age group
To reduce the level of the edentulous population to 21%. In addition to this, at least 60% of
those in this age group in South Africa should retain a minimum of 20 functional teeth.
Goal 6:
In addition to the above five goals, to strive to obtain useful national data in respect of the
following oral conditions before 1995:
(i) Premalignant lesions and squamous cell carcinoma of the oral cavity;
(ii) trauma of the face and oral structures;
(iii) malocclusion at the age of 12 years.
1.8 Points of service delivery
South Africans receive health care either from private practitioners or from State funded
hospitals and clinics. The private practitioners offer primary (basic primary health care, eg.
extractions ), secondary (intermediate care, eg. restorations), or tertiary health care (specialised
treatment, eg. crowns and bridges), at a cost laid down by the South African Dental and
Medical Associations and the Medical Aid schemes. Here too imbalance exists; in the 1990/91
financial year, the government spent approximately R73 million on health care while the
medical aid sector spent approximately R600 million in the same year [Price, 1994]. From this
Price calculated that approximately 32-times more is being spent per medical aid beneficiary
than per public sector beneficiary. This imbalance needs to be rectified to ensure equitable
services for all service users. The provision of free dental services is an attempt to achieve this.
1.9 Definition of free dental care
Prior to April 1996 anyone needing dental treatment who visited a state-funded dental
department had to pay a fixed fee that ranged from R8.00 to R13.00 depending on whether it
was a hospital, an academic institution, or a community based clinic. Since April 1994, all
state-funded clinics offer free primary health care. All permanent residents of South Africa,
whether they have private health insurance or not, have equal right of access to the publicly-
fiindcd PHC system free of char ge at the point of service. Patients receiving secondary and
tertiary health care services at public health facilities still pay user fees as determined by the
State.
1,4
1.10 Type of dental care being offered
Patients attending the state-funded dental clinics do so for various different reasons. According
to Van Wyk et al [1993], patients seek dental treatment for the following problems in order of
utilisation:
Relief of pain and sepsis
Restorations
Routine check-ups
Scaling and polishing
Orthodontic treatment
Dentures
The dental clinics in Soweto offer all the above services daily. When a patient attends any of
the dental clinics, he/she is first examined. Depending on the complaint treatment is planned.
I f this is an extraction, treatment will be immediate, ie. on the same day. If treatment is a
restoration or scaling and polishing, then this will be by appointment on another day. If
orthodontic treatment is needed an appointment to be examined by the specialist will be made.
If dentures are needed and the patient qualifies for a state subsidised denture, then an
application tbrm is completed. Once the form is approved (between 6 to 8 weeks), then the
patient is notified and treatment is given by appointments.
15
1.11 The operators who work in the clinics
All of the Soweto clinics are operated by qualified dental personnel. There is at least one
operator and dental assistant in each of the clinics on any given day.
Figure 1.1. An operator, dental assistant and patient in a Soweto clinic.
An operator is a dentist or dental therapist who is employed either full-time or part-time by
the Gauteng Oral Health Services. A dentist has obtained a dental degree recognised by the
Health Professionals Council and is qualified to diagnose and treat all forms of oral
diseases and to restore all dental defects. The length of training is usually five-and-a-half years.
A dental therapist is one who has studied for three years at one of the two dental institutions
in South Africa that train such individuals. They are qualified to do limited dental treatment,
namely examinations, routine extractions, simple restorations and scaling and polishing They
are also capable of managing emergency situations that may arise in the dental surgery. A dental
assistant is one who aids an operator to accomplish the various tasks. Some of these
assistants have qualified at recognised institutions and have appropriate diplomas, while
others have received in-service training. Each clinic has variable numbers of operators which
may fluctuate, depending on circumstances. For example, operators on leave, operators
resigning, operators being transferred and so on. If an operator goes on leave, or is sick, a
relief operator will be sent to that clinic to help treat the patients.
There is usually at least one “extra” operator within the dental services on any day to help
relieve at clinics where there may be a need. If there are no “extra” operators, the clinic will
have to junction with reduced staff. Hence on those days the workload per operator increases.
1.12 Barrier to using services
A number of articles have been written which examine the effects of user fees on the utilisation
o f services. The cost of dental services is the most significant barrier to the utilisation of the
dental service according to Cohen [1989], therefore, with free dental services, the utilisation,
ie. the attendance must increase. This is exactly what Wilkinson et a l, [1996], showed in their
study in KwaZulu/Natal before and after the introduction of South Africa’s free health
care for children and pregnant mothers. They reported a 44,7% increase in new patient
attendances and a 77,8% increase in total patient attendance.
However contrary to Cohen’s views [1989], a study by Faber et al., in the 1988/89
National Oral Health Survey [1993] reported that financial barriers are not the most
important barriers in South Africa. Their results indicate that patients stated lack of “perceived
17
need” and “anxiety and fear” as the two main barriers to dental treatment. This was followed
by financial considerations. In the same study the respondents were divided into low income
and high income groups. The results showed that twice as many low income group respondents
gave financial barriers as the most important reason for not visiting the dentist, as compared
to the high income group. Therefore tor the low income group, cost of services plays a pivotal
role in the utilisation of those services.
In Britain, after free healthcare for mothers and children were introduced in 1948, patient
attendances increased dramatically, but by 1998 50 years later, the numbers reached a plateau,
and have now decreased [Costello 1997]. It is possible that in South Africa, the same trend may
occur.
What the literature review has shown is that there is wide acceptance of the principle of
access to health care by inhabitants of a community; that user fees are a barrier to a greater or
lesser extent and that these principles apply to oral health care as well Free dental care at the
PHC level was started in South Africa in April 1996 but there are no published reports of the
effect of this on patient attendances in South Africa.
1.13 Objectives of this study
The objectives of this study were to determine from the records of the ten Soweto dental clinics
over a two year period one year before and one year after the introduction of free primary
dental care
1) the total number of patients attending these clinics,
2) the attendance of casual patients (pain relief) and booked patients (conservative and
18
specialised treatment),
3) the relationship between the booked and casual patient attendances,
4) the patient to operator ratio (patient index).
19
CHAPTER TWO
METHODS AND MATERIALS
2.1 Study authorisation
Before the study was begun, the protocol was ethically approved by the Committee for
Research on Human Subjects (Medical) of the University of the Witwatersrand-clearance
number M970306.
2.2 Research location
In Gauteng Province, with a population of some 17 million, there are approximately 150 clinics
and hospitals [National Health Trends 1997], Twelve general clinics and one hospital, including
the ten dental clinics in this study are situated in Soweto where the population is approximately
three million [Cohen 1989]. Soweto is in the Central Witwatersrand district in the province of
Gauteng. It is located approximately twenty kilometres south-west of central Johannesburg.
a
KEMPTOMPARK-#
RANDBURG,
# # KRUGERSDORP 1 4 B S E ROOSfePOORT JO H A N N E S B U R G BOKSBURG
RANDFONTEIN GERMISTONSPRIN GS S
ALBERTONBRAKPAN
SOW ETO
Figure 2.1. Location of Soweto in relation to other major cities in Gauteng.
20
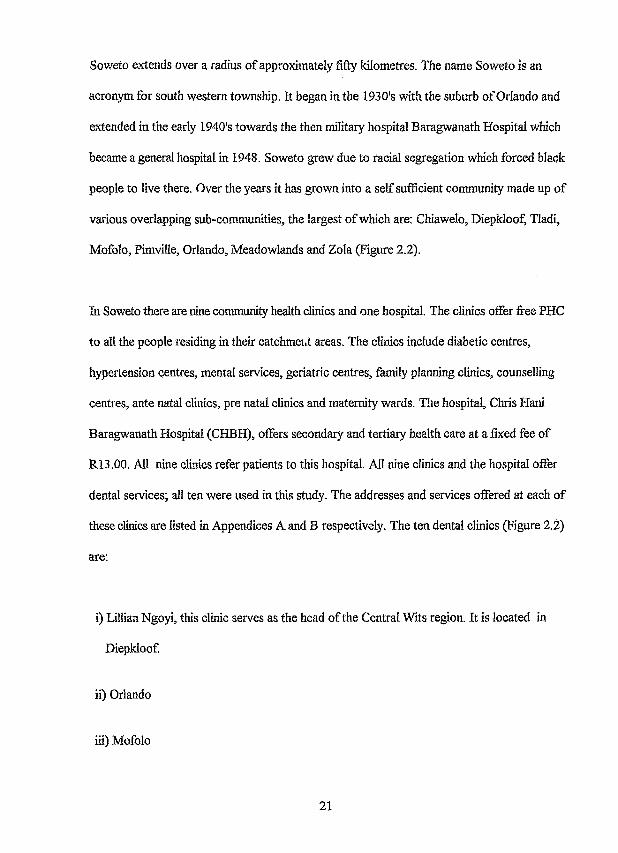
Soweto extends over a radius of approximately fifty kilometres. The name Soweto is an
acronym for south western township. It began in the 1930's with the suburb of Orlando and
extended in the early 1940's towards the then military hospital Baragwanath Hospital which
became a general hospital in 1948. Soweto grew due to racial segregation which forced black
people to live there. Over the years it has grown into a self sufficient community made up of
various overlapping sub-communities, the largest of which are: Chiawelo, Diepkloof, Tladi,
Mofolo, Pimville, Orlando, Meadowlands and Zola (Figure 2.2).
In Soweto there are nine community health clinics and one hospital. The clinics offer free PHC
to all the people residing in their catchmeut areas. The clinics include diabetic centres,
hypertension centres, mental services, geriatric centres, family planning clinics, counselling
centres, ante natal clinics, pre natal clinics and maternity wards. The hospital, Chris Hani
Baragwanath Hospital (CHBH), offers secondary and tertiary health care at a fixed fee of
R13.00. All nine clinics refer patients to this hospital. All nine clinics and the hospital offer
dental services; all ten were used in this study. The addresses and services offered at each of
these clinics are listed in Appendices A and B respectively. The ten dental clinics (Figure 2.2)
are:
i) Lillian Ngoyi, this clinic serves as the head of the Central Wits region. It is located in
Diepkloof.
ii) Orlando
iii) Mofolo
21
iv) Tladi
v) Pimville
vi) Meadowlands
vii) Zola
viii) Diepkloof
ix) Chiawelo
x) Cliris Hani Baragwanath Hospital (CHBH)
22
V
<5oV '/£fo £-UKtc.£ / y / r = |( ( Ci-v»MEaUoWLA
OoMoKVfuJ£ct.tmt.iy Mfoby lq oCLtAJ
.DoBToMvtuLeO K.LA
z o w o i .v oFbtUJ V.»TJVT t<.r#
n Cct;x i ^ /..o w. # I V '<Ofc- huoop CUMKY
271R .U I.a m i .
5-m Ni'arv''"' OR.L »vno v
<^Z/ ''. f " ‘’’y ’■T iV J \v / ey4e»;
U" 1 - L - fc 'H IT .H e t i l " k ,A M . ' - . v T I I I . t e i r a 7 " l o t - r . r o . VIARVV,.
? S € r , \ 1« > K e it
•'r«n I t v>*> r.>'„ R yTKMS'V;-'"'
- m .a o i^ m y ? / Z Z - X V r ™ .
ivuicni j } f i
ruiRi
"lOA-oKf.
f l e m t f i L.Z jZ'^'Afwtte®U AIIC.
SUWRoRM nii\ ^
^ rx ’=’(Sion’.UMLAtntrj
C t t l t t u G L O
"It i r'ln/i v
Figu
re
2.2.
Loc
ation
of
the
ten
study
cli
nics
in So
wet
o
2.3 The times and days that the dental services are available
All of the above health centres except for the Lillian Ngoyi and CH-Baragwanath Hospital are
open from 08:00 to 16:00 Monday to Friday. The Lillian Ngoyi clinic is open from 08:00 to
17:45 every weekday while CH-Baragwanath Hospital is open twenty-four hours, seven days
a week. At the CH-Baragwanath Hospital the dental services are only available from 08:00 to
16:00 Monday to Friday, however there is a dentist on call on a 24-hour basis who can render
emergency services if necessary. All the clinics close for a 15 minute tea break at approximately
10:00. The clinics then close for a 30 minute lunch break at approximately 12:30. Atypical
waiting room at one of the dental clinics is shown in Figure 2.3.
Figure 2.3. Patients waiting for treatment in a dental clinic.
24
On Saturdays, Mofolo, Zola, Lillian Ngoyi and Tladi, are open from 08:00 to 14:00. Dental
services are available free of charge at all nine clinics except the CH-Baragwanath Hospital at
which a user fee of R8.00 must be paid to receive treatment.
2.4 Research data
Each clinic records the total number of patients attending each day as well as the number of
those who were casual or booked patients together with the number of operators who had
worked in that dental clinic. These monthly statistics are sent to the Central Witwatersrand
headquarters at Lillian Ngoyi dental clinic.
For this study the monthly records for the two year period April 1995 to April 1997 were
examined. This specific time period was chosen in order to obtain an accurate attendance
pattern across tire year, to include the fluctuations in patient attendances influenced by seasons,
schou holidays, public holidays and even health promotion events. Furthermore, the study
period extends over a complete year on either side of the month when free dental care was
introduced. The first period (12 months) comprises the months before the introduction of free
services, while period two (13 months) is the period after the introduction of free services. The
study period therefore includes three April months.
The data extracted from the records were
1. The total patient attendance each day per clinic
2. Casual patients who required either dental examinations, extractions or medication
for dental abscesses on the same day per clinic
25
3. Booked patients who have been booked for restorations, scaling and polishings,
dentures or orthodontic treatment per clinic
4. The number of operators that had worked per month per clinic.
Two ratios were calculated
1. casual to booked ratio [casual/booked].
2. patient to operator ratio termed the Patient Index (PI) [total, patient number/number
of operators],
2.5 Data Management
All data collected from the ten different clinics was analysed using SAS for Windows [Version
6.12, SAS Institute INC, Cary NC; USA 1996], The data was plotted using Prism 3 software
[GraphPad Software, San Diego, CA, USA].
A general linear model analysis (Proc GLM) was done with total patient numbers, casual
patient numbers, booked patient numbers, casual to booked patient ratio and operator to
patient ratio as dependent variables, and clinic and period (before, after free treatment
introduction) as independent variables. The critical level of P was set at P<0,05.
26
CHAPTER THREE
RESULTS
3.1 Analysis of independent effects on dependent variables
A series of multivariate general linear model analyses were performed to examine for the
effect of introduction o f free primary dental care. The dependent variables were total patient
attendance, casual patient attendance, booked patient attendance, patient index and casual to
booked patient ratio. The independent variables were period (before and after the introduction
of free primary care) and individual clinic as well as the interaction period*clinic. Individual
clinics were included because they differ in size and staffing.
Table 3.1 summarises the results. There were statistically significant effects for each of the
independent variables and the interaction on the five dependent variables except for booked
patient attendance. Here period had no statistically significant effect.
3.2 Total number of patient attendances
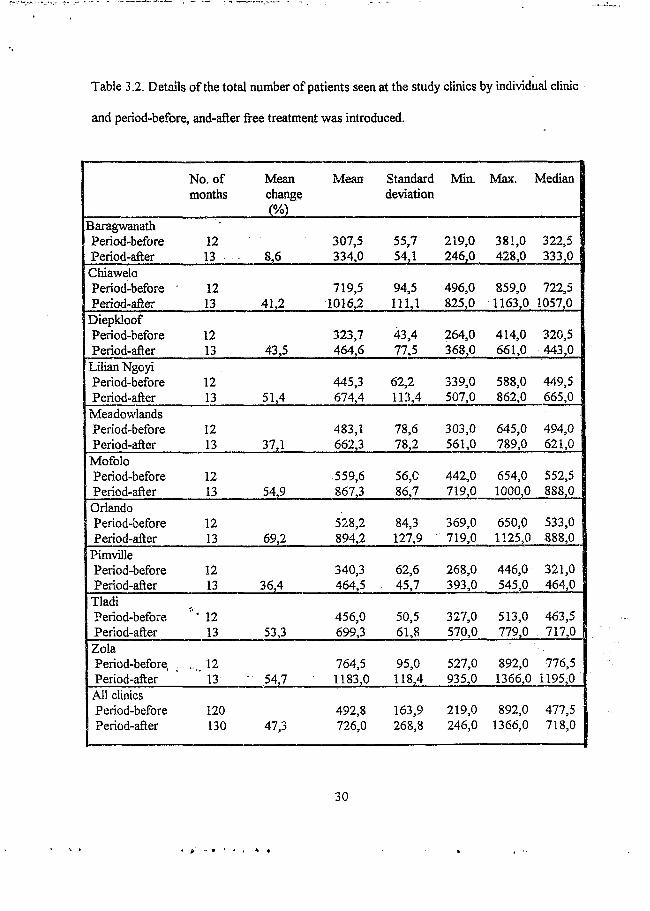
Total patient attendances over the two year period, April 1995 to April 1997, are listed in Table
3.2 and are plotted in Figure 3.1. There was a clear increase in total patient attendances after
the introduction of free dental care. In each of the ten clinics, before the introduction of free
health care the mean patient attendances, per month, in the twelve month period was 492,8
compared to 726 in the next 13 months. The minimum number of patients who attended any
one clinic during the first period changed little after the introduction of free services, from 219
to 246. However the maximum number of patients seen at any of the clinics during period one
27
increased from 892 to 1399.
Table 3.1. General linear model analysis results.
Dependent variable
Total patient attendance
Casual patient attendance
Booked patient attendance
Patient index
Casual to booked ratio
Independent variable
Period
Clinic
Period*clinic
Period
Clinic
Period*clinic
Period
Clinic
Period*clinic
Period
Clinic
Period*clinic
Period
Clinic
Period*clinic
F P
501.9 0.0001
163.25 0.0001
13.1 0.0001
358,89 0.0001
108.58 0.0001
11.53 0.0001
3.05 0.0819
68.98 0.0001
5.32 0.0001
19.71 0.0001
11.60 0.0001
1.70 0,0001
38.64 0.0001
40.96 0.0001
10.54 0.0001
28
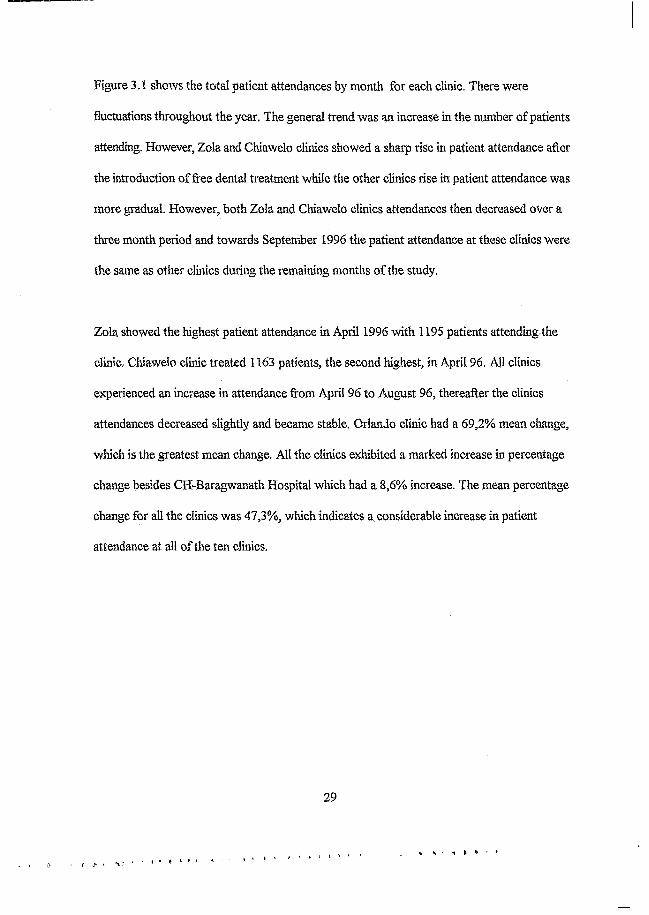
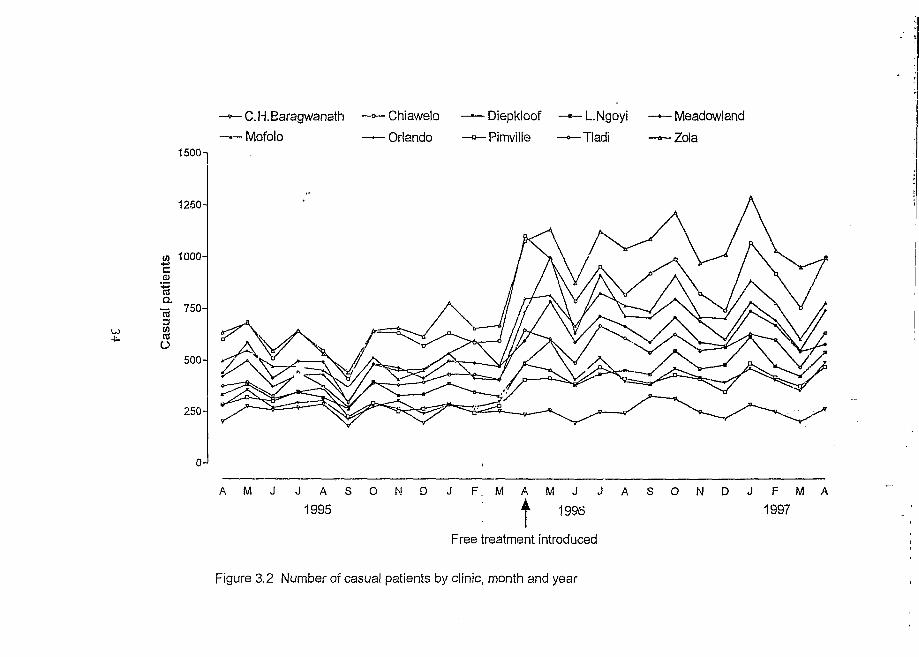
Figure 3.1 shows the total patient attendances by month for each clinic. There were
fluctuations throughout the year. The general trend was an increase in the number of patients
attending. However, Zola and Chiawelo clinics showed a sharp rise inpatient attendance after
the introduction of free dental treatment while the other clinics rise in patient attendance was
more gradual. However, both Zola and Chiawelo clinics attendances then decreased over a
three month period and towards September 1996 the patient attendance at these clinics were
the same as other clinics during the remaining months of the study.
Zola showed the highest patient attendance in April 1996 with 1195 patients attending the
clinic. Chiawelo clinic treated 1163 patients, the second highest, in April 96. All clinics
experienced an increase in attendance from April 96 to August 96, thereafter the clinics
attendances decreased slightly and became stable. Orlando clinic had a 69,2% mean change,
which is the greatest mean change. All the clinics exhibited a marked increase in percentage
change besides CH-Baragwanath Hospital which had a 8,6% increase. The mean percentage
change for all the clinics was 47,3%, which indicates a considerable increase in patient
attendance at all of the ten clinics.
29
Table 3.2. Details of the total number of patients seen at the study climes by individual clinic
and period-before, and-after free treatment was introduced.
No. of Mean Mean Standard Min. Max. Medianmonths change
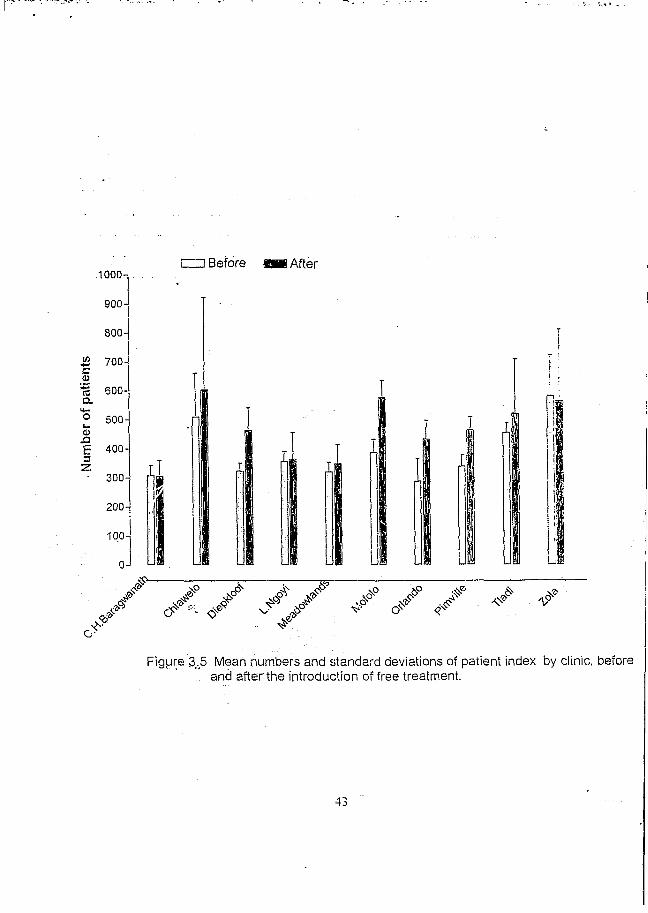
Figure 3 .5 Mean num bers and standard deviations of patient index by clinic, before . and after the introduction of free treatment.
43
CHAPTER FOUR
DISCUSSION
4.1 Data collection
The initial collecting of the data was relatively simple since it was all stored at the Lillian
Ngoyi clinic in Soweto. However, many clinics had not completed the monthly statistical
lorms correctly so that the data had to be re-checked at the individual clinics.
4.2 General Remarks
There was a definite increase in patient attendance at all ten dental clinics after free treatment
was introduced but at CH-Baragwanath Hospital the increase was very low probably because
this clinic does not offer free dental services. At this clinic patients still have to pay for
treatment and the Lillian Ngoyi clinic that provides free care is only a half a kilometre away.
The mean percentage change for total number of patient attendances was highest in Orlando,
a clinic that serves a large population living in Orlando East, Orlando West, Noordgesig and
even parts ofthe Power Park Squatter Camp. Hence the large numbers of patient attendances
would be expected.
The number of casual patients in all the clinics increased with a mean percentage change
from 1,2% at CH-Baragwanath Hospital to 70,2% at Orlando clinic. The same reasons for the
change in total patient numbers apply. The mean percentage increase in casual patient
44
attendance for all 10 clinics was 50,5%. This is an important increase in the number of patients
being treated for dental extractions or abscesses.
The number of booked patients attending the clinics also increased but only by a mean of 8,2%.
Furthermore, the pattern of change was not the same across the clinics. In six of the clinics,
there was an increase in the number of booked patients, in three there was a decrease and in
one there was no change.
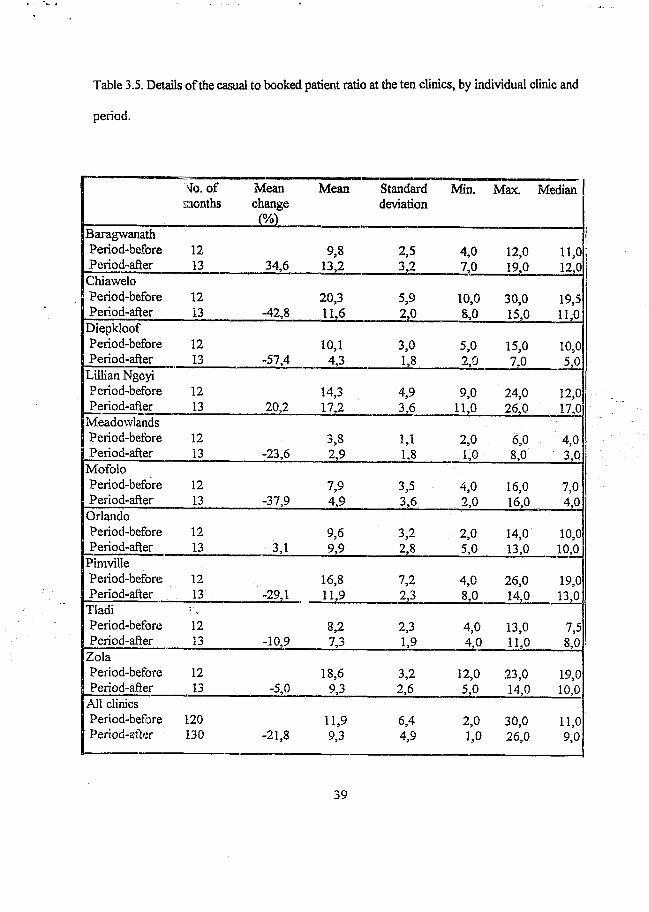
The mean percentage change for the casual to booked ratio for seven of the ten clinics had
decreased. This shows that before free treatment was introduced, the clinics were seeing more
casual to booked patients as compared to after free treatment. This indicates either the number
of casual patients had decreased or the number of booked patients have increased after free
dental treatment was introduced.
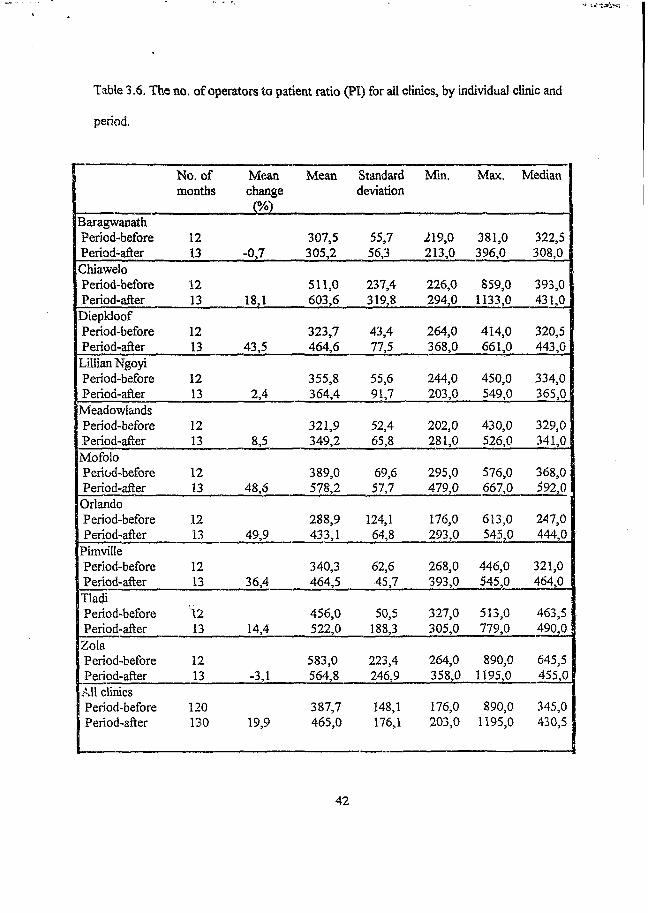
The Patient Index also remained fairly stable, which may seem surprising. However, after
the introduction of free dental care, in those clinics where patient numbers dramatically
increased, namely Tladi, Zola, Orlando, Lillian Ngoyi and Meadowlands, the number of
operators also increased. These have increased from a half to one operator per clinic,
depending on the patient workload, eg. Zola and Lillian Ngoyi clinics received one extra
operator, while Tladi and Orlando clinics received session operators.
4.3 Results compared to similar studies
This is the first, and only, study to compare patient attendances before and after the
45
introduction of free dental services in South Africa so no direct comparisons are possible.
Nonetheless the results are very similar to a study done at a rural general hospital in 1996 by
Wilkinson et ah, who looked at attendance patterns before and after the introduction of
South Africa’s free health care for children and pregnant mothers. His results show a 77,8%
increase in the total patient attendances. These results also correlate with an article written by
Peterson and Holst (1995), which states how the reduction of fees increases the utilisation of
dental services. A study done by Costello (1997), in which he examined the attendance patterns
o f children and mothers at clinics in Britain in 1948, the year when free health care for these
two groups were introduced, showed that attendances almost doubled in number, but over a
fifty year period (1948 to 1998) the attendance pattern reached a plateau and started to
decrease with time. Hence although there was an increase in patient attendances initially, with
time the patient attendance did decrease to acceptable levels.
4.4 Interpretations
The results all show a clear increase in patient attendances. When the operators at the clinics
were asked for their opinions on the patient attendances, they unanimously agreed that they
are treating too many patients and that the heavy patient load has compromised the quality of
the service rendered. Patients have become merely numbers and not people anymore with
operators becoming more and more frustrated.
Therefore, although dental operators in the Soweto clinics welcome free health care, they
believe the government should compensate by employing more operators to deal with the
increased demand. Furthermore, the operators and their teams should be recognised for
46
their hard work and rewarded by some means, such as cash bonuses, increased leave or time
off during the week, eg. a half day every two weeks.
4.5 Conclusion
This report has showed that free dental treatment has increased the patients’ attendance at all
of the ten study clinics which is likely to be the pattern at all clinics in South Africa. This
increase in attendance confirms the fact that cost is a barrier for dental treatment. Free dental
care has also allowed people access to dental services and empowered them with knowledge
concerning their oral health status and increasing their oral hygiene. People are being
introduced to dental care and educated in matters concerning oral hygiene.
Conversely, the health team providing the services are unable to cope with the increase
demand for these services. Hence, for the go vemment to introduce free PHC, measures should
have been taken to ensure that the increased number of patients attending the clinics can be
adequately treated. Therefore, for the increased number of people receiving treatment and for
the service providers to be content, the government should employ more staff and increase
their benefits. Operators also indicated that as a result of increased patient attendances, the
preventive school programmes have been stopped at some clinics .ithsr dimes have
reduced their programmes to a minimum. This reduction in preventive measures for school
children could cause ® generation of children with poor oral hygiene and hence gross caries,
a serious consequence for ihture operators treating the next generation of patients.
47
- w
APPENDIX A
A d d r e s s L i s tN .v t t . o r C l in ic IUiym va i. A m m i..ss & T u . N o . AKt.AS StRVM I
C htaw eloC U C C (ua«oluC U COld INitclivVsinhini RwiUChiatvehiT v l . m m w ^ i ; ! )
C luaw elo .SeM M ixe.l’U ui.M atx ittii.llla im m t.U .lU .l’iv teu Vi«itL, IVnlca Sunlit. VruiviKilen.Zmirhvknin. Nalvdi 1 Meiisnm,Mtilapn. RiK lviUe.VlnnwcItt V am p. U l.I I I . IlLiiiimi Vnmps. U l . l l l
D iflik lo n rC lIC |),v rL I„„ lC U C T(«48 Avcihic
niciAI.Mil'T c ir U M lio w .H is ;
D icp L lm tr/im e 1-6. U<cpLlinil‘h .\lcnsiiin . i‘.iri nl * it!.in>!i>. M antlvlavillv SqnnMci C.imp
D ifhtonvillc C lIC Dohsimvilltf CUV Stand No. 5/6 Hoodeponit RoadT clr iO l n m .tm z K
Dnlisiinville. l)<'h\tiiivillcl;Meii>inns l.ll.lll.D ntirnkni’pititiaUerC.mip. Snlcba Cam p. Mcadoxvlands Zoiicn 9 & lll.M e.idvw lands. hxlcitMons 11 & 12. Pan o f Zmnli ami Mofnln North
U m a n N to y iC I IC (K oos Ucukca)
L illian Ny»yi Cl 1C Old I’otchcT.Mroom Road ( N'cM Hi Si Jnhu l-yc I tospiial) Tci. tin n Q .u .o :u : . ,o2n.i
DicpLLutl / .n o c h . Power PurL. I teedom Park. M olvoalcdt Park. Orlando F.asl. Ptinvillc. D tepLlim n losteh Joitanneshuna.StMUh & SurrtHmtlingSnhiirlis.doliaim ohiiri: Nnrtlu 'i S iirrotiiuhogSuhnrKs. I ikciliiof. O range Farm. W cillers Farm
M andela-S iiu lu CU C (Plmmulong)
M andeLfSisulu CUC Pcla Street
Pliomolniig T s h U U I V l.t . l - iW
Dune Village. Phomolcmg.. Pltefem. Kill:trnc>. Orlando W est Vxtcnstnit
M eatlow landa CU C Meadow land: CUC No 291 j IkLpoori Circle Zone 2. Mcadmvlands T e l {0111956*1243
Meadow lan d s Znncs 1-10. Dohsonx d ie EMension 52. Part ofD uhsim x tile and Meadow landx 11 o 'tcl
M mTnlo CMC MololoC IIC R.iodcpmirt Road. M nfnln Vill.me T el. id I I ) 9.H2-55UU
Mol'olo N orth. Mofolo Village. Central. M ofnloSonlliW hile City Jahavu. Central W estern Jabaxn.R oekvdle. NUdape.Dtil'e ami (Irl.im ln W ol
O rla n d o CUC O rlando CMC 6556 RatticbeSuccI O rlando East T eh (O il) 955-75110
Orlando h a s t. Part nl'Orlnndo W est. Noordgevig. Power Park Squatter Camp
P im viltcC H C Pnm iU cCU C 3625 Zone 3 PimvillcT el: (011) QJT-’ SOr*
K lipspruit, Kfipsprtiii Extensions 2 5: 4. P im v d ie /o n e s 1-7. P inn 'illeU atcnsm ns. Power l»ark.l; red C la rk .P m n dleN ancefield . Industria.K ltptoxvn.Cliieken Karnt. Uush Knppivs.Eldorado Park . Fldnrado Park Extensions
S irc ifo rd C lIC SireirordCH C O range Farm T eh (0111 850-1IS6
Orange Farm Extensions 1-9. U n e /ie k hxtensuuiv l-4 .tira> m ere . Fine Tow n. W alkcrvdle. Jackson. W ctllcrs Farm, rik en h o f. Elaitdsrontcm .Swcctw aters.V lakrum cm
T lad i CUC Tladi ClIC 15.92 L cg w ale lac ct T Iadt . . T el: (011)930-6816
Tladt. N alcd i. Nalctli Extensions.Tladi Camp. M.detsane. Zola 1. Jahulam Flats. Part o fM olapu . Part ol M apetla
W ildclicesironlcin CUC WildcheeMrnntcni CUC T el: |0 I 6 | 5'1308tO
Palm S prings, L.ikeSide. SchnkengZone Ill.iSch.ikcneZoite b. Toiiusa Sqo.itlet Camp. Orange 1 arm I xientiiuis : -4 & 1 tt. f)c Deur. Residensnt
Z o la CUC Z o U C lKlU nthlcS trcet S tana Nn **80.7S3 7 n bPel H lM i'r .a .m iU
Zu’a 5.11,111. /u la N urtli./u ta l.xteiismnx.hmdcio l ituitni 1 Mensiuiis. Zundi l . t l . Oithsonville.D ohsmixille 1 xtensmnx. J.umiani. lahuiam lixtensions Nakxlt C.wtxp. Lueewvdlage 51"«irok<it«
48
APPENDIX B
S o w e t o C l i n i c F a c i l i t i e s
F a c i m t i k s
0
1
a
3
a1
-
i
2
S
2
1
3c
g a !i
i
i
PI 1C T r a i n i n '!; •
P I I C T r a i n i n g S c i i i i o i . • •C u r a t i v e S e r v i c t s ( A u . A g e s )
A n t h - N a t a I. C a r e
L A i i t u jR W a r d s . • • • • «■ •
P o s t - N a t a I. C i. i n i c
Wr.l.i. B a i i y C l i n i c . -
PlIOTllTIIERAPY • . . •D o m i c u . i . i a r y N u r s i n g D M S • . • •D i s t r i c t N u r s i n g S e r v i c e s (DNS) • • • •
F a m i l y P l a n n i n g . • . •
O p e r a t i n g T h e a t r e >
S i i u r v S pay W a r d •
R e n a l C l i n i c 1
P h y s i o t h e r a p y • •
O c c u p a t i o n a l T h e r a p y • •
C h i l d A m is t •
A i d s C l i n i c CO UN SELLI NG •
V o l u n t a r y H e a l t h C a r e S e r v i c e s •
X - R a y S e r v i c e s * •
S o c i a l W o r k
D e n t a l . • • • . • • «
U l l R A R Y •
A f t e r H c. u r S e r v i c e . . •
T r a d i t i o n a l B i r t h A t t e n d a n t s •
T r a o i t i o s a i H e a l e r s E u d c a i t o n
E l ' IL I P I I C S l ’PPORI C i i n i c • • • •
l i v i u m i n s i i i n S u p p t m i C l i n i c • • ! •D i a i i e i u S i i p p o r i C l i n i c • • • • • |
49
REFERENCES
Akpabio SP. Achieving oral health by the year 2000. In: Lambo TA, Stacey BD(eds) Issues in contemporary international health, Nigeria; Plenium Publishing Corporation, 1990:227-251.
Anand S, Hanson IC. Disability adjusted life years: a critical review. Working Paper Series no.95.06. Harvard Centre for Population and Development Studies. Cambridge: Harvard School of Public Health, 1995,
Be Kien Nio DRG. Improving oral and dental health through dental health education and prevention. Promoting oral health in deprived communities pp 201-215. German Foundation for International Development, Berlin, Germany, 1992.
Booth V, Ashley F. The oral health of a group of 15-17 year-old British school children of different ethnic origins. Community Dental Health 1989;6:195-205.
Cahen PM, Turlot JC, Frank RM. National survey of caries prevalence in 6-15 year-old children in France. Dent Res 1989;68:64-68.
CDA-IDA Workshop. Oral health policy guidelines for Commonwealth countries, New Delhi, India, April, 1994.
Chikte UME, Gugushe TS, Rudolph MJ, Reinach SG. Dental caries prevalence and CPITN of 12 year old rural school children in Transkei. Dent Ass S Afr 1990;45:245-249.
Cohen L, Gift H. Disease prevention and oral health promotion, Munksgaard, Germany 1995:367-368.
Cohen Y. Lecture notes- BDS VI students. Department of Community Dentistry, University o f the Witwatersrand,1989.
Costello A. Should mother and child health services in developing countries be free? BMJ 1997;314: 940-941.
Department o f Community Dentistry, Wits University, Reducing inequity in search of health promotion. Draft paper prepared for the symposium “Changing the face of dentistry”. University of the Witwatersrand, Johannesburg, 1994.
Gilbert L. Sociology and the “New Public Health” in South Africa, S Afr Sociology 1995;26:115-122.
Gilson L, Russell S, Buse IC. The political economy of user fees with targeting: developing equitable health financing policy. Int Develop 1995;7:369-402.
Gilson L. The lessons of user fee experience in Africa. Health Policy Plan 1997;12:273-285.
Gilson L. Re-addressing equity: The search for the Holy Grail? London: London School of Hygiene and Tropical Medicine, 1998.
50
Health trends in South Africa. Chief directorate: Planning support, division: contextual information, Johannesburg, 1994.
Hobdell MH, Myberg N. The needs of the population in relation to the training of oral health personnel and dental services. Wits University, Johannesburg, 1994.
Isman RE. Integrating primary oral health care into primary care. JDent Educ 1993;57:846- 852.
LaFond A. Sustaining Primary Health Care. London: Earthscan, 1995.
Leopold CT, Mander C, Watkins K, Rock WP. The world health organisation goals for oral health: a progress report. Community Dental Health, 1991;8:254-251.
Mahler H. The meaning of "Health for all by the year 2000": World Health Forum, 1981;3:5- 20.
Mautsch W, Sheiham A. Promoting oral health in deprived communities, Berlin: German Foundation for International Development, 1995.
Monekosso GL. Accelerating the achievement o f health for all. The three phase African Health Development Scenario. Brassaville: WHO/AFR, 1989.
Nolan B, Turbat V. Cost recovery in public health services in sub Saharan Africa. Economic Development Institute Technical Materials. Washington DC: World Bank, 1995.
Ntsulaba A. Towards a national health system. Department of National Health, 1995.
Pascal PC; Birmingham M R Primary health care in Dominica-striving to achieve equity- promoting oral health in deprived communities, German Foundation for International Development; 1991:335-344.
Petersen PE, Holst D, Cohen L, Gift H. Disease prevention and oral health promotion- utilisation of dental health services, Munksgaard, Germany 1995:367-368.
Pilot T. Trends in Oral Health: a global perspective. N Z Dent J, 1988;84:40-45.
Price M. The impact of political transformation in South Africa on policy debates regarding the public-private mix in health care. Journal of Health Policy and Planning, 1994;9:50-62.
Russell S, Gilson L. User Fees in Government Health Services, Is Equity Being Considered? An International Survey. PHP Department Publication no 15. London: London School of Hygiene and Tropical Medicine, 1995.
51
Saparamadu KDG. Promotion oral health: What needs to be done? Promoting Equity in Oral Health pg 27-32, Faculty of Dentistry and WHO Collaborating Centre, University of the Western Cape, South Africa, 1996:27-32.
Shaw P, Griffin C. Financing Health Care in sub-Saharan Africa through User fees and Insurance. Washington DC: World Bank, 1995.
Technical Committee For Oral Health National Policy, unpublished minutes, 1997.
Tendler J, Freedheim S. Trust in a rent-seeking world: Health and Government Transformed in Northeast Brazil. World Development, 1994;22:1771-1791.
The Berlin declaration on oral health services in deprived communities. Berlin, September 1992.
The Commonwealth (1989): The commonwealth today. Pg 2. London; the secretariate, 1989.
The World Development Report, Washington: The World Bank, 1988 222-223.
Van WykP. ed. National Oral Health Survey, South Africa 1988/1989. Department of Health, Pretoria, 1989.
Van Wyk P, Faber HS, Van Rooy HK, Oliver I. Patterns in the utilisation of oral health services in the RSA; A survey of four metropolitan samples. National Oral Health Survey, Pretoria, 1992/1993.
Whitehead M. The concepts and principles of equity and health. Copenhagen: WHO, 1990.
Wilkinson D, Sach EM, Karim SS A. Examination of attendance patterns before and after the introduction of South Africa’s policy of free health care for children aged under six years and pregnant women; BMJ, 1996;3 24:940-941.
World Health Organisation. Social justice and equity in health, unpublished report, WHO; Europe, Copenhagen, 1986.
52
Author Bhayat A
Name of thesis Patients Attendance At Soweto Dental Clinics Before And After Introduction Of Free Dental Services Bhayat
A 2000
PUBLISHER: University of the Witwatersrand, Johannesburg
Copyright Notice: All materials on the Un i ve r s i t y o f the Wi twa te r s rand , Johannesbu rg L ib ra ry website are protected by South African copyright law and may not be distributed, transmitted, displayed, or otherwise published in any format, without the prior written permission of the copyright owner.
Disclaimer and Terms of Use: Provided that you maintain all copyright and other notices contained therein, you may download material (one machine readable copy and one print copy per page) for your personal and/or educational non-commercial use only.
The University of the Witwatersrand, Johannesburg, is not responsible for any errors or omissions and excludes any and all liability for any errors in or omissions from the information on the Library website.