93
Patient-Centered Outcomes of Health Care Comparative Effectiveness Research February 3, 2015 9:00am – 12:00pm 16-145 CHS 1 Ron D.Hays, Ph.D.
| Date post: | 30-Dec-2015 |
| Category: |
Documents |
| Upload: | alberta-phillips |
| View: | 214 times |
| Download: | 1 times |

Patient-Centered Outcomes of Health Care
Comparative Effectiveness ResearchFebruary 3, 20159:00am – 12:00pm16-145 CHS
1
Ron D.Hays, Ph.D.

2
Introduction to Patient-Reported Outcomes
9:00-10:00am

Determinants of Health
3
Health
Behavior
Environment
Characteristics
QualityOf Care
Chronic Conditions
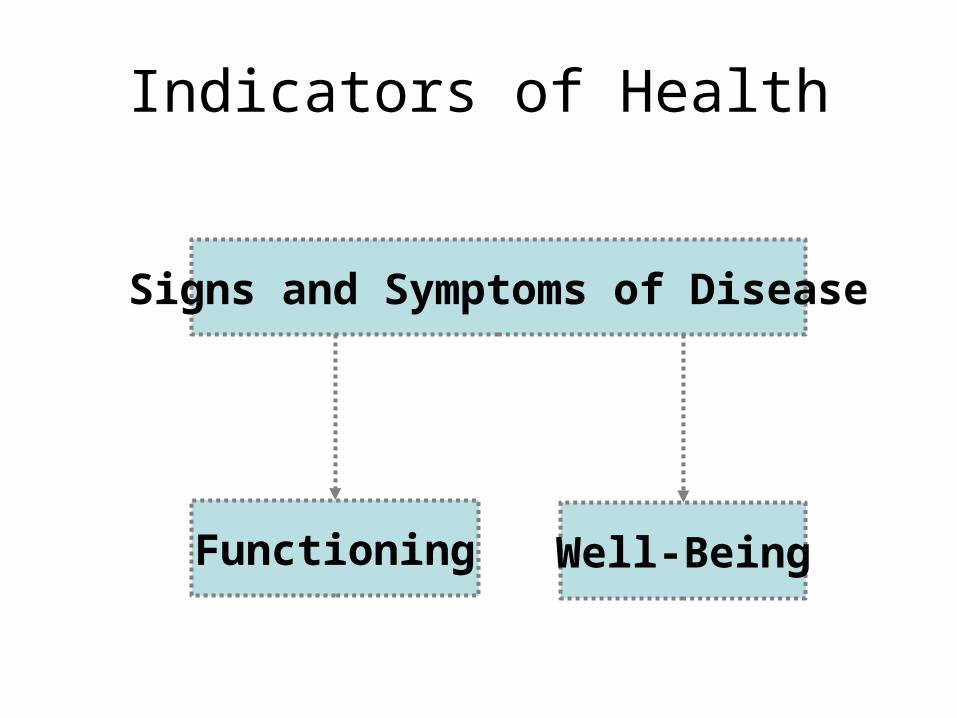
Indicators of Health
4
Signs and Symptoms of Disease
Functioning Well-Being

Functioning and Well-Being
• Functioning (what you can do)• Self-care• Role• Social
• Well-being (how you feel)– Pain– Energy– Depression– Positive affect
5

6
SF-36 Generic Profile Measure • Physical functioning (10 items)
• Role limitations/physical (4 items)
• Role limitations/emotional (3 items)
• Social functioning (2 items)
• Emotional well-being (5 items)
• Energy/fatigue (4 items)
• Pain (2 items)
• General health perceptions (5 items)

Indicators of Health
7
Signs and Symptoms of Disease
Functioning Well-Being

8
Health-Related Quality of Life (HRQOL)
Quality of environmentType of housingLevel of incomeSocial Support
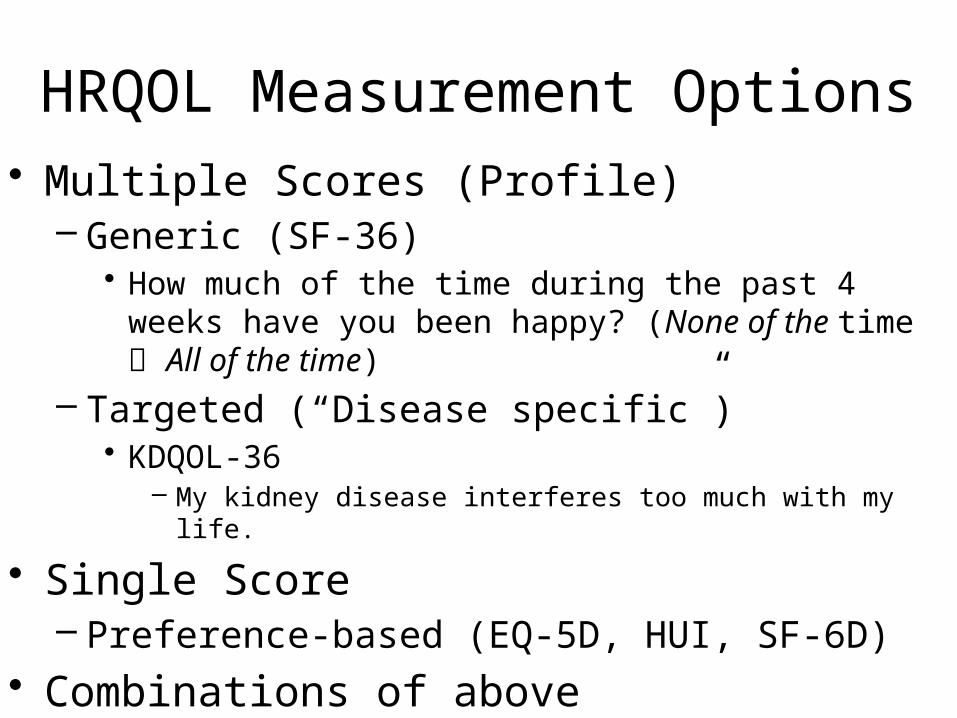
HRQOL Measurement Options• Multiple Scores (Profile)
– Generic (SF-36)• How much of the time during the past 4 weeks
have you been happy? (None of the time All of the time)
– Targeted (“Disease specific”)• KDQOL-36
– My kidney disease interferes too much with my life.
• Single Score– Preference-based (EQ-5D, HUI, SF-6D)
• Combinations of above 9

HRQOL Scoring Options
• 0-100 possible range
• T-scores (mean = 50, SD = 10)– (10 * z-score) + 50
• z-score = (score – mean)/SD
• 0 (dead) to 1 (perfect health)
10

11
HRQOL in HIV Compared to otherChronic Illnesses and General Population
0 10 20 30 40 50 60
Asymptomatic
Symptomatic
AIDS
General Pop
Epilepsy
GERD
Prostate disease
Depression
Diabetes
ESRD
MSEmot.Phy func
Hays et al. (2000), American Journal of MedicineT-score metric

Normal Distribution
Within 1 SD = 68.2%, 2 SDs =95.4%; 3 SDs = 99.6%

13
HRQOL in HIV Compared to otherChronic Illnesses and General Population
0 10 20 30 40 50 60
Asymptomatic
Symptomatic
AIDS
General Pop
Epilepsy
GERD
Prostate disease
Depression
Diabetes
ESRD
MSEmot.Phy func
Hays et al. (2000), American Journal of MedicineT-score metric

14
HRQOL in HIV Compared to otherChronic Illnesses and General Population
0 10 20 30 40 50 60
Asymptomatic
Symptomatic
AIDS
General Pop
Epilepsy
GERD
Prostate disease
Depression
Diabetes
ESRD
MSEmot.Phy func
Hays et al. (2000), American Journal of MedicineT-score metric

15
HRQOL in HIV Compared to otherChronic Illnesses and General Population
0 10 20 30 40 50 60
Asymptomatic
Symptomatic
AIDS
General Pop
Epilepsy
GERD
Prostate disease
Depression
Diabetes
ESRD
MSEmot.Phy func
Hays et al. (2000), American Journal of MedicineT-score metric

16
Hypertension
Diabetes
Current Depression
Stewart, A.L., Hays, R.D., Wells, K.B., Rogers, W.H., Spritzer, K.L., & Greenfield, S. (1994). Long-termfunctioning and well-being outcomes associated with physical activity and exercise in patients withchronic conditions in the Medical Outcomes Study. Journal of Clinical Epidemiology, 47, 719-730.
Physical Functioning in Relation to Time
Spent Exercising 2-years Before
Low High
Total Time Spent Exercising
84
82
80
78
76
74
72
70
68
66
64
62
0-100 range

17
Physical Health
Physical functionPhysical function
Role functionphysical
Role functionphysical
PainPain General Health
General Health
Physical Health

18
Mental Health
Emotional Well-BeingEmotional Well-Being
Role function-emotional
Role function-emotional
EnergyEnergy Social functionSocial
function
Mental Health
19
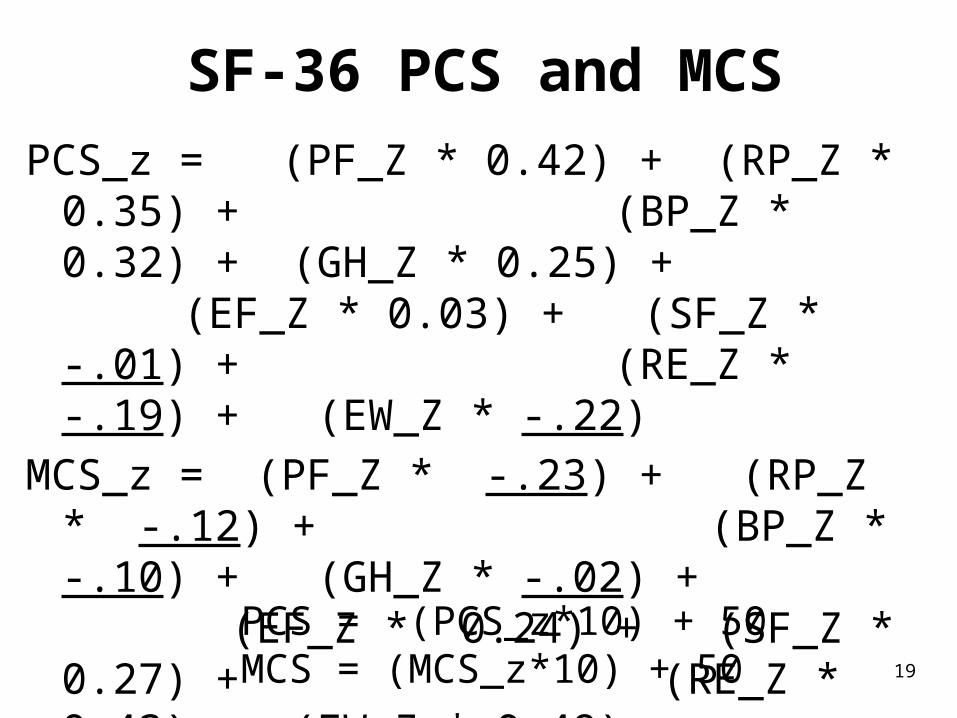
SF-36 PCS and MCSPCS_z = (PF_Z * 0.42) + (RP_Z * 0.35) +
(BP_Z * 0.32) + (GH_Z * 0.25) + (EF_Z * 0.03) + (SF_Z * -.01) + (RE_Z * -.19) + (EW_Z * -.22)
MCS_z = (PF_Z * -.23) + (RP_Z * -.12) + (BP_Z * -.10) + (GH_Z * -.02) + (EF_Z * 0.24) + (SF_Z * 0.27) + (RE_Z * 0.43) + (EW_Z * 0.49)
PCS = (PCS_z*10) + 50MCS = (MCS_z*10) + 50

20
Is Complementary and Alternative Medicine (CAM) Better than Standard Care (SC)?
0
10
20
30
40
50
60
70
80
90
100
CAM
SCCAM
SC
PhysicalHealth
CAM > SC
Mental Health
SC > CAM

21
Does Taking Medicine for HIV Lead to Worse HRQOL?
1 No dead2 No dead
3 No 50 4 No 75 5 No 100 6 Yes 0 7 Yes 25 8 Yes 50 9 Yes 75 10 Yes 100
Subject Antiretrovirals HRQOL (0-100)
No Antiretroviral 3 75Yes Antiretoviral 5 50
Group n HRQOL
22
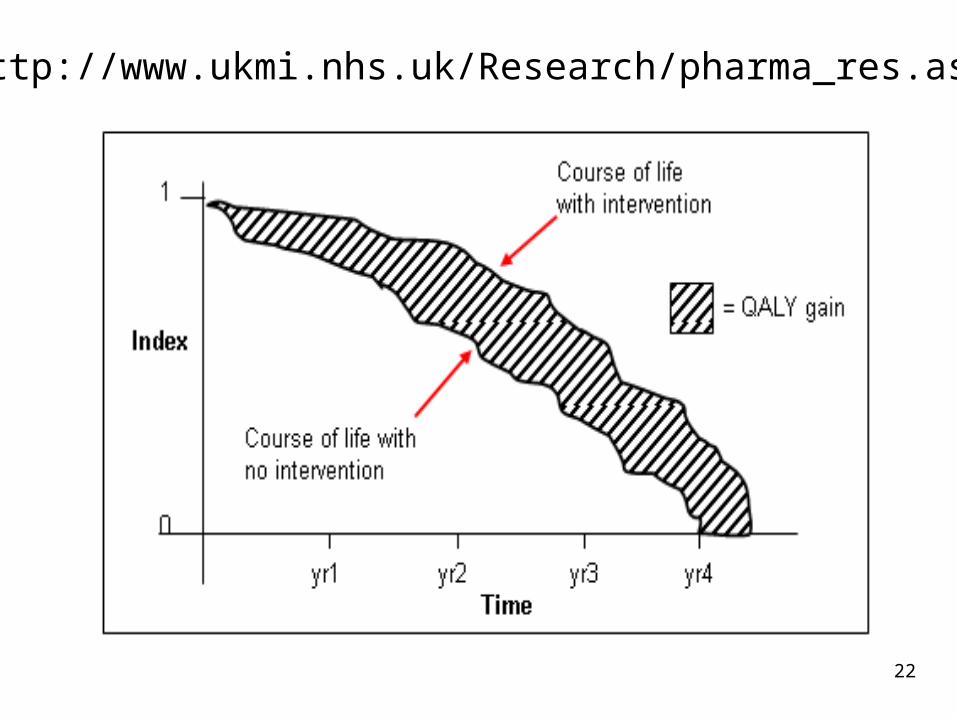
http://www.ukmi.nhs.uk/Research/pharma_res.asp

23
Cost-Effectiveness of Health Care
Cost ↓
Effectiveness (“Utility”) ↑

“QALYs: The Basics”
• Value is …– Preference or desirability of health states
• Preferences can be used to – Compare different interventions on a single common
metric (societal resource allocation)– Help make personal decisions about whether to have
a treatment
Milton Weinstein, George Torrance, Alistair McGuire, Value in Health, 2009, vol. 12 Supplement 1.
24

Preference Elicitation• Standard gamble (SG)• Time trade-off (TTO)• Rating scale (RS)
– http://araw.mede.uic.edu/cgi-bin/utility.cgi
SG > TTO > RS SG = TTOa
SG = RSb (Where a and b are less than 1)
• Also discrete choice experiments25

26
SF-6D health state (424421) = 0.59
• Your health limits you a lot in moderate activities (such as moving a table, pushing a vacuum cleaner, bowling or playing golf)
• You are limited in the kind of work or other activities as a result of your physical health
• Your health limits your social activities (like visiting friends, relatives etc.) most of the time.
• You have pain that interferes with your normal work (both outside the home and housework) moderately
• You feel tense or downhearted and low a little of the time.
• You have a lot of energy all of the time

27
HRQOL in SEER-Medicare Health Outcomes Study (n = 126,366)
0.73
0.74
0.75
0.76
0.77
0.78
0.79
0.8
0.81
0.82
No Condition Hypertension Arthritis-Hand Stroke COPD Arthritis-Hip
SF-6D (range = 0.30-1.00; SD = 0.14) by Condition
Controlling for age, gender, race/ethnicity, education, income, marital status, and the other 22 conditions.

28
Distant stage of cancer associated with 0.05-0.10 lower SF-6D Score
0.640.660.680.7
0.720.740.760.780.8
Breast Pros. Col. Lung
Local-Region
Distant
Unstaged
Figure 1. Distant Stage of Disease Associated with Worse SF-6D Scores (Sample sizes for local/regional, distant, and unstaged: Breast (2045,26, 347); Prostate (2652, 61 and 633), Colorectal (1481, 48 and 203), and Lung (466, 47 and 65).

Break #1
29

30
Evaluation of Patient-reported Outcome Measures
10:10-11:00am

31
Aspects of Good Health-Related Quality of Life
Measures
Aside from being practical..
1. Same people get same scores
2. Different people get different scores and differ in the way you expect
3. Measure is interpretable
4. Measure works the same way for different groups (age, gender, race/ethnicity)

32
Aspects of Good Health-Related Quality of Life
Measures
Aside from being practical..
1. Same people get same scores
2. Different people get different scores and differ in the way you expect
3. Measure is interpretable
4. Measure works the same way for different groups (age, gender, race/ethnicity)

Reliability
Degree to which the same score is obtained when the target or thing being measured (person, plant or whatever) hasn’t changed.Inter-rater (rater)
Need 2 or more raters of the thing being measuredInternal consistency (items)
Need 2 or more itemsTest-retest (administrations)
Need 2 or more time points
33
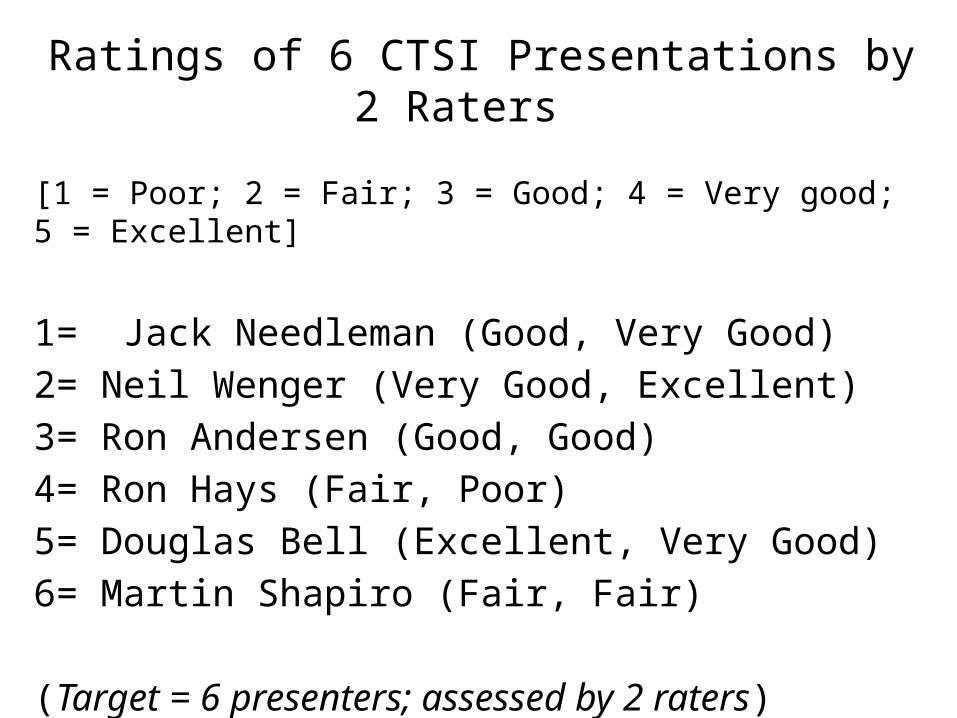
Ratings of 6 CTSI Presentations by 2 Raters
[1 = Poor; 2 = Fair; 3 = Good; 4 = Very good; 5 = Excellent]
1= Jack Needleman (Good, Very Good)2= Neil Wenger (Very Good, Excellent)3= Ron Andersen (Good, Good)4= Ron Hays (Fair, Poor)5= Douglas Bell (Excellent, Very Good)6= Martin Shapiro (Fair, Fair)
(Target = 6 presenters; assessed by 2 raters)34
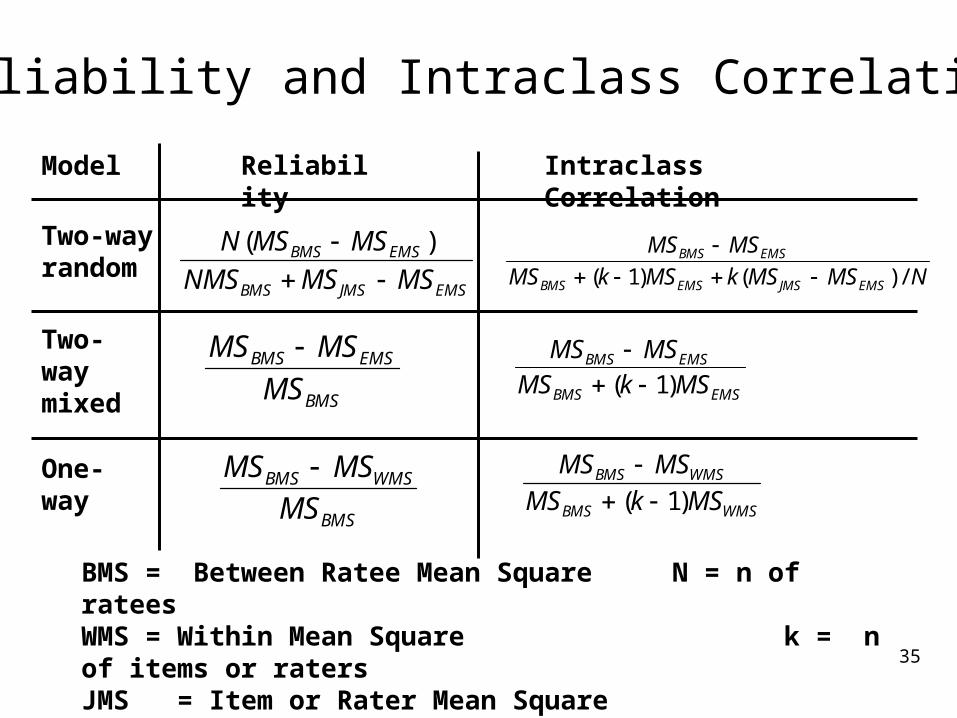
Reliability and Intraclass Correlation
BMS
WMSBMS
MS
MSMS WMSBMS
WMSBMS
MSkMS
MSMS
)1(
EMSBMS
EMSBMS
MSkMS
MSMS
)1(
BMS
EMSBMS
MS
MSMS
EMSJMSBMS
EMSBMS
MSMSNMS
MSMSN
)(
NMSMSkMSkMS
MSMS
EMSJMSEMSBMS
EMSBMS
/)()1(
Model Intraclass CorrelationReliability
One-way
Two-way mixed
Two-way random
BMS = Between Ratee Mean Square N = n of rateesWMS = Within Mean Square k = n of items or ratersJMS = Item or Rater Mean SquareEMS = Ratee x Item (Rater) Mean Square
35
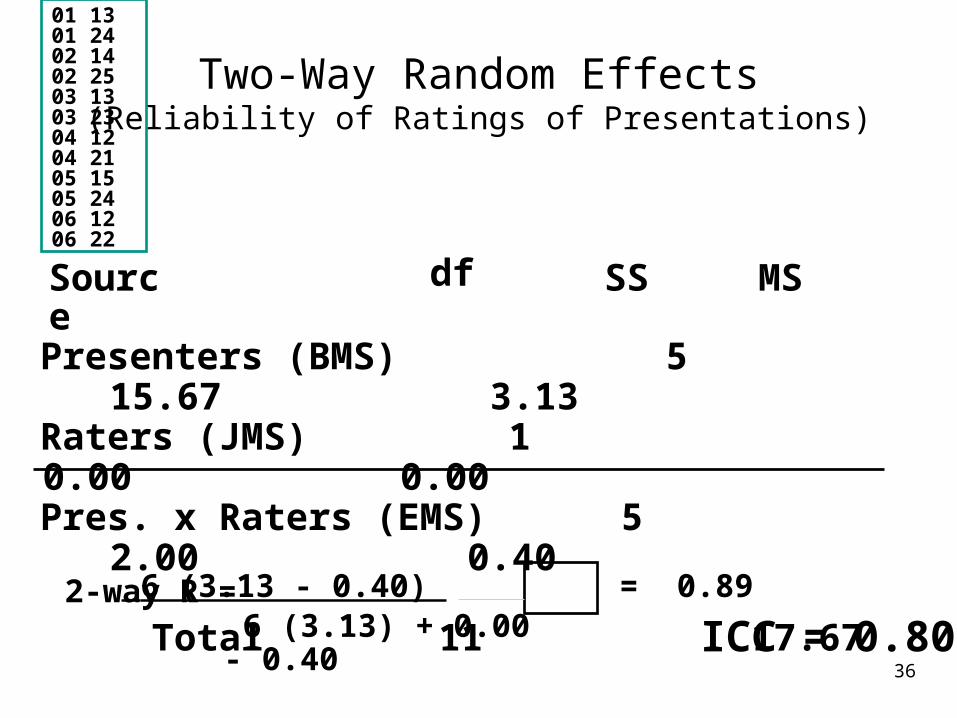
Two-Way Random Effects (Reliability of Ratings of Presentations)
Presenters (BMS) 5 15.67 3.13 Raters (JMS) 1 0.00 0.00 Pres. x Raters (EMS) 5 2.00 0.40
Total 11 17.67
Source df SS MS
2-way R = 6 (3.13 - 0.40) = 0.89 6 (3.13) + 0.00 - 0.40
01 1301 2402 1402 2503 1303 2304 1204 2105 1505 2406 1206 22
ICC = 0.8036
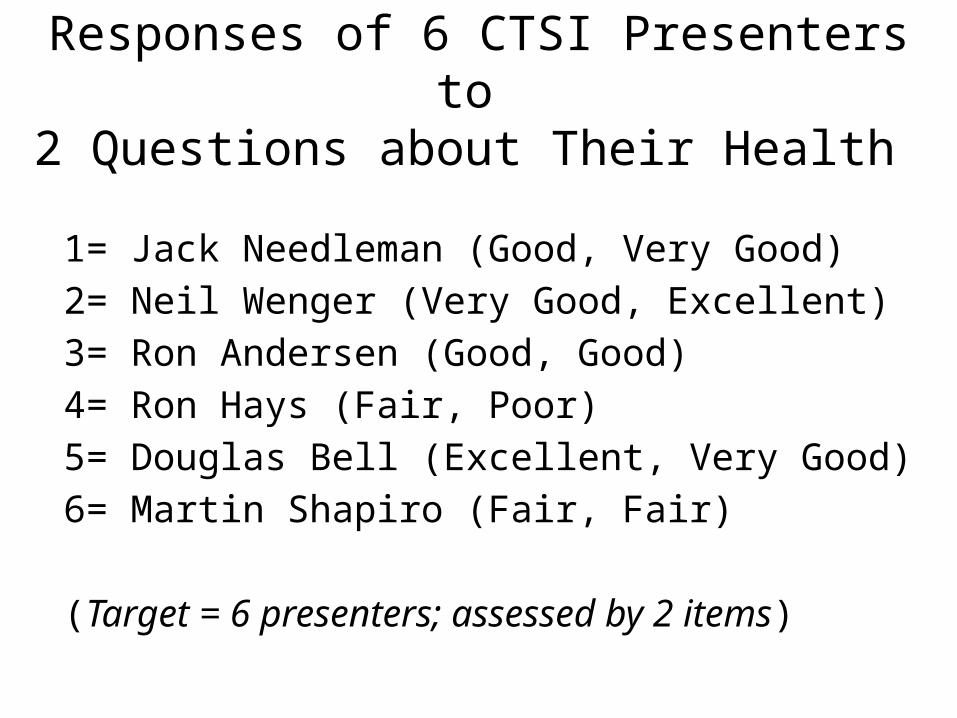
Responses of 6 CTSI Presenters to 2 Questions about Their Health
1= Jack Needleman (Good, Very Good)2= Neil Wenger (Very Good, Excellent)3= Ron Andersen (Good, Good)4= Ron Hays (Fair, Poor)5= Douglas Bell (Excellent, Very Good)6= Martin Shapiro (Fair, Fair)
(Target = 6 presenters; assessed by 2 items)37

Two-Way Mixed Effects (Cronbach’s Alpha)
Presenters (BMS) 5 15.67 3.13 Items (JMS) 1 0.00 0.00 Pres. x Items (EMS) 5 2.00 0.40
Total 11 17.67
Source df SS MS
Alpha = 3.13 - 0.40 = 2.93 = 0.873.13 3.13
01 3402 4503 3304 2105 5406 22
ICC = 0.7738

Reliability Minimum Standards
• 0.70 or above (for group comparisons)
• 0.90 or higher (for individual assessment)
SEM = SD (1- reliability)1/2 95% CI = true score +/- 1.96 x SEM
if z-score = 0, then CI: -.62 to +.62 when reliability = 0.90Width of CI is 1.24 z-score units
39

Item-scale correlation matrix
Depress Anxiety Anger Item #1 0.80* 0.20 0.20 Item #2 0.80* 0.20 0.20 Item #3 0.80* 0.20 0.20 Item #4 0.20 0.80* 0.20 Item #5 0.20 0.80* 0.20 Item #6 0.20 0.80* 0.20 Item #7 0.20 0.20 0.80* Item #8 0.20 0.20 0.80* Item #9 0.20 0.20 0.80* *Item-scale correlation, corrected for overlap.
40
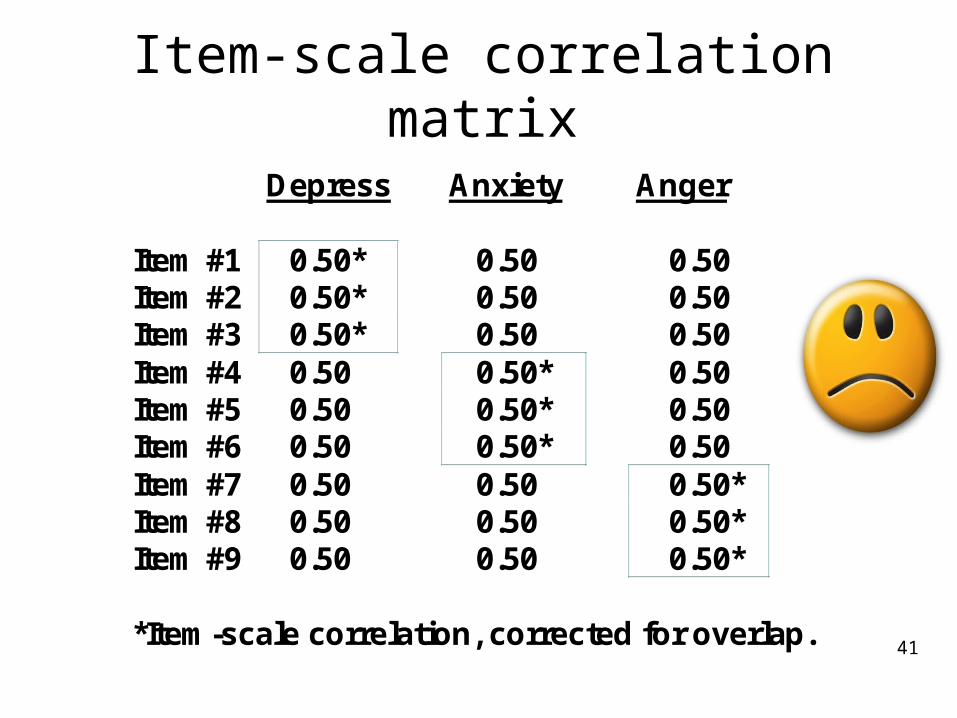
Item-scale correlation matrix
Depress Anxiety Anger Item #1 0.50* 0.50 0.50 Item #2 0.50* 0.50 0.50 Item #3 0.50* 0.50 0.50 Item #4 0.50 0.50* 0.50 Item #5 0.50 0.50* 0.50 Item #6 0.50 0.50* 0.50 Item #7 0.50 0.50 0.50* Item #8 0.50 0.50 0.50* Item #9 0.50 0.50 0.50* *Item-scale correlation, corrected for overlap.
41

42
Aspects of Good Health-Related Quality of Life
Measures
Aside from being practical..
1. Same people get same scores
2. Different people get different scores and differ in the way you expect
3. Measure is interpretable
4. Measure works the same way for different groups (age, gender, race/ethnicity)

ValidityDoes scale represent what it is
supposed to be measuring?
• Content validity: Does measure “appear” to reflect what it is intended to (expert judges or patient judgments)?– Do items operationalize concept?– Do items cover all aspects of concept?– Does scale name represent item content?
• Construct validity– Are the associations of the measure with
other variables consistent with hypotheses?
43

Relative Validity Example
Severity of Kidney Disease
None Mild Severe F-ratio Relative Validity
Burden of Disease #1 87 90 91 2 --
Burden of Disease #2 74 78 88 10 5
Burden of Disease #3 77 87 95 20 10
Sensitivity of measure to important (clinical) difference
44

Evaluating Construct ValidityScale Age (years)
(Better) Physical Functioning
(-)
45
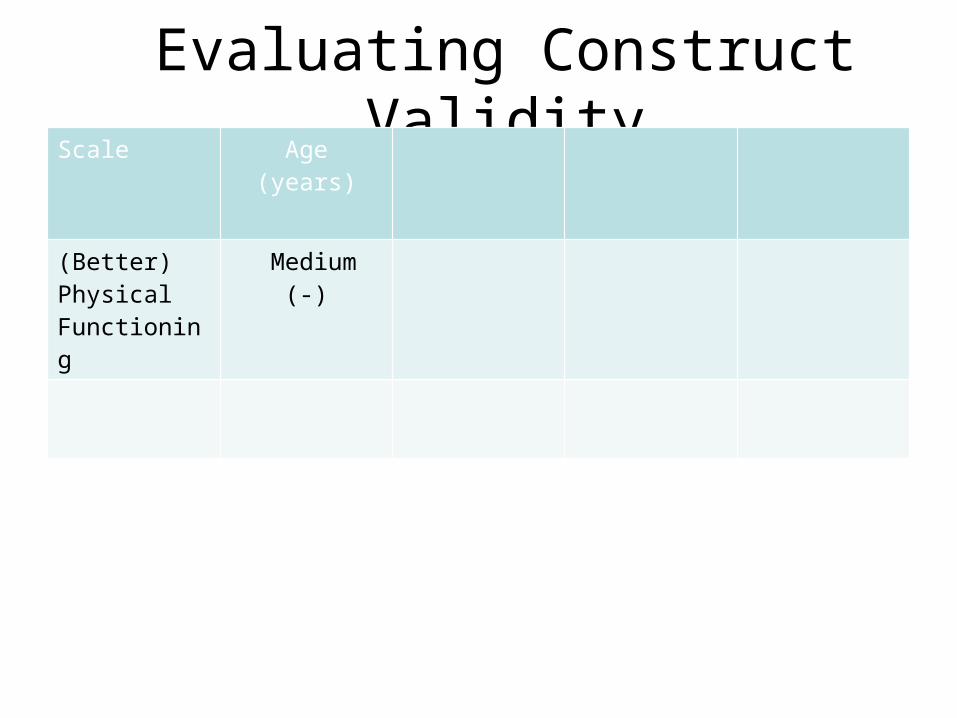
Evaluating Construct ValidityScale Age (years)
(Better) Physical Functioning
Medium (-)
46

Evaluating Construct ValidityScale Age (years)
(Better) Physical Functioning
Medium (-)
47
Effect size (ES) = D/SD
D = Score differenceSD = SD
Small (0.20), medium (0.50), large (0.80)

Evaluating Construct ValidityScale Age (years)
(Better) Physical Functioning
Medium (-)
r ˜͂P 0.24
Cohen effect size rules of thumb (d = 0.20, 0.50, and 0.80):
Small r = 0.100; medium r = 0.243; large r = 0.371
r = d / [(d2 + 4).5] = 0.80 / [(0.802 + 4).5] = 0.80 / [(0.64 + 4).5] = 0.80 / [( 4.64).5] = 0.80 / 2.154 = 0.371
48

Evaluating Construct ValidityScale Age (years) Obese
yes = 1, no = 0Kidney
Disease yes = 1, no = 0
In Nursing home yes
= 1, no = 0
(Better) Physical Functioning
Medium (-) Small (-) Large (-) Large (-)
Cohen effect size rules of thumb (d = 0.20, 0.50, and 0.80):
Small r = 0.100; medium r = 0.243; large r = 0.371
r = d / [(d2 + 4).5] = 0.80 / [(0.802 + 4).5] = 0.80 / [(0.64 + 4).5] = 0.80 / [( 4.64).5] = 0.80 / 2.154 = 0.371
49

Evaluating Construct ValidityScale Age (years) Obese
yes = 1, no = 0Kidney
Disease yes = 1, no = 0
In Nursing home yes
= 1, no = 0
(Better) Physical Functioning
Medium (-) Small (-) Large (-) Large (-)
(More) Depressive Symptoms
? Small (+) Small (+) Small (+)
Cohen effect size rules of thumb (d = 0.20, 0.50, and 0.80):
Small r = 0.100; medium r = 0.243; large r = 0.371
r = d / [(d2 + 4).5] = 0.80 / [(0.802 + 4).5] = 0.80 / [(0.64 + 4).5] = 0.80 / [( 4.64).5] = 0.80 / 2.154 = 0.371
(r’s of 0.10, 0.30 and 0.50 are often cited as small, medium, and large.) 50

Responsiveness to Change
• HRQOL measures should be responsive to interventions that change HRQOL
• Need external indicator(s) of change (Anchors)– “Improved” group = 100% reduction in seizure frequency– Ambiguous group = 99%-50% reduction in seizure frequency– “Unchanged” group = <50% change in seizure frequency
• Anchor correlated with change on target measure at 0.371 or higher
51

Responsiveness Index
Effect size (ES) = D/SD
D = raw score change in “changed”
(improved) group
SD = baseline SD
• Small: 0.20->0.49• Medium: 0.50->0.79• Large: 0.80 or above
52

Responsiveness Indices
(1) Effect size (ES) = D/SD
(2) Standardized Response Mean (SRM) = D/SD†
(3) Guyatt responsiveness statistic (RS) = D/SD‡
D = raw score change in “changed” group;
SD = baseline SD;
SD† = SD of D;
SD‡ = SD of D among “unchanged”53

54
Aspects of Good Health-Related Quality of Life
Measures
Aside from being practical..
1. Same people get same scores
2. Different people get different scores and differ in the way you expect
3. Measure is interpretable
4. Measure works the same way for different groups (age, gender, race/ethnicity)

Amount of Expected Change Varies
SF-36 physical function score mean = 87 (SD = 20) Assume I have a score of 100 at baseline
Hit by Bike causes me to be – limited a lot in vigorous activities– limited a lot in climbing several flights of stairs– limited a little in moderate activities
SF-36 physical functioning score drops to 75 (-1.25 SD)
Hit by Rock causes me to be – limited a little in vigorous activities
SF-36 physical functioning score drops to 95 (- 0.25 SD)55

Partition Degree of Change on Anchor
A lot better
A little better <- MID
No change
A little worse <- MID
A lot worse 56

57
Aspects of Good Health-Related Quality of Life
Measures
Aside from being practical..
1. Same people get same scores
2. Different people get different scores and differ in the way you expect
3. Measure is interpretable
4. Measure works the same way for different groups (age, gender, race/ethnicity)

0.0
0.2
0.4
0.6
0.8
1.0
-3.00 -2.00 -1.00 0.00 1.00 2.00 3.00
Posttraumatic Growth
Pro
babilit
y o
f R
esponse
Category Response Curves
Great Change
No Change
q
Very small
change
No chang
e
Small change
Moderate
change
Great change
Very great change
“Appreciating each day.”
58

Differential Item Functioning (DIF)
• Probability of choosing each response category should be the same for those who have the same estimated scale score, regardless of other characteristics
• Evaluation of DIF –Different subgroups –Mode differences
59
0
0.1
0.2
0.3
0.4
0.5
0.6
0.7
0.8
0.9
1
-4 -3.5 -3 -2.5 -2 -1.5 -1 -0.5 0 0.5 1 1.5 2 2.5 3 3.5 4
Pro
bab
ilit
y o
f "Y
es"
Res
po
nse
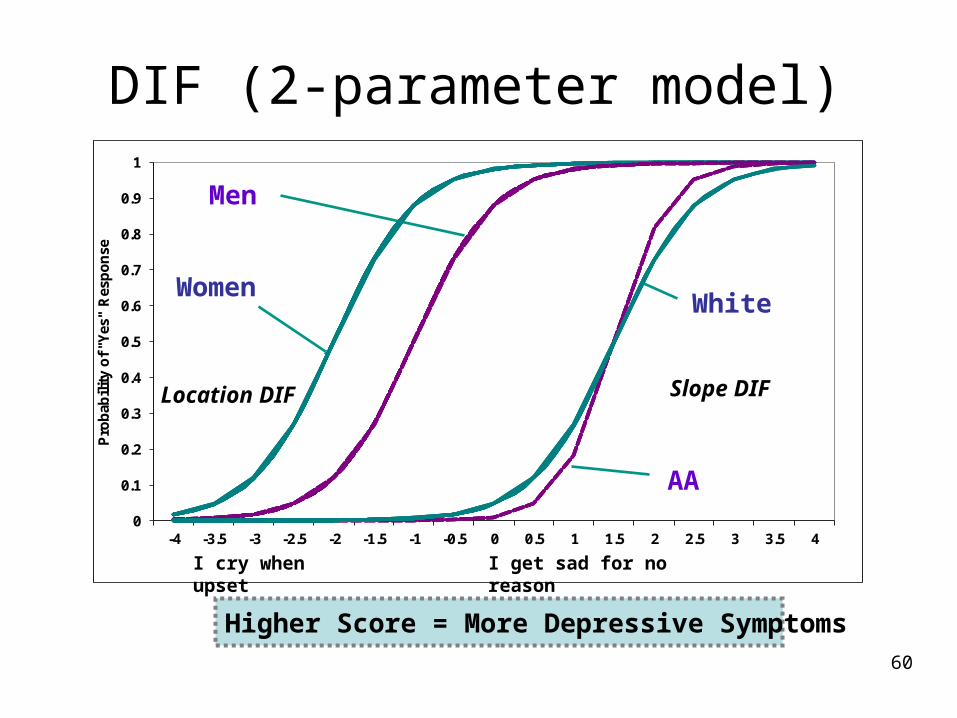
Location DIF
Slope DIF
DIF (2-parameter model)
Women
Men
AA
White
Higher Score = More Depressive Symptoms
I cry when upset I get sad for no reason
60

Questions?
61

Break #2
62

63
Use of Patient-Reported Outcome Measures in Clinical Practice
11:10-12:00 pm

64
0 10 20 30 40 50 60
General PopEpilepsy
GERDProstate disease
DepressionDiabetes
ESRDMS
AsymptomaticSymptomatic
AIDS
East-West
Physical Functioning and Emotional Well-Being at Baseline
for 54 Patients at UCLA-Center for East West Medicine
EWBPhysical
MS = multiple sclerosis; ESRD = end-stage renal disease; GERD = gastroesophageal reflux disease.
64

65
Significant Improvement in all but 1 of SF-36 Scales (Change is in T-score metric)
Change t-test prob.
PF-10 1.7 2.38 .0208
RP-4 4.1 3.81 .0004
BP-2 3.6 2.59 .0125
GH-5 2.4 2.86 .0061
EN-4 5.1 4.33 .0001
SF-2 4.7 3.51 .0009
RE-3 1.5 0.96 .3400
EWB-5 4.3 3.20 .0023
PCS 2.8 3.23 .0021
MCS 3.9 2.82 .0067

Effect Size
(Follow-up – Baseline)/ SDbaseline
Cohen’s Rule of Thumb:
ES = 0.20 Small
ES = 0.50 Medium
ES = 0.80 Large
66

67
Effect Sizes for Changes in SF-36 Scores
0
5
10
15
20
25
30
35
40
45
50
PFI Role-P Pain Gen H Energy Social Role-E EWB PCS MCS
Baseline
Followup
0.13 0.35 0.35 0.21 0.53 0.36 0.11 0.41 0.24 0.30
Effect Size
PFI = Physical Functioning; Role-P = Role-Physical; Pain = Bodily Pain; Gen H=General Health; Energy = Energy/Fatigue; Social = Social Functioning; Role-E = Role-Emotional; EWB = Emotional Well-being; PCS = Physical Component Summary; MCS =Mental Component Summary.0.11 0.13 0.21 0.24 0.30 0.35 0.35 0.36 0.41 0.53

68
Defining a Responder: Reliable Change Index
(RCI)
)( )2(12
SEM
XX
xxbl rSDSEM 1
Note: SDbl = standard deviation at baseline rxx = reliability

69
Significant Change
)1()( )2(12
xxrSD
XX
> = 1.96

70
Amount of Change in Observed Score Needed To be Statistically Significant
(1.96) )r - (1(SD) )2( xx
Note: SDbl = standard deviation at baseline and rxx = reliability

71
Amount of Change in Observed Score Needed To be Statistically Significant
(1.96) )r - (1 )2( xx
If rxx = 0.94 then
1.41421356237 x 0.24494897427 x 1.96 = 0.67

72
Amount of Change Needed for Significant Individual
Change 0.67 0.72 1.01 1.13 1.33 1.07 0.71 1.26 0.62 0.73
Effect Size
PFI = Physical Functioning; Role-P = Role-Physical; Pain = Bodily Pain; Gen H=General Health; Energy = Energy/Fatigue; Social = Social Functioning;Role-E = Role-Emotional; EWB = Emotional Well-being; PCS = Physical Component Summary; MCS =Mental Component Summary.
73
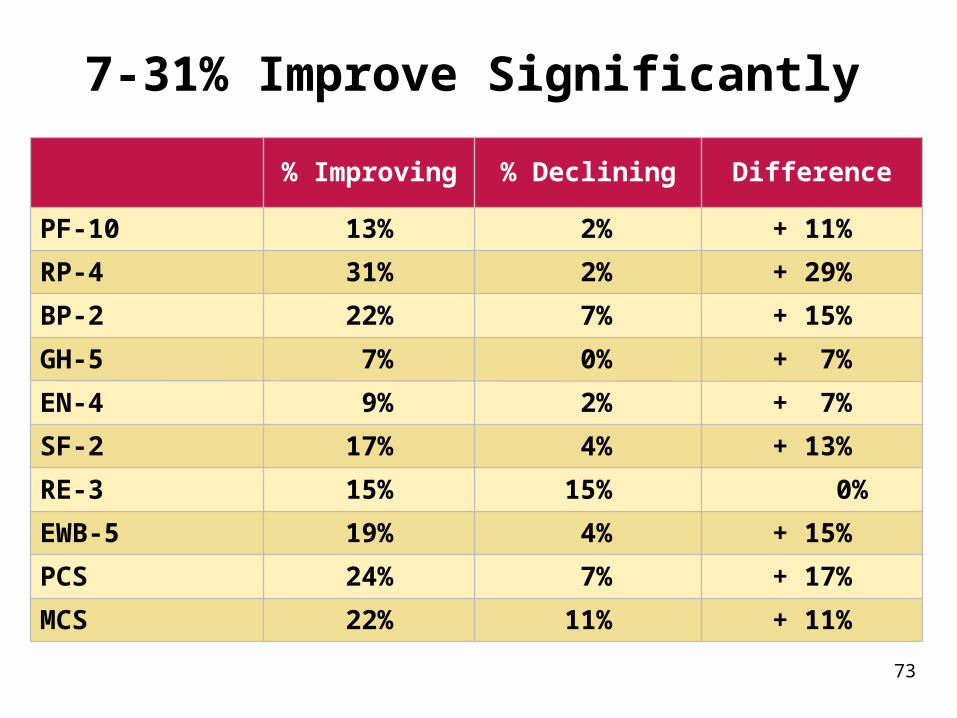
7-31% Improve Significantly
% Improving % Declining Difference
PF-10 13% 2% + 11%
RP-4 31% 2% + 29%
BP-2 22% 7% + 15%
GH-5 7% 0% + 7%
EN-4 9% 2% + 7%
SF-2 17% 4% + 13%
RE-3 15% 15% 0%
EWB-5 19% 4% + 15%
PCS 24% 7% + 17%
MCS 22% 11% + 11%

Item Responses and Trait Levels
Item 1 Item 2 Item 3
Person 1 Person 2Person 3
TraitContinuum
74

Computer Adaptive Testing (CAT)
75
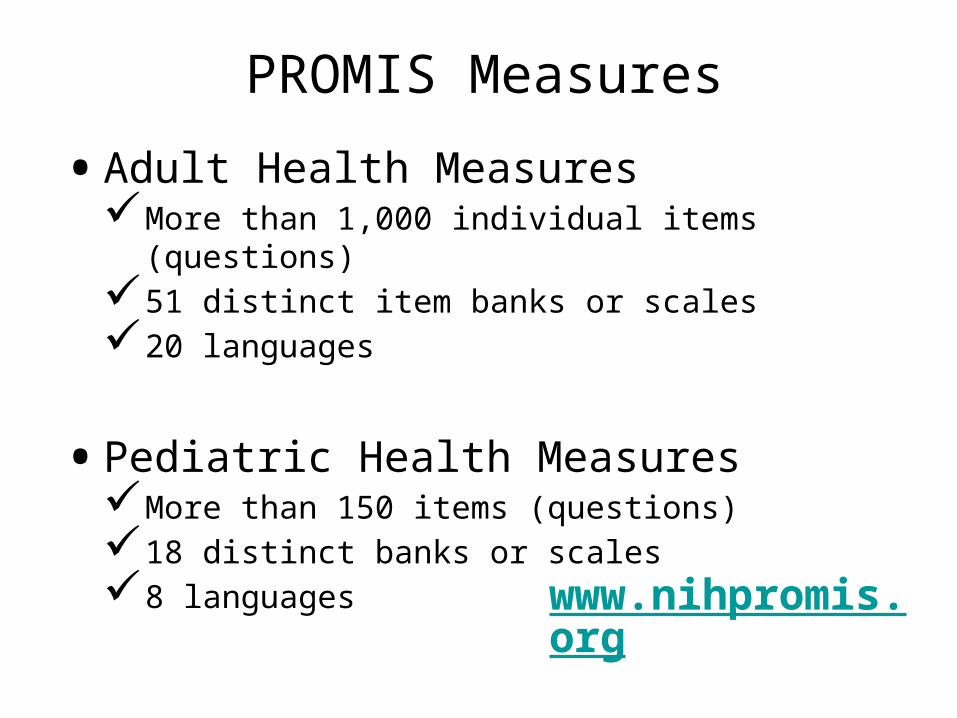
PROMIS Measures
• Adult Health MeasuresMore than 1,000 individual items (questions)51 distinct item banks or scales20 languages
• Pediatric Health MeasuresMore than 150 items (questions)18 distinct banks or scales 8 languages
76
www.nihpromis.org
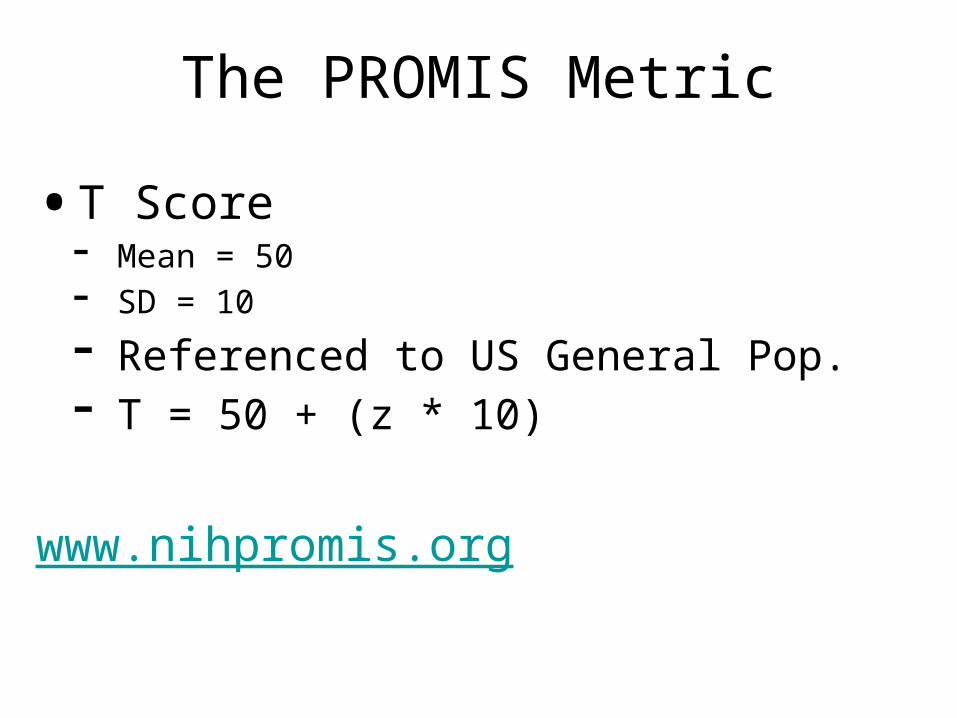
The PROMIS Metric
• T Score Mean = 50 SD = 10
Referenced to US General Pop. T = 50 + (z * 10)
www.nihpromis.org
77

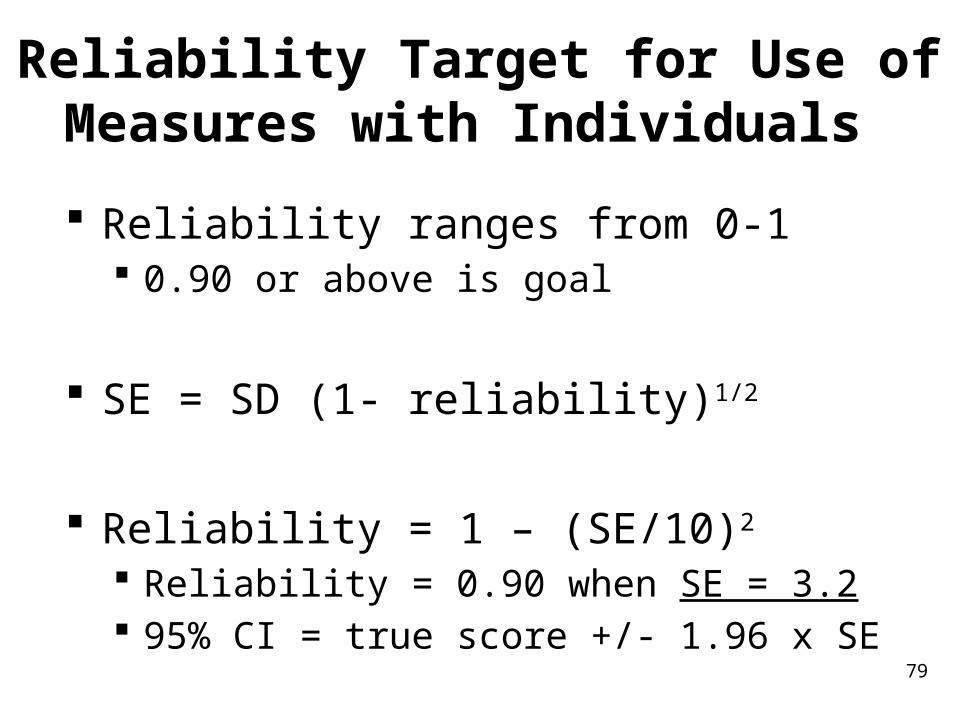
Reliability Target for Use of Measures with Individuals
Reliability ranges from 0-1 0.90 or above is goal
SE = SD (1- reliability)1/2
Reliability = 1 – (SE/10)2
Reliability = 0.90 when SE = 3.2 95% CI = true score +/- 1.96 x SE
79

In the past 7 days …
I was grouchy [1st question]– Never [39]– Rarely [48]– Sometimes [56]– Often [64]– Always [72]
Estimated Anger = 56.1 SE = 5.7 (rel. = 0.68)
80

In the past 7 days …
I felt like I was ready to explode [2nd question]
– Never– Rarely– Sometimes– Often– Always
Estimated Anger = 51.9 SE = 4.8 (rel. = 0.77) 81

In the past 7 days …
I felt angry [3rd question]– Never– Rarely– Sometimes– Often– Always
Estimated Anger = 50.5 SE = 3.9 (rel. = 0.85)
82

In the past 7 days …
I felt angrier than I thought I should [4th question] - Never
– Rarely– Sometimes– Often– Always
Estimated Anger = 48.8 SE = 3.6 (rel. = 0.87) 83

In the past 7 days …
I felt annoyed [5th question]– Never– Rarely– Sometimes– Often– Always
Estimated Anger = 50.1 SE = 3.2 (rel. = 0.90)
84
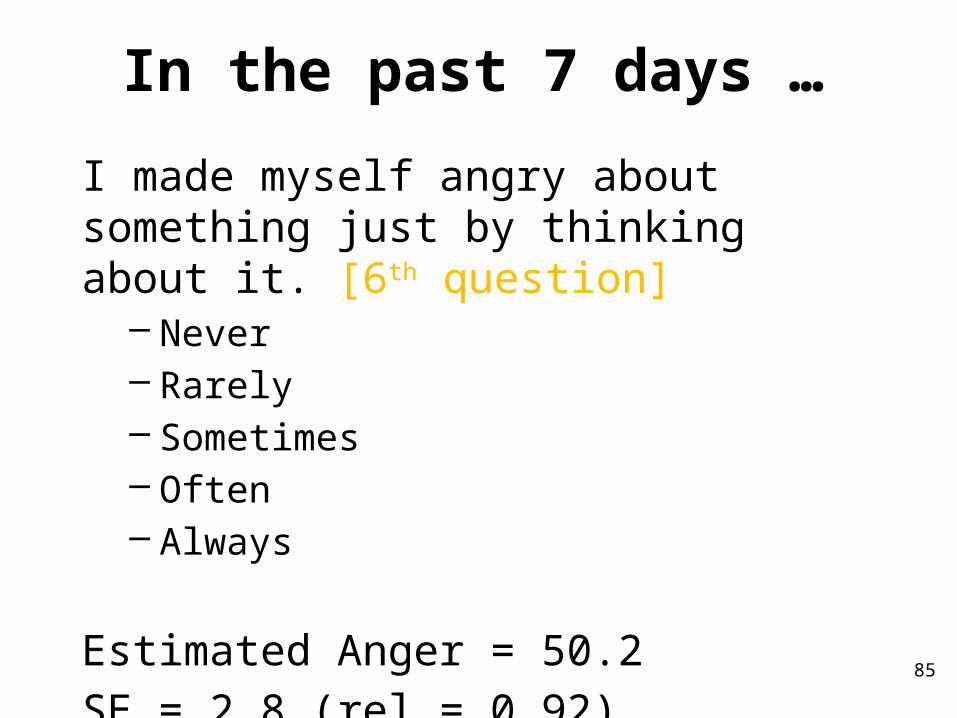
In the past 7 days …
I made myself angry about something just by thinking about it. [6th question]
– Never– Rarely– Sometimes– Often– Always
Estimated Anger = 50.2 SE = 2.8 (rel = 0.92)
85
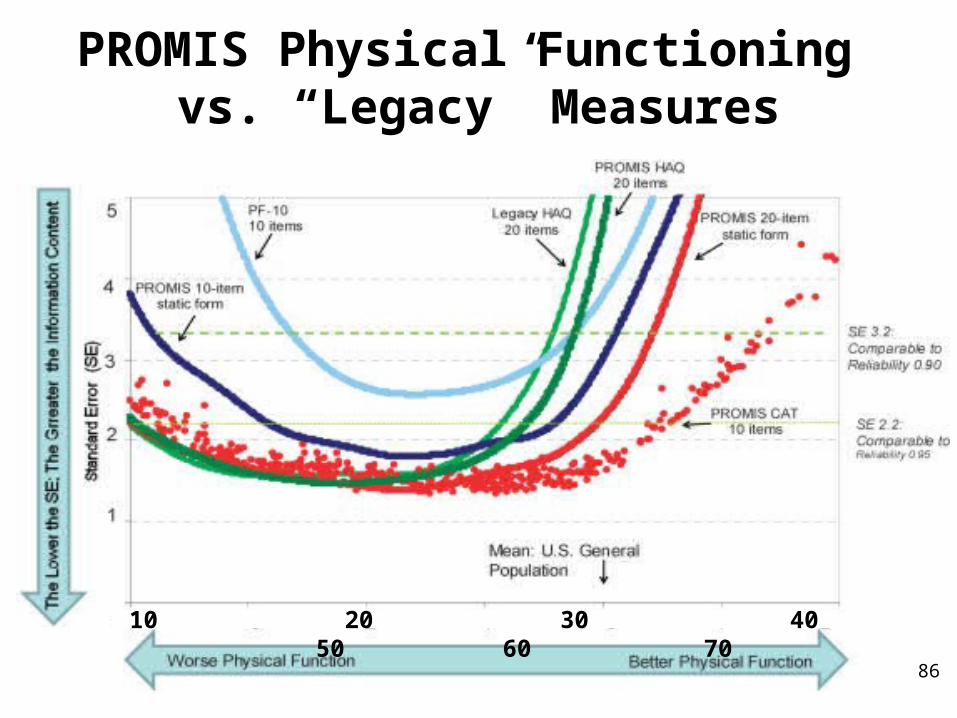
PROMIS Physical Functioning vs. “Legacy” Measures
86
10 20 30 40 50 60 70
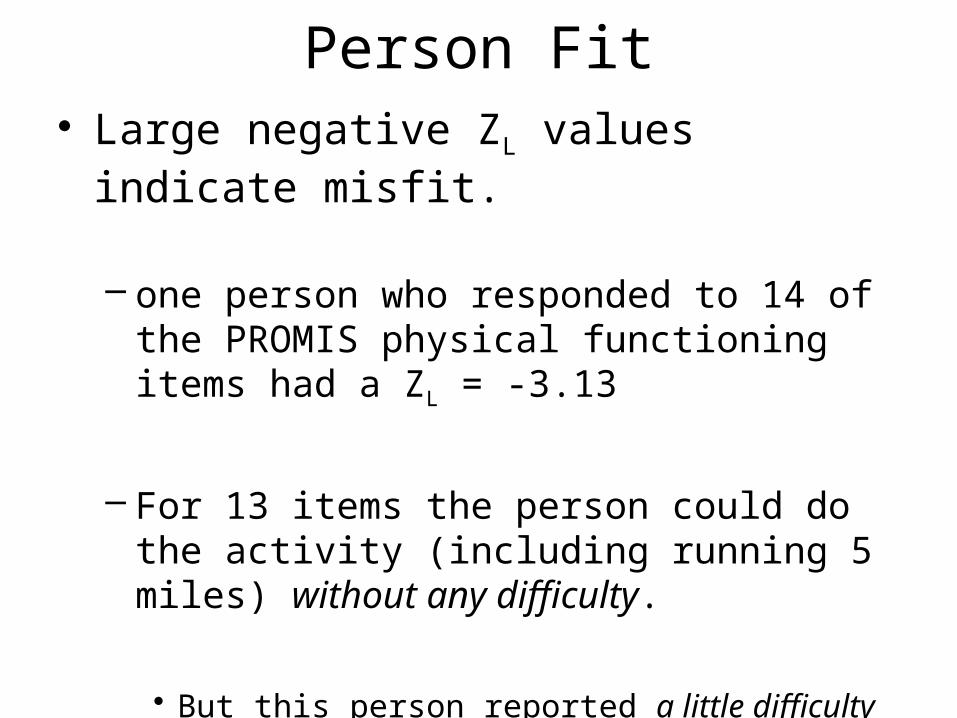
Person Fit• Large negative ZL values indicate
misfit.
– one person who responded to 14 of the PROMIS physical functioning items had a ZL = -3.13
– For 13 items the person could do the activity (including running 5 miles) without any difficulty.
• But this person reported a little difficulty being out of bed for most of the day.
87

Person FitItem misfit significantly related to:
–Longer response time –More chronic conditions–Younger age
88
89
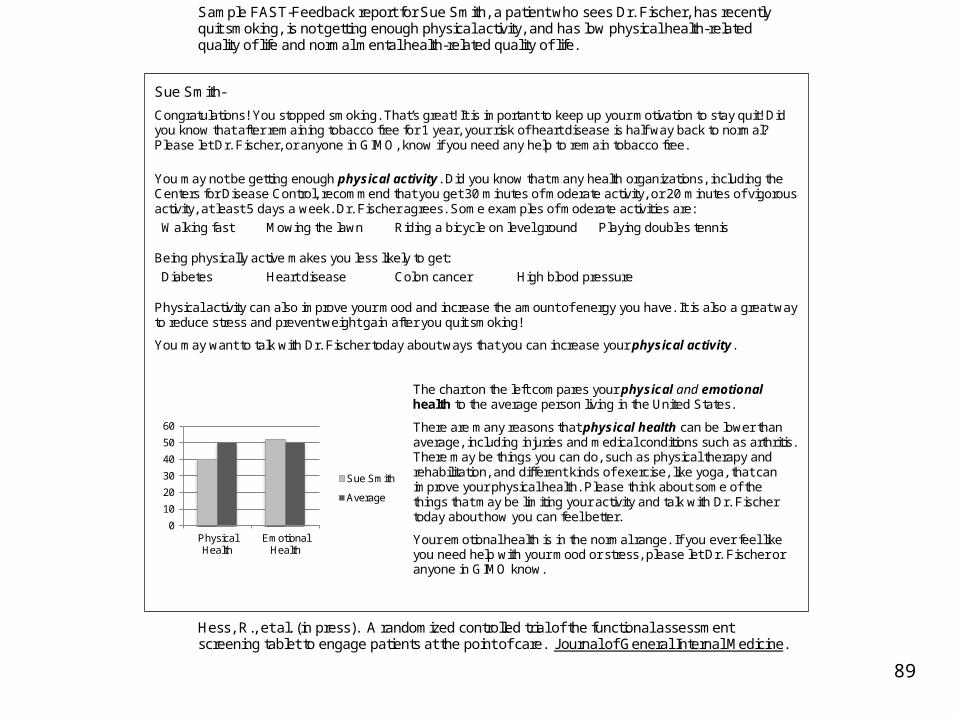
Sample FAST-Feedback report for Sue Smith, a patient who sees Dr. Fischer, has recently quit smoking, is not getting enough physical activity, and has low physical health-related quality of life and normal mental health-related quality of life.
Hess, R., et al. (in press). A randomized controlled trial of the functional assessment screening tablet to engage patients at the point of care. Journal of General Internal Medicine.
Sue Smith-
Congratulations! You stopped smoking. That’s great! It is important to keep up your motivation to stay quit! Did you know that after remaining tobacco free for 1 year, your risk of heart disease is half way back to normal? Please let Dr. Fischer, or anyone in GIMO, know if you need any help to remain tobacco free.
You may not be getting enough physical activity. Did you know that many health organizations, including the Centers for Disease Control, recommend that you get 30 minutes of moderate activity, or 20 minutes of vigorous activity, at least 5 days a week. Dr. Fischer agrees. Some examples of moderate activities are:
Walking fast Mowing the lawn Riding a bicycle on level ground Playing doubles tennis
Being physically active makes you less likely to get:
Diabetes Heart disease Colon cancer High blood pressure
Physical activity can also improve your mood and increase the amount of energy you have. It is also a great way to reduce stress and prevent weight gain after you quit smoking!
You may want to talk with Dr. Fischer today about ways that you can increase your physical activity.
0
10
20
30
40
50
60
Physical Health
Emotional Health
Sue Smith
Average
The chart on the left compares your physical and emotional health to the average person living in the United States.
There are many reasons that physical health can be lower than average, including injuries and medical conditions such as arthritis. There may be things you can do, such as physical therapy and rehabilitation, and different kinds of exercise, like yoga, that can improve your physical health. Please think about some of the things that may be limiting your activity and talk with Dr. Fischer today about how you can feel better.
Your emotional health is in the normal range. If you ever feel like you need help with your mood or stress, please let Dr. Fischer or anyone in GIMO know.
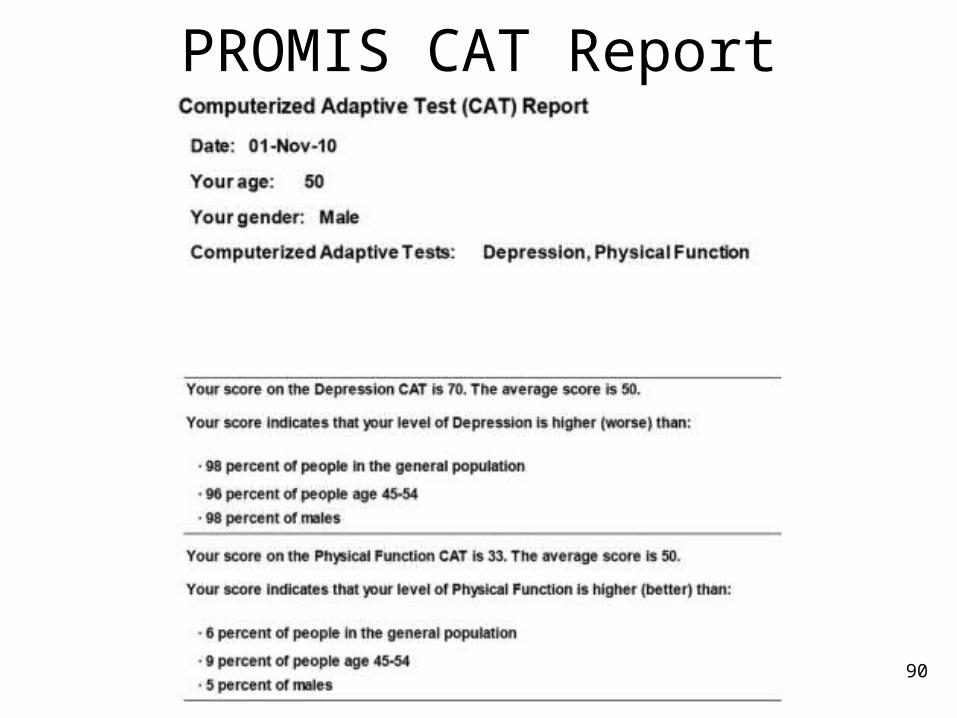
PROMIS CAT Report
90

91

“Implementing patient-reported outcomes assessment in clinical practice: a review of
the options and considerations”
Snyder, C.F., Aaronson, N. K., et al. Quality of Life Research, 21, 1305-1314, 2012.
– HRQOL has rarely been collected in a standardized fashion in routine clinical practice.
– Increased interest in using PROs for individual patient management.
– Research shows that use of PROs:• Improves patient-clinician communication• May improve outcomes 92

93
Thank you
[email protected] (310-794-2294) Powerpoint file available for downloading at: http://gim.med.ucla.edu/FacultyPages/Hays/


