Patterns of nucleotides that flank substitutions inhuman orthologous genesLei Ma1,2,3, Tingting Zhang3, Zhuoran Huang1,2, Xiaoqian Jiang1,2, Shiheng Tao1,2*
Abstract
Background: Sequence context is an important aspect of base mutagenesis, and three-base periodicity is anintrinsic property of coding sequences. However, how three-base periodicity is influenced in the vicinity ofsubstitutions is still unclear. The effect of context on mutagenesis should be revealed in the usage of nucleotidesthat flank substitutions. Relative entropy (also known as Kullback-Leibler divergence) is useful for finding unusualpatterns in biological sequences.
Results: Using relative entropy, we visualized the periodic patterns in the context of substitutions in humanorthologous genes. Neighbouring patterns differed both among substitution categories and within a category thatoccurred at three codon positions. Transition tended to occur in periodic sequences relative to transversion.Periodic signals were stronger in a set of flanking sequences of substitutions that occurred at the third-codonpositions than in those that occurred at the first- or second-codon positions. To determine how the three-baseperiodicity was affected near the substitution sites, we fitted a sine model to the values of the relative entropy.A sine of period equal to 3 is a good approximation for the three-base periodicity at sites not in close vicinity tosome substitutions. These periods were interrupted near the substitution site and then reappeared away fromsubstitutions. A comparative analysis between the native and codon-shuffled datasets suggested that the codonusage frequency was not the sole origin of the three-base periodicity, implying that the native order of codonsalso played an important role in this periodicity. Synonymous codon shuffling revealed that synonymous codonusage bias was one of the factors responsible for the observed three-base periodicity.
Conclusions: Our results offer an efficient way to illustrate unusual periodic patterns in the context of substitutionsand provide further insight into the origin of three-base periodicity. This periodicity is a result of the native codonorder in the reading frame. The length of the period equal to 3 is caused by the usage bias of nucleotides insynonymous codons. The periodic features in nucleotides surrounding substitutions aid in further understandinggenetic variation and nucleotide mutagenesis.
BackgroundTo understand the mechanisms underlying basic pro-cesses such as nucleotide mutation and fixation, DNA-protein interactions, DNA repair, and genetic diseases, itis important to study the influence of neighbouringnucleotides on substitutions in coding sequences [1-3].Studies on single nucleotide polymorphisms (SNPs)have revealed large biases of nucleotide composition atthe two immediately adjacent sites of SNPs [4]. Smallbiases can also occur farther away from polymorphicsites [4]. Analysis of the sequence context of SNPs has
indicated that CpG dinucleotides dominate in poly-morphic sites (SNPs) within non-CpG islands, whereasCpG dinucleotides are suppressed in polymorphic sites(SNPs) within CpG islands [5-7]. In plant chloroplastDNA, the mutation pattern correlates with the localbase composition [8,9]. In a spectrum of 7,271 muta-tions in 574 disease-related genes, the surroundingsequences were found to exert only a local influence onmutations [10].Periodic signals, specifically three-base periodicity,
exist in prokaryotic and eukaryotic exons. Early explana-tions for three-base periodicity suggested a preferencefor some nucleotides in the first-codon positions of cod-ing sequences, as well as an avoidance of some
nucleotides in the second-codon positions [11]. Laterresearch suggested that the periodicity in exons arosedue to the bias of codon usage frequencies [12]. Otherstudies proposed that three-base periodicity was deter-mined by a preference for triplets that are separated by3, 6 and 9 nucleotides (3n distances) in mRNA [13,14].As a gene monitoring approach, three-base periodicitycan be used to predict protein coding sequences [15].Intuitively, its variations should reveal coding frameshifts [16,17]. However, little is known regarding theeffects of substitution and its context on three-baseperiodicity.Detecting associations between substitutions and their
contexts will depend on the size of the alphabet usedand on the frequencies with which certain elements(monomers, dimers or n-mers over the chosen alphabet)occur along sequences. Thus, this type of approach hasits limitations. For example, the arbitrary choices of oli-gomer length can miss information beyond the chosenwindow. Furthermore, for the chosen alphabet, thenumerical value of compositional complexity willincrease exponentially according to the arbitrary oligo-mer length. For example, the size of a 6-mer alphabet is46 (4096) oligomers for DNA. In this sense, retrievinglong oligomers in DNA becomes a computationallytime-consuming task that requires very powerful com-putational facilities, which may not always be available.A number of other processes can be useful for finding
unusual patterns in biological sequences. One of these isthe Kullback-Leibler divergence, a windowless techniquethat can reflect the usage bias of nucleotides in each col-umn of a sequence alignment. In this study, we have usedthe Kullback-Leibler divergence and, based on relativeentropy, we have been able to illustrate periodic patternsin sequences that flank one-base substitutions in humanorthologous genes. Using a sine model to fit these periodicpatterns, we could then assess how the known three-baseperiodicity was influenced in the vicinity of substitutionsites. We discuss factors responsible for three-base peri-odicity, generated with the aid of two control sets in whichcodons were shuffled in two different manners.In the present study, neighbouring-nucleotide patterns
were found to differ among substitutions and transitionwas prone to occur in periodic sequences. We verifiedthat a sine model of period equal to 3 was a goodapproximation for periodic signals at sites not in closevicinity of some substitutions. Overall, our findings sup-port the conclusion that synonymous codon usage biasis responsible for three-base periodicity.
MethodsSequencesWe downloaded a dataset of 10,376 tri-alignments ofhuman-chimpanzee-macaque orthologous genes from
http://compgen.bscb.cornell.edu/orthologs/. This dataset[18] was derived from human genes in RefSeq [19],VEGA [20], and UCSC known Gene databases [21], andhad been passed through a series of rigorous filters thatwould remove genes with annotation errors, sequencingand assembly errors, poor synteny relationships, incom-plete alignments, frame-shifts, changes in exon-intronstructure, and recent duplication evidences [18].
Substitution inference methodThe method used for inferring a nucleotide substitutionin a tri-species alignment has been described previously[22,23]. For example, given that at a certain nucleotidesite, the human gene has A and both the chimpanzeeand macaque genes have G. We then can assume thatthe nucleotide G has changed to A in the human gene,i.e., G®A. There are 12 substitution categories, i.e.,each type of nucleotide can change into any of the otherthree types. Based on the tri-alignments dataset, weinferred 36,459 substitutions and then excluded adjacentmultiple-base substitutions, deletions and insertions.The remaining 35,561 substitutions were divided into 3groups in terms of the codon positions at which substi-tutions occurred and were further divided into 12 cate-gories according to substitution type (Additional file 1).Next, we extracted 100 nucleotides on each flank ofeach substitution and eliminated (if any) gaps in thesequences.
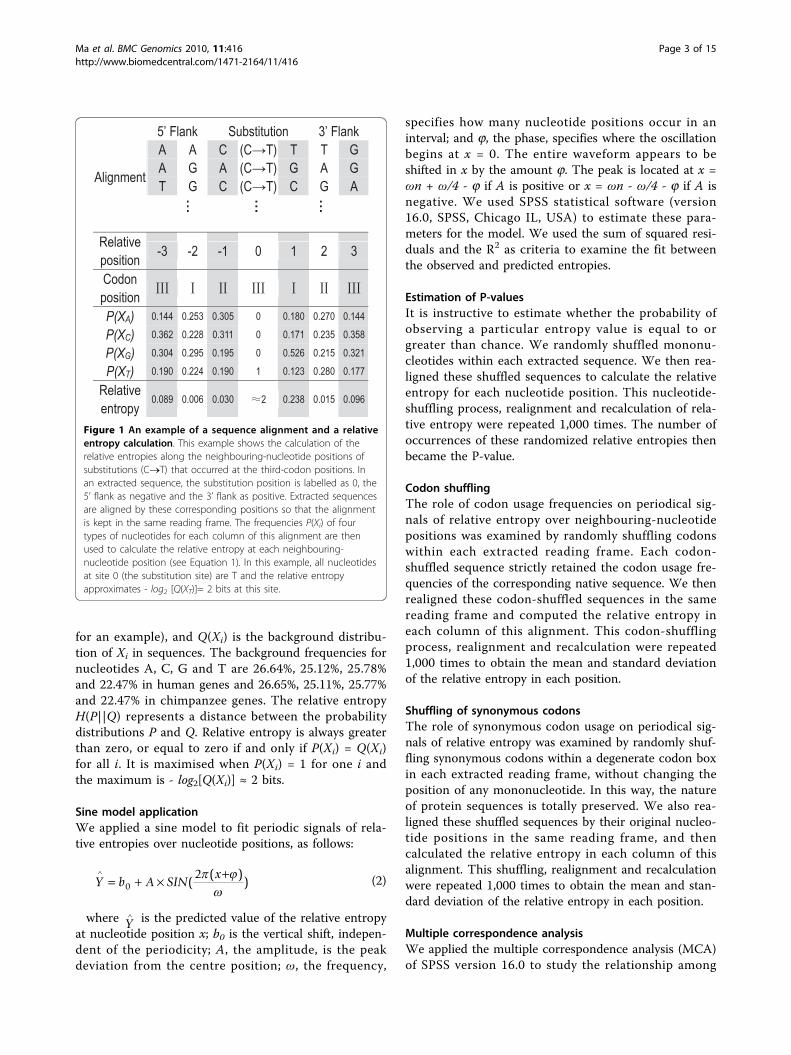
Sequence alignment methodWe arbitrarily labelled the position of the substitutionsite as ‘zero’ in the extracted sequence; positions at the 5′flank were then designated as negative numbers and thepositions at the 3′ flank as positive numbers. We thenaligned the extracted sequences by these correspondingpositions (see Figure 1 for an example). We next calcu-lated the frequencies of four nucleotide types in each col-umn of that alignment. Lastly, we applied relativeentropy to estimate the distance between the distributionof nucleotides at each neighbouring position and thebackground distribution (see Relative entropy below).
Relative entropy calculationRelative entropy at each position (or column) of a multi-ple sequence alignment followed the definition used inreference [24]:
H P Q P XP X
Q Xii
ii A C G T
( || ) ( ) log( )( )
{ , , , }
=∈
∑ 2 (1)
where Xi is a random variable for A, C, G, or T, P(Xi)represents the frequencies of four types of nucleotidesin each column of a sequence alignment (see Figure 1
Ma et al. BMC Genomics 2010, 11:416http://www.biomedcentral.com/1471-2164/11/416
for an example), and Q(Xi) is the background distribu-tion of Xi in sequences. The background frequencies fornucleotides A, C, G and T are 26.64%, 25.12%, 25.78%and 22.47% in human genes and 26.65%, 25.11%, 25.77%and 22.47% in chimpanzee genes. The relative entropyH(P||Q) represents a distance between the probabilitydistributions P and Q. Relative entropy is always greaterthan zero, or equal to zero if and only if P(Xi) = Q(Xi)for all i. It is maximised when P(Xi) = 1 for one i andthe maximum is - log2[Q(Xi)] ≈ 2 bits.
Sine model applicationWe applied a sine model to fit periodic signals of rela-tive entropies over nucleotide positions, as follows:
Y b A SINx∧
= + × +0
2(
( ))
(2)
where Y∧ is the predicted value of the relative entropy
at nucleotide position x; b0 is the vertical shift, indepen-dent of the periodicity; A, the amplitude, is the peakdeviation from the centre position; ω, the frequency,
specifies how many nucleotide positions occur in aninterval; and j, the phase, specifies where the oscillationbegins at x = 0. The entire waveform appears to beshifted in x by the amount j. The peak is located at x =ωn + ω/4 - j if A is positive or x = ωn - ω/4 - j if A isnegative. We used SPSS statistical software (version16.0, SPSS, Chicago IL, USA) to estimate these para-meters for the model. We used the sum of squared resi-duals and the R2 as criteria to examine the fit betweenthe observed and predicted entropies.
Estimation of P-valuesIt is instructive to estimate whether the probability ofobserving a particular entropy value is equal to orgreater than chance. We randomly shuffled mononu-cleotides within each extracted sequence. We then rea-ligned these shuffled sequences to calculate the relativeentropy for each nucleotide position. This nucleotide-shuffling process, realignment and recalculation of rela-tive entropy were repeated 1,000 times. The number ofoccurrences of these randomized relative entropies thenbecame the P-value.
Codon shufflingThe role of codon usage frequencies on periodical sig-nals of relative entropy over neighbouring-nucleotidepositions was examined by randomly shuffling codonswithin each extracted reading frame. Each codon-shuffled sequence strictly retained the codon usage fre-quencies of the corresponding native sequence. We thenrealigned these codon-shuffled sequences in the samereading frame and computed the relative entropy ineach column of this alignment. This codon-shufflingprocess, realignment and recalculation were repeated1,000 times to obtain the mean and standard deviationof the relative entropy in each position.
Shuffling of synonymous codonsThe role of synonymous codon usage on periodical sig-nals of relative entropy was examined by randomly shuf-fling synonymous codons within a degenerate codon boxin each extracted reading frame, without changing theposition of any mononucleotide. In this way, the natureof protein sequences is totally preserved. We also rea-ligned these shuffled sequences by their original nucleo-tide positions in the same reading frame, and thencalculated the relative entropy in each column of thisalignment. This shuffling, realignment and recalculationwere repeated 1,000 times to obtain the mean and stan-dard deviation of the relative entropy in each position.
Multiple correspondence analysisWe applied the multiple correspondence analysis (MCA)of SPSS version 16.0 to study the relationship among
Figure 1 An example of a sequence alignment and a relativeentropy calculation. This example shows the calculation of therelative entropies along the neighbouring-nucleotide positions ofsubstitutions (C®T) that occurred at the third-codon positions. Inan extracted sequence, the substitution position is labelled as 0, the5’ flank as negative and the 3’ flank as positive. Extracted sequencesare aligned by these corresponding positions so that the alignmentis kept in the same reading frame. The frequencies P(Xi) of fourtypes of nucleotides for each column of this alignment are thenused to calculate the relative entropy at each neighbouring-nucleotide position (see Equation 1). In this example, all nucleotidesat site 0 (the substitution site) are T and the relative entropyapproximates - log2 [Q(XT)]≈ 2 bits at this site.
Ma et al. BMC Genomics 2010, 11:416http://www.biomedcentral.com/1471-2164/11/416
Page 3 of 15
gene GC content, substitutions and adjacent nucleotides.“Multiple correspondence analysis, also known as homo-geneity analysis, quantifies nominal (categorical) data byassigning numerical values to the cases (objects) andcategories, such that in the low-dimensional representa-tion of the data, objects within the same category areclose together and objects in different categories are farapart. Each object is as close as possible to the categorypoints of categories that apply to the object. In this way,the categories divide the objects into homogeneous sub-groups. Variables are considered homogeneous whenthey classify objects that are in the same categories intothe same subgroups” (see SPSS version 16.0 manual[25]). Further detailed information regarding MCA algo-rithms can be obtained in [26].MCA allows us to analyse the pattern of relationships
of several categorical dependent variables. Each nominalvariable comprises several categories in our study. Asmentioned above, the variable substitution containstwelve categories, i.e., A®C, A®G, A®T, C®A, C®T,C®G, G®A, G®C, G ®T, T®A, T®C and T®G.We then divided all genes involved in our study into sixgroups according to their GC contents: (1) GC% < 40%,(2) 40% <= GC% < 45%, (3) 45% <= GC% < 50%, (4)50% <= GC% < 55%, (5) 55% <= GC% < 60%, and (6)GC% >= 60%. Thus, the variable GC% consists of sixcategories. Next, we built another two variables. One isthe 5′ adjacent base, representing the 5′ (-1) nucleotidesimmediately adjacent to substitutions; the other is the 3′adjacent base, representing the 3′ (+1) nucleotidesimmediately adjacent to substitutions. Each of these twovariables contains four categories, i.e., A, C, G and T. Inthis way, a case (or object) in our study is to record onecategory of each of these four variables. We then
constructed a table with cases as rows and variables ascolumns, according to the SPSS data format (Additionalfile 2).
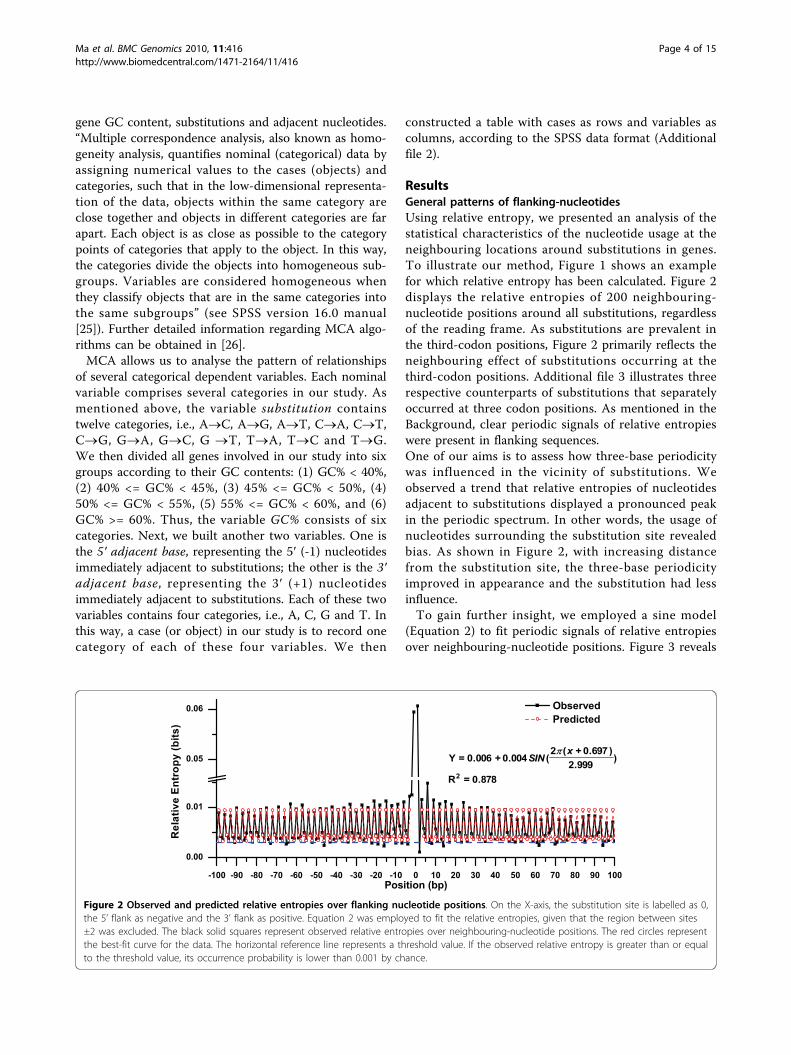
ResultsGeneral patterns of flanking-nucleotidesUsing relative entropy, we presented an analysis of thestatistical characteristics of the nucleotide usage at theneighbouring locations around substitutions in genes.To illustrate our method, Figure 1 shows an examplefor which relative entropy has been calculated. Figure 2displays the relative entropies of 200 neighbouring-nucleotide positions around all substitutions, regardlessof the reading frame. As substitutions are prevalent inthe third-codon positions, Figure 2 primarily reflects theneighbouring effect of substitutions occurring at thethird-codon positions. Additional file 3 illustrates threerespective counterparts of substitutions that separatelyoccurred at three codon positions. As mentioned in theBackground, clear periodic signals of relative entropieswere present in flanking sequences.One of our aims is to assess how three-base periodicitywas influenced in the vicinity of substitutions. Weobserved a trend that relative entropies of nucleotidesadjacent to substitutions displayed a pronounced peakin the periodic spectrum. In other words, the usage ofnucleotides surrounding the substitution site revealedbias. As shown in Figure 2, with increasing distancefrom the substitution site, the three-base periodicityimproved in appearance and the substitution had lessinfluence.To gain further insight, we employed a sine model
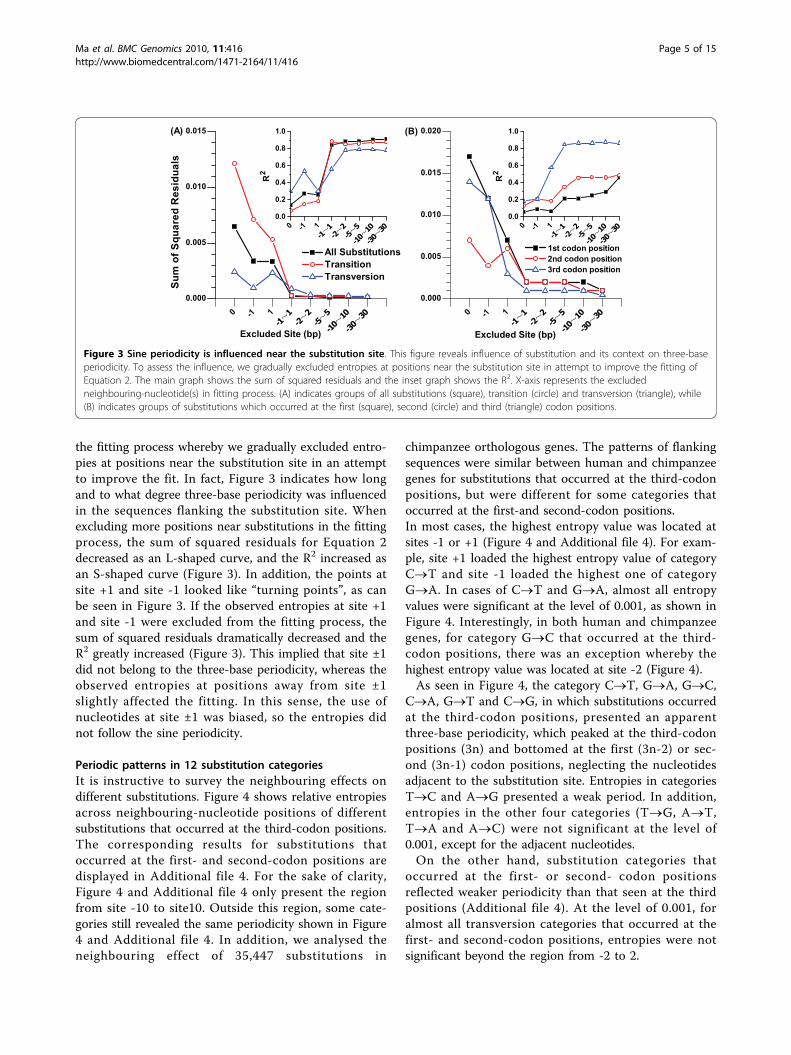
(Equation 2) to fit periodic signals of relative entropiesover neighbouring-nucleotide positions. Figure 3 reveals
Figure 2 Observed and predicted relative entropies over flanking nucleotide positions. On the X-axis, the substitution site is labelled as 0,the 5’ flank as negative and the 3’ flank as positive. Equation 2 was employed to fit the relative entropies, given that the region between sites±2 was excluded. The black solid squares represent observed relative entropies over neighbouring-nucleotide positions. The red circles representthe best-fit curve for the data. The horizontal reference line represents a threshold value. If the observed relative entropy is greater than or equalto the threshold value, its occurrence probability is lower than 0.001 by chance.
Ma et al. BMC Genomics 2010, 11:416http://www.biomedcentral.com/1471-2164/11/416
Page 4 of 15
the fitting process whereby we gradually excluded entro-pies at positions near the substitution site in an attemptto improve the fit. In fact, Figure 3 indicates how longand to what degree three-base periodicity was influencedin the sequences flanking the substitution site. Whenexcluding more positions near substitutions in the fittingprocess, the sum of squared residuals for Equation 2decreased as an L-shaped curve, and the R2 increased asan S-shaped curve (Figure 3). In addition, the points atsite +1 and site -1 looked like “turning points”, as canbe seen in Figure 3. If the observed entropies at site +1and site -1 were excluded from the fitting process, thesum of squared residuals dramatically decreased and theR2 greatly increased (Figure 3). This implied that site ±1did not belong to the three-base periodicity, whereas theobserved entropies at positions away from site ±1slightly affected the fitting. In this sense, the use ofnucleotides at site ±1 was biased, so the entropies didnot follow the sine periodicity.
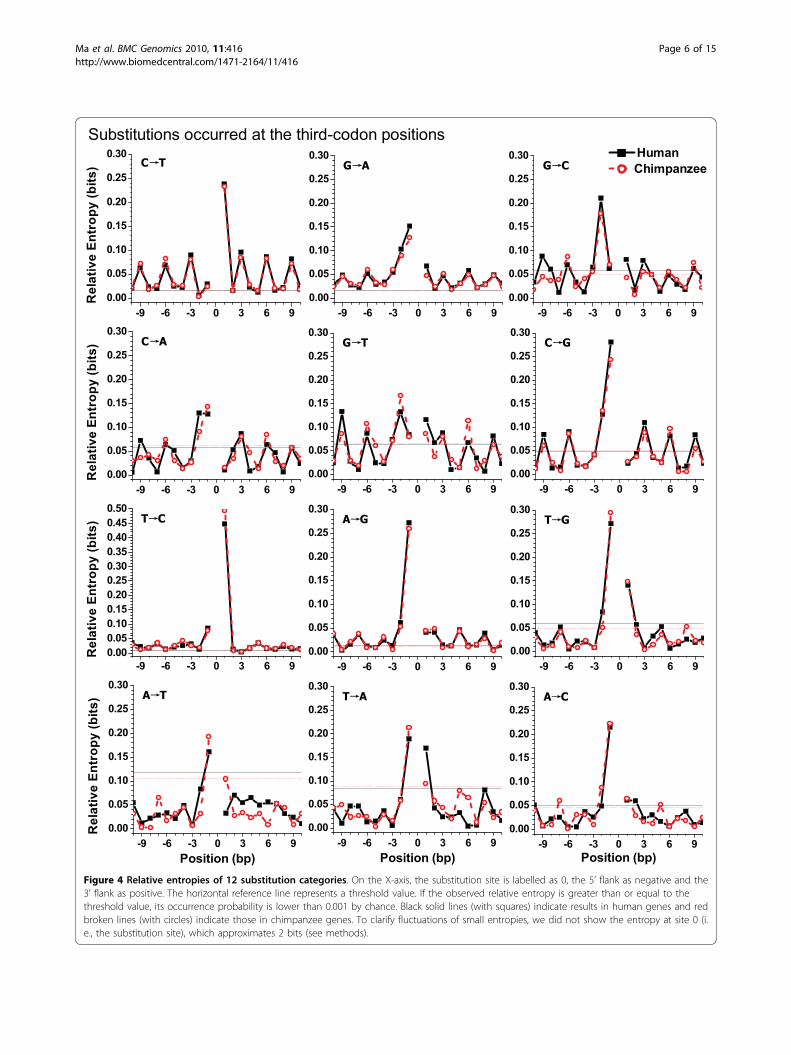
Periodic patterns in 12 substitution categoriesIt is instructive to survey the neighbouring effects ondifferent substitutions. Figure 4 shows relative entropiesacross neighbouring-nucleotide positions of differentsubstitutions that occurred at the third-codon positions.The corresponding results for substitutions thatoccurred at the first- and second-codon positions aredisplayed in Additional file 4. For the sake of clarity,Figure 4 and Additional file 4 only present the regionfrom site -10 to site10. Outside this region, some cate-gories still revealed the same periodicity shown in Figure4 and Additional file 4. In addition, we analysed theneighbouring effect of 35,447 substitutions in
chimpanzee orthologous genes. The patterns of flankingsequences were similar between human and chimpanzeegenes for substitutions that occurred at the third-codonpositions, but were different for some categories thatoccurred at the first-and second-codon positions.In most cases, the highest entropy value was located atsites -1 or +1 (Figure 4 and Additional file 4). For exam-ple, site +1 loaded the highest entropy value of categoryC®T and site -1 loaded the highest one of categoryG®A. In cases of C®T and G®A, almost all entropyvalues were significant at the level of 0.001, as shown inFigure 4. Interestingly, in both human and chimpanzeegenes, for category G®C that occurred at the third-codon positions, there was an exception whereby thehighest entropy value was located at site -2 (Figure 4).As seen in Figure 4, the category C®T, G®A, G®C,
C®A, G®T and C®G, in which substitutions occurredat the third-codon positions, presented an apparentthree-base periodicity, which peaked at the third-codonpositions (3n) and bottomed at the first (3n-2) or sec-ond (3n-1) codon positions, neglecting the nucleotidesadjacent to the substitution site. Entropies in categoriesT®C and A®G presented a weak period. In addition,entropies in the other four categories (T®G, A®T,T®A and A®C) were not significant at the level of0.001, except for the adjacent nucleotides.On the other hand, substitution categories that
occurred at the first- or second- codon positionsreflected weaker periodicity than that seen at the thirdpositions (Additional file 4). At the level of 0.001, foralmost all transversion categories that occurred at thefirst- and second-codon positions, entropies were notsignificant beyond the region from -2 to 2.
0 -1 1
0.000
0.005
0.010
0.015(A) (B)
All Substitutions Transition Transversion
Sum
of S
quar
ed R
esid
uals
Excluded Site (bp)
0 -1 1
0.000
0.005
0.010
0.015
0.020
1st codon position 2nd codon position 3rd codon position
Excluded Site (bp)
0 -1 10.0
0.2
0.4
0.6
0.8
1.0
R2
0 -1 10.0
0.2
0.4
0.6
0.8
1.0
R2
Figure 3 Sine periodicity is influenced near the substitution site. This figure reveals influence of substitution and its context on three-baseperiodicity. To assess the influence, we gradually excluded entropies at positions near the substitution site in attempt to improve the fitting ofEquation 2. The main graph shows the sum of squared residuals and the inset graph shows the R2. X-axis represents the excludedneighbouring-nucleotide(s) in fitting process. (A) indicates groups of all substitutions (square), transition (circle) and transversion (triangle), while(B) indicates groups of substitutions which occurred at the first (square), second (circle) and third (triangle) codon positions.
Ma et al. BMC Genomics 2010, 11:416http://www.biomedcentral.com/1471-2164/11/416
Substitutions occurred at the third-codon positions
Figure 4 Relative entropies of 12 substitution categories. On the X-axis, the substitution site is labelled as 0, the 5’ flank as negative and the3’ flank as positive. The horizontal reference line represents a threshold value. If the observed relative entropy is greater than or equal to thethreshold value, its occurrence probability is lower than 0.001 by chance. Black solid lines (with squares) indicate results in human genes and redbroken lines (with circles) indicate those in chimpanzee genes. To clarify fluctuations of small entropies, we did not show the entropy at site 0 (i.e., the substitution site), which approximates 2 bits (see methods).
Ma et al. BMC Genomics 2010, 11:416http://www.biomedcentral.com/1471-2164/11/416
Page 6 of 15
Native and simulated periodicitiesTo survey the reasons that could underlie the three-baseperiodicity in flanking sequences of substitutions, weestablished two control sets in which codons wereshuffled in two different manners. Table 1 and Addi-tional file 5 show the parameters of Equation 2 for fit-ting entropies in the native and simulated datasets.Because of the irregularity of the relative entropies inthe region from site -2 to +2, as mentioned above, weexcluded this region when estimating parameters in thenative and the synonymous-codon-shuffled datasets ofshown in Table 1 and Additional file 5.In the native dataset, at the threshold R2 value of 0.7,
Equation 2 is able to explain the three-base periodicityin 7 out of 12 substitution categories that occurred atthe third-codon positions (Table 1), implying that Equa-tion 2 was a good approximation for the three-base per-iodicity not in the vicinity of those substitutions.However, Equation 2 was not an ideal model for substi-tution categories that occurred at the first- and second-codon positions at the threshold R2 value of 0.7 (Addi-tional file 5). These may need a more complex modelthan is provided by Equation 2.In the first control set, in order to assess the role of
the codon usage frequencies on three-base periodicity insequences, we shuffled codons within each extractedreading frame. The order of codons was the only differ-ence between the native sequence and this artificial
coding sequence. Additional file 6 shows the relativeentropies of 21 nucleotide positions that were randomlychosen from this artificial dataset.Interestingly, we found a trend whereby the codon-
shuffled sequences revealed better periodicity than didthe native sequences (Additional file 6 and Table 1).The sine model (Equation 2) was a perfect model toexplain the three-base periodicity in the codon-shuffleddataset. In Table 1, all R2 values for the codon-shuffleddataset were greater than 0.9. However, in the nativedataset column of Table 1, only the R2 of categoryC®T was greater than 0.9, and the R2 of categoriesG®C, T®G, A®C, A®T, and T®A were lower than0.7. Furthermore, this trend was also observed in thecodon-shuffled dataset derived from substitutions thatoccurred at the first- and second-codon positions (Addi-tional file 5). As seen in Additional file 5, at the thresh-old R2 value of 0.7 for codon-shuffled dataset, Equation2 was able to fit the sine periodicity in all 12 substitu-tion categories that occurred at the first-codon positionsand in 10 out of 12 categories that occurred at the sec-ond-codon positions.In the second control condition, we tested the role of
synonymous codon usage on three-base periodicity byonly randomly exchanging synonymous codons within adegenerate codon box in each extracted reading frame.In this shuffling process, we did not change any positionof mononucleotides and strictly kept the native protein
Table 1 Parameters estimated by Equation 2 for substitutions occurring at the third-codon positions.
Category NativeA Codon shufflingB, D Synonymous codon shufflingC, D
R2 Peak Loc. A ω R2 Peak Loc. A ω R2 Peak Loc. A ω
A: Parameters for fitting the periodic signals in the native flanking sequences, given that the region between site ±2 was excluded. B: Parameters for fitting theperiodic signals in the corresponding codon-shuffled sequences. C: Parameters for fitting the periodic signals in the corresponding synonymous-codon-shuffledsequences, given that the region between site ±2 was excluded. D: Parameters were estimated from the mean for 1,000 independent random datasets. Thefollowing abbreviations and symbols are used in the table: Peak Loc represents peak location in the periodicity; A denotes amplitude; 3n means the multiple ofthree, corresponding to the third-codon positions; ω denotes how many nucleotide sites occur in an interval; All represents all substitutions; TS and TV representtransition and transversion, respectively.
Ma et al. BMC Genomics 2010, 11:416http://www.biomedcentral.com/1471-2164/11/416
Page 7 of 15
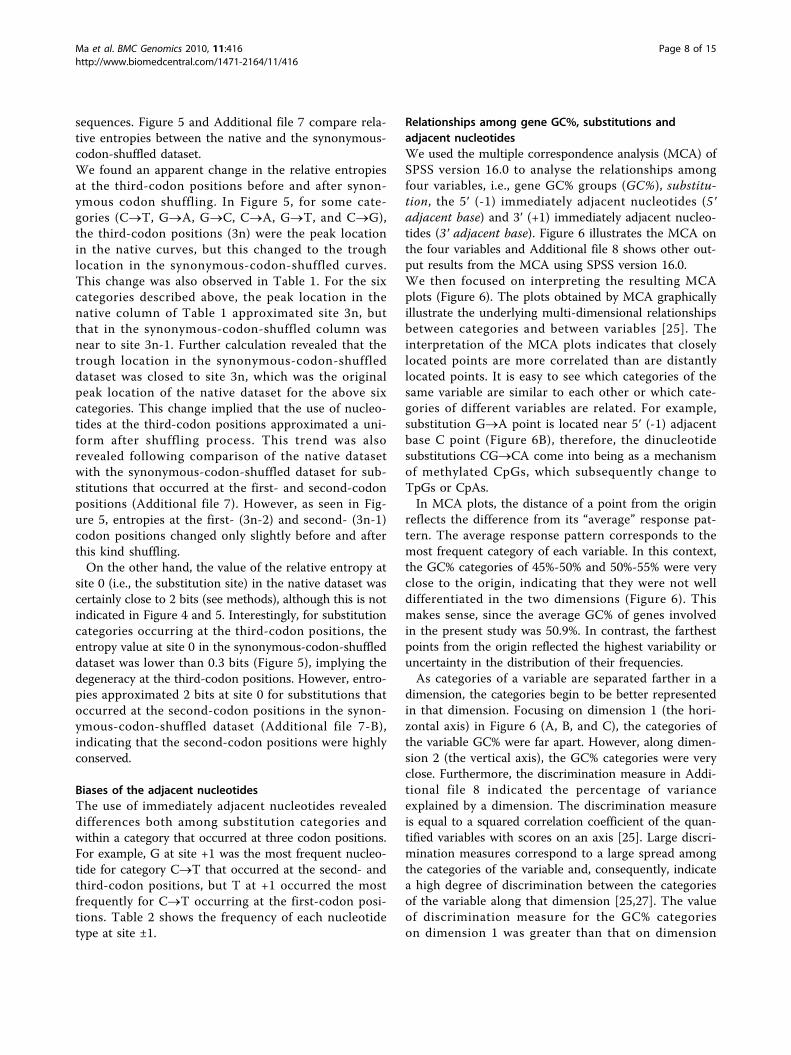
sequences. Figure 5 and Additional file 7 compare rela-tive entropies between the native and the synonymous-codon-shuffled dataset.We found an apparent change in the relative entropiesat the third-codon positions before and after synon-ymous codon shuffling. In Figure 5, for some cate-gories (C®T, G®A, G®C, C®A, G®T, and C®G),the third-codon positions (3n) were the peak locationin the native curves, but this changed to the troughlocation in the synonymous-codon-shuffled curves.This change was also observed in Table 1. For the sixcategories described above, the peak location in thenative column of Table 1 approximated site 3n, butthat in the synonymous-codon-shuffled column wasnear to site 3n-1. Further calculation revealed that thetrough location in the synonymous-codon-shuffleddataset was closed to site 3n, which was the originalpeak location of the native dataset for the above sixcategories. This change implied that the use of nucleo-tides at the third-codon positions approximated a uni-form after shuffling process. This trend was alsorevealed following comparison of the native datasetwith the synonymous-codon-shuffled dataset for sub-stitutions that occurred at the first- and second-codonpositions (Additional file 7). However, as seen in Fig-ure 5, entropies at the first- (3n-2) and second- (3n-1)codon positions changed only slightly before and afterthis kind shuffling.On the other hand, the value of the relative entropy at
site 0 (i.e., the substitution site) in the native dataset wascertainly close to 2 bits (see methods), although this is notindicated in Figure 4 and 5. Interestingly, for substitutioncategories occurring at the third-codon positions, theentropy value at site 0 in the synonymous-codon-shuffleddataset was lower than 0.3 bits (Figure 5), implying thedegeneracy at the third-codon positions. However, entro-pies approximated 2 bits at site 0 for substitutions thatoccurred at the second-codon positions in the synon-ymous-codon-shuffled dataset (Additional file 7-B),indicating that the second-codon positions were highlyconserved.
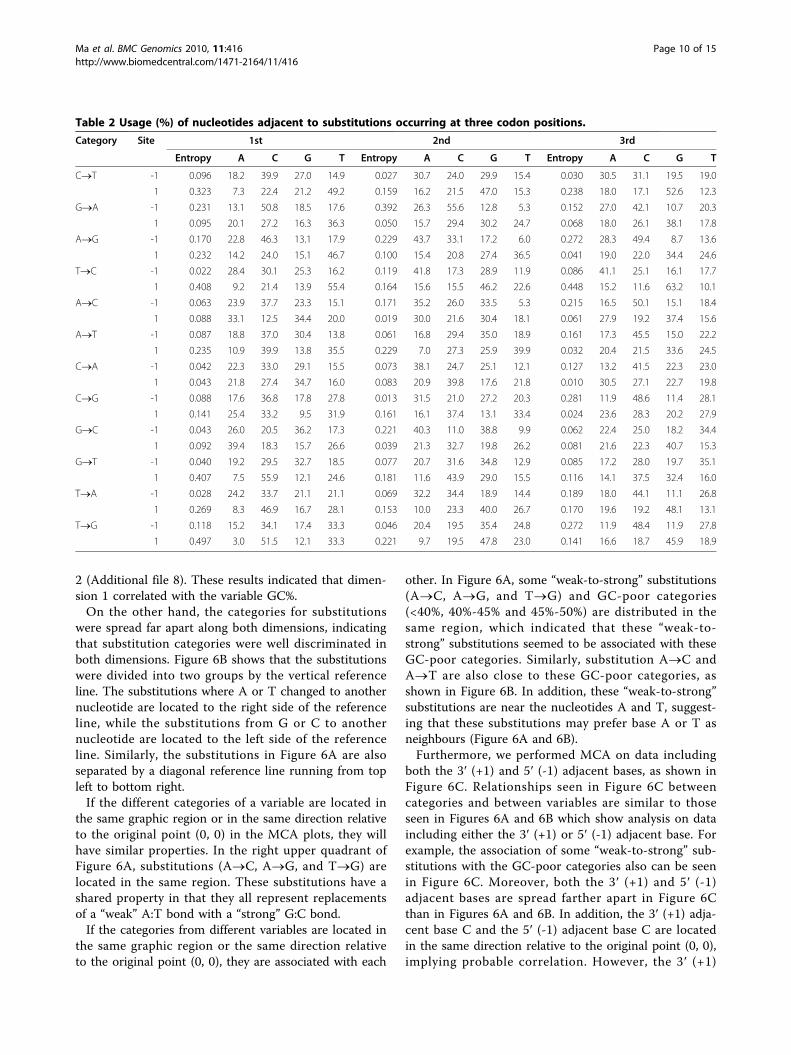
Biases of the adjacent nucleotidesThe use of immediately adjacent nucleotides revealeddifferences both among substitution categories andwithin a category that occurred at three codon positions.For example, G at site +1 was the most frequent nucleo-tide for category C®T that occurred at the second- andthird-codon positions, but T at +1 occurred the mostfrequently for C®T occurring at the first-codon posi-tions. Table 2 shows the frequency of each nucleotidetype at site ±1.
Relationships among gene GC%, substitutions andadjacent nucleotidesWe used the multiple correspondence analysis (MCA) ofSPSS version 16.0 to analyse the relationships amongfour variables, i.e., gene GC% groups (GC%), substitu-tion, the 5′ (-1) immediately adjacent nucleotides (5′adjacent base) and 3′ (+1) immediately adjacent nucleo-tides (3′ adjacent base). Figure 6 illustrates the MCA onthe four variables and Additional file 8 shows other out-put results from the MCA using SPSS version 16.0.We then focused on interpreting the resulting MCAplots (Figure 6). The plots obtained by MCA graphicallyillustrate the underlying multi-dimensional relationshipsbetween categories and between variables [25]. Theinterpretation of the MCA plots indicates that closelylocated points are more correlated than are distantlylocated points. It is easy to see which categories of thesame variable are similar to each other or which cate-gories of different variables are related. For example,substitution G®A point is located near 5′ (-1) adjacentbase C point (Figure 6B), therefore, the dinucleotidesubstitutions CG®CA come into being as a mechanismof methylated CpGs, which subsequently change toTpGs or CpAs.In MCA plots, the distance of a point from the origin
reflects the difference from its “average” response pat-tern. The average response pattern corresponds to themost frequent category of each variable. In this context,the GC% categories of 45%-50% and 50%-55% were veryclose to the origin, indicating that they were not welldifferentiated in the two dimensions (Figure 6). Thismakes sense, since the average GC% of genes involvedin the present study was 50.9%. In contrast, the farthestpoints from the origin reflected the highest variability oruncertainty in the distribution of their frequencies.As categories of a variable are separated farther in a
dimension, the categories begin to be better representedin that dimension. Focusing on dimension 1 (the hori-zontal axis) in Figure 6 (A, B, and C), the categories ofthe variable GC% were far apart. However, along dimen-sion 2 (the vertical axis), the GC% categories were veryclose. Furthermore, the discrimination measure in Addi-tional file 8 indicated the percentage of varianceexplained by a dimension. The discrimination measureis equal to a squared correlation coefficient of the quan-tified variables with scores on an axis [25]. Large discri-mination measures correspond to a large spread amongthe categories of the variable and, consequently, indicatea high degree of discrimination between the categoriesof the variable along that dimension [25,27]. The valueof discrimination measure for the GC% categorieson dimension 1 was greater than that on dimension
Ma et al. BMC Genomics 2010, 11:416http://www.biomedcentral.com/1471-2164/11/416
Substitutions occurred at the third-codon positions
Position (bp) Position (bp)Figure 5 Entropies in native and synonymous-codon-shuffled datasets. On the X-axis, the substitution site is labelled as 0, the 5’ flank asnegative and the 3’ flank as positive. The horizontal reference line represents a threshold value. If the observed relative entropy is greater thanor equal to the threshold value, its occurrence probability is lower than 0.001 by chance. Means and standard deviations for 1,000 independentlysynonymous-codon-shuffled samples are indicated by the red circles and blue error bars.
Ma et al. BMC Genomics 2010, 11:416http://www.biomedcentral.com/1471-2164/11/416
Page 9 of 15
2 (Additional file 8). These results indicated that dimen-sion 1 correlated with the variable GC%.On the other hand, the categories for substitutions
were spread far apart along both dimensions, indicatingthat substitution categories were well discriminated inboth dimensions. Figure 6B shows that the substitutionswere divided into two groups by the vertical referenceline. The substitutions where A or T changed to anothernucleotide are located to the right side of the referenceline, while the substitutions from G or C to anothernucleotide are located to the left side of the referenceline. Similarly, the substitutions in Figure 6A are alsoseparated by a diagonal reference line running from topleft to bottom right.If the different categories of a variable are located in
the same graphic region or in the same direction relativeto the original point (0, 0) in the MCA plots, they willhave similar properties. In the right upper quadrant ofFigure 6A, substitutions (A®C, A®G, and T®G) arelocated in the same region. These substitutions have ashared property in that they all represent replacementsof a “weak” A:T bond with a “strong” G:C bond.If the categories from different variables are located in
the same graphic region or the same direction relativeto the original point (0, 0), they are associated with each
other. In Figure 6A, some “weak-to-strong” substitutions(A®C, A®G, and T®G) and GC-poor categories(<40%, 40%-45% and 45%-50%) are distributed in thesame region, which indicated that these “weak-to-strong” substitutions seemed to be associated with theseGC-poor categories. Similarly, substitution A®C andA®T are also close to these GC-poor categories, asshown in Figure 6B. In addition, these “weak-to-strong”substitutions are near the nucleotides A and T, suggest-ing that these substitutions may prefer base A or T asneighbours (Figure 6A and 6B).Furthermore, we performed MCA on data including
both the 3′ (+1) and 5′ (-1) adjacent bases, as shown inFigure 6C. Relationships seen in Figure 6C betweencategories and between variables are similar to thoseseen in Figures 6A and 6B which show analysis on dataincluding either the 3′ (+1) or 5′ (-1) adjacent base. Forexample, the association of some “weak-to-strong” sub-stitutions with the GC-poor categories also can be seenin Figure 6C. Moreover, both the 3′ (+1) and 5′ (-1)adjacent bases are spread farther apart in Figure 6Cthan in Figures 6A and 6B. In addition, the 3′ (+1) adja-cent base C and the 5′ (-1) adjacent base C are locatedin the same direction relative to the original point (0, 0),implying probable correlation. However, the 3′ (+1)
Table 2 Usage (%) of nucleotides adjacent to substitutions occurring at three codon positions.
Ma et al. BMC Genomics 2010, 11:416http://www.biomedcentral.com/1471-2164/11/416
Page 10 of 15
adjacent base A is far away from the 5′ (-1) adjacentbase A.The MCA results confirm the previous view that a
GC-poor sequence may have more likelihood of nucleo-tide substitutions from A or T to another base [23]. The“weak-to-strong” substitutions may be influenced by theimmediately adjacent nucleotide A or T. These associa-tion could potentially result from variations in the
pattern of substitution, from localised selection forincreased GC content, or from biased gene conversion(BGC), which would favour fixation of “weak-to-strong”substitutions [28,29].
DiscussionThe aim of the present study was to uncover the pat-terns of nucleotides that flank one-base substitutions in
Figure 6 Relationship among gene GC% groups, substitution categories and adjacent nucleotides. The MCA of SPSS version 16.0 wasused to analyse the relationship among gene GC content, substitutions and adjacent nucleotides. Figure (A) represents the analysis for therelationship among the 3’ (+1) adjacent base, substitution categories and gene GC% groups. Figure (B) represents the analysis for therelationship among the 5’ (-1) adjacent base, substitution categories and gene GC% groups. Figure (C) represents the analysis for the relationshipamong the 3’ (+1) adjacent base, the 5’ (-1) adjacent base, substitution categories and gene GC% groups.
Ma et al. BMC Genomics 2010, 11:416http://www.biomedcentral.com/1471-2164/11/416
Page 11 of 15
human orthologous genes, in order to estimate howthree-base periodicity might be influenced in thesequences that flank substitutions. We used relativeentropy as a tool to characterise the use of nucleotidesthat flank substitutions. We then fitted a sine model tothe relative entropy values and verified that a period-three sine is a good approximation for periods at sitesnot in the close vicinity of some substitution categories.
Influence of substitution and its context on three-baseperiodicityThe present investigations suggested that the knownthree-base periodicity was affected in the context of sub-stitutions. The periodic patterns of flanking nucleotidesvaried both among substitution categories and within acategory that occurred at three codon positions. Periodicsignals in transversion categories cannot be explained bya sine model (Equation 2) at the R2 level of 0.7, indicat-ing that transversion may be prone to occur in codingsequences with a weak periodicity. In contrast, the sinemodel could explain the periodic behaviour in transitioncategories that occurred at the third-codon positions,implying that transition at the third-codon positionstended to take place in periodic sequences. In addition,in categories C®T and G®A, the nucleotide G pre-vailed in the first positions of some codons but did notdo so in the second positions of some codons (data notshown). This finding was highly consistent with theRNY model (R = purine, Y = pyrimidine and N = purineor pyrimidine)[11]. Therefore, it is reasonable to thinkthat substitution and its context influences the three-base periodicity in genes.A link probably appeared between periodicity inter-
ruption and substitutions. The most common situationwas one in which the periodicity was greatly affected inthe close vicinity of a substitution. The periodic signalswere interrupted near the substitution sites and theywould then reappear away from the substitution sites.The usage biases of the flanking nucleotides extend nofarther than two nucleotides from the substitution sites,similar to Krawczak’s study [10]. These results add afurther component for the study of substitutions ingenes.
Codon usage frequency is not the only origin of three-base periodicityWe also looked for the origin of three-base periodicityaround substitutions. To determine the contribution ofcodon usage frequencies to three-base periodicity, weshuffled each extracted reading frame at the codon level.The shuffled sequence kept a strict codon usage fre-quency in the corresponding native sequence. Thus, ifperiodic signals of the native flanking sequences were tobe determined by their codon usage frequencies alone,
codon shuffling would not lead to changes in the peri-odic signals, and we would also see no differencebetween the native and the shuffled sequences. How-ever, changes clearly appeared (Table1). Whether thenative sequences revealed a periodic signal or not, theircorresponding codon-shuffled sequences were reflectedin the three-base periodicity (Table 1). For example, inthe transversion categories, the native dataset presentedweak periodicity but its codon-shuffled set showedstrong periodicity (Table 1).Differences between native and simulated sequences
have also been reported in other studies [14]. However,these differences did not agree well with a previous sug-gestion [12] that codon usage frequencies should be thesource of DNA periodicity in exons. This disagreementprobably arose because the previous study emphasisedentire coding sequences, similarly to Figure 2. In com-parison, our study concentrated on the sequence contextof different substitutions. Therefore, differencesappeared when the individual substitution categorieswere probed. We could not explain the three-base peri-odicity by the codon usage frequencies alone.
Codon order determines the differences between thenative and codon-shuffled datasetsThe question arises, therefore, regarding the cause ofthe difference between the native and codon-shuffleddatasets. The only difference between a native sequenceand its corresponding codon-shuffled sequence is thecodon order seen in the reading frame. In this case, ran-dom changes in the native codon order lead to differ-ences between the native and shuffled sequences. Thecodon order of genes is associated with mRNA second-ary structure, encoded protein, DNA-protein interactionand other biological characteristics. In addition, the tri-plets in mRNA that are spaced in 3n distances can pro-duce three-base periodicity [13], indicating that certaincodon combinations probably result in the periodicity inexons [14]. Therefore, the order of codons in the nativesequences determines their differences from the codon-shuffled sequences, and also contributes to differencesin neighbouring effects among substitution categories.On the other hand, clearly periodic signals of the rela-
tive entropies tended to appear in the codon-shuffledsequences, even if these signals could not be identifiedin the corresponding native sequences (Table 1). A simi-lar study shows that simulated coding sequences, whichwere created using codon usage frequencies only,demonstrate DNA periodicity very similar to theobserved in real exons [12]. However, another studysuggested that three-base periodicity in biologicalsequences had specific characteristics not reproduced incomputer-generated exon-like sequences based oncodon usage frequencies [14]. This discrepancy may
Ma et al. BMC Genomics 2010, 11:416http://www.biomedcentral.com/1471-2164/11/416
Page 12 of 15
have arisen due to differences in methodology. The pre-vious study [14] found that some triplets in mRNAappeared several times at a fixed distance (e.g. 3n) with-out interruption, so that triplets provided a good peri-odicity. The method used in that study was very usefulin detecting triplets spaced by 3n distances in mRNA.For example, TTG triplets were found separated by 3, 3and 6 nucleotides in that study. However, if we do notconsider whether a triplet corresponds to a codon box;for instance, if we assume that TTG can occupy twocodon boxes (e.g., TT in the first codon box and G inthe following box), then codon-shuffling will certainlydestroy this type of triplet spacing at a 3n-fixed distancein the native sequence. Consequently, the triplet peri-odic signals would disappear.As mentioned in the Background, the relative entropy
is a windowless technique that does not depend on oli-gonucleotides. Thus, the relative entropy technique usesan entirely different process to find periodic signalscompared to the triplet technique. Furthermore, codonshuffling is prone to homogenise periodicities because itbreaks the native cluster of codons in genes and makescodons uniform in a codon-column of sequence align-ment. In this sense, periodicity in the codon-shuffledsequence reflects the usage bias of nucleotides amongthree codon positions.Thus, our results confirm that the three-base periodi-
city is a result of certain codon clusters within codingsequences. The length of the period equal to 3 is causedby the usage bias of nucleotides within the genetic code.
Synonymous codon usage bias is responsible for thethree-base periodicityThe synonymous-codon shuffling introduced associa-tions of codon degeneracy with three-base periodicity.Synonymous codons usually differ by nucleotides in thethird-codon positions, while a few synonymous codons(6-fold degenerate) differ in the first- or second-codonpositions. Thus, if we randomly changed synonymouscodons in a degenerate codon box, we primarily causedrandom changes in the nucleotides at the third-codonpositions. After synonymous codon shuffling, the use ofnucleotides at the third-codon positions was close touniform, resulting in loss of bias in the native sequences.In addition, by only varying two types of nucleotides inthe first- or second-codon positions, the 6-fold degener-ate codon groups could differ from each other. There-fore, entropy values at the third-codon positions inFigure 5, especially at site 0 (the substitution site),greatly decreased, whereas the values at the first- andsecond-codon positions changed only slightly. In otherwords, the bias of synonymous codon usage existedwithin the native coding sequences. The comparisonbetween the native and synonymous-codon-shuffled
dataset indicated that the usage bias of synonymouscodons could account for the three-base periodicity ingenes.Synonymous codons are not randomly used both
between genomes and among genes within a genome[27]. As mentioned in reference [30], many reasonsunderlie synonymous codon usage bias in codingsequences, including “ (i) diversity in the (G+C)% at thethird codon position [31], (ii) abundance of t-RNAmolecules [32], (iii) overall base composition of genes[33], (iv) differences in the expression level of the genes[34], (v) differences in the cellular location of the genesin the genome [35], (vi) optimal growth temperature[36-38] and (vii) protein secondary structures [39,40]”[30].
Limitations in flanking nucleotide lengthOur study had one clear limitation. If a substitution waslocated near one end of the coding sequence, insuffi-cient neighbouring nucleotides were available to studythe periodic signals. Thus, we only examined 100nucleotides flanking each side of a substitution. In total,91.99% of the available substitutions had 100 or morenucleotides on the 5′ flank, while 92.25% of substitutionshad 100 or more nucleotides on the 3′ flank. Neverthe-less, this length setup did not influence the analysis ofneighbouring effects near substitutions. In addition,some neighbouring effects agreed with what had beenpreviously reported about the nucleotide biases over 300nucleotides flanking SNPs [4].
ConclusionsThis study provides a useful way to illustrate unusualperiodic patterns in the context of substitutions andverifies that a sine model of period equal to 3 is agood approximation for the three-base periodicity atsites not in the close vicinity of some substitutions.Our results offer further insight into the origin of thethree-base periodicity. We confirm that the three-baseperiodicity is a result of certain codon clusters withincoding sequences [14]. The length of the period equalto 3 is caused by the usage bias of nucleotides withinsynonymous codons. Our investigation of the influenceof substitution and its context on the three-base peri-odicity in genes may be of great interest in analysinghuman genetic variation, as well as in designing genepredicting tools based on the principle of three-baseperiodicity.
Additional material
Additional file 1: Frequency of substitutions distributed in threerespective codon positions. This file shows the sample size of eachsubstitution category that occurred at three codon positions.
Ma et al. BMC Genomics 2010, 11:416http://www.biomedcentral.com/1471-2164/11/416
Additional file 2: Data for MCA. A table with cases as rows andvariables as columns according to the SPSS data format.
Additional file 3: Counterparts of Figure 2: Relative entropies in theflanking sequences of substitutions that separately occurred atthree codon positions. This file illustrates three respective counterpartsfor substitutions that separately occurred at three codon positions. Thefigure legend refers to Figure 2.
Additional file 4: Counterparts of Figure 4: Relative entropies for 12substitution categories that occurred at the first- and second-codonpositions. This file displays the corresponding results for 12 substitutioncategories that occurred at the first (A) and second (B) codon positions.The figure legend refers to Figure 4.
Additional file 5: Counterparts of Table 1: Parameters estimated byEquation 2 for substitution categories that occurred at the first-and second-codon positions. This file shows parameters estimated byEquation 2 for substitution categories that occurred at the first (A) andsecond (B) codon positions.
Additional file 6: Relative entropies of the nucleotide- and codon-shuffled datasets. This file illustrates relative entropies across 21nucleotide positions that were randomly chosen from nucleotide- andcodon-shuffled sequences. The figure legend refers to Figure 4 exceptfor labels on the X-axis. Points and error bars in the figures representmeans and standard deviations for 1,000 independently random samples.
Additional file 7: Counterparts of Figure 5: Entropies in native andsynonymous-codon-shuffled datasets for substitutions thatoccurred at the first (A) and second (B) codon positions. This fileillustrates relative entropies in the native and synonymous-codon-shuffled dataset for substitutions that occurred at the first (A) and second(B) codon positions. The figure legend refers to Figure 5.
Additional file 8: Output of SPSS MCA. This file illustrates the outputresults from the MCA of SPSS 16.0.
AcknowledgementsWe appreciate anonymous reviewers for instructive advices in manuscriptrevision. We are grateful to the Rhesus Macaque Genome Sequencing andAnalysis Consortium who contributed materials essential for the study. Wethank Jian Chen for analysis and interpretation of data. We would also liketo thank all the members in the Bioinformatics Centre in Northwest A&FUniversity for the daily useful discussions.
Author details1Bioinformatics Centre, Northwest A&F University, Yangling, Shaanxi, 712100,China. 2College of Life Science, Northwest A&F University, Yangling, Shaanxi,712100, China. 3College of Life Science, Shihezi University, Shihezi, Xinjiang,833200, China.
Authors’ contributionsLM has made contributions to conception, analysis and interpretation ofdata, and drafted the manuscript. TZ involved in revising the manuscriptcritically for important intellectual content and performed statistical analysis.ZH and XJ proposed many additional suggestions for improvingperformance of computer programs. ST conceived the study, participated inits design and supported the research. All authors read and approved thefinal manuscript.
Received: 20 January 2010 Accepted: 5 July 2010 Published: 5 July 2010
References1. Donigan KA, Sweasy JB: Sequence context-specific mutagenesis and base
excision repair. Mol Carcinog 2009, 48:362-368.2. Nakken S, Rodland EA, Rognes T, Hovig E: Large-scale inference of the
point mutational spectrum in human segmental duplications. BMCGenomics 2009, 10:43.
3. Jiang C, Zhao Z: Directionality of point mutation and 5-methylcytosinedeamination rates in the chimpanzee genome. BMC Genomics 2006,7:316.
4. Zhao Z, Boerwinkle E: Neighboring-nucleotide effects on singlenucleotide polymorphisms: a study of 2.6 million polymorphisms acrossthe human genome. Genome Res 2002, 12:1679-1686.
5. Tomso D, Bell D: Sequence context at human single nucleotidepolymorphisms: overrepresentation of CpG dinucleotide at polymorphicsites and suppression of variation in CpG islands. J Mol Biol 2003,327:303-308.
6. Zhao Z, Zhang F: Sequence context analysis of 8.2 million singlenucleotide polymorphisms in the human genome. Gene 2006,366:316-324.
7. Zhao Z, Zhang F: Sequence context analysis in the mouse genome:single nucleotide polymorphisms and CpG island sequences. Genomics2006, 87:68-74.
8. Morton B: The role of context-dependent mutations in generatingcompositional and codon usage bias in grass chloroplast DNA. J Mol Evol2003, 56:616-629.
9. Morton B, Oberholzer V, Clegg M: The influence of specific neighboringbases on substitution bias in noncoding regions of the plant chloroplastgenome. J Mol Evol 1997, 45:227-231.
10. Krawczak M, Ball E, Cooper D: Neighboring-nucleotide effects on the ratesof germ-line single-base-pair substitution in human genes. Am J HumGenet 1998, 63:474-488.
11. Trifonov EN: 3-, 10.5-, 200- and 400-base periodicities in genomesequences. Physica a-Statistical Mechanics and Its Applications 1998,249:511-516.
12. Eskesen ST, Eskesen FN, Kinghorn B, Ruvinsky A: Periodicity of DNA inexons. Bmc Molecular Biology 2004, 5.
13. Lopez-Villasenor I, Jose MV, Sanchez J: Three-base periodicity patterns andself-similarity in whole bacterial chromosomes. Biochem Biophys ResCommun 2004, 325:467-478.
14. Sanchez J, Lopez-Villasenor I: A simple model to explain three-baseperiodicity in coding DNA. FEBS Lett 2006, 580:6413-6422.
15. Yin CC, Yau SST: Prediction of protein coding regions a DNA by the 3-base periodicity analysis of sequence. Journal of Theoretical Biology 2007,247:687-694.
16. Trifonov E: Translation framing code and frame-monitoring mechanismas suggested by the analysis of mRNA and 16 S rRNA nucleotidesequences. J Mol Biol 1987, 194:643-652.
17. Frenkel FE, Korotkov EV: Using triplet periodicity of nucleotide sequencesfor finding potential reading frame shifts in genes. DNA Res 2009,16:105-114.
18. Gibbs R, Rogers J, Katze M, Bumgarner R, Weinstock G, Mardis E,Remington K, Strausberg R, Venter J, Wilson R, Batzer M, Bustamante C,Eichler E, Hahn M, Hardison R, Makova K, Miller W, Milosavljevic A,Palermo R, Siepel A, Sikela J, Attaway T, Bell S, Bernard K, Buhay C,Chandrabose M, Dao M, Davis C, Delehaunty K, Ding Y, Dinh H, Dugan-Rocha S, Fulton L, Gabisi R, Garner T, Godfrey J, Hawes A, Hernandez J,Hines S, Holder M, Hume J, Jhangiani S, Joshi V, Khan Z, Kirkness E, Cree A,Fowler R, Lee S, Lewis L, Li Z, Liu Y, Moore S, Muzny D, Nazareth L, Ngo D,Okwuonu G, Pai G, Parker D, Paul H, Pfannkoch C, Pohl C, Rogers Y, Ruiz S,Sabo A, Santibanez J, Schneider B, Smith S, Sodergren E, Svatek A,Utterback T, Vattathil S, Warren W, White C, Chinwalla A, Feng Y, Halpern A,Hillier L, Huang X, Minx P, Nelson J, Pepin K, Qin X, Sutton G, Venter E,Walenz B, Wallis J, Worley K, Yang S, Jones S, Marra M, Rocchi M, Schein J,Baertsch R, Clarke L, Csürös M, Glasscock J, Harris R, Havlak P, Jackson A,Jiang H, Liu Y, Messina D, Shen Y, Song H, Wylie T, Zhang L, Birney E,Han K, Konkel M, Lee J, Smit A, Ullmer B, Wang H, Xing J, Burhans R,Cheng Z, Karro J, Ma J, Raney B, She X, Cox M, Demuth J, Dumas L, Han S,Hopkins J, Karimpour-Fard A, Kim Y, Pollack J, Vinar T, Addo-Quaye C,Degenhardt J, Denby A, Hubisz M, Indap A, Kosiol C, Lahn B, Lawson H,Marklein A, Nielsen R, Vallender E, Clark A, Ferguson B, Hernandez R,Hirani K, Kehrer-Sawatzki H, Kolb J, Patil S, Pu L, Ren Y, Smith D, Wheeler D,Schenck I, Ball E, Chen R, Cooper D, Giardine B, Hsu F, Kent W, Lesk A,Nelson D, O’brien W, Prüfer K, Stenson P, Wallace J, Ke H, Liu X, Wang P,Xiang A, Yang F, Barber G, Haussler D, Karolchik D, Kern A, Kuhn R, Smith K,Zwieg A: Evolutionary and biomedical insights from the rhesus macaquegenome. Science 2007, 316:222-234.
Measurement and Statistics Thousand Oaks (CA): SageSalkind NJ 2007,657-663.
27. Suzuki H, Brown CJ, Forney LJ, Top EM: Comparison of correspondenceanalysis methods for synonymous codon usage in bacteria. DNA Res2008, 15:357-365.
28. Galtier N, Piganeau G, Mouchiroud D, Duret L: GC-content evolution inmammalian genomes: the biased gene conversion hypothesis. Genetics2001, 159:907-911.
29. Berglund J, Pollard KS, Webster MT: Hotspots of biased nucleotidesubstitutions in human genes. PLoS Biol 2009, 7:e26.
30. Mukhopadhyay P, Basak S, Ghosh TC: Synonymous codon usage indifferent protein secondary structural classes of human genes:implication for increased non-randomness of GC3 rich genes towardsprotein stability. J Biosci 2007, 32:947-963.
31. Alvarez F, Robello C, Vignali M: Evolution of codon usage and basecontents in kinetoplastid protozoans. Mol Biol Evol 1994, 11:790-802.
32. Ikemura T: Codon usage and tRNA content in unicellular andmulticellular organisms. Mol Biol Evol 1985, 2:13-34.
33. Ellis JT, Morrison DA: Schistosoma mansoni: patterns of codon usage andbias. Parasitology 1995, 110(Pt 1):53-60.
34. Pouwels PH, Leunissen JA: Divergence in codon usage of Lactobacillusspecies. Nucleic Acids Res 1994, 22:929-936.
35. Chiapello H, Ollivier E, Landes-Devauchelle C, Nitschke P, Risler JL: Codonusage as a tool to predict the cellular location of eukaryotic ribosomalproteins and aminoacyl-tRNA synthetases. Nucleic Acids Res 1999,27:2848-2851.
36. Lynn DJ, Singer GA, Hickey DA: Synonymous codon usage is subject toselection in thermophilic bacteria. Nucleic Acids Res 2002, 30:4272-4277.
37. Basak S, Banerjee T, Gupta SK, Ghosh TC: Investigation on the causes ofcodon and amino acid usages variation between thermophilic Aquifexaeolicus and mesophilic Bacillus subtilis. J Biomol Struct Dyn 2004,22:205-214.
38. Basak S, Ghosh TC: Temperature adaptation of synonymous codon usagein different functional categories of genes: a comparative studybetween homologous genes of Methanococcus jannaschii andMethanococcus maripaludis. FEBS Lett 2006, 580:3895-3899.
39. Kahali B, Basak S, Ghosh TC: Reinvestigating the codon and amino acidusage of S. cerevisiae genome: a new insight from protein secondarystructure analysis. Biochem Biophys Res Commun 2007, 354:693-699.
40. Adzhubei AA, Adzhubei IA, Krasheninnikov IA, Neidle S: Non-random usageof ‘degenerate’ codons is related to protein three-dimensional structure.FEBS Lett 1996, 399:78-82.
doi:10.1186/1471-2164-11-416Cite this article as: Ma et al.: Patterns of nucleotides that flanksubstitutions in human orthologous genes. BMC Genomics 2010 11:416.
Submit your next manuscript to BioMed Centraland take full advantage of:
• Convenient online submission
• Thorough peer review
• No space constraints or color figure charges
• Immediate publication on acceptance
• Inclusion in PubMed, CAS, Scopus and Google Scholar
• Research which is freely available for redistribution
Submit your manuscript at www.biomedcentral.com/submit
Ma et al. BMC Genomics 2010, 11:416http://www.biomedcentral.com/1471-2164/11/416


![Biochem 22 [Nucleotides]](https://static.documents.pub/doc/80x56/577c82b31a28abe054b1e527/biochem-22-nucleotides.jpg)


