Journal of Sedimentary Research, 2012, v. 82, 859–870 Research Article DOI: 10.2110/jsr.2012.77 PATTERNS OF SEDIMENTATION IN THE CONTEMPORARY RED SEA AS AN ANALOG FOR ANCIENT CARBONATES IN RIFT SETTINGS SAM J. PURKIS, 1 PAUL M. (MITCH) HARRIS, 2 AND JAMES ELLIS 3 1 National Coral Reef Institute, Nova Southeastern University, 8000 North Ocean Drive, Dania Beach, Florida 33004, U.S.A., 2 Chevron Energy Technology Company, 6001 Bollinger Canyon Road, D-1212, San Ramon, California 94583, U.S.A. 3 Ellis GeoSpatial, 1839 Ygnacio Valley Road, #229, Walnut Creek, California 94598, U.S.A. e-mail: [email protected]ABSTRACT: Patterns of sedimentation in the Red Sea offer a contemporary analog for carbonate deposition in marine rift settings. Covering 20u of latitude, the sea is sufficiently long to display pronounced climate differences and the clear tropical waters support vigorous coral reef growth and associated production of carbonate sediment. Six focus areas within the Red Sea, each covering exactly 1,600 sq. km, illustrate the variability of spatial patterns in reefal and other carbonates in this rift setting. Five of the focus areas are located on a north–south transect along the western margin of the sea: (1) Gubal Straits (Egypt), (2) Shalatayn (Egypt), (3) Trinkitat (Sudan), (4) Dahlak (Eritrea), and (5) Halib (Eritrea); and one is from the eastern margin: (6) Farasan Banks (Saudi Arabia). Using Landsat imagery, water depth and two marine facies classes, ‘‘reefal frameworks’’ and ‘‘sediments,’’ were mapped. Lumping these two classes define ‘‘carbonate bodies’’ that were analyzed for trends in orientation, relation to local fault networks, and size-frequency distribution. Fault lineaments digitized from the literature are closely related to the orientation of carbonate bodies with areas exceeding 5 sq. km. Smaller bodies do not preferentially align with fault trends. Water depth and the occurrence of reefal frameworks and sediments for the six focus areas are not systematically related. Used as an analog, these data from the contemporary Red Sea may provide insight into the orientation and scale of accumulation of carbonates in subsurface marine rift settings. INTRODUCTION Cutting NNW to SSE across a Precambrian shield, the Red Sea covers 20u of latitude. This basin is sufficiently long to display pronounced climate differences, driven by increased monsoonal influence of the Indian Ocean that creates a north–south gradient in aridity. The clear tropical waters of the Red Sea support vigorous coral reef growth and associated production of carbonate sediment. Miocene and younger carbonate successions in this area attain thicknesses of 450 m (Bosence 2005). The Red Sea is an active rift system; spreading began in the late Oligocene and evolved from a series of continental lacustrine depressions into today’s 2,200 m deep marine trough. Carbonate-dominated marine rifts are common in the geological record, as rift basins provide many shallow-water sites for the establishment of carbonate platforms (Cross and Bosence 2008; Bosence 2012). Receiving only sparse attention in the literature, few well-documented ancient examples exist, however, where platform geometry and shallow marine carbonate facies distribution can be shown to be controlled by rift-related faulting. One example comes from the mid-Miocene Gulf of Suez rift. Here, the geometry of carbonate accumulation is governed by extensional fault-block topogra- phy (Burchette 1988; Cross et al. 1998; Cross and Bosence 2008). In this system in onshore Egypt, structural control is imparted predominantly by marginal half-grabens. Dorobek (2008) reviews several Tertiary and Mesozoic examples of syn-rift to early post-rift platforms, where extensional faults control morphology, orientation, and stratigraphy of carbonates. Given the relatively few ancient examples to illustrate styles of carbonate sedimentation under conditions of extensional tectonism, the Modern Red Sea is interesting in that it may offer conceptual models that can be extrapolated to yield a better understanding of rift-type basins in general, and especially their economically important sedimentary fills and possible reservoir distribution. Fault-block carbonate platforms also represent important hydrocarbon producing reservoirs themselves (e.g., Erlich et al. 1990; Erlich et al. 1993; Gro ¨ tsch and Mercadier 1999; Fournier et al. 2005; Bosence 2012). The Red Sea potentially represents a modern analog for early and post-rift marine carbonate sedimentation. The aim of this manuscript is to use the Modern Red Sea to explore local and regional controls on shallow-water carbonate facies geometry in an extensional tectonic setting. The results of this study quantitatively illustrate spatial patterns that could provide insight into the geometry and scales of accumulation of carbonate bodies in subsurface analogs. BACKGROUND The Red Sea coast is characterized by an almost uninterrupted belt of fringing reefs, as well as barrier reefs and even atolls. Effectively lacking a continental shelf, spectacular steeply sloping drop-offs restrict shallow- water carbonate production to small surface areas. Sediment is almost exclusively skeletal. Below the euphotic zone, carbonate production takes the form of Globigerina-rich marl and deepwater limestone (Hofmann et al. 1998; Bosworth et al. 2005). Fringing reefs grow close to the mainland with first-order control on their arrangement and orientation imparted by the tectonic grain of the Red Sea rift (Dullo and Montaggioni 1998; Bosence 2012). Secondary control is exerted by siliciclastic input from the hinterland. Fringing reefs, for example, are typically absent in wadi Published Online: November 2012 Copyright E 2012, SEPM (Society for Sedimentary Geology) 1527-1404/12/xxx-xxx/$03.00
Transcript
Journal of Sedimentary Research, 2012, v. 82, 859–870
Research Article
DOI: 10.2110/jsr.2012.77
PATTERNS OF SEDIMENTATION IN THE CONTEMPORARY RED SEA AS AN ANALOG FOR ANCIENTCARBONATES IN RIFT SETTINGS
SAM J. PURKIS,1 PAUL M. (MITCH) HARRIS,2 AND JAMES ELLIS3
3
1National Coral Reef Institute, Nova Southeastern University, 8000 North Ocean Drive, Dania Beach, Florida 33004, U.S.A.,2Chevron Energy Technology Company, 6001 Bollinger Canyon Road, D-1212, San Ramon, California 94583, U.S.A.
3Ellis GeoSpatial, 1839 Ygnacio Valley Road, #229, Walnut Creek, California 94598, U.S.A.
ABSTRACT: Patterns of sedimentation in the Red Sea offer a contemporary analog for carbonate deposition in marine rift settings.Covering 20u of latitude, the sea is sufficiently long to display pronounced climate differences and the clear tropical waters supportvigorous coral reef growth and associated production of carbonate sediment. Six focus areas within the Red Sea, each covering exactly1,600 sq. km, illustrate the variability of spatial patterns in reefal and other carbonates in this rift setting. Five of the focus areas arelocated on a north–south transect along the western margin of the sea: (1) Gubal Straits (Egypt), (2) Shalatayn (Egypt), (3) Trinkitat(Sudan), (4) Dahlak (Eritrea), and (5) Halib (Eritrea); and one is from the eastern margin: (6) Farasan Banks (Saudi Arabia). UsingLandsat imagery, water depth and two marine facies classes, ‘‘reefal frameworks’’ and ‘‘sediments,’’ were mapped. Lumping these twoclasses define ‘‘carbonate bodies’’ that were analyzed for trends in orientation, relation to local fault networks, and size-frequencydistribution. Fault lineaments digitized from the literature are closely related to the orientation of carbonate bodies with areasexceeding 5 sq. km. Smaller bodies do not preferentially align with fault trends. Water depth and the occurrence of reefal frameworksand sediments for the six focus areas are not systematically related. Used as an analog, these data from the contemporary Red Seamay provide insight into the orientation and scale of accumulation of carbonates in subsurface marine rift settings.
INTRODUCTION
Cutting NNW to SSE across a Precambrian shield, the Red Sea covers20u of latitude. This basin is sufficiently long to display pronouncedclimate differences, driven by increased monsoonal influence of theIndian Ocean that creates a north–south gradient in aridity. The cleartropical waters of the Red Sea support vigorous coral reef growth andassociated production of carbonate sediment. Miocene and youngercarbonate successions in this area attain thicknesses of 450 m (Bosence2005). The Red Sea is an active rift system; spreading began in the lateOligocene and evolved from a series of continental lacustrine depressionsinto today’s 2,200 m deep marine trough.
Carbonate-dominated marine rifts are common in the geological record,as rift basins provide many shallow-water sites for the establishment ofcarbonate platforms (Cross and Bosence 2008; Bosence 2012). Receivingonly sparse attention in the literature, few well-documented ancient examplesexist, however, where platform geometry and shallow marine carbonatefacies distribution can be shown to be controlled by rift-related faulting. Oneexample comes from the mid-Miocene Gulf of Suez rift. Here, the geometryof carbonate accumulation is governed by extensional fault-block topogra-phy (Burchette 1988; Cross et al. 1998; Cross and Bosence 2008). In thissystem in onshore Egypt, structural control is imparted predominantly bymarginal half-grabens. Dorobek (2008) reviews several Tertiary andMesozoic examples of syn-rift to early post-rift platforms, where extensionalfaults control morphology, orientation, and stratigraphy of carbonates.
Given the relatively few ancient examples to illustrate styles ofcarbonate sedimentation under conditions of extensional tectonism, the
Modern Red Sea is interesting in that it may offer conceptual models thatcan be extrapolated to yield a better understanding of rift-type basins ingeneral, and especially their economically important sedimentary fills andpossible reservoir distribution. Fault-block carbonate platforms alsorepresent important hydrocarbon producing reservoirs themselves (e.g.,Erlich et al. 1990; Erlich et al. 1993; Grotsch and Mercadier 1999;Fournier et al. 2005; Bosence 2012). The Red Sea potentially represents amodern analog for early and post-rift marine carbonate sedimentation.The aim of this manuscript is to use the Modern Red Sea to explore localand regional controls on shallow-water carbonate facies geometry in anextensional tectonic setting. The results of this study quantitativelyillustrate spatial patterns that could provide insight into the geometry andscales of accumulation of carbonate bodies in subsurface analogs.
BACKGROUND
The Red Sea coast is characterized by an almost uninterrupted belt offringing reefs, as well as barrier reefs and even atolls. Effectively lacking acontinental shelf, spectacular steeply sloping drop-offs restrict shallow-water carbonate production to small surface areas. Sediment is almostexclusively skeletal. Below the euphotic zone, carbonate production takesthe form of Globigerina-rich marl and deepwater limestone (Hofmann etal. 1998; Bosworth et al. 2005). Fringing reefs grow close to the mainlandwith first-order control on their arrangement and orientation imparted bythe tectonic grain of the Red Sea rift (Dullo and Montaggioni 1998;Bosence 2012). Secondary control is exerted by siliciclastic input from thehinterland. Fringing reefs, for example, are typically absent in wadi
Published Online: November 2012
Copyright E 2012, SEPM (Society for Sedimentary Geology) 1527-1404/12/xxx-xxx/$03.00
mouths (Braithwaite 1982; Montaggioni et al. 1986; Turak et al. 2007),but not always so (Gvirtznam et al. 1977; Dullo and Montaggioni 1998).Barrier reefs and atolls become more prevalent in the central, andparticularly the southern, portions of the basin (Bantan 1999; Reinicke etal. 2003; Rowlands et al. 2012). The Farasan Archipelago, on the easternmargin of the sea, and its western-margin counterpart, the DahlakArchipelago, both sit atop broad shallow shelves that extend hundreds ofkilometers out towards the deep central axis of the rift. The developmentof offshore reefs is particularly pronounced in these archipelagos, whereasfringing reefs become stifled by siliciclastic influence. Though far offshorefrom the coast, the reef-crest outlines and the orientation of foreslopes forthese buildups, like the nearshore fringes farther north, broadly follow thetectonic framework of the rift (Dullo and Montaggioni 1998). The9,600 sq. km of Landsat mapping conducted for this study allow adetailed examination of the arrangement of carbonate facies from thenorthern to southern limits of the Red Sea.
QUANTITATIVE METHODS
Satellite Mapping of Facies
This study employs Landsat 7 ETM+ data to image six 1,600 sq. kmfocus areas distributed along the eastern and western margins of the RedSea (Fig. 1). These locations encompass the latitudinal range of shallow-water carbonate deposits in this basin. Three of the six focus areas (GubalStraits, Dahlak, and Halib) have offshore islands. The remaining three(Shalatayn, Trinkitat, and Farasan) do not.
There is a long lineage of using satellite remote sensing for mapping thearrangement of spectral lithotopes in the Red Sea (Bantan 1999; Purkis etal. 2002; Purkis and Pasterkamp 2004; Purkis et al. 2010; Harris et al.2012; Rowlands et al. 2012). Segmentation of the Landsat imagery intolithotopes—interpreted to be distinct bodies of uniform sediment—wasachieved using a combination of edge detection, spectral and texturalanalysis, and manual editing. A facies map for each focus area wasgenerated by assigning lithotopes to one of four classes; reefalframeworks (5 primarily boundstone), sediments (5 skeletal grain-stone), emergent (5 siliciclastic and/or carbonate), and deep water(5 basinal mud) (Figs. 2, 3). This assignment was conducted manuallyand, following Harris and Vlaswinkel (2008), color, texture, shape, andcontext relative to other facies were the objective reproducible criteriaused to assign each lithotope into a facies class. This attribution wasconducted using the object-based image-analysis software eCognition.This method of facies mapping is subjective, so care was taken tomaintain consistency in the attribution process and to test forrepeatability.
Mapping was first conducted for the three focus areas (Farasan,Dahlak, and Gubal) where seabed maps were available for all or part ofthe focus area. The map of Farasan was validated against the biotopemaps of Rowlands et al. (2012), the map of Dahlak against Carbone et al.(1998), and the map of Gubal against Hamouda and El-Wahhab (2012).Knowledge from these focus areas was used to guide facies mapping inthe three remaining focus areas, which lacked independent information.Resultant maps from all six focus areas were further checked againstultra-high-resolution QuickBird (2.4 m pixel) or WorldView-2 (1.8 mpixel) satellite images tendered by Google Earth and against geospatiallyregistered United Kingdom Hydrographic Office (UKHO) nauticalcharts. As was the case with Rankey (2002) and Harris and Vlaswinkel(2008), it was not possible to measure classification accuracy quantita-tively (cf. Purkis and Pasterkamp 2004). Qualitative inspection, however,suggests that the maps truthfully capture the facies arrangements of thesix focus areas.
Given that emergent areas are spectrally distinct from submerged areasin the infrared wavelengths (Landsat bands 5–7), it can be expected thatfacies class ‘‘emergent’’ to be close to 100% accurate. Simultaneous
inspection of the blue and red Landsat channels (bands 1 and 3) canreliably be used to identify pixels that do not contain a spectralcontribution from the seabed (blue band), but are also unaffected byturbidity (red band). Hence, facies class ‘‘deep water’’ should also be closeto 100% accurate. Prediction of accuracy for the attribution of ‘‘sediments’’and ‘‘reefal frameworks’’ is less straightforward inasmuch as the spectraldifference between the two is less dramatic than for emergent and deep-water areas. This said, when viewing an RGB image composed of Landsatbands 1, 2, and 3, the two facies can be clearly distinguished (Harris andVlaswinkel 2008). Sediments are highly reflective and, in the imagery, canbe recognized by their homogeneous white color and visible bedforms. Bycontrast, reefal frameworks are less reflective, honey-brown to green incolor, and have more angular geometries. In lieu of these pronounceddifferences, a high degree of confusion between classes ‘‘sediments’’ and‘‘reefal frameworks’’ is not anticipated for the six facies maps.
Prior to analysis, facies classes ‘‘sediments’’ and ‘‘reefal frameworks’’were lumped to deliver an extra map category, ‘‘carbonate facies.’’ Fromhere forward, discrete units of the ‘‘carbonate facies’’ category are termed‘‘carbonate bodies.’’
Although the maps could be compared qualitatively, a suite ofmorphometric parameters were extracted from GIS shape files for thecarbonate bodies. Data were then quantitatively analyzed for trends andpatterns.
Quantifying the Relationship in Orientation of Carbonate Bodies andFault Lineaments
To quantitatively examine trends, orientations of all carbonate bodieswere calculated for the six focus areas by fitting an ellipse to each bodyand by matching first- and second-order moments. The orientationmeasurement was taken to be the orientation of the major axis of thefitted ellipse (following Haralick and Shapiro 1992).
To ascertain whether the orientation of carbonate bodies is tectonicallyinfluenced, fault maps from the literature (Crane and Bonatti 1987, figs.6, 12, 13, and 14; Bott et al. 1992, fig. 2; Carbone et al. 1998, fig. H1.1;Khalil and McClay 2002, fig. 2) were geospatially registered and the faultlineaments manually digitized in a GIS (Fig. 1). Though various methodswere employed by the original authors to produce their fault maps, allconsider onshore structural patterns. The literature fault maps aretherefore independent from the offshore carbonate bodies, and a validcomparison can be made between the two datasets. For all focus areasapart from Halib, a circular buffer with a diameter of 150 km wascentered on the midpoint of each focus area and used to demark faultsthat would be considered to be associated with that focus area. For Halib,the buffer diameter was increased to 250 km, because 150 km wasinsufficient to encompass a representative number of faults for this focusarea. Faults lying wholly outside the defined buffer zones were discardedfrom further analysis. A total of 420 of the digitized faults fell within thesix buffers, with lengths varying from 1.5 km to 330 km.
For each focus area, the orientation of fault lineaments were groupedinto 15u bins and statistically compared with two populations oforientations for the carbonate bodies: those , 5 sq. km in area andthose . 5 sq. km in area. This quantitative comparison was conductedusing the parametric Watson-Williams multi-sample test for equal means,which can be used as a one-way ANOVA test for circular data (Mardiaand Jupp 2000). As applied, the null hypothesis of the Watson-Williamstest is that the means of the orientations of the fault lineaments and testedpopulation of carbonate bodies are equal. If the null hypothesis is upheldfor a given focus area at the 95% confidence interval (CI), fault control onthe orientation of the carbonate bodies can be concluded. Accordancebetween the faults and carbonate bodies for each focus area was alsovisually compared by plotting their orientations in polar coordinates(Fig. 4).
860 S.J. PURKIS ET AL. J S R
Quantifying Size-Frequency Distributions and Lateral Extent ofCarbonate Bodies
The size-frequency distributions and lateral (planform) extent ofcarbonate bodies for the six Red Sea focus areas might provide insightsto patterns in subsurface analogs. Trends between the frequency ofoccurrence of carbonate bodies versus their area were explored using thecomplementary cumulative distribution function (ccdf) P(X§x), which is
the standard way of visualizing this kind of data (Clauset et al. 2009).Plotted as such, the y axis reports on the probability that a carbonatebody is greater than or equal to a given area value (x axis) (Fig. 5).
For each focus area, ‘‘width maps’’ were generated which use color todescribe the minimum distance from any point within each carbonatebody to the periphery of that body (Fig. 6). The purpose of generatingwidth maps is to highlight between-site differences in the lateralcontinuity, an important component of geometry, of carbonate bodies.
FIG. 1.—Location of the six focus areasdistributed down the length of the Red Sea rift.The size of each area is 1,600 sq. km. Faultlineaments surrounding each focus area weredigitized from the literature (Crane and Bonatti1987, figs. 6, 12, 13, and 14; Bott et al. 1992, fig.2; Carbone et al. 1998, fig. H1.1; Khalil andMcClay 2002, fig. 2). For all focus areas apartfrom Halib, a circular buffer (broken lines) witha diameter of 150 km was used to demark faultsthat would be considered to be associated withthat focus area. The buffer diameter wasincreased to 250 km for Halib. Color-codedbathymetry from NGDC ETOPO2 Global 2’Elevations.
RED SEA AS AN ANALOG FOR RIFT CARBONATES 861J S R
Satellite Mapping of Bathymetry
Comparison of contrast-stretched Landsat images with UKHOnautical charts indicate that the deepest areas where seabed charactercould be discerned correspond to a water depth of 30 m, which isconsistent with visible-light penetration in the tropical waters of theregion (Bosscher and Schlager 1993; Purkis et al. 2002; Purkis andPasterkamp 2004). Facies mapping was therefore conducted only down to30 m water depth, with all remaining non-emergent portions of the
imagery assigned to the ‘‘deep water’’ class and discarded from furtheranalysis. Following the ratio-algorithm method of Stumpf et al. (2003),depth soundings digitized from UKHO nautical charts were used astraining data to tune the coefficients of the algorithm, and spectralbathymetry was extracted from the Landsat. Digital elevation models(DEMs) were constructed for each focus area. These DEMs captureseabed topography from the low-water mark to 30 m water depth andhave a spatial resolution of 30 m2, that of the Landsat imagery fromwhich they were derived. The DEMs were produced so as to assess the
FIG. 2.—Landsat image, facies, and bathymetry maps for the three focus areas with islands (Gubal Straits, Dahlak, Halib). Credit: Landsat courtesy of U.S.Geological Survey.
862 S.J. PURKIS ET AL. J S R
arrangement of the mapped facies classes with respect to water depth, ashas been conducted previously for modern shallow-water carbonatedepositional systems (Wilkinson et al. 1999; Rankey 2004; Purkis et al.2005; Harris and Vlaswinkel 2008; Bosence 2008; Purkis and Vlaswinkel2012).
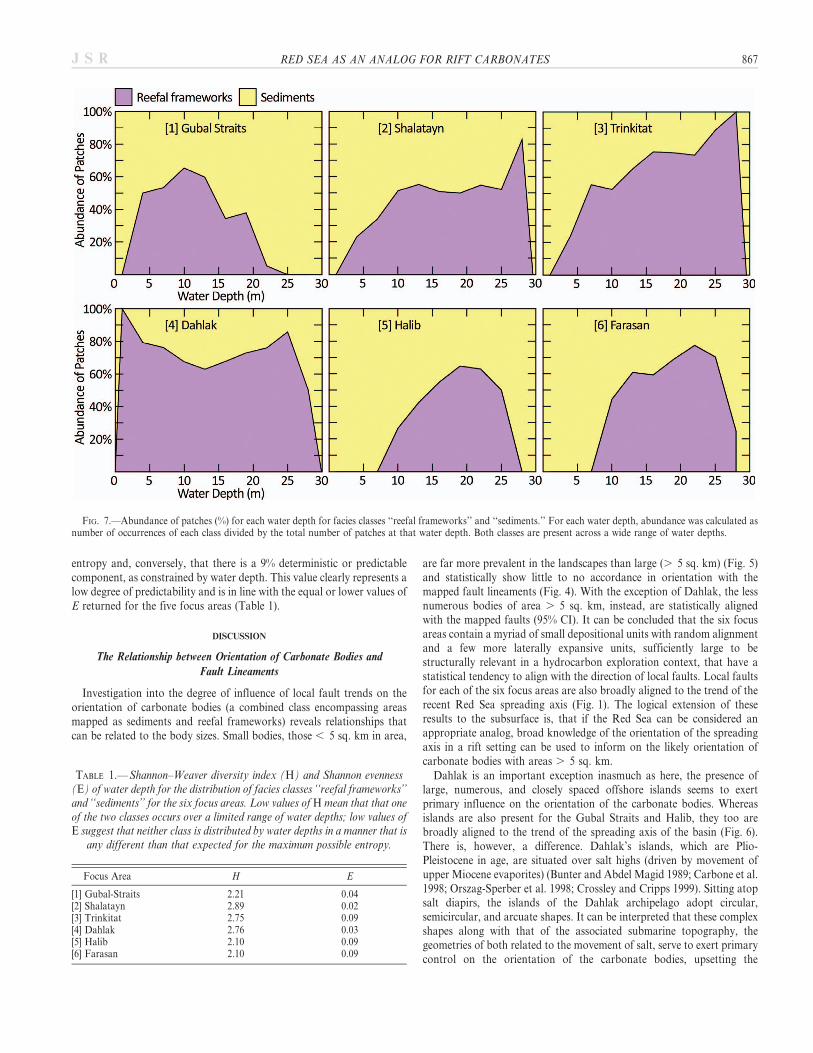
To explore relations between water depth and the two shallow-waterfacies classes, ‘‘reefal frameworks’’ and ‘‘sediments,’’ the mean depth foreach mapped patch (polygon) for these two facies was calculated for each
of the six focus areas. This was achieved by tallying the values of theDEM subtended by each patch for the two facies classes and averaging toyield a mean. For each water depth, abundance was calculated as thenumber of occurrences of each class divided by the total number ofpatches at that water depth (Fig. 7).
Following Rankey (2004) facies diversity (H), at any given water depthcan be quantified using the Shannon–Weaver diversity index (Shannonand Weaver 1962). This metric estimates the uncertainty in predicting
FIG. 3.—Landsat image, facies, and bathymetry maps for the three focus areas without islands (Shalatayn, Trinkitat, Farasan). Credit: Landsat courtesy of U.S.Geological Survey.
RED SEA AS AN ANALOG FOR RIFT CARBONATES 863J S R
abundances of elements (e.g., given a water depth, how much uncertaintyis there in predicting facies type?). In the context of this study, given awater-depth range in which there exist two (n) facies classes (reefalframeworks and sediments) with proportions pi, … , pn within that waterdepth range, diversity (H) for each water depth is defined as
H~{Xn
i~1
pi: ln pi ð1Þ
A value of H 5 0 indicates a perfectly ordered system (a given waterdepth is characterized by only one facies class; not diverse), whereashigher H indicates a greater number of facies classes (diverse).
As per Rankey (2004), it can be assumed that both facies categories canbe represented in all water depths and calculate the maximum possiblevalue of H (termed Hmax) as ln(n). Divergence from the maximum canthen be defined by the Shannon–Weaver evenness index (E):
E~1{(H=Hmax) ð2Þ
E ranges from zero (H 5 Hmax) to one, with E values near unity showingthat the system is not diverse (H 5 0), but instead dominated by onefacies class (Rankey 2004).
RESULTS
Analyzing the Relationship between Orientation of Carbonate Bodies
and Fault Lineaments
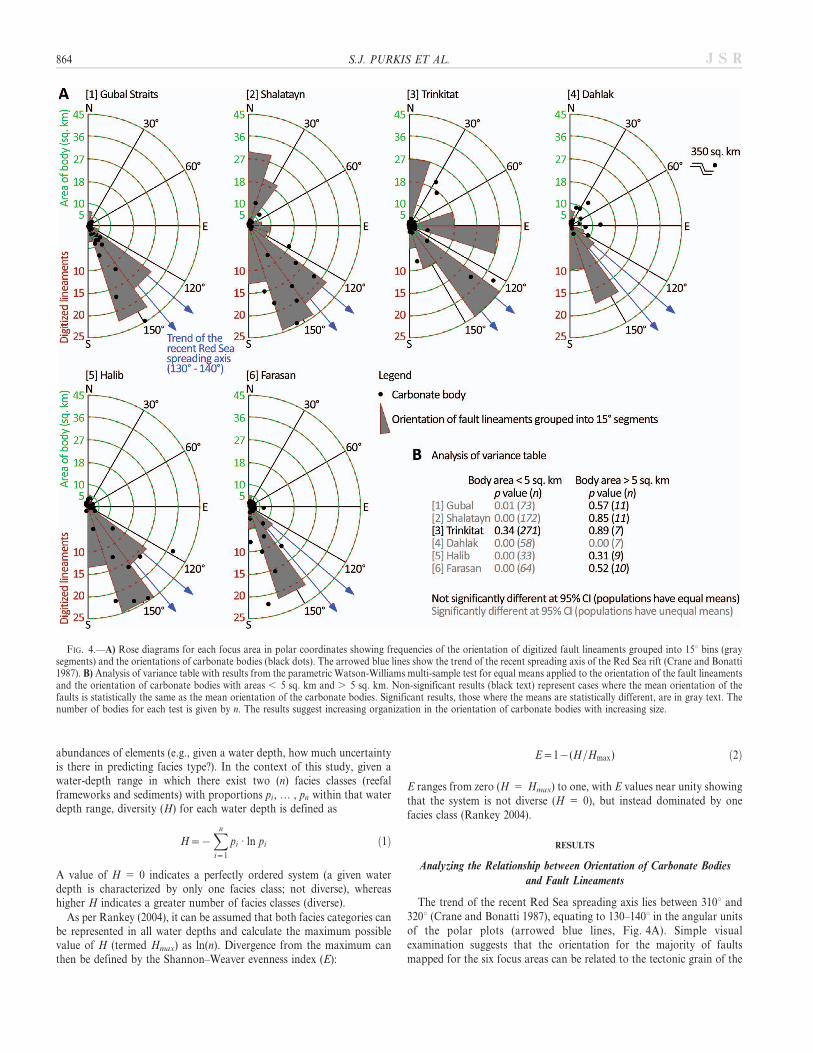
The trend of the recent Red Sea spreading axis lies between 310u and320u (Crane and Bonatti 1987), equating to 130–140u in the angular unitsof the polar plots (arrowed blue lines, Fig. 4A). Simple visualexamination suggests that the orientation for the majority of faultsmapped for the six focus areas can be related to the tectonic grain of the
FIG. 4.—A) Rose diagrams for each focus area in polar coordinates showing frequencies of the orientation of digitized fault lineaments grouped into 15u bins (graysegments) and the orientations of carbonate bodies (black dots). The arrowed blue lines show the trend of the recent spreading axis of the Red Sea rift (Crane and Bonatti1987). B) Analysis of variance table with results from the parametric Watson-Williams multi-sample test for equal means applied to the orientation of the fault lineamentsand the orientation of carbonate bodies with areas , 5 sq. km and . 5 sq. km. Non-significant results (black text) represent cases where the mean orientation of thefaults is statistically the same as the mean orientation of the carbonate bodies. Significant results, those where the means are statistically different, are in gray text. Thenumber of bodies for each test is given by n. The results suggest increasing organization in the orientation of carbonate bodies with increasing size.
864 S.J. PURKIS ET AL. J S R
Red Sea rift (Fig. 1). Polar plots of the orientations of the faultlineaments and carbonate bodies indicate varying levels of accordance forthe six focus areas (Fig. 4A). Clear trends, however, become apparentafter partitioning the carbonate bodies into two groups by area, those, 5 sq. km and those . 5 sq. km, and applying the Watson-Williams test(Fig. 4B). For all focus areas apart from Trinkitat, the mean of theorientations of , 5 sq. km carbonate bodies is significantly different atthe 95% CI to the mean of the orientation of the mapped fault lineaments.It can be inferred from this result that Trinkitat is the only focus area inwhich faults direct the orientation of the ‘‘small’’ carbonate bodies. Bycontrast, when the carbonate bodies with areas . 5 sq. km areconsidered, four of the five focus areas show statistically significantaccordance between the orientation of the bodies and the faultlineaments; Dahlak is the only focus area to lack such a relationshipfor these ‘‘large’’ carbonate bodies. As is discussed later, Dahlak is alsounique among the six focus areas in terms of its complex arrangement ofislands, shallow shelves, and deep troughs, features related to themovement of upper Miocene evaporites.
Analyzing Size-Frequency Distributions and Lateral Extent ofCarbonate Bodies
For all focus areas, the abundance of small carbonate bodies is greaterthan the abundance of large ones (Fig. 5). Further, in the size range of10,000 sq. m to 100 sq. km, the relationship between decreasingprobability of encounter and increasing area is roughly linear for allsites, suggesting power law scaling, which is now a frequently interpretedtrend for carbonate facies (Drummond and Dugan 1999; Rankey 2002;Purkis et al. 2007; Purkis et al. 2010; Fullmer et al. 2010). If characteristicof the data, a power-law would suggest carbonate-body abundance toscale as an inverse power to body area. However, a roughly straight trendon a log-log plot is a necessary but not sufficient condition for power-lawbehavior, and it is necessary to test for two other distributions withsimilar form: the negative exponential and lognormal. A negative
exponential distribution would report carbonate-body abundance toincrease exponentially with a linear decrease in carbonate-body area. Ifthe logarithms of the carbonate-body areas were to form a normaldistribution, the original (antilog) areas would be lognormally distribut-ed. Lognormal distributions may be almost indistinguishable from powerlaws (Perline 2005), in that both can result in a nearly straight trend on alog-log plot. Negative exponential distributions differentiate fromlognormal and power-law at the small end of the size spectrum, wherethere is an underrepresentation of small units.
The power-law, exponential, and lognormal are all ‘‘heavy-tailed’’distributions, meaning that there is a nontrivial amount of weight farfrom the center of the distribution (Clauset et al. 2007). For the data, thisimplies that carbonate bodies orders of magnitude larger (or smaller) thanthe mean are relatively common. As per Clauset et al. (2007), the latterpoint is particularly true when compared to a normal distribution, whereessentially no weight is far from the mean. The salient message from thisanalysis is not the separation of power-law, exponential, and lognormalbehavior, but instead, the result that the plan-view areas of the carbonatebodies are heavy-tailed and hence do not cluster around a typical value.Therefore, simple traditional statistics for normal distributions, such asmean and variance, are poor descriptors of the size-frequency distribu-tions and could not be used to parameterize geostatistical models of thefocus areas. This is an important observation, but detailed considerationof how heavy-tailed size-frequency distributions should be imparted toreservoir models is beyond the scope of this report.
To statistically test for the presence of power-law, negative exponential,and lognormal distributions, the three-step procedure of Clauset et al.(2009) was followed. This test reports all six focus areas to be lognormallydistributed when the full range of the data is considered. Repeating thetest after discarding carbonate bodies with area , 10,000 sq. m (i.e.,following Clauset et al. 2009, and imposing an xmin threshold), which isthe point in the six series where the trends ‘‘roll’’ parallel to the horizontalaxis, identifies the size-frequency distribution of Shalatayn and Trinkitat
FIG. 5.—Complementary cumulative distri-bution function (ccdf) P(X§x) of the popu-lations of areas for carbonate bodies for thesix focus areas. x-axis—log body area, y-axis—log probability that a body is greaterthan or equal to a given area value. Lineartrend in log-log plot indicates power-law.Under power-law conditions, abundancecan always be obtained from area by aconstant factor a. Focus areas with islands(Halib, Gubal Straits, Dahlak) have highera than those without. Farasan is anexception: it lacks islands but reports ahigh a.
RED SEA AS AN ANALOG FOR RIFT CARBONATES 865J S R
as power-law. Distributions of all other focus areas remain classified aslognormal.
It is apparent from the width maps (Fig. 6) that the focus areas withoffshore islands (Gubal Straits, Dahlak, and Halib) do not display morelaterally extensive bodies than those which lack islands (Shalatayn,Trinkitat, and Farasan). For instance, the largest carbonate body mappedfor Shalatayn, a focus area without islands, is as laterally extensive as thatof Halib, where islands are present. For both, the largest bodies attainwidths exceeding 5 km.
One mechanism by which islands may influence the lateral extent ofcarbonate bodies is by serving as nucleation points from which carbonatedeposition can build out. However, relevant too is the depth to underlyingbedrock, inasmuch as it controls water depth. The potential of a system toprograde is dictated by water depth, amongst other factors, and deepseparating channels can prevent, or at least delay, the coalescence of twoadjacent carbonate bodies. Three focus areas, Gubal Straits, Trinkitat,and Farasan, are notable for their limited width of carbonate bodies. Thefirst (Gubal Straits) has islands. The other two do not. The width mapsfor the three focus areas show abundant channels incising thedepositional systems, and the DEMs inform these channels to exceed30 m water depth (Figs. 2, 3). Here, it appears that water depth, not the
absence of islands, is the factor presently limiting shallow-watercarbonate deposition.
Analyzing the Relationship between Water Depth and the Occurrence of
Reefal Frameworks and Sediments
Even a cursory glance at the distribution in abundance of the faciesclasses ‘‘reefal frameworks’’ and ‘‘sediments’’ with water depth illustratesthat both classes occur across a range of water depths (Fig. 7). Beyondthe raw count data, however, Shannon–Weaver entropy metrics providequantitative information on diversity and describe its structure for the sixfocus areas (Table 1). The Shannon–Weaver diversity index (H) is highfor all focus areas, indicating high diversity of the two facies classes withwater depth. The lack of partitioning between facies is further reinforcedby the Shannon–Weaver evenness index (E). In the situation where E
approaches 1, there is a more deterministic relationship: given a waterdepth, the occurrence of a facies class can be confidently predicted. E isproportional to the percentage that uncertainty has been reduced fromthe maximum. Taking Halib as an example, for a given water depth, thevalue of E 5 0.09 means that the observed uncertainty in facies-classoccurrence has been reduced 9% relative to the maximum possible
FIG. 6.—Planform width maps of carbonate bodies. Hotter colors demark wider, more laterally expansive, carbonate bodies. Top row are the three focus areas withoffshore islands (Gubal Straits, Dahlak, and Halib). Bottom row are the three remaining focus areas which lack islands (Shalatayn, Trinkitat, and Farasan). Dashed whitearrowed lines show trend of the recent Red Sea spreading axis (130–140u) (Crane and Bonatti 1987). Credit: Landsat courtesy of U.S. Geological Survey.
866 S.J. PURKIS ET AL. J S R
entropy and, conversely, that there is a 9% deterministic or predictablecomponent, as constrained by water depth. This value clearly represents alow degree of predictability and is in line with the equal or lower values ofE returned for the five focus areas (Table 1).
DISCUSSION
The Relationship between Orientation of Carbonate Bodies and
Fault Lineaments
Investigation into the degree of influence of local fault trends on theorientation of carbonate bodies (a combined class encompassing areasmapped as sediments and reefal frameworks) reveals relationships thatcan be related to the body sizes. Small bodies, those , 5 sq. km in area,
are far more prevalent in the landscapes than large (. 5 sq. km) (Fig. 5)and statistically show little to no accordance in orientation with themapped fault lineaments (Fig. 4). With the exception of Dahlak, the lessnumerous bodies of area . 5 sq. km, instead, are statistically alignedwith the mapped faults (95% CI). It can be concluded that the six focusareas contain a myriad of small depositional units with random alignmentand a few more laterally expansive units, sufficiently large to bestructurally relevant in a hydrocarbon exploration context, that have astatistical tendency to align with the direction of local faults. Local faultsfor each of the six focus areas are also broadly aligned to the trend of therecent Red Sea spreading axis (Fig. 1). The logical extension of theseresults to the subsurface is, that if the Red Sea can be considered anappropriate analog, broad knowledge of the orientation of the spreadingaxis in a rift setting can be used to inform on the likely orientation ofcarbonate bodies with areas . 5 sq. km.
Dahlak is an important exception inasmuch as here, the presence oflarge, numerous, and closely spaced offshore islands seems to exertprimary influence on the orientation of the carbonate bodies. Whereasislands are also present for the Gubal Straits and Halib, they too arebroadly aligned to the trend of the spreading axis of the basin (Fig. 6).There is, however, a difference. Dahlak’s islands, which are Plio-Pleistocene in age, are situated over salt highs (driven by movement ofupper Miocene evaporites) (Bunter and Abdel Magid 1989; Carbone et al.1998; Orszag-Sperber et al. 1998; Crossley and Cripps 1999). Sitting atopsalt diapirs, the islands of the Dahlak archipelago adopt circular,semicircular, and arcuate shapes. It can be interpreted that these complexshapes along with that of the associated submarine topography, thegeometries of both related to the movement of salt, serve to exert primarycontrol on the orientation of the carbonate bodies, upsetting the
FIG. 7.—Abundance of patches (%) for each water depth for facies classes ‘‘reefal frameworks’’ and ‘‘sediments.’’ For each water depth, abundance was calculated asnumber of occurrences of each class divided by the total number of patches at that water depth. Both classes are present across a wide range of water depths.
TABLE 1.— Shannon–Weaver diversity index (H) and Shannon evenness(E) of water depth for the distribution of facies classes ‘‘reefal frameworks’’and ‘‘sediments’’ for the six focus areas. Low values of H mean that that oneof the two classes occurs over a limited range of water depths; low values ofE suggest that neither class is distributed by water depths in a manner that is
any different than that expected for the maximum possible entropy.
relationship to local faults shown to be present for the other five focusareas.
The carbonate platforms of the Farasan Banks focus area also sit atopsalt diapirs (Guilcher 1988). Here, diapiric structures formed submarinehighs that have developed into carbonate platforms as they have spent asignificant amount of time in the shallow-water carbonate production zone(Bosence 2012). Such platforms are termed salt diapir platforms (Bosence2005) and adopt circular, arcuate, amoeboid, and elongate shapes,punctuated with subcircular embayments and deep reentrants and channels(Rowlands et al. 2012). Despite the influence of salt diapirism, and unlikeDahlak, the influence of the direction of local faults on the orientation ofcarbonate bodies in the Farasan Banks is the same as for the majority of thefocus area; bodies with area , 5 sq. km are not directed by the faults, andthe . 5 sq. km bodies preferentially align with them.
The varying influence of faults on carbonate bodies of different sizesmay arise for two reasons. The first can be explained in process terms andthe second as a statistical artifact. Studies at comparable scale thatconsider planform geometries of both sand and reefal bodies in moderncarbonate depositional environments report large units to be elongate inshape and small units to be rounded (Purkis et al. 2007; Harris et al.2011). A rounded shape does not have a preferred orientation. Therelationship between body size and shape has been explained by theinfluence of different hydrodynamic and biotic processes acting oncarbonate bodies less than a few square kilometers in area, versus thoseacting on larger bodies (Purkis et al. 2007). For example, it can beimagined that the hydrodynamics influencing small bodies to be the sameas those of the surrounding waters. Larger bodies may modify theprevailing hydrodynamics and set up local gradients, an effect whichconceivably may have biotic ramifications, e.g., in terms of the retentionof coral larvae (Pinsky et al. 2012). A statistical artifact may also explainthe differential behavior in orientation of small and large bodies. Acarbonate body with an area of 5 sq. km consists of , 5,500 30 m 3 30 mLandsat pixels, whereas a 1 sq. km body consists of , 1,000 pixels and a0.5 sq. km body of only , 270 pixels. A threshold in the number of pixelsthat comprise a body must exist, below which shape, and hence alsoorientation, cannot be accurately assessed. A statistical artifact willtherefore arise as the resolution of the dataset (1 Landsat pixel 5 30 m 3
30 m) is approached. Given that the smallest carbonate body consideredin the Red Sea analysis consists of nine Landsat pixels (8,100 sq. km inarea), which is a sufficient number to capture the geometry of a body, it isunlikely that the small size of the bodies is preventing orientation frombeing calculated accurately. The difference in behavior between small andlarge bodies cannot therefore be easily ascribed to a statistical artifact andshould be assumed to be real.
Size-Frequency Distributions of Carbonate Bodies
Power-law trends are scale-invariant across their entire distribution.The abundance (y) of an object, in an inverse power-law distributedpopulation, scales as an inverse power of the size of the object (x). Underthese conditions, y can always be obtained by scaling x by a constantfactor a, such that y~x{a. It is because this relationship holds for allvalues of the power law that the distribution is said to be scale invariant.Lognormal distributions can be similar in shape to power-law distribu-tions. For instance, if X has a lognormal distribution, then in a log-logplot of the ccdf P(X§x), the behavior will appear to be nearly a straightline for a large portion of the body of the distribution. Indeed, if thevariance of the corresponding normal distribution is large, thedistribution may appear linear on a log-log plot for several orders ofmagnitude (Mitzenmacher 2003), so called ‘‘power-law mimicry’’ (Perline2005).
From the perspective of gaining insight into scales of accumulation ofcarbonates, the scale-invariant property of power-law and lognormal
distributions is of interest because it allows the likelihood of occurrence ofsmall bodies in a subsurface system to be computed using the samerelationship that exists between the frequency of the large bodies and theirsize. For instance, under the assumption of power-law, if the large bodiesin a system can be resolved by seismic and the small ones cannot, thepower in the predictability of the scale-invariant relationship is obvious.However, as illustrated by the different slopes (a) of the ccdf P(X§x),there are differences in the relationship between abundance and area ofcarbonate bodies between the Red Sea focus areas (Fig. 5). For example,for Trinkitat, given an occurrence of a carbonate body, there is a 10%likelihood that the body is . 1 sq. km in size. For Dahlak, Gubal,Farasan, and Halib, there is a 10% likelihood that the body is . 10 sq.km, and so on. These differences become important if the a of the ccdffrom a modern analog is to be used to inform on the abundance of bodiesof a given size in the subsurface. There is the hint of a relationshipbetween a and the presence (Gubal Straits, Dahlak, and Halib) andabsence (Shalatayn, Trinkitat, and Farasan) of islands. Dahlak, theGubal Straits, and Halib have high a (shallow slopes to their ccdf).Meanwhile, Shalatayn and Trinkitat have noticeably steeper slopes (lowera). Farasan, however, is an exception in being a focus area without islandsbut a high a. Given this exception and given too that only six focus areashave been considered, it is premature to place any weight on theobservation that the focus areas with islands have higher a to their ccdfthan the focus areas without islands. Further investigation into thecontrols on a is required.
The Occurrence of Reefal Frameworks and Sediments is Unrelated toWater Depth
Arrangements of facies versus water depth in the Modern have beenpublished on extensively, and the majority of contributions to theliterature have arisen from studies in the tropical Atlantic. Rankey (2004)examined 400 sq. km of seabed offshore of the Florida Keys with a depthrange of 1–9 m and concluded a random arrangement of facies withdepth. Similarly, Wilkinson et al. (1999) concluded a random patterningfor 723,000 sq. km of Florida–Bahamas lithotopes in space; depth wasnot considered. In the Arabian Gulf, Purkis et al. (2005) also concluded arandom ordering of fabrics for a 25 sq. km plot in which facies weremapped for depths spanning 5–7 m. In contrast, by considering 2 sq. kmof Florida seabed with water depth ranging from 0–3 m, Bosence (2008)employed embedded Markov chain analysis to identify the relationship offacies to depth to be ordered. It should be noted that the Markovapproach of Bosence (2008) is quite different from that of Rankey (2004),who employed metrics to estimate the uncertainty in predicting theabundance of facies elements at different water depths. In a study fromthe Pacific which spanned water depths of 0–40 m, Purkis and Vlaswinkel(2012) showed several facies to inhabit narrow and well-defined depthregimes, sufficient to be considered non-random, whereas others couldnot be constrained so precisely. Despite methodological differences, thestatus quo on this subject hence falls into three camps: a handful ofstudies that observe random ordering (Rankey 2004; Purkis et al. 2005;Wilkinson et al. 1999), one study which reports deterministic orderingwith respect to depth (Bosence 2008), and one study that shows aspects ofboth randomness and determinism (Purkis and Vlaswinkel 2012).
Investigation into the degree to which facies are diagnostic of waterdepth was not central to this study, for several reasons. First, limited bythe coarse spectral and spatial resolution of Landsat and lacking groundcontrol, we opted to map to only two broad facies classes in the 0–30 mwater depth range—‘‘sediments’’ and ‘‘reefal frameworks.’’ The urge tobe more ambitious with the number of classes was resisted in order tobalance the need for high map accuracy. Second, the optical derivation ofthe bathymetric DEM for each focus area from the Landsat imagery wasguided by several tens of depth soundings digitized from UKHO nautical
868 S.J. PURKIS ET AL. J S R
charts. This approach will not deliver as high an accuracy as whenderivation is guided by many thousands of soundings acquired in the fieldusing sonar (cf. Purkis et al. 2010; Rowlands et al. 2012). While werecognize these limitations, the data are sufficient to provide broadinsight into the lack of a relationship between water depth and sedimentsand reefal frameworks in the 0–30 m depth range, at Landsat scale, forthe six focus areas. The lack of diagnostic power that water depthprovides for the occurrence of the two classes is visually and statisticallyevident (Fig. 7; Table 1). At most, uncertainty (E), as compared tomaximum possible entropy in the water depth to facies relationship, isreduced by 9% (Farasan and Halib), but for all other focus areas E isconsiderably lower. Following the interpretation of Rankey (2004), thisresult for Halib and Farasan, both best case scenarios, can be taken tomean that ‘‘if we knew a facies type to be present at a given location, thatinformation would constrain water depth only 9% better than the case inwhich we merely guessed at water depth at a given location with no otherinformation.’’ There clearly is no deterministic relation between the twofacies types and water depth in any of the six focus areas considered.
For the reefal frameworks, whereas water depth is significant in termsof both mode of life and taxonomy (Bosscher and Schlager 1993), thedata show that the clear waters of the Red Sea allow the zone ofsignificant reef growth to extend down to at least the maximum mappedwater depth (30 m). If our DEMs and facies mapping extended to greaterwater depths, as was the case for Purkis and Vlaswinkel (2012),differentiation of facies into water-depth ranges likely would be observed;areas beneath the zone of reef growth would be dominated by sediments.As per Rankey (2004), this point implies that identification of orderversus randomness in the arrangement of facies with water depth isdependent on the range of water depth considered. Like this study,previous work which reports no pattern between facies and water depth(Rankey 2004; Purkis et al. 2005) have considered narrow depth ranges.
CONCLUSION
The Red Sea provides a classic analog for investigating the interplaybetween rift tectonics and shallow-water marine carbonate sedimentation.Six focus areas within the Red Sea, each covering exactly 1,600 sq. km,illustrate the variability of spatial patterns in reefal and other carbonatesin this rift setting. The orientation of Red Sea carbonate bodies with areas, 5 sq. km is not dominantly (statistically) controlled by faults. Theorientation of larger bodies is fault-directed for five of the six focus areas,which encompass the latitudinal range of shallow-water carbonatedeposits in the Red Sea, from coastal shelves to diapirically controlledoffshore highs. Dahlak is an exception, and in this focus area we interpretthe orientation of . 5 sq. km carbonate bodies to be controlled by closelyspaced islands, whose geometry is in turn directed by underlying saltdiapirs. The presence of islands was not shown to deliver more laterallyexpansive carbonate bodies for any of the six focus areas, nor was waterdepth found to be related to the relative abundance of reefal frameworksand sediments. The size-frequency distribution of bodies for all focusareas was shown to be lognormal. This distribution is heavy-tailed, socalled because there exists a nontrivial amount of weight far from thecenter of the distribution. For this reason, a lognormal distribution is notwell described by the mean and variance of the population.
ACKNOWLEDGMENTS
We thank Chevron Energy Technology Company for support of thisresearch and for permission to publish. The Landsat tiles came courtesy of theU.S. Geological Survey, and we acknowledge Google Earth for onlineimagery. The ETOPO2 Global 2’ Elevations data used in Figure 1 are fromthe Research Data Archive, which is maintained by the Computational andInformation Systems Laboratory at the National Center for AtmosphericResearch (NCAR). NCAR is sponsored by the National Science Foundation.
We are grateful to Gwilym Rowlands for sharing his broad knowledge of theRed Sea, to Lotte Purkis for help in preparing the satellite images, and toJeremy Kerr for statistical assistance. We are grateful for highly constructiveand useful reviews returned by Dan Bosence and Marcello Minzoni, as well asfor the comments of Associate Editor Peter Burgess and Editor Gene Rankey.This is NCRI publication 150.
REFERENCES
BANTAN, R.A., 1999, Geology and sedimentary environments of Farasan Bank (SaudiArabia) Southern Red Sea: a combined remote sensing and field study [PhD Thesis]:Royal Holloway, University of London, 297 p.
BOSENCE, D.W.J., 2005, A genetic classification of carbonate platforms based on theirbasinal and tectonic settings in the Cenozoic: Sedimentary Geology, v. 175, p. 49–72.
BOSENCE, D., 2008, Randomness or order in the occurrence and preservation of shallow-marine carbonate facies? Holocene, South Florida: Palaeogeography, Palaeoclimatol-ogy, Palaeoecology, v. 270, p. 339–348.
BOSENCE, D., 2012, Carbonate dominated marine rifts, in Roberts, D.G., and Bally,A.W., eds., Regional Geology and Tectonics: Phanerozoic Rift Systems andSedimentary Basins: Amsterdam, Elsevier, p. 89–114.
BOSSCHER, H., AND SCHLAGER, W., 1993, Accumulation rates of carbonate platforms:Journal of Geology, v. 101, p. 345–355.
BOSWORTH, W., HUCHON, P., AND MCCLAY, K., 2005, The Red Sea and Gulf of AdenBasins: Journal of African Earth Sciences, v. 43, p. 334–378.
BOTT, W.F., SMITH, B.A., OAKES, G., SIKANDER, A.H., AND IBRAHAM, A.I., 1992, Thetectonic framework and regional hydrocarbon prospectivity of the Gulf of Aden:Journal of Petroleum Geology, v. 15, p. 211–243.
BRAITHWAITE, C.J.R., 1982, Patterns of accretion of reefs in the Sudanese Red Sea:Marine Geology, v. 46, p. 297–325.
BUNTER, M.A.G., AND ABDEL MAGID, A.E.M., 1989, The Sudanese Red Sea, 1. Newdevelopments in stratigraphy and petroleum geological evolution: Journal ofPetroleum Geology, v. 12, p. 145–166.
BURCHETTE, T.P., 1988, Tectonic control on carbonate platform facies distribution andsequence development: Miocene, Gulf of Suez: Sedimentary Geology, v. 59, p. 179–204.
CARBONE, F., MATTEUCCI, R., AND ANGELUCCI, A., 1998, Present-day sedimentation onthe carbonate platforms of the Dahlak Islands, Eritrea, in Purser, B.H., and Bosence,D.W.J., eds., Sedimentation and Tectonics in Rift Basins: Red Sea–Gulf of Aden:London, Chapman and Hall, p. 523–536.
CLAUSET, A., YOUNG, M., AND GLEDITSCH, K.S., 2007, On the frequency of severeterrorist events: Journal of Conflict Resolution, v. 51, p. 58–87.
CLAUSET, A., SHALIZI, C.R., AND NEWMAN, M.E.J., 2009, Power-law distributions inempirical data: SIAM (Society for Industrial and Applied Mathematics) Review,v. 51, p. 661–703.
CRANE, K., AND BONATTI, E., 1987, The role of fracture zones during early Red Searifting: structural analysis using Space Shuttle radar and Landsat imagery: Journal ofthe Geological Society, London, v. 144, p. 407–420.
CROSS, N.E., AND BOSENCE, D.W.J., 2008, Tectono-sedimentary models for rift-basincarbonate systems, in Lukasik, J., and Simo, T., eds., Controls on Carbonate Platformand Reef Development: SEPM, Special Publication 89, p. 83–105.
CROSS, N.E., BOSENCE, D.W.J., AND PURSER, B.H., 1998, The tectono-sedimentaryevolution of a rift margin carbonate platform: Abu Shaar, Gulf of Suez, Egypt, inPurser, B.H., and Bosence, D.W.J., eds., Sedimentation and Tectonics in Rift Basins:Red Sea–Gulf of Aden: London, Chapman and Hall, p. 271–295.
CROSSLEY, R., AND CRIPPS, D., 1999, Templates from mainland Africa and the Red Seafor interpreting the early evolution of the South Atlantic, in Cameron, N.R., Bate,R.H., and Clure, V.S., eds., The Oil and Gas Habitats of the South Atlantic: TheGeological Society of London, Special Publication 153, p. 85–96.
DOROBEK, S.L., 2008, Tectonic and depositional controls on syn-rift carbonate platformsedimentation, in Lukasik, J., and Simo, T., eds., Controls on Carbonate Platformand Reef Development: SEPM, Special Publication v. 89, p. 57–81.
DRUMMOND, C.N., AND DUGAN, P.J., 1999, Self-organizing models of shallow-watercarbonate accumulation: Journal of Sedimentary Research, v. 69, p. 939–946.
DULLO, W.-C., AND MONTAGGIONI, L., 1998, Modern Red Sea coral reefs: a review oftheir morphologies and zonation, in Purser, B.H., and Bosence, D.W.J., eds.,Sedimentation and Tectonics in Rift Basins: Red Sea–Gulf of Aden: London,Chapman and Hall, p. 583–594.
ERLICH, R.N., BARRETT, S.F., AND GUO, B.J., 1990, Seismic and geologicalcharacteristics of drowning events on carbonate platforms: American Association ofPetroleum Geologists, Bulletin, v. 74, p. 1523–1537.
ERLICH, R.N., LONGO, A.P., AND HYARE, S., 1993, Response of platform margins todrowning: evidence of environmental collapse, in Loucks, R.G., and Sarg, J.F., eds.,Carbonate Sequence Stratigraphy: Recent Developments and Applications: AmericanAssociation of Petroleum Geologists, Memoir 57, p. 241–266.
FOURNIER, F., BORGOMANO, J., AND MONTAGGIONI, L.F., 2005, Development patternsand controlling factors of Tertiary carbonate build-ups: New insights from high-resolution 3-D seismic and well data from the Malampaya gas field (OffshorePalawan, Philippines): Sedimentary Geology, v. 174, p. 189–215.
FULLMER, S., KACZMAREK, S.E., AND STEFFEN, K., 2010, Modern carbonate facies:moving from description to quantitative prediction: 30th Annual Gulf Coast Section,SEPM Foundation, Bob F. Perkins Research Conference, Seismic Imaging ofDepositional and Geomorphic Systems, December 5–8, 2010, Houston, Texas.
RED SEA AS AN ANALOG FOR RIFT CARBONATES 869J S R
GROTSCH, J., AND MERCADIER, C., 1999, Integrated 3-D reservoir modeling based on 3-Dseismic: the Tertiary Malampaya and Camargo buildups, offshore Palawan,Philippines: American Association of Petroleum Geologists, Bulletin, v. 83, p.1703–1728.
GUILCHER, A., 1988, A heretofore neglected type of coral reef: The ridge reef.Morphology and origin: 6th International Coral Reef Symposium, Australia,Proceedings, v. 3, p. 399–402.
GVIRTZMAN, G., BUCHBINDER, B., SHEN, A., NIR, Y., AND FRIEDMAN, G.M., 1977,Morphology of the Red Sea fringing reefs a result of the erosional pattern of the last-glacial low-stand sea level and the following Holocene recolonization: BureauRecherches Geologiques et Minieres (France), Memoires, no. 89, p. 480–491.
HAMOUDA, A.Z., AND EL-WAHHAB, M.A., 2012, Detection of the bottom faciescharacteristics at El Zeit Bay, Red Sea, by using single-beam acoustic sound:Oceanology, v. 52, p. 60–71.
HARALICK, R.M. AND SHAPIRO, L.G., 1992, Computer and Robot Vision: Vols. 1, 2:Reading, Massachusetts, Addison-Wesley, 630 p.
HARRIS, P.M., AND VLASWINKEL, B.M., 2008, Modern isolated carbonate platforms:templates for quantifying facies attributes of hydrocarbon reservoirs, in Lukasik, J.,and Simo, T., eds., Controls on Carbonate Platform and Reef Development: SEPM,Special Publication 89, p. 323–341.
HARRIS, P.M., ELLIS, J., AND PURKIS, S.J., 2011, Analyzing spatial patterns in moderncarbonate sand bodies from Great Bahama Bank: Journal of Sedimentary Research,v. 81, p. 185–206.
HARRIS, P.M., ELLIS, J., AND PURKIS, S.J., 2012, Analogs for carbonate deposition inearly rift settings: SEPM, Short Course Notes 55, p. 1–75, and 2 DVDs.
HOFMANN, P., SCHWARK, L., BRACHERT, T., BADAUT, D., RIVIERE, M., AND PURSER, B.H.,1998, Sedimentation, organic geochemistry and diagenesis of cores from the axial zoneof the southern Red Sea: relationships to rift dynamics and climate, in Purser, B.H.,and Bosence, D.W.J., eds., Sedimentation and Tectonics in Rift Basins: Red Sea–Gulfof Aden: London, Chapman and Hall, p. 479–503.
KHALIL, S.M., AND MCCLAY, K.R., 2002, Extensional fault-related folding, northwestRed Sea, Egypt: Journal of Structural Geology, v. 24, p. 743–762.
MARDIA, K.V., AND JUPP, P.E., 2000, Directional Statistics: Chichester, Wiley, 429 p.MITZENMACHER, M., 2003, A brief history of generative models for power law and
lognormal distributions: Internet Mathematics, v. 1, p. 226–251.MONTAGGIONI, L.F., BEHAIRY, A.K.A., EL-SAYED, M.K., AND YUSUF, N., 1986, The
modern reef complex, Jeddah area, Red Sea: a facies model for carbonatesedimentation on embryonic passive margins: Coral Reefs, v. 55, p. 127–150.
ORSZAG-SPERBER, F., HARWOOD, G., KENDALL, A., AND PURSER, B.H., 1998, A review ofthe evaporites of the Red Sea–Gulf of Suez rift, in Purser, B.H., and Bosence, D.W.J.,eds., Sedimentation and Tectonics in Rift Basins: Red Sea–Gulf of Aden: London,Chapman and Hall, p. 409–425.
PERLINE, R., 2005, Strong, weak, and false inverse power laws: Statistical Science, v. 20,p. 68–88.
PINSKY, M.L., PALUMBI, S.R., ANDREFOUET, S., AND PURKIS, S.J., 2012, Open and closedseascapes: where does habitat patchiness create populations with high fractions of self-recruitment?: Ecological Applications, v. 22, p. 1257–67.
PURKIS, S.J., AND PASTERKAMP, J., 2004, Integrating in situ reef-top reflectance spectrawith Landsat TM imagery to aid shallow-tropical benthic habitat mapping: CoralReefs, v. 23, p. 5–20.
PURKIS, S.J., AND VLASWINKEL, B., 2012, Visualizing lateral anisotropy in moderncarbonates: American Association of Petroleum Geologists, Bulletin, v. 96, p. 1665–1585.
PURKIS, S.J., KENTER, J.A.M., OIKONOMOU, E.K., AND ROBINSON, I.S., 2002, High-resolution ground verification, cluster analysis and optical model of reef substratecoverage on Landsat TM imagery (Red Sea, Egypt): International Journal of RemoteSensing, v. 23, p. 1677–1698.
PURKIS, S.J., RIEGL, B., AND ANDREFOUET, S., 2005, Remote sensing of geomorphologyand facies patterns on a modern carbonate ramp (Arabian Gulf, Dubai, U.A.E.):Journal of Sedimentary Research, v. 75, p. 861–876.
PURKIS, S.J., KOHLER, K.E., RIEGL, B.M., AND ROHMANN, S.O., 2007, The statistics ofnatural shapes in modern coral reef landscapes: The Journal of Geology, v. 115,p. 493–508.
PURKIS, S.J., ROWLANDS, G.P., RIEGL, B.M., AND RENAUD, P.G., 2010, The paradox oftropical karst morphology in the coral reefs of the arid Middle East: Geology, v. 38,p. 227–230.
RANKEY, E.C., 2002, Spatial patterns of sediment accumulation on a Holocenecarbonate tidal flat, Northwest Andros Island, Bahamas: Journal of SedimentaryResearch, v. 72, p. 591–601.
RANKEY, E.C., 2004, On the interpretation of shallow shelf carbonate facies andhabitats: how much does water depth matter?: Journal of Sedimentary Research,v. 74, p. 2–6.
REINICKE, G.B., KROLL, D.K., AND SCHUHMACHER, H., 2003, Patterns and changes ofreef-coral communities at the Sanganeb-Atoll (Sudan, Central Red Sea): 1980 to 1991:Facies, v. 49, p. 271–298.
ROWLANDS, G., PURKIS, S.J., RIEGL, B., METSAMAA, L., BRUCKNER, A., AND RENAUD, P.,2012, Satellite imaging coral reef resilience at regional scale. A case-study from SaudiArabia: Marine Pollution Bulletin, v. 64, p. 1222–1237.
SHANNON, C.E., AND WEAVER, W., 1962, The Mathematical Theory of Communication:Urbana, University of Illinois Press, 144 p.
STUMPF, R.P., HOLDERIED, K., AND SINCLAIR, M., 2003, Determination of water depthwith high-resolution satellite imagery over variable bottom types: Limnology andOceanography, v. 48, p. 547–556.
TURAK, E., BRODIE, J., AND DEVANTIER, L., 2007, Reef-building corals and coralcommunities of the Yemen Red Sea: Fauna of Arabia, v. 23, p. 1–40.
WILKINSON, B.H., DRUMMOND, C.N., DIEDRICH, N.W., AND ROTHMAN, E.D., 1999,Poisson processes of carbonate accumulation on Paleozoic and Holocene platforms:Journal of Sedimentary Research, v. 69, p. 338–350.
Received 30 January 2012; accepted 17 September 2012.