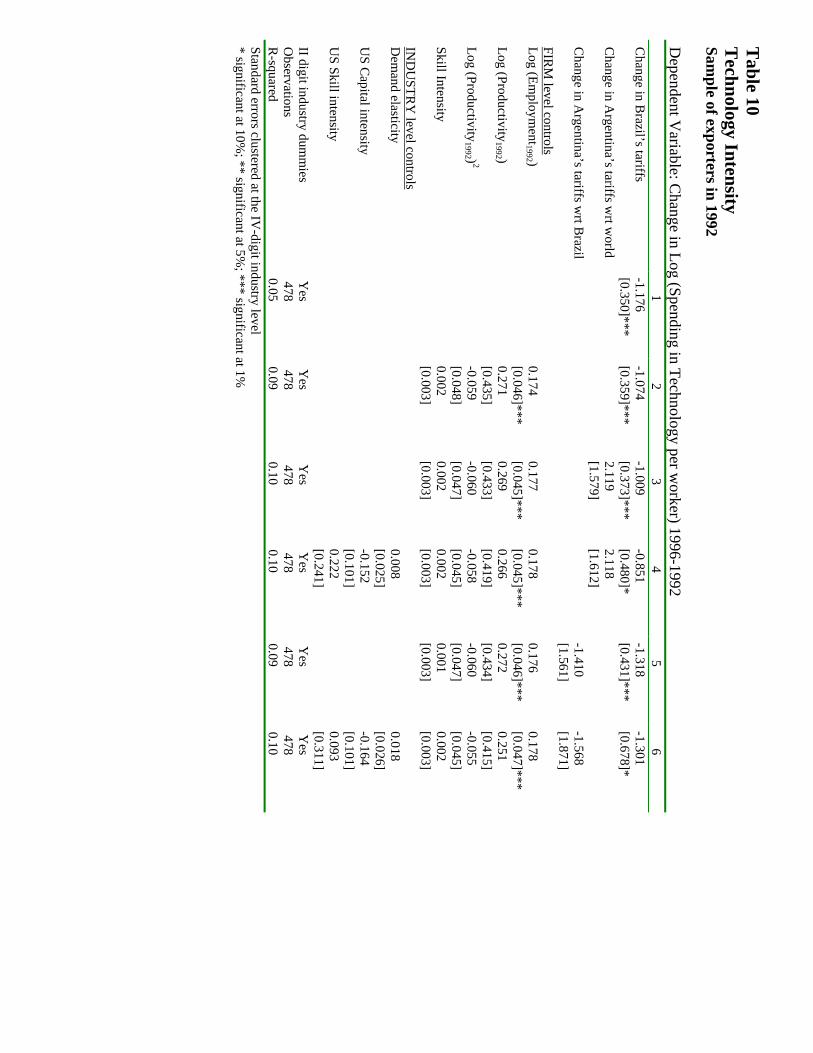
Multilateral Trade Liberalization, Exports and Technology Upgrading: Evidence on the Impact of MERCOSUR on Argentinean Firms Paula Bustos CREI and Universitat Pompeu Fabra July 2007 Abstract Several empirical studies have documented that exporters have positive performance characteristics relative to firms only servicing the domestic market. Whether these findings imply that policies that expand export opportunities have a positive impact on firm performance depends on whether exporting causes better performance or better firms self select into the export market. In this paper I investigate the impact of a multilateral trade agreement (MERCOSUR) on entry in the export market and investment in technology within the framework of a simple model that introduces technology choice in Melitz (2003) model. In the model, a reduction in variable export costs increases exporting revenues, inducing more firms to enter the export market, and to adopt new technologies. The empirical identification of the effect of falling Brazilian tariffs on entry in the export market and technology upgrading by Argentinean firms is based in the change in Brazilian tariffs across 4-digit- SIC industries. I find that the average reduction in export tariffs (0.24) increases the probability of entry in the export market by 0.10 and increases spending in technology by 0.20 log points.
Transcript
Multilateral Trade Liberalization, Exports and Technology Upgrading:
Evidence on the Impact of MERCOSUR on Argentinean Firms
Paula Bustos
CREI and Universitat Pompeu Fabra
July 2007
Abstract
Several empirical studies have documented that exporters have positive performance
characteristics relative to firms only servicing the domestic market. Whether these findings imply that
policies that expand export opportunities have a positive impact on firm performance depends on
whether exporting causes better performance or better firms self select into the export market. In this
paper I investigate the impact of a multilateral trade agreement (MERCOSUR) on entry in the export
market and investment in technology within the framework of a simple model that introduces
technology choice in Melitz (2003) model. In the model, a reduction in variable export costs increases
exporting revenues, inducing more firms to enter the export market, and to adopt new technologies.
The empirical identification of the effect of falling Brazilian tariffs on entry in the export market and
technology upgrading by Argentinean firms is based in the change in Brazilian tariffs across 4-digit-
SIC industries. I find that the average reduction in export tariffs (0.24) increases the probability of
entry in the export market by 0.10 and increases spending in technology by 0.20 log points.
1. Introduction
Several empirical studies have documented that exporters have positive performance
characteristics relative to firms only servicing the domestic market.1 Exporters are larger,
have higher labor productivity, capital-intensity, technology-intensity and pay higher
wages. Whether these findings imply that policies that expand export opportunities, like
multilateral trade liberalizations, have a positive impact on firm performance depends on
whether exporting causes better performance or ex-ante good firms become exporters.
There is ample evidence that the more productive firms self select into the export
market, which can be rationalized by the model of trade with heterogeneous firms
developed by Melitz (2003). In Melitz’s model trade liberalization increases aggregate
productivity through a selection effect, as it reallocates market shares to more productive
firms and produces the exit of less productive firms. In this paper I analyze whether trade
liberalization can also induce firms to invest in technology upgrading to improve their
productivity. For that purpose, I develop a simple model that introduces technology
choice into Melitz (2003) model and test its predictions in the context of the launching of
a multilateral trade agreement (MERCOSUR).
In the model, firms can enter a monopolistically competitive industry by paying a
fixed entry cost, after which their productivity will be revealed. After entry they can
produce using a technology that features increasing returns to scale (a fixed cost and
constant marginal cost). Heterogeneity in productivity can be interpreted in two ways:
first, more productive firms have a lower marginal production cost in the sense that they
produce more output per unit of labor; second, more productive firms produce a good of
higher quality, in the sense that consumers are willing to pay more for the same amount
of the good. Up to this point the setup is identical to Melitz (2003), but in addition, after
observing their productivity, firms can choose to pay a fixed cost to adopt a new
technology that will produce a proportional reduction in their marginal cost, or a
proportional increase in the quality of the good. Then, in this setup, there is a part of firm 1 The empirical studies include Bernard and Jensen (1999) for the U.S.; Clerides, Lach and Tybout (1998) for Mexico, Colombia and Morocco.
2
productivity that is the result of luck but firms can also take actions to increase their
productivity. A simple interpretation would be that before entering an industry firms
engage in product development, but the value of that product/its marginal production cost
is revealed only after it has been developed and the cost of product development is sunk.
At the production stage, firms can take actions to increase the quality of the product or
further reduce its marginal cost, by paying a per period extra fixed production cost.
Firms that export face both variable and fixed exporting costs, and the latter implies
that only the most productive firms enter the export market.2 Similarly, the presence of
fixed technology adoption costs also implies that only the most productive firms adopt
the new technology. This result is due to the fact that in the model, a proportional
reduction in marginal cost produces a proportional increase in revenues, which will be
higher in value the higher are initial revenues. Then, only firms with high enough
revenues will find paying the fixed cost of technology adoption profitable.
In this setup, a reduction in variable export costs increases exporting revenues, making
it profitable for more firms to enter the export market, and to adopt new technologies. A
reduction in trade costs increases revenues because it reduces the price firms charge
abroad and, as the elasticity of demand is bigger than one, quantities sold increase more
than proportionally. Then, revenues increase, and as the benefit of technology upgrading
is proportional to revenues and its cost is fixed, more firms will have enough revenues to
make technology adoption profitable.3
The bilateral trade liberalization that took place between Argentina and Brazil starting
in the early 1990’s provides a unique set up to test the causal relationship between falling
export costs and technology upgrading. Brazilian tariffs fell from an average of 29% in
2 The result that only the most productive firms enter the export market is due to their higher potential exporting revenues: as they have a lower marginal production cost charge a lower price, which produces a more than proportional increase in their sales because demand is elastic, thus exporting revenues are higher for more productive firms while fixed exporting costs are the same for all firms. As a result, only the most productive firms will find entering the export market profitable. 3 The relationship between exporting and quality upgrading has been proposed by Verhoogen (2004) who develops a model where increased trade with more developed countries increases production of high quality goods and tests it in the context of Mexico’s 1994 devaluation. The mechanism for quality upgrading in his model is not increased revenues for exporters but the higher valuation for high quality goods of consumers in developed countries. In this paper the analysis focuses on trade liberalization between countries of similar level of development, thus the focus is on increased revenues for exporters to a symmetric country.
3
1991 to zero in 1995 in all industries (with the exception of automobiles and sugar). The
impact of MERCOSUR on Argentina’s exports was impressing: between 1992 and 1996,
exports to Brazil quadrupled, while exports to the rest of the world increased only 60%.
As a result, the growth in exports to Brazil explains 50% of the growth in total
Argentinean exports in that period.
I analyze a panel of 1388 Argentinean manufacturing firms covering the period 1992-
1996. This data set permits to build a comprehensive measure of investment in
technology, as it includes several dimensions of adoption of new technologies such as
spending in computers and software; payments for technology transfers and patents; and
spending on equipment, materials and labor related to innovation activities performed
within the firm.4
In a first analysis of the data I check whether observed characteristics of exporters
are consistent with the ones predicted by the model. In the model, underlying productivity
differences produce a sorting of firms into three groups: the low productivity firms only
serve the domestic market and use the old technology, the medium productivity firms still
use the old technology but also export, and the most productive firms both export and use
the new technology. In this setting a reduction in variable trade costs will increase
exporting revenues thus inducing firms in the middle-range of the productivity
distribution to enter the export market and upgrade technology.
The patterns observed in the data are consistent with the proposed model: if we
compare firms in the same industry (at the 4-digit-SIC level), firms that were already
exporting in 1992 have a 0.37 log points higher level of spending in technology per
worker than firms that don’t export before and after liberalization, while firms that would
enter the export market after liberalization, but still do not export in 1992, are not
significantly more technology intensive than firms that don’t export in 1992 and would
not enter the export market after liberalization. In contrast, after liberalization new
exporters become more and technology-intensive than firms that do not export, increasing
their spending in technology per worker 0.34 log points faster. Interestingly, firms that
4 Such as R&D, adaptation of new products or production processes, technical assistance for innovations in production, organization, commercialization, engineering and industrial design.
4
were already exporting in 1992 also increase spending in technology 0.27 log points
faster than firms that never export.
The patterns in the data described above show that there is a coincidence between
entry in the export market and technology upgrading, but can’t establish whether it is
expanded export opportunities that cause technology adoption or viceversa, or whether
both are caused by a third factor. Then, a second step in the empirical analysis attempts to
establish causality between exporting and technology adoption, by linking these
outcomes directly to the reduction in Brazil’s tariffs for imports from Argentina.
The empirical identification of the effect of falling export costs on entry in the export
market and technology upgrading by both continuing exporters and new entrants in the
export market is based on variation in the change in Brazilian tariffs across 4-digit-SIC
industries. The model predicts that in industries where Brazilian tariffs fell more there
will be more entry in the export market and also more technology upgrading by both
continuing exporters and new exporters.
Then, to asses the direct impact of falling tariffs on the export decision I estimate the
change in the probability of a firm entering the export market as a function of the
variation in Brazil’s tariffs at the industry level. I find that firms in sectors with a higher
reduction in tariffs are more likely to enter the export market. The average reduction in
tariffs (0.24) increases the probability of entry in the export market by 0.10 percentage
points.
I also estimate the change in spending in technology per worker as a function of the
change in tariffs and find that firms increase their spending in technology faster in
industries where tariffs fall more. The average reduction in Brazil’s tariffs increases
spending in technology by 0.20 log points.
Next, I investigate whether the channel suggested by the model is at work: the drop in
export tariffs induces technology upgrading through the increase in exporting revenues,
versus the alternative explanation that the mere act of exporting causes technology
upgrading as it exposes firms to technology and know how abroad. If the increase in
export revenues is inducing technology upgrading we should observe technology
upgrading not only in new exporters but also in firms that were already exporting in 1992
and face a reduction in tariffs. In fact, the reduction in tariffs has the same positive effect
5
on the change in spending in technology when restricting the sample to firms that were
already exporting in 1992. Finally, the same effect is found when the sample is restricted
to firms that were not exporting in 1992, documenting the effect of tariff reductions on
technology adoption acting through entry.
The results above suggest that entry in the export market and technology upgrading
were both caused by the reduction in Brazil’s tariffs, but an alternative explanation is that
the change in Brazil’s tariffs is correlated with other industry-level trends that are causing
both entry and technology upgrading. Thus, I perform a series of robustness checks to
assess whether the empirical identification strategy is correctly capturing the effects of
trade liberalization.
The results reported above are based on a generalized differences and differences
estimation, where the sources of variation are differential changes in Brazil’s tariffs
across time (1996-1992) and across IV- digit SIC industries. This estimation is based on
the assumption that these changes are not correlated with unobserved industry trends that
might be correlated with changes in export status or changes in spending in technology.
To check whether this assumption is correct, I include industry trends at the 2-digit-SIC
level,5 and a series of exogenous industry characteristics at the 4-digit-SIC level like skill
and capital intensity of the industry in the U.S., and the elasticity of substitution of
demand. In addition, other changes in tariffs are included, like the change in Argentina’s
import tariffs with respect to Brazil and the rest of the world. The results are robust to all
these controls, with point estimates still being significant at the 5% level. As a final check
that results are not driven by unobserved industry-level shocks in the domestic market
that could be correlated with changes in tariffs I show that changes in Brazil’s tariffs are
not correlated with growth in domestic sales.
The subject of this paper is related to a series of empirical studies on the impact of
exporting on firm productivity. This paper focuses on a different outcome, technology
upgrading, which has the advantage of studying a particular mechanism (a reduction in
variable export costs) and a particular channel (technology upgrading) through which
5 It is not possible to include industry trends at the 4-digit level as that is the maximum level of desegregation of the tariff data.
6
exporting can affect firm performance, and the disadvantage of making a comparison to
the existing literature harder.
The survey does not provide a good measure of labor or total factor productivity as it
does not contain information on value added, and capital stock per firm. Still, if
technology upgrading is expected to produce increases in labor and total factor
productivity, the results on this paper can be related to the existing literature. Bernard and
Jensen (1999) report that in the U.S. exporters have higher productivity than non
exporters, but this is because ex-ante more productive firms become exporters, while
there are no effects of exporting on productivity. Clerides, Lach and Tybout (1998) also
show evidence that the positive association between exporting and productivity is
explained by self-selection of the good plants in Colombia, Mexico and Morocco. These
two studies base their conclusions on the comparison of exporters and non exporters
across time and not on variation in a trade policy variable. The evidence reported in this
paper suggests that causality can also run in the opposite direction, as reductions in
variable export costs induce both entry in the export market and technology upgrading.
Then, firms entering the export market are not only more productive ex-ante but they also
take actions (investment in technology) targeted towards increasing their productivity.
This finding is consistent with the evidence reported in Trefler (2004) for the impact of
the Canada-U.S. Free Trade Agreement on Canadian plants: he finds that Canadian plants
in industries with higher U.S. tariff concessions had faster productivity growth.
The theoretical model presented in this paper is a general equilibrium version of the
model in Bustos (2005). The insight that expanded export opportunities induce more
firms to upgrade technology was first developed by Yeaple (2005). In his model firms are
ex-ante homogeneous and heterogeneity in exporting and technology choice is an
equilibrium outcome: as the low marginal cost technology uses skilled-labor more
intensively wages adjust in such a way that in equilibrium all firms are indifferent
between not exporting and using the low technology or exporting and using the high
technology. In the model presented in this paper labor is homogeneous and heterogeneity
in exporting and technology choice is the result of ex-ante heterogeneity in productivity.
Additionally, there is not a full coincidence between exporting and using the high
technology as the least productive exporters might choose to use the low technology.
7
These last two features of the model are important to interpret the empirical findings
reported above, where new exporters were more productive than never exporters before
trade liberalization and firms that were already exporting also upgrade technology when
variable trade costs fall.
The remaining of the paper is organized as follows. The next section presents the
theoretical model and derives the empirical predictions on the effects of trade
liberalization on entry in the export market and technology upgrading. Section 3
describes the trade liberalization episode and the data set. Section 4 presents the empirical
strategy and tests the predictions of the model. Section 5 concludes.
2. Theory
This section develops a simple model of the decision to enter the export market and
upgrade technology by heterogeneous firms. I will consider an economy consisting of a
single monopolistically competitive industry where firms produce differentiated products
under increasing returns to scale, and using a single factor of production, labor, as in
Krugman (1979, 1980). Firms are heterogeneous in productivity and face fixed exporting
costs as in Melitz (2003), and can choose to increase their productivity by paying a fixed
technology adoption cost, as in Yeaple (2005). I first present the closed economy model,
and later its open economy version where two symmetric countries trade.
2.1 Closed Economy
Set up of The Model
Demand
There is a representative consumer with CES preferences over a continuum of
varieties of a good:
10 )(
1
<<⎥⎦
⎤⎢⎣
⎡= ∫
Ω∈
ρωωρ
ρ
ω
dqU
Consumers maximize (1) subject to the budget constraint:
Edqp =∫Ω∈
ωωωω
)()(
8
Then, demand for a particular variety is:
σωω−
⎟⎠⎞
⎜⎝⎛=
Pp
PEq )()(
where 11/1 >−= ρσ is the constant elasticity of substitution and
σ
ωω σ
ω
−
⎥⎦
⎤⎢⎣
⎡= −
Ω∈∫
11
1)( dpP (1)
Supply
The supply side is characterized by monopolistic competition. Each variety is
produced by a single firm, and there is free entry into the industry. Firms produce
varieties using a technology that features a constant marginal cost and a fixed cost, both
in terms of labor. Firms are heterogeneous in their productivity in the sense that marginal
labor costs varies across firms using the same technology. This idiosyncratic component
of labor productivity will be indexed byϕ , that also indexes firms and varieties. Firms
also can choose to upgrade their technology in the following sense: by paying an
additional fixed cost they can reduce their marginal cost of production. This can be
represented as a choice between two different technologies l and h, where h features a
higher fixed cost and a lower marginal cost. The resulting total cost functions under each
technology would be:
⎟⎟⎠
⎞⎜⎜⎝
⎛+=
⎟⎟⎠
⎞⎜⎜⎝
⎛+=
γϕϕηϕ
ϕϕϕ
)()(
)()(
qfTC
qfTC
h
l
(2)
where 1>η and .1>γ
Entry and timing
Before starting to produce a given variety firms face uncertainty regarding their
productivity level )(ϕ . Upon entry they pay a fixed cost consisting of units of labor,
and draw their productivity level from a known cumulative distribution function
ef
9
kG −−= ϕϕ 1)( . After observing their productivity they decide whether to exit the market
or start producing with one of the technologies in eq. (2). Finally, in every period there is
an exogenous probability of exit )(δ .
Firm Behavior
After observing their productivity (ϕ ) firms choose the profit maximizing price and
technology given the equilibrium price level (P). First they calculate the price that attains
the maximum profits under each technology. Then, they choose the technology that
attains higher profits. If profits are negative under the best technology choice they exit.
Profit maximization
Under CES preferences the profit maximizing price is a constant markup over
marginal costs. Then, a firm with productivity ϕ using technology l will charge the
following price:
ϕρϕ 11)( =lp
the resulting quantity sold, revenues and profits are:
( )( )
( ) fPEfr
PEqpr
EPq
ll
lll
l
−=−=
==
=
−−
−−
−
11
11
1
1)(1)(
)()()(
)(
σσ
σσ
σσ
ϕρσ
ϕσ
ϕπ
ϕρϕϕϕ
ρϕϕ
(3)
For firms using technology h prices, quantities sold, revenues and profits are :
( )( )
( ) ηγϕρσ
ηϕσ
ϕπ
γϕρϕϕϕ
γρϕϕ
γϕρϕ
σσσ
σσσ
σσσ
fPEfr
PEqpr
EPq
p
hh
hhh
h
h
−=−=
==
=
=
−−−
−−−
−
111
111
1
1)(1)(
)()()(
)(
111)(
(4)
Technology choice
10
Firms will use the technology that attains higher profits, then they will use technology
h if:
( ) ( ) ( 111)()( 111 −>−⇔> −−− ηγϕρσ
ϕπϕπ σσσ fPElh ) (5)
Note that the cost of technology upgrading (the RHS of eq. 5) is the same for all firms
while the benefit (the LHS of eq. 5) is increasing in the firm's productivity. Then,
technology adoption will be characterized by a cutoff productivity level hϕ above which
all firms will use technology h. Technology choice is represented in Figure 1, where hπ
are profits for using technology h as a function of productivity ( )1−σϕ and lπ are
profits for using techology l.
Hπ
Lπ
1−σϕ
1−σϕhTechnology Low Technology High
1*
−σ
ϕExit
Figure I: Technology Choice
ηf
f
Exit
The expected present value of profits is:
( )⎭⎬⎫
⎩⎨⎧=
⎭⎬⎫
⎩⎨⎧
−= −∞
=∑ )(1,0max)(1,0max)( ϕπ
δϕπδϕ st
st
v
11
As profits are increasing in productivity, firms below a certain threshold will
make negative profits and exit. Note that, as only the most productive firms adopt
technology h, this threshold will be defined by the zero profit condition under technology
l:
∗ϕ
( ) ( ) 01)( 11 =−=−∗−∗ fPEl
σσ ϕρσ
ϕπ (6)
Industry Equilibrium
To solve for the equilibrium price (P), number of firms (M) and the distribution of
active firms' productivities in the economy it will be convenient to write all the
equilibrium conditions as functions of the exit cutoff ( ) which in turn will be
determined by the free entry condition. I will first write
∗ϕ
hϕ as a function of .The
productivity cutoff for adopting technology h is given by , which
implies:
∗ϕ
)()( hl
hh ϕπϕπ =
( ) ( ) ( ) ( 111 111 −=−−−− ηϕρ
σγ σσσ fPE h ) (7)
Next, can be expressed as a function of using the definition of the exit cutoff
(eq. 6) to substitute for the price index (P) and income (E) in eq. 7:
hϕ ∗ϕ
11
11
1
−
⎟⎟⎠
⎞⎜⎜⎝
⎛−−
= −∗
σ
σγηϕϕ h (8)
Then, as long as ∗ϕϕ h
( ) 111
1 11 >= −
− −− σ
σγη , which is the case when , only the most
productive firms use technology h and the fraction of surviving firms adopting
technology h is:
1−> σγη
( )( ) ( ) kk
GG hh
−
−−−
−−
⎥⎦⎤
⎢⎣⎡== −
−∗
∗
∗1
1
1 11
)(1)(1 σ
σγη
ϕϕϕ
ϕϕ .
It will also be useful to define as the ex-post weighted average productivity level
of surviving firms, where ex-post means that for firms adopting technology h effective
productivity is
~ϕ
γϕ , and ex-post productivities are weighted by the elasticity of
substitution to reflect their impact on the price index:
12
( ) ( )1
1
)(1)(
)(1)( 111
−
∗ ⎟⎟⎠
⎞⎜⎜⎝
⎛−
+−
= ∗−−
<∗−
<<
∼
∫∫σ
ϕϕϕϕγϕ
ϕϕϕϕ σσ
ϕϕ
σ
ϕϕϕd
Ggd
Gg
hh
(9)
The average productivity level of surviving firms can also be expressed as a
function of the cutoff by substituting from eq. (8) in eq. (9). An explicit
solution can be obtained by using the Pareto distribution:
∼
ϕ
∗ϕ hϕ
( )1
11
1
1
~−
−
∆⎭⎬⎫
⎩⎨⎧
−−= ∗ σ
σ
σϕϕ
kk (10)
where
( )1
11
11
1111
−+−
−−
⎟⎟
⎠
⎞
⎜⎜
⎝
⎛⎟⎟⎠
⎞⎜⎜⎝
⎛−−
−+=∆−
σ
σσ
σ
γηγ
k
(11)
As prior to entry firms don't know their productivity level, free entry implies that the
present value of expected profits equals the sunk entry cost:
( )[ ] _11 πδ
ϕ∗−= Gfe (12)
where ( )∗− ϕG1 is the probability of survival and are per-period expected profits
of surviving firms:
_
π
( ) ( ) ( )( )∗
−−
−−
−−−=ϕϕηϕρ
σπ
σσ
GGffPE
h
1111 1~
1_
(13)
where ( )( )∗−
−ϕϕ
GG h
11 is the probability of adopting technology h.6
6 To obtain equation 17 note that if _
r are expected revenues of surviving firms:
13
To solve for the free entry condition (12) it is convenient to express expected profits in
terms of the exit cutoff . Then by substituting (6) in (13) expected profits can be
written as a function of :
∗ϕ
∗ϕ
( ) ( ) ( )⎟⎟⎟
⎠
⎞
⎜⎜⎜
⎝
⎛
⎟⎟⎠
⎞⎜⎜⎝
⎛−−−
⎟⎟⎟
⎠
⎞
⎜⎜⎜
⎝
⎛=
−
∗
∗−
∗
∗ kh
fϕϕϕη
ϕϕϕπ
σ
11
1~_
(14)
and by substituting ( )∗
∗
ϕϕϕ
~
by (13) and ( )∗
∗
ϕϕϕ h
by (18) average profits can be written as:
( ) ∆⎟⎟⎠
⎞⎜⎜⎝
⎛−−
−= f
k 11_
σσπ (15)
Note that expected profits are independent of , which is due to the use of a Pareto
distribution for
∗ϕ
)(ϕG . In general, changes in have two effects on expected profits: a
direct positive effect as each firm has a higher productivity which makes each firm's
profit increase; and an indirect negative effect as a higher implies productivity of
competitors is higher, thus the price index is lower and each firm's profits fall. In the case
of a Pareto distribution both effects cancel out, and as a result average profits are
independent of the cutoff.
∗ϕ
∗ϕ
To interpret the formula for expected profits it is convenient to write as: ∆f
( ) ( ) ( )⎪⎭
⎪⎬⎫
⎪⎩
⎪⎨⎧
⎟⎟⎠
⎞⎜⎜⎝
⎛−+=
⎪⎭
⎪⎬⎫
⎪⎩
⎪⎨⎧
⎟⎟⎠
⎞⎜⎜⎝
⎛−
−−+=∆
−
∗
∗−
−
−kh
h fffffk
ϕϕϕ
γηη
σ
σ
1
1111 1
( ) ( )( ) ( ) ( )( )
( ) ( )( ) ( )( )
( )1~
1_
1111_
11111_
)()()(1
1
)()()(1
1
−−
−−
<
−
<<∗−
−−−
<
−−
<<∗
=
⎥⎦⎤
⎢⎣⎡ +
−=
⎥⎦⎤
⎢⎣⎡ +
−=
∫∫
∫∫
∗
∗
σσ
σσ
ϕϕ
σ
ϕϕϕ
σ
σσσ
ϕϕ
σσ
ϕϕϕ
ϕρ
ϕϕϕγϕϕϕϕ
ρ
ϕϕϕγρϕϕϕρϕ
PEr
dgdgG
PEr
dgPEdgPEG
r
hh
hh
14
where ( ) fffh 1−=− η is the fixed cost of technology h and ( )( ) kh −
∗
∗
ϕϕϕ is the fraction
of firms that use technology h, then ∆f can be interpreted as the average fixed production
cost of surviving firms. Note that if there was only one technology available then average
profits would be the same as in (15) but with 1=∆ . In that case, expected profits take the
simple form of a multiple of the revenues of the marginal firm which must equal the fixed
production cost (f). In the case where technology h becomes available expected profits
increase by the additional fixed production cost ( )ffh − of the marginal firm adopting
technology h multiplied by the fraction of firms adopting technology h : ( )( ) kh −
∗
∗
ϕϕϕ . The
option to upgrade technology thus increases expected profits, the reason being that the
marginal adopting firm gets no increase in profits for adopting, but all the firms above
must be making positive adoption profits as adoption generates higher revenues for them
but they pay the same the same fixed cost as the marginal adopting firm.
Free entry implies that the present value of expected profits: ( ) _1 πϕ δ
k−∗ must equal
the sunk entry cost: . The solution for the entry cutoff is then: ef
( )k
kff
e
1
11
⎥⎦
⎤⎢⎣
⎡⎟⎟⎠
⎞⎜⎜⎝
⎛−−
−∆=∗
σσ
δϕ (16)
The exit cutoff in the case of only one technology is the one corresponding to 1=∆ ,
then as ( )[ ] 11)1(1 11 11 >−−+=∆ −− −− σσ ηγ σ kk
the exit cutoff increases in the case firms can
choose to upgrade technology. The reason is that the most productive firms can increase
their profits by adopting technology h, which increases expected profits and induces
entry. As a result, the price index falls (or wages increase) so that the least productive
firms make negative profits and exit.
By substituting (16) in (8) the productivity cutoff to adopt technology h can be
obtained:
k
k
kff
e
h 11
11
11
11
1 ∆⎟⎟⎠
⎞⎜⎜⎝
⎛−−
⎭⎬⎫
⎩⎨⎧
⎟⎠⎞
⎜⎝⎛
−−−
=−
−
σ
σγη
σσ
δϕ (17)
15
Average productivity of surviving firms can be obtained by substituting eq. (16) in eq.
(9):
( )( )[ ]
111
111
1111
11~
−
−
−+
+∆⎟⎟⎠
⎞⎜⎜⎝
⎛
−−
−⎟⎟⎠
⎞⎜⎜⎝
⎛= σ
σ
σ
σσ
δϕ k
k
kk
kk
ff
e
(18)
Welfare can be measured by the real wage, which is the inverse of the price index (P),
as the wage is the numeraire. The price index can be written as a function of average
productivity and the measure of firms M by changing the integration variables in equation
(1):
111
)(1)()(
−∼
∗−
≥
− ⎟⎠⎞
⎜⎝⎛=
−= ∫ ∗
σσ
ϕϕ
σ ϕρϕϕϕϕ Md
GgMpP (19)
To solve for the measure of firms note that it can be obtained by dividing total revenue
in the economy by average revenue ⎟⎠⎞⎜
⎝⎛ = _
r
EM . By the equality of income and
expenditure, LE = and _
r can be obtained from average profits: , then ⎟⎠⎞
⎜⎝⎛ += fr
__πσ
⎟⎟⎠
⎞⎜⎜⎝
⎛+
=f
LM _πσ
, and substituting for from eq. (15) _
π
( )( )1−−∆=
σσ kkf
LM (20)
The solution for the price level can then be obtained by substituting eq. (20) and eq.
(18) in (19):
( ) ( )( )
k
k
kk
kff
LP e
1
1
11
1111
111 −
−− ∆⎟⎟
⎠
⎞⎜⎜⎝
⎛−−
−⎟⎠⎞
⎜⎝⎛= −
−
σσδσ
ρσ
σ
(21)
The following subsection discusses the effects of a reduction in the cost of adoption on
technology choice and average productivity in the closed economy. It can be useful to
build intuition on the workings of the model, but this comparative static result will not be
taken to the data so this subsection can be skipped to continue reading the open economy
version of the model.
16
Effects of a reduction in the cost of adoption
The closed economy model can be useful to analyze the effect of a reduction in the
relative cost of new technologies in a setting where initial productivity differences can
give rise to heterogeneity in the adoption decision. As all variables of interest depend on
the cost of adoption η only through ,∆ it suffices to note that:
( ) 01)1(1
1 111 <−−⎥⎦⎤
⎢⎣⎡
−−=
∂∆∂
−− −− σσ ηγση
σ kkk
because 1−>σk . Then, expected profits increase as η falls. To interpret this result
note that expected profits are a multiple of expected fixed cost, then when the cost of
adoption falls, revenues from adoption must fall, but as the share of firms adopting
technology h grows faster ( )( )∗
∗
ϕϕϕ h
expected profits still increase. Thus, in a sense, the
reduction on the cost of adoption is reducing the excess profits (w.r.t. the marginal active
firm) of the most productive firms that had already adopted, but increases the excess
profits of new adopters, and the second effect dominates. This result relies on the
assumption that 1−>σk , that implies that the density of the firm productivity
distribution falls faster than the market share of more productive firms increases which is
a necessary assumption for the average productivity in the industry to be finite.
The increase in expected profits would induce entry in the industry and thus the exit
productivity cutoff ( )∗ϕ must fall. As both the exit productivity cutoff falls and the share
of firms using technology h increases, average productivity in the industry grows,
which reduces the price level (P) and increases welfare
⎟⎠⎞
⎜⎝⎛ ~ϕ
( )P1 . At the same time, the
measure of firms (M) falls: this is simply the result of the increase in the "average fixed
cost" ( in the economy: although the fixed cost to adopt technology h falls, the
share of firms adopting increases more than proportionally and as a result the average
fixed cost increases. As on average firms are using more labor to cover the fixed
production cost an economy of size L would support less firms or varieties in equilibrium.
The reduction in the measure of varieties will increase the price index and reduce welfare,
)f∆
17
but the net welfare effect of the fall in technology adoption cost is positive as the increase
in average productivity overweighs the reduction in varieties.
In sum, a reduction in technology adoption cost will increase welfare by inducing both
selection of better firms into the industry and an increase in the productivity of the firms
that adopt technology h.
2.2 Open Economy
In the absence of trade frictions the open economy model is identical to the closed
economy one, except that the relevant size of the economy (L) would increase to
incorporate the size of all trading partners. Then, in the solution of the closed economy
equilibrium presented above only L would change when opening up to trade, and thus
technology adoption would not be affected as hϕ would stay constant. The exit cutoff
would not change either thus average productivity would remain the same. The only
effect of opening up to trade would be an increase in the measure of firms, or varieties
offered worldwide, increasing welfare through a corresponding fall in the price level,
exactly as in Krugman's model (Krugman 1979-1980).
∗ϕ
Similarly, if there were only variable trade costs all firms would export and, as will be
shown below, a reduction in variable trade costs would have no effect on technology
adoption. Thus, I will introduce two types of trade frictions:
1. Per-unit iceberg costs, so that τ units need to be shipped for 1 unit to make it to
the foreign country.
2. An initial fixed cost of units of labor to start exporting, incurred after firms
have learnt
exf
ϕ .
I will consider the simple case of two symmetric countries that engage in a bilateral
trade liberalization, thus all parameters, including τ will be identical for both countries.
18
Firm Behavior
Profit Maximization
Profits from sales in the domestic market would be identical as in the closed economy
(eqs. 3 and 4) with the exception that the price index P now takes into account the
prices of varieties imported from foreign. Profits from export sales (under technology l,
as an example) would be:
( ) xel fPE −= −−− 111 1)( σσσ ϕρ
στϕπ
where the symmetry assumption implies that the price index ( )P and the expenditure
level ( in foreign are the same as at home. Revenues in the export market are reduced
in a fraction reflecting the extra variable trade costs that get translated in a higher
price in the export market
)Eστ −1
τϕρϕ 111)( =lp and produce lower revenues because demand is
To analyze the joint decision of whether to enter the export market and whether to
adopt technology h, firms compare the total profit of each of the four resulting choices,
which are:
Profits if only servicing the domestic market and using technology l:
( ) fPEfr xl
dl −=−= −− 111)(1)( σσ ϕρ
σϕ
σϕπ
Profits if only servicing the domestic market and using technology h:
( ) ηγϕρσ
ϕσ
ϕπ σσσ fPEfr xl
dh −=−= −−− 1111)(1)(
Profits if also exporting and using technology l:
( ) ( ) xx
lxl ffPEfr −−+=−= −−− 111 11)(1)( σσσ ϕρ
στϕ
σϕπ
Profits if also exporting and using technology h:
19
( ) ( ) xx
lxh ffPEfr −−+=−= −−−− ηγϕρ
στϕ
σϕπ σσσσ 1111 11)(1)(
Exporting and technology choices are represented in Figure 2, where the four possible
profits are depicted as a function of firm's productivity (more precisely a transformation
of firm's productivity: ). The case represented is one where firms sort into four
different groups: the least productive firms
1−σϕ
( )∗<ϕϕ exit, the low productivity firms
( )xϕϕϕ <<∗ only serve the domestic market and use technology , the medium
productivity firms (
l
)hx ϕϕϕ << still use technology l but also export, and the most
productive firms ( ).ϕϕ <h both export and use technology h . This case is be obtained
when where is defined as the level of productivity above which a firm
using technology l will find exporting profitable, and is defined as the level of
productivity above which an exporter will find adoption of technology h profitable, as
can be seen from figure one. In Bustos (2005) I show that when the maximum
profit function has the shape depicted in figure one: it is the upper envelope of the four
profit functions corresponding to each combination of the technology and exporting
choices, but using technology h and only servicing the domestic market is always
dominated by some other choice, and there is a range of productivity levels where
exporting is profitable but adopting technology h is not, so that the marginal exporter
uses technology I will focus in this case
<xϕ hϕ xϕ
hϕ
<xϕ hϕ
.h ( )hx ϕϕ < in what follows and provide the
necessary parameter restrictions for this ordering of cutoffs to apply.
20
hdπ
ldπ
1−σϕ
Technology LExport
Technology HExportExit
Figure 2: Exporting and Technology ChoiceMaximum Profit Function π(ϕ σ-1)
lxπ
hxπ
Technology LDon’t Export
1−σϕh1
*−σ
ϕ1−σϕx
f
xff +
xff +η
ηf
As in the closed economy, to solve for the equilibrium price ( )tP , measure of firms (
) and the distribution of active firm's productivity in the economy it will be
convenient to write all the equilibrium conditions as a function of the exit productivity
cutoff , using the zero profit condition for the marginal active firm to partial out the
effects of the aggregate variables (
tM
∗ϕ
E and P ) on firm's profits , and leave the export and
technology adoption cutoffs as functions only of the parameters that affect those groups
of firms differentially. Then, I next state the conditions for exit, entry in the export
market and technology adoption as a function of the exit cutoff.
Exit
For the least productive firms profits are highest when using technology l and only
serving the domestic market, then the exit cutoff ( )∗ϕ is be defined by:
( ) ( ) 010)( 11 =−⇔=−∗−∗ fPEd
lσσ ϕρ
σϕπ (22)
21
Exporting
The marginal exporting firm uses technology l, thus the exporting cutoff )( xϕ is
defined by:
( ) ( ) 01)()( 111 =−⇔=−−−
xx
xxlx
dl fPE σσσ ϕρ
στϕπϕπ (23)
xϕ can be expressed as a function of by substituting the zero profit condition for
the marginal firm (eq. 22) in eq. (23):
∗ϕ
11−
⎟⎟⎠
⎞⎜⎜⎝
⎛= ∗
σ
τϕϕff xx (24)
note that as long as ( ) 111
>−στ ffx , thus only the most productive firms export. ∗>ϕϕ x
Technology Choice
The marginal firm adopting technology h is an exporter, then the adoption cutoff
)( hϕ is defined by:
( )( ) ( ) ( ) ( 1111
0)()(1111 −=+−
⇔=−−−−− ηϕρ
στγ
ϕπϕπσσσσ fPE h
hxlh
xh
) (25)
As in the closed economy, the benefit of technology adoption (the LHS of eq. 25 ) is
proportional to a firm's variable profits which in the open economy case are higher by a
factor ( )στ −+ 11 as firms do not only sell at home but also in the export market. Thus, the
exporting option increases the profitability of technology adoption. hϕ can be expressed
as a function of by using the zero profit condition for the marginal firm (eq. 22): ∗ϕ
( )1
1
11 1
1
1
111
−
−⎟⎟⎠
⎞⎜⎜⎝
⎛−−
+= −−
∗σ
σσσ γη
τϕϕ h (26)
The share of active firms adopting technology h ( ) ⎥⎦⎤
⎢⎣⎡ −
∗
kh
ϕϕ is higher in the open (eq.
26) than in the closed economy (eq. 8) as the cutoff for adoption falls relative to the exit
22
cutoff ( )∗ϕϕh
because ( ) 11 11
1 <+ −− σστ . This is so because in the open economy exporting
increases revenues, making technology adoption more profitable. Note that this is true
only if the marginal firm is a non-exporter; if the marginal firm was an exporter then the
share of firms adopting technology h would be the same in the closed and open economy
and τ would have no impact on technology choice.
By comparing eqs. (24) and (26) we can see that the parameter restriction for
is that technology adoption costs are high enough relative to fixed exporting costs:
xh ϕϕ >
( ) 11
11
1 11
1
1
>⎟⎟⎠
⎞⎜⎜⎝
⎛
+=
−− −−
−
− σσγη
σ
σ
ττ
ϕϕ
ffx
h
x
Industry Equilibrium
The exit cutoff will be determined by the free entry condition:
( )[ ] te Gf_11 π
δϕ∗−= (27)
that is identical to the closed economy one except that expected profits will now
account for the possibility of exporting:
t
_π
)()(~_~__
xxxddt p ϕπϕππ += (28)
where is the expected productivity level of home surviving firms that has the
same expression as in the closed economy (eq. 9) and are expected profits
from domestic sales, that have the same expression as in the closed economy (eq. 13),
d
~ϕ
~ϕ )(
~_
dd ϕπ
)(1)(1
∗−
−=ϕϕ
GG
xxp is the probability of exporting and are expected exporting profits: )(
~_
xx ϕπ
( ) ( ) xxxx fPE −⎥⎦⎤
⎢⎣⎡=
−∗−−
1~11
~_ 1)(σ
σσ ϕϕτρσ
ϕπ (29)
where is the expected productivity level of home firms that export: x
~ϕ
23
( ) ( ) 11
)()( 111~ −
⎥⎦⎤
⎢⎣⎡ += −−
<
−
<< ∫∫σ
ϕϕϕγϕϕϕϕ σσ
ϕϕ
σ
ϕϕϕdgdg
hhxx (30)
Then, to solve for the free entry condition (eq. 27) we need to write (eq. 28) as a
function of the exit cutoff. can be written as a function of the exit cutoff by
substituting for the solution for
t
_π
)(~_
dd ϕπ
( )∗ϕϕ h (eq. 26) in eq. 13 and by using the zero profit
condition for the marginal firm (eq. 22) to eliminate the aggregate variables (E and P)
in eq. (13). (eq. 29) can also be written as a function of the exit cutoff by
substituting for the solution for
)(~_
xx ϕπ
( )∗ϕϕ h and ( )∗ϕϕ x (eqs. 24 and 26) in the definition of
(eq. 30) to obtain and also using the zero profit condition for the marginal
firm in the foreign country (that is identical to the one at home (eq. 22) because of the
symmetry assumption) to eliminate the aggregate variables (E and P). After some
algebra, the solution for expected profits is:
~
xϕ ( )∗ϕϕ~
x
( ) tt fk
∆⎟⎟⎠
⎞⎜⎜⎝
⎛−−
−=
11_
σσπ (31)
( )( ) ( )⎪⎭
⎪⎬⎫
⎪⎩
⎪⎨⎧
⎥⎥⎦
⎤
⎢⎢⎣
⎡−⎟⎟
⎠
⎞⎜⎜⎝
⎛−+
−+⎟
⎟
⎠
⎞
⎜⎜
⎝
⎛⎟⎟⎠
⎞⎜⎜⎝
⎛+=∆
−−−
−−
−
111
1111
1
11 ηγτ
ητσσ
σσ
k
ff
ff x
k
xt (32)
To interpret the solution for expected profits note that tf∆ can be written as:
( ) ( ) ( )fffff h
kh
x
kx
t −⎟⎟⎠
⎞⎜⎜⎝
⎛+⎟⎟
⎠
⎞⎜⎜⎝
⎛+=∆
−
∗
∗−
∗
∗
ϕϕϕ
ϕϕϕ
Then, the solution for expected profits has the same form as in the closed economy:
expected profits are a multiple ( )( )11−−
−σ
σk of expected fixed costs ( )ft∆ . Note that this is
the case because with a pareto distribution expected profits are a multiple of the variable
profits of the marginal firm. In the simplest case of a closed economy with only one
technology and then expected profits are a multiple of the variable profits of the
marginal surviving firm, which must be equal to f. The addition of the exporting
1=∆t
24
possibility implies that for exporters, which are a fraction ( )( ) kx −
∗
∗
ϕϕϕ of the surviving
firms, expected profits will be augmented by a multiple of the variable exporting profits
of the marginal exporters which are .Thus, the possibility of exporting will increase
expected profits in the same way as in the model in Melitz (2003). Finally, for technology
adopters, which are a fraction
xf
( )( ) kh −
∗
∗
ϕϕϕ of surviving firms, expected profits will be
augmented by a multiple of the variable exporting profits of the marginal adopters which
are ( exactly as in the closed economy model. Still, the introduction of both the
option to export and the option to upgrade technology has an effect on expected profits
beyond the sum of the two parts: there is an interaction between the two options as in the
open economy the fraction of firms adopting technology h
)ffh −
( )( ) ⎥⎦⎤
⎢⎣⎡ −
∗
∗ kh
ϕϕϕ is higher than in
the closed economy by a factor ( ) 11 11 >+ −− σστk
because their profits are higher than those
of the marginal firm due to the exporting revenues, as discussed above.
By substituting the solution for average profits (eq. 31) in the free entry condition (eq.
27) we can solve for the exit cutoff:
( )k
te
t kff
1
11
⎥⎦
⎤⎢⎣
⎡∆⎟⎟⎠
⎞⎜⎜⎝
⎛−−
−=∗
σσ
δϕ (33)
By substituting the solution for the cutoff in eqs. 24 and 26 a solution for the exporting
and technology adoption cutoffs can be obtained:
( )1
1
1
1
11 −
⎟⎟⎠
⎞⎜⎜⎝
⎛∆⎥
⎦
⎤⎢⎣
⎡⎟⎟⎠
⎞⎜⎜⎝
⎛−−
−=
σ
τσ
σδ
ϕff
kff x
te
x k
k
(34)
( ) ( )1
1
11
1
1
11
1
11
111
−
−⎟⎟⎠
⎞⎜⎜⎝
⎛−−
+∆⎥
⎦
⎤⎢⎣
⎡⎟⎟⎠
⎞⎜⎜⎝
⎛−−
−= −−
σ
σσσ γη
τσσ
δϕ k
k
te
h
kff (35)
And finally, the price index can be obtained by substituting the exit cutoff (eq. 33) in
the zero profit condition for the marginal surviving firm (eq. 22):
25
( )k
k
te kf
fLfP
1
11
1
111 −
−
∆⎥⎦
⎤⎢⎣
⎡⎟⎟⎠
⎞⎜⎜⎝
⎛−−
−⎟⎠⎞
⎜⎝⎛=
−
σσ
δσ
ρ
σ
(36)
Bilateral trade liberalization
In this section I analyze the effects of a reduction in variable export costs on entry in
the export market and technology upgrading. First, it is easy to note by looking at eqs.
(24) and (26) that a reduction in τ will increase the fraction of surviving firms that export
( )( ) kx
−
∗
∗
ϕϕϕ and the fraction of surviving of firms that use technology h ( )( ) k
h−
∗
∗
ϕϕϕ . A fall in τ
increases exporting revenues inducing more firms to export and also increases the benefit
of technology adoption, inducing more firms to adopt technology h. This results in higher
expected profits as:
( ) 01
1_
<∂∆∂
⎟⎟⎠
⎞⎜⎜⎝
⎛−−
−=
∂∂
τσσ
τπ tt f
k
because 1>σ , ( 1−> )σk and
( ) ( ) ( ) 011
111
1
1
1
111 <−⎟⎟⎠
⎞⎜⎜⎝
⎛−
−+−⎟⎟
⎠
⎞⎜⎜⎝
⎛−=
∂∆∂ −
−
−− −
−−−−−− η
γητττ
τ
σ
σ
σ
σσσ
kk
k
kff
ffk xxkt
The increase in expected profits induces entry into the industry, and as a result the
price index at home falls (or the real wage and welfare increase), as can be seen from
equation (36) where the sign of τ∂∂P is the opposite of the sign of τ∂
∆∂ t . As the price index
at home falls, firms only servicing the domestic market see their revenues reduced and
thus the least productive ones exit the industry. As a result, the exit productivity cutoff
increases, as can be seen from equation (33) where the sign of τϕ∂∂ ∗
t is the same as the
sign of τ∂∆∂ t . Thus, exactly as in Melitz (2003) a reduction in variable export costs
induces the exit of the least productive firms in the industry.
Note that although the share of firms entering the export market and the share of firms
adopting technology h increases, meaning that ( )∗
∗
ϕϕϕx and ( )
∗
∗
ϕϕϕh fall, it could be in
principle possible that xϕ and hϕ increase as the exit cutoff is increasing. Indeed, the
26
reduction in τ has two effects on exporting revenues: first a direct positive effect as
exporters reduce their price and sales react more than proportionally ( 1>σ ); second, an
indirect negative effect as the price index at foreign falls because of entry of more
productive firms and technology upgrading at foreign, entry of new exporters from home,
technology upgrading of home exporters and the reduction of the prices charged by all
home exporters. In Appendix 1 I show that the direct effect dominates thus exporting
revenues increase and 0>∂∂τϕ x .
With respect to the benefit of technology upgrading, which is proportional to total
revenues, the reduction in τ then increases exporting revenues but reduces domestic
revenues as the home price index falls. P falls because there is entry of foreign firms, a
higher share of home firms use technology h and the least productive home firms exit. I
also show in the appendix that the first effect dominates so that 0>∂∂τϕh as long as not all
firms export ( ). Then, bilateral trade liberalization has an effect on technology
adoption only if not all firms export. The intuition for this result is that if all firms export,
then the marginal firm would be an exporter and thus would be defined by:
ff x >−1στ
∗ϕ
( ) ( ) ( ) 0110)( 111 =−−+⇔=−∗−−∗
xxl ffPE σσσ ϕρ
στϕπ (37)
and thus the technology adoption cutoff would be
11
11
1
−
⎟⎟⎠
⎞⎜⎜⎝
⎛−−
= −∗
σ
σγηϕϕ h
and expected profits would be
( ) ( )⎥⎥⎥
⎦
⎤
⎢⎢⎢
⎣
⎡−⎟
⎟
⎠
⎞
⎜⎜
⎝
⎛⎟⎟⎠
⎞⎜⎜⎝
⎛−−
++⎟⎟⎠
⎞⎜⎜⎝
⎛−−
−=
−
−
−
ffffk h
k
xt
11
11
11
1
_ σ
σγη
σσπ
Then, a reduction in τ would not affect expected profits, and thus the exit cutoff
would also remain unaffected. As a result, as can be seen in eq. (37) the price level would
fall in such a way to offset the increase in revenues produced by the fall in τ , thus the
benefit of technology adoption (that is proportional to revenues) would not increase. The
27
reason why this does not happen when not all firms export is that the reduction in τ
produces an advantage for the more productive firms relative to the marginal firm, thus
its positive impact on revenues is not offset by free entry.
The results that 0>∂∂τϕx and 0>∂
∂τϕh are important to establish for empirical work as
only if these cutoffs fall a reduction in variable export costs induces entry in the export
market and technology upgrading by firms that did not export or adopt technology h
before trade liberalization, which are the testable implications of the model I take to the
data in the following section.
3. Context and Data
3.1 Trade Liberalization
Argentina started reducing import tariffs with respect to the rest of the world before
MERCOSUR was launched. Between October 1988 and October 1991 there were 11
major revisions on trade policy, often related to changes in macroeconomic policy aimed
at controlling hyperinflation. By October 1991, the average nominal tariff was 12%,
ranging from 0% for capital goods not produced in the country to 22% for consumption
goods. Almost all import licenses were eliminated, with the exception of the automobile
industry.
MERCOSUR was established by Argentina, Brazil, Paraguay and Uruguay in March
1991. The agreement included the progressive elimination of tariff and non tariff
restrictions to trade, and the adoption of a common tariff with third countries. There was
a transition phase between 1991 and 1994 that consisted of progressive tariff reductions
aimed to achieve free trade within the region by the end of 1994. The Customs Union was
established in 1995 with the adoption of a Common External Tariff (CET), with an
average level of 11%. Tariffs varied between 0 and 20% across industries. Inputs and
materials had the lowest tariffs, followed by semi-finished industrial goods, and final
goods. There were exceptions to internal free trade for a limited number of products,
special regimes for sugar and automobiles and some products faced tariff rates different
from the CET. As a result of the agreement, in 1996 the import weighted average intra-
28
MERCOSUR tariff was 0.86% for Argentina and 0.02% for Brazil, while the extra-zone
average tariff was 13.17% and 15.44% respectively.
The panel I analyze covers the period 1992-1996, that is coincident with the
multilateral trade liberalization, but posterior to Argentina’s unilateral trade liberalization.
As a result, Argentinean import tariffs had already been reduced in the period under study.
In fact, between 1992 and 1996 average import tariffs increased slightly (1.28%). The
modifications on import tariffs during this period are partly related to the reduction in
tariffs within MERCOSUR, and the convergence to the CET, that partly reflected the
structure of protection in Brazil. Figure 1.a reports the frequency of the change in import
tariffs from Argentina with the rest of the world for 4-digit SIC industries, where within
each 4-digit-industry tariffs for different tariff lines (HS 1988) and origins are weighted
by imports.7 The reduction in import tariffs from Brazil is reported in Figure 1.b. The
average reduction was only 12 percentage points, as import tariffs in Argentina were
already low before MERCOSUR was launched. In fact, imports from Brazil grew exactly
at the same rate as imports from the rest of the world during this period (60%).
MERCOSUR had a much bigger impact on Argentinean exports. Between 1992 and
1996, exports to Brazil quadrupled, while exports to the rest of the world only increased
60%. As a result, growth in exports to Brazil explains 50% of the growth in exports
during this period. This might be related to the deep reduction in Brazilian tariffs for
imports from Argentina, which fell on average 24 percentage points, with a maximum fall
of 63 pp. Figure 2 reports the frequency of the variation in Brazilian import tariffs for 4-
digit SIC industries. This variation reflects import tariffs in 1992, as all tariffs were zero
in 1995, except for the automobile sector.
3.2 Firm-Level Data
The data I analyze comes from the Survey on Technological Behavior of Industrial
Argentinean Firms [Encuesta sobre la Conducta Tecnologica de las Empresas Industriales
Argentinas (ETIA)] conducted by the National Institute of Census and Statistics in
Argentina (INDEC). The survey covers the period 1992-1996 and was conducted in 1997
7 The source of tariff data is TRAINS.
29
over a representative sample of 1,639 industrial firms. The sample was based on 1993
census data and covers 40% of total industrial sales and employment in 1996.
As the survey was conducted in 1997, it does not contain information on firms that were
active in 1992 and exited afterwards. I focus my analysis on a balanced panel of 1,388
firms present both in 1992 and 1996 for which there is information on sales, employment
and belong to 4-digit-SIC industries with information on Brazil’s tariffs.
The survey contains information on several dimensions of spending on technology
upgrading. Firms upgrade technology by performing various innovation activities like
internal R&D, paying for technology transfers and buying capital goods that embody new
technologies; and with different purposes like changing production processes, products,
organizational forms or commercialization.
I constructed a measure of spending on technology (ST) that includes these different
dimensions: spending on computers and software; payments for technology transfers and
patents; and spending on equipment, materials and labor related to innovation activities
performed within the firm.8
The survey contains information on ST for all years in the period 1992-1996, while
information on all the rest of the variables (sales, exports, imports, employment by
education, investment) is only available for the years 1992 and 1996.
3.3 Sector-Level Data
In the empirical section I use controls for 4-digit-SIC industry characteristics that
might be correlated with changes in tariffs. First, average capital and skill intensity in the
industry in the U.S. in the 1980’s obtained from the NBER productivity database. The
measure of capital intensity is capital (real equipment plus real structures) per worker,
although other measures like only real equipment capital per worker, or capital over value
added provide similar results. The measure of skill intensity is the ratio of non production
to production workers in the industry, although the relative wage share of non production
workers was also used providing similar results. Finally, I use the elasticity of
substitution in the industry as estimated by Broda and Weinstein (2006).
8 Like R&D, adaptation of new products or production processes, technical assistance for production, engineering and industrial design, organization and commercialization
30
4. Empirics
In this section I test the predictions of the theoretical model developed in section 2.
First, I check whether observed characteristics of continuing exporters (firms that
exported both in 1992 and 1996) and new exporters (firms that did not export in 1992 but
did export in 1996) relative to non-exporters in the same 4-digit-SIC industry are
consistent with the sorting pattern predicted by the model. Second, I test whether firms
are more likely to enter the export market and upgrade technology in industries where
Brazil’s tariffs fell more.
4.1 Within-industry patterns in the data
In the model, underlying productivity differences produce a sorting of firms into three
groups: the low productivity firms only serve the domestic market and use the old
technology, the medium productivity firms still use the old technology but also export,
and the most productive firms both export and use the new technology. In this setting a
reduction in variable trade costs will increase exporting revenues inducing firms in the
middle-range of the productivity distribution to enter the export market and upgrade
technology. Figure 3 illustrates the effects of trade liberalization for firms in each part of
the productivity distribution. Note that firms with initial productivity ϕ > were already
exporting and high tech before liberalization, firms in the range were already
exporting before Brazil’s tariffs drop, but will find it profitable to adopt the new
technology only afterwards, as their export revenues increase. Thus, under this ordering
of cutoffs, we expect that, on average, continuing exporters increase their spending in
technology. Next, firms in the range will enter the export market and adopt
the new technology, while firms in the range enter the export market but
keep the old technology. Then, we would expect that, on average, new exporters increase
spending in technology.
0hϕ
00hx ϕϕϕ <<
01xh ϕϕϕ <<
11Hx ϕϕϕ <<
31
0Hϕ 1992
1996
Stay Non ExporterLow Tech
Start exportingStay Low Tech
Start exportingSwitch toHigh Tech
Continue exportingSwitch toHigh Tech
ContinueexportingStayHigh Tech
Figure 3: Effect of falling variable export costs
*1ϕ
X0ϕ
X1ϕ
H1ϕ
Exit
*0ϕ
Table 1 reports differences between exporters and non exporters within the same 4-
digit-SIC industry before liberalization: firms that were already exporting in 1992 are on
average 2.8 times bigger in terms of sales than never exporters, while firms that would
enter the export market after 1992 (new exporters) are in between (2 times bigger than
never exporters). In addition, firms that export in 1992 have a 0.37 log points higher level
of spending in technology per worker and are 6.5 times more skill intensive than firms
that would never export, while new exporters are not significantly more technology or
skill intensive than never exporters in 1992. In contrast, after liberalization these new
exporters become more skill and technology-intensive than firms that do not export,
increasing their spending in technology per worker 0.34 log points faster. Interestingly,
firms that were already exporting in 1992 also increase spending in technology 0.27 log
points faster than never exporters.
The patterns in the data described above show that there is a coincidence between
entry in the export market and technology upgrading, but can’t establish whether it is
expanded export opportunities that cause technology adoption or viceversa, or whether
both are caused by a third factor. As the results described above are based on
comparisons of exporters and non exporters within industries, they are robust to
32
macroeconomic shocks that affect all firms equally (an example could be exchange rate
appreciation) or to shocks that affect all firms within an industry (an example could be
fast technological change in a particular industry). Still, the fact that within each sector
exporters and new exporters are upgrading technology faster than other firms could
reflect other shocks that affect middle and high productivity firms differentially. One
example could be capital account liberalization that could facilitate access to credit to
finance technology upgrading and entry in foreign markets for middle and big firms but
not to small firms. Then, the next step in the empirical analysis attempts to establish
causality between exporting and technology adoption, by linking these outcomes directly
to the reduction in Brazil’s tariffs for imports from Argentina.
4.2 The Impact of the reduction in Brazil’s tariffs
Empirical identification of the effect of the fall in variable export costs on entry in the
export market and technology upgrading by Argentinean firms will be based on variation
in the change in Brazilian import tariffs across 4-digit-SIC Industries.
As the tariff reductions were programmed in 1991, and reach a level of zero for all
industries9 in 1995 the source of variation is the initial tariff levels in Brazil, thus the
change in tariffs can’t be driven by political pressures arising from the effects of
liberalization in Brazil or Argentina, or the response to shocks to industry performance
during this period. I use the 1992 tariffs of Brazil for imports from Argentina that were
very similar to tariffs for imports from the rest of the world. As in 1991 Argentina’s share
on Brazil’s imports was only 7.7%, and rose only to 11.2% in 1995 when all tariffs were
eliminated, it is unlikely that Brazil’s trade policy was targeted to industry characteristics
particular to Argentina, in the sense that they were high in industries where Argentina had
a comparative advantage. Still, Brazil’s tariff structure is correlated with certain industry
characteristics which could be an important source of bias. I address this problem in two
ways: first, I include 2-digit-SIC sector trends that would account for unobserved industry
characteristics at broad sector levels that could be correlated with Brazil’s tariffs; second,
I include in the regressions controls for some industry characteristics at the 4-digit-SIC
level as the elasticity of demand, capital and skill intensity. 9 Except for the automobile and sugar industries. All the results presented in this section have been replicated for the sample of firms excluding these sectors.
33
An additional issue concerning the use of Brazil’s tariffs to measure the effect of
expanded export opportunities on entry in the export market and technology upgrading is
that they might be correlated with changes in Argentina’s tariffs during this period, as
long as the structure of protection was similar between the two countries in 1992. To
address this concern I control for the change in Argentina’s tariffs with respect to the
world in the period 1992-1996, and alternatively for the change in Argentina’s tariffs
with respect to Brazil. An important point to note is that Argentina’s tariffs with the rest
of the world were very similar to tariffs with respect to Brazil in 1992 (the correlation is
0.92), thus it is hard to distinguish the effect of the reduction of tariffs with respect to
Brazil from changes of tariffs with respect to the rest of the world. In effect, as discussed
earlier, Argentina had already gone through a process of unilateral trade liberalization
before 1992, thus its tariffs were already low in 1992 and there was no change in the
share of Argentinean imports from MERCOSUR in the period 1992-1996 (stayed at
24%).
I will first present the estimation of the effect tariff changes on entry in the export
market and later the estimation for technology upgrading.
Entry in the export market
I estimate a linearized version of the entry in the export market choice described by
equation (34):
⎭⎬⎫
⎩⎨⎧ >+++
= Τ
otherwise
kIifEXP ijtijstjt
ijt 0
01 ετβ (I)
where j indexes 4-digit-SIC industries; s indexes 2-digit-SIC industries; t indexes time,
that is the years 1992 and 1996; i indexes firms; EXPijt is a dummy variable that takes
the value of 1 if the firm exported in year t; τjt are Brazil’s tariffs that vary at the 4-
digit-SIC industry and across time; kij are plant fixed effects that capture unobserved
constant plant heterogeneity (ϕ) and constant sector characteristics that affect the
sector exporting cutoffs in the model (σ, k, fx, f, η , γ ) and also some other sector
characteristics that although not included in the model might affect the exporting
34
cutoffs (like factor intensity) 10 ; Ist are 2-digit-SIC industry dummies that capture
variation across time in sector characteristics.
Due to the nonlinearity of the probability function in the probit model, equation (I)
with plant fixed effects can’t be consistently estimated by probit (incidental parameters
problem), then I will estimate it using the linear probability model:
ijtijstjtijt kIEXP ετβτ +++= (II)
In this case differencing eliminates the constant plant and sector heterogeneity:
ijsjij IEXP ετβτ ∆+∆+∆=∆ (III)
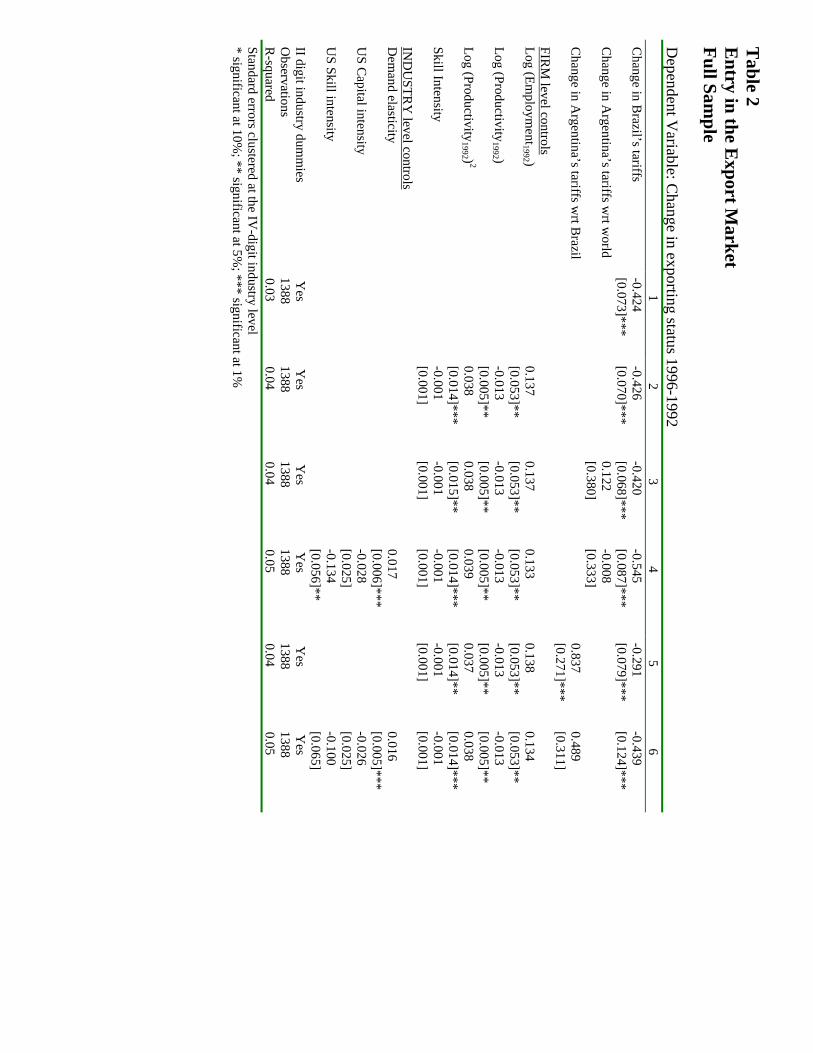
Estimation of equation 3 by OLS is reported in the first column of Table 2, where the
reported standard errors are clustered at the 4-digit-SIC industry level. The coefficient in
the change in Brazil’s tariffs (βτ) is negative (-0.424) and significant (t =-5.8), meaning
that the average drop in Brazil’s tariffs (24 percentage points) increases the probability of
entry in the export market by 10 percentage points.
There are several potential problems with the estimation of equation (III). First, it is a
linearized version of a nonlinear probability function, then if the true function is
nonlinear first differencing does not eliminate constant unobserved plant and sector
characteristics, and these might be correlated with tariffs. One way to check if the linear
specification in equation (II) is correct is to include in the regression initial firm and
industry characteristics that are expected to be proxies for constant firm and industry
heterogeneity:
ijsjcijzjij IczEXP εββτβτ ∆+∆+++∆=∆ 1992 (IV)
Where zij1992 are firm characteristics in the initial year (1992) like size measured by the
number of workers, productivity measured by sales per worker and skill intensity; and cj
are 4-digit-SIC industry characteristics like the elasticity of demand, skill and capital
intensity in the U.S.
10 Bernard, Redding and Schott (2004) develop a 2 factor, 2 sector and 2 country model of trade with heterogeneous firms and show that the cutoff for entry in the export market is closer to the exit cutoff in comparative advantage industries.
35
Estimation of equation (IV) is reported in columns (2) to (6) of Table 2, and although
some of the firm and industry characteristics are highly significant, the coefficient on
Brazil’s tariffs is not significantly affected by their inclusion. I also control for the change
in import tariffs in case these had some indirect effect on exporting, but these are not
significant. The coefficients in the regressions including all controls (columns 4 and 6)
are -0.545 (t=-6.26) and -0.439 (t=-3.5) and imply that the average drop in Brazil’s tariffs
(24 percentage points) increases the probability of entry in the Brazil’s market by 13 to10
percentage points.
It is interesting to note that the results reported in Table 2 imply that bigger and more
productive firms are more likely to enter the export market, as predicted by the model.
Skill intensity at the firm-level has no effect on entry in the export market. Measures for
the change in Argentina’s tariffs with the world are not significant (Columns 3 and 4),
and the change in Argentina’s tariffs with respect to Brazil is also not significant once
controls for sector characteristics are included (Columns 5 and 6).
Of the sector characteristics only the elasticity of demand has a significant positive
effect on entry, and skill-intensity has a significant negative effect that becomes
insignificant when the change in Argentina’s tariffs with respect to Brazil is included in
the regression, as Argentina was protecting unskilled-labor intensive sectors these
variables are highly correlated and become insignificant when both are included in the
regression. I think it is likely that the relevant variable in this setting is skill intensity
because Argentina’s tariffs were already low before MERCOSUR, and as a result the
share of MERCOSUR imports in total Argentinean imports did not increase between
1992 and 1996.
A second potential problem of the specification in equation (IV) is that if there are
sunk exporting costs, current exporting status might depend on lagged exporting status,11
which in turn is likely to be correlated with the initial level of Brazil’s tariffs. As the
panel I am analyzing only contains data for 1992 and 1996, it is not possible to include
lagged export status in the specification in differences. One way to check that this is not
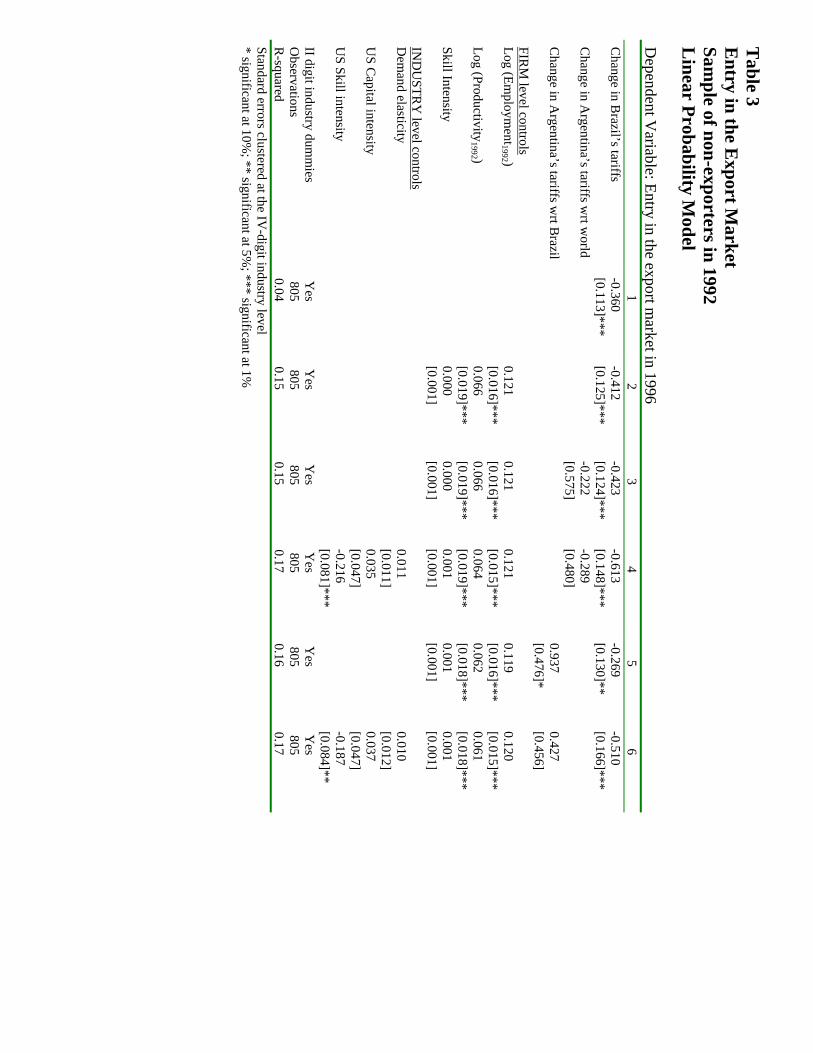
creating a problem in the identification on the coefficient on Brazil’s tariffs is to estimate
11 Bernard and Jensen (2004) find evidence of the existence of sunk exporting costs in the U.S.
36
the equation restricted to firms that were not exporters in 1992. In this case, as the only
possible outcome is entry, I will estimate both the linear probability model (LPM) and the
Probit model:
⎭⎬⎫
⎩⎨⎧ >+∆+++∆
=otherwise
IczifEXP ijsjcijzj
ij 0
01 19921996
νββτβτ (V)
Table 3 reports the estimation of equation (V) by the LPM. The coefficient on the
change in Brazil’s tariffs is very similar to the one estimated with the full sample and
significant [-0.613 (t=-4.14) and -0.51 (t=-3.07) in columns 4 and 6 where all controls are
included], implying that the average reduction in tariffs increases the probability of
entering the export market by 15 to 12 percentage points.
Table 4 reports estimation of equation (V) by the Probit model. The coefficient on the
change in Brazil’s tariffs is similar to the one estimated with the LPM and significant (-
0.716 (t=-4) and -0.582 (t=-3.05) in columns 4 and 6 where all controls are included),
implying that the average reduction in tariffs increases the probability of entering the
export market by 17 to 14 percentage points.
It is interesting to note that the initial size control, that is included as an indicator of
the permanent component of firm productivity, enters in a quadratic form in the
estimation with the full sample and only as a linear term in the estimation restricted to
non exporters in 1992.12 In the first case, the effect of size on entry peaks 0.38 standard
deviations above the mean of the size distribution, after which it is negative. This is
consistent with the model’s prediction that firms in the middle range should be entering
when tariffs fall, as the most productive ones would already be exporters. In the second
case, as the sample is restricted to non exporters, the effect of size is predicted to be
monotonic: more productive firms are always more likely to enter.
A potential problem in the estimation of equation (V) is sample selection. The model
predicts that in sectors where tariffs are higher the exporting cutoff will be higher, thus it
is likely that in sectors with high initial tariffs non exporters will be more productive than
in sectors with low initial tariffs, creating a positive correlation between tariffs in 1992 12 Alternative polynomials in size were included in each specification, and the reported ones are the only ones that were significant.
37
and unobserved productivity, thus biasing downwards the coefficient on the change in
tariffs. A simple way to asses whether this is a problem is to look at the correlation of
firm characteristics that are correlated with unobserved productivity like size and sales
per worker in the sub sample of non exporters in 1992, and both are very low (-0.033 and
0.013). In addition, when these firm characteristics are included in the regressions the
coefficient does not change in the case of the LPM (Column 2 of table 3) and becomes
still lower in the Probit model (Column 2 of table 4), thus sample selection does not seem
to play an important role.
Technology adoption decision
The technology adoption decision described in the model (equation 35) is binary, but
the variable I observe in the data is spending in technology, then i will try to identify
changes in technology through changes in spending in technology, both in absolute levels
and per worker. According to equation (35), a firm will be more likely to adopt
technology H the lower is the threshold ϕH in its sector, and the higher is its own
productivity (ϕ), then the level of spending in technology can be described by:
ijtijstjtmjtxijt kIST mx εταταττ
++++=log (VI)
where τm denotes import tariffs, as adoption of new technologies depends on the size
of the export market and also the size of the domestic market. In differences:
ijsjmjxij IST mx εταταττ
∆+∆+∆+∆=∆ log (VII)
Estimation of equation VII by OLS is reported in Table 5. The coefficient on the
change in export tariffs is negative and significant in all specifications. The size of the
coefficient (-0.867 (t=-2.36) -1.195 (t=-2.13) in columns 4 and 6 where all controls are
included) implies that the average drop in Brazil’s tariffs (24 percentage points) induces
an increase in technology spending of 0.20 to 0.28 log points. In this case all firm-level
variables are significant but their inclusion has a very small effect on the coefficient on
Brazil’s tariffs. The change in import tariffs is not significant.
Next, I estimate equation (VII) for two sub-samples of firms, the ones that were not
exporting in 1992 and the ones that were exporting, as the model predicts that both
38
groups will upgrade technology if the ordering of cutoffs for entry in the export market
(ϕx) and for adopting the new technology (ϕh) before (t=0) and after liberalization (t=1) is
. Reductions in Brazil’s tariffs will induce entry in the export market
and adoption of the new technology for firms that with initial productivity (ϕj) in the
range . Then, within the group of firms that were not exporting in
1992, bigger tariff reductions imply bigger drops in both thresholds and thus a higher
likelihood that firms will find themselves in the range where they enter the export market
and upgrade technology. Table 6 reports the estimation of equation (V) for the sub-
sample of firms that were not exporting in 1992. The coefficient βTx is significant in all
specifications and similar to the one estimated for the full sample. For the other half of
the sample, firms that were exporting in 1992, the reduction in tariffs would induce
technology upgrading if they are on the range which again will be
more likely the bigger the drop in ϕH, thus the larger the reduction in Brazil’s tariffs.
Table 7 reports the estimation for the sub sample of firms that exported in 1992, the
coefficient is similar to the one estimated for the full sample, and significant in all
specifications except in column (4) where all sector-level controls are included and the
change in Argentinean tariffs with respect to the world is included. The change in
Argentinean tariffs is correlated with initial Brazilian tariffs (correlation is 0.15), as
between 1992 and 1995 the external tariffs of Argentina converged to the common
external tariff of MERCOSUR, that was partly based on Brazil’s external tariff structure,
thus it is possible that the smaller sample size of the group of exporters makes it difficult
to separately identify their effects when all sector-level controls are included, as when
only firm level controls and the change in Argentina’s tariffs is included the coefficient
on Brazil’s tariffs is significant.
0011HxHx ϕϕϕϕ <<<
0011HxHx ϕϕϕϕϕ <<<<
0011HxHx ϕϕϕϕϕ <<<<
The result that firms that were already exporting in 1992 upgrade technology is
consistent with technology upgrading being driven by the increase in revenues, which
results from the assumption that adoption of the new technology requires payment of a
fixed cost. If technology upgrading was driven by the mere act of exporting, Brazil’s
tariffs would impact technology spending only through their induced entry in the export
39
market, and there would be no effect on the sample restricted to firms that exported in
1992.
A further question is if the reduction in Brazil’s tariffs also increases the technology
intensity of production, in the sense of increasing the ratio of spending in technology to
labor. This is stronger evidence that firms are actually changing the technology they are
using, instead of just expanding production by increasing the use of all factors
proportionally. Table 8 reports estimates of equation VII, replacing the growth in
spending in technology by the growth in spending in technology per worker as the
dependent variable. The estimates of βTx are very similar to the ones reported in table 5.
Finally, tables 9 and 10 report the estimation of the same equation restricted to non
exporters and exporters in 1992, providing results similar to tables 6 and 7.
Domestic Sales
As an additional robustness check that the drop in Brazil’s tariffs is acting through
increased export revenues and is not correlated with other shocks that might affect
industries at the 4-digit-SIC level of desegregation and would not be captured by the 2-
digit-SIC-industry dummies, I estimated equation VII with the change in domestic sales
as a dependent variable. The results are reported in table 11. Domestic sales are not
significantly correlated with Brazil’s tariffs, except in the two specifications that include
all controls (columns 4 and 6) where the coefficient is significant at 10% confidence level.
Still, as the coefficient is always positive it would actually bias the effect of Brazil’s
tariffs on technology towards zero, as the fall in Brazil’s tariffs is slightly correlated with
negative shocks in domestic sales. Interestingly, the model predicts that in sectors where
Brazil’s tariffs fall more domestic sales would be reduced for all firms as the exit
productivity cutoff increases, so competitors in the industry become more productive. In
addition, for firms that did not upgrade technology domestic sales would also fall due to
the technology upgrading by rivals, thus a positive correlation of domestic sales with the
change in Brazil’s tariffs is not inconsistent with the model. Still, even in the case where
this correlation is reflecting other shocks to domestic sales it is weak and can’t be behind
the 1% significance found in the equivalent regressions for entry in the export market ad
technology upgrading.
40
5. Concluding Remarks
The evidence reported in this paper suggests that expanded export opportunities can
have a positive effect on firm performance. The evidence is consistent with falling
variable export costs increasing revenues for exporters and making adoption of new
technologies profitable for more firms. The finding that falling variable export costs
induce firms to take actions that can increase their productivity suggests that the cross-
sectional differences between exporters and non exporters are not completely explained
by selection of the most productive firms into the export market, but are partly induced
by participation in export markets. Then, trade policies oriented to facilitate access to
foreign markets, like multilateral trade liberalizations, can have a positive effect on firm-
level performance.
41
References
Bernard, Andrew B. and J. Bradford Jensen, 1999, “Exceptional Exporter Performance: Cause, Effect or Both?” Journal of International Economics 47 1-25.
Bernard, Andrew B. and J. Bradford Jensen, 2004, “Why Some Firms Export” The Review of Economics and Statistics 86 (2) 561-569.
Bernard Andrew, Stephen Redding and Peter Schott, 2007 “Comparative Advantage and Heterogeneous Firms,” Review of Economic Studies, 74, 31-66.
Bustos, Paula, 2005, “The Impact of Trade on Technology and Skill Upgrading: Evidence from Argentina” Unpub. Paper UPF.
Broda, Christian and David Weinstein, 2006, “Globalization and the Gains from Variety,” Quarterly Journal of Economics 121 (2) 541-585.
Melitz, Marc, 2003, “The Impact of Trade on Aggregate Industry Productivity and Intra-Industry Reallocations,” Econometrica 71 (6) 1695-1725.
Clerides, Sofronis K., Saul Lach, and James R. Tybout, 1998, “Is Learning by Exporting Important? Micro-dynamic Evidence from Colombia, Mexico and Morocco,” Quarterly Journal of Economics 133 (3) 903-947.
Trefler, D., 2004, “The Long and The Short of the Canada-U.S. Free Trade Agreement, ” American Economic Review 94 (4) 870-895.
Verhoogen, E., 2007, “Trade, Quality Upgrading and Wage Inequality in the Mexican Manufacturing Sector:,” Unpub. Paper Columbia University.
Yeaple, S.R., 2005, “A Simple Model of Firm Heterogeneity, International Trade and Wages,” Journal of International Economics 65 1-20.
42
Theory Appendix
1. Proof that :0>∂∂τϕx
( ) τσ
σδ
ϕσ
k
k
tx
e
x
ff
kff 1
111
11
∆⎟⎟⎠
⎞⎜⎜⎝
⎛⎥⎦
⎤⎢⎣
⎡⎟⎟⎠
⎞⎜⎜⎝
⎛−−
−=
−
( )( )ττ
σσ
δτϕ σ
∂∆∂
⎟⎟⎠
⎞⎜⎜⎝
⎛⎥⎦
⎤⎢⎣
⎡⎟⎟⎠
⎞⎜⎜⎝
⎛−−
−=
∂∂ − kk
tx
e
x
ff
kff
11
11
11
Then, as 1>σ and ( ,1−> )σk it is sufficient to consider the sign of the last term.
( ) ( ) ( )kk
kk kx
k
xkt f
fff
1
11
11
1
11
11 11
⎪⎭
⎪⎬⎫
⎪⎩
⎪⎨⎧
⎥⎥⎦
⎤
⎢⎢⎣
⎡−⎟⎟
⎠
⎞⎜⎜⎝
⎛−−
++⎟⎟
⎠
⎞
⎜⎜
⎝
⎛⎟⎟⎠
⎞⎜⎜⎝
⎛+=∆
−
−
− −
−−
−
ηγηττττ
σσ
σ
σσ
Then, the last term is:
( ) ( ) ( ) ( )⎪⎭
⎪⎬⎫
⎪⎩
⎪⎨⎧
⎥⎥⎦
⎤
⎢⎢⎣
⎡−⎟⎟
⎠
⎞⎜⎜⎝
⎛−−
+∆=∂∆∂ −−
−−
−1
111 11
11
11
1η
γηττ
ττ σ
σ
k
kk
k
Akk
kt
t (A.1)
where
( ) ( ) 011 1111 11 >+−+= −−−−− −− σσσ τττττ σσkk
kkA kk
because:
( ) ( )
( )σ
σ
σσσ
ττ
τττττ σσ
−
−
−−−−−
+>
⇔+>+
⇔>−−
1
1
1111
11
11
011
kk
kk
Akk
Then, as all terms in equation (A.1) are positive, ,0
1
>∂
⎟⎟⎠
⎞⎜⎜⎝
⎛∆∂
τ
τkt
and then 0>∂∂τϕx .
2. Proof that :0>∂∂τϕh
43
First, note that as ,0>k ( )[ ]τϕ
τϕ
∂∂
∂∂ =
khh signsign
( ) ( ) ( ) 11
11 1
11
11 −
−−−
− +∆⎟⎟⎠
⎞⎜⎜⎝
⎛−−
⎥⎦
⎤⎢⎣
⎡⎟⎟⎠
⎞⎜⎜⎝
⎛−−
−= σ
σσ
σ τγη
σσ
δϕ
kk
te
kh kf
f
( )[ ]( )
( )τ
τ
γη
σσ
δτϕ
σσ
σ
σ ∂⎥⎦⎤
⎢⎣⎡ +∆∂
⎟⎟⎠
⎞⎜⎜⎝
⎛−−
⎥⎦
⎤⎢⎣
⎡⎟⎟⎠
⎞⎜⎜⎝
⎛−−
−=
∂∂
−−
−−
−
11
1
1
1
11
11
kk
t
e
kh
kff
Then, it is sufficient to consider the sign of the derivative of the last term w.r.t. τ , where the last term is:
( ) ( ) ( ) ( ) ( )⎪⎭
⎪⎬⎫
⎪⎩
⎪⎨⎧
⎥⎥⎦
⎤
⎢⎢⎣
⎡−⎟⎟
⎠
⎞⎜⎜⎝
⎛−−
++++=+∆−−
−−
−−−
−
−−−−−−−− 1
11111
111
111
1111 η
γηττττ
σσσ
σσσ
σσσσ
kkkkk
ff xk
t
Then,
( )( ) ( )
⎥⎥⎦
⎤
⎢⎢⎣
⎡−⎟
⎟⎠
⎞⎜⎜⎝
⎛+++=
∂⎥⎦⎤
⎢⎣⎡ +∆∂ −
−−−−−
−
−
−−−−−−−−
−−1
11
1
1
1
1111
1
1111 σ
σσ
σ
σ
σ
ττττττ
τσσσ
σ kkk
k
ff
ffk xkxk
t
As ( ) 01 11 >+ −−− σστk
k , then the sign of ( )
τ
τ σσ
∂
⎥⎦
⎤⎢⎣
⎡+∆∂ −
−− 111k
t
is the same as the sign of the last term: which i show below is as long as which will be the case if trade costs are such that not all firms export:
0> ff x >−1στ
( )
( )
( )
( )
ff
ff
ff
ff
ff
ff
ff
ff
ff
x
xk
xkxkxk
xkxk
xkxk
k
kkk
kk
kk
>
⇔>
⇔+>+
⇔+>+
⇔>−⎟⎟⎠
⎞⎜⎜⎝
⎛++
−
−−
−−−−
−−−−
−−−−−−
−−−
−−−
−−−
−−−
−−−
−−−
−−−
−−−
1
1
1
11
111
11
11
11
11
11
11
11
11
11
1
11
011
σ
σ
σ
σσ
σσ
τ
τ
τττ
τττ
ττττ
σσ
σσ
σσ
σσ
σσ
σσ
σσ
σσ
44
Figures 1.a and 1.b Change in Argentina’s Import Tariffs 1992-1996
1.a Average for all countries
15
10Density
5
0
-.1 -.05 0 .05 .1 .15
Change in Tariffs
1.b Average for Brazil
15
10
Density
5
0
-.2 -.15 -.1 -.05 0
Change in Tariffs
Figure 2 Change in Brazil’s Tariffs for Imports from Argentina 1992-1996
5
4
Density 3
2
1
0
-.6 -.4 -.2 0
Change in Tariffs
Table 1 Within Industry Patterns in the Data: Exporter Premia Firm Characteristic
Robust Standard Errors in Brackets * significant at 10%; ** significant at 5%; *** significant at 1% Note: Exporter premia are estimated from a regression of the form:
ijjijENijEEijNEij IENEENEY εαααα +++++=ln where i indexes firms, j indexes industries (four digit SIC classification); NE are new exporters, EE are continuing exporters, EN are firms that exported in 1992 but didn’t in 1996 and the reference category relative to which differences are estimated is non exporters; Ij are industry dummies, and Y is the firm characteristic for which the premia are estimated. Observations New Exporters 231Continuing Exporters 557Stopped Exporting 27Non Exporters 573Total 1388
Table 2
Entry in the E
xport Market
Full Sample
Dependent V
ariable: Change in exporting status 1996-1992
1
2
3
45
6C
hange in Brazil’s tariffs
-0.424 -0.426
-0.420-0.545
-0.291-0.439
[0.073]***
[0.070]***[0.068]***
[0.087]***[0.079]***
[0.124]***C
hange in Argentina’s tariffs w
rt world
0.122
-0.008
[0.380][0.333]
Change in A
rgentina’s tariffs wrt B
razil
0.837 0.489
[0.271]***
[0.311]FIR
M level controls
Log (Employm
ent1992 )
0.137 0.137
0.133 0.138
0.134
[0.053]**[0.053]**
[0.053]**[0.053]**
[0.053]**Log (Productivity
1992 ) -0.013
-0.013-0.013
-0.013-0.013
[0.005]**
[0.005]**[0.005]**
[0.005]**[0.005]**
Log (Productivity1992 ) 2
0.0380.038
0.0390.037
0.038
[0.014]***[0.015]**
[0.014]***[0.014]**
[0.014]***Skill Intensity
-0.001
-0.001 -0.001
-0.001 -0.001
[0.001][0.001]
[0.001][0.001]
[0.001]IN
DU
STRY
level controls
Dem
and elasticity
0.017
0.016
[0.006]***
[0.005]***U
S Capital intensity
-0.028
-0.026
[0.025][0.025]
US Skill intensity
-0.134
-0.100
[0.056]**
[0.065]II digit industry dum
mies
Yes
Yes
Yes
Yes
Yes
Yes
Observations
1388 1388
1388 1388
1388 1388
R-squared
0.03 0.04
0.04 0.05
0.04 0.05
Standard errors clustered at the IV-digit industry level
* significant at 10%; ** significant at 5%
; *** significant at 1%
Table 3
Entry in the E
xport Market
Sample of non-exporters in 1992
Linear Probability M
odel D
ependent Variable: Entry in the export m
arket in 1996
1
23
45
6C
hange in Brazil’s tariffs
-0.360 -0.412
-0.423-0.613
-0.269-0.510
[0.113]***
[0.125]***[0.124]***
[0.148]***[0.130]**
[0.166]***C
hange in Argentina’s tariffs w
rt world
-0.222
-0.289
[0.575][0.480]
Change in A
rgentina’s tariffs wrt B
razil
0.937 0.427
[0.476]*
[0.456]FIR
M level controls
Log (Employm
ent1992 )
0.121 0.121
0.121 0.119
0.120
[0.016]***
[0.016]***
[0.015]***
[0.016]***
[0.015]***
Log (Productivity1992 )
0.0660.066
0.0640.062
0.061
[0.019]***[0.019]***
[0.019]***[0.018]***
[0.018]***Skill Intensity
0.000
0.000 0.001
0.001 0.001
[0.001][0.001]
[0.001][0.001]
[0.001]IN
DU
STRY
level controls
Dem
and elasticity
0.011
0.010 [0.011]
[0.012]U
S Capital intensity
0.035
0.037
[0.047][0.047]
US Skill intensity
-0.216
-0.187
[0.081]***
[0.084]**
II digit industry dumm
ies Y
es Y
es Y
es Y
es Y
es Y
es O
bservations805
805 805
805 805
805R
-squared0.04
0.15 0.15
0.17 0.16
0.17Standard errors clustered at the IV
-digit industry level * significant at 10%
; ** significant at 5%; *** significant at 1%
Table 4
Entry in the E
xport Market
Sample of non-exporters in 1992
Probit Model
Dependent V
ariable: Entry in the export market in 1996
1
2
34
56
Change in B
razil’s tariffs -0.369
-0.437
-0.457
-0.716-0.274
-0.582
[0.111]***
[0.140]***[0.138]***
[0.179]***[0.150]*
[0.191]***C
hange in Argentina’s tariffs w
rt world
-0.412
-0.531
[0.646][0.571]
Change in A
rgentina’s tariffs wrt B
razil
1.116 0.560
[0.644]*
[0.588]FIR
M level controls
Log (Employm
ent1992 )
0.130 0.130
0.130 0.127
0.128
[0.019]***
[0.019]***
[0.019]***
[0.020]***
[0.019]***
Log (Productivity1992 )
0.0830.085
0.0810.078
0.077
[0.022]***[0.022]***
[0.023]***[0.022]***
[0.022]***Skill Intensity
0.000
0.000 0.001
0.001 0.001
[0.001][0.001]
[0.001][0.001]
[0.001]IN
DU
STRY
level controls
Dem
and elasticity
0.009
0.007 [0.013]
[0.013]U
S Capital intensity
0.045
0.048
[0.051][0.052]
US Skill intensity
-0.273
-0.241
[0.108]**
[0.106]**
II digit industry dumm
ies Y
es Y
es Y
es Y
es Y
es Y
es O
bservations805
805 805
805 805
805O
bserved P .289441
.289441 .289441
.289441 .289441
.289441 Predicted P (at X
bar) .2823885
.2572645 .2568933
.2525254 .2559729
.2526902 Log-likelihood value
-467.0335 -417.06766
-416.85636 -410.88945
-414.91253 -410.78402
Pseudo R-squared
0.0357 0.1389
0.1393 0.1516
0.1433 0.1518
Standard errors clustered at the IV-digit industry level
* significant at 10%; ** significant at 5%
; *** significant at 1%
Table 5
Technology A
doption Full Sam
ple D
ependent Variable: C
hange in Log (Spending in Technology) 1996-1992
12
3
45
6C
hange in Brazil’s tariffs
-1.017
-1.029-1.011
-0.867-1.251
-1.195
[0.344]***
[0.339]***[0.318]***
[0.367]**[0.406]***
[0.562]**C
hange in Argentina’s tariffs w
rt world
0.353
0.345
[1.132][1.155]
Change in A
rgentina’s tariffs wrt B
razil
-1.400 -1.463
[1.147][1.466]
FIRM
level controls
Log (Employm
ent1992 )
0.090 0.090
0.089 0.093
0.093
[0.032]***[0.032]***
[0.032]***[0.032]***
[0.032]***Log (Productivity
1992 )
0.607 0.608
0.582 0.617
0.585
[0.287]**[0.287]**
[0.277]**[0.285]**
[0.274]**Log (Productivity
1992 ) 2 -0.072
-0.073-0.068
-0.073-0.068
[0.033]**
[0.033]**[0.032]**
[0.033]**[0.032]**
Skill Intensity
0.006 0.006
0.006 0.005
0.006
[0.002]**[0.002]**
[0.003]**[0.002]**
[0.003]**IN
DU
STRY
level controls
Dem
and elasticity
0.024
0.029 [0.021]
[0.022]U
S Capital intensity
-0.212
-0.215
[0.079]***
[0.081]***
US Skill intensity
0.215
0.113
[0.165][0.211]
II digit industry dumm
ies Y
es Y
es Y
es Y
es Y
es Y
es O
bservations899
899 899
899 899
899R
-squared0.03
0.05 0.05
0.05 0.05
0.05Standard errors clustered at the IV
-digit industry level * significant at 10%
; ** significant at 5%; *** significant at 1%
Table 6
Technology A
doption Sam
ple of non-exporters in 1992 D
ependent Variable: C
hange in Log (Spending in Technology) 1996-1992
12
3
45
6C
hange in Brazil’s tariffs
-0.981 -1.213
-1.254-1.144
-1.375-1.308
[0.495]*
[0.496]**[0.479]**
[0.524]**[0.577]**
[0.736]*C
hange in Argentina’s tariffs w
rt world
-0.570
-0.423
[1.499][1.551]
Change in A
rgentina’s tariffs wrt B
razil
-1.224 -1.098
[1.349][1.775]
FIRM
level controls
Log (Employm
ent1992 )
0.140 0.140
0.135 0.144
0.139
[0.053]***[0.053]***
[0.054]**[0.053]***
[0.055]**Log (Productivity
1992 )
0.362 0.363
0.354 0.368
0.361[0.395]
[0.396][0.393]
[0.396][0.393]
Log (Productivity1992 ) 2
-0.037-0.037
-0.035-0.037
-0.035[0.048]
[0.049][0.049]
[0.048][0.048]
Skill Intensity
0.010 0.010
0.009 0.009
0.009
[0.003]***[0.003]***
[0.004]***[0.003]**
[0.004]**IN
DU
STRY
level controls
Dem
and elasticity
0.014
0.018 [0.042]
[0.044]U
S Capital intensity
-0.084
-0.083
[0.136][0.133]
US Skill intensity
0.164
0.098
[0.207][0.255]
II digit industry dumm
ies Y
es Y
es Y
es Y
es Y
es Y
es O
bservations421
421 421
421 421
421R
-squared0.07
0.11 0.11
0.11 0.11
0.11Standard errors clustered at the IV
-digit industry level * significant at 10%
; ** significant at 5%; *** significant at 1%
Table 7
Technology A
doption Sam
ple of exporters in 1992 D
ependent Variable: C
hange in Log (Spending in Technology) 1996-1992
12
3
45
6C
hange in Brazil’s tariffs
-1.093 -1.020
-0.959-0.821
-1.328-1.447
[0.381]***
[0.379]***[0.390]**
[0.539][0.452]***
[0.722]**C
hange in Argentina’s tariffs w
rt world
1.994
1.816
[1.687][1.763]
Change in A
rgentina’s tariffs wrt B
razil
-1.785 -2.331
[1.671][1.992]
FIRM
level controls
Log (Employm
ent1992 )
0.094 0.097
0.100 0.097
0.102
[0.045]**[0.044]**
[0.044]**[0.045]**
[0.046]**Log (Productivity
1992 )
0.543 0.541
0.525 0.544
0.502[0.494]
[0.491][0.471]
[0.495][0.464]
Log (Productivity1992 ) 2
-0.075-0.076
-0.071-0.076
-0.068[0.055]
[0.055][0.051]
[0.055][0.050]
Skill Intensity
0.002 0.002
0.003 0.002
0.002 [0.003]
[0.003][0.003]
[0.003][0.003]
IND
USTR
Y level controls
Dem
and elasticity
0.025
0.035 [0.023]
[0.024]U
S Capital intensity
-0.224
-0.240
[0.108]**
[0.106]**
US Skill intensity
0.217
0.033
[0.262][0.327]
II digit industry dumm
ies Y
es Y
es Y
es Y
es Y
es Y
es O
bservations478
478 478
478 478
478R
-squared0.05
0.07 0.07
0.08 0.07
0.08Standard errors clustered at the IV
-digit industry level * significant at 10%
; ** significant at 5%; *** significant at 1%
Table 8
Technology Intensity
Full Sample
Dependent V
ariable: Change in Log (Spending in Technology per w
orker) 1996-1992
1
23
4
5
6C
hange in Brazil’s tariffs
-1.049 -1.025
-0.949-0.782
-1.256-1.162
[0.330]***
[0.332]***[0.311]***
[0.349]**[0.402]***
[0.550]**C
hange in Argentina’s tariffs w
rt world
1.520
1.576
[1.063][1.074]
Change in A
rgentina’s tariffs wrt B
razil
-1.459 -1.381
[1.040][1.381]
FIRM
level controls
Log (Employm
ent1992 )
0.190 0.192
0.191 0.194
0.193
[0.031]***[0.031]***
[0.031]***[0.031]***
[0.031]***Log (Productivity
1992 )
0.555 0.558
0.550 0.566
0.551
[0.226]**[0.225]**
[0.221]**[0.224]**
[0.220]**Log (Productivity
1992 ) 2 -0.078
-0.079-0.077
-0.079-0.076
[0.026]***
[0.026]***[0.026]***
[0.026]***[0.026]***
Skill Intensity
0.002 0.002
0.002 0.002
0.002 [0.002]
[0.002][0.002]
[0.002][0.002]
IND
USTR
Y level controls
Dem
and elasticity
0.012
0.020 [0.024]
[0.025]U
S Capital intensity
-0.133
-0.135
[0.080][0.082]
US Skill intensity
0.231
0.126
[0.160][0.212]
II digit industry dumm
ies Y
es Y
es Y
es Y
es Y
es Y
es O
bservations899
899 899
899 899
899R
-squared0.04
0.09 0.09
0.09 0.09
0.09Standard errors clustered at the IV
-digit industry level * significant at 10%
; ** significant at 5%; *** significant at 1%
Table 9
Technology Intensity
Sample of non-exporters in 1992
Dependent V
ariable: Change in Log (Spending in Technology per w
orker) 1996-1992
1
23
4
5
6C
hange in Brazil’s tariffs
-0.910 -1.027
-0.913-0.782
-1.279-1.245
[0.519]*
[0.485]**[0.455]**
[0.500][0.560]**
[0.719]*C
hange in Argentina’s tariffs w
rt world
1.602
1.707
[1.359][1.379]
Change in A
rgentina’s tariffs wrt B
razil
-1.906 -1.830
[1.267][1.741]
FIRM
level controls
Log (Employm
ent1992 )
0.258 0.258
0.254 0.264
0.262
[0.053]***[0.053]***
[0.055]***[0.053]***
[0.055]***Log (Productivity
1992 )
0.389 0.387
0.396 0.398
0.415[0.326]
[0.324][0.325]
[0.326][0.328]
Log (Productivity1992 ) 2
-0.048-0.049
-0.049-0.048
-0.050[0.041]
[0.040][0.041]
[0.040][0.041]
Skill Intensity
0.003 0.003
0.003 0.002
0.002 [0.003]
[0.003][0.003]
[0.003][0.003]
IND
USTR
Y level controls
Dem
and elasticity
0.008
0.016 [0.041]
[0.043]U
S Capital intensity
-0.015
0.004
[0.137][0.136]
US Skill intensity
0.213
0.081
[0.199][0.258]
II digit industry dumm
ies Y
es Y
es Y
es Y
es Y
es Y
es O
bservations421
421 421
421 421
421R
-squared0.08
0.14 0.15
0.15 0.15
0.15Standard errors clustered at the IV
-digit industry level * significant at 10%
; ** significant at 5%; *** significant at 1%
Table 10
Technology Intensity
Sample of exporters in 1992
Dependent V
ariable: Change in Log (Spending in Technology per w