Page 1
Page 1 of 19
29 October 2012
Susanna Chui
[email protected]
(852) 2235 7131
Trading data
52-Week Range (HK$)
3 Mth Avg Daily Vol (m)
No of Shares (m)
Market Cap (HK$m)
Listed on HKEx
IPO Price (HK$)
Major Shareholders (%)
Auditors
Result Due
1.00/2.03
0.33
1,037.73
1,432.06
Dec 2010
2.88
HiSun Tech (43%)
Hao Capital (23%)
Fidelity (9%)
PWC
FY12: Mar Company description
Founded in 2000, PAX is the no. 1 and no. 3 EFT-POS terminal solution provider in China and
the world respectively. It is strong in Asia/ Pacific
and Mideast/ Africa. Its major customers are
acquiring banks and merchant service provider
such as CCB (939.HK), BOC (3988.HK), ABC
(1288.HK) and UMS.
Price chart
-
0.50
1.00
1.50
2.00
2.50
3.00
3.50
Dec
-10
Mar
-11
Jun
-11
Sep
-11
Dec
-11
Mar
-12
Jun
-12
Sep
-12
HK$
Undervalued leader in e-payment
Rating Buy Initiation
Target Price HKD 2.30
Current price
HKD 1.38 Upside +67%
No. 1 EFT-POS terminal solution provider in China
PAX is currently the no. 1 player in EFT-POS (electronic funds transfer
point of sale) terminal solution provider in China and rank the third
globally. Over the past years, the company has enjoyed the fastest
shipment growth amongst the top players. The potential losses from fraud
could be so significant that customers must ensure the terminals are up to
the highest security standards. Therefore, behind the company growth is
the customer confidence, supported by PAX’s advancing leading position,
qualification and established track record.
Secular growth due to low penetration and EMV upgrade
In 2011, the global payment card terminal shipment has increased 14.4%,
with 33.2% growth in emerging markets. There is still huge room for
growth in emerging markets given the low penetartion rate (emerging
markets: <5 units/1,000 people, versus developed markets: 10-35 units).
Growth will also be rekindled in developed markets with EMV (Europay,
MasterCard and Visa) upgrade which offers higher security as a mean to
combat credit card fraud. We believe PAX can benefit from these
opportunities as well as expand their overseas' market share.
Industry consolidation favorable for overseas share gain
In recent years, global top players have been pursuing growth through
aggressive M&A. As the industry consolidation leads to fewer choices and
lower bargaining power for customers, the customers will be more open to
deal with other qualified providers. We believe PAX, the third largest
global player, just after Ingenico and VeriFone, can benefit and gain
further overseas market share. With fast growing overseas sales, of which
GPM is above the company average, the blended GPM will be pulled up.
We initiate coverage on PAX Global with BUY
The company is trading at 7.3x FY12E PER (2.4x FY12E ex-cash PER,
with HKD973.2mn of cash in 1H12), which is 51.8% lower than the
average 15.2x of its peers (Verifone, Ingenico and Xinguodu). We believe
the valuation discount will be narrowed given its growth in global market
share. We initiate coverage on the stock with target price of HK$2.30,
based on 12.2x FY12E PER or 20% discount to peers.
HKD million FY10A FY11A FY12E FY13E FY14E
Revenue 724 1,103 1,291 1,596 2,011
Operating profit 173 207 234 282 354
Net Profit 145 182 195 235 295
Consensus NP 196 243 282
EPS (HKD) 0.19 0.18 0.19 0.23 0.28
P/E (x) 7.1 7.9 7.3 6.1 4.8
Sources: Bloomberg, CIRL estimates
PAX Global | 327.HK
China Puti
Page 2
Page 2 of 19
No. 1 EFT-POS terminal solution provider in China
PAX is currently the no. 1 player in EFT-POS (electronic funds transfer point of sale)
terminal solution provider in China and rank the third globally. The company is
increasingly gaining global market share. Amongst the top 5 players, it has delivered
the largest CAGR of 53.4% in shipment over 2007-2011.
Exhibit 1: POS terminal global market share in 2011
Ranking Market share Shipment Change
Ingenico (FR) 1 28.1% 4,844,000 18%
VeriFone (US) 2 25.3% 4,363,847 38%
PAX (CN) 3 5.5% 949,271 83%
CyberNet (KR) 4 4.6% 787,500 0%
Bitel (KR) 5 3.3% 563,375 32%
Castles (TW) 6 3.1% 532,100 -5%
Xinguodu (CN) 7 2.3% 400,000 82%
Gertec (BR) 8 1.5% 250,000 14%
Newland (CN) 9 1.4% 242,800 31%
Spectra Tech. (HK) 10 1.2% 213,746 27%
Total
100.0% 17,232,904 14%
Source: The Nilson Report, CIRL (excluding SZZT, which focuses on EPOS terminals)
Exhibit 2: PAX has enjoyed the fastest growth since 2007 compared with other top players
Source: The Nilson Report, CIRL (excluding SZZT, which focuses on EPOS terminals)
After years of rapid growth, the company has a well-established global presence. It is
now the top 10 provider in all regions, particularly strong in Asia-Pacific and Mideast/
Africa, accounting for 11.1% and 10.2% shipment in these regions respectively.
-20%
0%
20%
40%
60%
80%
100%
2007 2008 2009 2010 2011
Ingenico (FR) VeriFone (US) PAX (CN)
CyberNet (KR) Bitel (KR) Industry
Page 3
Page 3 of 19
Results in the Asia-Pacific region have come about as a result of its strong presence
in its stronghold, China, whilst opportunities in Middle-East arise from their tendency
to source non-US suppliers due to their tense relationship with US.
Exhibit 3: PAX is the top 10 provider in all regions
Regions PAX shipment Region shipment Market share Ranking
Asia/ Pacific (China) 714,277 6,454,456 11.1% (30-32%) 3 (1)
Mideast/ Africa 161,878 1,588,338 10.2% 4
Europe 57,495 4,296,436 1.3% 6
Latin America 12,060 2,770,644 0.4% 9
United States 3,355 1,913,008 0.2% 10
Canada 206 210,022 0.1% 7
Total 949,271 17,232,904 5.5% 3
Source: The Nilson Report, PAX, CIRL (excluding SZZT, which focuses on EPOS terminals)
What are EFT-POS Terminals?
An EFT-POS terminal is a system which allows the customer or cashier to swipe a
payment card and authorize the transaction through either a signature or PIN. There
are various different types of terminals, including counter-top POS terminals
(supporting broadband and dial connectivity), mobile POS terminals (supporting
wireless connectivity, such as GPRS and Wi-Fi), consumer activated devices (for
inputting the PIN codes), and contactless devices (for contactless cards such as
Visa’s payWave and MasterCard’s PayPass).
Exhibit 4: PAX’s existing products
Source: PAX, CIRL
How does the payment card transaction process work?
Every payment card transaction involves multiple parties such as the cardholders, the
issuer (the consumer’s banks), the merchants, and the acquirer (the merchant's
banks/ payment processors), which are all connected with the card association’s
Page 4
Page 4 of 19
network. Processing a payment card transaction mainly involves two stages:
authorization and settlement. Here is the general overview.
Exhibit 5: Typical electronic fund transfer transaction
Source: PAX, CIRL
Who are the customers?
We generally see POS terminals at merchants, when we purchase with payment
cards. The decision on which POS terminal to buy are usually made by the merchant's
acquirers (merchant's banks or payment processors) and merchant service providers
(UnionPay Merchant Services (UMS) and independent sales organizations (ISO),
which act as agents to penetrate the small-to-medium level merchant market on
behalf of the acquiring banks). In rare instances, only the largest merchants, such as
Walmart, will get involve in the decision themselves.
Cardholder Merchant
(e.g. retailers, restaurant and hotels)
Acquirers
(Merchant's banks/ payment processors)
Card Association
(e.g. China UnionPay)
Merchant service provider
(e.g. UMS and ISO)
Issuer
(Consumer’s banks)
EFT-POS terminal solutions provider
(e.g. PAX)
Customers Other parties involved in the transaction PAX
Authorization is the process, where an electronic request is sent through various parties to either approve or decline the transaction.
1. Cardholder pays with card through an EFT-POS terminal at merchant, which sends transaction data to the acquiring bank.
2. The acquiring bank sends authorization request to the issuing bank through the network of card association.
3. The issuing bank verifies that the cardholder’s credit is sufficient and grants authorization.
4. The acquiring bank receives the response and relays it to the merchant.
5. Merchant receives the authorization response and completes the transaction accordingly.
Settlement is the process, where all parties settle their accounts.
1. Merchant deposits the transaction receipt with the acquiring bank.
2. The acquiring bank submits settlement files to the issuing bank for reimbursement via the network of card association.
3. The issuing bank posts the transaction to the cardholder account and sends the cardholder a monthly statement.
4. Cardholder receives statement and pays issuer.
Page 5
Page 5 of 19
Why the customers choose PAX? It’s all about confidence.
According to The Nilson Report, the amount of fraud losses is ~USD8.0bn, which is
equaled to 4.46¢ per $100 in total volume of purchases. The potential fraud loss is so
significant that merchants’ banks or payment processors must ensure the terminals
are up to the highest security standards. Therefore, the determining factor that drives
the purchase is all about customer confidence, supported by PAX’s advancing leading
position, qualification and established track record.
1) Higher customer confidence amid rapid market share growth: PAX is increasingly
gaining market share in global market. The company is ranked No. 3 in 2011, up
from No. 7 in 2007. At the same time, the market share of both Ingenico and
Verifone has declined to 28.1% and 25.3% in 2011, from 31.8% and 30.0% in
2007 respectively. The customers will think of PAX after Ingenico (ING.FP) and
Verifone, leading to higher chance of selecting PAX as one of their qualified
suppliers. The narrowing gap with these two largest players will also improve
customer confidence in PAX's product quality.
Exhibit 6: PAX’s global market share
Source: The Nilson Report, CIRL
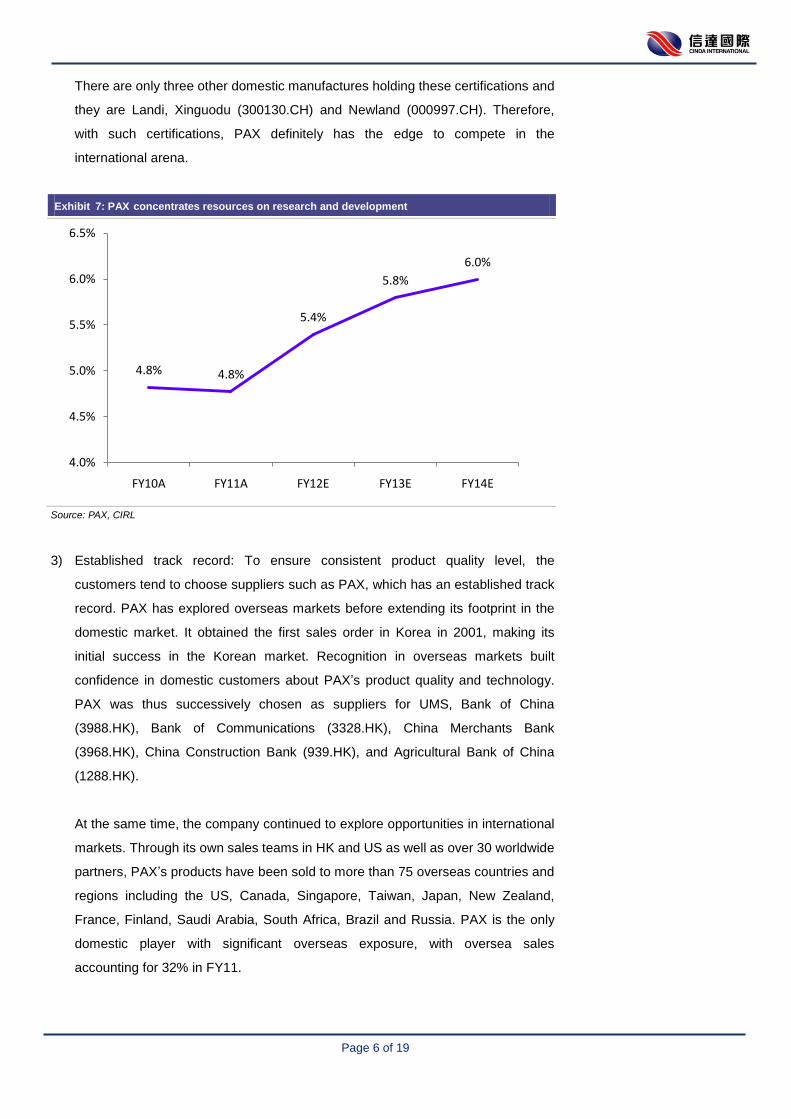
2) Boasting over the high certification barrier: PAX concentrates resources on
research and development which accounts for ~5.0% of total revenue. PAX also
outsources EMS manufacturers to provide assembly and processing services.
With over 500 employees, ~55% of them are engineers.
PAX was the first Asian POS terminal solution provider in Asia to obtain EMV
(Europay, MasterCard and Visa) 2000 certifications. It has also been awarded PCI
(Payment Card Industry) certifications, which are mandatory around the world.
31.8% 30.9%28.3% 28.1% 28.1%
30.0%
26.7%24.0%
21.7%
25.3%
1.4% 1.9% 2.3%3.5%
5.5%
0.0%
5.0%
10.0%
15.0%
20.0%
25.0%
30.0%
35.0%
2007 2008 2009 2010 2011
Ingenico (FR) Verifone (US) PAX (CN)
Page 6
Page 6 of 19
There are only three other domestic manufactures holding these certifications and
they are Landi, Xinguodu (300130.CH) and Newland (000997.CH). Therefore,
with such certifications, PAX definitely has the edge to compete in the
international arena.
Exhibit 7: PAX concentrates resources on research and development
Source: PAX, CIRL
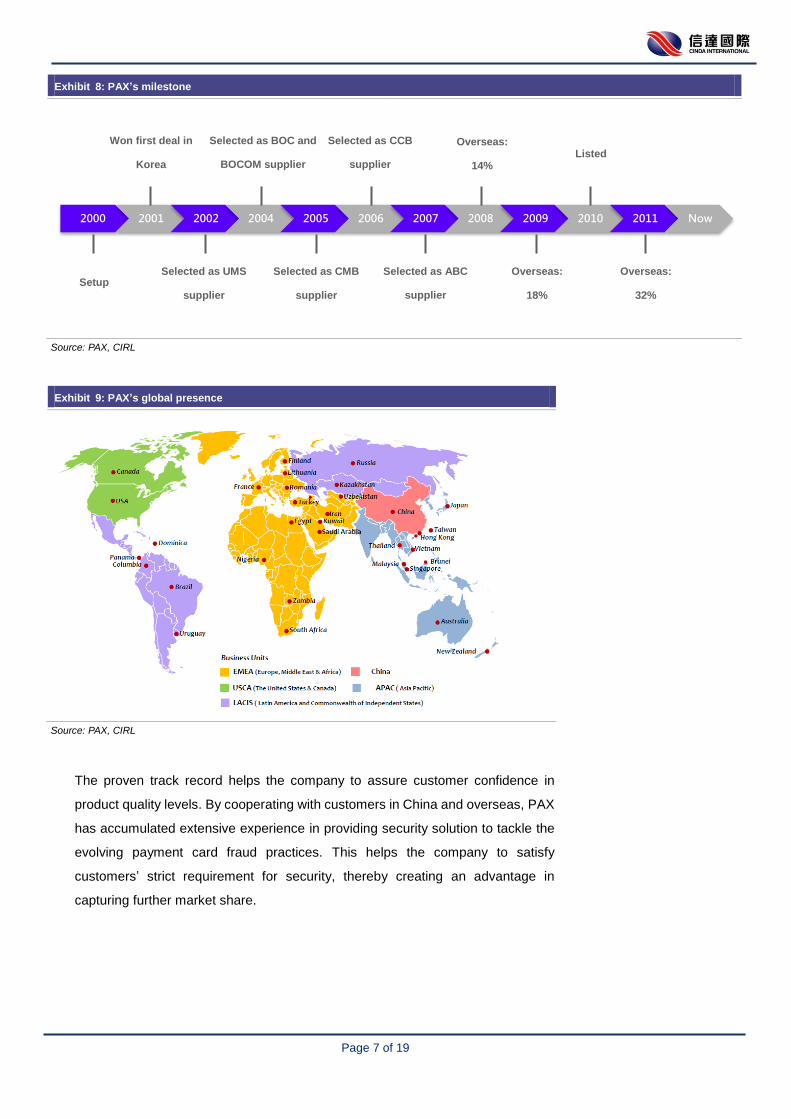
3) Established track record: To ensure consistent product quality level, the
customers tend to choose suppliers such as PAX, which has an established track
record. PAX has explored overseas markets before extending its footprint in the
domestic market. It obtained the first sales order in Korea in 2001, making its
initial success in the Korean market. Recognition in overseas markets built
confidence in domestic customers about PAX’s product quality and technology.
PAX was thus successively chosen as suppliers for UMS, Bank of China
(3988.HK), Bank of Communications (3328.HK), China Merchants Bank
(3968.HK), China Construction Bank (939.HK), and Agricultural Bank of China
(1288.HK).
At the same time, the company continued to explore opportunities in international
markets. Through its own sales teams in HK and US as well as over 30 worldwide
partners, PAX’s products have been sold to more than 75 overseas countries and
regions including the US, Canada, Singapore, Taiwan, Japan, New Zealand,
France, Finland, Saudi Arabia, South Africa, Brazil and Russia. PAX is the only
domestic player with significant overseas exposure, with oversea sales
accounting for 32% in FY11.
4.8% 4.8%
5.4%
5.8%
6.0%
4.0%
4.5%
5.0%
5.5%
6.0%
6.5%
FY10A FY11A FY12E FY13E FY14E
Page 7
Page 7 of 19
Exhibit 8: PAX’s milestone
Source: PAX, CIRL
Exhibit 9: PAX’s global presence
Source: PAX, CIRL
The proven track record helps the company to assure customer confidence in
product quality levels. By cooperating with customers in China and overseas, PAX
has accumulated extensive experience in providing security solution to tackle the
evolving payment card fraud practices. This helps the company to satisfy
customers’ strict requirement for security, thereby creating an advantage in
capturing further market share.
2000 2001 2002 2004 2005 2006 2007 2008 2009 2010 2011 Now
Selected as UMS
supplier
Selected as CMB
supplier
Selected as ABC
supplier
Overseas:
18%
Overseas:
32%
Setup
Selected as BOC and
BOCOM supplier
Selected as CCB
supplier
Overseas:
14%
Listed
Won first deal in
Korea
Page 8
Page 8 of 19
Understanding PAX’s competitors
PAX faces different competitors in different battlefield. In PAX’s stronghold, China, its
products are primarily for UMS and major commercial banks in China, with domestic
competitors such as Landi, and Xinguodu, and foreign competitors such as VeriFone.
Landi, is a subsidiary of Ingenico. Due to the superior customer relationships and
product quality, we believe Landi and PAX will continue to enjoy the stable market
share. Though Xinguodu has adopted an aggressive pricing strategy, it mainly
captures the market share from foreign manufacturers such as VeriFone. This is
because VeriFone offers global models instead of customized products tailored to
customers’ needs, and is present only through distributors.
Globally, Ingenico and VeriFone are the largest players. VeriFone is the primary
terminal vendor in the US market, while Ingenico is the largest vendor in Asia-Pacific,
Europe, Latin America and Canada. Though they possess strong customer
relationship and technology advantage in certain regions and market segments, we
believe PAX, with its leading position, qualification and established track record, can
still be one of 2-3 qualified suppliers and will continuously capture further market
share in the industry consolidation.
Exhibit 10: PAX and its competitors have the strong presence in different regions
PAX Ingenico VeriFone
Home base (2011 market share) China (30-32%) Europe (43.7%) United States (59.7%)
Global ranking 3 1 2
Global market share 5.50% 28.10% 25.30%
Regional ranking and market share Asia/ Pacific: 2 (11.1%) Asia/ Pacific: 1 (22.7%) Asia/ Pacific: 4 (7.7%)
Europe: 6 (1.3%) Europe: 1 (43.7%) Europe: 2 (30.9%)
Latin America: 9 (0.4%) Latin America: 1 (36.2%) Latin America: 2 (33.2%)
United States: 10 (0.2%) United States: 2 (11.2%) United States: 1 (59.7%)
Mideast/ Africa: 4 (10.2%) Mideast/ Africa: 3 (10.7%) Mideast/ Africa: 2 (25.6%)
Canada: 7 (0.1%) Canada: 1 (54.3%) Canada: 2 (34.8%)
Shipment CAGR over 2007-2011 53.4% 6.3% 5.0%
Source: The Nilson Report, CIRL (excluding SZZT, which focuses on EPOS terminals)
Page 9
Page 9 of 19
Secular growth due to low penetration and EMV
upgrade
According to The Nilson Report, the payment card authorization terminals shipped
17.2mn units worldwide in 2011, up 14.4% from 15.1mn in 2010. The fastest growing
regions are emerging markets including Asia-Pacific, Latin America and Mideast/
Africa, with growth of 33.2% altogether.
Exhibit 11: POS terminal shipment worldwide
Source: The Nilson Report, CIRL
Exhibit 12: Emerging markets have delivered the fastest growth in 2011
2011 2010 Change
Asia/ Pacific 6,454,456 4,594,401 40.5%
Europe 4,296,436 4,148,306 3.6%
Latin America 2,770,644 2,338,586 18.5%
United States 1,913,008 2,112,075 -9.4%
Mideast/ Africa 1,588,338 1,184,776 34.1%
Canada 210,022 224,634 -6.5%
Source: The Nilson Report, CIRL
Secular industry growth driven by the emerging markets
Amongst the emerging markets, the fastest growing region is Asia-Pacific in 2011 with
a total of 6.5mn terminals, an increase of 40.5%. Mideast/ Africa and Latin America
also received 1.6mn units and 2.8mn in 2011, up 34.1% and 18.5% respectively.
Asia/ Pacific , 37.5%
Europe, 24.9%
Latin America , 16.1%
United States, 11.1%
Mideast/ Africa, 9.2%
Canada, 1.2%
Page 10
Page 10 of 19
The emerging markets have experienced boom over the last few year. However, there
are still less than 5 POS terminals per 1,000 people, versus 10-35 in the developed
markets. We expect the emerging markets’ penetration rate will grow further, driven by
1) emergence of the middle class and 2) local authorities pushing for secure
e-payment (electronic payment).
Exhibit 13: POS installed devices per 1,000 people
Source: Verifone, CIRL
China market will enjoy moderate revenue growth amid under penetration
PAX’s stronghold, China has even a larger potential along with the consumption
driven growth path. Factoring in declining ASP due to competition and cost reduction,
we expect the company will still deliver 10.2% CAGR on revenue from China over
FY11-FY14E.
Exhibit 14: PAX’s revenue from China
Source: PAX, CIRL
566
755 800
899
1,011
-
200
400
600
800
1,000
1,200
1,400
FY10A FY11A FY12E FY13E FY14E
HK
D m
n
CAGR: 10.2%
Page 11
Page 11 of 19
The key growth driver will be the overseas market amid EMV upgrade
As for developed markets, we expect growth will rekindle in the coming years despite
being sluggish in 2011, as EMV upgrade will take place, especially in US. According to
The Nilson Report, the amount of credit card fraud losses is ~USD8.0bn, which is
equaled to 4.46¢ per $100 in total volume of purchases. The losses could not be
ignored as card issuers are ultimately the one to bear such losses. A more secured
solution was required - EMV chip, an added security of protecting personal data theft
from credit cards. Different regions are successively in the process of implementing
EMV chip in credit cards as extra security measures.
Exhibit 15: Different regions are successively in converting magnetic stripe transaction to EMV chip transaction
Magnetic stripe transaction
Store data by modifying the magnetism of magnetic
particles on a band of magnetic material on the card,
which can be duplicated by the criminals
EMV chip transaction
Utilize a small data processing chip to transmit encrypted
information, acting as a form of identification for cardholder
transactions.
Source: Industry data, CIRL
UK was one of the first movers on EMV, with migration taking place between 2003
and 2008. We believe liability shifts from the card issuer to the merchant for fraud on
card transaction at a non-compliant POS terminal might have played a role in spurring
retailers to re-terminalize. Also, the reductions of interchange fee paid by the
merchant's banks (the acquiring banks) to the customer’s banks (the issuing banks),
appeared to have traction. As a result, UK’s fraud rates were nearly cut in half since
EMV became widely adopted.
In the Euro zone, the Single Euro Payments Area (SEPA) migration framework set by
Europe Payment Council included EMV chip card as a standard. Subsequently,
fraud rates at point-of-sale in France was halved after the roll-out of EMV.
Page 12
Page 12 of 19
Exhibit 16: EMV migration in various counties
Source: Industry data, CIRL
We believe the next wave will be in the US. After Euro zone upgraded to EMV, US
became a significant target for skimming of card data resulting in high fraud rate. US
contributes disproportionately to the global tally, driving 47% of global card fraud on
27% of global card volume. To lower the fraud costs, US decided to accelerate its
conversion to EMV. Key elements of the card networks’ roadmaps of US EMV
implementation include incentives for merchants starting in 2012 (possible reduced
interchange rates for early adoption), and a liability shift starting in 2015 (liability for
card fraud on non-EMV transaction in US is set to shift from the card issuers to the
merchants starting Oct 2015). The carrot-and-stick approach should contribute to the
success in a number of EMV migration efforts.
We believe the EMV migration could shorten the replacement cycle in US from ~5 yrs
to ~4 yrs, inducing 0.5mn units of potential increase in POS terminal shipment, from
the existing ~10mn units of installed base.
Exhibit 17: Quantifying the EMV opportunity in US
Normal Accelerated Potential change
Installed base in US (mn) 10 10
Replacement cycle (yrs) 5 4 -20.0%
Shipment(mn) 2 2.5 +25.0%
Source: Industry data, CIRL
While VeriFone has a home advantage in US, we believe PAX, with its growing
leading position, qualification and established track record, can still be one of 2-3
qualified suppliers in the world. We believe the company can benefit from the low
penetration rate in emerging markets and EMV opportunities in the rest of the world,
whilst expanding overseas market share amid industry consolidation. We expect the
company will deliver 42.2% CAGR on revenue from overseas over FY11-FY14E.
2003 2006 2008 2009 2012 2013 2014 2016
France Canada US
UK Australia
Page 13
Page 13 of 19
Exhibit 18: PAX’s revenue from overseas
Source: PAX, CIRL
157
348
490
697
1,000
-
200
400
600
800
1,000
1,200
FY10A FY11A FY12E FY13E FY14E
HK
D m
n
CAGR: 42.2%
Page 14
Page 14 of 19
Industry consolidation favorable for overseas
share gain
PAX is rapidly gaining market share in the global market. The company is rank No. 3
in 2011, up from the No. 7 in 2007. At the same time, the market share of both
Ingenico and Verifone has declined to 28.1% and 25.3% in 2011, from 31.8% and
30.0% in 2007 respectively. We believe narrowing the gap with these two largest
players will go on, on the back of industry consolidation.
Exhibit 19: PAX’s global market share
Source: The Nilson Report, CIRL
Generally the overseas customers will source POS terminals from 2-3 qualified
suppliers such as Ingenico, VeriFone and Hypercom. The industry consolidation has
now changed this dynamics however:
1) The top players are aggressively pursuing M&A. For example, VeriFOne has
acquired #3 Hypercom and #8 Gemalto over the past year. After a long period of
consolidation in terminals, ~50% of the global market is held by Ingenico and
VeriFone, with each party dominant in certain market segments or countries. The
industry consolidation is leading to fewer choices and lower bargaining power for
customers.
31.8% 30.9%28.3% 28.1% 28.1%
30.0%
26.7%24.0%
21.7%
25.3%
1.4% 1.9% 2.3%3.5%
5.5%
0.0%
5.0%
10.0%
15.0%
20.0%
25.0%
30.0%
35.0%
2007 2008 2009 2010 2011
Ingenico (FR) Verifone (US) PAX (CN)
Page 15
Page 15 of 19
Exhibit 20: Industry mergers and acquisitions
Date Major activities
2006 VeriFone buys Lipman (Israel based)
2008 Ingenico buys Sagem Monetel (France based)
2008 Ingenico buys controlling stake in Landi (China based)
2010 VeriFone buys POS terminals segment from Gemalto (France based)
2011 VeriFone buys Hypercom ex POS terminals in the UK, US, Spain (US based)
Source: Industry data, CIRL
2) Ingenico and VeriFone have taken the strategic decision to expand out of
terminals into services. For example, Ingenico acquired EasyCash in 2010, a
leading payment service provider (PSP) in Germany. VeriFone also acquired
Point, Northern Europe's largest provider of payment and gateway services and
solutions for retailers. Both Ingenico and Verifone are now competing with their
direct customers.
In order to maintain bargaining power and confront competition, we expect the
customers will be more open to consider other qualified suppliers. We believe PAX,
the third largest player, just after Ingenico and VeriFone, with qualification and
established track record, can gain further market share in the overseas market.
Overseas expansion stabilizing margins
Due to high customer concentration and Xinguodu’s aggressive pricing strategy,
PAX’s ASP has declined by ~5-10%/ year for the same products. However, the
management believes cost control and roll-out of new models can support China
segment’s GPM above 30%.
Most importantly, we expect the overseas segment will outgrow China segment. The
overseas sales proportion will rise from 32% in FY11 to 50% in FY14E. As overseas
segment’s GPM is ~38.0%, above 35.5% of company average in FY11, the blended
GPM will be pulled up to ~37% with overseas expansion.
Page 16
Page 16 of 19
Exhibit 21: PAX is increasing overseas sales proportion
Source: PAX, CIRL
Exhibit 22: PAX‘s blended GPM will be pulled up to~37.0%
Source: PAX, CIRL
78%68% 62% 56% 50%
22%32% 38% 44% 50%
0%
20%
40%
60%
80%
100%
120%
FY10A FY11A FY12E FY13E FY14E
China Overseas
39.8%
34.3%
31.0% 31.0% 31.0%
42.3%
38.0%
46.7%45.0%
43.5%
40.3%
35.5%37.0% 37.1% 37.2%
20%
25%
30%
35%
40%
45%
50%
FY10A FY11A FY12E FY13E FY14E
China Overseas Total
Page 17
Page 17 of 19
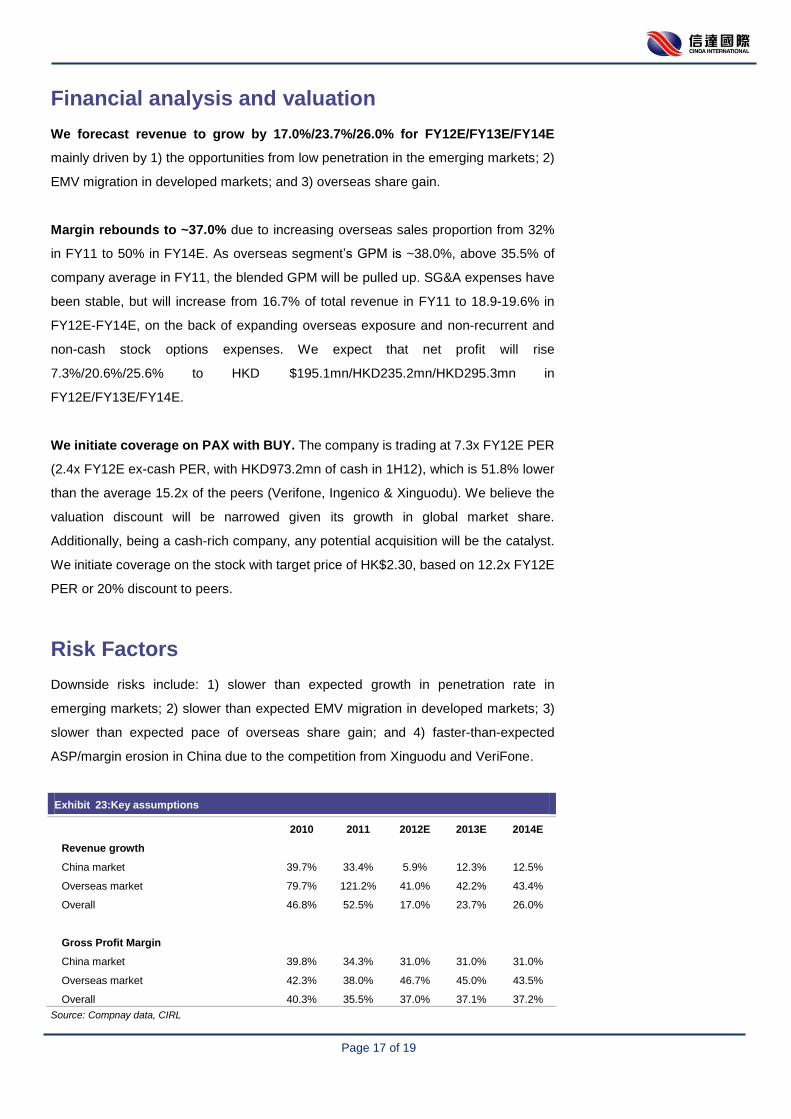
Financial analysis and valuation
We forecast revenue to grow by 17.0%/23.7%/26.0% for FY12E/FY13E/FY14E
mainly driven by 1) the opportunities from low penetration in the emerging markets; 2)
EMV migration in developed markets; and 3) overseas share gain.
Margin rebounds to ~37.0% due to increasing overseas sales proportion from 32%
in FY11 to 50% in FY14E. As overseas segment’s GPM is ~38.0%, above 35.5% of
company average in FY11, the blended GPM will be pulled up. SG&A expenses have
been stable, but will increase from 16.7% of total revenue in FY11 to 18.9-19.6% in
FY12E-FY14E, on the back of expanding overseas exposure and non-recurrent and
non-cash stock options expenses. We expect that net profit will rise
7.3%/20.6%/25.6% to HKD $195.1mn/HKD235.2mn/HKD295.3mn in
FY12E/FY13E/FY14E.
We initiate coverage on PAX with BUY. The company is trading at 7.3x FY12E PER
(2.4x FY12E ex-cash PER, with HKD973.2mn of cash in 1H12), which is 51.8% lower
than the average 15.2x of the peers (Verifone, Ingenico & Xinguodu). We believe the
valuation discount will be narrowed given its growth in global market share.
Additionally, being a cash-rich company, any potential acquisition will be the catalyst.
We initiate coverage on the stock with target price of HK$2.30, based on 12.2x FY12E
PER or 20% discount to peers.
Risk Factors
Downside risks include: 1) slower than expected growth in penetration rate in
emerging markets; 2) slower than expected EMV migration in developed markets; 3)
slower than expected pace of overseas share gain; and 4) faster-than-expected
ASP/margin erosion in China due to the competition from Xinguodu and VeriFone.
Exhibit 23:Key assumptions
2010 2011 2012E 2013E 2014E
Revenue growth
China market 39.7% 33.4% 5.9% 12.3% 12.5%
Overseas market 79.7% 121.2% 41.0% 42.2% 43.4%
Overall 46.8% 52.5% 17.0% 23.7% 26.0%
Gross Profit Margin
China market 39.8% 34.3% 31.0% 31.0% 31.0%
Overseas market 42.3% 38.0% 46.7% 45.0% 43.5%
Overall 40.3% 35.5% 37.0% 37.1% 37.2%
Source: Compnay data, CIRL
Page 18
Page 18 of 19
Exhibit 24: Financial statement
Source: Company data, CIRL
Exhibit 25: Peer comparison
Source: Bloomberg, CIRL
Income statement Cash flow
Year to Dec (HKD mn) FY10A FY11A FY12E FY13E FY14E Year to Dec (HKD mn) FY10A FY11A FY12E FY13E FY14E
Revenue 724 1,103 1,291 1,596 2,011 Pre-tax profit 173 207 234 282 354
Gross profit (reported) 292 392 477 592 748 Taxes paid (22) (30) (15) (39) (46)
EBITDA 175 211 237 286 359 Depreciation 3 3 4 5 6
Depreciation (3) (3) (4) (5) (6) Associates 0 0 0 0 0
EBIT 173 207 234 282 354 CFO bef. WC change 153 181 222 248 313
Net interest income (exp.) 0 0 0 0 0 Change in working cap (42) (211) (188) (148) (183)
Associates 0 0 0 0 0 Cashflow from operation 111 (30) 34 100 130
Exceptionals/others 0 0 0 0 0 CAPEX (5) (3) (4) (4) (6)
Profit before tax 173 207 234 282 354 Free cash flow 107 (33) 31 95 124
Tax expenses (27) (26) (39) (46) (58) Dividends 0 0 0 0 0Minority interest 0 0 0 0 0 Balance sheet adj. 0 0 0 0 0
Net profit 145 182 195 235 295 Sharse issued 719 132 0 0 0
NP (exclude option exp.) 145 182 215 252 301 Others 0 0 (0) 0 0
Net cash flow 825 99 31 95 124
Balance sheet Net cash (debt) start 244 1,069 1,168 1,199 1,294
Year to Dec (HKD mn) FY10A FY11A FY12E FY13E FY14E Net cash (debt) at year-end 1,069 1,168 1,199 1,294 1,419
Cash & equiv 1,069 1,168 1,199 1,294 1,419
Trade receivables 269 504 684 818 982 Ratios
Other receivables 0 0 0 0 0 Year to Dec (HKD mn) FY10A FY11A FY12E FY13E FY14E
Inventories 149 306 363 466 610 Growth rate (%)
Other current assets 7 17 17 17 17 Revenue 46.8 52.5 17.0 23.7 26.0Fixed assets 11 11 11 11 11 EBITDA 71.7 20.3 12.7 20.6 25.6Intangible assets 0 0 0 0 0 EBIT 72.4 20.3 12.6 20.6 25.6Investment, associates etc 0 0 0 0 0 Net profit 72.0 25.0 7.3 20.6 25.6
Total assets 1,505 2,006 2,275 2,607 3,039 EPS 70.0 (9.7) 7.2 20.6 25.6
Margins (%)
Account payables 143 250 300 388 513 Gross margin (reported) 40.3 35.5 37.0 37.1 37.2Other payables 0 0 0 0 0 EBITDA 24.2 19.1 18.4 17.9 17.9Short-term debt 0 0 0 0 0 EBIT 23.8 18.8 18.1 17.6 17.6Other current liabs 75 155 179 187 199 Net margin 20.1 16.5 15.1 14.7 14.7
Long-term debts 0 0 0 0 0 Other ratios
Deferred tax and others 0 0 0 0 0 ROE (%) 11.3 11.4 10.9 11.6 12.7Other long-term liabs 0 0 0 0 0 ROA (%) 9.7 9.1 8.6 9.0 9.7
Total liabilities 218 405 479 575 712 Net gearing (%) (83.1) (73.0) (66.7) (63.7) (61.0)
Interest coverage (x) NA NA NA NA NAShare capital 100 104 104 104 104 Receivables days 135.7 166.7 193.5 187.0 178.2Reserves 1,187 1,497 1,692 1,928 2,223 Payables days 120.9 128.0 134.5 141.2 148.3
Shareholders' equity 1,287 1,601 1,796 2,031 2,327 Inventory days 125.6 156.8 163.1 169.6 176.4
Minorities 0 0 0 0 0 Effective tax rate (%) 15.7 12.4 16.5 16.5 16.5
Total equity 1,287 1,601 1,796 2,031 2,327
Net cash (debt) 1,069 1,168 1,199 1,294 1,419
Price Market cap PE (x) PB (x) Dividend yield (%)
Ticker (HKD) (HKD mn) FY11A FY12E FY13E FY11A FY12E FY13E FY11A FY12E FY13EChina EFT-POS manufacturersShenzhen Xingu-A 300130 CH 18.03 2,061 22.7 16.6 12.4 1.8 1.7 1.5 0.7% 1.5% 2.5%Average 22.7 16.6 12.4 N/A 1.8 1.7 1.5 0.7% 1.5% 2.5%
Global EFT-POS manufacturersVerifone Systems PAY US 229.03 24,692 9.6 10.8 9.0 2.6 2.5 2.2 0.0% 0.0% 0.0%Ingenico ING FP 407.09 21,365 33.8 18.3 16.0 3.3 3.0 2.6 1.3% 1.3% 1.6%Average 21.7 14.5 12.5 N/A 3.0 2.7 2.4 1.3% 1.3% 1.6%
Pax Global 327 HK 1.38 1,432 7.9 7.3 6.1 0.9 0.8 0.7 0.0% 0.0% 0.0%
Page 19
Page 19 of 19
Rating Policy
Rating Definition
Stock Rating Buy Outperform HSI by 15%
Neutral Between -15% ~ 15% of the HSI
Sell Underperform HSI by -15%
Sector Rating Accumulate Outperform HSI by 10%
Neutral Between -10% ~ 10% of the HSI
Reduce Underperform HSI by -10%
Analysts List
Antony Cheng Research Director (852) 2235 7127 [email protected]
Hayman Chiu Senior Research Analyst (852) 2235 7677 [email protected]
Kenneth Li Senior Research Analyst (852) 2235 7619 [email protected]
Lewis Pang Research Analyst (852) 2235 7847 [email protected]
Susanna Chui Research Analyst (852) 2235 7131 [email protected]
Analyst Certification
I, Susanna Chui hereby certify that all of the views expressed in this report accurately reflect my personal views about
the subject company or companies and its or their securities. I also certify that no part of my compensation was / were,
is / are or will be directly or indirectly, related to the specific recommendations or views expressed in this report / note.
Disclaimer
This report has been prepared by the Cinda International Research Limited. Although the information and opinions
contained in this report have been compiled or arrived at from sources believed to be reliable, Cinda International
cannot and does not warrant the accuracy or completeness of any such information and analysis. The report should not
be regarded by recipients as a substitute for the exercise of their own judgment. Recipients should understand and
comprehend the investment objectives and its related risks, and where necessary consult their own financial advisers
prior to any investment decision. The report may contain some forward-looking estimates and forecasts derived from
the assumptions of the future political and economic conditions with inherently unpredictable and mutable situation, so
uncertainty may contain. Any opinions expressed in this report are subject to change without notice. The report is
published solely for information purposes, it does not constitute any advertisement and should not be construed as an
offer to buy or sell securities. Cinda International will not accept any liability whatsoever for any direct or consequential
loss arising from any use of the materials contained in this report. This document is for the use of intended recipients
only, the whole or a part of this report should not be reproduced to others.