52
Payments in Lieu of Taxes Balancing Municipal and Nonprofit Interests Policy Focus Report • Lincoln Institute of Land Policy DAPHNE A. KENYON AND ADAM H. LANGLEY
| Date post: | 03-Jan-2016 |
| Category: |
Documents |
| Upload: | lincoln-institute-of-land-policy |
| View: | 23 times |
| Download: | 0 times |

Payments in Lieu of TaxesBalancing Municipal and Nonprofit Interests
Policy Focus Report • Lincoln Institute of Land Policy
D a p h n e a . K e n y o n a n D a D a m h . L a n g L e y

k e n y o n a n d l a n g l e y ● pay m e n t s i n l i e u o f ta x e s 1
Payments in Lieu of Taxes:Balancing Municipal and Nonprofit InterestsDaphne A. Kenyon and Adam H. Langley
Policy Focus Report Series
The policy focus report series is published by the Lincoln Institute of Land Policy to address timely public policy issues relating to land use, land markets, and property taxation. Each report is designed to bridge the gap between theory and practice by combining research findings, case studies, and contributions from scholars in a variety of academic disciplines, and from professional practitioners, local officials, and citizens in diverse communities.
About This Report
In recent years, local government revenue pressures have led to heightened interest in pay-ments in lieu of taxes (PILOTs), which are payments made voluntarily by tax-exempt nonprofits as a substitute for property taxes. This report provides case studies of several municipalities that have pursued PILOTs in the past decade, as well as a broader picture of PILOT use in the United States.
While PILOTs can provide crucial revenue for municipalities with large nonprofit sectors, there are also major problems with how they are currently collected in many places. To avoid these problems, the report provides general guidelines for when municipalities should consider PILOTs, highlights the importance of municipal–nonprofit collaboration on PILOTs, and outlines alternative ways to raise revenues from tax-exempt nonprofits. It also offers more detailed recommendations for how to design PILOT programs that are fair to nonprofits while raising meaningful revenue for municipalities.
Copyright © 2010 by Lincoln Institute of Land PolicyAll rights reserved.
113 Brattle StreetCambridge, MA 02138-3400, USAPhone: 617-661-3016 or 800-526-3873Fax: 617-661-7235 or 800-526-3944Email: [email protected]: www.lincolninst.edu
ISBN 978-1-55844-216-0Policy Focus Report/Code PF028

k e n y o n a n d l a n g l e y ● pay m e n t s i n l i e u o f ta x e s 1
. . . . . . . . . . . . . . . . . . .
Contents
2 Executive Summary
4 Chapter 1: The Nonprofit Sector and Local Government Finances 4 Overview of the Nonprofit Sector 6 What are PILOTs? 7 Heightened Interest in PILOTs
10 Chapter 2: The Property Tax Exemption for Nonprofits 10 Rationales for the Tax Exemption 11 State Variations in Legal Requirements 13 Challenges to the Property Tax Exemption 16 Tax Savings for Different Types of Nonprofits 18 Tax Revenue Forgone Due to the Property Tax Exemption
20 Chapter 3: Case Studies of PILOT Programs and Initiatives 21 Boston, Massachusetts 24 The MacDowell Colony in Peterborough, New Hampshire 25 Providence, Rhode Island 25 Yale University in New Haven, Connecticut 26 State and Federally Funded PILOT Programs 27 Potential for Municipal PILOT Programs
29 Chapter 4: Arguments For and Against PILOTs 29 Arguments For PILOTs 32 Arguments Against PILOTs
35 Chapter 5: Implementing and Structuring a PILOT Program 36 Municipal Strategies to Obtain PILOTs 37 Building Support for a PILOT Program 38 PILOT Program Features 41 Alternatives to PILOTS
43 Chapter 6: Findings and Recommendations
46 References
48 Acknowledgments
49 About the Authors
49 About the Lincoln Institute of Land Policy

2 p o l i c y f o c u s r e p o r t ● l i n c o l n i n s t i t u t e o f l a n d P o l i c y
. . . . . . . . . . . . . . . . . . .
k e n y o n a n d l a n g l e y ● pay m e n t s i n l i e u o f ta x e s 3
Executive Summary
of the longest standing PILOT programs and the most revenue productive program in the United States. PILOTs are a tool to address two problems with the property tax exemption provided to nonprofits. First, the exemption is poorly targeted, since it mainly benefits nonprofits with the most valuable property holdings, rather than those providing the greatest pub-lic benefits. Second, a geographic mismatch often exists between the costs and benefits of the property tax exemption, since the cost of the exemption in terms of forgone tax revenue is borne by the municipality in which a nonprofit is located, but the public benefits provided by the nonprofit often extend to the rest of the state or even the whole nation. PILOTs can provide crucial revenue for certain municipalities, and are one way to make nonprofits pay for the public services
Charitable nonprofit organizations, which include private universities, hospitals, museums, soup kitchens, and churches, are exempt from
property taxation in all 50 states. Many nonprofits reduce local government spend-ing by offering services that would otherwise be provided by those governments, but at the same time these nonprofits impose a cost on municipalities by consuming public services, such as police protection and roads. Payments in lieu of taxes (PILOTs) are pay-ments made voluntarily by tax-exempt non-profits as a substitute for property taxes. In recent years, local government revenue pressures have led to heightened interest in PILOTs, and over the last decade they have been used in at least 117 municipalities in at least 18 states. Large cities collecting PILOTs include Baltimore, Boston, Phila-delphia, and Pittsburgh. Boston has one
2 p o l i c y f o c u s r e p o r t ● l i n c o l n i n s t i t u t e o f l a n d P o l i c y k e n y o n a n d l a n g l e y ● pay m e n t s i n l i e u o f ta x e s 3
. . . . . . . . . . . . . . . . . . .
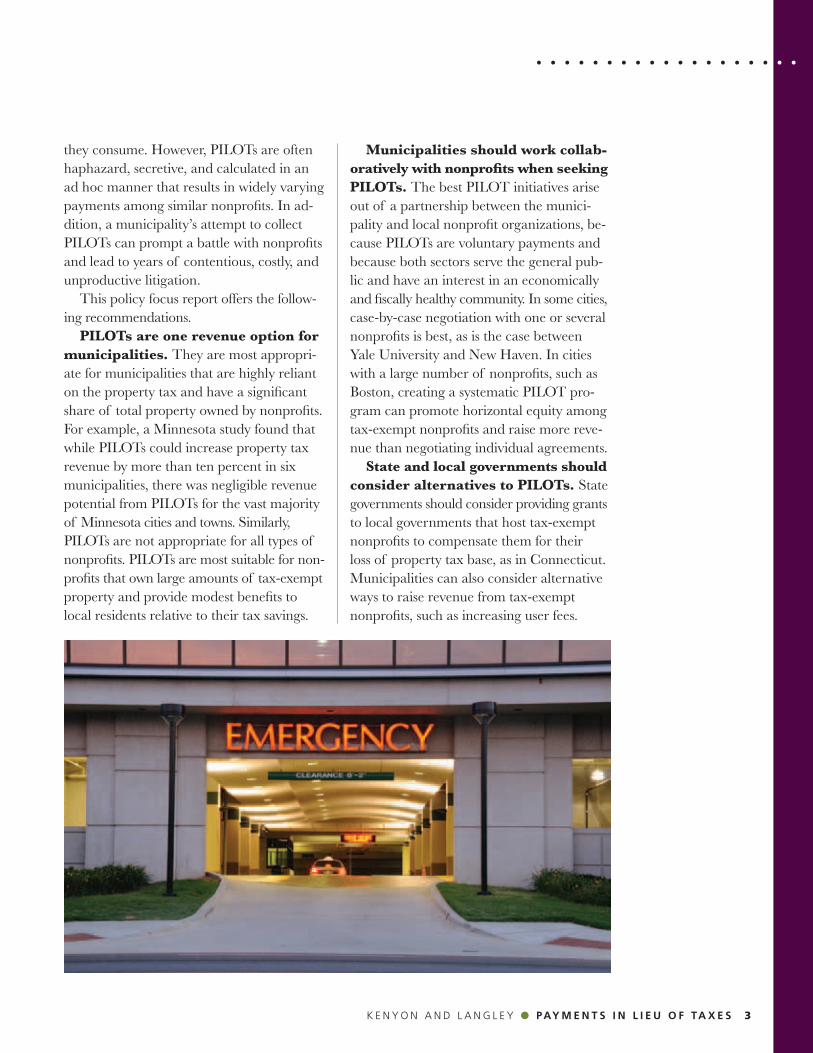
they consume. However, PILOTs are often haphazard, secretive, and calculated in an ad hoc manner that results in widely varying payments among similar nonprofits. In ad-dition, a municipality’s attempt to collect PILOTs can prompt a battle with nonprofits and lead to years of contentious, costly, and unproductive litigation. This policy focus report offers the follow-ing recommendations. PILOTs are one revenue option for municipalities. They are most appropri-ate for municipalities that are highly reliant on the property tax and have a significant share of total property owned by nonprofits. For example, a Minnesota study found that while PILOTs could increase property tax revenue by more than ten percent in six municipalities, there was negligible revenue potential from PILOTs for the vast majority of Minnesota cities and towns. Similarly, PILOTs are not appropriate for all types of nonprofits. PILOTs are most suitable for non-profits that own large amounts of tax-exempt property and provide modest benefits to local residents relative to their tax savings.
Municipalities should work collab-oratively with nonprofits when seeking PILOTs. The best PILOT initiatives arise out of a partnership between the munici-pality and local nonprofit organizations, be-cause PILOTs are voluntary payments and because both sectors serve the general pub-lic and have an interest in an economically and fiscally healthy community. In some cities, case-by-case negotiation with one or several nonprofits is best, as is the case between Yale University and New Haven. In cities with a large number of nonprofits, such as Boston, creating a systematic PILOT pro-gram can promote horizontal equity among tax-exempt nonprofits and raise more reve-nue than negotiating individual agreements. State and local governments should consider alternatives to PILOTs. State governments should consider providing grants to local governments that host tax-exempt nonprofits to compensate them for their loss of property tax base, as in Connecticut. Municipalities can also consider alternative ways to raise revenue from tax-exempt nonprofits, such as increasing user fees.

4 p o l i c y f o c u s r e p o r t ● l i n c o l n i n s t i t u t e o f l a n d P o l i c y
. . . . . . . . . . . . . . . . . . .
k e n y o n a n d l a n g l e y ● pay m e n t s i n l i e u o f ta x e s 5
C h a p t e r 1
The Nonprofit Sector and Local Government Finances
from some nonprofits. This report defines PILOTs as payments “made voluntarily by tax-exempt nonprofits as a substitute for property taxes” (Brody 2005, 275).
OvERv IE w OF ThE NONPROF I T S ECTORThe nonprofit sector accounts for roughly one-tenth of the U.S. economy, whether measured by employment or total spending (Walker 2005). This report focuses on 501(c)(3) charitable nonprofits, which include most of the nonprofits active in the arts, education, health care, human services, and religion— 1.14 million of which are registered with the Internal Revenue Service (IRS). Nonprofits with 501(c)(3) status include both public charities and private foundations. There are
T he United States benefits from a large and diverse nonprofit sector that includes a wide array of organizations: private universities,
hospitals, art museums, soup kitchens, and churches. Many nonprofits reduce spending by municipalities by offering services that would otherwise be provided by the local government. However, nonprofits also impose a cost on municipalities because they consume public services, such as police protection and roads, but normally do not pay taxes for these services since most property owned by charitable nonprofits is exempt from tax-ation in all 50 states. Some municipalities have attempted to recoup part of this cost through payments in lieu of taxes (PILOTs)

4 p o l i c y f o c u s r e p o r t ● l i n c o l n i n s t i t u t e o f l a n d P o l i c y k e n y o n a n d l a n g l e y ● pay m e n t s i n l i e u o f ta x e s 5
. . . . . . . . . . . . . . . . . . .
also 456,000 other nonprofits registered with the IRS that do not qualify for 501(c)(3) sta-tus, including business leagues, labor unions, social clubs, professional organizations, and political action committees. These other non-profits are generally not exempt from prop-erty taxes (National Center for Charitable Statistics 2010). Figure 1 shows the relative importance of each type of charitable nonprofit sorted by each category’s share of total revenues in the charitable sector. Hospitals and higher edu-cation institutions control 51 percent of total revenues and 42 percent of assets, but account for only 1 percent of charitable nonprofits
registered with the IRS. In contrast, religious and human services organizations account for 43 percent of registered charita-ble nonprofits, but only a small fraction of total assets or revenue reported to the IRS. In general, resources in the charitable nonprofit sector are extremely concentrated. The great majority of organizations are small and have few financial resources, while a small number of large nonprofits have the great majority of revenues, assets, and em-ployees. For example, 62 percent of charita-ble nonprofits filing IRS Form 990 (the tax return most nonprofits are required to file), had annual revenues below $100,000,
Figure 1
Charitable Nonprofits Registered with the IRS (April 2010)
Note: Religious congregations are not required to register with the IRS; nonprofits with gross receipts under $25,000 and religious congregations are not required to file IRS Form 990 with financial information. The number of organizations includes all 501(c)(3) charitable nonprofits registered with IRS (1,138,289), but revenues and assets for each subsector only include charities that filed IRS Form 990 (598,110).
Source: National Center for Charitable Statistics (2010).
Religion
Arts, Culture, and Humanities
Other
Private Foundations
Public and Societal Bene�t
Education (Excluding Higher Ed)
Higher Education
Human Services
Health (Excluding Hospitals)
Hospitals
19.3%
9.0%
6.8%
10.6%
9.6%
13.4%
0.4%
23.9%
6.5%
0.6%
0.8%
3.1%
2.5%
18.2%
6.9%
9.8%
17.9%
8.6%
7.8%
24.3%
0.8%
2.1%
3.2%
4.1%
5.0%
6.6%
10.9%
12.2%
15.0%
40.2%
% Revenues % Assets % Organizations

6 p o l i c y f o c u s r e p o r t ● l i n c o l n i n s t i t u t e o f l a n d P o l i c y
. . . . . . . . . . . . . . . . . . .
k e n y o n a n d l a n g l e y ● pay m e n t s i n l i e u o f ta x e s 7
accounting for 1.2 percent of total revenue for all filing charitable nonprofit organizations; 2.9 percent had annual revenues above $10 million, accounting for 84.7 percent of total revenue. Average revenues were $45,500 for the first group and $134 million for the sec-ond group (National Center for Charitable Statistics 2010). Throughout this report, the term non-profit is used to refer to the subset of non-profits typically eligible for exemption from property taxation, which are the 501(c)(3) charitable nonprofits, although state re-quirements for exemption often diverge from federal law.
w h AT ARE P I LOT S?Payments in lieu of taxes are usually negoti-ated between a municipality and individual nonprofits. PILOTs can be ad hoc payments by one or more nonprofits, or they can be standard payments from a wide range of nonprofits when a local government has a systematic PILOT program that provides guidance regarding expected contributions. PILOTs can be one-time payments, but negotiations sometimes lead to contracts stip-ulating continued payments for many years. PILOTs are often framed in two ways. First, they are considered a means to par-tially offset property tax revenue forgone because the nonprofit’s property is tax- exempt. Second, they are thought of as contributions to cover the nonprofit’s share of the cost of public services provided by municipalities that are normally funded with property taxes (e.g., fire services, road maintenance, or snow removal). Regard- less of the stated rationale, both of these arrangements are PILOTs according to the definition used in this report. The basis for deciding upon an appro-priate PILOT amount varies across munici-palities. Some ask tax-exempt institutions to
pay a specific proportion of the property taxes the institution would owe if taxable. Others base the PILOT on some measure of the size of the nonprofit’s property, such as square footage, or the size of its economic activity, such as number of employees or dormitory beds. The cost of basic services provided to nonprofit institutions is also used as a guide, but in many cases PILOTs are completely ad hoc and negotiated without any apparent basis. In all cases, a primary characteristic of a PILOT is that it is voluntary; that is, there is no law requiring a nonprofit to make a PILOT. However, municipalities may en-courage PILOTs in several ways. Nonprofits may agree to make PILOTs because they realize that they share an interest in the fis-cal health of the local government. For ex-ample, a college’s ability to attract students would be impacted negatively if the college is located in a run-down city with inadequate public services. Some nonprofits may feel pressured to make a PILOT because they know local agencies have the power to grant or withhold zoning changes, building permits, and the like. Finally, in a few cases muni- cipalities have threatened to revoke a non-profit’s tax exemption or levy a tax or fee in order to obtain a PILOT. Unless otherwise specified, in this report the term PILOT refers only to voluntary payments made by nonprofits to municipali-ties. However, the term is often used more broadly, and can refer to payments from the state or federal government to local govern-ments to compensate them in part for the forgone property tax revenues on publicly owned property. Also, local governments sometimes offer businesses the opportunity to make a PILOT instead of full payment of property taxes as an economic incentive to encourage the business to locate or stay in that municipality.

6 p o l i c y f o c u s r e p o r t ● l i n c o l n i n s t i t u t e o f l a n d P o l i c y k e n y o n a n d l a n g l e y ● pay m e n t s i n l i e u o f ta x e s 7
. . . . . . . . . . . . . . . . . . .
hE IGhTENEd INTEREST I N P I LOTSPress accounts suggest growing interest in PILOTs since the early 1990s. Recent high-profile efforts to create or expand PILOT programs have occurred in Pittsburgh, Providence, Boston, and elsewhere. Although no systematic comprehensive survey of PILOT use is available, this report found that since 2000 PILOTs have been used in at least 18 states (figure 2). Seventeen of those states account for 35 cities and towns with PILOTs. In addition, 82 out of a total of 351 municipalities in Massachusetts have collected PILOTs (Massachusetts Depart-ment of Revenue 2003). Two major factors drive the high level of interest in PILOTs around the country: growing scrutiny of the nonprofit sector, and increasing pres- sure on municipalities to find new sources of revenue.
Growing Scrutiny of the Nonprofit SectorCommercial activity in the nonprofit sector and news reports scrutinizing the behavior of nonprofit organizations have raised issues about the nonprofit property tax exemption, and have possibly reduced public support for it. In some cases, public support for tax exemption of nonprofits is tied to their charitable nature, but that support is re-duced when they pursue commercial activi-ties. Weisbrod (2004, 43) describes a “wave of commercialization among nonprofits,” which includes charging user or admission fees, seeking revenues from marketing rela-tionships, research and development part-nerships with for-profits, joint purchasing partnerships between nonprofits and for-profits, and engaging in unrelated business activities that have little to do with the nonprofit’s social mission.
Figure 2
States with Municipalities Collecting PILOTs (2000–2010)
80+ Municipalities with PILOTs4–8 Municipalities with PILOTs2–3 Municipalities with PILOTs1 Municipality with PILOTs0 Municipalities with PILOTs
Source: Authors’ research (see chapter 3).

8 p o l i c y f o c u s r e p o r t ● l i n c o l n i n s t i t u t e o f l a n d P o l i c y
. . . . . . . . . . . . . . . . . . .
k e n y o n a n d l a n g l e y ● pay m e n t s i n l i e u o f ta x e s 9
Cordes and Steuerle (2010, 2) describe a blurring of the line between nonprofit and for-profit organizations: “Many nonprofits have found it advantageous to operate more like businesses in some respects; some for-profit businesses have adopted some non-profit attributes; and businesses and non-profits have discovered mutual benefit from acting as partners, both in for-profit and not-for-profit ventures.” Public confidence in nonprofits has fallen in the last decade. A 2008 Brookings Institu-tion study found that, “General confidence in charitable organizations appeared to hit its modern low point in 2003 and has not moved up or down significantly since” (Light 2008, 2). Although some of this decline in confidence may simply reflect the public’s increasing cynicism about all public institu-tions, including government and the media, since the 1990s several high-profile events
have likely reduced public trust in nonprofits. In one case, the head of the United Way of America served seven years in jail for de-frauding that organization of more than $1 million. Other reports showed that Stanford University overcharged the federal govern-ment by more than $200 million, including charges “for flowers, furniture, parties, a grand piano, football tickets, and deprecia-tion on a yacht as ‘indirect research costs’” (Youngman 2002, 39). About the same time, the Philadelphia Inquirer ran a series of articles on the high salaries and assets that exist in some parts of the nonprofit sector in that city. Youngman (2002) points out that even when there is no real change in behavior, media attention and government inves- tigations can create the perception that there is a spike in scandals. Beginning about 2005, reports that hospi-tals were charging uninsured patients more

8 p o l i c y f o c u s r e p o r t ● l i n c o l n i n s t i t u t e o f l a n d P o l i c y k e n y o n a n d l a n g l e y ● pay m e n t s i n l i e u o f ta x e s 9
. . . . . . . . . . . . . . . . . . .
than privately insured patients caught the public’s ire (Anderson 2007). More recently, both New Hampshire and New Jersey gov-ernment officials have focused on the issue of high salaries for nonprofit executives, and New Jersey legislators have placed limits on what charities can pay their CEOs if they provide services for the state (Gose 2010). This increasing public scrutiny has led to challenges of nonprofits’ tax-exempt status (Strom 2010). PILOTs made by nonprofits offer what some consider a middle-ground approach, whereby nonprofits maintain their property tax exemption, but municipalities still receive some money to offset revenues forgone due to the exemption.
Local Government Revenue PressuresIn a September 2009 survey of city fiscal conditions, the National League of Cities reported that pessimism about the ability to meet city fiscal needs was at its highest level in the history of its 24-year survey (Hoene and Pagano 2009). Even worse, because city fiscal conditions typically lag behind eco-nomic conditions by about two years, many municipal officials expect budget shortfalls to worsen through 2012 (McFarland 2010). Over the last three decades local govern-ments have faced a combination of steep declines in federal aid and erosion of the property tax base. Figure 3 shows sources of general revenue for local governments, which include cities, towns, and villages; counties; school districts; and special districts. Between 1977 and 1992, federal aid to local govern-ments as a share of total general revenues—which was never high—fell 62 percent. It has risen since then, but is still less than half of what it was 30 years ago. The share of general revenues from state aid in 2007 is identical to the share in 1977. During this 30-year period, the relative importance of the property tax has declined —falling from 34 percent of general revenues
in 1977 to 28 percent in 2007. The erosion in the property tax base is due to a wide variety of factors, including the growth of tax limitations, exemptions, and other forms of special property tax treatment, none of which are expected to turn around in the foreseeable future (Augustine et al. 2009, 4). For example, since the late 1970s many states have imposed property tax limits on local governments. By 2006, 34 states had some type of limit on property tax rates, 29 states had limits on property tax reve-nues, and 14 states had statewide limits on property tax assessments. Only seven states did not have any of these limits, and thus left complete control of property tax deci-sions to local governments (Anderson 2006). With declining federal aid and constraints on property taxes, local governments have needed to find other ways to raise revenue. The most notable increases are seen in user charges, but in some municipalities, efforts to find new revenue sources have included soliciting PILOT contributions from non-profits that own property exempt from property taxes.
Figure 3
General Revenue Sources for Local Governments (1977–2007)
35%
30%
25%
20%
15%
10%
5%
0%State Aid Federal
AidProperty
TaxSales &
Excise TaxUser
ChargesOther
1977 1992 2007
Source: Census of Governments.

10 p o l i c y f o c u s r e p o r t ● l i n c o l n i n s t i t u t e o f l a n d P o l i c y
. . . . . . . . . . . . . . . . . . .
k e n y o n a n d l a n g l e y ● pay m e n t s i n l i e u o f ta x e s 11
C h a p t e r 2
The Property Tax Exemption for Nonprofits
Payments in lieu of property taxes must be understood within the context of the history, rationale, and dimensions of the property
tax exemption for charitable nonprofits, which is provided in all 50 states and the District of Columbia. The roots of the prop-erty tax exemption are based on case law and can be traced to the British legal tradi-tions that settlers brought with them to the American colonies, although explicit prop-erty tax exemption did not arise until much later (Gallagher 2002, 3). Annual state prop-erty taxation did not become the norm until the 1830s, and explicit codification of prop-erty tax exemption for charitable nonprofits followed. For example, in 1859 the Kansas Constitution became the first state constitu-tion that explicitly exempted churches from taxation (Diamond 2002, 120–121).
RAT IONALES FOR ThE TAx Ex EMPT IONVarious rationales for the charitable prop- erty tax exemption have evolved over time, including two that are particularly relevant today. First, the property tax exemption for charitable nonprofits can be justified as part of the decision to properly define the prop-erty tax base. Swords (2002) argues that the proper base of the property tax is property in private hands. Since nonprofits are estab-lished in order to benefit the public, proper-ty owned and used by nonprofits should not be part of the tax base. Second, the property tax exemption is often justified as an appropriate subsidy to encourage the activity of nonprofits, also known as the quid pro quo theory. According to this theory, because nonprofits provide benefits to society, including reducing the

10 p o l i c y f o c u s r e p o r t ● l i n c o l n i n s t i t u t e o f l a n d P o l i c y k e n y o n a n d l a n g l e y ● pay m e n t s i n l i e u o f ta x e s 11
. . . . . . . . . . . . . . . . . . .
services that need to be provided by govern-ment, they are deserving of a tax subsidy. In recent years, the quid pro quo rationale has become increasingly important at the state level, as states have moved toward narrower definitions of organizations eligible for ex-emption than those used at the federal level (Brody 2007). Critics point out that the property tax ex-emption is an imprecise policy for subsidiz-ing charitable activities, because it primarily benefits nonprofits with the most valuable landholdings, not those providing the great-est public benefits (Bowman, Cordes, and Metcalf 2009, 280–281). There is also a geographic mismatch between the benefits provided by a tax-exempt nonprofit and the cost of the exemption in forgone property tax revenues. While the benefits are often broadly dispersed throughout a metropolitan area, a state, or the nation, the cost of the property tax exemption is concentrated in the host municipality.
STATE vAR IAT IONS I N L EGAL REqu IREMENTS The criteria that nonprofits must satisfy to qualify for a property tax exemption are de-termined at the state level—in state consti-tutions, statutes, and rulings by state courts. In 27 states federal designation as a 501(c)(3) organization is necessary for state tax ex-emption (Bowman, Cordes, and Metcalf 2009, 273). However, states often adopt a narrower definition, and thus 501(c)(3) des-ignation is no guarantee that a nonprofit will be tax-exempt at the state level. Seventeen states grant local governments the authority to determine which nonprofits qualify for tax exemption within certain categories, although the enumerated categories may be a fairly small part of the nonprofit sector (Bowman 2002, 32). State constitutions normally provide for a charitable tax exemption, but vary in whether this exemption is mandated or authorized (figure 4). Since the majority of state
Source: Brody (2010a).
State constitution mandates charitable exemption (17)
State constitution authorizes legislature to give charitable exemption (25)
State constitution does not address taxes or exemption (8)
Figure 4
Charitable Tax Exemption in State Constitutions

12 p o l i c y f o c u s r e p o r t ● l i n c o l n i n s t i t u t e o f l a n d P o l i c y
. . . . . . . . . . . . . . . . . . .
k e n y o n a n d l a n g l e y ● pay m e n t s i n l i e u o f ta x e s 13
constitutions leave authority over the chari-table tax exemption to legislatures, “states generally have laws exempting the property of churches, schools, and ‘charitable’ orga-nizations;” in states where the constitution is silent on this exemption, courts have ruled that “granting exemption is within the in-herent power of the legislature” (Gallagher 2002, 4–5). However, only 11 states define charity statutorily, and thus clarifying the parameters of what types of nonprofit orga-nizations qualify for the charitable tax ex-emption is often left to state courts (Bow-man and Fremont-Smith 2006, 203). Since all states have a charitable tax ex-emption, the definition of what constitutes a charity may be the most important issue in determining the breadth of a state’s exemp-tion. Particularly important is whether a charity must provide a public benefit or re-lieve government of a burden to obtain tax-exempt status. Providing a public benefit is the broader definition that often results in a wider range of nonprofits receiving
tax-exempt status. That said, relief of a government burden is not normally inter-preted narrowly to mean services that government actually provides, but rather, services that government views as bene- ficial (Brody 2007, 276). Table 1 shows the range of state require-ments that charities must meet to obtain tax-exempt status. These differences across states mean that legal challenges to nonprof-its’ tax-exempt status will also vary. At least 10 states have multipart tests that have been specified by state courts or in state statute to determine whether a nonprofit qualifies for the charitable tax exemption, such as Illinois’ five-part test described in box 1 (Bowman 2002, 43). Normally property must be both owned and used by a nonprofit to qualify for exemp-tion from the property tax. In no state is nonprofit ownership alone sufficient for an exemption; the property must actually be used for an exempt purpose. As a result, many charitable nonprofits do in fact pay
Table 1
State Requirements for Charitable Tax Exemption
Number of States% Yes for
Known StatesYes No unknown
Tax-exempt charities are ALLOwEd TO:
Charge a fee to recipients of its services 41 3 6 93.2
If yes, must charge poor people below cost 12 27 8 30.8
Make a profit, as long as it is retained for institutional purpose 36 7 7 83.7
Support political candidates or influence legislation 16 23 11 41.0
Serve a predominantly social function 12 28 10 30.0
Distribute net income to its members or officers 0 42 8 0.0
Tax-exempt charities are REquIREd TO:
Provide a general public benefit 38 7 5 84.4
Provide service to rich and poor without regard to ability to pay 24 13 13 64.9
Relieve government of a burden 19 21 10 47.5
Provide a substantial part of its services for free 15 22 13 40.5
Derive most income from public funds or private donations 14 23 13 37.8
Source: Compiled from Bowman (2002, 40–44).

12 p o l i c y f o c u s r e p o r t ● l i n c o l n i n s t i t u t e o f l a n d P o l i c y k e n y o n a n d l a n g l e y ● pay m e n t s i n l i e u o f ta x e s 13
. . . . . . . . . . . . . . . . . . .
substantial property tax bills. For example, in Cambridge, Massachusetts, the Massa-chusetts Institute of Technology is by far the largest property taxpayer in the city because of its ownership of properties used by bio-technology firms, for rental housing, and other noneducational activities (City of Cambridge 2009, 85). The “use” requirement also means that taxes are owed when a nonprofit holds prop-erty for future development, although some period of time for construction is allowed. The treatment of ancillary property—espe-cially parking lots—is a frequent subject of litigation, and state courts vary in whether they interpret the use requirement narrowly for each property, or whether they take into consideration that an individual property may not itself be used for an exempt pur-pose but is necessary for a charity’s overall operations (Bowman 2002, 35–37). Finally, state laws vary in the treatment of property that is partially used for an exempt purpose, with nonprofits sometimes completely losing or maintaining their exemption. The most common approach is to allocate property taxes based on the share of the property used for a nonexempt purpose (Brody 2007, 283). The treatment of rental property can be complicated. Nonprofits that rent space from a for-profit entity are normally not eli-gible for a property tax exemption. Property that is owned by a nonprofit and rented to another charity that uses it for an exempt purpose is also sometimes taxable, although courts have occasionally decided “to permit exemption only when the lease arrangements are at or below cost” (Gallagher 2002, 8).
ChALLENGES TO Th E PROPERTY TA x Ex EMPT ION The complexity of property tax laws, reve-nue pressures of municipalities, evolving or-ganizational practices of nonprofits, and the
. . . . . . . . . . . . . . . . .
changing political climate all contribute to challenges to the property tax exemption for nonprofits. “Nonprofit entities have shown remarkable success in state supreme courts and statehouses in defending exemptions against municipal and legislative challenge” (Brody 2010b, 88). However, the following situations often lead to challenges to a non-profit’s exemption and are considered by courts (Brody 2007, 275–279): • Charging fees: Normally charging fees
does not in and of itself lead to a revo-cation of tax-exempt status, especially if the fees are below market rates, a large share of customers are charged a lower

14 p o l i c y f o c u s r e p o r t ● l i n c o l n i n s t i t u t e o f l a n d P o l i c y
. . . . . . . . . . . . . . . . . . .
k e n y o n a n d l a n g l e y ● pay m e n t s i n l i e u o f ta x e s 15
box 1
Court Challenges to Exemptions for Nonprofit hospitals
N onprofit hospitals attract frequent legal challenges
to their tax exemptions, and three such cases de-
cided by state supreme courts are of particular interest.
Two cases decided in 1985 show how similar rulings can
lead to very different outcomes. In Utah County v. Inter-
mountain Health Care, the Utah Supreme Court found
that two nonprofit hospitals failed to meet the state
constitution’s charitable standard because they provided
insufficient charity care, and thus their tax exemption
was revoked (Fanning 2008, 33). Similarly, in Hospital
Utilization Project (HUP) v. Commonwealth of Pennsylvania,
the Pennsylvania Supreme Court found that a hospital
support facility could not qualify for a sales tax exemp-
tion because it did not meet the requirements of a purely
public charity in the state constitution. This ruling also
had implications for the property tax exemption in the
state (Gallagher 2002, 12).
The impact of these rulings played out very differently,
however. In Utah, health care organizations worked with
the State Tax Commission to develop standards requiring
health care nonprofits to maintain charity care plans,
publicize the availability of subsidized care, and provide
unreimbursed care that exceeds the value of their
a broad group, as opposed to being more like a member-serving organization.
• High executive compensation: While courts do not seem to have consistent rulings on this issue, they distinguish between cases of justifiable high pay for executives who have successfully man-aged large nonprofit organizations, and cases of nonprofits that unjustifiably ap-pear to be zeroing-out profits by passing on large salaries to executives.
In addition to these scenarios that might lead to questions about certain nonprofits’ tax exemptions, several types of organiza-tions are particularly likely to face challenges
fee based on their ability to pay, or the fees subsidize a charity’s general mission.
• Not receiving a large share of revenue from donations: Nonprofits that are largely financed with fees may face more scrutiny, but generally courts treat government funding and private donations similarly.
• Competing with for-profit businesses: Competition alone does not normally lead to revocation of tax-exempt status, but it is a consideration. Perhaps most important is whether a nonprofit’s opera-tions are distinguishable from for-profit competitors.
• Serving a broad charitable class: Courts often consider whether a charity serves
property tax exemption. The Utah Supreme Court upheld
the constitutionality of these standards in a 1994 decision.
Utah’s approach, which has been termed a “community benefit
reporting requirement,” has been adopted in some form by
16 states.
The Pennsylvania Supreme Court established a five-part test
to determine whether a nonprofit qualified for a charitable tax
exemption. This HUP test set a high threshold to qualify for
the charitable tax exemption, and resulted in confusion due to
the many different interpretations by courts around the state.
14 p o l i c y f o c u s r e p o r t ● l i n c o l n i n s t i t u t e o f l a n d P o l i c y k e n y o n a n d l a n g l e y ● pay m e n t s i n l i e u o f ta x e s 15
. . . . . . . . . . . . . . . . . . .
By 1994 at least 1,000 nonprofit organizations had their
tax-exempt designation challenged formally or informally
(Leland 1995, 592). The HUP test and subsequent court
cases led “cities, counties, townships, and school districts
across Pennsylvania to solicit PILOTs under the threat of
challenges to charitable tax exemptions,” including the
creation of one of the nation’s most comprehensive PILOT
programs in Philadelphia (Gallagher 2002, 16).
In 1997 Pennsylvania’s legislature passed Act 55, the Purely
Public Charity Act, clarifying ways charities could meet the
requirements for tax exemption, which made it easier for
nonprofits to qualify as public charities. The Pennsylvania
Supreme Court affirmed these new standards, and challenges
to nonprofits’ tax exemption and pressure to make PILOTs
abated. For example, PILOT contributions in Philadelphia fell
from $8.8 million in 1996 to roughly $800,000 in 2001
(Glancey 2002).
The third case, Provena Covenant Medical Center v. The
Department of Revenue, was decided by the Illinois Supreme
Court in 2010. The Illinois Department of Revenue had ruled
that a nonprofit hospital should lose its property tax exemp-
tion because it did not meet parts three and five of the five-
part test put forth in 1968 by the court in Methodist
Old Peoples Home v. Korzen):
1. The nonprofit must have no capital stock or shareholders.
2. It must earn no profits or dividends, but instead derive
funding mainly from private and public charity.
3. It must dispense charity to all who need and apply for it.
4. It does not provide gain or profit in a private sense to
any person connected with it.
5. It must not place obstacles in the way of those who
need the charitable benefits it provides.
The court upheld the revocation of the hospital’s tax exemp-
tion because Provena provided insufficient charity care and
granted price reductions to less than one percent of its
patients under the hospital’s charitable care program. It is
too soon to tell what the repercussions of the Provena ruling
will be. Some commentators predict that it will affect health
care nonprofits across the country (Yue and Colias 2010);
others note that the Illinois charitable standard for nonprofits
differs from that in other states and predict that the major
impact of the ruling will be limited to health care nonprofits
in that state (Columbo 2010).
to their exemptions. While court rulings vary depending on state law, it is possible to make some generalizations. Hospitals attract more court challenges to their tax-exempt status than any other type of nonprofit organization. One important reason is that uninsured patients have been charged significantly higher rates than in-sured patients, because private insurers and the government negotiate large discounts for their members, and then nonprofit hospitals have employed aggressive tactics to obtain payments from their patients (Connoly 2005). It can be difficult to distinguish the operations of nonprofit and for-profit hospi-tals, because they often provide similar levels
of charity care (Brody 2007, 279; Shafroth 2005). A search of state cases in which health care institutions litigated a denial of property tax exemption found that for the 1990–2007 period there were 141 cases from 42 states. These cases were decided about evenly for and against the health care institution (Fanning 2008). Nonprofits providing long-term-care housing, including retirement homes and low-income housing, may be the second most frequent target of legal challenges to the nonprofit property tax exemption, particularly when the housing is offered at market rates. Courts recognize “the clear contrast between, for example, elderly

16 p o l i c y f o c u s r e p o r t ● l i n c o l n i n s t i t u t e o f l a n d P o l i c y
. . . . . . . . . . . . . . . . . . .
k e n y o n a n d l a n g l e y ● pay m e n t s i n l i e u o f ta x e s 17
people who live in their own homes and pay taxes, and those who live in a property owned by a charitable institution that does not” (Gallagher 2002, 5–6). Health clubs also face challenges to their property tax exemption because of similari-ties between nonprofit clubs like the YMCA and for-profit competitors. Other types of targeted nonprofit organizations include arts organizations (Gallagher 2002, 5); childcare facilities (Brody 2007, 282); “land set aside for conservation” (Brody 2007, 285); and organizations taking “controversial positions on social, economic, and cultural issues” (Youngman 2002, 33). On the other hand, universities do not seem to face frequent challenges to their tax-exempt status, except for ancillary prop-erties that are not being used for educational purposes. This is likely because the majority of state constitutions explicitly provide for property tax exemptions for educational institutions. Churches and religious organi-zations also are usually free of such chal-
lenges, due both to constitutional protec-tions and political support, although they sometimes must account for individual prop-erties not directly tied to religious activities. Social service organizations provide a large share of government services through con-tracts, often have limited revenues, and enjoy considerable political support, so they, too, are largely unaffected by challenges (Lemov 2010).
TAx SAv INGS FOR d I FFERENT TYPES OF NONPROF I TS The importance of the property tax exemp-tion varies significantly for different types of nonprofits. Many nonprofit organizations rent space instead of owning property, and thus generally do not receive any benefit from the property tax exemption. Among nonprofits that do own real property, the tax savings from the exemption vary widely.Although it is difficult to confirm hard num-bers, table 2 shows estimates of the tax sav-ings from the property tax exemption for

16 p o l i c y f o c u s r e p o r t ● l i n c o l n i n s t i t u t e o f l a n d P o l i c y k e n y o n a n d l a n g l e y ● pay m e n t s i n l i e u o f ta x e s 17
. . . . . . . . . . . . . . . . . . .
different types of nonprofit organizations (Cordes, Gantz, and Pollak 2002). Overall, this study estimates that only one-third of nonprofit organizations own real property, but this fraction is much higher for larger nonprofits with higher revenues and for non-profits that need significant amounts of property in order to carry out their core mis-sions, such as retirement homes, hospitals, and higher education institutions. The table highlights the concentration of financial re-sources in the nonprofit sector, because a small number of large nonprofits with very
large tax savings inflate the average savings ($203,144) far above the median savings ($18,259) received by nonprofits that own property. For the typical nonprofit organization, the savings from the property tax exemption equals roughly 2 percent of total revenues for the organization. However, for the small minority of nonprofits with revenues below $100,000 that own real property, the prop-erty tax exemption is much more impor-tant—the median tax savings equals 14 per-cent of total revenues. On the other hand,
Table 2
Estimated Tax Savings from the Property Tax Exemption for Nonprofits that Own Real Property (1997)
Number of Nonprofits that
Own Real Property
Percent of Nonprofits that
Own Real Property (%)
Tax Savings for Organizations that Own Real Property ($)
Tax Savings as a Percent of Total Revenues (%)
Average Median Average Median
All Organizations 151,689 33 203,144 18,259 9 2
Revenue Level
$100,000 or less 54,762 7 13,018 7,001 54 14
$100,001–$500,000 48,526 28 32,861 8,961 11 4
$500,001–$1,000,000 15,435 51 30,546 13,313 4 2
$1,000,001–$5,000,000 21,430 70 58,577 24,257 3 1
$5,000,001–$10,000,000 4,998 83 147,031 82,281 2 1
Over $10,000,000 6,538 88 1,390,062 427,902 2 2
Organization Type
Performing Arts 5,491 19 79,103 10,079 4 2
Human Service/ Multipurpose
24,138 40 49,989 13,443 5 2
Museums 1,904 44 133,682 20,181 16 4
Housing/Shelter 6,613 58 63,526 27,576 20 9
Higher Education 1,898 62 1,477,483 381,507 4 2
Retirement Homes 4,393 81 214,039 80,492 15 6
Hospitals 4,000 70 1,736,467 515,603 4 2
Notes: This table presents rough approximations, not precise calculations. The authors used the following methodology. First, they took the Federal Reserve Board’s estimate of real estate owned by nonprofits in 1997 ($900 billion), and made adjustments to remove property owned by churches and nonprofits that are not registered as 501(c)(3) organizations, and to account for nonprofits excluded from the National Center for Charitable Statistics’ (NCCS) database of IRS Form 990 returns. These adjustments resulted in a $365 billion estimate of property owned by charities in the sample. Second, the $365 billion total was allocated to individual charities based on each organization’s share of the total value of land, buildings, and equipment. The authors address the inclusion of equipment by assigning a value of $0 to all organiza-tions with a value of land, buildings, and equipment below $100,000. Third, to reach an estimate of each charity’s tax savings from the property tax exemption, each organi-zation’s estimated real property value is multiplied by the average effective commercial property tax rate for each state in 1997 (Minnesota Taxpayers Association 1999).
Source: Cordes, Gantz, and Pollak (2002, Table 4–6).

18 p o l i c y f o c u s r e p o r t ● l i n c o l n i n s t i t u t e o f l a n d P o l i c y
. . . . . . . . . . . . . . . . . . .
k e n y o n a n d l a n g l e y ● pay m e n t s i n l i e u o f ta x e s 19
the total dollar value of the property tax exemption goes primarily to large nonprof-its. Those with revenues above $10 million receive nearly two-thirds of the total tax savings from the property tax exemption, despite representing only 4.3 percent of nonprofits that own real property. Large discrepancies in tax savings are also evident when looking at different types of nonprofits. The importance of the tax savings when measured as a percent of total revenues is highest for retirement homes and other nonprofits engaged in housing
and shelter. Hospitals and higher education institutions receive by far the largest absolute tax savings from the property tax exemption. There are also large differences in the im-portance of the property tax exemption within each type of nonprofit.
TAx REvENuE F ORGONE duE TO ThE P ROPERTY TAx ExEMPT IONThe reduction in the property tax base caused by the charitable tax exemption has two related effects on municipalities—decreased property tax revenues, and higher property tax rates for businesses and home-owners. Assuming tax rates are constant, the percentage of would-be property tax collec-tions forgone due to the charitable tax ex-emption ranges widely at the state level de-pending on the size of the nonprofit sector, from about 1.5 percent to 10 percent, with a national average around 5 percent of prop-erty tax revenues (Bowman, Cordes, and Metcalf 2009). Looking at statewide averages obscures the fact that nonprofit property tends to be highly concentrated in central cities and college towns (Netzer 2002). For these mu-nicipalities, the nonprofit tax exemption can significantly shrink the tax base. The Chronicle of Philanthropy analyzed property assessment rolls in 2006 to determine the impact of the nonprofit property tax exemption in 23 of the 30 largest cities in the United States (Lipman 2006a). Figure 5 shows that the value of exempt property owned by non-profits varies widely, from 10.8 percent of total property value in Philadelphia to 1.9 percent in Memphis and El Paso. While this figure highlights the variation across cities, the statistics for individual cities should not necessarily be viewed as definitive, given differences in the emphasis placed on assessing tax-exempt property (Lipman 2006b). For example, the Boston Assessing
Note: These statistics should be viewed as rough estimates. Policy makers should exercise caution when drawing conclusions from these data, because the quality of assessments of exempt property is wide-ranging and often unreliable (Lipman 2006b).
Source: Lipman (2006a).
0% 2% 4% 6% 8% 10% 12%
El Paso
Memphis
Tucson
Phoenix
Nashville
San Diego
Dallas
Los Angeles
San Jose
Houston
Washington, DC
Seattle
Jacksonville, FL
San Francisco
Charlotte
Fort Worth
Portland, OR
Columbus, OH
Denver
New York City
Baltimore
Boston
Philadelphia
Figure 5
Estimated value of Exempt Property Owned by Nonprofits as a Percent of Total Property value

18 p o l i c y f o c u s r e p o r t ● l i n c o l n i n s t i t u t e o f l a n d P o l i c y k e n y o n a n d l a n g l e y ● pay m e n t s i n l i e u o f ta x e s 19
. . . . . . . . . . . . . . . . . . .
Department recently conducted a detailed assessment of tax-exempt property and found that properties owned by universities and medical institutions alone were equiva-lent to 14.0 percent of total assessed value (City of Boston 2009), which is much higher than the 8.4 percent shown in figure 5. In addition to the percentage of proper-ty value owned by tax-exempt nonprofits, a city’s reliance on the property tax relative to other revenue sources affects the impact of the nonprofit property tax exemption on municipal budgets. Forgone property tax revenue will not have as large an impact on the budgets of local governments with a heavier reliance on sales and excise taxes, user fees, or state aid. In general, the nonprofit tax exemption is small compared to the total property tax base, but is large compared to other kinds of state and local tax exemptions for nonprofits (box 2). Furthermore, the value of government-
owned property that is tax-exempt is gen- erally much greater than the value of tax-exempt nonprofit property. In some cases the exempt value from property tax relief programs for homeowners, business tax abatements, and other tax incentives may also be larger than the value of the non-profit tax exemption. Furthermore, a large portion of nonprofit tax exemptions accrue to religious entities, which are generally not targeted for PILOTs.
box 2
Revenue Forgone from various State and Local Tax Exemptions
After the property tax exemption, the two largest state and local
tax savings for nonprofits are exemptions from income and
sales taxes. Nonprofits also receive an indirect tax subsidy from the
deductibility of charitable contributions from state and local income
taxes, and from the ability to issue tax-free bonds. Every state ex-
empts charitable nonprofits from property taxes, and all 45 states
with corporate income taxes also exempt charitable nonprofits.
Exemption from sales taxes is not as common: 24 of 45 states
with general sales taxes exempt purchases by charitable nonprofits,
while another 16 states exempt purchases for specific categories
of charitable nonprofits. Only 15 of 45 states exempt sales by
charitable nonprofits (Bowman and Fremont-Smith 2006).
Sherlock and Gravelle (2009) made the following estimates of fiscal
year 2009 forgone revenue from the charitable tax exemption at the
state and local level:
• Property tax exemption: $17–32 billion
• Income tax exemption of investment income: $7–9 billion
• Income tax deduction for charitable contributions: $3.6 billion
• Sales tax exemption: $3.3 billion
These estimates are a lower bound, because they do not include
the value of religious property and the sample does not include
all charitable nonprofits (although it includes almost all large non-
profits). Both of the studies cited here estimated the forgone reve-
nues from these state and local tax subsidies for nonprofits using
data from the IRS Form 990 and information about the extent of
nonprofit tax exemptions in each state.

20 p o l i c y f o c u s r e p o r t ● l i n c o l n i n s t i t u t e o f l a n d P o l i c y
. . . . . . . . . . . . . . . . . . .
k e n y o n a n d l a n g l e y ● pay m e n t s i n l i e u o f ta x e s 21
C h a p t e r 3
Case Studies of PILOT Programs and Initiatives
Obtaining systematic information on PILOTs is difficult for a num-ber of reasons. Governments that employ a payment arrangement
defined here as a PILOT do not always use that term. Alternatively, some governments apply the term PILOT to a type of payment not included in our definition, such as a payment from a governmental or for-profit entity to a municipality as a substitute for full property taxes. It is easier to obtain in-formation on broadly applied PILOT pro-grams such as the one in Boston, but more difficult to obtain information on PILOTs made by single institutions under ad hoc or short-lived agreements. Furthermore, neither party to the transaction may be willing to make detailed PILOT information public. To understand the scope of PILOTs in recent years, this report began with a 1998
survey of municipal finance directors and key community leaders in 73 large cities across the United States. This study was the first to gather information on PILOT activity nationwide (Leland 2002). It found PILOTs in seven large cities in six states: Baltimore, Boston, Detroit, Indianapolis, Minneapolis, Philadelphia, and Pittsburgh. We have used Google’s search engine and a comprehensive literature review to com-pile information on municipal PILOTs in place since 2000. This compilation included both large cities and smaller municipalities that host an educational institution or hos-pital that plays a major role in the city’s economy, such as the small town of Lebanon, New Hampshire, which receives payments from the Dartmouth-Hitchcock Medical Center. Each of the seven cities where Leland found a PILOT program in 1998
harvard Medical School,
Boston

20 p o l i c y f o c u s r e p o r t ● l i n c o l n i n s t i t u t e o f l a n d P o l i c y k e n y o n a n d l a n g l e y ● pay m e n t s i n l i e u o f ta x e s 21
. . . . . . . . . . . . . . . . . . .
has continued to collect revenues from PILOTs since 2000, and our research un-covered many additional municipalities with PILOTs. This finding might leave the im-pression that PILOT use is growing. How-ever, both the scope (large cities vs. all municipalities) and methodology (survey vs. literature review and Google search) in these two studies are different, and thus no definitive conclusion regarding any trend in PILOT use can be reached. A systematic, comprehensive survey of PILOT use for every municipality in the United States is not available, but several sources provide information on their likely magnitude. First, U.S. Census data show that PILOTs made by nonprofits are just one of many items included under “miscel-laneous revenue, not elsewhere classified” or falling “within the definition of general revenue, but not classifiable as a tax, inter-governmental revenue, or current charge.” That entire category accounted for 5 percent of municipal revenue in FY2007 (Census of Governments 2007), indicating that, in aggregate, PILOTs contribute only a small fraction of municipal revenues. Second, a study of hospital PILOTs focused on the 10 private hospitals included in the U.S. News 2004 Honor Roll (Schiller 2004). Five of them made PILOTs, one for-merly made a PILOT, and four had not made any. Hospital PILOT amounts ranged from a $300,000 fire service fee paid to Durham, North Carolina, by the Duke University Medical Center to $5.8 million in fire and police service fees paid to Palo Alto, Califor-nia, by the Stanford Hospital and Clinics. A third source in The Chronicle of Higher Education (2010) examined PILOTs made by research universities across the United States. After applying the PILOT definition used in this report, and focusing only on private colleges, we determined that 16 of the top private research universities in the
United States made PILOTs to the munici-palities in which they are located. Among the universities that reported PILOTs, annu-al contributions ranged from $500,000 from the University of Notre Dame to $7.5 mil-lion from Yale University. Some of these PILOTs are long-standing, dating to the 1920s, but four were instituted since 2000. The basis for payments ranges from assessed value, number of employees, or number of residence beds to what the university thought it could afford. In Pitts-burgh, all voluntarily contributing nonprof-its pay into a public service fund organized by local nonprofits, but the individual con-tribution amounts are not revealed. Information on PILOTs in selected cities and towns illustrates that the revenue gener-ated by PILOTs is often small, amounting to a fraction of 1 percent of the city budget (table 3). However, on occasion PILOT revenue can comprise a significant portion of the budget, as in Bristol, Rhode Island, where PILOT revenue from Roger Williams University contributes nearly 5 percent of the city budget. Several case studies illus-trate the factors affecting both the potential and pitfalls of PILOTs.
BOSTON , M ASSAChuSETTS As a city renowned for its many world-class colleges, universities, and hospitals, Boston has one of the longest standing PILOT programs and the most revenue productive program in the country. In FY2009 Boston obtained $15.7 million in PILOTs from all tax-exempt nonprofits. Even so, this is a small percentage of the total city budget (0.66 percent). Educational and medical institutions accounted for $14.9 million of this total, which is only 4.3 percent of what these organizations would have paid if they were liable for property tax payments at the commercial rate (table 4). Educational and medical organizations would have

22 p o l i c y f o c u s r e p o r t ● l i n c o l n i n s t i t u t e o f l a n d P o l i c y
. . . . . . . . . . . . . . . . . . .
k e n y o n a n d l a n g l e y ● pay m e n t s i n l i e u o f ta x e s 23
contributed 24.6 percent of city property tax revenue if they were taxable entities (City of Boston 2008; 2009; Boston Assessing Department 2010). When a nonprofit expands its real estate holdings, particularly when it acquires pre-viously taxable property and applies for tax exemption or when it begins new construc-tion, the Boston city government initiates a conversation with the objective of reaching a PILOT agreement between the city and the nonprofit. Factors that affect the pay-ment include the size and usage of the property or project. Agreements extend between 10 and 30 years, and negotiated payments are subject to an annual escala-tor clause. Community service benefits pro- vided by nonprofits are taken into account and can offset up to 25 percent of the negotiated cash PILOT. In January 2009 Boston Mayor Thomas Menino initiated a PILOT Task Force to review the current PILOT program, with the likely but not explicitly stated goal of raising additional revenue from nonprofits. While Boston University, Harvard University,
Massachusetts General Hospital, Brigham and Women’s Hospital, and Tufts Medical Center each make annual payments to the city over $1 million dollars, many nonprofits make no PILOT. An additional concern is the wide range in payments. In the latest year for which data are available, Harvard paid nearly $2 million, while Boston College paid less than $300,000. The issue of increasing PILOT amounts is viewed very differently by some government officials and representatives of nonprofit groups. According to City Councilor Stephen Murphy, a member of the city’s PILOT Task Force, 13 of the city’s 16 private colleges and universities contribute revenues under PILOT agreements, but these agreements fail to compensate the city adequately for its services (Marcelo 2009). Twice Murphy has petitioned the legislature to allow full taxation of nonprofit organizations and Representa-tive Michael Moran (D-Boston) sponsored a bill to assess nonprofits at 25 percent of the value of their property. In contrast, Richard Doherty, president of the Association of Independent Colleges and Universities in
Table 3
PILOT Contributions to Municipal Revenues
CityRevenue
Generated ($) City Budget ($) YearRevenue Generated as
Share of Total Budget (%)
Baltimore, MD 5,000,000 1,493,018,000 FY2001 0.33
Boston, MA 15,685,743 2,380,000,000 FY2009 0.66
Bristol, RI 2,100,000 44,017,031 FY2009 4.77
Butler, PA 15,000 8,442,098 FY2010 0.18
Cambridge, MA 4,508,000 466,749,012 FY2008 0.97
Detroit, MI 4,160,000 2,460,000,000 FY1998 0.17
Lebanon, NH 1,280,085 42,312,510 FY2010 3.03
Minneapolis, MN 158,962 1,400,000,000 FY2009 0.01
New Haven, CT 7,500,000 648,585,765 FY2010 1.16
Pittsburgh, PA 4,416,667 496,611,848 FY2007 0.89
Providence, RI 2,500,000 444,544,123 FY2010 0.56
Note: In the cases of Baltimore, Bristol, Pittsburgh, and Providence, the total payment was divided by the number of years for an estimated annual payment.
Source: Authors’ research.

22 p o l i c y f o c u s r e p o r t ● l i n c o l n i n s t i t u t e o f l a n d P o l i c y k e n y o n a n d l a n g l e y ● pay m e n t s i n l i e u o f ta x e s 23
. . . . . . . . . . . . . . . . . . .
The PILOT Task Force issued recom-mendations in April 2010 that cover many important features for a systematic PILOT program, including using a basis for calcu-lating PILOT amounts (in this case, assessed value); granting community benefit offsets
Massachusetts, has stated, “The colleges and universities and teaching hospitals in Boston pay about $15 million a year in payments in lieu of taxes . . . that’s the highest amount, I believe, of any city in the country” (Short-sleeve 2009).
Table 4
Estimated Property Tax Revenue if Taxable and PILOTs for Nonprofits in Boston (FY2009)
InstitutionExempt value (FY2009) ($)
Property Tax Revenue if Taxable ($)
PILOT Amount ($)
PILOT as % of Revenue if Taxable
Educational Institutions
Boston University 2,115,919,700 57,362,583 4,892,138 8.53
Harvard University 1,477,225,500 40,047,583 1,996,977 4.99
Suffolk University 237,230,300 6,431,313 375,290 5.84
Berklee College of Music 161,741,600 4,384,815 361,222 8.24
Boston College 561,952,500 15,234,532 293,251 1.92
Mass. College of Pharmacy 106,910,300 2,898,338 227,980 7.87
Tufts University 151,760,200 4,114,219 152,159 3.70
Emerson College 177,826,400 4,820,874 139,368 2.89
Showa Institute 54,718,800 1,483,427 120,966 8.15
Wentworth Institute of Technology 207,977,400 5,638,267 40,747 0.72
Northeastern University 1,351,225,100 36,631,712 30,571 0.08
Simmons College 152,572,500 4,136,240 15,000 0.36
New England Law Boston 15,888,500 430,737 13,125 3.05
Emmanuel College 165,162,000 4,477,542 0 0.00
Fisher College 16,719,000 453,252 0 0.00
Wheelock College 60,362,200 1,636,419 0 0.00
Medical Institutions
Massachusetts General Hospital 1,457,667,100 39,517,355 2,200,964 5.57
Brigham and Women’s Hospital 815,886,700 22,118,688 1,315,822 5.95
Tufts Medical Center 581,770,900 15,771,809 1,015,628 6.44
Mass. Bio-Medical Research Corp 146,236,500 3,964,472 818,728 20.65
Children’s Hospital 691,857,800 18,756,265 250,000 1.33
Boston Medical Center 300,928,700 8,158,177 221,644 2.72
Beth Israel Deaconess Med. Center 823,114,100 22,314,623 167,000 0.75
Dana Farber Cancer Institute 226,522,000 6,141,011 131,475 2.14
Spaulding Rehabilitation Hospital 86,751,700 2,351,839 77,534 3.30
Caritas St. Elizabeth’s Med. Center 252,504,700 6,845,402 0 0.00
Faulkner Hospital 181,881,400 4,930,805 0 0.00
New England Baptist Hospital 144,781,500 3,925,026 0 0.00
Total of All Institutions 12,725,095,100 344,977,325 14,857,589 4.31
Note: PILOT includes three categories: cash PILOT (91.6% of total), community service credits (5.3%), and property taxes paid on properties that would normally qualify as exempt based on their use (3.2%).
Source: City of Boston (2009, 44–45).

24 p o l i c y f o c u s r e p o r t ● l i n c o l n i n s t i t u t e o f l a n d P o l i c y
. . . . . . . . . . . . . . . . . . .
k e n y o n a n d l a n g l e y ● pay m e n t s i n l i e u o f ta x e s 25
that reduce a nonprofit’s cash PILOT; and extending the range of nonprofits targeted for payments beyond colleges, universities, and hospitals to secondary educational in-stitutions and cultural institutions, such as museums (City of Boston 2010).
Th E MACdOw ELL COLONY I N PETERBORO uGh , N Ew hAMPS h IREThe MacDowell Colony, founded in 1907 to promote the arts, operates an artists-in-residence program in 32 art studios and various common buildings on 450 acres in Peterborough, New Hampshire. Artists from across the country compete for a MacDowell Fellowship. Former fellows include Leonard Bern-stein, Willa Cather, Aaron Copland, Alice Walker, and Thornton Wilder. In 2005, 246 artists including one New Hampshire resident were selected to receive fellowships. The Peterborough Board of
Selectmen challenged the colony’s tax exemp-tion on the basis that, among other reasons, it “failed to meet the statutory requirement that residents of New Hampshire be admit-ted to a charity’s benefits.” Selectmen of-fered to accept a substantial PILOT, but when MacDowell refused the offer, the town revoked the organization’s tax exemption. Without its tax-exempt status, MacDowell Colony’s property tax bill would have been $160,000 per year (Town of Peterborough v. The MacDowell Colony, Inc. 2008). MacDowell appealed the selectmen’s decision. Eventually the New Hampshire Supreme Court voted in favor of MacDowell, ruling its promotion of the arts benefits the general public, which automatically includes residents of New Hampshire. A MacDowell Colony (2008) press release states, “While defending MacDowell’s charitable status required significant time and resources, the Colony’s board of directors felt the issue was sufficiently important to pursue at the
Macdowell
Colony

24 p o l i c y f o c u s r e p o r t ● l i n c o l n i n s t i t u t e o f l a n d P o l i c y k e n y o n a n d l a n g l e y ● pay m e n t s i n l i e u o f ta x e s 25
. . . . . . . . . . . . . . . . . . .
highest level. MacDowell hoped the case would set a precedent, one that would safe-guard other charitable organizations from increasing pressure by municipalities to pay taxes they do not owe.” PROv IdENCE , Rh O d E I S LAN dIn 2003 the City of Providence reached an agreement with its four private colleges for payments in lieu of property taxes totaling $48 million over 20 years. At the time Mayor David Cicilline argued, “With total annual budgets of $750 million, combined endow-ments of $2 billion, and over 25,000 students —the vast majority of them from outside of Providence—these institutions are thriving in our city. Yet for all the annual police, fire, public-works, and other services these enor-mous institutions consume, they pay virtual-ly no compensation to the city” (Perry 2003). By 2009 the economic downturn forced Providence to search for more revenue, and the value of property owned by nonprofits had more than doubled since the start of the decade. For both reasons, Providence sought to increase the revenues raised from colleges, and planned to obtain PILOT revenue from hospitals for the first time. The colleges ob-jected, citing the earlier agreement and not-ing they faced their own financial challenges. State legislation was filed that would allow a tuition tax, a $150 fee per semester for each full-time student from out of state, as well as legislation to allow Rhode Island cities to collect payments up to 25 percent of the property tax liability that would be owed if exempt properties were subject to full taxation (Marcelo 2009). In September 2009 the city established a Commission to Study Tax-Exempts with several objectives, including determining the costs associated with providing city services to tax-exempt organizations and developing a methodology for valuing community part-nerships made by tax-exempt institutions.
The commission has not yet issued its final report. It is important to note that Rhode Island and Connecticut are the only two states where the state government makes PILOTs to municipalities hosting private non-profit hospitals and educational institutions.
YALE uN IvERS I TY IN NEw hAvEN , C ONNECT ICuTIn 1991 Yale entered into a formal agree-ment with New Haven to make a $1.2 million annual PILOT, and over time that financial contribution has risen (Kodrzycki and Munoz 2009, 23). In February 2009 Yale agreed to increase its payments by 50 percent, with the university contributing around $7.5 million per year starting in 2010 (Zapana 2009), but the story of Yale’s contribution to New Haven goes far beyond its PILOT. Since the mid-1980s, Yale has been actively involved with public officials and corporate leaders in fostering New Haven’s economic development. A study of resur-gent U.S. cities concluded that universities can make a substantial difference in a city’s economic future, noting that, “Yale emerged as the engine of New Haven’s revitalization”
Yale university

26 p o l i c y f o c u s r e p o r t ● l i n c o l n i n s t i t u t e o f l a n d P o l i c y
. . . . . . . . . . . . . . . . . . .
k e n y o n a n d l a n g l e y ● pay m e n t s i n l i e u o f ta x e s 27
(Kodrzycki and Munoz 2009, 21). In addi-tion to its role as a major employer and in-cubator for the biomedical sector, Yale has been involved in the city’s revitalization in other ways, including funding The Center for the City, an organization aimed at tap-ping New Haven’s civic resources to tackle its social problems; redevelopment of sever-al blocks of the city’s retail center; and pay-ing a stipend for Yale employees buying homes in the city (Kodrzycki and Munoz 2009, 23). Although Yale’s efforts stand out for their magnitude, other town-gown economic development collaborations have evolved in places such as Greensboro, North Carolina; Philadelphia, Pennsylvania; and Worcester, Massachusetts. From the local government perspective, colleges and universities can be important anchors for employment and economic development, and from the col- lege or university perspective, fixed assets make relocation difficult and a city’s posi-tive image helps it attract students, faculty, and staff (Sungu-Eryilmaz and Greenstein 2010, 8).
STATE AN d F Ed ERALLY Fu N d Ed P I LOT P ROGRAMSState-funded programs in Connecticut and Rhode Island make PILOTs to municipali-ties for exempt property owned by nonprofit educational and medical institutions. Some-times these are called GILOT programs (grants in lieu of taxes) to distinguish them from the types of PILOTs described previously. Under Connecticut’s program, which is the more long-standing and well-financed of the two, the state reimburses municipali-ties for revenue forgone because of the property tax exemption afforded to colleges and hospitals. Initially the state reimbursed local communities for 25 percent of the amount that colleges and hospitals would
have paid in property taxes if they were taxed. Over time, this percentage was raised several times, until it was set at 77 percent in 1999 (Carbone and Brody 2002). In FY2008, Connecticut’s total payment under the pro-gram was $122.4 million, which was paid to 57 municipalities and 7 special districts (State of Connecticut 2008). Rhode Island reimburses municipalities for tax revenue forgone from nonprofit educational institutions and hospitals, state-owned hospitals, veterans’ residential facili-ties, and correctional facilities, but on a much smaller scale. Under this program, introduced in 2006, municipalities are reimbursed for 27 percent of tax revenue forgone. For FY2010, Rhode Island will pay out $27.6 million (State of Rhode Island 2009). One of the strongest arguments in favor of a state-funded PILOT program is that the property tax exemption for nonprofits is created by the state and typically provides benefits to citizens beyond municipal bor-ders. Another argument is that the statewide treatment of nonprofits can be more system-atic than local PILOTs, which often appear to be ad hoc in nature. There are some difficulties with such a program, however. State budget problems may mean that the funding is unreliable from year to year. Just as states tend to cut aid to local governments during recessions, they are likely to cut appropriations under PILOT programs. A different kind of prob-lem is an incentive for local assessors to overstate the value of nonprofit property covered under such a program, since any overstatement will increase state grant reve-nue at no cost to the municipality. To coun-teract this temptation, a state PILOT pro-gram must include some monitoring of local assessment practices. The federal government also has several programs for compensating local governments

26 p o l i c y f o c u s r e p o r t ● l i n c o l n i n s t i t u t e o f l a n d P o l i c y k e n y o n a n d l a n g l e y ● pay m e n t s i n l i e u o f ta x e s 27
. . . . . . . . . . . . . . . . . . .
Figure 6
Share of Property Taxes Paid to Massachusetts Municipalities by Nonprofits if Exemption Removed (FY2003)
for forgone taxes on property owned by the federal government. The U.S. Payments in Lieu of Taxes (PILT) program makes pay-ments to local governments (primarily coun-ties) for public land owned by the Interior Department or the U.S. Forest Service. In FY2009, the PILT program directed $382 million to local governments, with 84 per-cent going to 12 states in the Mountain West and Pacific regions, including Alaska (U.S. Department of the Interior 2010). Many states also make PILOTs on behalf of state-owned property, notably in capital cities.
POTENT IAL FOR Mu N IC IPAL P I LOT PROGRAMSNonprofits vary greatly in the amount of revenue they earn and the value of the assets they control. Four nonprofit sectors—
hospitals, health other than hospitals, higher education, and human services—account for 59 percent of nonprofit assets and 78 percent of revenues. Of these four sectors, hospitals have the largest proportion of both revenues and assets. The Massachusetts Department of Rev-enue conducted a survey in FY2003 of the state’s 351 municipalities to look at property owned by tax-exempt charitable and educa-tional institutions (McArdle and Demirai 2004). These organizations owned property worth $22 billion, or approximately 3 per-cent of total property value in the state. However, there were large variations across communities. Figure 6 shows the share of property tax revenue from these organizations if the property tax exemption was removed and they were taxed at the commercial tax
Note: Figure shows estimates for charitable and educational institutions if taxed at the commercial tax rate.
Source: McArdle and Demirai (2004).
Percent of Property Tax Levy
More than 10.0% (18 municipalities)
2.5%–10.0% (68 municipalities)
1.0%–2.5% (78 municipalities)
0.0%–1.0% (144 municipalities)
0.0% no value (35 municipalities)
Did not report (8 municipalities)

28 p o l i c y f o c u s r e p o r t ● l i n c o l n i n s t i t u t e o f l a n d P o l i c y
. . . . . . . . . . . . . . . . . . .
k e n y o n a n d l a n g l e y ● pay m e n t s i n l i e u o f ta x e s 29
The number of nonprofits, expenses, and assets by U.S. region is shown in table 6. Northeastern states host a disproportionate-ly large share of nonprofit organizations, while the South has the smallest share. This same pattern holds for nonprofits’ expenses, although nonprofits in the West have the lowest level of assets. The potential to raise revenue from PILOTs is likely to be con-centrated in the Northeastern states and in certain cities and towns, with health and education nonprofits being the most likely revenue generators.
Table 5
Revenue Potential of PILOTs in Minnesota
Number of Cities
and TownsPotential Increase in Property Tax Revenue
2,105 0, No potentially taxable nonprofits
447 Less than 1%
125 1–5%
17 5–10%
6 Greater than 10%
Note: Revenue would be collected from charitable institutions and hospitals but not governments, churches or colleges. A tax rate of 0.38% was assumed.
Source: Minnesota Budget Project and Property Tax Study Project (2000).
Table 6
Nonprofits by u.S. Census Region (2005)
RegionNumber of Organizations per 10,000 Population
Expenses per Capita ($)
Assets per Capita ($)
Northeast 12.8 5,462 11,325
Midwest 10.9 3,800 7,139
South 9.0 2,690 5,186
West 10.5 3,125 4,757
Total 10.9 3,601 6,751
Source: Wing, Pollak, and Blackwood (2008, 198–200).
rate in each municipality. While tax revenues forgone due to the property tax exemption were less than 1 percent of total property tax revenues in the majority of the state’s municipalities, they exceeded 2.5 percent of total property tax revenues in one-quarter of the municipalities, and exceeded 10 per-cent of total revenues in 18 communities. The Minnesota Budget Project and Prop-erty Tax Study Project (2000) researched the revenue potential of PILOTs in the state’s 2,700 cities and towns based on the value of property owned by charitable insti-tutions and hospitals, but not governments, churches, or colleges. Table 5 indicates that if cities and towns were to collect property taxes from charitable institutions and hospi-tals, the impact on total local property tax revenues would vary greatly. While 78 per-cent of Minnesota cities and towns would receive no additional property tax revenue because they have no charitable institutions or hospitals, six cities and towns would be able to increase property tax collections by more than 10 percent, assuming they held the tax rate constant. Alternatively, they could reduce the tax by 10 percent on the rest of the taxpayers.
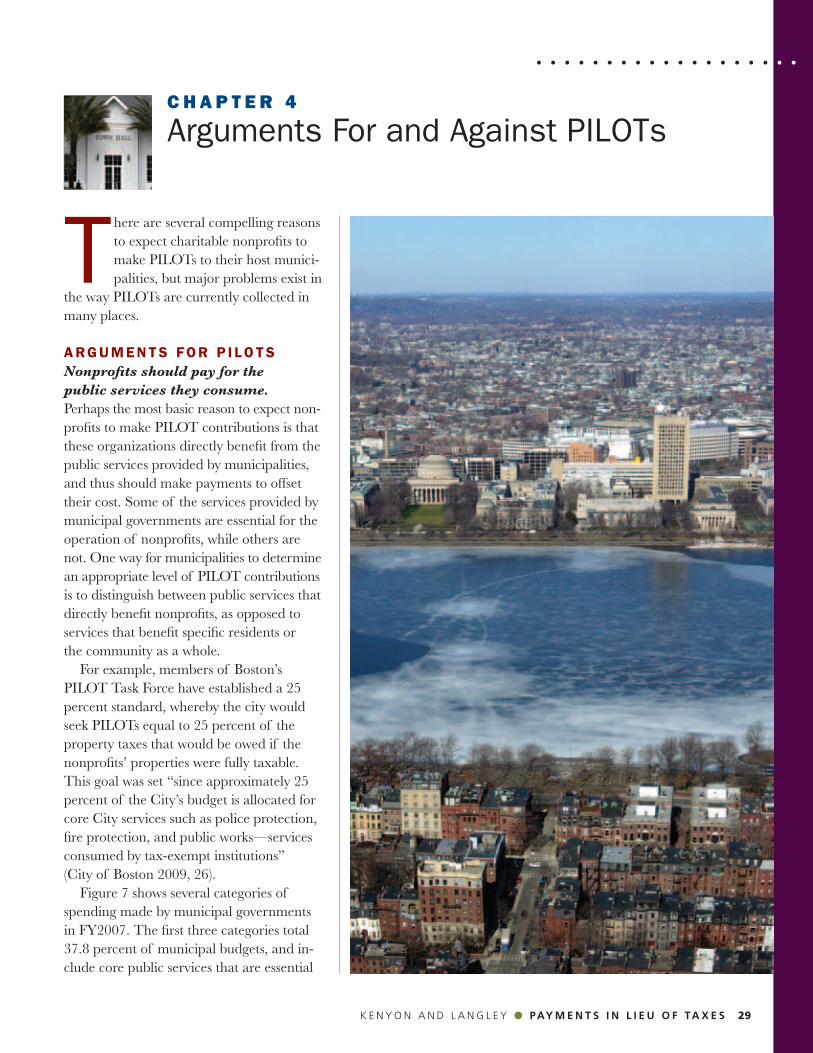
28 p o l i c y f o c u s r e p o r t ● l i n c o l n i n s t i t u t e o f l a n d P o l i c y k e n y o n a n d l a n g l e y ● pay m e n t s i n l i e u o f ta x e s 29
. . . . . . . . . . . . . . . . . . .C h a p t e r 4
Arguments For and Against PILOTs
There are several compelling reasons to expect charitable nonprofits to make PILOTs to their host munici-palities, but major problems exist in
the way PILOTs are currently collected in many places.
ARGuMENTS FOR P I LOT SNonprofits should pay for the public services they consume.Perhaps the most basic reason to expect non-profits to make PILOT contributions is that these organizations directly benefit from the public services provided by municipalities, and thus should make payments to offset their cost. Some of the services provided by municipal governments are essential for the operation of nonprofits, while others are not. One way for municipalities to determine an appropriate level of PILOT contributions is to distinguish between public services that directly benefit nonprofits, as opposed to services that benefit specific residents or the community as a whole. For example, members of Boston’s PILOT Task Force have established a 25 percent standard, whereby the city would seek PILOTs equal to 25 percent of the property taxes that would be owed if the nonprofits’ properties were fully taxable. This goal was set “since approximately 25 percent of the City’s budget is allocated for core City services such as police protection, fire protection, and public works—services consumed by tax-exempt institutions” (City of Boston 2009, 26). Figure 7 shows several categories of spending made by municipal governments in FY2007. The first three categories total 37.8 percent of municipal budgets, and in-clude core public services that are essential

30 p o l i c y f o c u s r e p o r t ● l i n c o l n i n s t i t u t e o f l a n d P o l i c y
. . . . . . . . . . . . . . . . . . .
k e n y o n a n d l a n g l e y ● pay m e n t s i n l i e u o f ta x e s 31
for the operation of nonprofits—police and fire protection, sewers and waste manage-ment, and roads. This is considered a low-end estimate of the public services used by nonprofits because other types of services that directly benefit nonprofits are not in-cluded in these categories. County govern-ments and special districts also provide ser-vices directly benefiting nonprofits, but do not normally receive PILOTs and thus are not included in the figure.
PILOTs provide essential revenue for some municipalities and allow tax exporting.For municipalities with a large share of tax-exempt nonprofit property, PILOTs can provide essential revenue that can be used to provide improved public services, lower property tax rates, or pursue other policy goals. PILOTs are sometimes dismissed be-cause they currently make a small contribu-tion to municipal budgets when measured in percentage terms. However, the revenue that could be generated with expanded use of PILOTs is considerable, even with non-
profits paying a quarter or less of what they would pay if their properties were all taxable. Relative size is not the only way to mea-sure the importance of a PILOT program; the dollar value matters, too. For example, in FY2009 nonprofit organizations in Bos-ton made PILOTs worth $15.7 million. Although that payment was only 0.66 per-cent of the city’s budget, it was more than enough to fund snow removal for an entire winter, or about half of the budget for the city’s library system (City of Boston 2008; 2009). PILOTs are also a way for municipalities to export their tax burden to nonresidents, because most revenues for universities, retire-ment homes, and sometimes hospitals come from people who live outside the municipal-ity (Brody 2005). Some economists may oppose this strategy, because property taxes serve as the “price” for local services (Fischel 2001), and thus a tax that is exported to nonresidents may lead to overspending by municipalities. However, tax exporting may be a justifiable policy to the extent that the benefits provided by nonprofits spill over
Source: Census of Governments.
Figure 7
Municipal Government General Expenditures (FY2007)
17.8%
4.6%
5.5%
8.9%
11.9%
13.5%
7.9%
10.5%
19.4%
0% 5% 10% 15% 20%
Other
Housing and Community Development
Parks and Recreation
Social Services
Education
Government Administration and Debt Payments
Roads
Sewers and Waste Management
Police and Fire Protection

30 p o l i c y f o c u s r e p o r t ● l i n c o l n i n s t i t u t e o f l a n d P o l i c y k e n y o n a n d l a n g l e y ● pay m e n t s i n l i e u o f ta x e s 31
. . . . . . . . . . . . . . . . . . .
into surrounding communities, while the costs in terms of forgone revenues are con-centrated in one city. This is particularly the case when economically strong suburbs sur-round a center city whose tax base has been depleted due to a high number of nonprofits.
PILOTs can address inequities created by the charitable property tax exemption.One critique of the charitable property tax exemption is the perceived inequity in the distribution of tax savings. Generally the greatest tax savings go to large nonprofits with the most valuable landholdings, especially hospitals, higher education institutions, and tax-exempt housing facilities, while most small nonprofits receive relatively little in tax ben-efits. The large nonprofits are the same ones most frequently targeted for PILOTs. Con-versely, smaller nonprofits, especially social service providers, are rarely targeted. Because nonprofits that rent space from private owners are generally not eligible for
the property tax exemption, about two-thirds of nonprofit organizations do not receive any benefit from the exemption (Cordes, Gantz, and Pollak 2002). However, to the extent that landlords pass on some portion of their property taxes in the form of higher rent, organizations that rent still pay prop-erty taxes. This raises concerns about hori-zontal equity, since two nonprofits that are similar in almost every respect may receive dramatically different tax benefits solely because one nonprofit owns its property while the other one rents.
PILOTs can reduce inefficient location decisions made by nonprofits.According to economic theory, the charitable property tax exemption distorts the location decisions of nonprofits because it creates an incentive for them to locate in center cities where the tax savings are high compared to adjacent municipalities (Quigley and Schmenner 1975). It is well established that property taxes are capitalized into selling

32 p o l i c y f o c u s r e p o r t ● l i n c o l n i n s t i t u t e o f l a n d P o l i c y
. . . . . . . . . . . . . . . . . . .
k e n y o n a n d l a n g l e y ● pay m e n t s i n l i e u o f ta x e s 33
prices—for otherwise identical properties, the one with higher property taxes will have a lower selling price, which equalizes total expenses over the life of the property (Yinger et al. 1988). Consequently, within a given metropolitan area, nonprofits have a financial incentive to locate in municipali-ties with high tax rates, because their deci-sions are based solely on selling prices, not property taxes (McEachern 1981). The empirical evidence that the chari- table tax exemption leads nonprofits organi-zations to locate in municipalities with high property tax rates more frequently than they would without the tax exemption is weak, but this potential inefficiency is still a concern (Hansmann 1987; Chang and Tuckman 1990). By making nonprofits pay more for choosing to locate in high-tax municipalities with a large share of tax-exempt properties, PILOTs can help offset distortions created by the property tax exemption. PILOTs can also address two other inefficiencies: the in-centive for tax-exempt nonprofits to have a higher ratio of capital and land to labor, and to own property instead of renting.
ARGuMENTS AGA INST P I LOTSPILOTs are often ad hoc, secretive, and contentious.Table 7 contrasts PILOTs with many desirable features of a tax system. Many of the problems with PILOTs result from the fact that they are voluntary payments. As a result, PILOTs are haphazard—the level of PILOT amounts normally depends more on the aggressiveness of municipal officials than on property values or the level of pub-lic services consumed by nonprofits. Conse-quently there are huge horizontal inequities, with similar nonprofits making very different PILOTs even within the same municipality. The processes that lead to PILOTs are harshly criticized by many nonprofits that view PILOTs as a kind of extortion. Even though they are legally tax-exempt, non-profits may feel that it is in their best interest to make a contribution, because otherwise they could face the possibility of having their property tax exemption challenged in court, face resistance when trying to secure building permits, or lose government con-tracts. In the process of fighting over PILOTs, both municipalities and nonprofits can spend
Table 7
desirable Features of a Tax System vs. PILOTs
desirable Features of a Tax System Common Pitfalls with PILOTs
Horizontal equity: Taxpayers in similar situations pay similar taxes. For example, two homeowners with similar property values pay similar property taxes.
Because PILOTs are voluntary, two tax-exempt nonprofits with similar property values often make very different PILOTs.
Vertical equity: Taxpayers with a greater ability to pay often face higher tax bills.
Large nonprofits with highly valued real property may pay less in PILOTs than smaller nonprofits with lower property values.
low administrative costs: The costs of government adminis-tration plus compliance costs for the private sector are low relative to the amount of revenue raised.
The costs of government administration for PILOTs (including costs for assessing tax-exempt property), the expenditures nonprofits make to avoid or reduce PILOTs, and the potential costs of litigation for both parties can all be high.
revenue sufficiency: The tax system raises enough revenue to pay for the desired level of public services.
PILOTs normally raise little revenue relative to what nonprofits would pay if taxable, but can still provide crucial revenue for some municipalities.
Transparency: The tax system should be simple and easy to understand.
PILOTs are often negotiated secretly, and the payments are often determined in an ad hoc way with no underlying basis.
Predictability: Tax rates should be fairly stable from year to year so taxpayers can plan for future liabilities, and govern-ment should be able to rely on a stable revenue stream.
PILOTs are often short-term agreements, which leave municipalities uncertain that they will continue to raise sufficient revenue, and nonprofits concerned that they will be asked for higher and higher payments in the future.

32 p o l i c y f o c u s r e p o r t ● l i n c o l n i n s t i t u t e o f l a n d P o l i c y k e n y o n a n d l a n g l e y ● pay m e n t s i n l i e u o f ta x e s 33
. . . . . . . . . . . . . . . . . . .
significant amounts of money on legal fees and end up with their reputations tarnished.
PILOTs provide limited and unreliable revenue.PILOT programs normally do not generate significant revenue relative to the size of mu-nicipal budgets. Leland (2002) summarized PILOT programs in several large cities in the 1990s, and found that PILOTs as a percent-age of these cities’ budgets were relatively small: 0.15 percent in Baltimore; 0.17 per-cent in Detroit; 0.54 percent in Philadelphia; 0.77 percent in Pittsburgh; and 1.37 percent in Boston. It can also be difficult for municipalities to negotiate long-term PILOT agreements that provide a reliable revenue source, even from nonprofits willing to make significant finan-cial contributions. Brody (2010b, 88) outlines a frequent source of conflict between munic-ipalities and nonprofits:
Municipalities above all seem to be seek-ing a predictable revenue stream that they can count on for budgeting purposes, but colleges [and other nonprofits] justifiably fear agreeing to long-term commitments. It is not just concern about future revenue needs—colleges worry about a creeping line of scrimmage. Hence the insistence by nonprofits that contributed to the Pittsburgh Public Service Fund that each year’s collective multimillion dollar PILOT was a “gift” that couldn’t be com-pelled or become a base line for future contributions.
Nonprofits often reject the idea of making PILOTs because they want to avoid any di-rect challenge to the property tax exemption itself and are worried about creating the im-pression that they are taxable organizations. Concern about establishing the precedent that nonprofits are taxable is justifiable. While most state constitutions allow for tax exemp-
tions for charitable nonprofits, state court decisions and new statutes can dramatically narrow the interpretation of these constitu-tional provisions. It is important for local governments interested in voluntary contri-butions from nonprofits, but not interested in challenging the property tax exemption itself, to make this intent explicit in the contracts signed between nonprofits and municipalities that form the basis of on-going PILOT agreements. The limited revenue potential of a PILOT program must be weighed against the possi-bility of significant legal and administrative costs. To be fair for nonprofits, PILOT pro-grams should consider the community ben-efits provided by each nonprofit organization, and the assessed value of its tax-exempt property. However, collecting these data entails some administrative costs for munici-palities and compliance costs for nonprofits. Finally, heavy-handed requests for PILOTs can strain relationships between municipali-ties and nonprofits, which is another cost to consider since successful partnerships can be very beneficial for municipalities.
PILOTs could lead nonprofits to raise fees, cut services, or reduce employment.The added cost of making PILOTs may have some negative consequences for non-profits, such as the possibility that they will raise fees charged to their beneficiaries, cut services, reduce employment, or relocate. Certainly it is important to consider the implications of the extra expense. Non- profits will respond differently based on the type of organization, their reliance on different revenue sources, their current budget situation, and other factors. How- ever, as long as PILOTs are truly voluntary, and not just voluntary in name, a non- profit presumably would decline to make a PILOT if doing so would have severe

34 p o l i c y f o c u s r e p o r t ● l i n c o l n i n s t i t u t e o f l a n d P o l i c y
. . . . . . . . . . . . . . . . . . .
k e n y o n a n d l a n g l e y ● pay m e n t s i n l i e u o f ta x e s 35
consequences, such as forcing the non- profit to drastically cut core services or relocate. One of the most likely reactions of non-profits to the extra expense of a PILOT is to increase user fees, which accounted for 49 percent of revenues for charitable non-profits in 2005 (Wing, Pollak, and Black-wood 2008, 134). This response is especially likely for nonprofits that rely heavily on fees and provide services where demand does not fall much in response to higher prices, such as a marginal increase in college tuition. Because fees will normally be paid in part by beneficiaries who live outside the muni-cipality, this response is effectively a type of tax exporting, and possibly a better match between the benefits and costs of the nonprofit. While it is doubtful that nonprofits would make severe cuts to their main operations because of a PILOT, they could decide to cut charitable services that are not central to their core mission. For example, in response to making a $2 million PILOT, Brown Uni-versity “eliminated more than $600,000 in support for HELP, an urban health and education program” (Worcester Regional Research Bureau 2004, 3).
Nonprofits often argue that PILOTs could force them to cut payrolls or make other changes that would diminish the economic benefits that accrue to the local community. There is no doubt that these benefits can be significant. In addition to direct employment, large nonprofits such as hospitals, universities, and museums can serve as anchor institutions that bring non-residents into city centers, create businesses to supply goods and services demanded by the anchor institutions, and foster urban renewal (Penn Institute for Urban Research 2009). Universities can provide particularly large dividends for a community’s long-term success, including a more highly skilled workforce, innovative start-ups, a vibrant cultural life, and all of the jobs and tax revenue that go along with these benefits (Appleseed Consultants 2003). However, focusing on the general eco-nomic benefits generated by nonprofits is not an argument against PILOTs per se. For-profit businesses are also major employ-ers and generate similar economic benefits, and do pay property taxes. Higher PILOTs could reduce property tax rates for for-profit businesses, and in turn increase employment in the private sector. Other possible responses by nonprofits include attempts to raise donations to cover the expense of the PILOT, or to lower oper-ational costs through efficiency improvements. However, it is normally not possible to rely on increased donations to cover the cost of PILOTs, because PILOTs are unlikely to encourage philanthropy and are often sought during recessions when nonprofits also face declines in donations and government grants (National Council of Nonprofits 2010). Furthermore, during a recession non-profits will have already pursued cost-cutting measures to raise efficiency in response to general declines in revenue.

34 p o l i c y f o c u s r e p o r t ● l i n c o l n i n s t i t u t e o f l a n d P o l i c y k e n y o n a n d l a n g l e y ● pay m e n t s i n l i e u o f ta x e s 35
. . . . . . . . . . . . . . . . . . .C h a p t e r 5
Implementing and Structuring a PILOT Program
I n light of the problems with the way PILOTs are currently solicited in many municipalities, this chapter offers some guidance on how to avoid common pit-
falls for municipalities interested in seeking PILOTs from nonprofits and describes the processes often used to obtain PILOTs. It also examines various features of established PILOT programs and some alternative ways to raise revenues from nonprofits and other entities. PILOTs are not appropriate for all municipalities. Before implementing a PILOT program, municipal officials should consider some key information—most importantly, the value of tax-exempt property owned by nonprofits as a percentage of total property value in the municipality. PILOTs can pro-vide essential revenue for municipalities with a large share of tax-exempt property, but
they may not be worth the cost and effort in municipalities without a large nonprofit sector. Municipalities should also consider the types of nonprofits that own property in their communities, and their ability to contribute to the local budget (Worcester Regional Research Bureau 2004). Public officials also must have a solid understanding of the legal basis for the charitable property tax exemption. Munici-palities are probably more likely to receive significant PILOTs if they are located in states with a narrower definition of charity or more stringent requirements on the use of exempt property. In addition, local politi-cal support for PILOTs must be considered. Tax-exempt nonprofits often fight PILOT attempts aggressively, and municipalities are more likely to obtain PILOTs if they have support from taxpayers, politicians, public

36 p o l i c y f o c u s r e p o r t ● l i n c o l n i n s t i t u t e o f l a n d P o l i c y
. . . . . . . . . . . . . . . . . . .
k e n y o n a n d l a n g l e y ● pay m e n t s i n l i e u o f ta x e s 37
employees, the local media, and others before trying to institute such a program.
Mu NIC IPAL STRATEG IES TO O BTA IN P I LOTSMunicipalities that have successfully solicited PILOTs from nonprofits have often employed a “carrot and stick” approach—with explicit appeals to the nonprofits’ sense of commu-nity responsibility, as well as the potential consequences of not contributing.
The Carrot: Appeals to Community Responsibility and FairnessRequests for PILOTs are often couched in terms of community responsibility and fair-ness. In particular, some people argue that it is fair to expect nonprofits to make payments to partially cover the cost of local public services, and that a contribution is part of being a good neighbor. For example, a letter from the City of Cambridge, Massachusetts (2010), to tax-exempt property owners appeals to a sense of fairness: “It is only fair to expect exempt property owners to make some contribution towards the cost of municipal services.” It notes that despite being much less than what a taxable entity would pay, a payment would be a “significant and appreciated contribu-tion to the fiscal well-being of the City.” The letter also explains that PILOTs help provide an adequate level of public services that benefit both tax-exempt property own-ers and other residents of the community, which is another common appeal. Universities in particular are often sym-pathetic to this argument since so many of their students and faculty live in the area and a vibrant community helps attract stu-dents. Finally, making a PILOT can improve a nonprofit’s public image, which can be particularly important for nonprofits with strained relations in the local community or with controversial expansion plans.
The Stick: Coercive Strategies that Lead to PILOTsAppeals to community responsibility are often not enough for municipalities to obtain significant PILOT amounts, so local govern-ments may choose to use one or more other strategies to obtain PILOTs. First, the threat of new fees or taxes on charitable nonprofits—imposed either locally or at the state level—has led nonprofits to make PILOTs, because these voluntary contributions are viewed as preferable to the fees or taxes. While it is impossible to know the intentions of municipal officials, it appears that fees on nonprofits are often introduced as a strategic tool to compel PILOTs. For example, a tuition tax proposed in Pittsburgh in 2009 was dropped when local colleges and universities agreed to make PILOTs worth about $5 million per year (Urbina 2009). In Baltimore, a 2001 propos-al to impose an energy tax on all nonprofits was dropped once “the city’s nonprofit hos-pitals, colleges, universities, and nursing homes agreed to pay the city a total of $20 million over the next four years” (Anft 2001). In Watertown, Massachusetts, Har-vard University agreed in 2002 to make a PILOT worth at least $3.8 million per year with a 3 percent annual adjustment through 2054. Based on an interview with the town manager, a newspaper article said that “the turning point in the negotiations fol-lowed a push by Watertown officials for a bill in the Legislature that would have forced all tax-exempt institutions to pay taxes on properties that represent more than 2.5 percent of a community’s tax base” (Flint 2002, A1). Second, potential challenges to a non-profit’s property tax exemption have led to PILOTs because the nonprofit believes these payments are better than risking a complete revocation of the organization’s tax exemp-

36 p o l i c y f o c u s r e p o r t ● l i n c o l n i n s t i t u t e o f l a n d P o l i c y k e n y o n a n d l a n g l e y ● pay m e n t s i n l i e u o f ta x e s 37
. . . . . . . . . . . . . . . . . . .
tion. A tax-exempt nonprofit may decide that making a PILOT will help avoid any formal challenge to the organization’s exemption. In other cases, a nonprofit may face a legal challenge to its property tax exemption and decide that its best option is to settle and reach a PILOT agreement, either because of the uncertainty of litigation or simply to avoid further legal fees (Leland 1994). Third, municipalities have control over building permits, zoning decisions, and other factors that influence nonprofits’ operations, and nonprofits may decide to make PILOTs to maintain good relations with local govern-ment officials and receive favorable treat-ment in the future. Using these or other coercive strategies is a high-risk, high-reward decision for municipalities. Some of the largest PILOTs in the country were preceded by these tactics, at least implicitly. However, this approach often antagonizes the nonprofit community, can entail significant legal costs, may hurt the local government’s reputation, and is not guaranteed to work. The legality of fees and taxes imposed on tax-exempt organizations is often uncertain, and may be overturned by courts. At the same time, charitable non-profits have a strong track record of defend-ing their property tax exemptions against a legal challenge (Brody 2010b). Ultimately, while nonprofits may make PILOTs to receive favorable treatment
on building permits, zoning decisions, and other regulations, an explicit quid pro quo arrangement is probably illegal. A federal district court ruled in Northwestern University v. City of Evanston (2002) that the city could not place a large part of the university’s campus in a historic district—which solely contained the university—with restrictions on future development in retaliation for the university’s refusal to make PILOTs. In many respects, threatening to use the stick appears better than actually using it.
Bu I L d ING Su PPORT FOR A P I LOT P ROGRAMPILOTs are voluntary payments, and thus building support for a PILOT program among tax-exempt nonprofits is essential, even when a degree of coercion is involved. Even if a municipality is insistent on receiv-ing some sort of PILOT, maintaining flex-ibility about specific program features is important. For example, nonprofits may wish to receive more credit for community benefits, or have plans for phasing in a PILOT agreement. While the municipality may receive smaller PILOTs than it had hoped for at the beginning of negotiations, working in collaboration with nonprofits will make them more likely to participate in a PILOT program. Having most major nonprofits in a municipality buy into a pro-posed PILOT program has major benefits,

38 p o l i c y f o c u s r e p o r t ● l i n c o l n i n s t i t u t e o f l a n d P o l i c y
. . . . . . . . . . . . . . . . . . .
k e n y o n a n d l a n g l e y ● pay m e n t s i n l i e u o f ta x e s 39
such as reducing criticism related to hori-zontal inequities and putting more pressure on nonprofits to make voluntary payments so they would not be one of the few insti- tutions not participating. Boston’s creation of a task force in January 2009 to expand its PILOT program provides some guidance for other cities. The task force included representatives from the major stakeholders: hospitals (2 task force mem-bers); universities (2); businesses (2); local government (1); community organizations (1); and labor (1). Despite their divergent interests, the members met regularly over 14 months and were able to reach agreement on a series of recommendations. Forming a similar task force is one way for muni- cipalities to build support for a PILOT program in their communities.
P I LOT P ROGRAM FEATuRESSystematic PILOT Program vs. Individual PILOT AgreementsFor larger cities with a significant number of nonprofits owning tax-exempt property, a systematic PILOT program is desirable because it can address many of the prob-lems associated with PILOTs. However, for smaller municipalities that only have one or a handful of nonprofits that will be targeted for PILOTs, it may be more realistic to reach individual agreements with each organization.
Types of Nonprofits Targeted Municipalities must decide which types of nonprofits to target for PILOTs. While many people oppose the idea of asking small social service providers or religious organizations for PILOTs, turning this basic idea into a consistent policy can be difficult because of the wide range of services pro-vided by nonprofits and the fact that people often disagree about which types of activities should be subsidized via tax exemption.
One way to address this problem is to develop a list of general principles, and then solicit PILOTs only from nonprofits that do not satisfy these requirements. This approach was taken under Philadelphia’s Voluntary Contribution Program in the mid-1990s. The city sought PILOTs from charities that did not meet the five criteria of a “purely public charity” as defined by the state supreme court. As a result, only about 50 of 580 charities in the city were asked for a PILOT. While this approach worked reasonably well in Philadelphia, courts had widely varying interpretations of the “purely public charity” test throughout the rest of the state, which illustrates the ambiguities that can result from this type of list of general principles (Glancey 2002). An alternative approach is to set a threshold level of assessed value or operating revenues for inclusion in a PILOT program. For example, Boston’s PILOT Task Force recommended establishing a threshold of $15 million in assessed property value for a non-profit to be included in its PILOT program. This approach focuses attention on those nonprofits that would normally make the largest PILOTs, but can result in similar non-profits being treated very differently solely because of their size, which is a poor proxy for both the community services provided by nonprofits and their ability to make PILOTs. Some municipalities ask for PILOTs from specific types of nonprofits. For example, Detroit has targeted housing facilities for low-income residents and the disabled (Le-land 2002, 203). Finally, in many municipal-ities the decision about which organizations to target is easy, because their nonprofit sec-tor is dominated by a single large institution. Another view is that fairness requires municipalities to ask all property-owning tax- exempt nonprofits for PILOTs. These advo-cates argue that since PILOTs are voluntary, obtaining at least modest contributions from

38 p o l i c y f o c u s r e p o r t ● l i n c o l n i n s t i t u t e o f l a n d P o l i c y k e n y o n a n d l a n g l e y ● pay m e n t s i n l i e u o f ta x e s 39
. . . . . . . . . . . . . . . . . . .
all nonprofits builds support for a PILOT program, because large nonprofits and spe-cific types of organizations do not feel un-fairly singled out. With a universal program, incorporating community benefit offsets is an even more important element in the negotiations.
Trigger for Inclusion in PILOT Program Municipalities must decide when it is appro-priate to request PILOTs from nonprofits. One approach is to solicit PILOTs when nonprofits purchase previously taxable prop-erty and thus remove it from the tax rolls, or when they make significant improvements to existing tax-exempt properties. This ap-proach is currently used in Boston. Non-profits may be more likely to support this approach, because they can take the PILOT cost into consideration when deciding to expand, as opposed to being surprised by a new request for PILOTs over which they have no control. Municipalities also will be able to more gradually adjust their budgets instead of facing a sudden drop in their tax base, and are in a better position to request a PILOT when the nonprofit is requesting a building permit from the local government. How- ever, relying on a trigger for inclusion in a PILOT program leaves a large share of tax-exempt property out of consideration for PILOTs, and thus will normally not raise as much revenue as a strategy of targeting all nonprofits would raise. In addition, seeking PILOTs only during expansion discourages capital investment and raises the cost of entry for new nonprofits.
Basis Used to Calculate PILOTsArguably the fairest basis to calculate PILOT amounts is the assessed value of tax-exempt property, because the PILOT is proportional to the nonprofit’s tax savings from the prop-
erty tax exemption. Like regular taxpayers, owners of exempt property are more likely to view a PILOT request as fair if they view the assessed value as accurate. While cur-rent assessments are often unreliable, it is not as difficult to obtain accurate assess-ments of exempt property as is commonly believed. Some guidance can be found in recent efforts by the Boston Assessing Department to estimate the value of exempt property owned by educational and medical institu-tions in the city for FY2009. The depart-ment first used its statutory authority to obtain detailed facility information from these organizations. Since the types of properties owned by many nonprofits have relatively few trans-actions that can be used for comparable sales, the city relied primarily on the income approach for assessments and used a cost approach for some special purpose items. The department then allowed the institu-tions to review these assessments, and made adjustments when necessary (City of Boston 2009, 40). The Boston PILOT Task Force recommended seeking PILOTs equivalent to 25 percent of the taxes a nonprofit would have paid if their properties were not exempt. Other cities take different approaches. For example, Cambridge, Massachusetts, uses square footage as the basis. In Balti-more, PILOTs were based on an organiza-tion’s annual operating income, which is a rough proxy for a nonprofit’s ability to make a PILOT (Leland 2002, 203). PILOTs can also be linked to some measure of economic activities, as in the part of Yale’s PILOT that is based on the number of residence beds and the number of employees (Kelder-man 2010). Sometimes there is no apparent basis for a PILOT other than the negotiations between the nonprofit and municipality to set an acceptable amount.

40 p o l i c y f o c u s r e p o r t ● l i n c o l n i n s t i t u t e o f l a n d P o l i c y
. . . . . . . . . . . . . . . . . . .
k e n y o n a n d l a n g l e y ● pay m e n t s i n l i e u o f ta x e s 41
Multiyear Agreements Some PILOTs include a multiyear agree-ment between the nonprofit and the muni-cipality, often with an escalator clause. For example, the Massachusetts Institute of Technology’s PILOT to Cambridge is sub-ject to a 2.5 percent annual increase (Kel-derman 2010). The advantage of a multi-year agreement is that it reduces uncertain-ty for both nonprofits and municipalities.
Community Benefit OffsetsOne of the central arguments for PILOTs is that some charitable nonprofits provide modest public benefits to local residents relative to their tax savings. There are two ways to address this critique: these organiza-tions can make PILOTs (essentially reduc-ing their tax savings), or they can provide greater public benefits for local residents. Some municipalities have pursued the second approach by incorporating commu-nity benefit offsets into their PILOT pro-grams. That is, the nonprofits’ target cash PILOTs are reduced in return for providing public services directly benefiting local resi-dents. This approach was a key component of Philadelphia’s Voluntary Contribution Program in the mid-1990s, and the PILOT Task Force in Boston also emphasized the
importance of community benefits in their recommendations. There are several reasons that municipal-ities interested in PILOTs should consider community benefit offsets. First, nonprofits may be better able to provide many public services than municipal governments, and they can often do so at a lower cost. For ex-ample, given their resources and expertise, nonprofit hospitals are in a particularly good position to provide free health clinics for local residents. This approach is also more likely to foster mutually beneficial partner-ships between municipalities and nonprofits. Nonprofits are normally more willing to contribute in-kind services than to make PILOTs, and may be able to raise private donations to support these initiatives, whereas PILOTs could possibly discour- age philanthropy. The difficult part about incorporating community benefit offsets into a PILOT program is deciding what services should count for offsets. It is crucial that a muni- cipality is clear and consistent about its priorities—that is, which types of services would be most beneficial for residents. Then nonprofit leaders and city officials can work together to identify the best oppor-tunities to leverage nonprofits’ expertise,
Table 8
Community Benefit Offsets to Reduce Cash PILOTs
Should count as an offset Should not count as an offset
Job training for local residents Job creation
Scholarships reserved for local residents Scholarships available to all students
Public health clinic Unreimbursed medical care that was billed for
Property taxes voluntarily paid on property being used for an exempt purpose
Property taxes paid on property that is not actively used for an exempt purpose
After school tutoring for local students Not applicable
Legal aid Not applicable
After school arts, music, and sports programs Not applicable
Note: These are rough guidelines, but decisions about which benefits should count depend on the needs of individual municipalities and the capacity of local nonprofits to provide services. For another set of guidelines, see City of Boston (2009, 75–79).

40 p o l i c y f o c u s r e p o r t ● l i n c o l n i n s t i t u t e o f l a n d P o l i c y k e n y o n a n d l a n g l e y ● pay m e n t s i n l i e u o f ta x e s 41
. . . . . . . . . . . . . . . . . . .
resources, and interests to reach these goals. The Boston PILOT Task Force rec-ommends that only “those services that are ‘above and beyond’ the tax-exempt organi-zation’s business model should be consid-ered for PILOT credits” (City of Boston 2009, 7). Table 8 provides some suggestions for which types of activities should count for community benefit offsets based on the description above. To consider community benefit offsets, municipalities must have a way to estimate the cash value of donated in-kind services or volunteer hours to reduce a nonprofit’s target cash PILOT. Experience from Phila-delphia’s Voluntary Contribution Program shows that nonprofits can be “trusted to value their services fairly” (Glancey 2002, 217). Finally, municipalities may wish to estab- lish a limit on the amount that community benefits can reduce a nonprofit’s target cash PILOT. For example, one of the Boston PILOT Task Force’s recommendations was to increase the maximum community bene-fit offset from 25 percent of the cash PILOT to 50 percent (City of Boston 2010).
ALTERNAT IvES TO P I LOT SThere is a wide range of alternatives to formal PILOT programs for cash-strapped municipalities with a substantial or growing nonprofit sector. Table 9 divides the options into those that apply to nonprofits only or to all entities, and distinguishes three types of contributions.
Voluntary Contributions Nonprofits can make direct contributions to their municipalities by providing needed services such as health clinics, legal clinics, or scholarships, often referred to as services in lieu of taxes, or SILOTs. These arrange-ments are very similar to community benefit offsets, but a city can have SILOTs without having a PILOT program. For example, Vanderbilt University does not make a PILOT to Nashville, but does provide police protection for areas of Nashville surround-ing its campus (Nelson 2010). Some analysts believe that municipalities would be better off pursuing partnerships with local nonprofits to provide needed pub-lic services and foster economic development than by seeking PILOTs. For example, the Worcester Regional Research Bureau (2004, 16) concluded that instead of seeking PILOTs “the City [would] be better served by increas-ing the tax base through economic develop-ment projects in collaboration with the insti-tutions of higher learning.”
Contingent ContributionsMunicipal service fees are charged only to nonprofits to pay for government services that taxable entities pay for with property taxes or other general revenues, such as police protection and road maintenance. This option is rarely used because of legal challenges, but since 1973 Minneapolis has levied street maintenance fees against nonprofits based on the square footage
Table 9
ways Municipalities Can Obtain Financial Contributions from Nonprofits
voluntary Contribution Contingent Contribution Compulsory Contribution
Nonprofits Only PILOTs SILOTs
Municipal service fees Tuition tax
All Property Owners
n/a FeesCharges
Special assessments
For-profit entities pay property taxes on all property;
Nonprofits pay property tax on property not used for exempt purposes

42 p o l i c y f o c u s r e p o r t ● l i n c o l n i n s t i t u t e o f l a n d P o l i c y
. . . . . . . . . . . . . . . . . . .
k e n y o n a n d l a n g l e y ● pay m e n t s i n l i e u o f ta x e s 43
of exempt properties. In 2010 this fee is expected to generate $775,000 in revenue from 1,600 tax-exempt organizations in-cluding churches and cemeteries (Hjelle and Hjermstad 2009). User fees are typically paid by nonprofits and for-profit businesses alike, so when mu-nicipalities reduce the proportion of their budgets financed by property taxes and in-crease the proportion financed through user fees this shift in revenue sources will bring in additional revenue from nonprofits. For example, if garbage collection is currently financed through the property tax, a munic-ipality can use a fee instead, and apply that fee to nonprofit organizations as well as other property owners. There are some fees that fall between a user fee (which can be charged to nonprofits) and a tax (which cannot). Fees that fall in this gray area are often litigated in state courts, with the rulings varying by state. In the case of fire protection fees, the highest court in West Virginia ruled that a fire and flood protection fee was not a tax, but the highest court in Massachusetts ruled a Bos-ton fire protection fee to be an unconstitu-tional tax (Youngman 2002, 25–26). Some issues considered by courts include whether the fee is paid by all organizations or only tax-exempt nonprofits, whether property values are the basis used to calculate the fee, and whether the level of payment is directly tied to the amount consumed by the non-profit (i.e., garbage removal) or not (i.e., fire protection). Both nonprofits and other entities usually have to pay special assessments, which are based on property values and used to pay for improvements that benefit specific prop-erties in a municipality. For example, special assessments may be used to pay for sewer hookups for properties in a certain part of a municipality.
Compulsory Contributions Tuition tax proposals have been proposed or considered in several states and municipali-ties, but none has yet been levied. However, three Maryland counties do levy energy taxes solely on nonprofits (Anft 2001, 3). Depending upon the state constitution and state law, a municipality might be able to reduce the amount of property tax reve-nue forgone by limiting the amount of the tax exemption. This can be done by limit-ing the dollar value of the exemption (i.e., exempt values only up to $5 million) or the number of acres that can be exempt. Many nonprofits own property that is not central to their charitable purpose, known as ancillary property. States take different approaches to determining whether ancil-lary property should be tax-exempt (Galla-gher 2002). For example, Dartmouth Col-lege must pay property taxes on dorms and dining halls because they are not exempt under New Hampshire law, but other states do not require colleges to pay property taxes on such ancillary property ( J. F. Ryan Associates 2005, 6). One common critique of the property tax exemption is that it is granted by state governments, but the cost is borne by local governments. Consequently, states may ex-empt a broader range of nonprofits from taxation than they would if they had to bear the full cost of the exemption. In 2002, Vir-ginia voters approved an amendment to the state constitution that transferred authority over granting tax exemptions to local gov-ernments. Fairfax County soon decided to make all future property purchased by non-profits taxable, although existing tax-exempt property was not affected (Shafroth 2005, 811). An alternative way to address this cri-tique is for the state government to provide grants to municipalities hosting tax-exempt nonprofits, as is done in Connecticut.

42 p o l i c y f o c u s r e p o r t ● l i n c o l n i n s t i t u t e o f l a n d P o l i c y k e n y o n a n d l a n g l e y ● pay m e n t s i n l i e u o f ta x e s 43
. . . . . . . . . . . . . . . . . . .C h a p t e r 6
Findings and Recommendations
C haritable nonprofits are generally exempt from property taxation across the United States at the same time that they benefit from
a variety of public services provided by local governments. Some municipalities have at-tempted to recoup part of these public ser-vice costs through payments in lieu of taxes (PILOTs), which are voluntary payments made by nonprofits as a substitute for property taxes. In recent years, municipal revenue pres-sures and greater scrutiny of the nonprofit sector have led to a heightened interest in PILOTs, and since 2000, PILOTs have been used in at least 117 municipalities in at least 18 states. PILOTs typically contribute a small percentage of revenues to city budgets, often less than 1 percent. But the dollar magni-
tudes can be significant, such as Boston’s $15.7 million PILOT from nonprofits in FY2009, and the percentage contribution can be significant in smaller cities, such as in Bristol, Rhode Island, where PILOTs account for 5 percent of the city’s budget. With an annual PILOT of $7.5 million, Yale Univer-sity makes the largest payment among col-leges and universities in the United States. PILOTs are an attempt to compensate for the revenue loss from the property tax exemption for nonprofits and for several problems with that tax exemption. Nation-wide, the forgone revenue from the property tax exemption for nonprofits was estimated at $17 billion to $32 billion in FY2009 in one study, and about 5 percent of total prop-erty tax revenues in another. The percentage varies considerably among cities depending

44 p o l i c y f o c u s r e p o r t ● l i n c o l n i n s t i t u t e o f l a n d P o l i c y
. . . . . . . . . . . . . . . . . . .
k e n y o n a n d l a n g l e y ● pay m e n t s i n l i e u o f ta x e s 45
upon the size of their nonprofit sector and reliance on property tax revenues. A survey of the largest cities in the United States found that the nonprofit tax exemption reduces the property tax base from 10.8 percent in Philadelphia to 1.9 percent in Memphis and El Paso (see figure 5). The charitable property tax exemption for nonprofits has several inherent flaws when viewed as a subsidy to encourage charitable activities—the currently dominant rationale for the exemption. Frequently there is a geo-graphic mismatch between the benefits pro-vided by tax-exempt nonprofits and the cost of the exemption in forgone property tax revenues. While the benefits are broadly dis-persed throughout a metropolitan area, a state, or the nation, the cost of the charita-ble property tax exemption is concentrated in a small number of municipalities, espe-cially center cities and college towns. Additionally, the property tax exemption primarily benefits nonprofits with the most valuable landholdings, not those providing the greatest public benefit. Thus, there are no tax savings for nonprofits that rent, and the greatest tax savings go to large nonprofits,
especially hospitals, universities, and long-term housing facilities. PILOTs can provide crucial revenue for certain municipalities while addressing some of the problems with the charitable proper-ty tax exemption, but there are serious prob-lems with PILOTs as well. Because they are voluntary payments, PILOTs are haphazard and often calculated in an ad hoc manner, with the level of payments normally de-pending more on the aggressiveness of municipal officials than on property values or the amount of public services consumed by nonprofits. As a result, similar nonprofits often pay very different amounts; PILOTs frequently lack transparency and predict-ability; they can strain relations with non-profits; and they often raise little and unreli-able revenue. Given the major differences across municipalities, there is no single set of recommendations: PILOTs are appropri-ate for some municipalities and nonprofits, but not all (table 10). Among its general recommendations, this report suggests that municipalities should work collaboratively with nonprofits when seeking PILOTs to minimize the burden
Table 10
General Recommendations for Municipalities
Recommendation Explanation
PILOTs are not appropriate for all municipalities.
PILOTs can provide crucial revenue for municipalities highly reliant on property tax revenue or with a signifi-cant share of total property value owned by tax-exempt nonprofits. In some cases, legal and administrative costs may outweigh the revenue potential.
PILOTs are not appropriate for all nonprofits.
Municipalities should focus on nonprofits owning large amounts of tax-exempt property and providing modest benefits to local residents relative to their tax savings.
Municipalities should work collaboratively with nonprofits when seeking PILOTs.
This should make local officials more aware of the benefits that nonprofits provide to local residents and the financial constraints they face. Nonprofits may offer suggestions that reduce the burden of PILOTs for their organizations, while still making a financial contribution to the local government.
Negotiating individual PILOT agreements is best for munici-palities with few nonprofits.
Case-by-case negotiation enables consideration of the unique financial constraints for each nonprofit, but can lead to large discrepancies in PILOT amounts among similar nonprofits.
Systematic PILOT programs are best for municipalities with a large number of nonprofits.
This approach promotes horizontal equity among tax-exempt nonprofits, fosters transparency, makes payments more predictable, and may raise more revenue than negotiating individual agreements.
Consider alternatives to PILOTs. Because of the serious pitfalls of PILOTs, alternatives should be considered, ranging from increased user fees to grants from the state to municipalities that host tax-exempt nonprofits.

44 p o l i c y f o c u s r e p o r t ● l i n c o l n i n s t i t u t e o f l a n d P o l i c y k e n y o n a n d l a n g l e y ● pay m e n t s i n l i e u o f ta x e s 45
. . . . . . . . . . . . . . . . . . .
placed on nonprofits for the revenue collected (table 11). Negotiating individual PILOT agreements works best for municipalities with few nonprofits, while a systematic PILOT program is best for municipalities with a large number of nonprofits. For municipalities interested in imple-menting a PILOT program, the Yale–New Haven collaboration and Boston’s PILOT program provide useful models. Yale’s in-volvement with the New Haven community is an example of how a single nonprofit can play a critical economic development role in a troubled city. Boston has long obtained PILOTs from many of its hospitals, colleges, and universities. Recently the mayor created a task force consisting of major stakeholders and charged them with reaching a consen-sus on changes for this voluntary program. The task force illustrates the importance of building support for a PILOT program, and its recommendations cover many important features of a systematic PILOT program. Because of the serious pitfalls of PILOTs, this report also sets forth a menu of alterna-tives to PILOTs that municipalities can use to raise revenue from tax-exempt nonprofits. These options include reaching agreements
with nonprofits to provide requested services in lieu of taxes; increasing reliance on user fees and special assessments, which normally can be charged to tax-exempt organizations; and considering revocation of the property tax exemption for individual properties that are not actively used for nonprofits’ charitable purposes. Broader changes can address a problem of accountability with the charitable proper-ty tax exemption: that is, it is granted by state governments, but the cost is borne by local governments. Connecticut has ad-dressed this problem by making state pay-ments to municipalities that host tax-exempt hospitals and universities, while Virginia has transferred authority over the charitable property tax exemption from the state to local governments. In an era of fiscal constraint, in which both municipalities and nonprofits play critical roles in serving the public, PILOTs are no panacea for cash-strapped local governments. However, PILOTs can provide crucial revenue for certain municipalities, and a well-designed PILOT program can address many of the pitfalls in existing PILOT agreements.
Table 11
Recommendations for Systematic PILOT Programs
Recommendation Explanation
Set a target for contributions. A target is a useful starting point for negotiations, and may be based on the per-centage of local government spending on services directly benefiting nonprofits.
Use a basis to calculate payments.
Using exempt property values as a basis promotes equity, while using square footage as a basis is easier to administer.
Make adjustments for community benefits.
Nonprofits should be able to reduce their cash payments in return for providing certain public services for local residents.
Consider soliciting PILOTs when property is taken off tax rolls.
Nonprofits avoid an unexpected new expense, and municipalities avoid facing a sudden drop in their tax base. However, this significantly erodes the revenue potential of PILOTs. Phasing in property tax exemptions over several years also achieves these goals.
Use a threshold to determine which nonprofits to include.
A threshold level of property value or annual revenues excludes nonprofits lacking the financial resources to make meaningful contributions.
Reach multiyear PILOT agreements.
Long-term agreements reduce uncertainty about future payments for both nonprofits and municipalities.

46 p o l i c y f o c u s r e p o r t ● l i n c o l n i n s t i t u t e o f l a n d P o l i c y
. . . . . . . . . . . . . . . . . . .
k e n y o n a n d l a n g l e y ● pay m e n t s i n l i e u o f ta x e s 47
r e f e r e n C e s
Anderson, Gerard F. 2007. From ‘soak the rich’ to ‘soak the poor’: Recent trends in hos-pital pricing. Health Affairs 26(3): 780–789.
Anderson, Nathan B. 2006. Property tax limitations: An interpretive review. National Tax Journal 59(3): 685–694.
Anft, Michael. 2001. Broaching the topic of taxation. The Chronicle of Philanthropy 13(18): 43–45.
Appleseed Economic Development Consul-tants. 2003. Engines of economic growth: The economic impact of Boston’s eight research universities on the metropolitan Boston area. March.
Augustine, Nancy Y., Michael E. Bell, David Brunori, and Joan M. Youngman. 2009. The property tax under siege. In Erosion of the prop-erty tax base: Trends, causes and consequences, eds. Nancy Y. Augustine, Michael E. Bell, David Brunori, and Joan M. Youngman, 1–16. Cam-bridge, MA: Lincoln Institute of Land Policy.
Boris, Elizabeth T. 1999. The nonprofit sector in the 1990s. In Philanthropy and the nonprofit sector in a changing America, ed. Charles Clotfelter and Thomas Ehrlich, 1–33. Bloomington, IN: Indiana University Press.
Boston Assessing Department. 2010. Email correspondence. September 15.
Bowman, Woods. 2002. Institutional property-tax exemption in theory and practice. Working Paper. Cambridge, MA: Lincoln Institute of Land Policy.
Bowman, Woods and Marion R. Fremont-Smith. 2006. Nonprofits and state and local governments. In Nonprofits and government: Col-laboration and conflict, ed. Elizabeth T. Boris and C. Eugene Steuerle, 181–213. Washington, DC: Urban Institute Press.
Bowman, Woods, Joseph Cordes, and Lori Metcalf. 2009. Preferential tax treatment of property used for social purposes: Fiscal im-pacts and public policy implications. In Erosion of the property tax base: Trends, causes, and consequences, ed. Nancy Y. Augustine, Michael E. Bell, David Brunori, and Joan M. Youngman, 269–294. Cambridge, MA: Lincoln Institute of Land Policy.
Brody, Evelyn. 2005. Nonprofit organizations, payments in lieu of taxes (PILOTs). In The encyclopedia of taxation and tax policy, ed. Joseph J. Cordes, Robert D. Ebel, and Jane G. Gravelle, 275–276. Washington, DC: Urban Institute Press.
Brody, Evelyn. 2007. The states’ growing use of a quid-pro-quo rationale for the charity property tax exemption. The Exempt Organization Tax Review 56(3): 269–288.
Brody, Evelyn. 2010a. All charities are prop-erty-tax exempt, but some charities are more exempt than others. 44 New England Law Review 621.
Brody, Evelyn. 2010b. Payments in lieu of taxes: ‘Contributions,’ say the towns; ‘Extortion’ say the colleges. The Chronicle of Higher Education 56(21): 88.
Brophy, Paul C., and Rchel D. Godsil. 2009. Anchor institutions as partners in building successful economies and local economies. In Retooling HUD for a catalytic federal government: A report to Secretary Shaun Donovan. Philadelphia: Penn Institute for Urban Research, University of Pennsylvania. February.
Carbone, Nicholas, and Evelyn Brody. 2002. PILOTs: Hartford and Connecticut. In Property-tax exemption for charities, ed. Evelyn Brody, 233–252. Washington, DC: Urban Institute Press.
Census of Governments. U.S. Census Bureau. Data from the Urban Institute–Brookings Institution Tax Policy Center. State and Local Government Finance Data Query System. http://www.taxpolicycenter.org/slf-dqs/pages.cfm
Chang, Cyril, and Howard Tuckman. 1990. Do higher property tax rates increase the market share of nonprofit hospitals? National Tax Journal 43(2): 175–187.
Chronicle of Higher Education. 2010. What some universities agree to pay local govern-ments in lieu of taxes. The Chronicle of Higher Education 56(21).
City of Boston. 2008. FY2009 Summary Budget. http://www.cityofboston.gov/TridionImages/02%20Summary%20Budget_ tcm1-3153.pdf
City of Boston. 2009. Mayor’s PILOT task force: Interim report. September 16. www.cityofboston.gov/assessing/PILOT.asp
City of Boston. 2010. PILOT task force: Executive summary of final report. April 12. http://www.cityofboston.gov/assessing/PILOT.asp
City of Cambridge. 2009. Comprehensive Annual Finance Report, July 1, 2008–June 30, 2009.
City of Cambridge. 2010. PILOT request letter. February 6.
Columbo, John D. 2010. Analysis of Provena decision. Nonprofit Law Prof Blog. March 18. http://lawprofessors.typepad.com/nonprofit
Connoly, Ceci. 2005. Tax-exempt hospitals’ practices challenged; 46 lawsuits allege that uninsured pay the most. The Washington Post, January 29.
Cordes, Joseph J., Marie Gantz, and Thomas Pollak. 2002. What is the property-tax exemp-tion worth? In Property-tax exemption for charities, ed. Evelyn Brody, 81–112. Washington, DC: Urban Institute Press.
Cordes, Joseph J. and C. Eugene Steuerle, eds. 2010. Nonprofits and business. Washington, DC: Urban Institute Press.
Diamond, Stephen. 2002. Efficiency and benevolence: Philanthropic tax exemptions in 19th-century America. In Property-tax exemption for charities, ed. Evelyn Brody, 115–144. Washington, DC: Urban Institute Press.
Fanning, Mary M. 2008. Nonprofit healthcare institutions, property tax exemptions, and poli-cy implications from recent court cases. Paper presented at Midwest Political Science Associa-tion Annual National Conference. April 3–6.
Fischel, William A. 2001. Municipal corpora-tions, homeowners and the benefit view of the property tax. In Property taxation and local govern-ment finance, ed. Wallace E. Oates, 33–78. Cam-bridge, MA: Lincoln Institute of Land Policy.
Flint, Anthony. 2002. Harvard, Watertown set for deal for lost taxes. Boston Globe, September 25: A1.
Gallagher, Janne. 2002. The legal structure of property tax exemption. In Property-tax exemption for charities, ed. Evelyn Brody, 3–22. Washington, DC: Urban Institute Press.
Glancey, David B. 2002. PILOTs: Philadelphia and Pennsylvania. In Property-tax exemption for charities, ed. Evelyn Brody, 211–232. Washing-ton, DC: Urban Institute Press.

46 p o l i c y f o c u s r e p o r t ● l i n c o l n i n s t i t u t e o f l a n d P o l i c y k e n y o n a n d l a n g l e y ● pay m e n t s i n l i e u o f ta x e s 47
. . . . . . . . . . . . . . . . . . .
Gose, Ben. 2010. Nonprofit CEO pay comes under scrutiny by state legislators looking to tighten belts. The Chronicle of Philanthropy 22(16): 8.
Hansmann, Henry. 1987. The effect of tax exemption and other factors on the market share of nonprofit versus for-profit firms. National Tax Journal 40(1): 71–82.
Hjelle, Brette, and Suzette Hjermstad. 2009. Memo to Sandra Colvin Roy. Nongovern-mental tax exempt parcel street maintenance assessment. Public hearing, October 20. www.ci.minneapolis.mn.us/council/2009-meetings/ 20091030/docs/03_Street_Maintenance_ Assessment_RCA.pdf
Hoene, Christopher W., and Michael A. Pagano. 2009. City fiscal conditions in 2009: Research brief on America’s cities. Washington, DC: National League of Cities. September.
Hospital Utilization Project v. Commonwealth of Pennsylvania, 487 A.2d 1306 (Pa. 1985).
J. F. Ryan and Associates. 2005. Springfield financial control board project plan: Establish-ment of a payment in lieu of tax program (PILOT). September 16.
Kelderman, Eric. 2010. Colleges and cities square off over taxes. The Chronicle of Higher Education 56(21): 30–32.
Kodrzycki, Yolanda, and Ana Patricia Munoz. 2009. Lessons from resurgent cities. Federal Reserve Bank of Boston 2009 Annual Report: 9–31.
Leland, Pamela. 1994. Responding to a prop-erty tax challenge: Lessons learned in Pennsyl-vania. 7 State Tax Notes 927. August 1.
Leland, Pamela. 1995. Exploring challenges to nonprofit status: issues of definition and access in community-based research. The American Behavioral Scientist 39(5): 587–601.
Leland, Pamela. 2002. PILOTs: The large city experience. In Property-tax exemption for charities, ed. Evelyn Brody, 193–210. Washington, DC: Urban Institute Press.
Lemov, Penelope. 2010. Taxing away an exemption: With revenue down, states and localities are taking a second look at tax- exempt organizations. Governing, March 17.
Light, Paul C. 2008. How Americans view charities: A report on charitable confidence, 2008. Brookings Institution, Issues in Gover-nance Studies. November.
Lipman, Harvy. 2006a. The value of a tax break. The Chronicle of Philanthropy 19(4): 13.
Lipman, Harvy. 2006b. Cities take many approaches to valuing tax-exempt property. The Chronicle of Philanthropy 19(4): 14.
MacDowell Colony. 2008. MacDowell prevails in legal case. March 14. www.macdowellcolony.org
Marcelo, Philip. 2009. Providence looking for more from nonprofit institutions. The Providence Journal, May 12.
Massachusetts Department of Revenue. 2003. A study of charitable and educational property tax exemptions: FY2003 impact of MGL 59 §5 cl 3. Division of Local Services. December.
McArdle, Regina, and Donna Demirai. 2004. A study of charitable and educational property tax exemptions. City and Town, January. Mas-sachusetts Department of Revenue, Division of Local Services. http://www.mass.gov/Ador/docs/dls/publ/ct/2004/january.pdf
McEachern, William. 1981. Tax-exempt property, tax capitalization, and the cumula-tive-urban-decay hypothesis. National Tax Journal 34(2): 185–192.
McFarland, Christiana. 2010. State of America’s cities survey on jobs and the economy. Research brief on America’s cities. Washington, DC: National League of Cities. May.
Methodist Old Peoples Home v. Korzen, 223 N.E. 2d 537 (Ill. 1968).
Minnesota Budget Project and Property Tax Study Project. 2000. Cost estimate of payments in lieu of taxes on charitable institutions and nonprofits. December 12.
Minnesota Taxpayers Association. 1999. 50-state property tax comparison study. St. Paul, MN: Minnesota Taxpayers Association.
National Center for Charitable Statistics. 2010. Washington, DC: The Urban Institute. http://nccs.urban.org
National Council of Nonprofits. 2010. State budget crisis: Ripping the safety net held by nonprofits. March 16.
Nelson, Libby. 2010. How other universities contribute to their communities. The Chronicle of Higher Education 56(21).
Netzer, Dick. 2002. Local government finance and the economics of property-tax exemption. In Property-tax exemption for charities, ed. Evelyn Brody, 47–80. Washington, DC: Urban Institute Press.
Northwestern University v. City of Evanston, 2002 U.S. Dist. LEXIS 17104, *25 (N.D. Ill. Sept. 11, 2002).
Perry, Jack. 2003. Cicilline, 4 colleges reach pact on voluntary payments. Providence Journal, June 5.
Provena Covenant Medical Center v. The Department of Revenue, 925 N.E. 2d 1131 (Ill. 2010).
Quigley, John M., and Roger W. Schmenner. 1975. Property tax exemption and public policy. Public Policy 23 (Summer): 259–278.
Schiller, Zach. 2004. Memo to James Rokakis, Cuyahoga County, Ohio County Treasurer. Policy Matters Ohio. December 17. www. policymattersohio.org/pdf/HospitalPILOTs_2004_ 12.pdf
Shafroth, Frank. 2005. The case of nonprofits and their tax effects on state and local govern-ments. State Tax Notes. March 14.
Sherlock, Molly F., and Jane G. Gravelle. 2009. An overview of the nonprofit and charitable sector. Washington, DC: Congressional Research Service. November 17.
Shortsleeve, Joe. 2009. I-Team: Some non-profits not required to pay taxes. WBZ News. April 23. http://wbztv.com/iteam/item.property.taxes.2.993075.html
State of Connecticut. 2008. Office of Policy and Management, Intergovernmental Policy Division. Description for colleges (private) and general/free standing chronic disease hospitals: Payments in lieu of taxes.
State of Rhode Island. 2009. Fiscal year 2010 state aid to cities and towns.
Strom, Stephanie. 2010. States move to revoke charities’ tax exemptions. New York Times, February 27.
Sungu-Eryilmaz, Yesim, and Rosalind Green-stein. 2010. Town–gown cooperation in com-munity development. Communities and Banking Summer: 8–10. Federal Reserve Bank of Boston.
Swords, Peter. 2002. The charitable real property tax exemption as a tax-base-defining provision. In Property-Tax Exemption for Charities, ed. Evelyn Brody, 377–382. Washington, DC: Urban Institute Press.
Town of Peterborough v. The MacDowell Colony, Inc. 943 A.2d 768 (N.H. 2008).
Urbina, Ian. 2009. Pittsburg Mayor strikes a deal to abandon tuition tax. New York Times, December 22.

48 p o l i c y f o c u s r e p o r t ● l i n c o l n i n s t i t u t e o f l a n d P o l i c y
. . . . . . . . . . . . . . . . . . .
U.S. Department of the Interior. 2010. Payments in lieu of taxes. http://www.doi.gov/pilt/index.html
Utah County v. Intermountain Health Care Inc., 709 P.2d 265 (Utah 1985).
Walker, David M. 2005. Tax-exempt sector: Governance, transparency and oversight are critical for maintaining public trust. Testimony before the House Committee on Ways and Means by Comptroller General of the United States. Washington, DC: U.S. Government Accountability Office. April 20.
Weisbrod, Burton A. 2004. The pitfalls of profits. Stanford Social Innovation Review Winter: 40–47.
Wing, Kennard T., Thomas H. Pollak, and Amy Blackwood. 2008. Nonprofit almanac: 2008. Washington, DC: Urban Institute Press.
Worcester Regional Research Bureau. 2004. Will PILOTs fly in Worcester? Taxing non-profits and other options. March 24. www. wrrb.org/reports/04-04pilot.pdf
Yinger, John, Howard S. Bloom, Azel Borsch-Supan, and Helen F. Ladd. 1988. Property taxes and house values: The theory and estimation of intra-jurisdictional property tax capitalization. San Diego: Academic Press.
Youngman, Joan M. 2002. The politics of the property-tax debate: Political issues. In Property-Tax Exemption for Charities, ed. Evelyn Brody, 23–46. Washington, DC: Urban Institute Press.
Yue, Lorene, and Mike Colias. 2010. Illinois Supreme Court upholds ruling against Provena in tax-exempt case. Crain’s Chicago Business, March 18.
Zapana, Victor. 2009. Yale to up payment to city. Yale Daily News, February 27.
ACKNOwLEdGMENTS
We are grateful to Bethany Paquin for her able research assistance and comments on report drafts, which contributed significantly to the quality of this report. Michael Laderman also provided valuable research assistance by collecting extensive information about municipalities’ use of PILOTs. We thank the following Lincoln Institute staff and fellows for their helpful comments on the work in progress and other contributions: Richard Dye, professor at the Institute of Government and Public Affairs, University of Illinois, and visiting fellow at the Lincoln Institute; Gregory K. Ingram, presi-dent and CEO; Ann LeRoyer, senior editor and director of publications; Jane Malme, fellow; Emily McKeigue, managing editor; and Joan Youngman, senior fellow and chairman of the Institute’s Department of Valuation and Taxation. These outside reviewers also helped improve the report with their careful reading and insightful comments:
• Evelyn Brody, Professor, Chicago-Kent College of Law;
• Pamela Leland, Principal and Founder, The Leland Leadership Group, LLC; and
• David Sjoquist, Director, Fiscal Research Center, Andrew Young School of Policy Studies, Georgia State University.
In addition, special thanks go to the following Massachusetts-based individuals who participated in a September 2010 review session on the draft report:
• James A Chiavelli, Communications Director, Office of Government Relations and Community Affairs, Northeastern University
• Stephen Cirillo, Director of Finance, Town of Brookline
• Richard Doherty, President, Association of Independent Colleges and Universities in Massachusetts
• John Erwin, Executive Director, Conference of Boston Teaching Hospitals
• Andrew Johnson, Assessing Department, City of Cambridge
• Eric A. Lustig, Professor, New England Law School, Boston
• Kevin A. McCluskey, Senior Director of Community Relations for Boston, Harvard University
• Ronald W. Rakow, Commissioner of Assessing, City of Boston
• John Robertson, Deputy Legislative Director, Massachusetts Municipal Association
Although the authors took reviewer comments seriously in crafting their recommendations, the final report’s recommendations are not meant to represent the views of the individuals or organizations listed above.

48 p o l i c y f o c u s r e p o r t ● l i n c o l n i n s t i t u t e o f l a n d P o l i c y
ABO uT ThE AuThORS
daphne A. Kenyon is a visiting fellow in the Lincoln Institute’s Department of Valuation and Taxation and principal of D. A. Kenyon & Associates, Windham, New Hampshire. She has worked on a wide range of public finance issues as professor of economics at Dartmouth College and Simmons College, as a policy analyst for nonprofits and government, and as a consul-tant. She currently sits on the New Hampshire State Board of Education and the Education Commission of the States.
Adam h. Langley is a research analyst in the Lincoln Institute’s Department of Valuation and Taxation, where he has coauthored papers on property tax relief programs, education finance, and state-local government fiscal relationships. He earned his B.A. in political studies from Bard College, and is currently a master’s student in economics at Boston University. He previously worked in the New York State Assembly.
ABOuT ThE L INCOLN INST I TuTE OF LANd P OL ICY www.lincolninst.edu
The Lincoln Institute of Land Policy is a leading resource for key issues concerning the use, regulation, and taxation of land. Providing high-quality education and research, the Institute strives to improve public dialogue and decisions about land policy. As a private operating foundation whose origins date to 1946, the Institute seeks to inform decision making through education, research, policy evaluation, demonstration projects, and the dissemination of information, policy analysis, and data through our publications, Web site, and other media. By bring- ing together scholars, practitioners, public officials, policy makers, journalists, and citizens, the Lincoln Institute integrates theory and practice and provides a nonpartisan forum for multi-disciplinary perspectives on public policy concerning land, both in the United States and internationally.
Ordering Information
To download a free copy of this report or to order copies of the printed report, visit www.lincolninst.edu and search by author or title. For additional information on discounted prices for bookstores, multiple-copy orders, and shipping and handling costs, send your inquiry to [email protected].
Production Credits
P RO J E C T M A NAG E R & E D I TO RAnn LeRoyer
D E S I G N & P RO D U C T I O N DG Communications/NonprofitDesign.com
P R I N T I N G Recycled Paper Printing, Boston
Photographs
iStockphoto.com: front cover, 2, 3, 4, 8, 13, 14, 16, 19, 29, 43, back cover left & right
Thinkstock.com: 10, 31, 35, back cover centerCreative Commons: 20, 25MacDowell Colony: 24 New Hampshire Food Bank: 34Joan Youngman: 37
113 Brattle StreetCambridge, MA 02138-3400 USA
Phone: 617-661-3016 or 800-LAND-USE (800-526-3873)
Fax: 617-661-7235 or 800-LAND-944 (800-526-3944)
Web: www.lincolninst.eduEmail: [email protected]
92%
Cert no. SCS-COC-001366

Payments in Lieu of TaxesBalancing Municipal and Nonprofit Interests
ISBN 978-1-55844-216-0Policy Focus Report/Code PF028
In recent years, local government revenue pressures have led to heightened interest in payments in lieu of taxes (PILOTs), which are payments made voluntarily by tax-exempt nonprofits as a substitute for property taxes. Over the last decade PILOTs have been used in at least 117 municipalities in at least
18 states. PILOTs can provide crucial revenue for certain municipalities, and are one way to make charitable nonprofits—which are exempt from property taxation in all 50 states—help pay for the public services they consume. However, PILOTs are often haphazard, secretive, and calculated in an ad hoc manner that results in widely varying payments among similar nonprofits. In this report Daphne A. Kenyon and Adam H. Langley, visiting fellow and research analyst at the Lincoln Institute of Land Policy respectively, explore PILOT use across the United States within the context of municipal revenue pressures and the property tax exemption for nonprofits, and they make these recommendations.
• PILOTs are one revenue option for municipalities. PILOTs are most appropriate for municipalities that are highly reliant on the property tax and have a significant share of total property value owned by nonprofits. PILOTs are also most suitable for nonprofits that own large amounts of tax-exempt property and provide modest benefits to local residents relative to their tax savings.
• Municipalities should work collaboratively with nonprofits when seeking PILOTs. Because PILOTs are voluntary payments and because both nonprofits and municipalities share a commitment to serving the general public, the best PILOT initiatives arise out of partnerships between municipalities and non- profit organizations. Boston’s PILOT program and the agreement between Yale University and New Haven are examples of successful collaborative arrangements.
• State and local governments should consider alternatives to PILOTs. Because there can be problems with PILOTs, this report also sets forth alternatives for augmenting municipal revenues. State governments should consider providing grants to local governments that host tax-exempt nonprofits to compensate them for their loss of property tax base, as in Connecticut. Municipalities can also consider such alter- natives as user fees, charges, and special assessments, which are paid by both nonprofits and for- profit entities.
ISBN 978-1-55844-216-0


