21
PBMS Strategic Planning Meeting November 13 – 14, 2014 1 Display A
| Date post: | 26-Dec-2015 |
| Category: |
Documents |
| Upload: | randall-reynolds |
| View: | 216 times |
| Download: | 0 times |

Display A
1
PBMSStrategic Planning Meeting
November 13 – 14, 2014

Display A
2
ParticipantsWho Braved the Cold and Snow?

Display A
3
ParticipantsName Agency PBMS RoleScott Abbott WY PBMS UserJeremy Barclay KS PBMS UserBonnie Barr CO PBMS UserJennifer Batcher FBOP PBMS UserLeann Bertsch ND Director/PMCBrittany Brothers ASCA ASCA Administrative SupportGeorge Camp ASCA Executive Co-DirectorElizabeth Carson BJS Federal PartnerJudi Simon Garrett FBOP PBMS UserJennifer Guild IA PBMS UserOsman Hamdan CO PBMS UserPatricia Hardyman ASCA PBMS System AdministratorTim Heater ATG Software DeveloperBob Lampert WY PMC ChairLettie Prell IA PBMS UserCharles Ryan AZ Director/PMCBeLinda Watson NIC NIC Program Manager

Display A
4
AgendaDay One – Thursday November 13th
Welcome and Introductions
Overview of Strategic Planning Process
Long-Term Goals For PBMS – Utility, Software Development, & Benchmarks
Review and Update 3-Year Priority list
Participation Issues and Strategies to Solve Them
Where Do We Go From Here — PBMS Website and Dashboard?
Day Two – Friday November 14th
Good Morning and Any Follow-up Issues from Monday?
Review of Draft Revised PBMS Key Indicators
Display A
We have come long way?.…Siri, where do we go from here?
5

Display A
6Objectives of This Meeting1. Long-Term Goals For PBMS – Utility, Software Development,
& Benchmark
2. Review Participation Issues and Develop Strategies
3. Identify desirable changes to PBMS and Dashboard
Goal: 3-Year Priority To Do List!!

Display A
7
Participation IssuesStrategies to Solve Them

Display A
Participation Strategies – 2014 Suggestions
Reach out to National Governors Association to encourage participation.
Tout PBMS counting rules as means of collecting consistent data.
Focus on “wow factor” that will intrigue people.
Streamline data implement automated feed and data sharing.
Share success stories and best practices in ASCA’s Corrections Directions newsletter.
Use green, amber, red tracking to show changes in rates of key indicators.
8
ASCA

Display A
Participation Strategies – 2014 Suggestions
WebX/Webinar training on how to use reports for key people in agencies.
Create best practices list to show how agencies are using PBMS (especially blue states).
Create and send out survey to find out how agencies are using PBMS.
Encourage Directors to make PBMS a priority – entire agency.
Draft letter asking Directors to give suggestions to increase participation.
Facilitate upload process -- rewrite extraction program.
9
ASCA Activities

Display A
Participation Strategies – 2014 Suggestions
Give notice when map is going to change.
Develop benchmarking.
Hire dedicated staff for PBMS within agencies/ASCA.
Change color coding – Some do not want to be “pink.”
Bring large jail systems together since they are not inputting data. Send letter and arrange single meeting to discuss concerns and suggestions to overcome their obstacles.
Start collecting data through ASJ (Annual Survey of Jails) or other DOJ surveys.
10ASCA, Agencies & Partners

Display A
Participation Strategies – 2014 Suggestions
Require staff to use PBMS and participate in WebX training -- once it’s up and running.
Make PBMS a priority.
Provide grants for states to facilitate process/rewrite extraction program.
If Agency and PBMS definitions do not match – Agencies can suggest changes or adjust agency data collection.
Repeat follow-up efforts in different ways to show PBMS is not going away.
11
Agencies and Partners

Display A
12
Participation – Where do We Go From Here?

Display A
13
Where Do We Go From Here
PBMS Website and Dashboard?

Display A
14Suggested Upgrades to PBMS Web Site Develop Yellow, Red, and Purple warning messages on the data entry screens
and data upload screen to notify PBMS users if data deviate from 1 or 2 deviations from mean (last 12 mos), missing denominators, or missing data.
Develop benchmarking - Task for PMC.
Automated uploads between agency data base and PBMS web site.
Suppress entering each facility’s data until the organization data is ready Option indicate on report number facilities reporting for agency, e.g., 11 of 12 facilities.
Roll facility characteristics up to agency characteristics (little overlap between agency and facility-level characteristics reported to pbms.
Create option on the Comparative Organization and Facility Reports for selecting range of months, quarters, or years (rather just months).
Display A
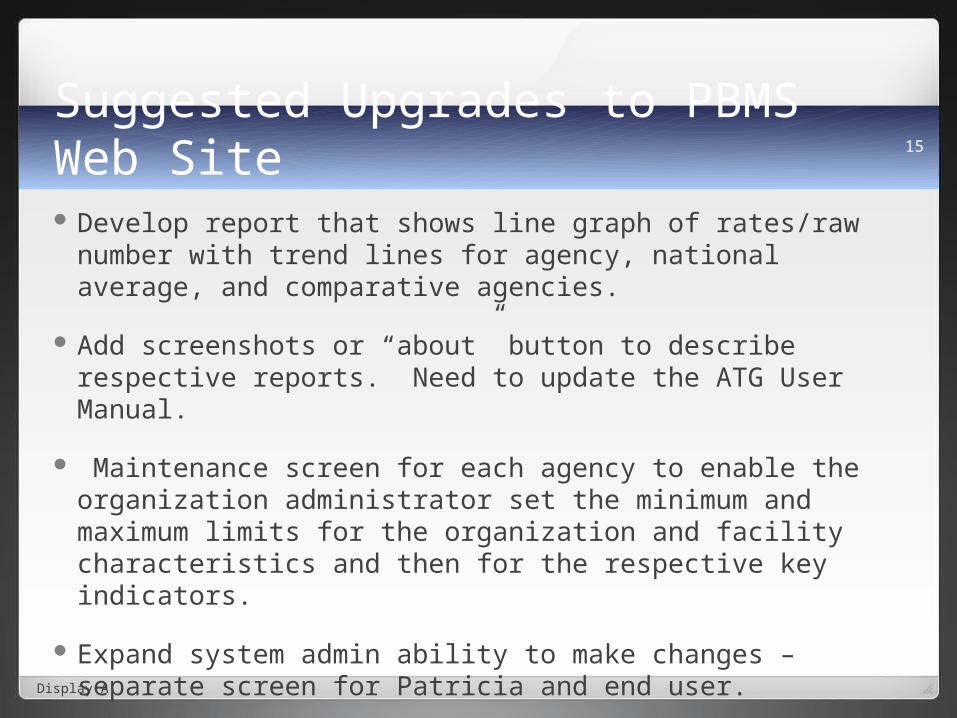
15Suggested Upgrades to PBMS Web Site Develop report that shows line graph of rates/raw number with trend lines
for agency, national average, and comparative agencies.
Add screenshots or “about” button to describe respective reports. Need to update the ATG User Manual.
Maintenance screen for each agency to enable the organization administrator set the minimum and maximum limits for the organization and facility characteristics and then for the respective key indicators.
Expand system admin ability to make changes – separate screen for Patricia and end user.
Create screen for linking facilities to facility users .

Display A
16Suggested Upgrades to PBMS Web Site Add screenshots or “about” button to describe respective reports. Need to
update the ATG User Manual.
Maintenance screen for each agency. – The option of creating key indicators and characteristic “maintenance” screens within under the Organization Administration menu to enable the organization administrator set the minimum and maximum limits for the organization and facility characteristics and then for the respective key indicators.
Expand system admin ability to make changes – separate screen for Patricia and end user.
Screen for linking facilities to facility users.
Develop a pre-audit instrument.
Display A
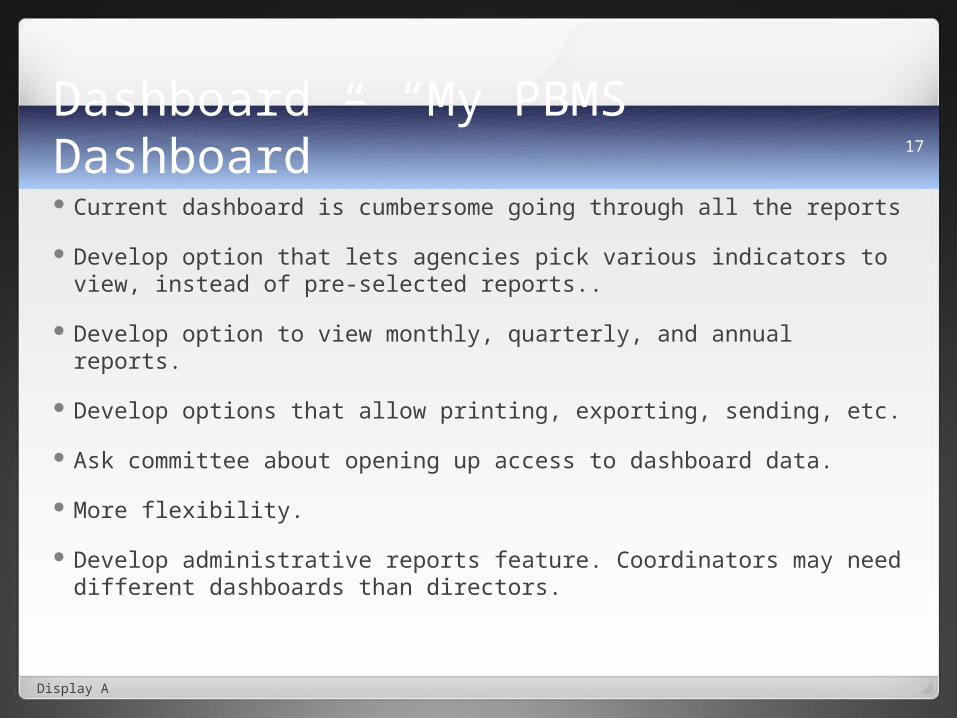
17Dashboard – “My PBMS Dashboard” Current dashboard is cumbersome going through all the reports
Develop option that lets agencies pick various indicators to view, instead of pre-selected reports..
Develop option to view monthly, quarterly, and annual reports.
Develop options that allow printing, exporting, sending, etc.
Ask committee about opening up access to dashboard data.
More flexibility.
Develop administrative reports feature. Coordinators may need different dashboards than directors.
Display A
18
Day 2: Review of Draft Revised PBMS Key Indicators
Organization Characteristics and Key IndicatorsOrganization Inmate Population
ASCA Restrictive Housing Resolution

Display A
19
PROPOSED
Inmates in facilities operated by the DOC.
Inmates housed in facilities operated by other states’ correctional facilities under a contract for bed space. (Exclude -- inter-state compact cases.)
Inmates housed in facilities not operated by the DOC, such as county or regional jail facilities or facilities operated by private vendors.
Exclude inmates under the inter-state compact agreement; these inmates should be counted by the receiving state.
Exclude offenders housed in the DOC facilities as “safe keepers,” i.e., for an evaluation/diagnostic assessment or as a courtesy for a local facility or law enforcement agency.
PROBLEM: Inmates housed in Community Corrections facilities/status. Compiling reliable org key indicator data would be difficult for some agencies, e.g., medical, mental health services, substance treatment, education, etc.
Organization Inmate Population -- last day of a given month:

Display A
20
Restrictive HousingASCA Resolution # 24

Display A
Thank You! Safe Travels! Good bye!
21
GO BLUE!!


