A Global High Shift Cycling Scenario: The Potential for Dramatically Increasing Bicycle and E-bike Use in Cities Around the World, with Estimated Energy, CO2, and Cost Impacts 12 November 2015 By the Institute for Transportation & Development Policy and the University of California, Davis Jacob Mason, Lew Fulton, Zane McDonald Research commissioned by the Union Cycliste Internationale (UCI), the European Cyclists’ Federation (ECF), and the Bicycle Product Suppliers Association (BPSA)
Transcript
A Global High Shift Cycling Scenario: The Potential for Dramatically Increasing Bicycle and E-bike Use in Cities Around the World, with Estimated Energy, CO2, and Cost Impacts
12 November 2015
By the Institute for Transportation & Development Policy and the University of California, Davis
Jacob Mason, Lew Fulton, Zane McDonald
Research commissioned by the Union Cycliste Internationale (UCI), the European Cyclists’ Federation (ECF), and the Bicycle Product Suppliers Association (BPSA)
2 | A Global High Shift Cycling Scenario
Acknowledgments
The authors wish to thank Union Cycliste Internationale (UCI), the European Cyclists’
Federation (ECF), and the Bicycle Product Suppliers Association (BPSA) for their generous
financial support that made this research possible, particularly our primary contacts there,
Chris Peck, Kevin Mayne, and Bob Margevicius. We also thank the individuals who participated
in meetings of the advisory committee for this study, providing data and insight on cycling
and e-bike use around the world. Members of that group include Christopher Peck, Kevin
Mayne, Carlofelipe Pardo, Christopher Cherry, Bob Margevicius, Michael Replogle, Randy
Neufeld, Alejandra Leal, Geetam Tiwari, and S. K. Jason Chang.
Without that support we would not have had the data or insight to conduct the global level
of scenario building and analysis that was completed. Finally, the authors thank all the
members of the Research Team at UC Davis who carried out much of the data gathering,
data cleaning, and data refinement and analysis work. We thank also the contributions
of Stephen Robert Kulieke and Katie Rustad of UC Davis and Jemilah Magnusson, Gabriel
Lewenstein, and Aimee Gauthier, of ITDP, and Zoé Kruchten and Elina Baltatzi of ECF who
helped manage strategic communications.
There are many other people too numerous to name who helped this project succeed and we
thank them. Of course the flaws in the end product are the responsibility of the authors alone.
Authors
Research commissioned by
November 2015 itdp.org | 3
ContentsExecutive Summary 4
Cycling and E-biking: Status and Potential 4
Key Results of the New High Shift Cycling Scenario 5
Conclusions/Recommendations 6
1. Introduction 8
2. Cycling Around the World Today—Data and Baseline Setting 10
Bicycle Mode Share Data 10
E-biking 13
Bicycle and E-bike Sales 15
Bike Sharing 16
3. Cycling BAU Scenario 18
BAU Projections for E-biking 18
BAU Policy Narrative 20
4. High Shift Cycling Scenario 21
Modal Shift Impacts of the High Shift Cycling Scenario 24
Impacts on Energy Use and CO2 Emissions 29
Costs and Savings Associated with the High Shift Cycling Scenario 31
Cost Assumptions 31
Cost Results 32
5. The High Shift Scenario: A Policy Narrative 34
Regions with Low Cycling 36
Regions with Moderate Cycling 37
Regions with High Cycling 38
Implications for COP 21 38
Conclusions/Next Steps 39
References 40
4 | A Global High Shift Cycling Scenario
The report builds on the 2014 study A Global High Shift Scenario: Impacts and Potential for More Public Transport, Walking, and Cycling with Lower Car Use. That report provided a global assessment of the potential for increasing travel on sustainable, efficient modes while concurrently developing cities that are far less car-dependent. However, the role of cycling in the previous study could be considered relatively minor, with the global average urban mode share increasing by three percentage points in 2030 (from 3 to 6 percent of total travel).2 A number of supporters/users and contributors to the previous report felt that the role of cycling might have been understated in that study. The authors rec-ognized that those comments might be valid because within the wider study there was limited capacity to consider cycling in detail. This report explores just how much is possible if we study cycling in more detail using the same approach. The result is the most com-prehensive picture ever of global urban cycling activity.
Both the 2014 study and the High Shift Cycling Study focus on urban areas, which are projected to have the greatest growth in demand for travel. Given the higher densities of people, services, and jobs that are possible in cities, as opposed to rural areas, cities inherently have the greatest potential to direct the growing demand for travel to sustainable modes and to cycling in particular.
This study uses the same basic method-ology as the previous study, including the development of business-as-usual and high shift scenarios. However, it provides a number of new contributions over the previous study.
We have:
• Undertaken a bigger effort to collect and tabulate data on cycling and electric bicycle (e-bike) ridership around the world, finding higher ridership levels than previ-ously estimated;
• Developed better estimates of recent cycling trends by region;
• Created the new High Shift Cycling (HSC) scenario for 2030 and 2050, taking into account cities that currently have high cycling levels, typical trip distances, and other factors;
• Reestimated the potential impacts of high cycling and e-biking levels on energy use, CO2 emissions, and a range of cost factors.
Cycling and E-biking: Status and Potential
The extensive data collection undertaken for this project reveals that more cities and countries than previously considered already have high cycling (and e-bike) mode shares. Based on our new database, it is estimated that in 2015 bicycles/e-bikes account for about 6 percent of urban trips worldwide. However, more than half of documented cycling trips occur in China, Japan, and a few European countries such as the Netherlands and Den-mark. In the United States and Canada urban cycling is estimated to account for only about 1 percent of trips. (These values include only utility trips such as commuting or shopping—not recreational cycling.) Recent trends suggest that mode shares and cycling levels per capita
Executive SummaryCycling plays a major role in personal mobility around the world, but it could play a
much bigger role. Given the convenience, health benefits, and affordability of bicycles,
they could provide a far greater proportion of urban passenger transportation, helping
reduce energy use and CO2 emissions worldwide.1 This report presents a new look at
the future of cycling for urban transportation (rather than recreation), and the potential
contribution it could make to mobility as well as sustainability. The results show that a
world with a dramatic increase in cycling could save society US$24 trillion cumulatively
between 2015 and 2050, and cut CO2 emissions from urban passenger transport by nearly
11 percent in 2050 compared to a High Shift scenario without a strong cycling emphasis.
November 2015 itdp.org | 5
are at best increasing slowly in most of the developed world, and are declining in many industrializing countries. These trends are pre-served in our BAU scenario, leading to a mode share that is relatively unchanged worldwide by 2030.
Yet in considering the bigger potential for increasing cycling levels in the future, the more successful cities today can serve as models. Cities such as Amsterdam and Copenhagen are well known, though York in the United Kingdom; Davis, California; and many cities in India, China, and other countries around the world have cycling mode shares well over 15 percent of trips.3 Not all cities may be able to reach such levels, but there is one fact that suggests that the potential is large: in cities and countries where data is available, typi-cally more than half of all trips are less than 10 kilometers.4 Even in the United States more than 35 percent of trips are less than 5 kilo-meters, a distance typically covered in twenty minutes or less. A number of such trips should be “cyclable” for many, or at least amenable to travel via e-bikes. The question becomes how to unlock this potential. If it can be unlocked, the benefits will be substantial.5
Key Results of the New High Shift Cycling Scenario
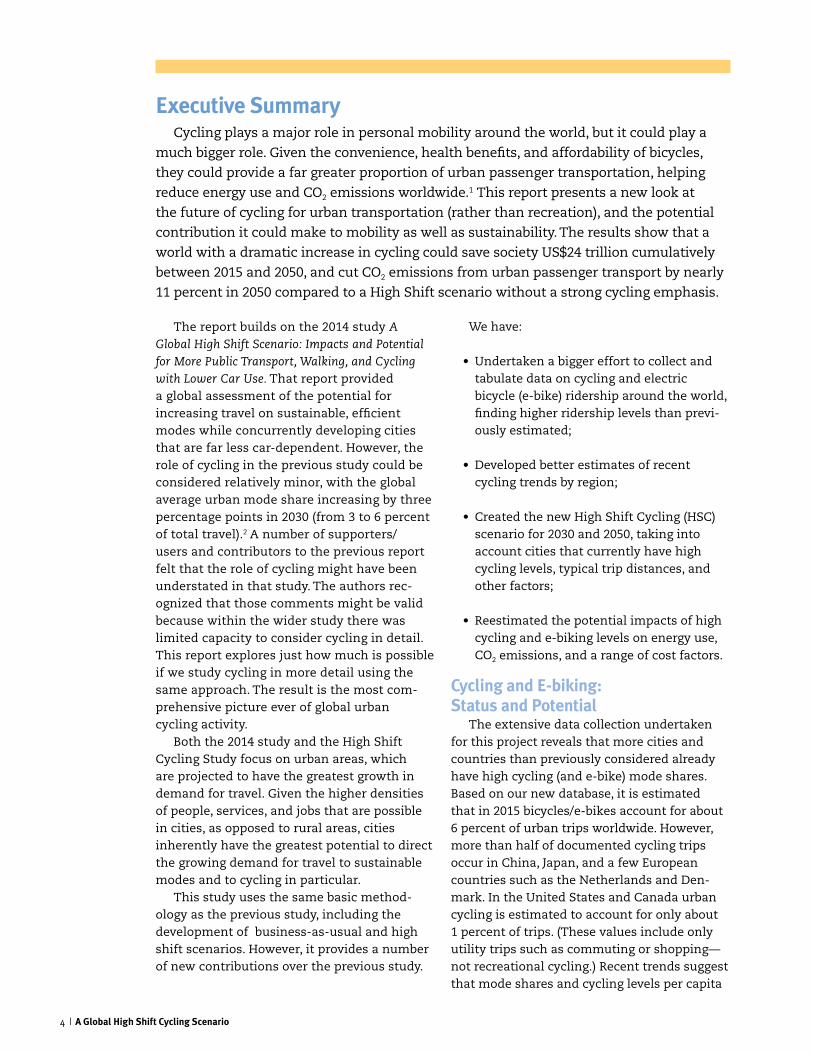
Through a range of policies and invest-ments described in this report, the HSC scenario achieves an 11 percent combined cycling/e-bike share of urban passenger travel distance worldwide by 2030, compared to a base share of 6 percent. By 2050 in the HSC sce-nario, cycling and e-bikes should account for 14 percent of urban kilometers of travel, ranging
from about 25 percent in the Netherlands and China to about 11 percent in the United States and Canada. Figure ES-1 presents the mode share results for Organisation for Economic Co-operation and Development (OECD) and non-OECD countries, cycling and e-bikes, in 2015, 2030 BAU and HSC, and 2050 BAU and HSC. This shows strong increases in both OECD and non-OECD in the High Shift Cycling scenario compared to slow growth (OECD) or decline (non-OECD) in the BAU.
We have quantified three important aspects of the high shift to cycling and e-bikes: energy use, CO2 emissions, and direct costs to travel-ers (including vehicle purchase, operation, and related infrastructure costs). This is, however, an incomplete picture of total societal costs and benefits from increased cycling. There is a wide range of other impacts that can be expected from this scenario, many of which are difficult to quantify and have not been included in this report. Increased cycling is associated with higher rates of physical activ-ity, reduced air pollution, lower traffic conges-tion, and calmer urban traffic that can reduce road-crash-related fatalities and injuries. These benefits could be investigated and quantified in follow-up research.
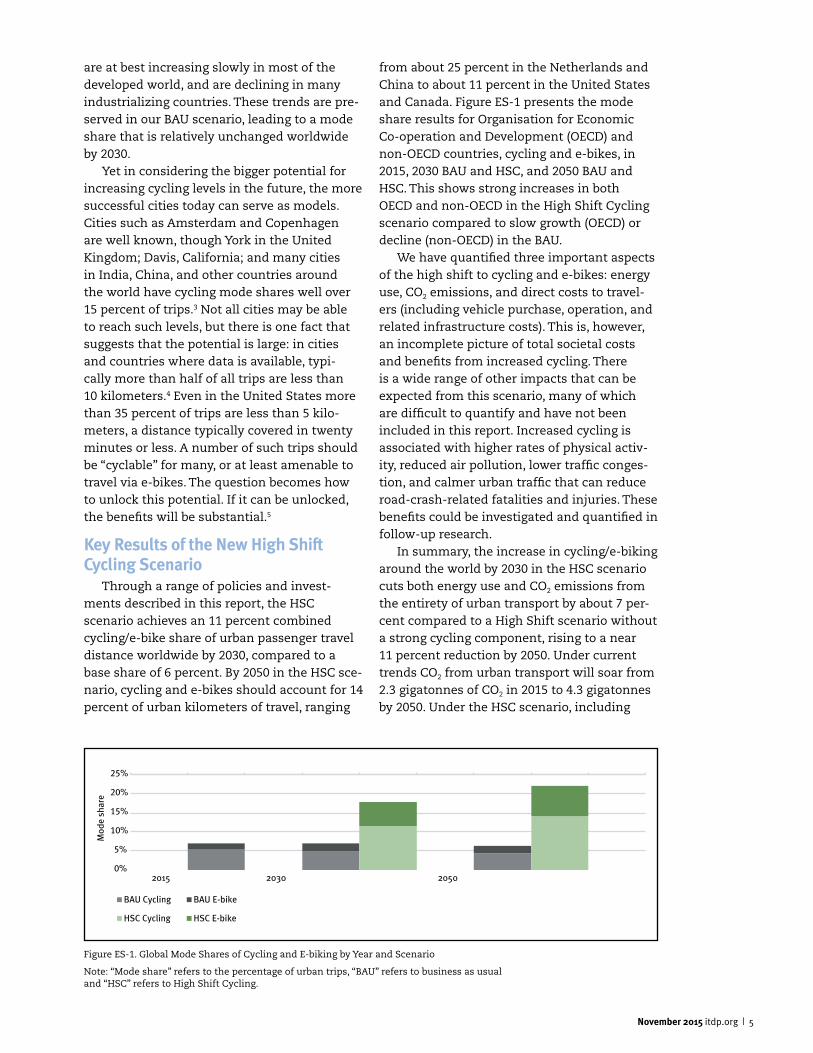
In summary, the increase in cycling/e-biking around the world by 2030 in the HSC scenario cuts both energy use and CO2 emissions from the entirety of urban transport by about 7 per-cent compared to a High Shift scenario without a strong cycling component, rising to a near 11 percent reduction by 2050. Under current trends CO2 from urban transport will soar from 2.3 gigatonnes of CO2 in 2015 to 4.3 gigatonnes by 2050. Under the HSC scenario, including
0%
5%
10%
15%
20%
25%
2015 2030 2050
Mod
e sh
are
BAU Cycling BAU E-bike
HSC Cycling HSC E-bike
Figure ES-1. Global Mode Shares of Cycling and E-biking by Year and Scenario
Note: “Mode share” refers to the percentage of urban trips, “BAU” refers to business as usual and “HSC” refers to High Shift Cycling.
6 | A Global High Shift Cycling Scenario
the impact from increased public transport use, this figure could be cut in half, potentially resulting in a 2 gigatonnes reduction in CO2 emissions per year by 2050.
The increase in cycling and e-bike use would save the world a cumulative US$6 trillion between 2015 and 2030, increasing to US$24 tril-lion between 2015 and 2050. Thus a future with a dramatic increase in cycling would not only reduce CO2 emissions and energy use, but would save the world an enormous amount of money compared to a BAU future.
Conclusions/Recommendations This analysis shows that cycling can have
a substantial positive impact on the world’s future, saving US$24 trillion dollars over the next thirty-five years and dramatically improving quality of life for the world’s rapidly urbanizing population. Benefits also include an 11 percent annual reduction in urban transport CO2 emissions by 2050 over the High Shift scenario without a strong cycling component, as part of a broader 50 percent reduction from the entire set of changes in the HSC scenario versus the BAU scenario. Given the growing threat of global climate change, the authors recommend that actions be taken at the municipal, national, and global level to help realize such a scenario.
In upcoming climate negotiations, the authors recommend that countries include specific commitments for cycling, including mode share and infrastructure investment targets. E-bikes play a critical role in the HSC scenario, but there are a range of issues that
must be addressed for e-bikes to succeed as a mass mode in many countries. These include safety and cost. Governments should encour-age and subsidize low-powered, speed-limited e-bike usage while placing direct restrictions on high-polluting gasoline motorbikes.
To meet ambitious cycling targets and achieve the resultant benefits, strong poli-cies must be adopted at both the local and national levels of government. The recom-mendations below are based on the policies adopted by cities and countries that have achieved high and sustained levels of cycling as a percentage of urban travel. To achieve an
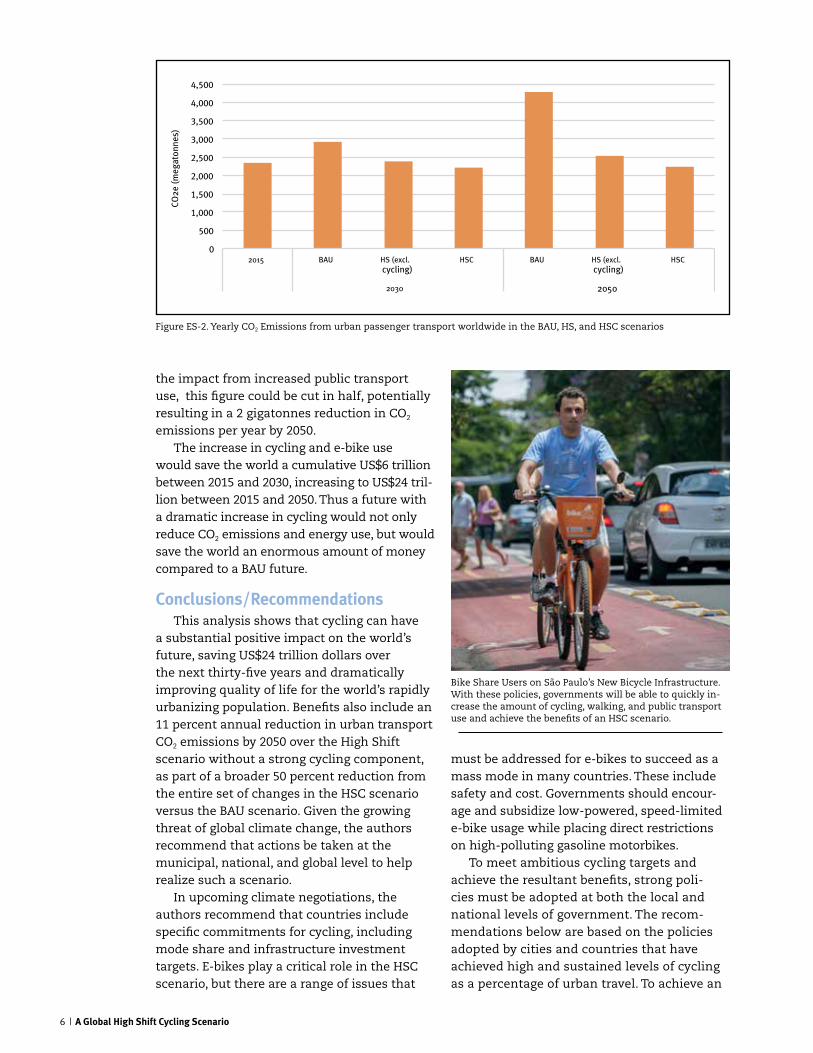
Bike Share Users on São Paulo’s New Bicycle Infrastructure. With these policies, governments will be able to quickly in-crease the amount of cycling, walking, and public transport use and achieve the benefits of an HSC scenario.
0
500
1,000
1,500
2,000
2,500
3,000
3,500
4,000
4,500
2015 BAU HS (excl. cycling)
HSC BAU HS (excl. cycling)
HSC
2030 2050
CO2e
(meg
aton
nes)
Figure ES-2. Yearly CO2 Emissions from urban passenger transport worldwide in the BAU, HS, and HSC scenarios
November 2015 itdp.org | 7
HSC scenario, governments should:
• Rapidly develop cycling and e-bike infra-structure on a large scale;
• Implement bike share programs in large- and medium-size cities, prioritizing con-nections to transit;
• Revise laws and enforcement practices to better protect people cycling and walking;
• Invest in walking facilities and public transport to create a menu of nonmotor-ized transport options that can be com-bined to accommodate a wide variety of trips;
• Coordinate metropolitan transport and land-use plans, so that all new investments result in more cycling, walking, and public
transport trips and fewer trips by motor-ized vehicles;
• Repeal policies that subsidize additional motor vehicle use, such as minimum park-ing requirements, free on-street parking, and fuel subsidies;
• Encourage cycling and active transport via pricing policies and information campaigns;
• Adopt policies such as congestion pricing, vehicle kilometers traveled (VKT) fees, and development impact fees to charge a price for driving that accounts for negative externalities;
• Dedicate fuel taxes, driving fees, and other transport-system revenues toward invest-ment in sustainable transport.
• The most important change was to remove cycling from the impacts of last year’s HS scenario, and report the HS scenario including only the BAU level of cycling. Thus, in this report, the 2014 study HS results are slightly lower than those published in last year’s report;
• Second, the BAU for cycling was updated for the 2014 HS scenario based on the BAU developed in this study, so that the two BAUs match. This BAU is higher than last year’s, since we somewhat underes-timated base year cycling mode shares last year;
• Finally, the new HSC scenario was developed, with far higher cycling and
e-biking levels than in last year’s HS scenario.
Presenting all of this information posed something of a challenge, but through-out this report we refer mainly to three scenarios: the revised BAU, last year’s HS scenario (with BAU cycling), and the new HSC scenario that shows the full impact of high cycling over what is achieved without it. In some places we focus on the marginal impact of cycling by comparing HSC to last year’s HS; in others we show the impact of HSC compared to the BAU, which includes the benefits from cycling along with very high public transport ridership, and other high shift benefits.
New Study versus 2014 StudyThe HSC study builds on last year’s High Shift Scenario report, with a more detailed
examination of the potential contribution of cycling and e-bikes. This required making a few adjustments to the analysis to aid comparison:
8 | A Global High Shift Cycling Scenario
1. Introduction
In 2014, the study A Global High Shift Scenario: Impacts and Potential for More Public Transport, Walking, and Cycling with Lower Car Use examined a global scenario for dramati-cally increased personal travel by sustainable, efficient modes, including walking, cycling, and public transportation. The study showed that urban passenger transport CO2 emissions could be reduced by 40 percent in 2050 and that US$100 trillion could be saved globally between 2015 and 2050 by investing in sustainable transportation compared to the BAU scenario, which was based on the International Energy Agency (IEA)’s 4°C Scenario.
This study expands the 2014 analysis to examine whether additional data and evidence support a much higher HSC scenario for bicycle and e-bike use around the world. Cycling was singled out for a more detailed analysis, given its versatility and range. Consistent with the previ-ous study, only “utility” cycling (such as com-muting or shopping trips, rather than recreation
or sport) was included in the HSC scenario. Further, as in the previous study, we have
concentrated this study on the use of bicycles and e-bikes as a utility trip choice within urban agglomerations. This maintains consistency, although we acknowledge that a considerable amount of cycling also takes place in rural areas.
Within the urban context it is estimated that typically more than 50 percent of urban trips are less than 10 kilometers, a distance easily covered by bicycle.6 Since bicycles are highly space efficient, they require far less infrastructure and urban space than auto-mobiles, allowing for improved mobility in densely populated urban areas.7 Bicycles move at speeds far lower than motorbikes, resulting in dramatically safer mobility.8 Cycling and e-bike use also produce little or no greenhouse gases or local air pollutant emissions, making them much cleaner alternatives to motorbikes, which often produce high levels of emissions.9 With the spread of speed-restricted e-bikes,
November 2015 itdp.org | 9
cycling is becoming a more appealing option for a wider range of people and trip lengths, and in a greater variety of locations, such as hilly cities.5 Higher levels of cycling result in more exercise and a healthier population, reducing mortality rates from heart disease, and lowering levels of obesity—a rapidly grow-ing problem throughout much of the world.6
The experience of the Netherlands, Den-mark, and Japan shows that wealthy countries can achieve both a high rate of cycling and a high quality of life, but only if transporta-tion policy and urban development patterns strongly support bicycle use and sustainable transportation.10 With the approaching 2015 United Nations Climate Change Conference, also known as COP 21, there is a unique opportunity to commit global policy toward a future based on expanded cycling and sustain-able transportation. The transportation sector currently accounts for nearly 25 percent of all
carbon emissions, with urban passenger trans-portation emitting nearly 2.3 gigatons of CO2 in 2010. Reducing carbon emissions in the urban transportation sector is a key part of achiev-ing a two-degree scenario, where catastrophic climate change is largely avoided. If countries adopt aggressive sustainable transportation goals as part of the COP 21 negotiations, the world has a greater chance of achieving that scenario.
This report details the potential policies needed to reach an HSC scenario. The policies are based on examples of successful programs in cities and countries that have achieved both high levels of income and high levels of cycling. Unlike expensive policies needed in other sectors to reduce the severity of climate change, as this report shows, the policies nec-essary to reach an HSC scenario can dramati-cally reduce societal costs, freeing money for use in other endeavors.
10 | A Global High Shift Cycling Scenario
2. Cycling Around the World Today—Data and Baseline Setting
To develop and assess future scenarios of cycling we first needed to understand the existing picture of urban cycling by compiling data on the extent of current cycling trends in countries around the world. From this data we established a baseline (2015) picture of cycling and identified key factors influencing it. The following section outlines the raw data we were able to collect and how it was analyzed to craft a platform on which projections about future cycling growth could be built. This platform, in the form of our estimates for 2015, is referred to as the “baseline,” and is represen-tative of how cycling is being used as a utility mode of transportation throughout the world (the analysis does not consider recreational use). The data has also been used to estimate trends and to develop a BAU scenario, which is presented in the next section.
The authors conducted a wide ranging data search focused on cycling levels per capita, average urban mode shares, bike sales and stocks, extent of infrastructure (such as bike lanes and bike sharing systems), and bike-related costs (including bicycle purchase and maintenance costs as well as infrastructure construction and maintenance costs). By far the most readily available data across the most countries and the most years has been bicycle mode share data. Other data have been spotty outside of Europe. Thus mode share was used as the primary means of establishing a 2015 baseline for cycling. The detailed database will be made available concurrent with the launch of the report.
Bicycle Mode Share DataThe authors obtained sufficient data
on cycling mode share to estimate average cycling mode shares for twenty-one countries and regions based on social, economic, and climatic similarities. A few small, exceptional cycling countries (such as the Netherlands and Denmark) were pulled out to ensure that they received specific attention.
The authors and the expert panel were sen-sitive to the fact that there is inconsistency in the calculation of mode share, even from city to city within the same country. However, the
size of the data set (more than eight hundred cities) provides some confidence in average numbers and a means of comparing relative levels of cycling between cities and tracking changes over time. Nonetheless, a key recom-mendation of this report is to create improved data definitions and collection systems to better document the baseline situation and to track changes over time.
Key highlights include:
• Russia was included in non-OECD Europe due to a lack of Russian data;
• Six EU countries were analyzed separately, given the excellent data availability: the Netherlands, Denmark, France, Germany, Italy, and the United Kingdom;
• Japan was pulled out of OECD Pacific to highlight extraordinary cycling levels;
• In each region, we separated large cities from smaller ones and estimated the mode share for these two city sizes;
• We tracked the dates of data (which ranged from 1977 to 2015) and created a very rough system of time trends where this was possible.
Table 1 shows the data development process and final estimation of mode shares by our most detailed country/region breakout. This includes the percentage of large and smaller cities covered in each region (that is, the percentage represented in our database); for many regions we have near 100 percent coverage for larger cities, meaning at least one year of data of cycling mode share in each large city in those regions. For smaller cities the coverage is typically far lower, indicat-ing much greater uncertainty in the average mode shares in those cities. The table also shows the weighted mode share, taking into account large and small city mode share and the assumption that cities without data are on average 25 percent below the average taken for the cities with available data (based on
November 2015 itdp.org | 11
the expectation that cities that make data available are likely to be somewhat above average for cycling mode share). Finally, Table 1 also brings the average mode share up to 2015, based on the estimated trend and the average year of available data. The final 2015 mode shares are shown in the far right-hand column.
Figures 1a and b (next page) show the pro-gression of urban population-weighted aver-ages at the regional level from their average source year to the baseline year of 2015 (with-out adjustments for missing data). The number
of cities covered by the data is shown as labels above each column. Approximate trends in data were used to determine if a region was experiencing growth or decline in cycle uti-lization. Although many periods in different regions have limited data, approximate trends are evident. Despite variations in individual countries, it was determined that OECD regions would trend toward growth in the baseline, while non-OECD regions would experience a fall in cycling use. The trends for future bicycle mode share in the BAU scenario are described in greater detail in Section 3.
>300k Cities <300k Cities
City Count Region Percent Coverage
Mode Share
Percent Coverage
Mode Share
Weighted City Mode Share
Years to 2015 2015 Mode Share
12 Denmark 100% 0.45 61% 0.18 0.23 9 0.25
40 France 95% 0.04 15% 0.02 0.02 9 0.04
68 Germany 100% 0.13 19% 0.14 0.12 8 0.13
18 Italy 39% 0.09 7% 0.16 0.10 11 0.12
31 Netherlands 100% 0.28 44% 0.26 0.23 8 0.25
24 Nordic 100% 0.13 29% 0.18 0.14 8 0.16
33 United Kingdom 61% 0.03 14% 0.05 0.03 7 0.04
108 Other OECD Europe 55% 0.06 15% 0.08 0.06 7 0.07
Table 1. Development of baseline cycling modes data by country/region.
Notes: “City count” = number of cities for which data was obtained. “Percent coverage” = percentage of cities within size class for which data was obtained. “Weighted city mode share” includes adjustments for both large/small city weights, and for percentage of cities without data, as de-scribed in the text. “Years to 2015” = number of years from average year of data until 2015, used in adjusting data to base year.
Figure 1a. Average mode share estimates for different time periods, for selected OECD countries and regions.
Figure 1b. Average mode share estimates for different time periods, for selected non-OECD countries and regions.
Note: The number of cities included in the average is shown above each column.
November 2015 itdp.org | 13
E-biking
Global e-bike usage presented a particular challenge to developing a baseline. As an emerg-ing technology, e-bikes are not included in mode share reporting by all but a few cities. Instead, global/regional e-bike sales data was used to estimate e-bike usage within each region. We used the European Cyclists’ Federation (ECF) sales data (discussed below) through 2015 in various regions around the world as well as average VKT on e-bikes per year and average trip length to derive person-kilometers of travel (PKT) and trips/capita estimates.11 This was converted into mode share data by comparing these trip estimates to trips by other modes.
It should be noted that there are a variety
of e-bike types and technologies, and these are not differentiated in this study. But some types (such as predominate in China) do not require any pedaling, whereas others (predominating in Europe) require pedaling and either simply add electric power to each pedal stroke or allow the user to “top up” pedal power at the turn of a hand grip. The strengths and weaknesses of these different technologies, and their costs, vary and could be the subject of follow-up analysis. Figure 2 shows the aggregate baseline mode share for each region in the study with the darker top representing the portion of the mode share occupied by e-bikes. A more detailed discussion of e-bikes is provided in the sidebar on p. 14.
Figure 2. Aggregate, adjusted Baseline mode shares for bicycles and e-bikes, 2015.
0%
5%
10%
15%
20%
25%
30%
Mod
e sh
are
(% o
f tri
ps)
2015 Cycling Mode Share 2015 E-bike Mode Share
Denmark
France
Germany
Italy
Netherla
nds
Nordic
United Kingdom
Other O
ECD Europe
Japan
Other O
ECD Pacific
United Sta
tes
Canada
Mexic
oBra
zil
Other L
ACAfri
ca
Non-OECD Euro
pe/Russ
ia
Middle East
ChinaIn
dia
Other A
sia
14 | A Global High Shift Cycling Scenario
Electric bicycles (e-bikes) provide a wide range of benefits, which include increas-ing the range of potential travel distances, reducing cycling effort in hilly cities, and providing mobility to population groups that are not entirely comfortable using bicycles. While there have been complaints of discomfort from users of non-assisted bicycles, and some Dutch cities have found that elderly population has a greater risk of crashes when using e-bikes, restricting the speeds of ebikes to a locally agreed maxi-mum safe speed can help avoid safety issues
E-bikes come in many shapes, sizes, and price points around the world, and may play different roles depending on the specific technologies and types of bikes in question. For example, some are speed limited at 25 kilometers per hour; others are capable of going twice that speed. Some use electric-ity to assist pedal power, others use only electricity—pedaling is not even possible (as is prevalent in China). Most e-bikes in the developing world use heavy lead-acid bat-teries (very polluting and toxic), while those selling in Europe and North America are mainly lighter (and much more expensive) models with lithium-ion batteries.
There has been a rapid increase in the use of e-bikes in both developed and developing countries, with varying regulations regarding approved use and/or downright bans. Some countries have regulated these vehicles to the extent that only the “best” types of
e-bikes can circulate on bikeways (all oth-ers can only use regular streets—this is the case in most of Europe), other places do not differentiate the types of e-bikes or whether they are a different type of vehicle (most of Latin America), and some places (like some Chinese cities) have begun to ban e-bikes altogether due to safety concerns stemming from the heavier, higher speed e-bike models more common there.
In this study, we try to remain “technolo-gy neutral” but point out the need for e-bikes to be affordable yet safe all over the world. Many policy issues are in play in different countries and regulations are still being developed. But it seems reasonable to urge that e-bikes be regulated to be as safe as possible (that is, with speed governors set to locally or nationally agreed safe speeds, and greater access/circulation to those that use pedal assistance instead of throttle power), and designed to be as competitive price-wise as possible with internal-combustion engine two-wheelers.
While lithium-ion batteries have superior performance, e-bikes equipped with these batteries currently cost up to US$1,000 more than those with lead-acid batteries (though economies of scale may eventually make these much more affordable, and appropriate in more countries). Countries should “move up the ladder” of technology as makes sense given the local economy, while ensuring safety.
E-bikes
November 2015 itdp.org | 15
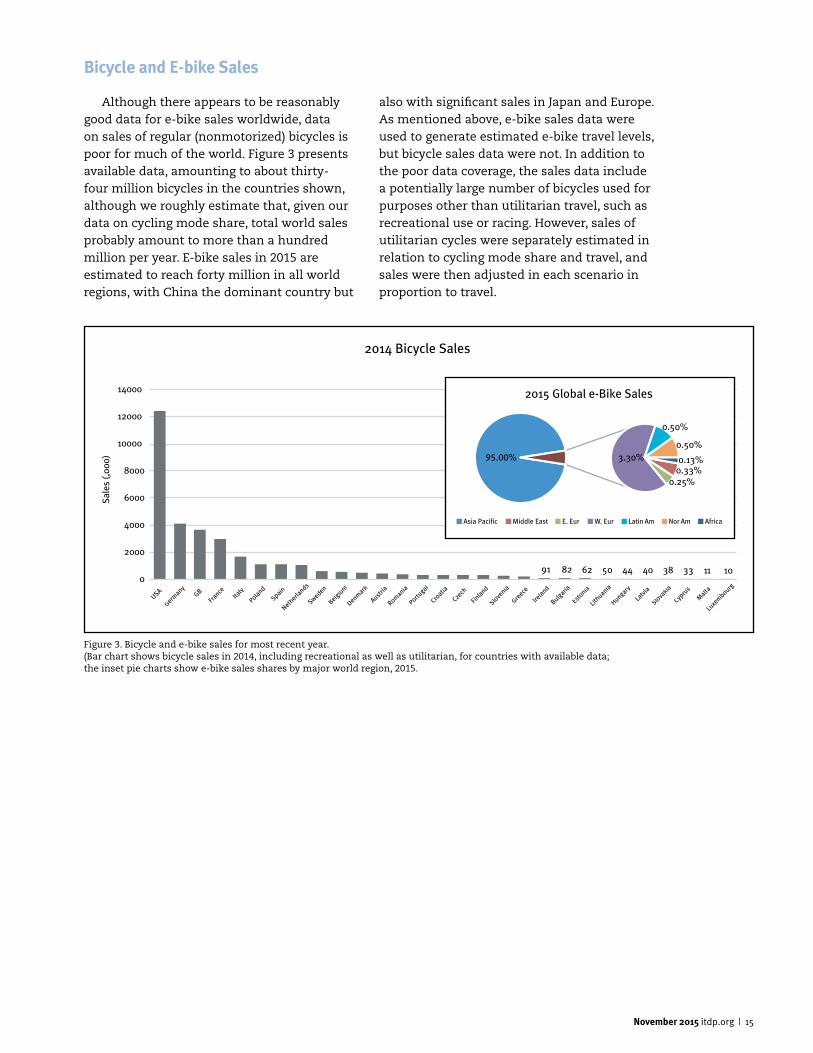
Although there appears to be reasonably good data for e-bike sales worldwide, data on sales of regular (nonmotorized) bicycles is poor for much of the world. Figure 3 presents available data, amounting to about thirty-four million bicycles in the countries shown, although we roughly estimate that, given our data on cycling mode share, total world sales probably amount to more than a hundred million per year. E-bike sales in 2015 are estimated to reach forty million in all world regions, with China the dominant country but
also with significant sales in Japan and Europe. As mentioned above, e-bike sales data were used to generate estimated e-bike travel levels, but bicycle sales data were not. In addition to the poor data coverage, the sales data include a potentially large number of bicycles used for purposes other than utilitarian travel, such as recreational use or racing. However, sales of utilitarian cycles were separately estimated in relation to cycling mode share and travel, and sales were then adjusted in each scenario in proportion to travel.
91 82 62 50 44 40 38 33 11 10 0
2000
4000
6000
8000
10000
12000
14000
USA
Germany
GB
France
Ita
ly
Poland
Spain
Netherla
nds
Sweden
Belgium
Denmark
Austria
Romania
Portugal
Croatia
Czech
Finland
Slovenia
Greece
Ireland
Bulgaria
Estonia
Lithuania
Hungary
Latvi
a
Slovakia
Cypru
s
Malta
Luxe
mbourg
Sale
s (,
000)
2014 Bicycle Sales
95.00% 0.33%
0.25%
3.30%
0.50%
0.50%
0.13%
2015 Global e-Bike Sales
Asia Pacific Middle East E. Eur W. Eur Latin Am Nor Am Africa
Figure 3. Bicycle and e-bike sales for most recent year. (Bar chart shows bicycle sales in 2014, including recreational as well as utilitarian, for countries with available data; the inset pie charts show e-bike sales shares by major world region, 2015.
Bicycle and E-bike Sales
16 | A Global High Shift Cycling Scenario
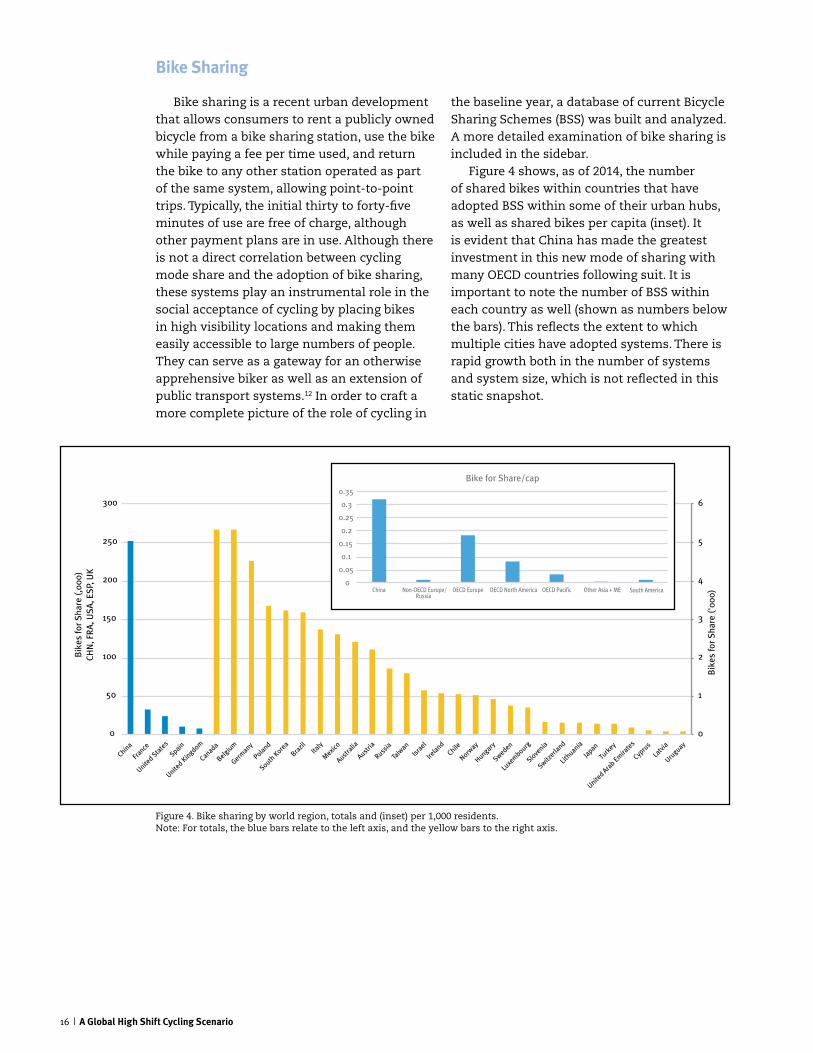
Bike sharing is a recent urban development that allows consumers to rent a publicly owned bicycle from a bike sharing station, use the bike while paying a fee per time used, and return the bike to any other station operated as part of the same system, allowing point-to-point trips. Typically, the initial thirty to forty-five minutes of use are free of charge, although other payment plans are in use. Although there is not a direct correlation between cycling mode share and the adoption of bike sharing, these systems play an instrumental role in the social acceptance of cycling by placing bikes in high visibility locations and making them easily accessible to large numbers of people. They can serve as a gateway for an otherwise apprehensive biker as well as an extension of public transport systems.12 In order to craft a more complete picture of the role of cycling in
the baseline year, a database of current Bicycle Sharing Schemes (BSS) was built and analyzed. A more detailed examination of bike sharing is included in the sidebar.
Figure 4 shows, as of 2014, the number of shared bikes within countries that have adopted BSS within some of their urban hubs, as well as shared bikes per capita (inset). It is evident that China has made the greatest investment in this new mode of sharing with many OECD countries following suit. It is important to note the number of BSS within each country as well (shown as numbers below the bars). This reflects the extent to which multiple cities have adopted systems. There is rapid growth both in the number of systems and system size, which is not reflected in this static snapshot.
Bike Sharing
0
1
2
3
4
5
6
0
50
100
150
200
250
300
China
France
United Sta
tes
Spain
United Kingdom
Canada
Belgium
Germany
Poland
South Kore
a
Brazil
Ita
ly
Mexic
o
Australia
Austria
Russia
Taiw
an
Israel
Ireland
Chile
Norway
Hungary
Sweden
Luxe
mbourg
Slovenia
Switzerla
nd
Lithuania
Japan
Turk
ey
United Ara
b Emirate
s
Cypru
s
Latvi
a
Uruguay
Bik
es fo
r Sha
re ('
000)
Bik
es fo
r Sha
re (,
000)
CH
N, F
RA,
USA
, ESP
, UK
0
0.05
0.1
0.15
0.2
0.25
0.3
0.35
China Non-OECD Europe/Russia
OECD Europe OECD North America OECD Pacific Other Asia + ME South America
Bike for Share/cap
Figure 4. Bike sharing by world region, totals and (inset) per 1,000 residents. Note: For totals, the blue bars relate to the left axis, and the yellow bars to the right axis.
November 2015 itdp.org | 17
Bike sharing is rapidly growing as a means of urban transportation, increasing from only fifteen thousand bikes in 2007 to more than one million bikes in 2015. These systems eliminate the need to purchase, store, or maintain a bicycle, creating easy access to bicycle transportation. Bike sharing also allows for trips to be made at either end of public transportation, without the need to store or transport a personal bicycle. This greatly expands the number of origins and destinations that can be reached quickly from transit stations.
Several types of bike share systems exist. A few systems are manually operated, with each station staffed by an attendant who controls bicycle rentals and returns. Most current systems are automated using “smart dock” technology. In these systems, bicycle rentals and returns are handled automati-cally through electronic locking mechanisms at docks in each station that secure the bicycles when they are not in use. The docks and stations are connected to user accounts through Internet connections. In some newer “smart bike” systems, the locking mecha-nisms and Internet connections are attached to the bicycles themselves, which may provide greater flexibility. Bike share bicycles are typically heavy-duty, weather-resistant vehicles that are quickly adjustable for use by a wide range of body shapes and sizes.
Some cities are experimenting with new technologies for bike share systems to serve a greater variety of trips. Tricycles have been deployed for less physically active users, shared cargo bikes help move heavy things, and shared e-bikes make cycling easier in hilly cities and for less physically able peo-ple. The rapid growth of bike share systems and the surge in innovation indicates that bike sharing will likely be an increasingly important piece of the urban transportation system.
In this study we have not attempted to estimate the marginal contribution of bike sharing to overall biking or impacts such as CO2 reduction. It would take a very large expansion of bike sharing systems around the world to have a significant effect com-pared to all the private bike travel projected in our HSC. However, given that bike share systems have catalyzed dramatic increases in private bike use in many cities, especially when paired with bicycle infrastructure and other policies that support cycling, these systems can have strong indirect impacts on total cycling levels and benefits.
Given the benefits, popularity, and relatively low cost of bike share systems, governments around the world have pro-vided subsidies to support their creation, operation, and expansion.
Bike Share
18 | A Global High Shift Cycling Scenario
3. Cycling BAU Scenario
The following section outlines a cycling BAU scenario, which describes the likely future if the current trajectories for transportation and development policies continue without strong deviations due to policy or other discontinui-ties. The section is followed by an HSC scenario that describes a future where policies are adopted to favor sustainable transportation, with a particular focus on bicycle use.
Projecting current cycling trends into the future for the BAU scenario is difficult given the lack of strong time-series data on key cycling indicators, such as the number of trips or kilometers per capita. Sales of bicycles are generally not useful indicators of cycling, as bicycle ownership is poorly correlated with bicycle use, particularly for “utility” trips. Instead, as shown in Figure 1 and discussed above, we used the mode share data to create very approximate trends by region, particularly for determining whether cycling per capita appears to be rising or falling beyond 2015. We assumed that approximate mode share trends continue to 2030, then slow to 2050. For each region, the average cycling mode share is shown over five-year periods, 2000 through 2015, along with 1997 to 2000. The number of cities for which there is data, included in the average, is shown above each bar.
Though many years in most regions have low or no records, some rough trends emerge, such as a slight increase in OECD Europe cycling mode shares and perhaps in the United States as well. In non-OECD regions, both data and anecdotes show declining cycling mode shares but again the low data coverage for many regions and years makes this difficult to verify broadly.13 Some regions, such as OECD Europe, have robust records showing a clear, if only slight, increase in mode shares; others, such as Japan, show no clear trend.3 The United States appears to show a general upward trend.
Based on our interpretation of these rough trends and anecdotes, we set the future trends very simply: in OECD we have increased mode share by 0.2 percentage points per year (one percentage point every five years), though also subject to a maximum 2 percent change versus
the previous year to avoid excessive changes in countries with low mode shares; in non-OECD we set a declining rate of the same magnitude. The results are shown in Figure 5. Overall these are quite conservative figures—not major changes from today’s mode shares. The 2030 mode shares tend to be less than 10 percent above (or below) today’s levels. This reflects a future of slow, steady trends, not radical depar-tures that would likely need to be driven by new policies—these are handled in the HS scenario.
When converted to PKT (using data on trips and trip length), the projection in Figure 5 emerges. The results show slow upward trends in cycling in OECD countries, and some fairly strong downward trends in cycling in the devel-oping world. This represents the BAU future upon which an HSC scenario must be overlaid.
BAU Projections for E-bikingWe developed future e-biking levels and
mode shares based primarily on the recent sales data shown in the previous section. Given the higher cost of e-bikes and their more limited appeal for recreational use, the sales data are assumed to have a strong correlation with use as transportation, although some recreational and tourism use clearly occurs in Europe and the United States. E-bike sales data is projected to 2030 and 2050 in Figure 6. Sales increased from 2015 to 2030 by the same percentage increase seen in recent history, with a maximum increase of 5 percent yearly. From 2030 to 2050 a sales growth cap was established at 2.5 percent annually, assuming that most of those interested in e-biking are already in possession of e-bikes, and e-bikes sales are primarily for the replacement of existing e-bikes. The large majority of global e-bike sales occur in Asia Pacific, primarily in China.11 This reflects ongoing bans on ICE two-wheelers within Chinese cities, pushing the population to use e-bikes. The transition has been expedited by low operations and maintenance (O&M) costs, existing cycling infrastructure, and a culture of widespread acceptance of motorized two-wheelers.14 West-ern Europe dominates the rest of e-bike sales, which is parallel to its historic adoption of
November 2015 itdp.org | 19
0.0
0.5
1.0
1.5
2.0
2.5
3.0
3.5
4.0
Ital
y
Den
mar
k
Fran
ce
Ger
man
y
Net
herl
ands
Nor
dic
Uni
ted
Kin
gdom
Oth
er O
ECD
Eur
ope
Japa
n
Oth
er O
ECD
Pac
ific
Uni
ted
Stat
es
Cana
da
Mex
ico
Bra
zil
Oth
er L
AC
Afri
ca
Non
-OEC
D E
urop
e/Ru
ssia
Mid
dle
East
Chin
a
Indi
a
Oth
er A
sia
Europe Pacific No. America So. America Africa E. Eur./Asia
pKm
/Cap
/Day
Cycling pKm/Cap/Day BAU
2010 2015 2020 2025 2030 2035 2040 2045 2050
0
10
20
30
40
50
60
70
80
90
100
0
1
2
3
4
5
6
7
8
9
10
2012
2013
2014
2015
2016
2017
2018
2019
2020
2021
2022
2023
2024
2025
2026
2027
2028
2029
2030
2031
2032
2033
2034
2035
2036
2037
2038
2039
2040
2041
2042
2043
2044
2045
2046
2047
2048
2049
2050
Asia
Pac
ific
Sale
s (m
il)
Sale
s ex
. Asi
a Pa
cific
(mil)
Africa Middle East E. Eur W. Eur Latin Am Nor Am Asia Pacific
Rest of world (left axis)
Asia Paci�c (right axis)
traditional bicycles. North America, Africa, and Latin America are all projected to have a slow but consistent growth in e-bike sales through 2050. Eastern Europe, Russia, and the Middle East are projected to experience a much slower rate of sales going forward. Few new policies emerge to promote e-biking, provide bicycle infrastructure, or otherwise incentivize higher uptake rates than shown here.
The e-bike sales projections, coupled with an assumed steady use of e-bikes at around
6 kilometers per trip and one trip per day per e-bike, or 6 kilometers per day per e-bike, results in the average e-bike PKT per day across the entire population, shown in Figure 7. Some countries are expected to be stuck at very low levels of e-biking, given the very low levels today, with no expectation that this will change without strong new policy drivers. A good example is India, where e-bikes are expected to be uncompetitive with gasoline scooters unless policies are enacted to change this.
Figure 5. BAU projections of cycling by region, 2015 to 2050.
Figure 6. E-bike sales, BAU projection, 2015–2050.
20 | A Global High Shift Cycling Scenario
0.0
0.2
0.4
0.6
0.8
1.0
1.2
1.4
1.6
1.8
2.0 D
enm
ark
Fran
ce
Ger
man
y
Ital
y
Net
herl
ands
Nor
dic
Uni
ted
Kin
gdom
Oth
er O
ECD
Eur
ope
Japa
n
Oth
er O
ECD
Pac
ific
Uni
ted
Stat
es
Cana
da
Mex
ico
Bra
zil
Oth
er L
AC
Afri
ca
Non
-OEC
D E
urop
e/R
ussi
a
Mid
dle
East
Chin
a
Indi
a
Oth
er A
sia
Europe Pacific No. America So. America Africa E. Eur./Asia
pKm
/cap
/day
e-Bike pKm/cap/day BAU
2010 2015 2020 2025 2030 2035 2040 2045 2050
BAU Policy NarrativeThe BAU scenario reflects a continuation of
existing cycling policies as well as other trans-portation and urban development policies. In the OECD, more policies supporting bicycle use will continue to be adopted. This slowly trans-lates to additional bicycle use as streets become increasingly safer and more comfortable and convenient for cycling.1 Generally the countries with the best existing bicycle infrastructure continue to show growth, while areas with low bicycle use, infrastructure, and awareness (and often high car dependency) show slower growth in cycling levels. Wealthy countries have seen car ownership levels, as a percentage of the population, plateau. OECD car ownership is not expected to grow significantly per capita in the future, as cities slowly embrace a broad variety of policies encouraging sustainable trans-portation and development.8 Further, urban populations in OECD countries are generally growing slowly, compared to cities in non-OECD countries, and they spend less on new road construction and more on road maintenance and retrofitting for more sustainable transpor-tation. Smaller cities in OECD countries may continue to lose population, straining the ability of governments to provide services to increas-
ingly low-density population. To address this situation, some governments will push for cities to shrink in size and to use resources even more efficiently. This may result in some increase in bicycle use as trip distances decline and government support for expensive automobile infrastructure declines.
In non-OECD countries, many cities are growing in a rapid and often loosely planned manner, with most growth occurring on the urban periphery in increasingly low densities. As more people are able to afford cars and motorized two-wheelers, they will buy them—possibly in great numbers. In the BAU, cities continue to pave and widen streets to accom-modate the additional motor vehicle traffic, but with little or no provision for cycling. With growing motor vehicle congestion and higher speeds, the environment for cycling in cities becomes increasingly hostile, causing more people to shift from cycling to other modes. With declining densities, other sustainable transportation modes, such as walking and cycling, will also decline in most cities. In the largest cities, some investment will continue to be made in rapid transit, but most cities become increasingly dependent on private motor vehicles for personal transportation.
Figure 7. E-bike passenger travel per day, BAU, 2015–2050.
November 2015 itdp.org | 21
4. High Shift Cycling Scenario
In the HSC scenario the goal is to exam-ine the upper limits of a plausible future of cycling—that is, to reach levels of cycling and e-bike riding that are well above today’s or the projected increase in the cycling BAU scenario. We have developed 2030 and 2050 targets for the HSC scenario based on three general considerations that can be supported by the evidence of shifts to cycling already achieved in high-cycle-use cities:
1. that the average city of the future can reach or at least approach the current cycling levels of the better-performing cities within its own country or region
2. that a certain percentage of trips are “cyclable,” based on trip distance
3. that future increases in cycling/e-biking will not exceed a maximum rate of change (increase) that seems plausible in a five-year period, based on past increases.
The HSC is dependent on a major shift in behaviors that has been achieved in a number of cities with strong policy support, including various incentives. It also will be greatly aided by better infrastructure (itself a function of policy) and aspects like reductions in the price of e-bikes, which are currently much more expensive than gasoline two-wheelers in many countries. These and other policy aspects are described in Section 5; here we lay out the actual HSC scenario, and elaborate the poten-tial impacts of this scenario on modal shift, travel patterns, energy use, CO2 emissions, and costs.
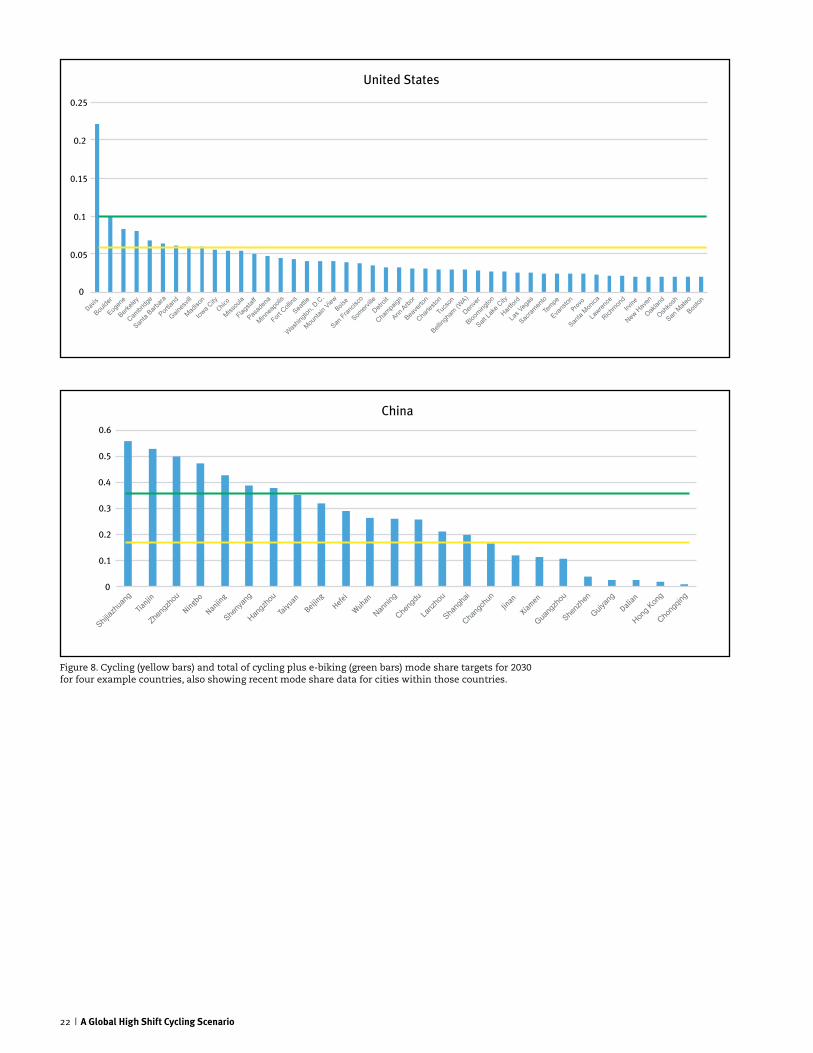
The mode share targets in the HSC have been developed with the above three factors in mind, though the cities in each region with the highest levels of cycling have provided the most important foundation for establishing our targets, along with cross-regional compari-sons. Figure 8 shows four specific countries as examples, indicating the range of cycling mode share in the cities for which data is available. In general, HSC targets for cycling in 2030 have been set in the vicinity of the current top five
or ten cities within a country or region, which puts the targeted cycling levels above those in the vast majority of cities. Adding in a target for e-cycling, the combined target (shown in green) is near or above the current best-known city in the region. It is important to keep in mind that data for many cities is missing, and there could be other cities with relatively high cycling mode share, although it seems likely that the vast majority of missing cities have a mode share below those with data, since those cities reporting data are likely ones that have initiatives under way.
For most countries and regions, this com-bined target is very ambitious, particularly with the expectation that it will be achieved within fifteen years. Figure 9 shows the five-year changes for cycling to achieve the 2030 tar-gets, and that are included in our modal shift analysis. We have fit a logistic growth curve to represent the increase in cycling and e-biking over time, which allows for a “slow start” in the 2015–2020 time frame, but then requires dramatic shifts over the 2020–2030 period. Is this even possible? The “policy narrative” section below delves into this, but a couple of examples in the previous section (Denmark, for example) suggest that a country (and cities) committed to major shifts can achieve ten per-centage point or higher mode share increases in a ten-year period.
Regarding the number of trips that are “cyclable,” the data on trip distance, though scant, suggests that a very high share of one-way urban trips traverse distances that are easily covered by cycling or e-biking, at least in principal.6, 15 Of course this depends on factors such as weather and terrain—which are very city specific—and some demographic groups are more limited in their trip types and distances than others. But given typical cycling trip distances of 3–5 kilometers and e-biking capable of distances of 10 kilometers without much trouble (an e-bike going at 30 kilometers per hour can cover 10 kilometers in twenty minutes, making this an easily commutable distance), we looked at the share of trips in a number of countries that are 5 to 10 kilome-ters.5 An example is shown in Figure 10—the
22 | A Global High Shift Cycling Scenario
Figure 8. Cycling (yellow bars) and total of cycling plus e-biking (green bars) mode share targets for 2030 for four example countries, also showing recent mode share data for cities within those countries.
0
0.05
0.1
0.15
0.2
0.25
Davis
Boulde
r
Eugen
e
Berkele
y
Cambri
dge
Santa
Barbara
Portlan
d
Gaines
vill
Madiso
n
Iowa C
ity
Chico
Missou
la
Flagsta
ff
Pasad
ena
Minnea
polis
Fort C
ollins
Seattle
Washin
gton,
D.C.
Mounta
in View
Boise
San Fran
cisco
Somerv
ille
Detroit
Champa
ign
Ann Arbo
r
Beave
rton
Charle
ston
Tucs
on
Belling
ham (W
A)
Denve
r
Blooming
ton
Salt La
ke C
ity
Hartfor
d
Las V
egas
Sacram
ento
Tempe
Evans
ton
Provo
Santa
Monica
Lawren
ce
Richmon
d
Irvine
New H
aven
Oaklan
d
Oshko
sh
San M
ateo
Boston
United States
0
0.1
0.2
0.3
0.4
0.5
0.6
Shijiaz
huan
g
Tianjin
Zheng
zhou
Ningbo
Nanjing
Sheny
ang
Hangz
hou
Taiyu
an
Beijing
Hefei
Wuhan
Nannin
g
Cheng
du
Lanz
hou
Shang
hai
Chang
chun
Jinan
Xiamen
Guang
zhou
Shenz
hen
Guiyan
g
Dalian
Hong K
ong
Chong
qing
China
November 2015 itdp.org | 23
0
0.02
0.04
0.06
0.08
0.1
0.12
0.14
0.16
0.18
0.2
York
Cambridge
Bristo
l
Oxford
Portsmouth
Swindon
Norfolk
Peterb
orough
Exete
r
Milt
on Keynes
Southampto
n
Plymouth
West
Midlands U
nitarie
s
Edinburgh
Manch
ester
Leice
ster
Liverp
ool
London
Presto
n
Aberdeen
Glouceste
r
Ipsw
ich
Watford
Birmingham
Durham
Leeds
Newcastl
e
Nottingham
Sheffield
Stoke-o
n-Trent
Blackpool
Dundee
Glasgow
United Kingdom
0
0.05
0.1
0.15
0.2
0.25
0.3
0.35
Patna
Nagpur
Raipur
Amritsa
r
Agra
Bhuba
nesw
ar
Guwahati
Bikaner
Hubli-D
harw
ad
Kanpur
TVM
Chandigarh
Madura
i
Bhopal
Varansi
Surat
Puducherry
Ahmadabad
Jaipur
Delhi
Kolkata
Pune
Chennai
Hydera
bad
Bangalore
Mumbai
Kochi
Panaji
Shimla
Gangtok
India
24 | A Global High Shift Cycling Scenario
United States. This shows that even in the United States, fully half of all car trips are five miles (8 kilometers) or less, and 35 percent are less than three miles (5 kilometers). Thus while for the United States the HSC target in 2030 is set at about 10 percent for combined cycle/e-bike mode share, a much higher mode share would appear possible given trip distances. The United States has among the longest average urban trip distances in the world—thus most other countries have higher shares of trips that are less than 10 kilometers. Even in Belgium—with much higher cycling shares than the Unites States—car trips account for about 70 percent of 5 kilometer trips and 80 percent of 8 kilometer trips.16
Figure 11 shows the same results for only the HSC separated by region. These reflect the foregoing assumptions and considerations in developing this scenario.
Modal Shift Impacts of the High Shift Cycling Scenario
Assuming a much higher uptick of cycling and e-biking requires a second assumption—how does this change broader travel patterns?
Individuals choosing to cycle typically means they are also choosing not to travel by another mode—be it walking, driving, or taking public transport. In the case of e-biking it could also mean shifting from a gasoline-powered two-wheel scooter or motorcycle. In the long run, a shift in travel modes toward more cycling has broader dynamics—supporting denser cities with transportation systems more oriented to walking, cycling, and public transport, as opposed to sprawling car-dominated cities.a
In addition, over a thirty- to forty-year time frame, this development can relate to an uptick in cycling rather than an uptick in driving (or even a modest shift from the latter to the former) by people who do not yet own a car—the vast majority of people in the developing world. Thus for a 2030 modal shift estimate, this is really an alternative development estimate—more people take up cycling and e-biking over time, and the demand for car ownership and car travel drops somewhat.
There are many ways that such scenarios could play out. For example, bicycles could substitute for some mass transport trips; on the other hand they could be part of a much
0.000
0.500
1.000
1.500
2.000
2.500
3.000
3.500
4.000
Den
mar
k
Fran
ce
Ger
man
y
Ital
y
Net
herl
ands
Nor
dic
Uni
ted
Kin
gdom
Oth
er O
ECD
Eur
ope
Japa
n
Oth
er O
ECD
Pac
ific
Uni
ted
Stat
es
Cana
da
Mex
ico
Bra
zil
Oth
er L
AC
Afri
ca
Non
-OEC
D E
urop
e/R
ussi
a
Mid
dle
East
Chin
a
Indi
a
Europe Pacific No. America So. America Africa E. Eur./Asia
pKm
/Cap
/Day
Cycling pKm/Cap/Day in HSC scenario
2015 2020 2025 2030
Figure 9. Increase in cycling per person per day between 2015 and 2030, HSC.
a World Economic Outlook Database, October 2014, International Monetary Fund. Database updated on 7 October 2014. Accessed on 27 January 2015.
November 2015 itdp.org | 25
Car Trip Distance Distribution (n=748,918)
Copyright: Rob Haaren
Miles
Cum
ulat
ive
Trip
s (%
)
0.0%
0 10 20 30 40 50 60 70 80 90 100
20.0%
40.0%
60.0%
80.0%
100.0%
Figure 10. Percentage of car trip distances in the United States.17
Figure 11. Mode shares to 2050, High Shift Cycling Scenario
more transit-oriented system where many trips involve both cycles and public transport, with cycles providing the “first and last mile” linkage and bus or rail providing the “core” part of the trip. The specific assumptions can have major effects on the resulting impacts on overall mode shares, kilometers of passenger travel by mode, transport system energy use, CO2 emissions, and a range of cost indicators. The HSC scenario represents one plausible way in which these interactions could occur, based on the experi-ence of cities that have achieved high rates of cycling. The analysis provides estimates of how a high shift toward cycling could translate into changes in key indicators of interest.
The cycling modal shift assumptions are as follows:
1. Starting from the HS scenario from our 2014 Global High Shift study, for each country/region we removed the (usually small) increase in cycling/e-biking that was projected to 2050, leaving only the effects of (fairly large) increases in bus and rail transit systems and their mode shift effects.
2. We then reintroduced our new HSC projec-tions for cycling/e-bike travel.
3. We then reduced future travel from three modes: cars, motorized (typically gasoline) two-wheelers (M2W), and regular large and small buses to capture our mode shift to cycling. We did not lower the levels of travel on “rapid transit” modes (bus rapid transit and all urban rail modes). We assumed that these would remain at their high levels as part of our bicycle-enhanced future scenario.
4. We lowered travel by car/M2W/bus to offset the rise in cycling/e-bike passenger kilometers in a given year. For example, an increase of 100 kilometers per person per year of cycling in 2030 results in a com-bined reduction of 100 kilometers in car/M2W/bus travel.
5. The relative reduction among these three modes is determined by their initial shares in the given year. For example, if there is twice as much car PKT as bus PKT in 2030, car PKT is reduced by two times the kilometers than bus PKT (and the opposite if bus PKT starts out twice the level of car PKT). This allows the dominant modes in each region to provide the biggest share of travelers shifting to bikes. This is typically cars, but in some regions (for example, Japan and Africa), in 2030 buses provide more PKT than cars, so there is a bigger reduction as people shift to bicycles/e-bikes.
The results of this for 2030 and 2050, on an OECD/Non-OECD basis, are shown in Figure 12. This shows the BAU case, last year’s HS case with the BAU levels of cycling/e-biking, and the new HSC case with much greater levels of cycling and lower levels of travel by other modes.
The changes between these scenarios are more clearly explained in Figure 14, which shows the 2030 and 2050 differences between last year’s HS versus BAU and the new HSC changes versus BAU, for OECD and non-OECD. This clearly shows that the cycling and e-bike levels do not change for last year’s HS (since they were reset to BAU levels) whereas they change significantly for the HSC scenario. The impact of modal shift from these changes in cyling and e-biking is substantial: for example, in 2030 the drop in OECD driving was 18 percent in last year’s HS, but in the HSC driving decreases by 24 percent over BAU. In non-OECD, driving decreased by 21 percent over BAU in last year’s HS scenario, but in the HSC driving decreases by 29 percent over BAU.
Figure 13 also shows that there is a reduc-tion in the increase of bus travel in the HSC scenario versus last year’s HS, since some of the previous increase in bus travel is instead shifted over to bicycles/e-bikes.
November 2015 itdp.org | 27
Figure 12. PKT Comparison between BAU, 2014 HS and Current HSC, for OECD and Non-OECD.
0
2
4
6
8
10
12
14
OECD 2015 2030 BAU 2030 Old HS 2030 New HSC 2050 BAU 2050 Old HS 2050 New HSC
OECD 2030 OECD 2050
Trill
ion
PKT
PKT Comparison, OECD - BAU, OLD HS, New HSC
LDV Bus Other Cycling e-bikes
0
5
10
15
20
25
30
35
40
45
Non-OECD 2015 2030 BAU 2030 Old HS 2030 New HSC 2050 BAU 2050 Old HS 2050 New HSC
Non-OECD 2030 Non-OECD 2050
Trill
ion
PKT
PKT Comparison, Non-OECD - BAU, OLD HS, New HSC
LDV Bus Other cycling e-bikes
28 | A Global High Shift Cycling Scenario
-4.0
-3.0
-2.0
-1.0
0.0
1.0
2.0
3.0
LDV Bus Other cycling e-bikes LDV Bus Other cycling e-bikes
OECD Non-OECD
2030 Change from HS Excluding Cycling 2030 Change due to Cycling
-12.0
-10.0
-8.0
-6.0
-4.0
-2.0
0.0
2.0
4.0
6.0
8.0
LDV Bus Other cycling e-bikes LDV Bus Other cycling e-bikes
OECD Non-OECD
2050 Change from HS Excluding Cycling 2050 Change due to Cycling
Figure 13a. Change in PKT relative to BAU for previous HS and new HSC scenarios, 2030.Figure 13b. Change in PKT relative to BAU for previous HS and new HSC scenarios, 2050.
Note: For buses, the reduction in the HSC scenario is relative to the increase that occurred in the old HS scenario, so the net change in bus travel is still positive.
November 2015 itdp.org | 29
Impacts on Energy Use and CO2 Emissions
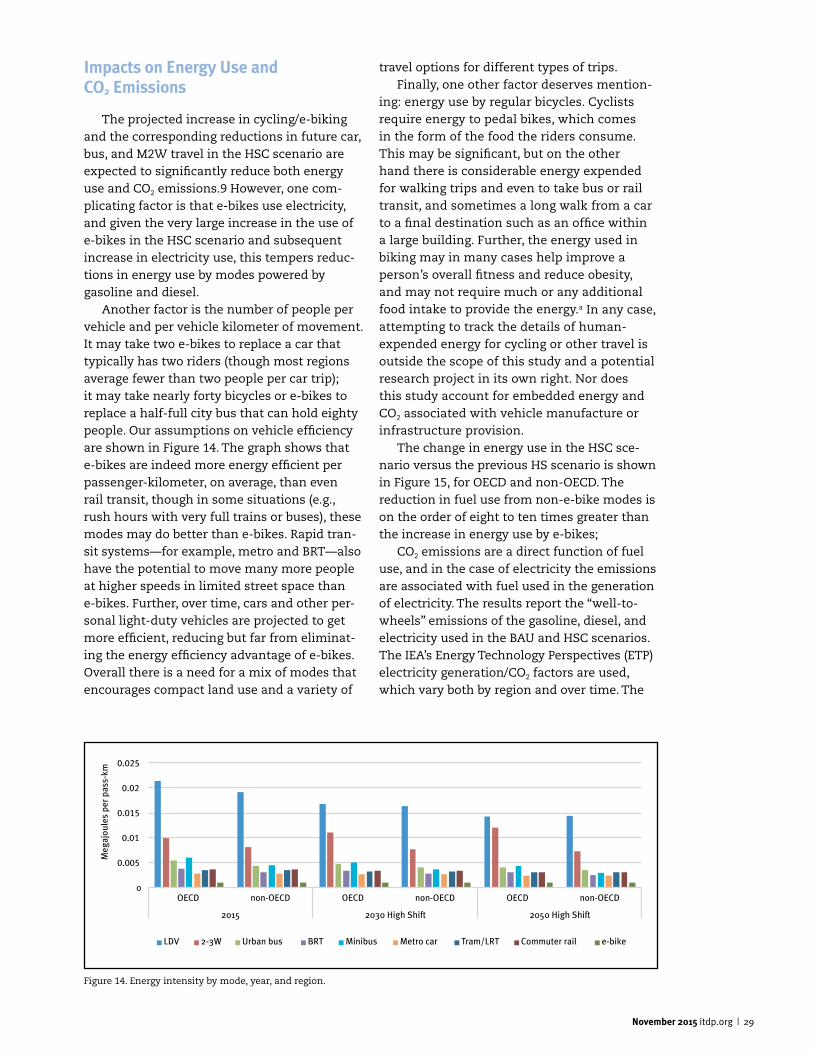
The projected increase in cycling/e-biking and the corresponding reductions in future car, bus, and M2W travel in the HSC scenario are expected to significantly reduce both energy use and CO2 emissions.9 However, one com-plicating factor is that e-bikes use electricity, and given the very large increase in the use of e-bikes in the HSC scenario and subsequent increase in electricity use, this tempers reduc-tions in energy use by modes powered by gasoline and diesel.
Another factor is the number of people per vehicle and per vehicle kilometer of movement. It may take two e-bikes to replace a car that typically has two riders (though most regions average fewer than two people per car trip); it may take nearly forty bicycles or e-bikes to replace a half-full city bus that can hold eighty people. Our assumptions on vehicle efficiency are shown in Figure 14. The graph shows that e-bikes are indeed more energy efficient per passenger-kilometer, on average, than even rail transit, though in some situations (e.g., rush hours with very full trains or buses), these modes may do better than e-bikes. Rapid tran-sit systems—for example, metro and BRT—also have the potential to move many more people at higher speeds in limited street space than e-bikes. Further, over time, cars and other per-sonal light-duty vehicles are projected to get more efficient, reducing but far from eliminat-ing the energy efficiency advantage of e-bikes. Overall there is a need for a mix of modes that encourages compact land use and a variety of
travel options for different types of trips.Finally, one other factor deserves mention-
ing: energy use by regular bicycles. Cyclists require energy to pedal bikes, which comes in the form of the food the riders consume. This may be significant, but on the other hand there is considerable energy expended for walking trips and even to take bus or rail transit, and sometimes a long walk from a car to a final destination such as an office within a large building. Further, the energy used in biking may in many cases help improve a person’s overall fitness and reduce obesity, and may not require much or any additional food intake to provide the energy.a In any case, attempting to track the details of human-expended energy for cycling or other travel is outside the scope of this study and a potential research project in its own right. Nor does this study account for embedded energy and CO2 associated with vehicle manufacture or infrastructure provision.
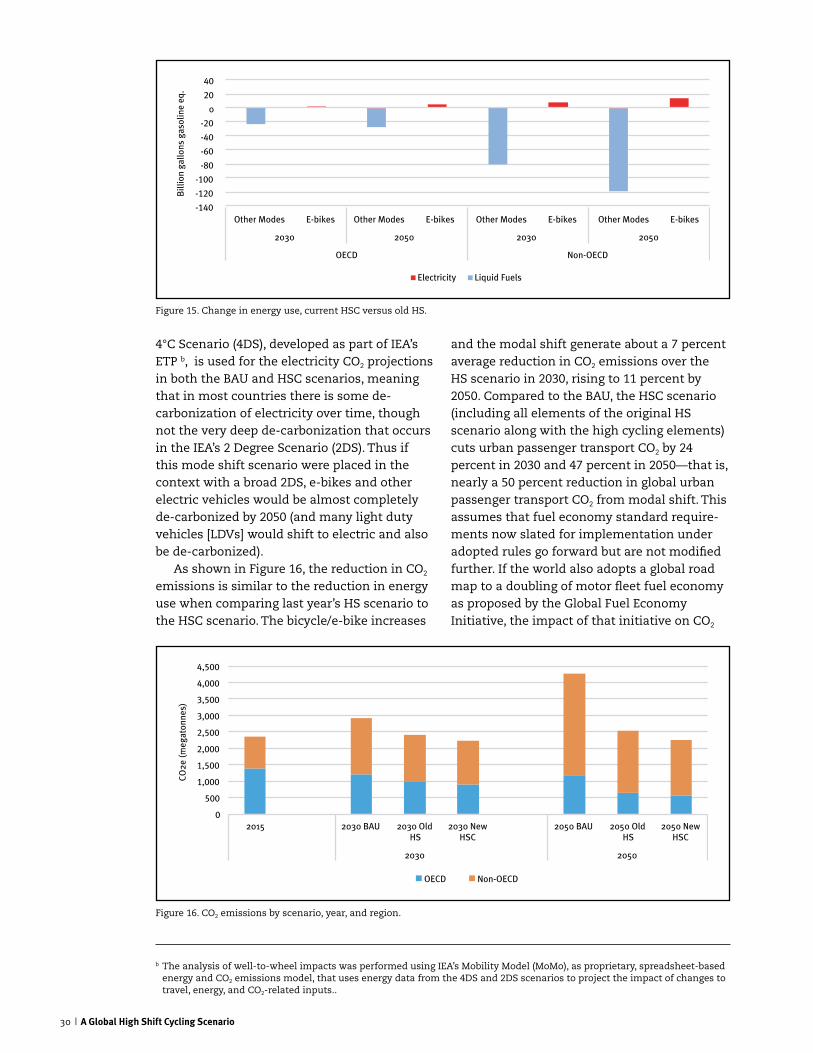
The change in energy use in the HSC sce-nario versus the previous HS scenario is shown in Figure 15, for OECD and non-OECD. The reduction in fuel use from non-e-bike modes is on the order of eight to ten times greater than the increase in energy use by e-bikes;
CO2 emissions are a direct function of fuel use, and in the case of electricity the emissions are associated with fuel used in the generation of electricity. The results report the “well-to-wheels” emissions of the gasoline, diesel, and electricity used in the BAU and HSC scenarios. The IEA’s Energy Technology Perspectives (ETP) electricity generation/CO2 factors are used, which vary both by region and over time. The
0
0.005
0.01
0.015
0.02
0.025
OECD non-OECD OECD non-OECD OECD non-OECD
2015 2030 High Shift 2050 High Shift
Meg
ajou
les
per p
ass-
km
LDV 2-3W Urban bus BRT Minibus Metro car Tram/LRT Commuter rail e-bike
Figure 14. Energy intensity by mode, year, and region.
30 | A Global High Shift Cycling Scenario
4°C Scenario (4DS), developed as part of IEA’s ETP b, is used for the electricity CO2 projections in both the BAU and HSC scenarios, meaning that in most countries there is some de-carbonization of electricity over time, though not the very deep de-carbonization that occurs in the IEA’s 2 Degree Scenario (2DS). Thus if this mode shift scenario were placed in the context with a broad 2DS, e-bikes and other electric vehicles would be almost completely de-carbonized by 2050 (and many light duty vehicles [LDVs] would shift to electric and also be de-carbonized).
As shown in Figure 16, the reduction in CO2 emissions is similar to the reduction in energy use when comparing last year’s HS scenario to the HSC scenario. The bicycle/e-bike increases
and the modal shift generate about a 7 percent average reduction in CO2 emissions over the HS scenario in 2030, rising to 11 percent by 2050. Compared to the BAU, the HSC scenario (including all elements of the original HS scenario along with the high cycling elements) cuts urban passenger transport CO2 by 24 percent in 2030 and 47 percent in 2050—that is, nearly a 50 percent reduction in global urban passenger transport CO2 from modal shift. This assumes that fuel economy standard require-ments now slated for implementation under adopted rules go forward but are not modified further. If the world also adopts a global road map to a doubling of motor fleet fuel economy as proposed by the Global Fuel Economy Initiative, the impact of that initiative on CO2
Figure 15. Change in energy use, current HSC versus old HS.
Figure 16. CO2 emissions by scenario, year, and region.
-140
-120
-100
-80
-60
-40
-20
0
20
40
Other Modes E-bikes Other Modes E-bikes Other Modes E-bikes Other Modes E-bikes
2030 2050 2030 2050
OECD Non-OECD
Bill
ion
gallo
ns g
asol
ine
eq.
Electricity Liquid Fuels
0
500
1,000
1,500
2,000
2,500
3,000
3,500
4,000
4,500
2015 2030 BAU 2030 Old HS
2030 New HSC
2050 BAU 2050 Old HS
2050 New HSC
2030 2050
CO2e
(meg
aton
nes)
OECD Non-OECD
b The analysis of well-to-wheel impacts was performed using IEA’s Mobility Model (MoMo), as proprietary, spreadsheet-based energy and CO2 emissions model, that uses energy data from the 4DS and 2DS scenarios to project the impact of changes to travel, energy, and CO2-related inputs..
November 2015 itdp.org | 31
emissions would overlap with the impact of the HSC scenario, making the marginal impact of each lower.
Costs and Savings Associated with the High Shift Cycling Scenario
As in last year’s high shift analysis, four basic types of costs are tracked for the current scenario: the purchase cost of vehicles (of all types); operation and maintenance costs for these vehicles and for systems such as metros and infrastructure such as roads and tracks; the initial construction costs of infrastructure associated with roads, parking, cycling, and transit systems; and the cost of energy used by vehicles in operation.
Cost Assumptions
We used the same estimates of infrastruc-ture and other costs per unit as in last year’s report, except that we updated some cost num-bers for bicycles and e-bikes. For the sales price of bicycles and e-bikes, we used recent Web searches of average prices in different parts of the world to develop very rough averages, and projected how those averages might change in the future. As shown in Figure 17, the average cost of bicycles and e-bikes is much higher in OECD countries than in China, or anywhere that has access to Chinese e-bikes. We assume that as lithium-ion battery costs decline so will the price of e-bikes that use them, and eventu-ally that e-bikes in the developing world can switch over to lithium-ion batteries at minimal price impact.
For the operations and maintenance costs of cycles and e-bikes, we assumed an annual
maintenance cost per unit for bicycles of US$30 in OECD countries and US$15 in non-OECD; for e-bikes we assumed much higher costs of US$100 in OECD and US$50 in non-OECD, mostly related to the maintenance and pos-sible replacement cost of batteries.
Finally, for the infrastructure costs related to cycling we assumed that cities would spend US$100,000 per kilometer of new cycle routes in OECD and half this cost in non-OECD countries. This covers a wide range of situ-ations from construction of new dedicated (or segregated) bike routes to re-striping of existing roads to provide bike lanes, and including secure bike parking facilities. These costs were applied to an estimate quantity of cycle lane construction, which in turn is linked to cycling levels (and thus rises with cycling levels over time). The ratios used were based on available data regarding the extent of cycle lanes relative to the total kilometers of cycling in a range of cities (thus this includes a large amount of cycling not actually using cycle lanes). For OECD a 2015 value of 4 million (annual) cycle kilometers per kilometer of cycle lanes is assumed, with a non-OECD average of 10 million. These ratios drop over time as strong investments are made in increasing the number of lane-kilometers. In other words, it is assumed that as more cycle infrastructure is built, more cycle kilometers are made using cycle infrastructure. OECD reaches a ratio of 2.5 million by 2050, with non-OECD reaching 5 million, reflecting growth in cycle lanes from about 200,000 kilometers worldwide in 2015 to more than 2 million by 2050.
Figure 17. Bicycle and e-bike average purchase cost by region and year.
$-
$200
$400
$600
$800
$1,000
$1,200
$1,400
$1,600
2015 2030 2050 2015 2030 2050
OECD Non-OECD
Bicycles E-bikes
32 | A Global High Shift Cycling Scenario
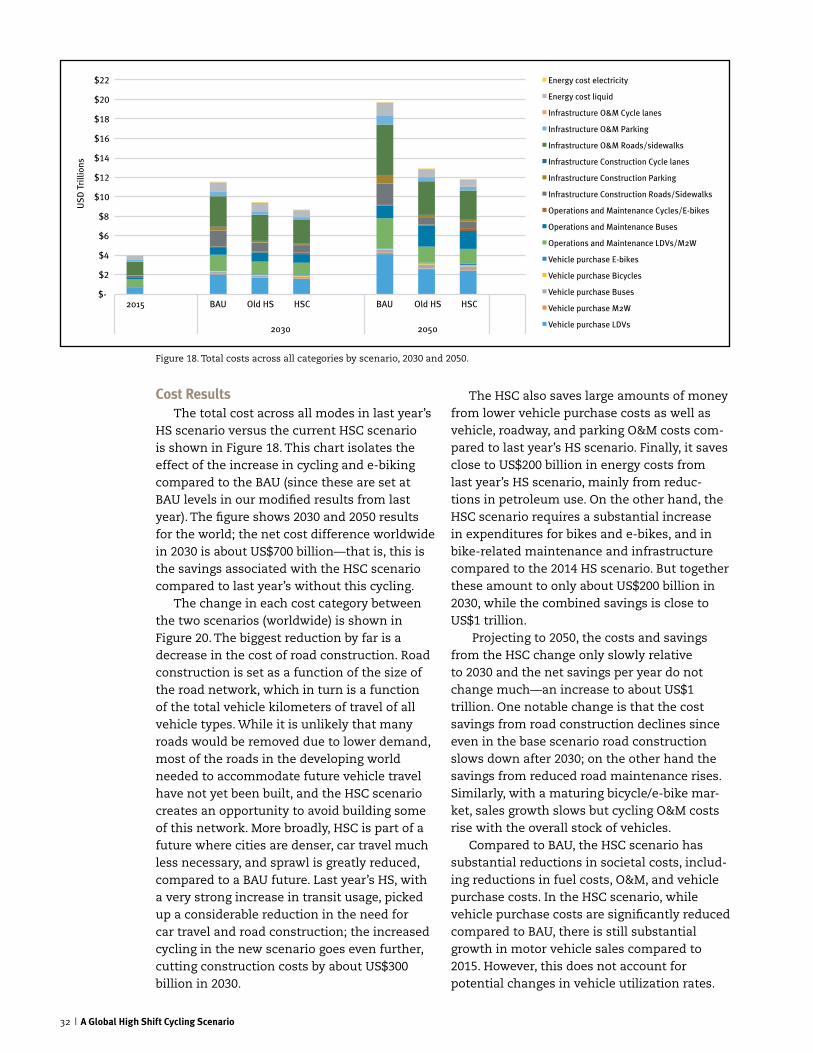
Cost Results The total cost across all modes in last year’s
HS scenario versus the current HSC scenario is shown in Figure 18. This chart isolates the effect of the increase in cycling and e-biking compared to the BAU (since these are set at BAU levels in our modified results from last year). The figure shows 2030 and 2050 results for the world; the net cost difference worldwide in 2030 is about US$700 billion—that is, this is the savings associated with the HSC scenario compared to last year’s without this cycling.
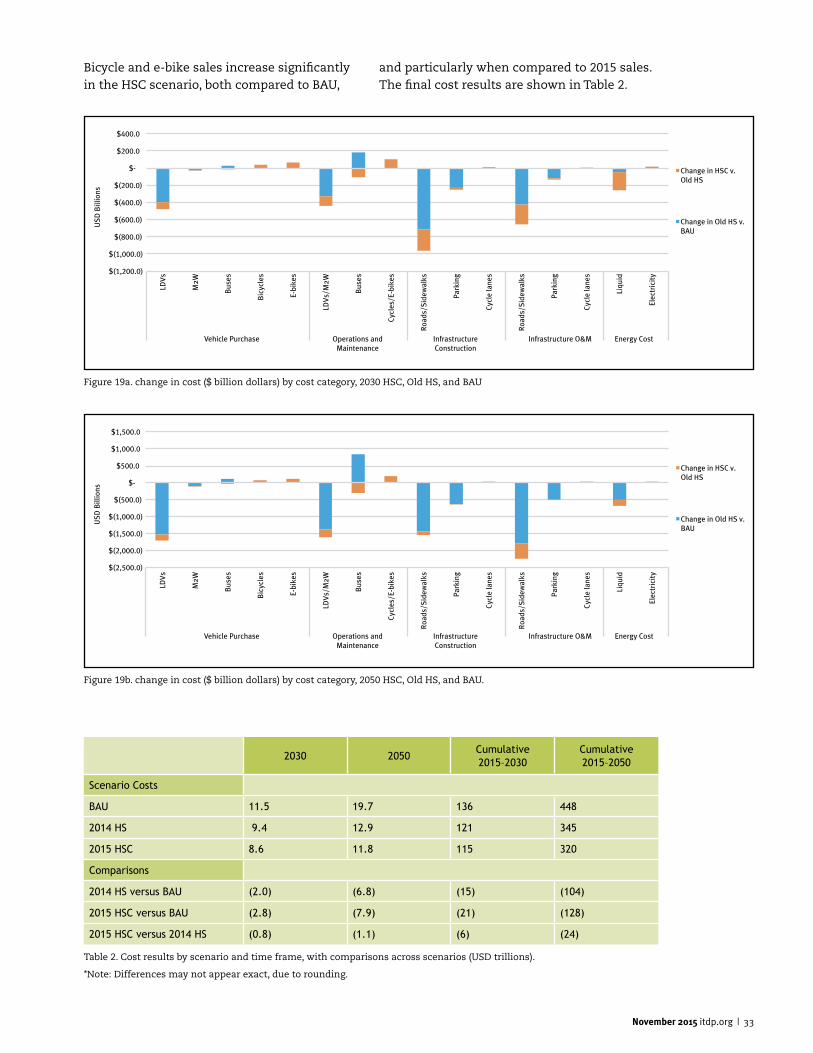
The change in each cost category between the two scenarios (worldwide) is shown in Figure 20. The biggest reduction by far is a decrease in the cost of road construction. Road construction is set as a function of the size of the road network, which in turn is a function of the total vehicle kilometers of travel of all vehicle types. While it is unlikely that many roads would be removed due to lower demand, most of the roads in the developing world needed to accommodate future vehicle travel have not yet been built, and the HSC scenario creates an opportunity to avoid building some of this network. More broadly, HSC is part of a future where cities are denser, car travel much less necessary, and sprawl is greatly reduced, compared to a BAU future. Last year’s HS, with a very strong increase in transit usage, picked up a considerable reduction in the need for car travel and road construction; the increased cycling in the new scenario goes even further, cutting construction costs by about US$300 billion in 2030.
The HSC also saves large amounts of money from lower vehicle purchase costs as well as vehicle, roadway, and parking O&M costs com-pared to last year’s HS scenario. Finally, it saves close to US$200 billion in energy costs from last year’s HS scenario, mainly from reduc-tions in petroleum use. On the other hand, the HSC scenario requires a substantial increase in expenditures for bikes and e-bikes, and in bike-related maintenance and infrastructure compared to the 2014 HS scenario. But together these amount to only about US$200 billion in 2030, while the combined savings is close to US$1 trillion.
Projecting to 2050, the costs and savings from the HSC change only slowly relative to 2030 and the net savings per year do not change much—an increase to about US$1 trillion. One notable change is that the cost savings from road construction declines since even in the base scenario road construction slows down after 2030; on the other hand the savings from reduced road maintenance rises. Similarly, with a maturing bicycle/e-bike mar-ket, sales growth slows but cycling O&M costs rise with the overall stock of vehicles.
Compared to BAU, the HSC scenario has substantial reductions in societal costs, includ-ing reductions in fuel costs, O&M, and vehicle purchase costs. In the HSC scenario, while vehicle purchase costs are significantly reduced compared to BAU, there is still substantial growth in motor vehicle sales compared to 2015. However, this does not account for potential changes in vehicle utilization rates.
Figure 18. Total costs across all categories by scenario, 2030 and 2050.
$-
$2
$4
$6
$8
$10
$12
$14
$16
$18
$20
$22
2015 BAU Old HS HSC Old HS HSC BAU
2030 2050
USD
Tri
llion
s Energy cost electricity
Energy cost liquid
Infrastructure O&M Cycle lanes
Infrastructure O&M Parking
Infrastructure O&M Roads/sidewalks
Infrastructure Construction Cycle lanes
Infrastructure Construction Parking
Infrastructure Construction Roads/Sidewalks
Operations and Maintenance Cycles/E-bikes
Operations and Maintenance Buses
Operations and Maintenance LDVs/M2W
Vehicle purchase E-bikes
Vehicle purchase Bicycles
Vehicle purchase Buses
Vehicle purchase M2W
Vehicle purchase LDVs
November 2015 itdp.org | 33
LDV
s
M2W
Bus
es
Bic
ycle
s
E-bi
kes
LDV
s/M
2W
Bus
es
Cycl
es/E
-bik
es
Roa
ds/S
idew
alks
Park
ing
Cycl
e la
nes
Roa
ds/S
idew
alks
Park
ing
Cycl
e la
nes
Liqu
id
Elec
tric
ity
Vehicle Purchase Operations and Maintenance
Infrastructure Construction
Infrastructure O&M Energy Cost
$(2,500.0)
$(2,000.0)
$(1,500.0)
$(1,000.0)
$(500.0)
$-
$500.0
$1,000.0
$1,500.0
Change in HSC v.Old HS
Change in Old HS v.BAU
USD
Bill
ions
$(1,200.0)
$(1,000.0)
$(800.0)
$(600.0)
$(400.0)
$(200.0)
$-
$200.0
$400.0
LDV
s
M2W
Bus
es
Bic
ycle
s
E-bi
kes
LDV
s/M
2W
Bus
es
Cycl
es/E
-bik
es
Roa
ds/S
idew
alks
Park
ing
Cycl
e la
nes
Roa
ds/S
idew
alks
Park
ing
Cycl
e la
nes
Liqu
id
Elec
tric
ity
Vehicle Purchase Operations and Maintenance
Infrastructure Construction
Infrastructure O&M Energy Cost
Change in HSC v.Old HS
Change in Old HS v.BAU
USD
Bill
ions
2030 2050Cumulative2015–2030
Cumulative2015–2050
Scenario Costs
BAU 11.5 19.7 136 448
2014 HS 9.4 12.9 121 345
2015 HSC 8.6 11.8 115 320
Comparisons
2014 HS versus BAU (2.0) (6.8) (15) (104)
2015 HSC versus BAU (2.8) (7.9) (21) (128)
2015 HSC versus 2014 HS (0.8) (1.1) (6) (24)
Table 2. Cost results by scenario and time frame, with comparisons across scenarios (USD trillions).
*Note: Differences may not appear exact, due to rounding.
Figure 19a. change in cost ($ billion dollars) by cost category, 2030 HSC, Old HS, and BAU
Figure 19b. change in cost ($ billion dollars) by cost category, 2050 HSC, Old HS, and BAU.
Bicycle and e-bike sales increase significantly in the HSC scenario, both compared to BAU,
and particularly when compared to 2015 sales. The final cost results are shown in Table 2.
34 | A Global High Shift Cycling Scenario
As outlined above, the HSC scenario is a highly ambitious but achievable plan for urban transportation, broadly reflecting a new para-digm of urban development in which public policies are directed toward an urban form that encourages a dramatic reduction in motor vehicle use, with much more active transport along with mass transit use. In this scenario, cars and motorized two-wheelers (such as motorcycles, mopeds, motorbikes, etc.) are subject to use restrictions, pricing, parking, and speed management to limit their usage and minimize their negative impact. Restrictions on motorized two-wheelers have been imple-mented successfully in China, and restrictions on automobiles have been implemented in cities around the world. It is critical to address all types of motor vehicles that rely on internal combustion engines (ICE), as the growth of motor vehicle use may occur primarily through increased car use in one region but increased ICE two-wheelers in another.
The overarching policy changes enable a particularly strong increase in urban cycling. Thus the HSC scenario is predicated upon an aggressive policy agenda where tough political decisions are made at the national level and in cities around the world in favor of density, locational efficiency, mixed use, and parking management. Supporting poli-cies directly encourage cycling, walking, and transit, through extensive infrastructure and excellent intermodal connections. In most countries, such policy decisions will require a radical shift away from the current trajectory in transportation and land-use policy. Political leaders have strong incentives to choose this path, as it leads to a dramatic reduction in societal investments and operating and energy costs, and it provides improved economic well-being, enhanced social equity and stabil-ity, and strong reductions in environmental damage over the current trajectory. Many cities
and countries have already chosen this path, providing tangible evidence of the benefits that can be accrued from this type of investment.
Cycling is vital to the HSC scenario, in part because cycling rates can grow dramatically in a very short amount of time and support a substantial percentage of trips. Over the long term, it may be possible for many cities to replicate the success of cycling in cities such as Groningen, Assen, and Amsterdam in the Neth-erlands, where cycling exceeds 40 percent of all trips, and in Copenhagen in Denmark, which grew from low levels of cycling after World War II to more than 45 percent of trips today.c, d Such cities have succeeded by providing seamless infrastructure and a host of supportive poli-cies to make cycling a safe, comfortable, and efficient option for a large number of trips. But in the short term, most efforts should be mod-eled after cities that have succeeded in rapidly growing cycling from very low levels, in some cases from near zero to more than 5 percent mode share in just a few years. Seville, Spain, is particularly relevant, as it grew cycling mode share from 0.5 percent to nearly 7 percent of trips in six years (2006–2012), with the number of cycling trips increasing from five thousand to seventy-two thousand per day.c Seville achieved this by installing a backbone network of nearly 130 kilometers of protected cycle lanes (cycle tracks) throughout the city and implementing a bike share program with 2,500 bicycles and 258 stations in a dense bike share network across the city. Paris, Buenos Aires, and Montreal have also experienced similarly rapid increases in cycling through investments in low-stress networks of cycling infrastructure and large-scale bike sharing schemes.
Substantial restraint on motor vehicle speed and volumes is the other widespread policy implementation that complements cycling infrastructure. In Europe and Japan historic city cores have kept high densities of population,
5. The High Shift Scenario: A Policy Narrative
c http://lcc.org.uk/pages/seville-goes-dutch.
November 2015 itdp.org | 35
Buenos Aires has seen rapid growth in cycling
through the implementation of a large-scale network of
protected bike lanes throughout the city. More than 140
kilometers of lanes were installed beginning in 2010. A
system began operation in 2010. This system has since
expanded to two hundred stations and was converted to
an automated system in 2015. These improvements have
caused bicycling to jump from less than 0.5 percent of
trips in 2010 to more than 3.5 percent of trips today.
In addition, many downtown streets in Buenos Aires
are in the process of being pedestrianized or heavily traffic
calmed, supporting active and public transportation. The
city has also installed multiple bus rapid transit (BRT)
corridors, knitting farther reaches of the city together,
and allowing for a wide variety of trips to be completed
quickly and comfortably through a combination of cycling,
walking, and public transport.
narrow streets, and often have substantial car-free zones. This was important in the case of Seville and is seen in the central zones of many Dutch cities. In the United Kingdom, which overall has a low cycling mode share, the highest mode shares are achieved in York and Cambridge, which have historic centers that have been car-free since the 1970s. Tokyo and other Japanese cities have long maintained high levels of cycling (many exceeding 20 percent of trips) through dense urban develop-ment and networks of streets designed for low speeds and low volumes of motor vehicles, which support cycling with fewer lanes for cycling.18
In the HSC scenario, the following policies, based on a number of best practice cycling policy recommendations 19,20 are used to quickly increase cycling levels:
• Cycling infrastructure is retrofitted onto existing streets and roads with relatively inexpensive materials to create backbone networks of low-stress bicycle routes on arterial streets, small residential streets, and even intercity roads;
• Construction includes 1 kilometer of cycling lanes (either pathways or striped lanes on city streets, along with street furniture and secure bike parking) for every 2.5 million cycling kilometers that occur each year;
• Implementation of bike share programs in large cities to connect to transit and provide initial impetus for cycling;
• Laws and enforcement practices are changed to better protect cyclists and walkers;
• Aggressive investment is also made in walking facilities and public transport to create a menu of transport options in cities that can be combined to accommodate a wide variety of trips without the need for motor vehicle use;
• Metropolitan land-use and transportation planning are coordinated so that new urban development investments are directed toward parts of the city where existing and planned cycling, walking, and public transit
Sou
rce:
CC
Im
age
cou
rtes
y of
ad
rim
cm o
n F
lick
rSo
urc
e: I
TD
P
Figure 20. Seville Bicycle Infrastructure
Figure 21. Buenos Aires Bicycle Infrastructure
36 | A Global High Shift Cycling Scenario
infrastructure can accommodate nearly all trips from that development without spurring additional motor vehicle use. New transportation investments are planned for areas where they can most effectively reduce existing motor vehicle use;
• Policies that had formerly supported additional motor vehicle use, such as minimum parking requirements, free park-ing on public streets, and fuel subsidies are eliminated;
• Policies such as congestion pricing, VKT fees, and development impact fees are adopted to charge a price for driving that accounts for negative externalities. These fees fund investment in sustainable trans-port;
• Funding is increased for sustainable transport to allow for high and sustained investment in cycling, walking, and public transportation infrastructure and services;
• National policies support and spur city-level change by providing funding for cities to invest in cycling and other active and public modes, and financing to help leverage existing revenue streams to spur large-scale investment;
• National governments adopt best prac-tice standards from the best performing countries to ensure that the highest quality infrastructure is built;
• Global institutions, such as development banks, change lending practices to shift investment from roads toward cycling and other more sustainable modes.
A significant change in motor vehicle tech-nologies is also going to happen in the time frame under consideration, complemented by a big shift in city management toward the so-called smart or connected cities with an emphasis on multimodal transport choice and transportation demand management. In an HSC scenario, it is essential that cycling be fully integrated into such policies and practices as they are developed on a number of levels. New technologies should be crafted with cycling safety in mind, exploiting the automation of
driving and motor vehicle speed (Intelligent Speed Adaption) to eliminate road crash fatali-ties (Vision Zero), boost vehicle occupancy and utilization rates, curb demand for parking, and reallocate space for better bicycle facilities. For example, while policies promoting automated motor vehicles are attractive and may encour-age some cycling, in an HSC scenario, priority is given to policies that more directly lead to mode switching, given the health, congestion, and cost benefits of shifting trips to cycling from motor vehicle use.
Regions with Low CyclingRegions with low cycling are defined as
either having very low cycling mode shares (less than 5 percent, such as in the United States) or having cycling done almost exclu-sively by people with low incomes. In the latter, cycling mode shares are typically declining as individuals in growing economies are able to afford alternatives to cycling.
Both of these types of countries can achieve moderate cycling levels within five years through adopting the following policy measures. Cities must first adopt rapid infra-structure implementation programs, focusing on building backbone networks of connected, high-quality bicycle facilities and bicycle-prior-ity streets, spaced evenly roughly 1–2 kilome-ters apart across cities, so that it is possible to traverse the city by bicycle without encounter-ing any stressful situations. In addition, cities should implement a large-scale rollout of bicycle sharing programs with densely spaced stations and a high ration of bicycles to resi-dents. This allows bicycles to be used without requiring a bicycle purchase, introducing many people to cycling and allowing cycling trips to be combined with transit trips to accom-modate longer trips by bicycle. Both backbone networks and bike sharing schemes can move from concept to implementation in well under five years, allowing for rapid growth in cycling. Funding for these efforts should come from reallocating existing urban roadway expan-sion funds toward sustainable transportation, particularly cycling infrastructure.
In tandem with improved infrastructure, cities must take the first steps to improve laws to protect people on bicycle and on foot. Laws should clarify right-of-way regulations, with some priority toward cycling and walking, and police officers should be trained to better
November 2015 itdp.org | 37
understand and enforce these laws.Low-cycling cities must also take first steps
to reduce motor vehicle travel. These include adopting demand-based on-street parking pricing, where the price of curbside parking is set with a goal of 85 percent occupancy. In addition to improving the allocation of curb space, this is used in tandem with the realloca-tion of street space, so that when, for example, parking space is reallocated to bicycle infra-structure, the demand for parking is reduced through a corresponding increase in parking price for the remaining parking spaces in the area. Cities must also develop transporta-tion and land-use plans for directing urban growth toward parts of the city with existing and planned cycling, walking, and public transit infrastructure that can accommodate the vast majority of trips. To fund large-scale investments in cycling, walking, and transit infrastructure, cities should begin developing new funding mechanisms, such as congestion pricing and VKT fees.
National governments should adopt poli-cies to prioritize cycling, walking, and transit at the national level. These policies include adopting best practice design standards for street design based on street design guides in the Netherlands, which is widely regarded as having designs most conducive to high levels of cycling, walking, and transit. To ensure that these designs are implemented well, national governments need to fund training for plan-ners and engineers to understand how these guidelines work. This includes visits from Dutch and Danish engineers and planners, to provide firsthand design training and to present tactile local examples of world-class street designs. To increase the speed of infra-structure implementation, national govern-ments also should provide funding to cities to adopt rapid cycling infrastructure programs. Bicycle network funding can often be diverted from existing urban roadway construction funds. National governments must also provide project financing to maximize the amount of infrastructure that can be built with available resources, again, to greatest effect where local governments are not able to obtain financing themselves.
National governments should also fund transportation and land-use planning efforts, requiring that plans include concrete strategies to reduce motor vehicle use. To help cities fund
the implementation of such plans, national governments should also provide funding and guidance for VKT fee programs and congestion charging schemes, with the condition that the revenue from these programs be devoted to the implementation of sustainable transporta-tion plans. National governments can also act to reduce incentives for driving, such as fuel subsidies, parking subsidies, and other policies that serve to encourage more driving. Coun-tries should also end government funding and financing of limited access and high-capacity roads and flyovers in urban areas, and existing roads of this type should be tolled and eventu-ally replaced with streets more conducive to sustainable transportation.
Bilateral and multilateral development banks, which typically finance projects in locations with declining levels of cycling and walking, can redirect all financing from urban roads to the financing of bicycle backbone networks, walking infrastructure, and rapid transit systems. The banks should adopt best practice design guidelines that direct invest-ment toward the highest quality projects that are implemented in the shortest amount of time.
Regions with Moderate CyclingRegions with moderate levels of cycling
include those with 5 to 15 percent mode share and significant levels of cycling by middle-class residents. These regions can move to high levels of cycling in five to ten years through the adoption of the following policies. In cities with moderate levels of cycling, plans can be developed to improve existing infrastructure to meet best practice designs and to expand the network of bicycle infrastructure and cycle-priority (low automobile speed, low automobile volume) streets to include all streets in the city. This includes decoupling existing motor vehicle routes from cycling routes on most residential and many commercial streets. This way, cycling trips are made directly and conveniently to all destinations in a city, but automobile trips are diverted around the densest parts of cities and residential neigh-borhoods, while still allowing for some local access. Infrastructure improvements can also include retiming traffic signals to prioritize the efficient movement of bicycles and mass transport vehicles over other modes. This way, motor vehicle travel speeds can be further
38 | A Global High Shift Cycling Scenario
reduced and cycling becomes a more efficient means of reaching destinations.
To boost safety, cities should adopt strict liability legislation, as currently in place in the Netherlands, which presumes that the most vulnerable users—people on bicycles and on foot—have priority at junctions, unless proved otherwise.3,10 Speed limits can be reduced in tandem with slower street designs to mitigate damage should crashes occur. Police officers should receive extensive training in the enforcement of driver behavior that most negatively impacts cycling and walking. Driver education policies should better educate driv-ers in safe driving, particularly around people cycling and walking.
Plans for large-scale transportation invest-ments must be adopted and implemented, creating large networks for cycling, rapid tran-sit, and walking, seamlessly connected through highly accessible transit stations with ample cycle parking and integrated payment schemes for transit, bike share, car share, and other forms of shared mobility. These infrastructure projects can be funded through the adoption of VKT fees and congestion pricing, which have the double effect of discouraging driving while funding effective alternative modes. These also provide a stable funding source, which cities can borrow against to implement more proj-ects in a shorter time frame. To further reduce demand for motor vehicle travel, off-street parking policies should be revised to eliminate required parking from new development and to cap the number of parking spaces in each area based on the level of motor vehicle use that can be accommodated effectively by nearby infrastructure.
In cities with high levels of motorized two-wheeler use, policies should be adopted to restrict those vehicles and promote e-bicycles instead. E-bikes should be allowed to use urban bicycle infrastructure, but only within regu-lated speeds (less than 20 kilometers per hour). New restrictions must be heavily enforced to maintain a high level of comfort and safety for people on non-assisted bicycles. In addition, new higher-speed infrastructure can be built to allow e-bikes to substitute for longer-distance trips, particularly in suburban areas outside city centers. E-bikes (like bicycles) should be permitted/encouraged to move with the flow of motor vehicle traffic as speeds and safety considerations permit.
Regions with High CyclingRegions with high cycling have mode share
of 15 to 30 percent and high levels of cycling across a wide range of the population, includ-ing some cycling among the upper classes and politicians. Cities with high levels of cycling should focus on further expansion of cycling through investment in e-bike infrastructure, particularly in lower-density areas where trips are longer, transit is less prevalent, and motor vehicle use is greater. This infrastructure should be designed for slightly higher speed (30 kilometers per hour), as is currently being developed in the Netherlands. This infrastruc-ture should allow for longer trips to be made by bicycle, with a more direct substitution for motor vehicle trips. These cities should contin-ue to improve existing infrastructure to bring all infrastructure up to the highest standards.
These cities need to focus heavily on reducing driving in existing development and ensuring that new development does not spur additional motor vehicle use. This includes promoting the redevelopment of lower density suburbs to transform them into more urban, higher density, mixed-use areas that are more supportive of cycling, walking, and transit trips.
As self-driving cars become more prevalent, intelligent national and local policies should help guide their use as a complement to cycling, transit, and walking. Specifically, the expansion of self-driving cars should be guided toward eliminating road crash fatalities (Vision Zero), boosting vehicle occupancy and utiliza-tion rates to curb demand for parking, reducing the operating cost of transit, and removing on- and off-street parking.
Implications for COP 21An HSC scenario, prioritizing cycling, walk-
ing, and public transport while restricting motor vehicle use, can achieve a 50 percent reduction in urban transport CO2. The 2015 United Nations Climate Change Conference (COP 21) in Paris provides an excellent opportunity to move global policy toward supporting this scenario. To do so, cycling targets for things such as cycling mode share, cycling infrastructure investment, and the introduction of e-bikes as part of national mobility strategies could be set at the country level to define goals and measure prog-ress toward them. Countries can make commit-ments to these targets as well as toward other supportive investment in walking and public
November 2015 itdp.org | 39
transportation necessary to achieve a future based on more sustainable transportation.
Other measures such as fiscal and tax incentives and the switching of fossil fuel sub-sidies to cycling and e-biking are already being discussed in Europe and could be extended elsewhere. 21
Conclusions/Next Steps Based on this study, it is likely that an HSC
scenario will result in greatly reduced fuel consumption, emissions, and spending on transportation while maintaining high levels of access and a high quality of life. A rapid increase in cycling and e-biking in particular contributes nearly 10 percent of additional emissions reductions on top of the HS scenario shift to public transportation. Costs resulting from the shift to cycling lead to an estimated annual savings of US$700 billion per year, with a cumulative savings of US$25 trillion dollars from 2015 to 2050.
Since the HSC scenario saves money, paying for it is not problematic. Cities and countries across the spectrum of wealth have demon-strated the potential for rapid increases in cycling, and it is clear that such a scenario is entirely possible in the given time frame. How-ever, a large amount of political will is required to change course from the BAU to implement an HSC scenario, and it is not clear if cities and countries will be able to find such will, especially given the low capacity for long-term planning in many places.
To improve on this study, better data on existing cycling rates and trends would be very useful. In particular, better data on cycling trip distances, mode shares, and trip rates around the world would help create a more accurate model. Data from developing regions, such as Africa and the Middle East, would be greatly beneficial. Data points over time for more locations would also help clarify current trends to create better projections. This data can be collected going forward through household travel surveys or from newer sources, such as cell phone data.
Finally, this research could be expanded to assess other co-benefits and impacts of greatly increased cycling. These could include the health and economic impacts of more physi-cal activity and greater work productivity. In developed nations, for instance, the health impacts of regular cycling on populations that are otherwise often highly sedentary are remarkable, with cycling to work reducing the risk of mortality by almost 40 percent.22 Fur-ther research could also examine the reduced social cost of traffic congestion from a future less dependent on motor vehicle use and the change to traffic injuries and deaths from streets that prioritize safe cycling and walking over driving speeds. The European Cyclists’ Federation has already completed several such international studies at the EU level including health, employment, and economic impacts, and there would be considerable value in extending these to a global scale.
40 | A Global High Shift Cycling Scenario
1 Kuster, F. A European Roadmap for cycling – ECF. 1–14 (2015).
2 Replogle, M. & Fulton, L. A Global High Shift Scenario : Impacts And Potential For More Public Transport, Walking, And Cycling With Lower Car Use. (2014).
3 Pucher, J. & Buehler, R. Making Cycling Irresistible: Lessons from The Netherlands, Denmark and Germany. Transp. Rev. 28, 495–528 (2008).
4 Pucher, J. & Buehler, R. Cycling for Everyone: Lessons from Europe. Transportation Research Record: Journal of the Transportation Research Board 2074, 58–65 (2008).
5 Bonifazi, E. et al. Emerging technology trends and innovation processes for the low carbon economy – electric two-wheelers. (2013).
6 Skougaard, B. Denmark National Travel Survey. 16, 191–194 (2013).
7 Dulac, J. Global Land Transport Infrastructure Requirements: Estimating road and railway infrastructure capacity and costs to 2050. 54 (2013).
8 Pucher, J. & Buehler, R. Sustainable transport in Canadian cities: Cycling trends and policies. Berkeley Plan. J. 19, 97–123 (2006).
9 CityRyde LLC. Methodology for Determining GHG Emission Reductions Through Bicycle Sharing Projects. Methodology (2011).
10 Ministry of Transport & Management Public Works and Water. Cycling in the Netherlands. 77 (2009). at http://www.fietsberaad.nl/library/repository/bestanden/CyclingintheNether-lands2009.pdf
11 Mayne, K. Report to the Pro E-bike Project : Market potential for Pro E-bike services in South America . 1–18 (2014).
12 Ricci, M. Bike sharing: A review of evidence on impacts and processes of implementation and operation. Res. Transp. Bus. Manag. 15, 28–38 (2015).
13 Starkey, P. & Hine, J. Poverty and sustainable transport How transport affects poor people with policy implications for poverty reduction A literature review. (2014).
14 Weinert, J. X., Ma, C., Yang, X. & Cherry, C. R. Electric Two-Wheelers in China: Effect on Travel Behavior, Mode Shift, and User Safety Perceptions in a Medium-Sized City. Transp. Res. Rec. 2038, 62–68 (2008).
15 Dekoster, J. & Schollaert, U. Cycling: the way ahead for towns and cities. Reproduction (1999). doi:10.1038/5000250
16 Vandenbulcke, G. et al. Mapping bicycle use and the risk of accidents for commuters who cycle to work in Belgium. Transp. Policy 16, 77–87 (2009).
References
November 2015 itdp.org | 41
17 Haaren, R. Van. Assessment of Electric Cars ’ Range Requirements and Usage Patterns based on Driving Behavior recorded in the National Household Travel Survey of 2009. 1, 56 (2012).
18 Pucher, J., Dill, J. & Handy, S. Infrastructure, programs, and policies to increase bicycling: an international review. Prev. Med. (Baltim). 50 Suppl 1, S106–25 (2010).
19 Dufour, D. PRESTO Cycling Policy Guide - General Framework. Intell. Energy - Eur. (2010).
20 Todd Litman, Robin Blair, Bill Demopoulos, Nils Eddy, Anne Fritzel, Danelle Laidlaw, Heath Maddox, K. F. Pedestrian and Bicycle Planning A Guide to Best Practices. 155 (2015).
21 Haubold, H. Commuting : Who Pays the Bill? Overview of fiscal regimes for commuting in Europe. Eur. Cycl. Fed.
22 Anderson, L. B., Schnohr, P., Schroll, M. & Hein, H. Q. All-cause mortality associated with physi-cal activity during leisure time, work, sports, and cycling to work. Arch Intern Med 1621–8 (2000). at http://www.ncbi.nlm.nih.gov/pubmed/10847255