29
California’s Welfare Recipients Family Circumstances, Income, and Time on Aid among CalWORKs Families May 2012 Caroline Danielson with research support from Daniel Krimm

California’s Welfare Recipients
Family Circumstances, Income, and Time on Aid among CalWORKs Families
May 2012
Caroline Danielson with research support from Daniel Krimm

http://www.ppic.org/main/home.asp California’s Welfare Recipients 2
Summary
CalWORKs—cash assistance and welfare-to-work services for low-income families—is an important part of California’s social safety net. A core goal of the program is basic financial support for low-income families with children. The second main goal is to increase parents’ ability to earn their way off CalWORKs (while likely still making use of other safety programs such as Medi-Cal, CalFresh, and federal and state tax credits for working families). To help realize these goals, the program includes both work incentives and penalties for parents. At the same time, California’s distinctive interpretation of these goals means that, regardless of the parents’ engagement with the self-sufficiency goal, children remain eligible for benefits.
Spurred by state budget constraints, substantial changes to the program have occurred over the past three years. In addition, Governor Brown proposed a major restructuring of the program in January. Today, policymakers face important questions about the income support, work incentives, and work services that are integral to CalWORKs.
Establishing a framework for a more detailed understanding of families on CalWORKs can provide important, informative background. To that end, this report characterizes typical CalWORKs families, their income sources, parents’ hours of work, and the length of time they receive CalWORKs. (We have relied mainly on 2009 data regarding a random sample of CalWORKs families collected by counties and reported to the federal government.)
We find that:
Families on CalWORKs are clearly disadvantaged – they have low incomes and low educational attainment – and they rely heavily on their CalWORKs grant as a source of income.
Many families rely on CalWORKs for short periods. Close to half of families currently on CalWORKs have relied on the program for two years or less.
Fewer families use CalWORKs for much longer periods: About 18 percent of CalWORKs families have received assistance for more than six years. Stays appear to be longer for families with greater disadvantage—for instance, the parents lack a high school degree.
CalWORKs families currently targeted by welfare-to-work services have higher earnings than other groups of parents, but relatively few have part or full time jobs in unsubsidized employment.
Taken together, these findings indicate that a stint on CalWORKs is comparatively transitory for many, although not all families. Policymakers could consider additional means of advancing child well-being and family self-sufficiency for those with long records of CalWORKs assistance. In addition, welfare-to-work services may be assisting parents to gain a toehold in the labor force, despite the fact that full-time employment remains a lofty goal for most current CalWORKs parents. Policy changes that decrease the share of parents required to work (and therefore provided with welfare-to-work services) may make the goal of working ones way off CalWORKs less attainable.

Contents
Summary 2
Figures 4
Tables 5
Abbreviations 6
Introduction 7
CalWORKs Income Support and Work Services 8
Who Makes Use of CalWORKs? 11
How Much Does CalWORKs Supplement Family Incomes? 14
How Much Do CalWORKs Parents Work? 19
How Long Do Families Stay on CalWORKs? 22
Conclusion 25
References 26
About the Author 27
Acknowledgments 27
Technical appendices to this paper are available on the PPIC website: http://www.ppic.org/content/pubs/other/512CDR_appendix.pdf
http://www.ppic.org/main/home.asp California’s Welfare Recipients 4
Figures
1. Over the past decade, CalWORKs grants to families fell 8
2. CalWORKs is the largest source of income for CalWORKs families 14
3. Earnings vary considerably across subgroups of CalWORKs families 16
4. Close to half of families currently on CalWORKs have received assistance for two years or less 23
http://www.ppic.org/main/home.asp California’s Welfare Recipients 5
Tables
1. Most CalWORKs families have one or two children and at least one is under age six 13
2. Housing and child care assistance are much less common than subsidized health insurance 18
3. Unsubsidized employment accounts for most of the work in which parents are engaged, but other types of employment also play a role 21
4. While long stays on CalWORKs diverge across subgroups, short stays are similar in length 24

http://www.ppic.org/main/home.asp California’s Welfare Recipients 6
Abbreviations
AFDC Aid to Families with Dependent Children
CalWORKs California Work Opportunity and Responsibility to Kids
EITC Earned Income Tax Credit
SNAP Supplemental Nutrition Assistance Program
SSI Supplemental Security Income
TANF Temporary Assistance for Needy Families
http://www.ppic.org/main/home.asp California’s Welfare Recipients 7
Introduction
The CalWORKs program is a critical piece of California’s social safety net.1 And though many poor children in California do not receive CalWORKs assistance at a given point in time, the program’s principal goal is to provide a measure of income security for low-income families with children.2 Additionally, a second key aim of CalWORKs is to increase parents’ earning power and thus help them gain independence from welfare. To further that purpose, many parents who receive assistance must either work or engage in a specified set of activities intended to lead to employment. Such parents receive “welfare-to-work” services to help them find and keep jobs; they also face the possibility of losing the adult portion of the family’s grant if they do not comply with the program’s work requirements or receive assistance for too many years.
In the past three budget years, policymakers have exempted parents of young children from the program’s work requirements, shortened the length of time that parents are eligible for grants and work services, and cut grants to all families. These changes substantially modified earlier policy. In January Governor Brown proposed to shift the program’s work focus by concentrating welfare-to-work services on families in the first two years of assistance. Parents who have received CalWORKs assistance for two to four years would retain eligibility for welfare-to-work services and their portion of the family’s grant only if they were working a substantial number of hours in unsubsidized employment (essentially a regular job). If implemented, these changes would substantially rework current policy.
The recent changes have resulted in budget savings because they limit work services and lower grants to families, and the governor’s proposed changes would continue that trend.3 But competing policy themes have also emerged out of these actions. They include: For whom is work an important goal? Parents with older children? Or those in their initial months of assistance? And in what ways, and to what extent, should income support for children be tied to parents’ compliance with work requirements? The expectation that it will take years to recover the jobs lost in the state during and after the Great Recession makes these questions even more fraught.
To provide a context for discussing these and related issues, this report presents a snapshot of CalWORKs families in 2008–09, relying primarily on data collected by counties about a randomly sampled group of CalWORKs families. Because this period was one in which the statewide unemployment rate never dipped below 10 percent, we also present some comparisons to the same span of months in 2006–07, when the unemployment rate averaged 5.4 percent.4
We begin by broadly describing changes to CalWORKs grant amounts and work services over the past decade. In the sections that follow, we focus in on CalWORKs family characteristics, sources of income, and prevalence of employment. Finally, we assess the length of time that families typically remain on CalWORKs.
1 Officially rolled out in 1998, California Work Opportunity and Responsibility to Kids (CalWORKs) is California’s Temporary Assistance for Needy Families (TANF) program. 2 Measuring a family’s income in relationship to the federal poverty line is only an approximate rendering of the actual, more complex income and assets criteria of the program. 3 The picture of trends in the safety net as a whole is more complex. In terms of overall government spending in the U.S., funds have grown. However, a larger share is made up of health insurance than previously, and funds have shifted toward serving the low-income working poor and the disabled and away from the non-disabled and those in deep poverty (Ben-Shalom, Moffitt, and Scholz, 2011.) 4 These data are known as the TANF Data Reports and are reported to the federal government as one of the state’s obligations to qualify for $3.7 billion in federal funding that supports CalWORKs and related programs. The data presented represent averages for federal fiscal years 2007 and 2009 (e.g., October 2008 to September 2009). Data for 2009 were the most recent publicly available when preparing this report. We describe these data in more detail in Technical Appendix A, and they can be obtained for every state from http://aspe.hhs.gov/ftp/hsp/tanf-data/index.shtml.

http://www.ppic.org/main/home.asp California’s Welfare Recipients 8
CalWORKs Income Support and Work Services
During the past decade the income support that CalWORKs provides has been steadily declining. Figure 1 shows that the average CalWORKs family grant dropped from $625 in 2001to $460 in 2011, after adjusting for inflation. This differs from several other large, means-tested income-support programs, which have seen automatic adjustments for inflation and grant increases in the past decade.5
FIGURE 1 Over the past decade, CalWORKs grants to families fell
SOURCE: California Department of Social Services, Public Assistance Facts and Figures. Available at www.cdss.ca.gov/research/PG370.htm.
NOTES: Amounts shown are average case grants for all CalWORKs families in July of each year. Inflation adjustment to 2011 equivalents calculated using the U.S. Bureau of Labor Statistics’ CPI inflation calculator.
Why have CalWORKs grant amounts shrunk? Until 2010, maximum grant amounts were largely unchanging, before adjusting for inflation. This indicates that shrinking family size or increasing earnings probably are not major contributors to lower grants. Rather, grant amounts have simply not kept pace with inflation. 6 Also, policymakers did cut grants in 2010 and again in 2011.
The fact that families on CalWORKs did not have higher earnings as the decade advanced is not necessarily surprising: Families on CalWORKs are presumably at or near a low point in their earnings and leave the program when their earnings improve. The macroeconomic situation in the state also became quite bleak starting in late 2007.
5 The federal Earned Income Tax Credit (EITC) and the largely federally funded Supplemental Nutrition Assistance Program (SNAP) amounts generally see automatic inflation adjustments each year. The 2009 American Recovery and Reinvestment Act also increased maximum SNAP and EITC amounts. In contrast, CalWORKs grant amounts are set by state law, and the state receives a capped amount from the federal government to cover a portion of the costs of the program. The basic TANF block grant has not grown since 1997. 6 California had a cost of living adjustment for CalWORKs in law, but it was suspended for most years in the past decade, and this provision was repealed in 2010. The pattern in California of grants not keeping pace with inflation is similar in other states.
$0
$100
$200
$300
$400
$500
$600
$700
2001 2002 2003 2004 2005 2006 2007 2008 2009 2010 2011
Average case grant (beforeinflation adjustment)
Average case grant (afterinflation adjustment)

http://www.ppic.org/main/home.asp California’s Welfare Recipients 9
While smaller family size is not a major factor in the shrinking grants over the entire decade, there is a longer-term trend in California of restricting eligibility for parents while continuing to aid children. Although it has always been the case that CalWORKs—and before 1998 its predecessor program, Aid to Families with Dependent Children (AFDC)—has aimed to serve families with children, adults now make up a smaller percentage of the caseload than in earlier years. For example, in 1995 68 percent of California AFDC recipients were children; in 2011 77 percent of CalWORKs recipients were children.
This change is mainly due to the more stringent eligibility requirements for parents enrolled in CalWORKs as compared to AFDC, changes aimed at advancing the enhanced self-sufficiency goals of CalWORKs. Generally speaking, CalWORKs parents who meet other eligibility criteria must also work, or participate in an approved set of activities intended to lead to private employment, in order to remain eligible for CalWORKs. Further, they cannot receive more than 48 months of grant assistance over their adult lifetimes (unless they are approved for an exemption from work requirements). In 1995, under AFDC, there was no time limit for parents, and work requirements were also less stringent.
Families differ in their degree of connection to the welfare-to-work-services portion of CalWORKs and grants. These distinctions stem from policy decisions about which groups of parents are required to work. They also reflect California’s policy that children remain eligible for CalWORKs grants even if their parents are not. Throughout this report, we rely on the following groups to describe parents’ relation to CalWORKs.
Current Access: Parents who are required to work. They currently have full access to welfare to work services and receive aid as part of the CalWORKs grant. (The governor’s proposal would further divide this group’s access to welfare-to-work services by number of aided months).7
On Hold: Parents who have their access to welfare-to-work services put on hold. (Under current policy, while services are on hold months are not counted towards the 48 month time limit.) These parents fall into two categories:
• Temporarily exempted. Exempted parents are not required to work and generally do not qualify for welfare-to-work services. However, they are still included in the CalWORKs grant. Exempted parents become required to work if their exemption status changes (for example, when their children become old enough).8
• Sanctioned parents. Parents who do not comply with work requirements and lack a good cause reason. They are ineligible for welfare-to-work services and the family’s payment is lower because they are not part of the CalWORKs grant. If they take appropriate action to comply with work requirements, they regain access both to their portion of the family’s grant and to welfare-to-work services.
Former Access: Parents who have reached their time limit (currently 48 months). They generally no longer have access to welfare-to-work services and are not part of the CalWORKs grant.9
Never Eligible: Parents who are never eligible for the CalWORKs grant or welfare-to-work services. These families include those with unauthorized immigrant parent(s), a parent receiving SSI, a non-needy caregiver (parent not in the family) as well as a few other, uncommon reasons.10
7 Counties have the option of providing services to other parents. There is a county (and state) incentive to do so: Federal law includes sanctioned and time-limited parents (as long as aid continues to their children) in the category of those required to work. Exempted parents can also volunteer to be in welfare-to-work services. However, county budgets for all of these activities have been strained. For example, the California Department of Social Services CA 237 and WTW 25 reports for 2011 indicate that about 12 percent of time-limited parents received work services. 8 Although exemptions are reevaluated periodically, some exemptions are effectively permanent. For example, a parent with primary care of a disabled child is exempted as long as the parent remains the primary caregiver. 9 A time limited parent can become eligible at any point for an extension to the time limit (for example, if she experiences domestic abuse).

http://www.ppic.org/main/home.asp California’s Welfare Recipients 10
Given the policy changes over the last three years, how has access to CalWORKs changed?
Current Access. Two recent policy changes reduced the share of these parents from 38 percent to 25 percent, according to our estimates.11 Of this 25 percent, the majority are in the first two years of their CalWORKs time limit (17% of all CalWORKs families). The rest (8% of all CalWORKs families) are in the second two years of their CalWORKs time limit.
On Hold: Temporarily exempted. We estimate that the number of families with exempt adults doubled from 11 percent to 22 percent as a result of the state enabling counties to exempt parents with one child under two years of age and two children under six years of age. (Unchanging exemptions include having an infant under 12 months and caring for a disabled family member in the home.)
On Hold: Sanctioned. Roughly 6 percent of CalWORKs families have parents who are sanctioned because they have not complied with program work requirements.12
Former Access. We calculate that the number of time-limited families grew from 8 percent to 11 percent of the caseload as a result of the shortening of the time limit from 60 to 48 months, starting in July 2011.
Never Eligible. About a third (35%) of families have parents or caregivers who have never been eligible for a CalWORKs grant or welfare-to-work services. The three most common reasons for this are that the parent is an unauthorized immigrant (21% of all CalWORKs families), that a child is living with a non-needy caregiver (7% of all CalWORKs families), or that the parent is an SSI recipient (6% of all CalWORKs families).
10 Families with no aided parents are often termed “child-only” CalWORKs recipients. We do not use that terminology in this report only to avoid ambiguity about parents’ potential access to welfare-to-work services. 11 In this and the following bullets, estimates are author’s calculations from the 2009 TANF Data Reports, U.S. Department of Health and Human Services. Available at http://aspe.hhs.gov/ftp/hsp/tanf-data/index.shtml. 12 We estimate that the share of families with sanctioned parents dropped from 8 percent to 6 percent after the recent, temporary expansions of exemptions to families with young children because sanctioned parents newly eligible for an exemption were converted to exempt status. See California Department of Social Services (2009) for more information about this aspect of the policy change.

http://www.ppic.org/main/home.asp California’s Welfare Recipients 11
Who Makes Use of CalWORKs?
Only families with children are eligible for CalWORKs. Most commonly, CalWORKs families have one parent and one child. Overall (and whether or not the parent was aided), 74 percent of CalWORKs families had one adult (nearly always a parent), and 41 percent had one child (Table 1). But enough families had two or more children that the average number of children in CalWORKs families was just over two.13 In California as a whole, the average size of families with children under 18 in the household was larger—just under five—but this is because they more often include two adults. The average number of children in all California families was also just over two.14
While CalWORKs families do not differ substantially from all California families in the number of children in the family, they do have characteristics associated with lower levels of work: young children, low educational attainment, and disability. Data limitations do not permit a more in-depth examination of employment difficulties CalWORKs families may face.15
Young Children
Table 1 shows that the majority of CalWORKs families have a child under age six. Having a preschool age child is the least common for families with time-limited parents, but this is because they have by definition received CalWORKs for at least 48 months and so tend to be older overall. Even so, 40 percent of time-limited families have a child under age six.
The central rationale for exempting parents who have primary care of young children is that work is more difficult for them than for parents of older children because of their need to find reliable and affordable child care arrangements. (We discuss the receipt of child care subsidies in the following section.) The current criterion for receiving this exemption is having primary care of one child under age two or two children under age six. Overall, about a quarter of CalWORKs families (26%) had a child under age two, and 19 percent of CalWORKs families had two children under age six (Table 1). Looking only at currently exempt parents, 60 percent had at least one child under the age of two and 37 percent had two or more children under the age of six.16
Parents’ Educational Attainment
CalWORKs parents with low educational attainment may also find it difficult to find employment because their lack of skills makes them uncompetitive for many job openings.
13 Families with aided parents in their first 48 months of assistance had smaller families, while families with sanctioned adults and adults who had reached their 48-month time limit had larger families. This is likely because parents in these latter two groups of families are older and are thus more likely to have completed childbearing, and younger families have in recent years had work exemptions triggered by the presence of young children. Nevertheless, sanctioned and time-limited families average fewer than three children (2.3 and 2.6 children, respectively). 14 These estimates are computed from the California sample of the 2009 Current Population survey. We based these estimates on families with at least one own child under 18 living in the home. 15 The TANF Data Reports are not designed to capture other barriers to employment that other research has identified (e.g., domestic violence, mental health issues, or substance abuse). 16 Since two-parent families were not exempted by the policy change except in rare circumstances, some parents with young children continued to be required to work.

http://www.ppic.org/main/home.asp California’s Welfare Recipients 12
In the general California population, in 2009 about 18 percent of families had parents who had not completed high school, 47 percent had parents who had completed high school, and 35 percent had parents with a higher education degree.17 In contrast, educational attainment is much lower for parents on CalWORKs. Educational attainment is incompletely recorded for many CalWORKs adults in these data, so we are able to compare educational attainment only for families in which parents are aided and have a current connection to work services, and for families with exempted parents. For these subgroups, between 41 percent and 51 percent of families had parents who had not completed high school or the equivalent. Most of the rest had a high school degree or GED, but no further degrees or certificates (Table 1).18
Narrowing the focus to the educational attainment of those newly approved for CalWORKs with six months or less of prior CalWORKs assistance, we find that 55 percent had a high school or higher degree in 2009, while only 44 percent did in 2007 (not shown in table).19 In other words, the educational attainment of those relying on CalWORKs for the first time was markedly higher in 2009 as compared to 2007. This is consistent with the idea that the recession triggered CalWORKs applications among qualitatively different families. Still, 35 percent of new applicant CalWORKs families in 2009 had parents with less than a high school degree, and 10 percent had no formal education at all.
Disability
We now turn our attention to one additional characteristic that may signal difficulty in finding and keeping a job: the presence of a disabled family member. Though not designed to capture physical or mental health conditions, these data do record whether family members received income from a federal disability program. Overall, 15 percent of CalWORKs families have income from a disability program (Table 1).
Table 1 indicates that more CalWORKs families had an adult with disability income (11%) than a child receiving disability income (4%). This is driven by the high incidence of parents who received SSI assistance rather than a CalWORKs benefit. Twenty-one percent of adults in CalWORKs families with parents who have never been eligible for assistance had disability income, while 8 percent or less had disability income among the other subgroups of families. Families in which adults had reached their CalWORKs time limit had a relatively high incidence of disability income for children (7%).20 This is plausibly because such families remain on CalWORKs for longer periods of time than families with no disabled children.21
17 These estimates are computed from the California sample of the 2009 Current Population survey. We based these estimates on families with at least one own child under 18 living in the home and noted the highest educational attainment of the head of household and of the spouse (if any). 18 These data do not distinguish among those who have completed a high school degree with no further education, and those who have completed education beyond the high school level but without receiving a degree or certificate. 19 In creating the new-applicant subgroup we excluded those families with parents who had never been eligible for CalWORKs. 20 This group of families also apparently had a higher incidence of disability income for adults (8%); however, this level is not statistically significant (comparing it to the incidence among families not in this subgroup). 21 Having primary care of a disabled family member is one reason that a parent can be exempted from welfare-to-work requirements. However, not all families with disabled children meet the requirements for this exemption.

http://www.ppic.org/main/home.asp California’s Welfare Recipients 13
TABLE 1 Most CalWORKs families have one or two children and at least one is younger than six
All Aided, work
required parent, first 24 months of
time limit
Aided, work required parent, second 24
months of time limit
Aided, exempt parent
Unaided, sanctioned
parent
Unaided, time limited parent
Parent / caregiver never
eligible
(1) (2) (3) (4) (5) (6) (7) Adults One adult (%) 74 51*** 78* 84*** 79** 80*** 76 Two adults (%) 26 49*** 22 16*** 21* 20*** 23** Average number of adults 1.25 1.49*** 1.22 1.16*** 1.21* 1.20** 1.22*** Children One child (%) 41 51*** 55*** 43 37 26*** 39** Two children (%) 28 27 23* 30 29 30 29 Three or more children (%) 31 21*** 22*** 26** 33 44*** 33** Average number of children 2.09 1.79*** 1.79*** 2.01 2.28* 2.56*** 2.15* Age of children (%) At least one child under age 2 26 20*** 6*** 60*** 16*** 13*** 18*** At least one child age 2 to 6 32 38*** 44*** 23*** 41*** 27* 30 No child under age 6 43 41 50** 16*** 43 60*** 51*** Two or more children under age 6 19 12*** 9*** 37*** 20 13*** 18* Parents’ education (%) 8th grade or less, or no formal, education - 7*** 9 8*** - - -
9th grade or more, but no high school degree/G ED - 34 32 43*** - - -
High school degree/GED - 53*** 51*** 44*** - - - Education beyond high school - 5*** 9*** 2 - - - Disability (%) Children 4 3* 3 3 4 7** 5 Adults 11 4*** 2*** 5*** 5*** 8 21***
SOURCE: Author’s calculations from the 2009 TANF Data Reports, U.S. Department of Health and Human Services. Available at http://aspe.hhs.gov/ftp/hsp/tanf-data/index.shtml.
NOTES: Asterisks indicate statistical tests for the subgroup (in each column) is significantly different from all those not in the subgroup (*=.10; **=.05; ***=.01 levels). Time limit, sanctioned, and exempt categories calculated using policies in place as of July 2011. Families with one and two parents are combined. Estimates not presented for adults’ education for subgroups where “unknown” makes up 7 percent or more of the category.

http://www.ppic.org/main/home.asp California’s Welfare Recipients 14
How Much Does CalWORKs Supplement Family Incomes?
In 2009, CalWORKs families received monthly cash assistance grants that averaged $523. (Due to reductions in grant amounts made since 2009, grants now average about $460 each month.) Before the recent reductions, CalWORKs grants accounted for 44 percent of all CalWORKs family incomes (Figure 2). CalFresh benefits contributed an additional 28 percent to family incomes.22 Income from employment constituted 18 percent of family incomes, while other government-provided benefits to adults and children made up 11 percent of family incomes. Child support paid by noncustodial parents and passed through to CalWORKs families did not add appreciably to family incomes.
FIGURE 2 CalWORKs is the largest source of income for CalWORKs families
SOURCE: Author’s calculations from the 2009 TANF Data Reports, U.S. Department of Health and Human Services. Available at http://aspe.hhs.gov/ftp/hsp/tanf-data/index.shtml.
Together, these income sources averaged $1,193 each month in 2009. This total excludes housing subsidies, child care subsidies, and subsidized health insurance, which we discuss below.
Because of the manner in which policymakers have structured grant calculations, CalWORKs families with earnings have higher incomes than families with no income from employment. CalWORKs grants decline as parents earn more, but a family with a working parent sees an initial bump up in income because the first $112 of earnings are disregarded in the grant calculation. After that, half of additional earnings are counted when determining the size of the CalWORKs grant. As Figure 3 shows, incomes are higher for subgroups of
22 CalFresh is generally considered to be “near cash” income, and in this report we treat it as indistinguishable from unrestricted cash sources of income. If CalFresh benefits caused families to spend more of their income on food than they would in the absence of the benefit, this would be problematic. However, there is very little evidence that this is the case. See the discussion in Danielson and Klerman (2011).
44%
28%
18%
8% 3% 0%
CalWORKs grant
CalFresh grant
Earnings
Other government assistance (adults)
Other government assistance (children)
Child support
http://www.ppic.org/main/home.asp California’s Welfare Recipients 15
families with parents who are aided and have not yet reached the 48-month time limit. They are higher because earnings make up a larger share of incomes (24% and 29%).23
Earnings
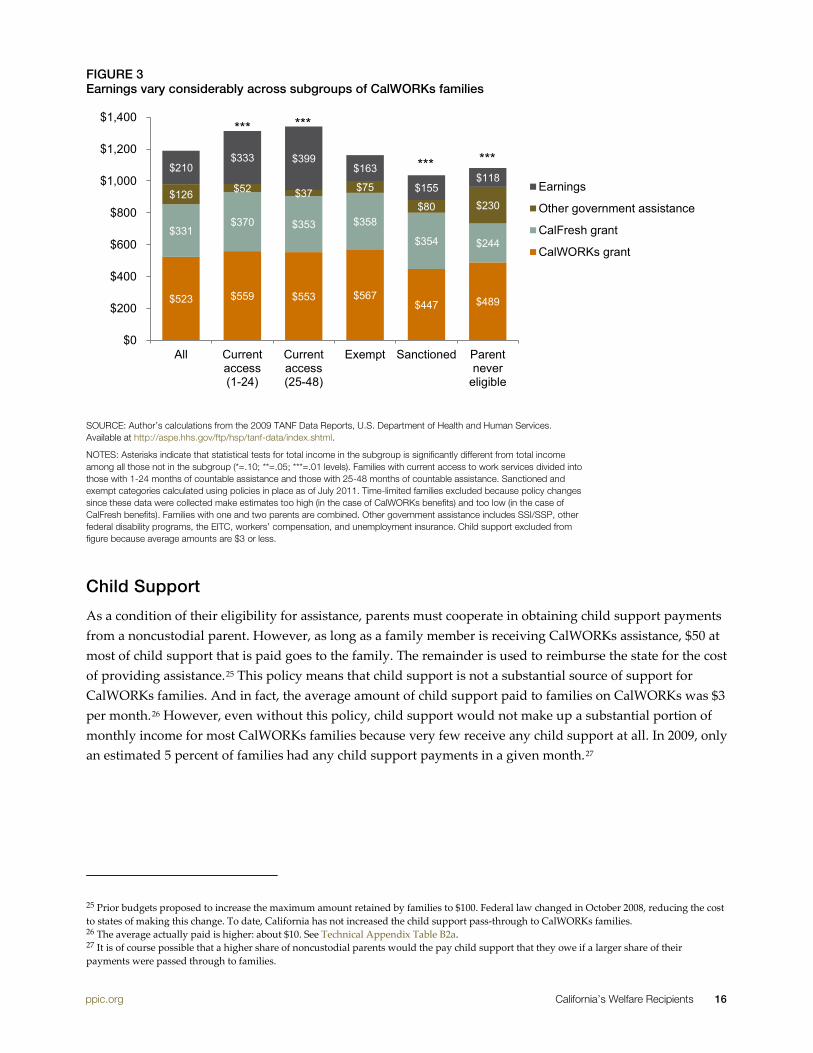
When families apply for CalWORKs, they must have low earnings. For a CalWORKs family containing one aided adult and one aided child, earnings of more than roughly $1,100 a month renders the family ineligible for benefits. In addition, families often apply for welfare because they have recently experienced a drop in their earned income. An illustration of this is the much lower earnings of families with recently approved CalWORKs applications ($118 each month in 2009) as compared with families with ongoing cases ($213 monthly).
In 2009, CalWORKs families overall earned an average of $210 each month (Figure 3). Despite the fact that 2009 was economically speaking dramatically worse than 2007, estimated earnings in 2007 at $201 were essentially identical to the 2009 average (2007 amount not shown in figure). This lack of difference suggests that families who have turned to CalWORKs in recent years face similar employment difficulties on the whole, regardless of the wider economic situation.
Although still low, earnings were substantially higher among families with parents who had not yet reached their time limit. Those in their first 24 months of assistance averaged $333 of monthly earnings, and those in their second 24 months averaged $399 of monthly earnings. Families with parents who were formerly eligible for grants and services but had reached their time limit also had relatively higher earnings ($290 each month) than other types of families.24 Families with currently sanctioned parents ($155), currently exempted parents ($163), and always-ineligible parents ($118) had the lowest earnings. While these differences are suggestive, it is simply not possible to determine from them to what degree welfare-to-work services increased the employment of those with the highest earnings and to what degree these services were simply made more available to those with the highest earnings potential.
23 The amounts shown in Figure 3 are not adjusted for varying family sizes across the subgroups. Table 2 indicates that family sizes do not vary widely, so adjusting income sources for family size would not appreciably alter the comparisons shown. 24 Sources of income for time limited families not presented in Figure 3. However, Technical Appendix Table B2a provides estimates for this group.
http://www.ppic.org/main/home.asp California’s Welfare Recipients 16
FIGURE 3 Earnings vary considerably across subgroups of CalWORKs families
SOURCE: Author’s calculations from the 2009 TANF Data Reports, U.S. Department of Health and Human Services. Available at http://aspe.hhs.gov/ftp/hsp/tanf-data/index.shtml.
NOTES: Asterisks indicate that statistical tests for total income in the subgroup is significantly different from total income among all those not in the subgroup (*=.10; **=.05; ***=.01 levels). Families with current access to work services divided into those with 1-24 months of countable assistance and those with 25-48 months of countable assistance. Sanctioned and exempt categories calculated using policies in place as of July 2011. Time-limited families excluded because policy changes since these data were collected make estimates too high (in the case of CalWORKs benefits) and too low (in the case of CalFresh benefits). Families with one and two parents are combined. Other government assistance includes SSI/SSP, other federal disability programs, the EITC, workers’ compensation, and unemployment insurance. Child support excluded from figure because average amounts are $3 or less.
Child Support
As a condition of their eligibility for assistance, parents must cooperate in obtaining child support payments from a noncustodial parent. However, as long as a family member is receiving CalWORKs assistance, $50 at most of child support that is paid goes to the family. The remainder is used to reimburse the state for the cost of providing assistance.25 This policy means that child support is not a substantial source of support for CalWORKs families. And in fact, the average amount of child support paid to families on CalWORKs was $3 per month.26 However, even without this policy, child support would not make up a substantial portion of monthly income for most CalWORKs families because very few receive any child support at all. In 2009, only an estimated 5 percent of families had any child support payments in a given month.27
25 Prior budgets proposed to increase the maximum amount retained by families to $100. Federal law changed in October 2008, reducing the cost to states of making this change. To date, California has not increased the child support pass-through to CalWORKs families. 26 The average actually paid is higher: about $10. See Technical Appendix Table B2a. 27 It is of course possible that a higher share of noncustodial parents would the pay child support that they owe if a larger share of their payments were passed through to families.
$523 $559 $553 $567 $447 $489
$331 $370 $353 $358
$354 $244
$126 $52 $37 $75
$80 $230
$210 $333 $399
$163
$155 $118
$0
$200
$400
$600
$800
$1,000
$1,200
$1,400
All Currentaccess(1-24)
Currentaccess(25-48)
Exempt Sanctioned Parentnever
eligible
Earnings
Other government assistance
CalFresh grant
CalWORKs grant
*** ***
*** ***
http://www.ppic.org/main/home.asp California’s Welfare Recipients 17
Non-CalWORKs Government Assistance
CalWORKs families are typically eligible for other government assistance, and applying for CalWORKs is one gateway to accessing these other programs. The most common types of assistance that CalWORKs recipients use are CalFresh nutrition benefits and subsidized health insurance. Below, we discuss these benefits along with other assistance that CalWORKs families may receive.
CalFresh
As previously mentioned, nutrition assistance benefits made up a substantial portion of family income, averaging $331 each month for all CalWORKs families. Eligibility for this program is not narrowly tied to eligibility for CalWORKs, so sanctioned and time-limited parents typically remain eligible for CalFresh. CalFresh grant amounts adjust upward if parents lose access to their portion of the family’s CalWORKs grant and the family’s circumstances remain otherwise unchanged. In fact, the impact of any type of CalWORKs grant cut—which is a state action—is mitigated by the counterbalancing effect of an increased CalFresh benefit mainly underwritten by the federal government.
Although it might seem that every CalWORKs family is eligible for CalFresh, in fact an estimated 12 percent do not receive a CalFresh benefit. This is disproportionately true of child-only families with never-eligible parents. More than one-fifth (21%) do not receive CalFresh assistance, mainly because children eligible for CalWORKs live in households that are income-ineligible for CalFresh.28
Other Cash Assistance
There are a number of types of so-called unearned income that CalWORKs families may have. These sources include the federal Earned Income Tax Credit, workers’ compensation, unemployment insurance benefits, and disability payments. Taken together, these sources of income averaged $126 each month. Unearned income was substantially higher for CalWORKs families with never-aided parents, averaging $230 each month. The main reason for this difference is the substantial number of parents in this group receiving SSI.29
Health Insurance, Housing, and Child Care Assistance
CalWORKs families can also obtain a number of types of in-kind assistance, such as transportation stipends and medical insurance through California’s Medi-Cal or Healthy Families programs. Of the three major types of assistance—child care subsidies, housing subsidies, and subsidized health insurance—only health insurance was common for CalWORKs families in 2009. In fact, Table 2 shows that all CalWORKs families had at least one member with subsidized health insurance, although the data do not permit us to determine which family members were covered.
Among all CalWORKs families, 12 percent had a housing subsidy and only 3 percent were receiving subsidized child care or preschool (Table 2). Help with child care costs was over twice as common among
28 In particular, children living with non-needy caregivers can be eligible for CalWORKs but ineligible for CalFresh. See Technical Appendix B for further details. 29 Some family members can receive CalWORKs benefits while other family members can receive SSI benefits, but no family member can receive both simultaneously.

http://www.ppic.org/main/home.asp California’s Welfare Recipients 18
families with parents who had not yet reached their time limit (6 and 8 percent). 30 At an estimated 30 percent, receipt of subsidized housing was much more common among families with timed-out parents, perhaps because members of this subgroup had the time to rise to the top of waiting lists for such housing.31
TABLE 2 Housing and child care assistance are much less common than subsidized health insurance
All
Aided, work required
parent, first 24 months of time limit
Aided, work required parent,
second 24 months of time limit
Aided, exempt parent
Unaided, sanctioned
parent
Unaided, time limited
parent
Parent / caregiver
never eligible
(1) (2) (3) (4) (5) (6) (7)
Health insurance (%) 100 100 100 100 100 100 100
Subsidized child care or preschool (%) 3 6*** 8** 5* 1** 3 0.1***
Subsidized housing (%) 12 8*** 12 12 14 30*** 7***
SOURCE: Author’s calculations from the 2009 TANF Data Reports, U.S. Department of Health and Human Services. Available at http://aspe.hhs.gov/ftp/hsp/tanf-data/index.shtml.
NOTES: Asterisks indicate that statistical tests for total income in the subgroup is significantly different from total income among all those not in the subgroup (*=.10; **=.05; ***=.01 levels). Time limit, sanctioned, and exempt categories calculated using policies in place as of July 2011. Significance not computed for health insurance status because all sampled families were recorded as having subsidized health insurance. Families with one and two parents are combined.
30 In these data, child care subsidies include child care funded in part or whole by the federal, state, or local government. Payments could be made directly to the parent or to a child care provider on behalf of the parent. While access to child care subsidies appears low in these data, it is important to keep in mind that the TANF Data Reports provide information about a single month. Use of subsidized child care at some point during the year is higher. In addition, these data record subsidy receipt at the level of the family; families with more than one child can receive subsidized child care for all children. 31 In these data, a housing subsidy indicates receipt of public housing or a rent subsidy funded by the federal, state, or local government, or through a private social service agency. Payments could be made directly to the parent or to the owner of the housing.

http://www.ppic.org/main/home.asp California’s Welfare Recipients 19
How Much Do CalWORKs Parents Work?
California’s welfare program takes a “work-first” approach. That is, out-of-work CalWORKs parents with current access to work services are usually required to begin a job search—with assistance from their county welfare department—once their family starts receiving a cash grant. If they cannot find work during the first weeks of their receipt of assistance, then a plan is developed that defines additional steps needed to help them obtain employment. To remain in compliance with program rules, these parents must work, or participate in a defined set of work-related activities, for an average of 32 hours a week.32
At the same time, families seek assistance from CalWORKs because the adults have difficulty finding a job, or because the wages they earn are low. The Great Recession and the years following made these problems more acute, with unemployment rates in California above 10 percent since February 2009 (and much higher in particularly hard-hit areas of the state).
Policymakers have restricted, or considered restricting, access to services in a number of ways. Recent changes eliminated—or sharply reduced—work services for 11 percent of all CalWORKs families. Shortening the time limit from 60 to 48 months also reduced services for 3 percent of CalWORKs families. Governor Brown’s recent budget proposal would rescind the first type of restriction on work services, replacing it with more severely time-limited work services (unless parents begin working a substantial number of hours in unsubsidized employment within 24 months).33 These families would also see a modest increase in their financial incentive to work in the shape of a higher amount of disregarded earnings before the family’s grant begins to decline.
Against the backdrop of the long-standing work-first emphasis of the program, these changes and proposed changes raise the question of how broadly the program should seek to engage parents in work.
As Table 3 shows, less than a third of parents in CalWORKs families were working at all in 2009 (27%), and hours among those who did work averaged 22 each week.34 Perhaps surprisingly, in 2007 an identical fraction of all CalWORKs parents worked (not shown in table). The unchanged prevalence of work among this selected segment of all California families with children again suggests that those who turn to CalWORKs—at least in recent years, and regardless of the state of the macroeconomy—face similar employment difficulties.
As this sample is of a selected group of low-income families—those who have currently turned to CalWORKs—it is important to keep in mind that these statistics are not representative of employment among all low-income families, or all families with children. For example, 86 percent of all California families with children had an employed adult in 2009.35
32 In two-parent families, currently one parent alone or both parents together must meet a work requirement of 35 hours per week. 33 Under the proposal, parents would be required to work the number of hours stipulated in federal law: 20 hours for single parents with primary care of a child under age six, 30 hours for other single parents, and 35 hours for one or both parents in two-parent families. 34 When recorded in the TANF Data Reports, these and other work activities must be documented using federally-defined criteria. To the extent that parents engage in legitimate work activities that counties cannot document, parents’ engagement is undercounted. 35 These estimates are computed from the California sample of the 2009 Current Population Survey. We based these estimates on families with at least one own child under 18 living in the home. For further discussion of work among low-income families nationally, see Acs and Nichols (2007) and Loprest and Nichols (2011).
http://www.ppic.org/main/home.asp California’s Welfare Recipients 20
There are seven federally defined categories of work: unsubsidized employment, private subsidized employment, public subsidized employment, work experience, on-the-job training, community service, and providing child care to a community-service program participant.36 Unsubsidized employment is essentially a regular job, while the other categories involve partial government funding of participants’ wages, or work that incorporates a training component.
For CalWORKs parents, one category—unsubsidized employment—makes up the bulk of work. For instance, in 2009 27 percent of parents engaged in some hours of work across the seven categories, but 25 percent had hours of unsubsidized employment. For parents who are the primary recipients of welfare-to-work services, this picture is somewhat different. Forty-two percent of parents in their first 24 months of their time limit had hours of work, but 38 percent engaged in some hours of unsubsidized employment. Close to half (47%) of parents in the second 24 months of their time limit had hours of work, but only 39 percent had any hours of unsubsidized employment. This suggests that welfare-to-work services helps engage parents in work more broadly defined.
While a substantial number of parents who are aided and have access to work services are working at least some hours in unsubsidized employment, many fewer have even approximately enough hours to meet current CalWORKs or federal hours minimums. Only 11 percent of those in the first 24 months of their time limit had at least 30 hours of unsubsidized employment, and 11 percent had between 20 and 29 hours of unsubsidized employment. Counting all seven categories of work, 14 percent had at least 30 hours, and 12 percent had 20 to 29 hours. Parents in the second 24 months of their time limit fared essentially the same: 13 percent engaged in at least 30 hours of unsubsidized employment while 17 percent had at least 30 hours, counting work more broadly. An additional 13 percent had between 20 and 29 hours of unsubsidized employment—and no additional families had 20 to 29 hours of work more broadly defined. In sum, most families who were engaged in unsubsidized employment in 2009, or in work more broadly defined, lacked enough hours to count as fully engaged in these activities, at least according to current state and federal hours rules.37
36 These are known as “core” work activities. There are two additional core activities: vocational education (for up to 12 months) and job search and job readiness training (up to six weeks per year, and extended during periods of high unemployment). “Non-core” activities count toward a parent’s required hours of participation only if he or she has a sufficient number of hours of core activities (20 hours is the most common number of core hours required). The list of federal non-core activities are: job skills training directly related to employment, education directly related to employment, and satisfactory attendance at a secondary school or course leading to a GED certificate. To date, California has supplemented this list with the following additional non-core activities: mental health, substance abuse, and domestic abuse services (beyond the six weeks allowed for job search and job readiness training), higher education (usually for up to 24 months), and other activities necessary to assist in obtaining employment. 37 California Department of Social Services (2011) discusses related concerns about the federal calculation of the state’s work participation rate.

http://www.ppic.org/main/home.asp California’s Welfare Recipients 21
TABLE 3 Unsubsidized employment accounts for most parents’ work, but other types of employment also play a role
All families
Aided, work required parent,
first 24 months of time limit
Aided, work required parent,
second 24 months of time
limit
Aided, exempt parent
Unaided, sanctioned
parent
Unaided, time limited parent
Parent / caregiver never
eligible
(1) (2) (3) (4) (5) (6) (7) Some hours (%)
Unsubsidized employment only 25 38*** 39*** 18*** 20* 32** 18***
Work 27 42*** 47*** 20*** 22* 33** 18***
Part-time and full-time hours (%)
Unsubsidized employment only
20-29 hours 7 11*** 13*** 6 3*** 7 5***
30 hours or more 7 11*** 13*** 7 5 11** 3***
Work
20-29 hours 7 12*** 13*** 6 2*** 7 5***
30 hours or more 8 14*** 17*** 7 6 13** 3***
Average number of hours among those with some hours
Unsubsidized employment only 21.95 22.44 24.08 24.64** 18.48** 23.63 18.65***
Work 22.28 23.30 24.20 23.88 18.62** 24.05 18.65***
SOURCE: Author’s calculations from the 2009 TANF Data Reports, U.S. Department of Health and Human Services. Available at http://aspe.hhs.gov/ftp/hsp/tanf-data/index.shtml.
NOTES: Asterisks indicate that statistical tests for the subgroup (in each column) is significantly different from all those not in the subgroup (*=.10; **=.05; ***=.01 levels). Families with one and two parents are combined. Time limit, sanctioned, and exempt categories calculated using policies in place as of July 2011. Hours of work and hours of unsubsidized employment are totaled for all adults in the family. “Work” includes recorded hours in the following activities: unsubsidized employment, public or private subsidized employment, work experience, community service, on-the-job training, and providing child care to a community-service program participant.
http://www.ppic.org/main/home.asp California’s Welfare Recipients 22
How Long Do Families Stay on CalWORKs?
California policymakers adopted a 60-month time limit on assistance for parents when they initially designed the CalWORKs program in the late 1990s. This is the federally allowed number of months that a family can receive assistance, and this length of time remains the most common in other states. At the same time, most other states terminate all assistance to families when parents reach the time limit (Kassabian, Vericker, Searle, and Murphy, 2011).38
In July 2011 lawmakers shortened California’s time limit to 48 months (but continued to apply it only to parents, not children). As mentioned above, Governor Brown has proposed a hybrid time limit. In addition, families with adults who are currently temporarily exempted or sanctioned would see those months retroactively added to their time limit clocks after a six-month grace period.
In view of both the recent change and the proposed change to allowable months of assistance for parents, it is useful to gain further insight into how long CalWORKs families generally make use of the program. Rather than classifying families by adults’ “countable” months on CalWORKs as we have done so far, in this section we use a more basic count of the number of months that a family has received cash assistance (whether for parents and children or just for children) since the inception of CalWORKs.39 This measure is intended to capture months not counted toward a parent’s time limit, so it helps to fill out the picture of time on CalWORKs. (At the same time, additional measures not readily calculable from data available to us could also inform decisionmaking.)40
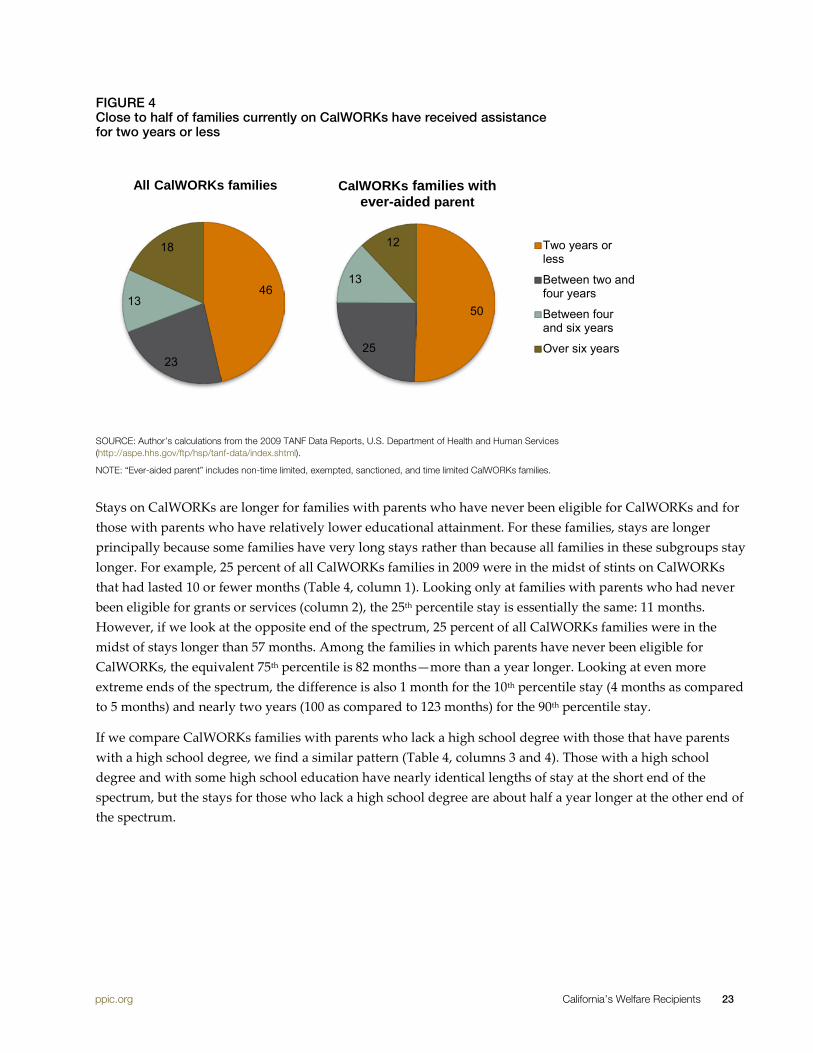
In 2009 close to half of all families then on CalWORKs had received this assistance for two years or less (Figure 4). And approximately another quarter had received CalWORKs for between two and four years. The remaining group—slightly less than a third—had been on CalWORKs for over four years.41 Stays are shorter for the two-thirds of CalWORKs families with parents who have ever been eligible for grants or services: Only 25 percent had over four years of assistance. It is also important to note that typical lengths of stay were no doubt somewhat shorter in 2009 as compared to earlier years: The group of families new to CalWORKs has recently made up a larger share of the caseload because of caseload growth during and after the recession.
38 Time limit exemption and extension practices also vary by state (Kassabian, Vericker, Searle, and Murphy, 2011). 39 We use data that capture the number of months that the TANF family has received cash or cash equivalents since December 1996, or roughly twelve years prior to the 2009 sample. (As the sample is drawn monthly, the potential number of months that could be recorded ranges between a minimum of 142 and a maximum of 153). Thus the total count of months is truncated for cases with pre-CalWORKs histories of aid receipt. The count is also potentially truncated if a family received assistance not funded by the TANF block grant. In addition, months that a parent may have received while a child (in a different family) are not counted. Technical Appendices A and B contain further discussion of the data used to calculate lifetime number of months of assistance and additional tabulations for subgroups of families. 40 These additional measures could include estimates of average number of months of assistance over a person’s lifetime and estimates of the number and frequency of repeat spells. 41 For mathematical reasons it is not possible to calculate the average number of months that families currently on CalWORKs remain on CalWORKs using the TANF Data Reports. It is possible to calculate percentiles of the distribution of current number of months on CalWORKs.
http://www.ppic.org/main/home.asp California’s Welfare Recipients 23
FIGURE 4 Close to half of families currently on CalWORKs have received assistance for two years or less
SOURCE: Author’s calculations from the 2009 TANF Data Reports, U.S. Department of Health and Human Services (http://aspe.hhs.gov/ftp/hsp/tanf-data/index.shtml).
NOTE: “Ever-aided parent” includes non-time limited, exempted, sanctioned, and time limited CalWORKs families.
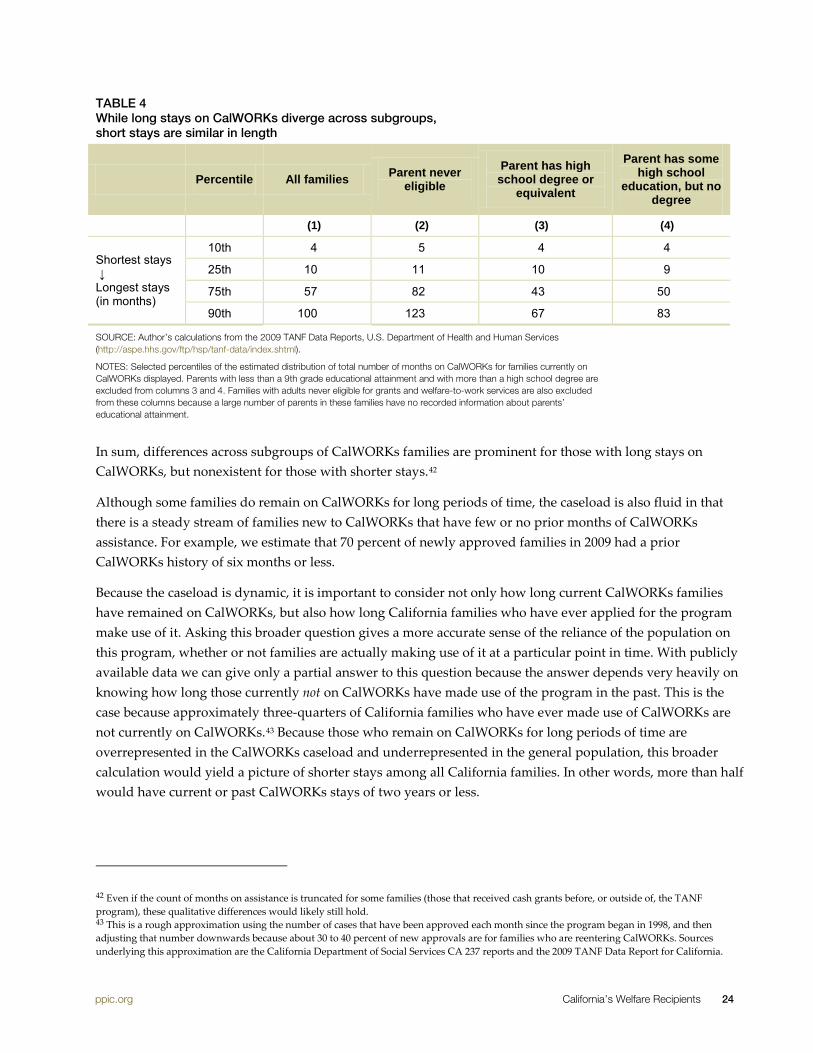
Stays on CalWORKs are longer for families with parents who have never been eligible for CalWORKs and for those with parents who have relatively lower educational attainment. For these families, stays are longer principally because some families have very long stays rather than because all families in these subgroups stay longer. For example, 25 percent of all CalWORKs families in 2009 were in the midst of stints on CalWORKs that had lasted 10 or fewer months (Table 4, column 1). Looking only at families with parents who had never been eligible for grants or services (column 2), the 25th percentile stay is essentially the same: 11 months. However, if we look at the opposite end of the spectrum, 25 percent of all CalWORKs families were in the midst of stays longer than 57 months. Among the families in which parents have never been eligible for CalWORKs, the equivalent 75th percentile is 82 months—more than a year longer. Looking at even more extreme ends of the spectrum, the difference is also 1 month for the 10th percentile stay (4 months as compared to 5 months) and nearly two years (100 as compared to 123 months) for the 90th percentile stay.
If we compare CalWORKs families with parents who lack a high school degree with those that have parents with a high school degree, we find a similar pattern (Table 4, columns 3 and 4). Those with a high school degree and with some high school education have nearly identical lengths of stay at the short end of the spectrum, but the stays for those who lack a high school degree are about half a year longer at the other end of the spectrum.
46
23
13
18
All CalWORKs families
50
25
13
12
CalWORKs families with ever-aided parent
Two years orless
Between two andfour years
Between fourand six years
Over six years
http://www.ppic.org/main/home.asp California’s Welfare Recipients 24
TABLE 4 While long stays on CalWORKs diverge across subgroups, short stays are similar in length
Percentile All families Parent never eligible
Parent has high school degree or
equivalent
Parent has some high school
education, but no degree
(1) (2) (3) (4)
Shortest stays ↓ Longest stays (in months)
10th 4 5 4 4
25th 10 11 10 9
75th 57 82 43 50
90th 100 123 67 83
SOURCE: Author’s calculations from the 2009 TANF Data Reports, U.S. Department of Health and Human Services (http://aspe.hhs.gov/ftp/hsp/tanf-data/index.shtml).
NOTES: Selected percentiles of the estimated distribution of total number of months on CalWORKs for families currently on CalWORKs displayed. Parents with less than a 9th grade educational attainment and with more than a high school degree are excluded from columns 3 and 4. Families with adults never eligible for grants and welfare-to-work services are also excluded from these columns because a large number of parents in these families have no recorded information about parents’ educational attainment.
In sum, differences across subgroups of CalWORKs families are prominent for those with long stays on CalWORKs, but nonexistent for those with shorter stays.42
Although some families do remain on CalWORKs for long periods of time, the caseload is also fluid in that there is a steady stream of families new to CalWORKs that have few or no prior months of CalWORKs assistance. For example, we estimate that 70 percent of newly approved families in 2009 had a prior CalWORKs history of six months or less.
Because the caseload is dynamic, it is important to consider not only how long current CalWORKs families have remained on CalWORKs, but also how long California families who have ever applied for the program make use of it. Asking this broader question gives a more accurate sense of the reliance of the population on this program, whether or not families are actually making use of it at a particular point in time. With publicly available data we can give only a partial answer to this question because the answer depends very heavily on knowing how long those currently not on CalWORKs have made use of the program in the past. This is the case because approximately three-quarters of California families who have ever made use of CalWORKs are not currently on CalWORKs.43 Because those who remain on CalWORKs for long periods of time are overrepresented in the CalWORKs caseload and underrepresented in the general population, this broader calculation would yield a picture of shorter stays among all California families. In other words, more than half would have current or past CalWORKs stays of two years or less.
42 Even if the count of months on assistance is truncated for some families (those that received cash grants before, or outside of, the TANF program), these qualitative differences would likely still hold. 43 This is a rough approximation using the number of cases that have been approved each month since the program began in 1998, and then adjusting that number downwards because about 30 to 40 percent of new approvals are for families who are reentering CalWORKs. Sources underlying this approximation are the California Department of Social Services CA 237 reports and the 2009 TANF Data Report for California.

http://www.ppic.org/main/home.asp California’s Welfare Recipients 25
Conclusion
This consideration of the circumstances of families on CalWORKs leads us to three broad conclusions. First, families on CalWORKs are clearly disadvantaged – they have low incomes and low educational attainment. They often have pre-school aged children, and they rely heavily on their CalWORKs grant as a source of income. At the same time, roughly half of families currently on CalWORKs have a record of assistance that is two years or shorter. Further, over half of families who have ever made use of CalWORKs have an assistance history that is two years or less. Taken together, these findings indicate that CalWORKs families are in immediate need, but that receiving aid is a relatively transitory situation for many.
Still, about one in five CalWORKs families has received assistance for over six years. In addition, long stays are relatively longer for families with greater disadvantage—for example, families with parents who lack a high school degree and those in which parents have never been eligible for a grant or work services. These are families for whom the policy goal of short-term assistance has not been achieved. Additional means of advancing child well-being and perhaps also family self-sufficiency for families with long records of assistance deserves policymaker consideration.
Finally, CalWORKs families currently targeted by welfare-to-work services have higher rates of participation in the labor force than families not targeted by such services. While this could be simply due to their greater capacity to work, it also suggests that welfare-to-work services may be helping parents gain a toehold in the workforce both before and during the recession. Still, the goal of full- or near-full-time unsubsidized employment appears to be a lofty one for most current CalWORKs families.
Ideally, CalWORKs provides short-term assistance that both advances children’s well-being and moves low income families toward self-sufficiency through their own earnings combined with on-going work supports like tax credits, nutrition assistance programs, and subsidized health insurance. Recent policy changes spurred by state budget constraints have reduced the resources available to achieve both of the central goals of CalWORKs. However, the decisions made have arguably also rebalanced the program’s goals, shifting the emphasis toward income support and away from self-sufficiency. In considering further changes to the program, policymakers have the opportunity to think through once again their balancing of the program’s two goals.
http://www.ppic.org/main/home.asp California’s Welfare Recipients 26
References
Acs, Gregory, and Austin Nichols. 2007. Low-Income Workers and Their Employers: Characteristics and Challenges. Washington DC: Urban Institute. Available at www.urban.org/UploadedPDF/411532_low_income_workers.pdf.
Bane, Mary Jo, and David T. Ellwood. 1995. Welfare Realities: From Rhetoric to Reform. Cambridge, MA: Harvard University Press.
Ben-Shalom, Yonatan, Robert Moffitt, and John Karl Scholz. 2011. “An Assessment of the Effectiveness of Anti-Poverty Programs in the U.S.” NBER Working Paper 17042.
Brown, Edmund G. 2012. 2012-2013 Governor’s Budget Summary (January 5). Available at www.ebudget.ca.gov/pdf/BudgetSummary/FullBudgetSummary.pdf.
Brown, Kay E. 2011. Temporary Assistance for Needy Families: Update on Families Served and Work Participation (September 8). Washington DC: U.S. Government Accountability Office. Available at www.gao.gov/assets/130/126892.pdf.
California Department of Social Services. 2009. All County Letter No. 09-46 (November 10). Available at www.dss.cahwnet.gov/lettersnotices/entres/getinfo/acl/2009/09-46.pdf.
California Department of Social Services. 2011a. All County Letter No. 11-33 (April 29). Available at www.dss.cahwnet.gov/lettersnotices/entres/getinfo/acl/2011/11-33.pdf.
California Department of Social Services. 2011b. Report on Engagement in Additional Work Activities (August 31). Available at www.cdss.ca.gov/research/res/pdf/calreports/EngagementAdditionalActivities-August31_2011.pdf.
Danielson, Caroline, and Jacob Alex Klerman. 2011. California's Food Stamp Program: Participation and Cost Challenges for the State. San Francisco: Public Policy Institute of California. Available at www.ppic.org/main/publication.asp?i=938.
Golden, Olivia, and Amelia Hawkins. 2012. TANF Child-Only Cases. Washington DC: Urban Institute. Available at www.acf.hhs.gov/programs/opre/other_resrch/tanf_ccdf/reports/child_only.pdf.
Holzer, Harry, and Karin Martinson. 2008. Helping Poor Working Parents Get Ahead: Federal Funds for New State Strategies and Systems. Washington DC: Urban Institute. Available at www.urban.org/publications/411722.html.
Kassabian, David, Tracy Vericker, David Searle, and Mary Murphy. 2011. Welfare Rules Databook: State TANF Policies as of July 2010. Washington DC: Urban Institute. Available at http://anfdata.urban.org/databooks/Databook%202010%20FINAL.pdf.
Legislative Analyst. 2012. The Governor’s CalWORKs and Child Care Proposals (February 22). Available at http://lao.ca.gov/analysis/2012/ss/calworks-child-care-022212.pdf.
Loprest, Pamela, and Austin Nichols. 2011. Dynamics of Being Disconnected from Work and TANF. Washington DC: Urban Institute. Available at www.urban.org/UploadedPDF/412393-Dynamics-of-Being-Disconnected-from-Work-and-TANF.pdf.
http://www.ppic.org/main/home.asp California’s Welfare Recipients 27
About the Author
Caroline Danielson is a policy fellow at PPIC. Her research focuses on social safety net programs, including nutrition assistance, welfare, child welfare, and child care subsidies. Before coming to PPIC she was a principal analyst at the University of California's Welfare Policy Research Project, a RAND graduate fellow, and an assistant professor of politics at the State University of New York, Potsdam. She holds a PhD in political science from the University of Michigan.
Acknowledgments
I gratefully acknowledge the contributions of Maher Alhakeem, Martin Aronson, Kim Belshé, Sarah Bohn, Laura Hill, Charr Lee Metsker, Gayathri Sundar, Lynette Ubois, and Brian Uhler to this report. I found their input invaluable. However, I bear the entire responsibility for any errors, as well as for the ultimate analysis and interpretation of the data used in this report.

PUBLIC POLICY INSTITUTE OF CALIFORNIA
Board of Directors
Gary K. Hart, Chair Former State Senator and Secretary of Education State of California
Mark Baldassare President and CEO Public Policy Institute of California
Ruben Barrales President and CEO San Diego Regional Chamber of Commerce
María Blanco Vice President, Civic Engagement California Community Foundation
Brigitte Bren Chief Executive Officer International Strategic Planning, Inc.
Robert M. Hertzberg Partner Mayer Brown, LLP
Walter B. Hewlett Chair, Board of Directors William and Flora Hewlett Foundation
Donna Lucas Chief Executive Officer Lucas Public Affairs
David Mas Masumoto Author and Farmer
Steven A. Merksamer Senior Partner Nielsen, Merksamer, Parrinello, Gross & Leoni, LLP
Kim Polese Chairman ClearStreet, Inc.
Thomas C. Sutton Retired Chairman and CEO Pacific Life Insurance Company
The Public Policy Institute of California is dedicated to informing and improving public policy in California through independent, objective, nonpartisan research on major economic, social, and political issues. The institute’s goal is to raise public awareness and to give elected representatives and other decisionmakers a more informed basis for developing policies and programs.
The institute’s research focuses on the underlying forces shaping California’s future, cutting across a wide range of public policy concerns, including economic development, education, environment and resources, governance, population, public finance, and social and health policy.
PPIC is a private operating foundation. It does not take or support positions on any ballot measures or on any local, state, or federal legislation, nor does it endorse, support, or oppose any political parties or candidates for public office. PPIC was established in 1994 with an endowment from William R. Hewlett.
Mark Baldassare is President and Chief Executive Officer of PPIC.
Gary K. Hart is Chair of the Board of Directors. Short sections of text, not to exceed three paragraphs, may be quoted without written permission provided that full attribution is given to the source.
Research publications reflect the views of the authors and do not necessarily reflect the views of the staff, officers, or Board of Directors of the Public Policy Institute of California.
Copyright © 2012 Public Policy Institute of California All rights reserved. San Francisco, CA
PUBLIC POLICY INSTITUTE OF CALIFORNIA 500 Washington Street, Suite 600 San Francisco, California 94111 phone: 415.291.4400 fax: 415.291.4401 www.ppic.org
PPIC SACRAMENTO CENTER Senator Office Building 1121 L Street, Suite 801 Sacramento, California 95814 phone: 916.440.1120 fax: 916.440.1121


