38
EARNINGS Q3 FY18 REVIEW: FINALLY ITS HERE! Edelweiss Investment Research Shobana Krishnan Economist [email protected] Sahil Kapoor Chief Market Strategist [email protected] February 2018

EARNINGS Q3 FY18 REVIEW: FINALLY ITS HERE!
Edelweiss Investment Research
Shobana Krishnan
Economist
Sahil Kapoor
Chief Market Strategist
[email protected] 2018

Earnings, Finally its here
● Q3 FY18 saw a decent earing growth. Both at the Nifty level and a broader market level. Nifty Earnings grew at 7%as against estimate of 12%. BSE- 500 earnings growth as been at 11%.
● Favorable base effect, Global tailwinds, Revival in Domestic Consumption, Government led Capex have beenthe common theme across commentaries. Biggest benefactors of these were Metals and Mining (PAT growth50%), Consumer Staples (PAT growth 21%), Auto Ancillaries (PAT growth 26%).
● Pharma, Telecom, Textiles, Public Sector Banks have all been dragger. Of which Public Sector banks have aloneclogged in a loss of about Rs 180 billion, dragging the overall PAT growth. Higher Provisions and Treasury losseshave led to weak earnings growth. BSE-500 PAT growth (ex Financials) is about 14%.
● Building Materials and Cement Industry produced mix bag of results. Slower growth in Building Materials segmentdisappointed as the shift from unorganized to organized is happening gradually. For the Cement Industry, on onehand input costs rose and on the other sales volume finally saw momentum.
● Among our coverage universe- PNC Infratech, Dilip Buildcon, SH Khelkar beat earnings estimate. Indian Terrain,Trident, Kirloskar continue to pose disappointing numbers.
● We expect Nifty EPS of FY18/19/20 to be 500/600/700. We are revising our Nifty target price for FY19 to 11,500 (from12,000 earlier) giving it a PE multiple of ~16.5 1Yr Fwd at an EPS of INR 700 for FY20.
2

3
Earnings Overview- Nifty/BSE-500

Nifty Earnings Overview
● Nifty Top line saw a growth of 16% against our expectations of 18% and bottom line growth of 7% as compared to the expectation of 12%.
● Auto, Metals and Mining. O&G witnessed robust growth in the Nifty Universe. SBI,Pharma continued to be the main dragger in earnings growth.
● Highest PAT Companies in Nifty Universe- Tata Steel, Hindalco, L&T
Nifty PAT Growth at 7%, SBI Major Dragger
-11%
1%
-5%
10%
17%
25%
18%16% 16%
Q3 16 Q4 16 Q1 17 Q2 17 Q3 17 Q4 17 Q1 18 Q2 18 Q3 18
Net Sales Growth Remained Stable
40.2
5.2
-1.7
-12.0
12.2
3.1
13.8
1.6 2.2
6.3
12.7
3.5
-10.0
13.7
7.0
Ju
n-1
4
Se
p-1
4
De
c-1
4
Ma
r-15
Ju
n-1
5
Se
p-1
5
De
c-1
5
Ma
r-1
6
Ju
n-1
6
Se
p-1
6
De
c-1
6
Ma
r-17
Ju
n-1
7
Se
p-1
7
De
c-1
7
Source: Capitaline, Edelweiss Investment Research
4

BSE 500- Earnings Overview
BSE 500 Earnings Growth Higher than Nifty, PSU Banks Continue to be a dragger
Net Sales ex Financials Growth Remained Steady
-20%
-10%
0%
10%
20%
30%
Q3
FY
16
Q4
FY
16
Q1
FY
17
Q2
FY
17
Q3
FY
17
Q4
FY
17
Q1
FY
18
Q2
FY
18
Q3
FY
18
Profit Profit Ex Financials
-15%
-10%
-5%
0%
5%
10%
15%
20%
Q3
FY
16
Q4
FY
16
Q1
FY
17
Q2
FY
17
Q3
FY
17
Q4
FY
17
Q1
FY
18
Q2
FY
18
Q3
FY
18
8,998 9,984
-576-225
-110 -49
45 55 75 119 172
312 348820
-2000
0
2000
4000
6000
8000
10000
Q3
FY
17
Ba
nks
- P
ub
lic
Se
cto
r
IT
Ph
arm
a
Tele
co
m
Co
nsu
me
r -
sta
ple
s
Co
nsu
me
r -
Dis
cre
tio
na
ry
Oth
ers
Au
to
Ba
nks
- P
riv
ate
Se
cto
r
Me
tals
& M
inin
g
NB
FC
O&
G
Q3
FY
18
Earnings Contribution-Sector Wise
Source: Capitaline, Edelweiss Investment Research
5

Mid Cap versus Large Cap FY18 EPS
Nifty Forward EPS for FY18 remain stable
480
485
490
495
500
505
510
515
520
525
530
535
Ap
r-1
7
Ma
y-1
7
Ju
n-1
7
Ju
l-17
Au
g-1
7
Se
p-1
7
Oc
t-1
7
No
v-1
7
De
c-1
7
Ja
n-1
8
Fe
b-1
8
500
550
600
650
700
750
800
850
900
950
1000
Ap
r-1
7
Ma
y-1
7
Ju
n-1
7
Ju
l-17
Au
g-1
7
Se
p-1
7
Oc
t-1
7
No
v-1
7
De
c-1
7
Ja
n-1
8
Fe
b-1
8
Nifty Mid Cap EPS see a downgrade
● PSU Banks have majorly been responsible for Earnings downgrades expectations in both large cap and mid cap index.
● We expect the last quarter to be the best quarter for the current fiscal in terms of earnings.
Source: Bloomberg, Edelweiss Investment Research
6

7
Earnings- Sectoral Trend

Auto Anc. Display Strong Growth Across All Parameters
-40
-30
-20
-10
0
10
20
30
-20
-10
0
10
20
30
40
50
De
c-1
6
Ja
n-1
7
Fe
b-1
7
Ma
r-17
Ap
r-1
7
Ma
y-1
7
Ju
n-1
7
Ju
l-17
Au
g-1
7
Se
p-1
7
Oc
t-1
7
No
v-1
7
De
c-1
7
Ja
n-1
8
%
%
Revival in CV Domestic and Export Sales
3MMA Domestic Sales (LHS) 3MMA Exports (RHS)
26%
10%
14.4%
-40%
-30%
-20%
-10%
0%
10%
20%
30%
40%
Q3
FY
16
Q4
FY
16
Q1
FY
17
Q2
FY
17
Q3
FY
17
Q4
FY
17
Q1
FY
18
Q2
FY
18
Q3
FY
18
Sales y-o-y Adjusted PAT y-o-y PBIDT Margins
● Auto Ancilliaries have been benefited by growing demand in Commercial Vehicles, domestically and globally. Also Tyres continued to be benefitted by anti-dumping duties levied.
● We believe Auto Anc sector to significantly contribute to BSE 500 sector going forward too as numbers for CV and Class 8 truck orders continue to remain robust.
Robust growth in Sales and PAT growth, PBIDT Margins Steady, BSE
500- Auto Anc
Source: SIAM, Capitaline, Edelweiss Investment Research
8
Textiles- Strong Headwinds have pressurized the Financials
5.0
5.3
5.5
5.8
6.0
15,000
17,500
20,000
22,500
25,000Q
3 F
Y1
6
Q4
FY
16
Q1
FY
17
Q2
FY
17
Q3
FY
17
Q4
FY
17
Q1
FY
18
Q2
FY
18
Q3
FY
18
%
INR
Higher cotton prices push up raw material cost
MCX Cotton Futures (LHS) RM as % of Sales (RHS)
9%
1%
9.8%
-20%
-15%
-10%
-5%
0%
5%
10%
15%
20%
25%
30%
Q3
FY
16
Q4
FY
16
Q1
FY
17
Q2
FY
17
Q3
FY
17
Q4
FY
17
Q1
FY
18
Q2
FY
18
Q3
FY
18
Sales y-o-y Adjusted PAT y-o-y PBIDT Margins
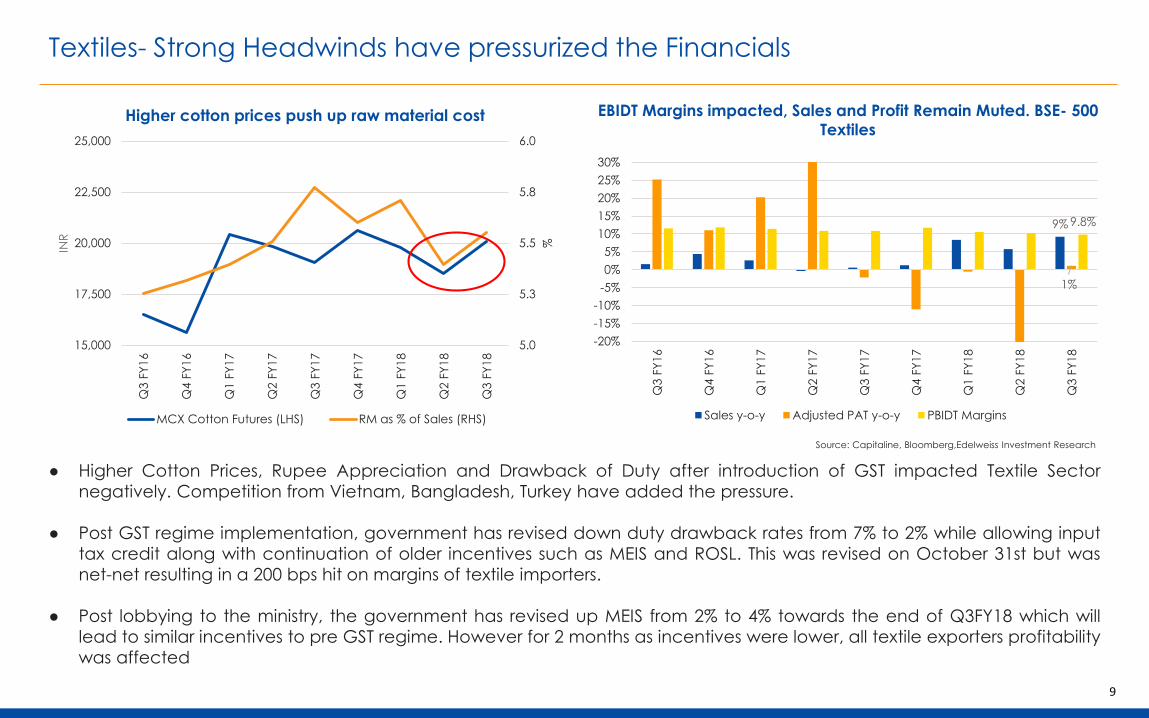
● Higher Cotton Prices, Rupee Appreciation and Drawback of Duty after introduction of GST impacted Textile Sector
negatively. Competition from Vietnam, Bangladesh, Turkey have added the pressure.
● Post GST regime implementation, government has revised down duty drawback rates from 7% to 2% while allowing input
tax credit along with continuation of older incentives such as MEIS and ROSL. This was revised on October 31st but was
net-net resulting in a 200 bps hit on margins of textile importers.
● Post lobbying to the ministry, the government has revised up MEIS from 2% to 4% towards the end of Q3FY18 which will
lead to similar incentives to pre GST regime. However for 2 months as incentives were lower, all textile exporters profitability
was affected
EBIDT Margins impacted, Sales and Profit Remain Muted. BSE- 500
Textiles
Source: Capitaline, Bloomberg,Edelweiss Investment Research
9

Consumer Staples: Profit Growth Aided by Tax Cuts
MSPs impacting Rural Wages With Lagged Effect
0%
5%
10%
15%
20%
25%
30%
FY10 FY11 FY12 FY13 FY14 FY15 FY16 FY17 FY18
y-o
-y
MSP- RHS Average Rural Wages- LHS
-20.0
-10.0
0.0
10.0
20.0
30.0
40.0
No
v-1
6
Ja
n-1
7
Ma
r-17
Ma
y-1
7
Ju
l-17
Se
p-1
7
No
v-1
7
Ja
n-1
8
%
Consumption in Two Wheelers and Tractors sees an
ascend
3MMA Two Wheelers (Left) 3MMA Tractors (Right)
5%
21% 21%
-10%
-5%
0%
5%
10%
15%
20%
25%
30%
35%
40%
Q3 FY16 Q4 FY16 Q1 FY17 Q2 FY17 Q3 FY17 Q4 FY17 Q1 FY18 Q2 FY18 Q3 FY18
Sales y-o-y Adjusted Profit y-o-y PBIDT Margins
Profit Bounced Back Sharply, BSE 500-Consumer Staples
● Consumption Staples Revenues have seen steady growth.
● GST cuts in the taxes have helped the profit to zoom.
● EBITDA Margins remained steady.
● We believe rural consumption and hike in MSPs to drive the consumer staples growth, going forward.
Source: Capitaline, CMIE, SIAM, Edelweiss Investment Research
10

Cement Sector- Mixed Bag of Results
-10.0% 0.0% 10.0% 20.0% 30.0% 40.0% 50.0% 60.0% 70.0%
Birla Corpn.
Heidelberg Cem.
India Cements
J K Cements
JK Lakshmi Cem.
Sagar Cements
Shree Cement
The Ramco Cement
UltraTech Cem.
Rising Costs for Cement Companies
QoQ Power and Fuel cost YoY Fuel and Power cost
-15%
-10%
-5%
0%
5%
10%
15%
0
100
200
300
400
500
600
700
800
900
Q1FY17 Q2FY17 Q3FY17 Q4FY17 Q1FY18 Q2FY18 Q3FY18
EBITDA/ton-LHS Sales Volume y-o-y
● Cement industry after being hit by demonetisation, monsoon and GST is finally showing sign of recovery.
● Higher input costs in terms of petcoke prices, fuel prices have impacted the margins.
● Looking ahead, we believe there is significant headwind in the cement sector aided through higher capacity utilization and nominal GDP growth
Sales Volume have risen but margins are impacted, BSE
500- Cement
Source: Capitaline,Edelweiss Investment Research
11

0.0%
0.1%
0.2%
0.3%
0.4%
0.5%
-0.2%
0.0%
0.2%
0.4%
0.6%
0.8%
Industrial Production Growth in EM and DM Remain
Robust
3MMA EM (Left) 3MMA DM (Right)
88
89
90
91
92
93
94
95
15-A
ug
-17
15-S
ep
-17
15-O
ct-
17
15-N
ov-1
7
15-D
ec
-17
15-J
an
-18
15-F
eb
-18
USD
Weak Dollar has driven Metal Prices Further higher
-100.0%
-80.0%
-60.0%
-40.0%
-20.0%
0.0%
20.0%
40.0%
-20.0%
-15.0%
-10.0%
-5.0%
0.0%
5.0%
10.0%
15.0%
20.0%
25.0%
2013 2014 2015 2016 2017
Shut down of Capacities in China, has led to higher
Indian exports, (Iron Ore Production)
India YoY (LHS) China YoY (RHS) ROW YoY (RHS)
Metals and Mining- Continue the Success Story
50%
-80%
-60%
-40%
-20%
0%
20%
40%
60%
80%
100%
Q3
FY
16
Q4
FY
16
Q1
FY
17
Q2
FY
17
Q3
FY
17
Q4
FY
17
Q1
FY
18
Q2
FY
18
Q3
FY
18
Sales y-o-y Adjusted Profit y-o-y PBIDT Margins
In spite of a high base , Profits and Revenue Growth Remained
Robust, BSE 500 -Metals
12Source: Capitaline, CMIE, Bloomberg, Edelweiss Investment Research
Banking – Stress in Public Sector Banks Continue
Personal Loans Continue to be Robust, Credit to Industry in
positive territory
-6
-4
-2
0
2
4
De
c-1
6
Ja
n-1
7
Fe
b-1
7
Ma
r-17
Ap
r-1
7
Ma
y-1
7
Ju
n-1
7
Ju
l-17
Au
g-1
7
Se
p-1
7
Oc
t-1
7
No
v-1
7
De
c-1
7
0
5
10
15
20
Yo
Y %
Yo
Y %
Total Loans (LHS) Personal Loans (LHS) Loans to Industry (RHS)
11286 100 94 97 103 111 102 108
-112
-238
234
6
-38-3
-43
-181
Q3
FY
16
Q4
FY
16
Q1
FY
17
Q2
FY
17
Q3
FY
17
Q4
FY
17
Q1
FY
18
Q2
FY
18
Q3
FY
18
Prf
otd
(IN
R B
illio
n)
Private Banks Public Banks
Public Sector Bank Profitability Continue to be in Stress
Profitability dent due to higher Provisions
0
10
20
30
40
50
60
0
50
100
150
200
250
Q3FY16 Q4FY16 Q1FY17 Q2FY17 Q3FY17 Q4FY17 Q1FY18 Q2FY18 Q3FY18
PCR-Public Banks-LHS PCR-Pvt. Banks-RHS
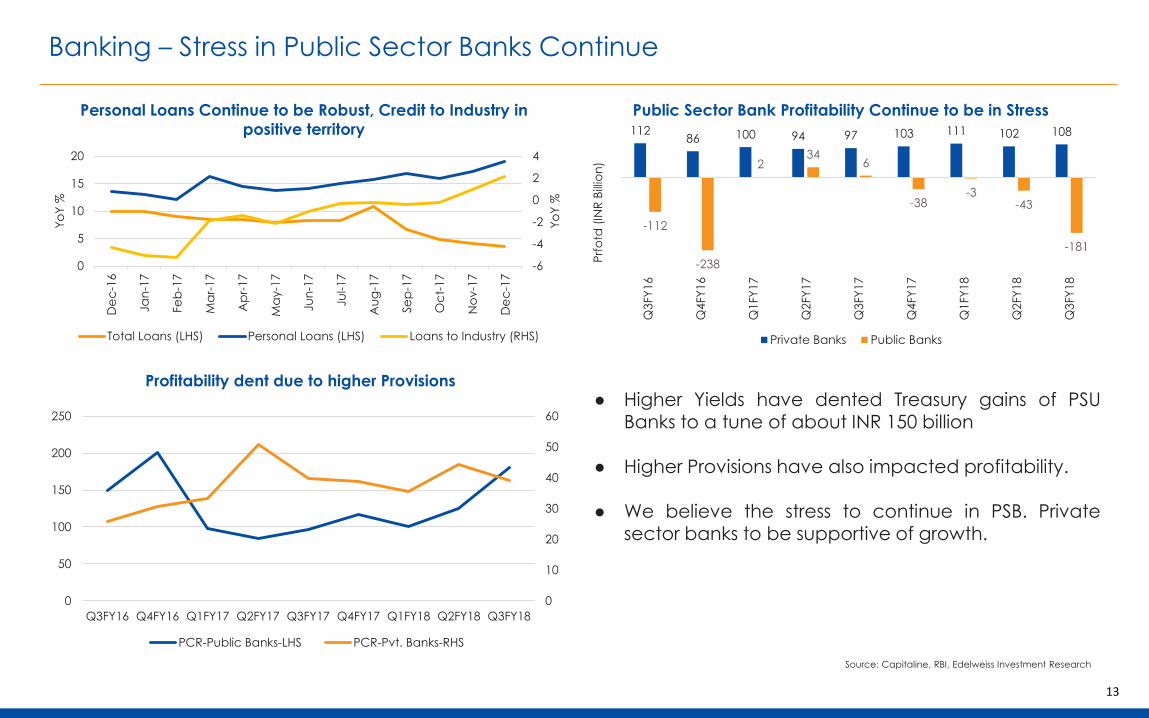
● Higher Yields have dented Treasury gains of PSUBanks to a tune of about INR 150 billion
● Higher Provisions have also impacted profitability.
● We believe the stress to continue in PSB. Privatesector banks to be supportive of growth.
Source: Capitaline, RBI, Edelweiss Investment Research
13

Road Construction: Industry to experience lower stress and higher growth
14
0
1000
2000
3000
4000
5000
6000
7000
8000
9000
FY10 FY14 FY18E
(IN
R b
n) 8% 4%
21%
Order Book Revenue Growth
894
2166
2408
1.1
1.4
1.0
0.5
0.6
0.7
0.8
0.9
1.0
1.1
1.2
1.3
1.4
1.5
0
500
1000
1500
2000
2500
3000
FY10 FY14 FY18E
(x)
(IN
R b
n)
Total Debt Debt/Equity
Cumulative
debt
accumulation
INR 1273 BN
Cumulative
debt
accumulation
INR 242 BN
Company’s Balance Sheet stress started reducing Execution is expected to pick up pace going forward
Companies in the infrastructure space witnessing a goldilocks scenario
Source: Capitaline, Edelweiss Investment Research
Building Materials – Growth Muted
Slow Growth Recovery in Building Materials Space, BSE-500
Building Materials
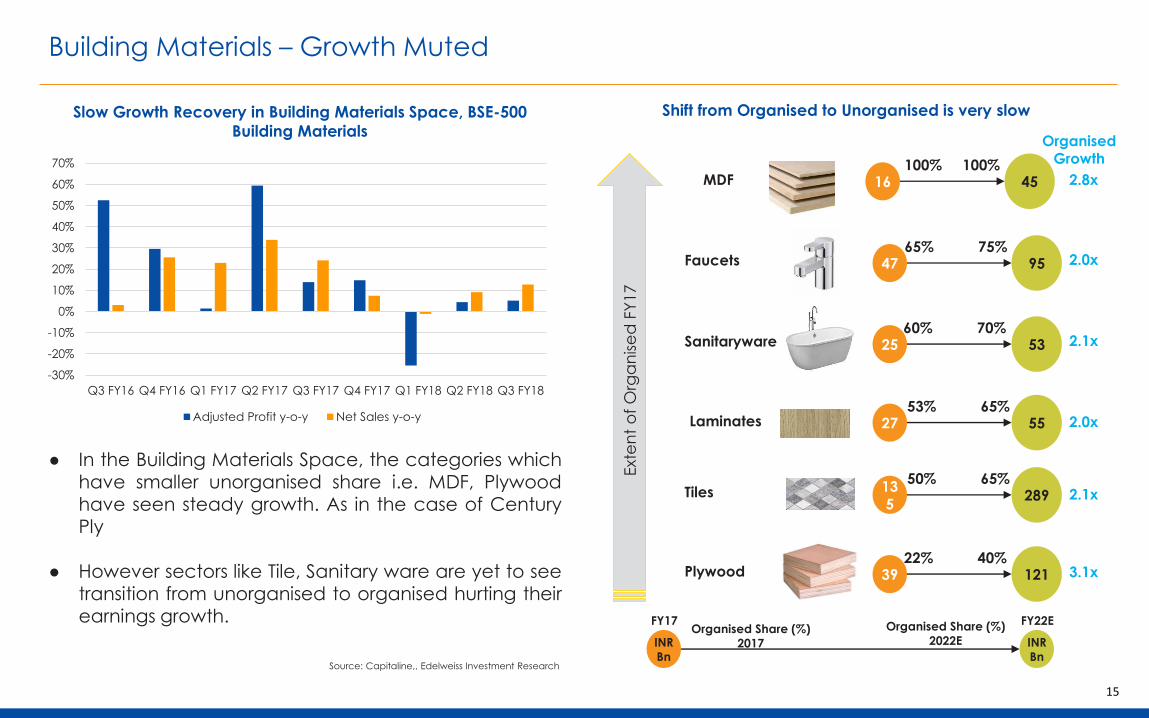
● In the Building Materials Space, the categories whichhave smaller unorganised share i.e. MDF, Plywoodhave seen steady growth. As in the case of CenturyPly
● However sectors like Tile, Sanitary ware are yet to seetransition from unorganised to organised hurting theirearnings growth.
Shift from Organised to Unorganised is very slow
-30%
-20%
-10%
0%
10%
20%
30%
40%
50%
60%
70%
Q3 FY16 Q4 FY16 Q1 FY17 Q2 FY17 Q3 FY17 Q4 FY17 Q1 FY18 Q2 FY18 Q3 FY18
Adjusted Profit y-o-y Net Sales y-o-y
INR
Bn
FY22E
Laminates 27 5553% 65%
Plywood 39 12122% 40%
Tiles 135
28950% 65%
Sanitaryware 25 5360% 70%
Faucets 47 9565% 75%
Exte
nt
of
Org
an
ise
d F
Y17
MDF 16 45100% 100%
2.8x
2.0x
2.1x
2.0x
2.1x
3.1x
Organised
Growth
INR
Bn
FY17Organised Share (%)
2017
Organised Share (%)
2022E
Source: Capitaline,, Edelweiss Investment Research
15

16
Coverage Stocks

17
Coverage Stocks : Analysis From the Estimates
● Among the best beats on both Topline and Bottom line were PNC Infra, Bharat Forge, Jamna Auto and SH Kelkar.
● Among the earnings which underperformed on both the Top and Bottom line were Mannapuram Finance, Ujjivan
Financial Services , Kirloskar Brothers.
SP Apparel
Trident
Indian Terrain
ABFRL
CUB
CGCEL
Borosil
GNA
Sanghi
Jamna Auto
Motherson
Bharat Forge
Sanghi
Sagar Cement
Sudarshan
SRF
SHK
Vinato
Phillips
Balaji Amines
Deepak Nitrite
Granules
Dilip Buildcon
KNRSadbhav
JMC
Quick Heal
Maharashtra Seamless
Kirloskar
KEC
A. Granito
Finolex
Shankara
Century Ply
Century
Can Fin
GIC
PNB
Ujjivan
Manappuram
Monte
-100%
-80%
-60%
-40%
-20%
0%
20%
40%
60%
80%
100%
-15% -10% -5% 0% 5% 10% 15% 20% 25% 30% 35%
PA
T
Net Sales
Deviation From the Estimates
Birla Corp
PNC
Beat on Sales, Beat on
Profits
Beat on Sales, Missed
on Profits
Beat on Profit, Missed
on Sales
Missed on Sales,
Missed on Profit
Source: Edelweiss Investment Research

18
Coverage Stocks : Earnings Growth Steady
-13%
-8%
14%
0%
41%
28%
28%
56%
38%
50%
4%
81%
597%
0%
0%
58% 21%
7%
-9%
280%
40%
154%
-10%
52%
50%
21%
19%
33%
250%
-11%
-574%
309%
79%
-5%
-3%
29%
27%
6%
34%
23%58%
-33%
0%
22%
6%
1%
16%
9%
23%
7%
9%
41%
23%
55%
36%
47%
5%
28%
32%
22%
23%
22%
13%
26%
32%33%
16%
40%
13%
2%
8%
29%
18%
48%
65%
2%
22%
6%
25%
15%
20% 20%
21%
22%
58%
2%
0%
8%
0%
10%
20%
30%
40%
50%
60%
70%
-800%
-600%
-400%
-200%
0%
200%
400%
600%
800%
SP
Ap
pa
rel
Trid
en
t
Ind
ian
Te
rra
in
AB
FRL
Mo
nte
Ca
rlo
CG
CEL
Bo
rosi
l Gla
ss
GN
A A
xle
s
Lum
ax
Jam
na
Au
to
Mo
the
rso
n S
um
i
Bh
ara
t Fo
rge
Sa
ng
hi
Ind
ust
rie
s
Birla
Co
rpo
ratio
n L
td
Sa
ga
r C
em
en
t Lt
d.
Su
da
rsh
an
SR
F
S H
Ke
lka
r
Vin
ati O
rga
nic
s
Ph
illip
s C
arb
on
Bla
ck L
td
Ba
laji
Am
ine
s
De
ep
ak N
itra
te
Gra
nu
les
Ind
ia
Dili
p B
uild
co
n
KN
R C
on
stru
ctio
ns
PN
C In
fra
tec
h
Sa
db
ha
v E
ng
ine
erin
g
JMC
Pro
jec
ts
Qu
ick H
ea
l
Ma
ha
rash
tra
Se
am
less
Go
da
va
ri P
ow
er
an
d Isp
at
Lim
ite
d
Kirlo
ska
r B
roth
ers
KEC
In
tern
atio
na
l
Asi
an
Gra
nito
Fin
ole
x In
d.
Sh
an
ka
ra
Ce
ntu
ry P
ly
Ze
e L
ea
rn
Ca
n F
in H
om
es
GIC
Ho
usi
ng
Fin
an
ce
PN
B H
ou
sin
g F
ina
nc
e
Ujji
va
n F
ina
nc
ial S
erv
ice
s
Ma
na
pp
ura
m F
ina
nc
e L
td
City U
nio
n B
an
k
% Y-o-Y Growth
PAT Net Sales (RHS)Source: Edelweiss Investment Research

19
Coverage Stocks : Valuation Analysis
SP Apparel
Trident
I.Terrain
Monte Carlo
CGCEL
Borosil Glass
GNA
Lumax Motherson
Bharat Forge
Sudarshan
SHK
Vinati Organics
Phillips
Balaji
Deepak Nitrate
Granules India
KNRPNC
Sadbhav
JMC
Quick Heal
Maharashtra Seamless
Kirloskar Brothers
KEC
A.Granito
Finolex Ind.
Shankara
Century Ply
Zee Learn
Can Fin
GIC
PNB
Ujjivan
Manappuram
CUB
0
5
10
15
20
25
30
35
40
-100% -50% 0% 50% 100% 150% 200% 250% 300% 350% 400%
P/E
(X
)
PAT
High P/E, High PAT
Growth
Low P/E, High PAT
Growth
Low PAT Growth, High
P/E
Low PAT Growth, Low
P/E
Sanghi
● We have plotted Earnings Growth for this quarter and One year forward P/E i.e P/E of FY19.
● In this exercise, Kiroskar Brothers, Philips Carbon, Monte Carlo have low P/E and high earnings growth
Sectoral Highlights
20
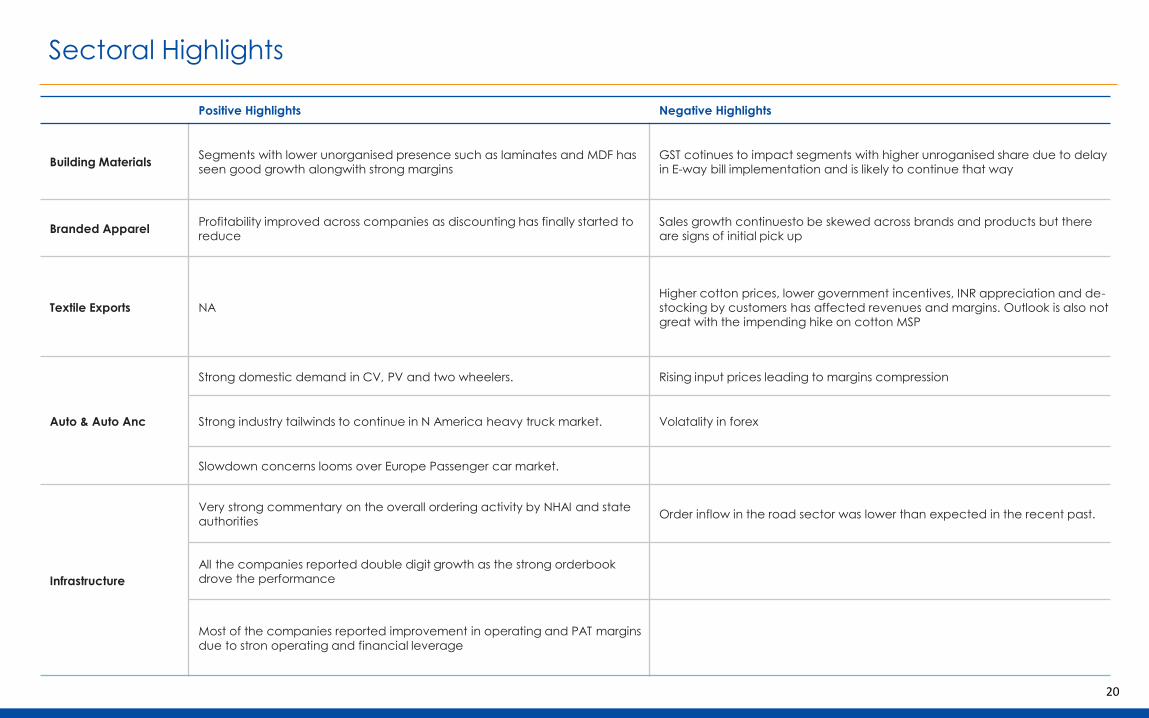
Positive Highlights Negative Highlights
Building MaterialsSegments with lower unorganised presence such as laminates and MDF has
seen good growth alongwith strong margins
GST cotinues to impact segments with higher unroganised share due to delay
in E-way bill implementation and is likely to continue that way
Branded ApparelProfitability improved across companies as discounting has finally started to
reduce
Sales growth continuesto be skewed across brands and products but there
are signs of initial pick up
Textile Exports NA
Higher cotton prices, lower government incentives, INR appreciation and de-
stocking by customers has affected revenues and margins. Outlook is also not
great with the impending hike on cotton MSP
Auto & Auto Anc
Strong domestic demand in CV, PV and two wheelers. Rising input prices leading to margins compression
Strong industry tailwinds to continue in N America heavy truck market. Volatality in forex
Slowdown concerns looms over Europe Passenger car market.
Infrastructure
Very strong commentary on the overall ordering activity by NHAI and state
authorities Order inflow in the road sector was lower than expected in the recent past.
All the companies reported double digit growth as the strong orderbook
drove the performance
Most of the companies reported improvement in operating and PAT margins
due to stron operating and financial leverage
Sectoral Highlights
21
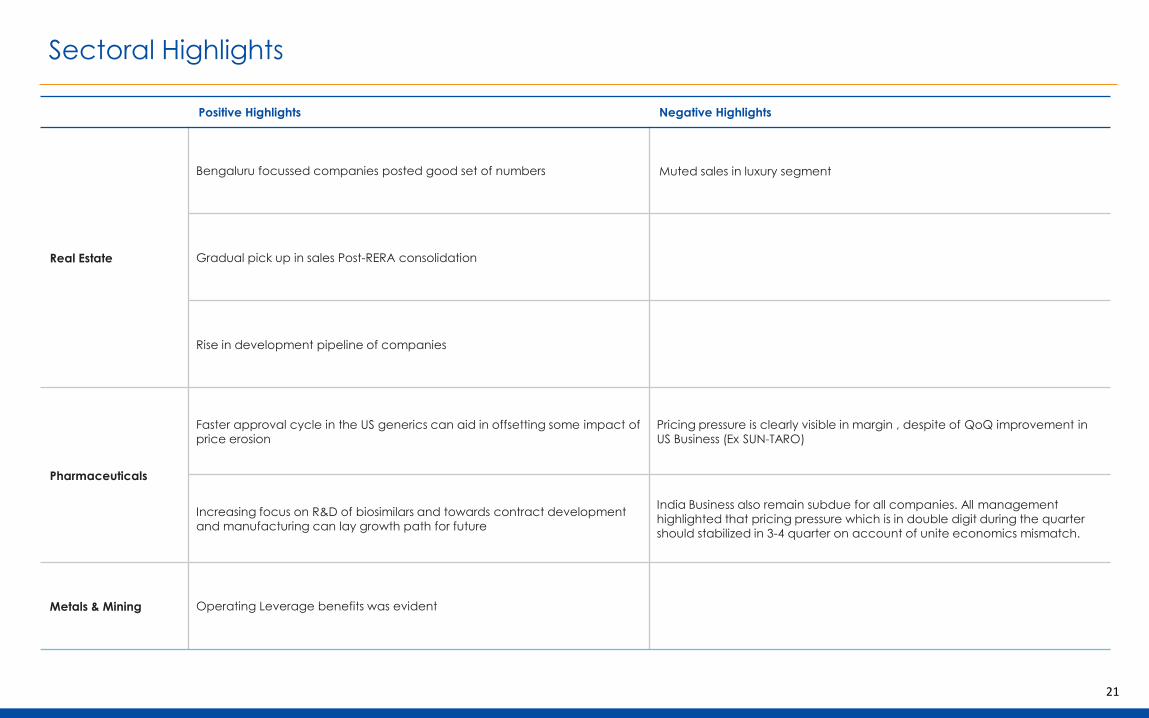
Positive Highlights Negative Highlights
Real Estate
Bengaluru focussed companies posted good set of numbers Muted sales in luxury segment
Gradual pick up in sales Post-RERA consolidation
Rise in development pipeline of companies
Pharmaceuticals
Faster approval cycle in the US generics can aid in offsetting some impact of
price erosion
Pricing pressure is clearly visible in margin , despite of QoQ improvement in
US Business (Ex SUN-TARO)
Increasing focus on R&D of biosimilars and towards contract development
and manufacturing can lay growth path for future
India Business also remain subdue for all companies. All management
highlighted that pricing pressure which is in double digit during the quarter
should stabilized in 3-4 quarter on account of unite economics mismatch.
Metals & Mining Operating Leverage benefits was evident

22
Earning Estimates
Textiles
SP Apparel Q3FY18 Q3FY18E Q3FY17 % Y-o-Y Q2FY18 % Q-o-Q Comments
Net sales 163 178 154 6% 170 -4%Topline growth was low inspite of 13% revenues to new clients on account of
product mix
EBITDA 27 36 35 -23% 32 -16%INR appreciation, high cotton costs and lower government incentives affected
margins
PAT 14 20 16 -13% 10 40% PAT was far below estimates on account of topline and margins miss
Trident Q3FY18 Q3FY18E Q3FY17 % Y-o-Y Q2FY18 % Q-o-Q Comments
Net sales 1137 1167 1122 1% 1155 -2% Sales were subdued on ccount of de-stocking by terry towel customers in USA
EBITDA 200 210 225 -11% 174 15%Textiles setor margins were weak but Trident outperformed as paper margins
were strong
PAT 73 82 79 -8% 51 43% PAT was lower than estimates due to higher tax expenses
Consumption
Indian Terrain Q3FY18 Q3FY18E Q3FY17 % Y-o-Y Q2FY18 % Q-o-Q Comments
Net sales 95 101 82 16% 115 -17%Topline growth was subdued compared to other players, even post adjusting
for excise
EBITDA 13 12 11 18% 14 -7% Margins were in line with our estimates due to better gross margin
PAT 6 7 6 14% 8 -24%PAT was slightly lower on account of higher depreciation and lower other
income

23
Earning Estimates
Consumption
Indian Terrain Q3FY18 Q3FY18E Q3FY17 % Y-o-Y Q2FY18 % Q-o-Q Comments
Net sales 95 101 82 16% 115 -17%Topline growth was subdued compared to other players, even post adjusting
for excise
EBITDA 13 12 11 18% 14 -7% Margins were in line with our estimates due to better gross margin
PAT 6 7 6 14% 8 -24%PAT was slightly lower on account of higher depreciation and lower other
income
ABFRL Q3FY18 Q3FY18E Q3FY17 % Y-o-Y Q2FY18 % Q-o-Q Comments
Net sales 1855 2025 1699 9% 1804 3%Topline growth was subdued on account of slow growth in Forever 21 and
Pantaloons
EBITDA 138 145 88 57% 119 16%Inspite of topline miss, operating profits were strong driven by rationalization in
Pantaloons
PAT 35 34 -12 NA -10 NA PAT was also in line with estimates after multiple quarters of underperformance
Monte Carlo Q3FY18 Q3FY18E Q3FY17 % Y-o-Y Q2FY18 % Q-o-Q Comments
Net sales 356 365 289 23% 138 158% Sales growth was strong albeit on a low base; due to a harsh winter
EBITDA 80 80 53 51% 26 208%Margins were higher than our estimates on higher share of the higher margin
cotton garments
PAT 48 46 34 41% 16 200%PAT was also slightly higher than our estimates due to strong operational
performance

24
Earning Estimates
Consumption
CGCEL Q3FY18 Q3FY18E Q3FY17 % Y-o-Y Q2FY18 % Q-o-Q Comments
Net sales 938 1,051 879 6.7% 960 -2.2%The slow down in growth was due to subdued ECD business mainly slow down
in gyser and pump business due to increase in competition
EBITDA 116 131 97 19.8% 121 -3.5% Margins were in line with our estimates due to better gross margin
PAT 69 78 54 27.9% 71 -1.8% PAT was lower then estimates, however, delivered strong y-o-y growth
Borosil Glass Q3FY18 Q3FY18E Q3FY17 % Y-o-Y Q2FY18 % Q-o-Q Comments
Net sales 79 85 72 9% 79 -1%Reported healthy number in its seasonally strong quarter for both the segments
consumer-ware & scientific-ware
EBITDA 13 12 9 35% 13 0%Strong growth in EBITDA mainly with the improvement in gross margin and
decrease in overhead expenses as % sales.
PAT 13 12 10 28% 14 -6%Reported Adj. PAT of INR 12.8cr, up 28% y-o-y excluding one off gain in Q3FY17
of INR 87cr.
Auto & Auto Anc
GNA Axles Q3FY18 Q3FY18E Q3FY17 % Y-o-Y Q2FY18 % Q-o-Q Comments
Net sales 167 160 119 41% 154 9%Strong growth in North America heavy truck market, combined with healthy
industry tailwinds in domestic CV and tractor market drove growth.
EBITDA 27 25 19 38% 24 13% Despite rise in input cost, higher operational efficiency fuel growth in EBITDA
PAT 13 11 8 56% 11 19% Higher growth in EBITDA, coupled with lower interest cosst fuelled rise in PAT

25
Earning Estimates
Auto & Auto Anc
Lumax Q3FY18 Q3FY18E Q3FY17 % Y-o-Y Q2FY18 % Q-o-Q Comments
Net sales 371 346 300 23% 380 -2%
Strong demand for passenger car models where Lumax provides its lighting
solution, coupled with change in mix towards high realisation LED lights drove
growth.
EBITDA 33 28 25 30% 30 9% Despite rise in input cost, higher operational efficiency fuel growth in EBITDA
PAT 18 18 13 38% 21 -13%Significantly lower profit from JV, SL Lumax due to one time price revision by its
client pulled down growth levels of company's consol PAT
Jamna Auto Q3FY18 Q3FY18E Q3FY17 % Y-o-Y Q2FY18 % Q-o-Q Comments
Net sales 470 410 304 55% 385 22%Strong growth in domestic M&HCV sales drove growth for company's overall
topline.
EBITDA 61 53 42 47% 50 22%Higher operational efficiency benefited, however rise in input prices led to
drop in EBITDA margins.
PAT 32 30 21 50% 29 8% PAT margins too witnessed a marginal drop.
Motherson
SumiQ3FY18 Q3FY18E Q3FY17 % Y-o-Y Q2FY18 % Q-o-Q Comments
Net sales 14398 14,316 10,591 36% 13,431 7%PKC integration coupled with healthy rise in domestic operation fuelled topline
rise. However slowdown in Europe passenger car markets looms.
EBITDA 1259 1,406 1,097 15% 1,251 1%Forex impact, higher input prices and supply constraint at PKC Europe pulled
down EBITDA margins
PAT 439 575 422 4% 786 -44%Although lower interest benefited, lower EBITDA margins pulled down PAT
margins as well.

26
Earning Estimates
Auto & Auto Anc
Bharat Forge Q3FY18 Q3FY18E Q3FY17 % Y-o-Y Q2FY18 % Q-o-Q Comments
Net sales 1391 1,132 944 47% 1,258 11%Strong demand from North American Class 8 Trucks, coupled with healthy
scenario in Europe and domestic business drove topline growth
EBITDA 416 322 261 60% 369 13%Despite higher input cost, operational efficiency because of impressive rise in
topline aided to growth in EBITDA margins
PAT 228 170 126 81% 204 12% Benefits of rise in EBITDA margins also drove growth in PAT margins.
Cement
Sanghi
IndustriesQ3FY18 Q3FY18E Q3FY17 % Y-o-Y Q2FY18 % Q-o-Q Comments
Net sales 285 287 272 5% 206 39%Revenue was in-line because of blended cement sales volume was but lower
realisation offset
EBITDA 67 82 42 58% 47 44%
EBITDA was from our estimate due to lower realisation and cement sales
volume was but clinker volume was much higher than anticipated (Low
margin product): hence margin impacted
PAT 32 30 5 597% 11 195% PAT was marginally higher than the estimates
Birla
CorporationQ3FY18 Q3FY18E Q3FY17 % Y-o-Y Q2FY18 % Q-o-Q Comments
Net sales 1403 1,321 1,097 28% 1,247 13%Significant growth in cement sales volume and marginal up in realisation
helped to beat our estimate
EBITDA 139 244 121 15% 177 -22%EBITDA was lower due to significant surge in Power and Fuel cost and also in
Freight & forwarding cost
PAT -22 56 -41 NA 1 NA Surge in operating cost resulted in loss on net level

27
Earning Estimates
Cement
Sagar Cement
Ltd. Q3FY18 Q3FY18E Q3FY17 % Y-o-Y Q2FY18 % Q-o-Q Comments
Net sales 251 264 191 32% 235 7%Net revenue was almost in-line with estimate, driven by 44% growth in cement
sales volume
EBITDA 33 45 29 15% 38 -14% Higher operating cost dented EBITDA
PAT 3 13 -1 NA 9 -65% Higher operating cost dented PAT
Chemicals
Sudarshan Q3FY18 Q3FY18E Q3FY17 % Y-o-Y Q2FY18 % Q-o-Q Comments
Net sales 345 317 282 22% 352 -2% Sales beat driven by robust volume growth of 25%
EBITDA 46 44 32 44% 52 -12% Higher raw material prices from China dampened gross margins
PAT 19 19 12 58% 23 -17% PAT largely in line with expectations
SRF Q3FY18 Q3FY18E Q3FY17 % Y-o-Y Q2FY18 % Q-o-Q Comments
Net sales 1,397 1,292 1,133 23% 1,286 9% Sales growth driven by refrigerants; Specialty demand to pick up in FY19
EBITDA 232 221 231 0% 211 10% Gross margin declined due to higher COGS
PAT 131 103 108 21% 103 27% Net profits beat driven by one-off forex gain of INR 21 cr

28
Earning Estimates
Chemicals
S H Kelkar Q3FY18 Q3FY18E Q3FY17 % Y-o-Y Q2FY18 % Q-o-Q Comments
Net sales 283 248 232 22% 222 28%Strong sales growth in fragrances business of 26% driven by demand recovery
across segments
EBITDA 58 45 40 46% 35 63% Strong sales growth and margin expansion in the flavours business
PAT 27 26 25 7% 19 42%PAT impacted by one-off termination cost related to partial reduction of PFW’s
workforce
Vinati
OrganicsQ3FY18 Q3FY18E Q3FY17 % Y-o-Y Q2FY18 % Q-o-Q Comments
Net sales 186 183 164 13% 161 15%Topline driven by demand for ATBS while IBB volumes impacted by an
extended debottlenecking shutdown at one of its major clients
EBITDA 50 57 55 -9% 46 8% Higher raw material prices resulted in a y-o-y dip of ~759 bps in gross margins
PAT 32 35 35 -9% 29 9% PAT decline driven by decline in EBITDA
Phillips
CarbonQ3FY18 Q3FY18E Q3FY17 % Y-o-Y Q2FY18 % Q-o-Q Comments
Net sales 612 625 485 26% 598 2%Increase in sales largely a reflection of the higher prices of CBFS y-o-y and
increased sales of specialty black
EBITDA 97 94 65 49% 95 2% EBITDA per ton improved as proportion of specialty black in sales mix increased
PAT 57 48 15 280% 51 12%Lower than expected interest costs resulted in higher than expected
profitability

29
Earning Estimates
Chemicals
Balaji Amines Q3FY18 Q3FY18E Q3FY17 % Y-o-Y Q2FY18 % Q-o-Q Comments
Net sales 219 200 166 32% 201 9%
Chemicals/amines business (comprising 77% of revenues) grew at a staggering
33% y-o-y with higher utilisation levels across derivatives led by supply
disruptions in China, a phenomenon which is expected to continue in the
medium term. Exports continued to grow in healthy double digits with 27% y-o-
y growth driven largely by demand from European countries.
EBITDA 51 48 37 38% 52 -2%
PAT 28 29 20 40% 29 -3%
Deepak
NitrateQ3FY18 Q3FY18E Q3FY17 % Y-o-Y Q2FY18 % Q-o-Q Comments
Net sales 371 340 280 33% 355 5%Basic chemicals segment witnessed strong growth of 25% y-o-y on account of
higher demand due to supply disruptions from China as well as increase in
domstic consumption demand.
Normalisation of operations in Roha facility (fire break out in Q3FY17) and
resumption in Hyderabad facility (operations disrupted due to regulatory issue
in Q3FY17) led to revenue resumption in fine and specialty chemicals segment
and performance products business respectively.
Acetone phenol project is in the final stages of commencement. The
technology provider’s team in on the site for commencement of final checks.
EBITDA 52 50 31 69% 52 -1%
PAT 20 22 8 154% 23 -10%

30
Earning Estimates
Pharmaceuticals
Granules India Q3FY18 Q3FY18E Q3FY17 % Y-o-Y Q2FY18 % Q-o-Q Comments
Net sales 411 388 353 16% 393 5%Revenue growth led by low-margin domestic sales of expanded paracetamol
capacity.
EBITDA 75 71 81 -7% 84 -10%
Higher intermediate prices (especially PAP) and low-margin incremental
paracetamol sales culminated into 372 bps y-o-y fall in gross margins.
High other expenses owing to forex fluctuations further added to margins de-
growth of 430 bps y-o-y.
PAT 35 29 39 -10% 40 -13%
Infrastructure
Dilip Buildcon Q3FY18 Q3FY18E Q3FY17 % Y-o-Y Q2FY18 % Q-o-Q Comments
Net sales 1942 1,706 1,389 40% 1,582 23%Topline growth was best in the industry at 40%. Even after strong base this
growth in topline was commendable
EBITDA 345 328 278 24% 291 18%EBITDA margin was low due high other expenses and is expected to recover
going forward.
PAT 165 138 109 52% 122 35% Bottomline got financial and operating leverage benefit
KNR
ConstructionsQ3FY18 Q3FY18E Q3FY17 % Y-o-Y Q2FY18 % Q-o-Q Comments
Net sales 433 426 382 13% 393 10% Topline growth was slightly higther than expectations.
EBITDA 98 77 58 71% 82 19%The company reported one of the highest EBITDA margin among peers and
highest in its history
PAT 62 45 42 50% 59 6%Low tax rate, low interest cost aid the company to reach 15% PAT margin; the
highest in history
31
Earning Estimates
Infrastructure
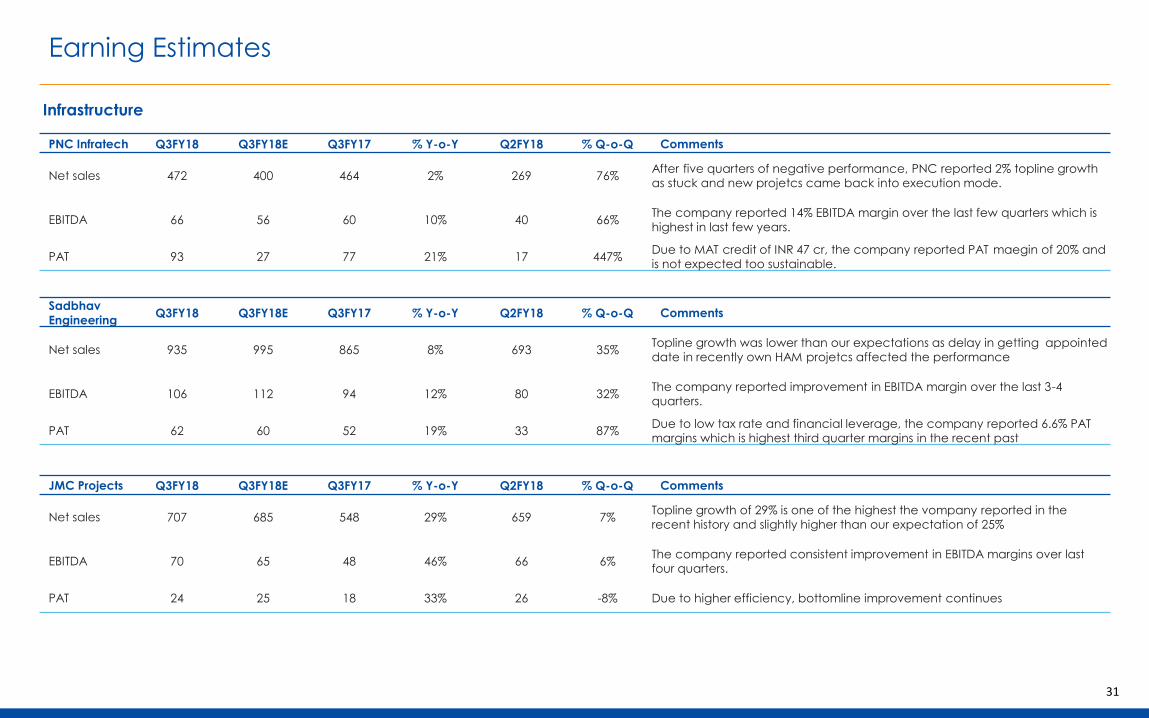
PNC Infratech Q3FY18 Q3FY18E Q3FY17 % Y-o-Y Q2FY18 % Q-o-Q Comments
Net sales 472 400 464 2% 269 76%After five quarters of negative performance, PNC reported 2% topline growth
as stuck and new projetcs came back into execution mode.
EBITDA 66 56 60 10% 40 66%The company reported 14% EBITDA margin over the last few quarters which is
highest in last few years.
PAT 93 27 77 21% 17 447%Due to MAT credit of INR 47 cr, the company reported PAT maegin of 20% and
is not expected too sustainable.
Sadbhav
EngineeringQ3FY18 Q3FY18E Q3FY17 % Y-o-Y Q2FY18 % Q-o-Q Comments
Net sales 935 995 865 8% 693 35%Topline growth was lower than our expectations as delay in getting appointed
date in recently own HAM projetcs affected the performance
EBITDA 106 112 94 12% 80 32%The company reported improvement in EBITDA margin over the last 3-4
quarters.
PAT 62 60 52 19% 33 87%Due to low tax rate and financial leverage, the company reported 6.6% PAT
margins which is highest third quarter margins in the recent past
JMC Projects Q3FY18 Q3FY18E Q3FY17 % Y-o-Y Q2FY18 % Q-o-Q Comments
Net sales 707 685 548 29% 659 7%Topline growth of 29% is one of the highest the vompany reported in the
recent history and slightly higher than our expectation of 25%
EBITDA 70 65 48 46% 66 6%The company reported consistent improvement in EBITDA margins over last
four quarters.
PAT 24 25 18 33% 26 -8% Due to higher efficiency, bottomline improvement continues

32
Earning Estimates
IT
Quick Heal Q3FY18 Q3FY18E Q3FY17 % Y-o-Y Q2FY18 % Q-o-Q Comments
Net sales 65 65 55 18% 106 -39%After five quarters of degrowth/flat performance, the company reported 20%
growth backed by growth both consumer and enterprise business
EBITDA 11 14 3 267% 52 -79%Due to high operating lvelerage, EBITDA margin reported at 18% against 6%
reported in the corresponding quarter.
PAT 7 9 2 250% 35 -80%Reported PAT margin was 10% against 3% reported in the corresponding
quarter.
Metals and Mining
Maharashtra
SeamlessQ3FY18 Q3FY18E Q3FY17 % Y-o-Y Q2FY18 % Q-o-Q Comments
Net sales 564 432 382 47.6% 484 17%
Volumes of seamless pipes grew at 47% on yoy basis to 81,700 tons, taking
9MFY18 volumes to ~2.22 lakh tons. MSL continues to maintain healthy order
book of INR 430cr derived 50% from PSUs like ONGC/refineries and rest of OB
from EPC players/equipment manufacturers like L&T, Thermax, as well as
dealers of seamless tubes.
EBITDA 61 80 59 3.4% 60 2%
EBIDTA remained flat at INR 61cr on yoy as well as qoq basis. Older orders with
lower realisation and margins, to the extent of 15k tons in seamless and 8-10k
tons in ERW pipes along with unfavorable currency movement resulted in
flattish EBITDA in the quarter
PAT 39 55 44 -11.4% 34 15%
Godavari
PowerQ3FY18 Q3FY18E Q3FY17 % Y-o-Y Q2FY18 % Q-o-Q Comments
Net sales 574 446 348 64.9% 455 26%
Reported strong performance in Q3FY18 backed by healthy volume growth
across product lines coupled with higher realisations. On standalone basis, net
sales during the quarter grew by 45.5% to INR 574cr. Pellets sales volumes were
higher by 53% along with 18% hike in average realisations.
EBITDA 125 100 47 166.0% 98 28%Growth of 46% in iron ore mining production led to higher captive supply
fueling EBIDTA growth by 165% to INR 125cr
PAT 64 30 -14 NA 12 433%
33
Earning Estimates
Engineering & Cap Goods
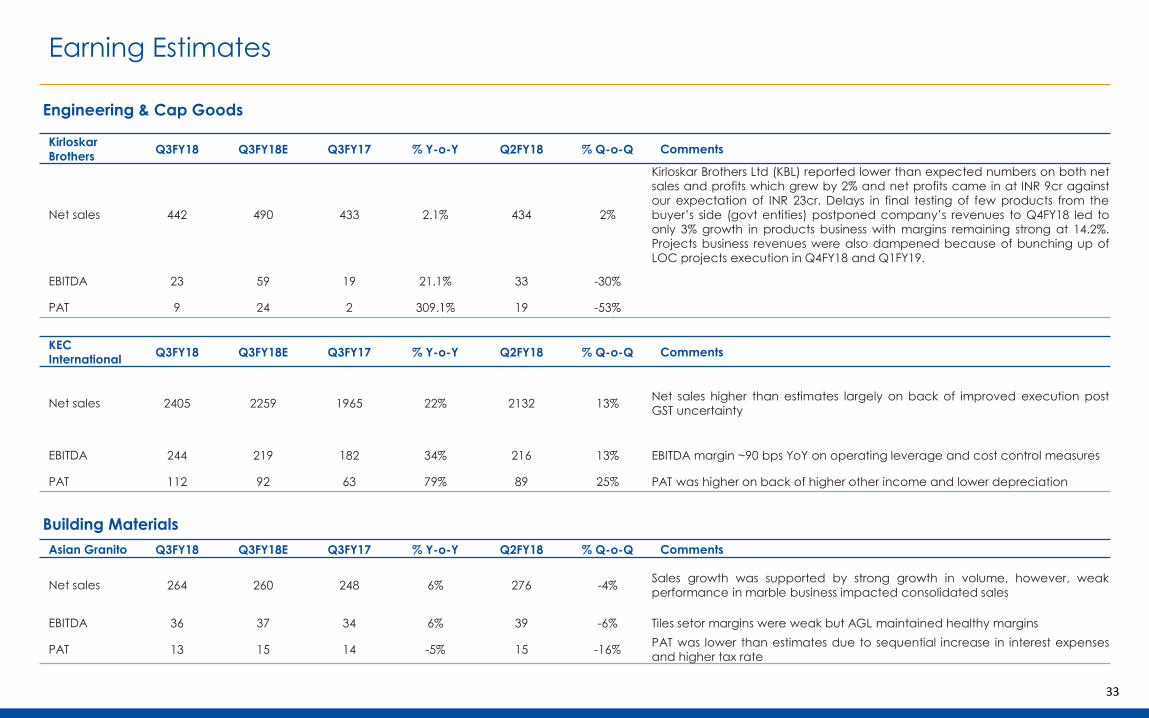
Kirloskar
BrothersQ3FY18 Q3FY18E Q3FY17 % Y-o-Y Q2FY18 % Q-o-Q Comments
Net sales 442 490 433 2.1% 434 2%
Kirloskar Brothers Ltd (KBL) reported lower than expected numbers on both net
sales and profits which grew by 2% and net profits came in at INR 9cr against
our expectation of INR 23cr. Delays in final testing of few products from the
buyer’s side (govt entities) postponed company’s revenues to Q4FY18 led to
only 3% growth in products business with margins remaining strong at 14.2%.
Projects business revenues were also dampened because of bunching up of
LOC projects execution in Q4FY18 and Q1FY19.
EBITDA 23 59 19 21.1% 33 -30%
PAT 9 24 2 309.1% 19 -53%
KEC
InternationalQ3FY18 Q3FY18E Q3FY17 % Y-o-Y Q2FY18 % Q-o-Q Comments
Net sales 2405 2259 1965 22% 2132 13%Net sales higher than estimates largely on back of improved execution post
GST uncertainty
EBITDA 244 219 182 34% 216 13% EBITDA margin ~90 bps YoY on operating leverage and cost control measures
PAT 112 92 63 79% 89 25% PAT was higher on back of higher other income and lower depreciation
Building Materials
Asian Granito Q3FY18 Q3FY18E Q3FY17 % Y-o-Y Q2FY18 % Q-o-Q Comments
Net sales 264 260 248 6% 276 -4%Sales growth was supported by strong growth in volume, however, weak
performance in marble business impacted consolidated sales
EBITDA 36 37 34 6% 39 -6% Tiles setor margins were weak but AGL maintained healthy margins
PAT 13 15 14 -5% 15 -16%PAT was lower than estimates due to sequential increase in interest expenses
and higher tax rate

34
Earning Estimates
Building Materials
Finolex Ind. Q3FY18 Q3FY18E Q3FY17 % Y-o-Y Q2FY18 % Q-o-Q Comments
Net sales 723 778 577 25% 475 52%
Adjusted for excise duty, sales were in line; sales grew ~25% y-o-y (excluding
duties and taxes), driven by healthy sales growth in Pipe & fittings (up ~35% y-
o-y)
EBITDA 113 132 130 -13% 50 128%EBITDA margins were below our estimate mainly due to contraction in gross
margin
PAT 69 79 72 -3% 28 146% Lower operating margin resulted lower PAT
Shankara Q3FY18 Q3FY18E Q3FY17 % Y-o-Y Q2FY18 % Q-o-Q Comments
Net sales 624 642 541 15% 571 9%Adjusted for excise duty, sales were in line with strong SSG growth in the retail
segment
EBITDA 41 49 37 11% 41 0%EBITDA margins were strong in retail but channel and enterprise were hit by
one-offs
PAT 18 23 14 29% 17 6% Inspite of EBITDA miss impacting bottomline, PAT growth was still strong
Century Ply Q3FY18 Q3FY18E Q3FY17 % Y-o-Y Q2FY18 % Q-o-Q Comments
Net sales 510 543 425 20% 475 7%Sales growth was driven by new MDF project and was in line adjusting for
excise
EBITDA 88 84 67 31% 75 17%EBITDA beat was driven by MDF which broke even in the first quarter of
operation itself
PAT 47 48 37 27% 40 18% PAT was in line with our estimates

35
Earning Estimates
Education
Zee Learn Q3FY18 Q3FY18E Q3FY17 % Y-o-Y Q2FY18 % Q-o-Q Comments
Net sales 30 30 25 20% 37 -18%Inline with our estimate, healthy performance dispite seasoanlly weakest
quarter.
EBITDA 10 11 9 15% 16 -36%Improvement in operating margin with the higher growth in revenue against
expenses as majority of expenses are fixed in nature and incremental sales
flowing to operating profit.
PAT 6 7 6 6% 10 -36% PAT was also in line with estimates with the improvement in operating margins
BFSI
Can FIn Q3FY18 Q3FY18E Q3FY17 % Y-o-Y Q2FY18 % Q-o-Q Comments
Net revenue 144 153 119 21.0 143 1.2Net revenue growth slightly slower than our estimate due to lower loan and
advances growth from our estimates
Net profit 80 80 60 34.4 75 6.8 Net PAT in-line due to moderate C/I
GNPA (%) 0 NA 0 22bps 0 6bps
GIC Q3FY18 Q3FY18E Q3FY17 % Y-o-Y Q2FY18 % Q-o-Q Comments
Net revenue 99 103 81 21.8 100 -0.3 Net revenue was almost in-line
Net profit 42 42 34 22.5 42 0.6 PAT was exactly in-line due to moderate cost
GNPA (%) 3 NA 3 3bps 3 17bps
PNB Housing Q3FY18 Q3FY18E Q3FY17 % Y-o-Y Q2FY18 % Q-o-Q Comments
Net revenue 514 507 326 57.8 480 7.1 Net revenue was exactly in-line with estimate
Net profit 218 225 138 58.2 210 3.8 PAT was almost in-line with estimate
GNPA (%) 0 NA 0 5bps 0 8bps
36
Earning Estimates
BFSI
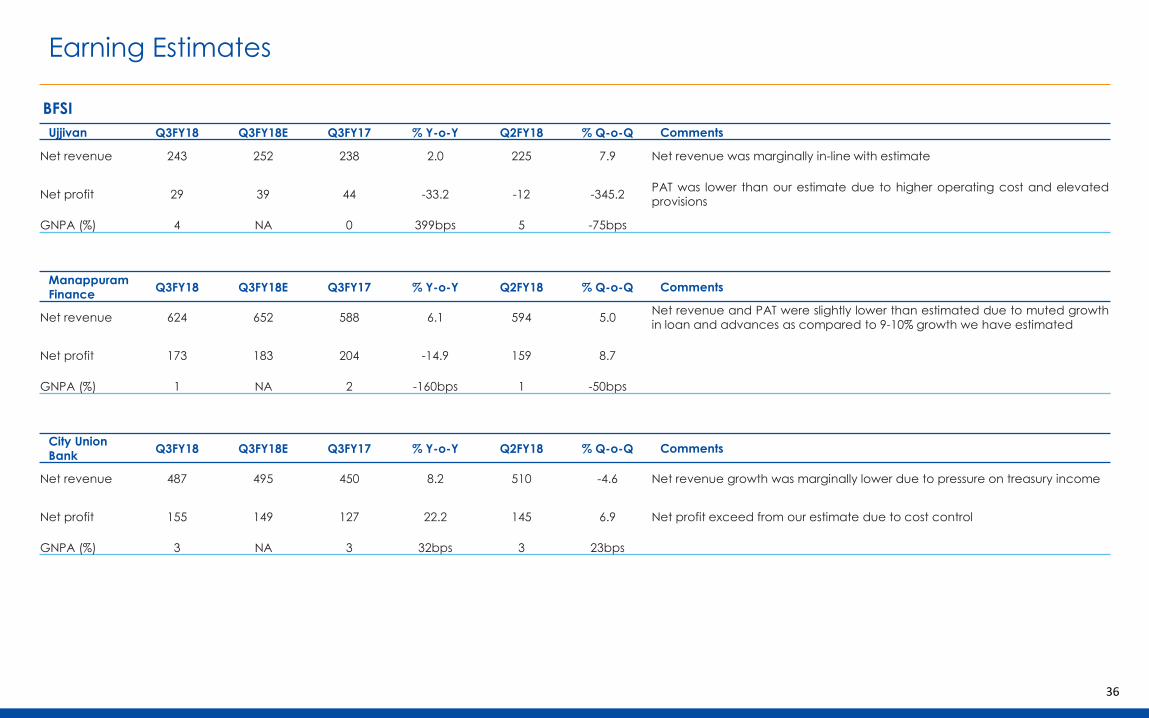
Ujjivan Q3FY18 Q3FY18E Q3FY17 % Y-o-Y Q2FY18 % Q-o-Q Comments
Net revenue 243 252 238 2.0 225 7.9 Net revenue was marginally in-line with estimate
Net profit 29 39 44 -33.2 -12 -345.2PAT was lower than our estimate due to higher operating cost and elevated
provisions
GNPA (%) 4 NA 0 399bps 5 -75bps
Manappuram
FinanceQ3FY18 Q3FY18E Q3FY17 % Y-o-Y Q2FY18 % Q-o-Q Comments
Net revenue 624 652 588 6.1 594 5.0Net revenue and PAT were slightly lower than estimated due to muted growth
in loan and advances as compared to 9-10% growth we have estimated
Net profit 173 183 204 -14.9 159 8.7
GNPA (%) 1 NA 2 -160bps 1 -50bps
City Union
BankQ3FY18 Q3FY18E Q3FY17 % Y-o-Y Q2FY18 % Q-o-Q Comments
Net revenue 487 495 450 8.2 510 -4.6 Net revenue growth was marginally lower due to pressure on treasury income
Net profit 155 149 127 22.2 145 6.9 Net profit exceed from our estimate due to cost control
GNPA (%) 3 NA 3 32bps 3 23bps

37
Performance Long Term Recommendation
Stocks Reco Price Target Return
KNR Constructions Ltd 51 260 495%
PNC Infratech Ltd 104 170 61%
JMC Projects (India) Ltd 247 286 135%
Dilip Buildcon Ltd 370 705 157%
Sadbhav Engineering Ltd 410 565 -2%
Manappuram Finance Ltd 92 129 18%
GIC Housing Finance Ltd 451 652 -10%
City Union Bank Ltd 159 180 7%
Ujjivan Financial Services Ltd 348 452 7%
Can Fin Homes Ltd 475 588 12%
PNB Housing Finance Ltd 1344 1659 -9%
Quick Heal Tehnologies 269 390 12%
Finolex industries 190 715 241%
Indian Terrain Ltd 120 230 71%
Aditya Birla Fashion & Retail Ltd 165 225 -8%
Crompton Greaves Consumer Electricals Ltd 143 257 64%
Heritage Foods Ltd 562 825 21%
Borosil Glassworks Ltd 880 1,158 7%
Parag Milk Foods 225 300 31%
Asian Granito India Ltd 407 640 25%
Shankara Building Products Ltd 1,316 1,575 31%
Everest Industries 465 624 22%
Century Plyboards 295 390 6%
Monte Carlo 588 800 -7%
Visaka Industries 715 1,075 -4%
Natco Pharmaceutical Ltd 171 1213 354%
Granules India Ltd 152 228 -23%
Stocks Reco Price Target Return
Dalmia Bharat Ltd 749 2,909 260%
Sanghi Industries Ltd 61 112 93%
Birla Corporation Ltd 952 1233 -7%
Sagar Cements Ltd 860 1137 14%
Vinati Organics Limited 100 1044 673%
SRF Ltd 891 2,109 118%
Sudarshan Chemical Industries Ltd 238 510 77%
S H Kelkar & Company Ltd 268 348 4%
Deepak Nitrite Ltd 280 360 -7%
Phillips Carbon 1272 1685 -7%
S P Apparels Ltd 400 550 -16%
Trident Ltd 85 118 -13%
Tata Communications 430 870 48%
NIIT Ltd 96 135 -1%
Zee Learn Ltd 49 80 -15%
Jamna Auto 23 270 248%
Precision Camshafts Ltd 185 169 -40%
Bharat Forge Ltd 455 807 67%
Motherson Sumi Systems Ltd 245 375 34%
Lumax Industries Ltd. 1850 2560 23%
GNA Axles Ltd 377 455 16%
Voltamp Transformers Ltd 823 1545 40%
Kirloskar Brothers Ltd 246 308 37%
KEC International Ltd 368 448 8%
Ratnamani Metals & Tubes Ltd 730 954 22%
Graphite India Ltd 110 – 465%
Maharashtra Seamless Ltd 335 596 37%
Jindal Stainless Steel (Hisar) Ltd. 205 329 -5%
Godawari Power & ISPAT Ltd. 232 395 125%

38
Disclaimer
Edelweiss Broking Limited (“EBL” or “Research Entity”) is regulated by the Securities and Exchange Board of India (“SEBI”) and is licensed to carry on the business of broking, depository services and related activities. The business of EBL and its Associates (list available on www.edelweissfin.com) are organized around five broad business groups – Credit including Housing and SME Finance,Commodities, FinancialMarkets, Asset Management and Life Insurance.Broking services offered by Edelweiss Broking Limited under SEBI Registration No.: INZ000005231; Name of the ComplianceOfficer:Mr. Brijmohan Bohra, Email ID: [email protected] Office: Edelweiss House, Off CST Road, Kalina, Mumbai - 400098; Tel. 18001023335/022-42722200/022-40094279
Disclosures under the provisions of SEBI (Research Analysts) Regulations 2014 (Regulations)Edelweiss Broking Limited ("EBL" or "Research Entity") is regulated by the Securities and Exchange Board of India ("SEBI") and is licensed to carry on the business of broking, depository services and related activities. The business of EBL and its associates are organized around five broad business groups – Credit including Housing and SME Finance, Commodities, Financial Markets, AssetManagement and Life Insurance. There were no instances of non-compliance by EBL on any matter related to the capital markets, resulting in significant andmaterial disciplinary action during the last three years. This research report has been prepared and distributed by Edelweiss Broking Limited ("Edelweiss") in the capacity of a Research Analyst as per Regulation 22(1) of SEBI (ResearchAnalysts) Regulations 2014 having SEBI RegistrationNo.INH000000172
This Report has been prepared by Edelweiss Broking Limited in the capacity of a Research Analyst having SEBI Registration No.INH000000172 and distributed as per SEBI (Research Analysts) Regulations 2014. This report does not constitute an offer or solicitation for the purchase or sale of any financial instrument or as an official confirmation of any transaction. The information containedherein is from publicly available data or other sources believed to be reliable. This report is provided for assistance only and is not intended to be and must not alone be taken as the basis for an investment decision. The user assumes the entire risk of any use made of this information. Each recipient of this report should make such investigation as it deems necessary to arrive at anindependent evaluationof an investment in the securities of companies referred to in this document (including the merits and risks involved), and should consult his own advisors to determine the merits and risks of such investment. The investment discussed or views expressed may not be suitable for all investors.
This information is strictly confidential and is being furnished to you solely for your information. This information should not be reproduced or redistributed or passed on directly or indirectly in any form to any other person or published, copied, in whole or in part, for any purpose. This report is not directed or intended for distribution to, or use by, any person or entity who is a citizen orresident of or located in any locality, state, country or other jurisdiction, where such distribution, publication, availability or use would be contrary to law, regulation or which would subject EBL and associates / group companies to any registration or licensing requirements within such jurisdiction. The distribution of this report in certain jurisdictions may be restricted by law, and persons inwhose possession this report comes, should observe, any such restrictions. The information given in this report is as of the date of this report and there can be no assurance that future results or events will be consistent with this information. This information is subject to change without any prior notice. EBL reserves the right to make modifications and alterations to this statement as maybe required from time to time. EBL or any of its associates / group companies shall not be in any way responsible for any loss or damage that may arise to any person from any inadvertent error in the information contained in this report. EBL is committed to providing independent and transparent recommendation to its clients. Neither EBL nor any of its associates, group companies,directors, employees, agents or representatives shall be liable for any damages whether direct, indirect, special or consequential including loss of revenue or lost profits that may arise from or in connection with the use of the information. Our proprietary trading and investment businesses may make investment decisions that are inconsistent with the recommendations expressed herein.Past performance is not necessarily a guide to future performance .The disclosures of interest statements incorporated in this report are provided solely to enhance the transparency and should not be treated as endorsement of the views expressed in the report. The information provided in these reports remains, unless otherwise stated, the copyright of EBL. All layout, design, originalartwork, concepts and other Intellectual Properties, remains the property and copyright of EBL and may not be used in any form or for any purpose whatsoever by any party without the express written permission of the copyright holders.
EBL shall not be liable for any delay or any other interruption which may occur in presenting the data due to any reason including network (Internet) reasons or snags in the system, break down of the system or any other equipment, server breakdown, maintenance shutdown, breakdown of communication services or inability of the EBL to present the data. In no event shall EBL be liablefor any damages, includingwithout limitationdirect or indirect, special, incidental, or consequential damages, losses or expenses arising in connectionwith the data presented by the EBL through this report.We offer our research services to clients as well as our prospects. Though this report is disseminated to all the customers simultaneously, not all customersmay receive this report at the same time.We will not treat recipients as customers by virtue of their receiving this report.
EBL and its associates, officer, directors, and employees, research analyst (including relatives) worldwide may: (a) from time to time, have long or short positions in, and buy or sell the securities thereof, of company(ies), mentioned herein or (b) be engaged in any other transaction involving such securities and earn brokerage or other compensation or act as a market maker in the financialinstruments of the subject company/company(ies) discussed herein or act as advisor or lender/borrower to such company(ies) or have other potential/material conflict of interest with respect to any recommendation and related information and opinions at the time of publication of research report or at the time of public appearance. EBL may have proprietary long/short position in theabovementioned scrip(s) and therefore should be considered as interested. The views provided herein are general in nature and do not consider risk appetite or investment objective of any particular investor; readers are requested to take independent professional advice before investing. This should not be construed as invitation or solicitation to do business with EBL.EBL or its associates may have received compensation from the subject company in the past 12 months. EBL or its associates may have managed or co-managed public offering of securities for the subject company in the past 12 months. EBL or its associates may have received compensation for investment banking or merchant banking or brokerage services from the subject company inthe past 12 months. EBL or its associates may have received any compensation for products or services other than investment banking or merchant banking or brokerage services from the subject company in the past 12 months. EBL or its associates have not received any compensation or other benefits from the Subject Company or third party in connection with the research report.Research analyst or his/her relative or EBL’s associates may have financial interest in the subject company. EBL, its associates, research analyst and his/her relativemay have other potential/material conflict of interest with respect to any recommendation and related information and opinions at the time of publicationof research report or at the time of public appearance.Participants in foreign exchange transactions may incur risks arising from several factors, including the following: ( i) exchange rates can be volatile and are subject to large fluctuations; ( ii) the value of currencies may be affected by numerous market factors, including world and national economic, political and regulatory events, events in equity and debt markets and changes in interestrates; and (iii) currenciesmay be subject to devaluation or government imposed exchange controls which could affect the value of the currency. Investors in securities such as ADRs and Currency Derivatives, whose values are affected by the currency of an underlying security, effectively assume currency risk.
Research analyst has served as an officer, director or employee of subject Company: NoEBL has financial interest in the subject companies: NoEBL’s Associates may have actual / beneficial ownership of 1% or more securities of the subject company at the end of the month immediately preceding the date of publication of research report.Research analyst or his/her relative has actual/beneficial ownership of 1% or more securities of the subject company at the end of the month immediately preceding the date of publicationof research report: NoEBL has actual/beneficial ownership of 1% or more securities of the subject company at the end of the month immediately preceding the date of publicationof research report: NoSubject companymay have been client during twelve months preceding the date of distributionof the research report.
There were no instances of non-complianceby EBL on any matter related to the capital markets, resulting in significant and material disciplinary action during the last three years.A graph of daily closing prices of the securities is also available at www.nseindia.com
Analyst Certification:The analyst for this report certifies that all of the views expressed in this report accurately reflect his or her personal views about the subject company or companies and its or their securities, and no part of his or her compensationwas, is or will be, directly or indirectly related to specific recommendations or views expressed in this report.
Additional Disclaimer for U.S. PersonsEdelweiss is not a registered broker – dealer under the U.S. Securities Exchange Act of 1934, as amended (the“1934 act”) and under applicable state laws in the United States. In addition Edelweiss is not a registered investment adviser under the U.S. Investment Advisers Act of 1940, as amended (the "Advisers Act" and together with the 1934 Act, the "Acts), and under applicable state lawsin the United States. Accordingly, in the absence of specific exemption under the Acts, any brokerage and investment services provided by Edelweiss, including the products and services described herein are not available to or intended for U.S. persons.This report does not constitute an offer or invitation to purchase or subscribe for any securities or solicitation of any investments or investment services and/or shall not be considered as an advertisement tool. "U.S. Persons" are generally defined as a natural person, residing in the United States or any entity organized or incorporated under the laws of the United States. US Citizens livingabroadmay also be deemed "US Persons" under certain rules.Transactions in securities discussed in this research report should be effected through Edelweiss Financial Services Inc.
Additional Disclaimer for U.K. PersonsThe contents of this research report have not been approved by an authorised person within the meaning of the Financial Services and Markets Act 2000 ("FSMA").In the United Kingdom, this research report is being distributed only to and is directed only at (a) persons who have professional experience in matters relating to investments falling within Article 19(5) of the FSMA (Financial Promotion) Order 2005 (the “Order”); (b) persons falling within Article 49(2)(a) to (d) of the Order (including high net worth companies and unincorporatedassociations); and (c) any other persons to whom it may otherwise lawfully be communicated (all such persons together being referred to as “relevant persons”).This research report must not be acted on or relied on by persons who are not relevant persons. Any investment or investment activity to which this research report relates is available only to relevant persons and will be engaged in only with relevant persons. Any person who is not a relevant person should not act or rely on this research report or any of its contents. This research reportmust not be distributed, published, reproduced or disclosed (in whole or in part) by recipients to any other person.
Additional Disclaimer for Canadian PersonsEdelweiss is not a registered adviser or dealer under applicable Canadian securities laws nor has it obtained an exemption from the adviser and/or dealer registration requirements under such law. Accordingly, any brokerage and investment services provided by Edelweiss, including the products and services described herein, are not available to or intended for Canadian persons.This research report and its respective contents do not constitute an offer or invitation to purchase or subscribe for any securities or solicitationof any investments or investment services.


