Lateral Distribution of Load in Composite Box Girder Bridges S. B. JOHNSTON and A. H. MATTOCK, Respectively, Former Graduate Student and Professor of Civil Engineering, University of Washington A computer program for the analysis of folded plate structures of general form was used to study the lateral distribution of load in simple span composite box girder bridges without transverse diaphragms or int e rnal stiffeners. The results were used to develop simple expressions for the loads carried by the interior and exterior girders in this type of bridge. The accuracy of the analysis was confirmed by the results of tests of a quarter-scale model of a two-lane, 80-ft span bridge supported by three box girders. •THE type of bridge under consideration consists of trapezoidal section steel girders made composite with a reinforced concrete deck slab. A typical cross section is shown in Figure 1. Diaphragms are provided only at the supports and the girders are not stiffened internally in any way. Composite action is ensured by the provision of stud type shear connectors on the top flanges of the girders. It is considered that bridges of the type described should be more efficient, econom- ical and aesthetically pleasing than steel-concrete composite bridges using I-section girders. Due to the larger torsional stiffness of the closed trapezoidal section girder as compared to an I-section girder of similar flexural strength, a greater lateral distribution of loads is achieved with this form of construction than is the case with a concrete deck slab on steel I-section girders. The bending moment for which each girder must be designed is therefore less in the box girder bridge , thus leading to economy. Further economies in fabrication and erectio n ar e achieved by the elimina- tion of stiffeners and transverse diaphragms other than at the supports. The clean external appearance of this l-ype of bridge is aesthetically very pleasing. METHOD OF ANALYSIS A box gir der bridg e of the type described may be considered as a simply supported folded plate structure, since it consists of a series of adjoining thin plates rigidly con- nected along their edges, and since the encl diaphragms effect;.vely p1·event displace- ments in their planes b1.1t offer negligible resistance normal to these planes. A computer pro gram was written for the analysis of simply supported folded plate structures of general form. The stiffness method of analysis was used allowing four degrees of freedom at each joint (1 rotational, 3 translational). The stiffness coef- ficients used were obtained from the exact solution of the folded plate problem pro- duced by Goldberg and Leve (1). The computer program is discussed in more detail elsewhere (2). - For a given load system the computer program yields the displacements and forces acting at each joint. To obtain displaceme11ts and stresses within a plate, the plate is hypothetically subdivided into a number of coplanar plates joined at their edges. The displacements and stresses at the locations of the hypothetical joints can then be ob- tained by use of the computer program. Paper sponsored by Committee on Steel Superstructures and presented at the 46th Annual Meeting . 25
Transcript
Lateral Distribution of Load in Composite Box Girder Bridges S. B. JOHNSTON and A. H. MATTOCK, Respectively, Former Graduate Student and
Professor of Civil Engineering, University of Washington
A computer program for the analysis of folded plate structures of general form was used to study the lateral distribution of load in simple span composite box girder bridges without transverse diaphragms or internal stiffeners. The results were used to develop simple expressions for the loads carried by the interior and exterior girders in this type of bridge.
The accuracy of the analysis was confirmed by the results of tests of a quarter-scale model of a two-lane, 80-ft span bridge supported by three box girders.
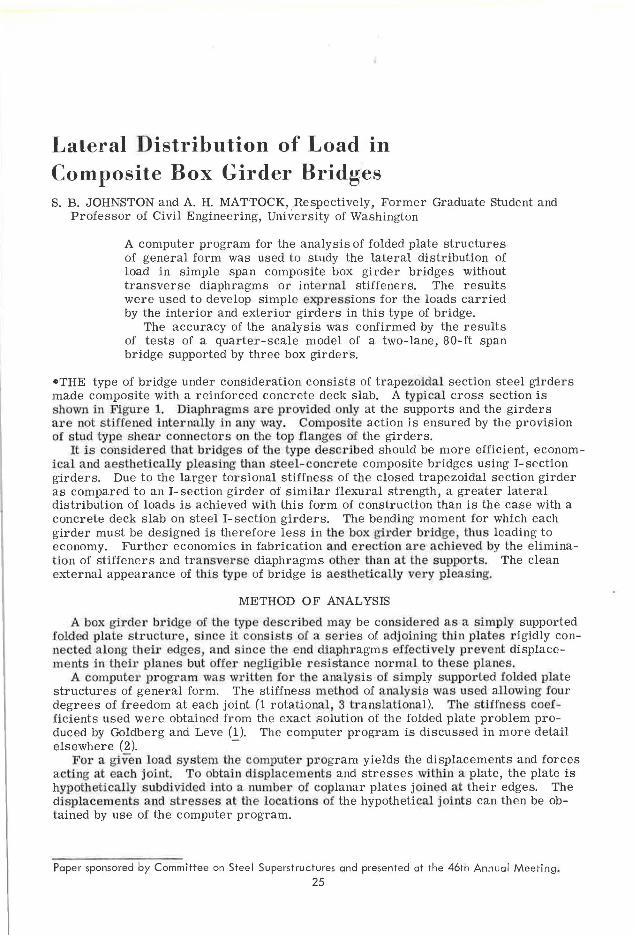
•THE type of bridge under consideration consists of trapezoidal section steel girders made composite with a reinforced concrete deck slab. A typical cross section is shown in Figure 1. Diaphragms are provided only at the supports and the girders are not stiffened internally in any way. Composite action is ensured by the provision of stud type shear connectors on the top flanges of the girders.
It is considered that bridges of the type described should be more efficient, economical and aesthetically pleasing than steel-concrete composite bridges using I-section girders. Due to the larger torsional stiffness of the closed trapezoidal section girder as compared to an I-section girder of similar flexural strength, a greater lateral distribution of loads is achieved with this form of construction than is the case with a concrete deck slab on steel I-section girders. The bending moment for which each girder must be designed is therefore less in the box girder bridge, thus leading to economy. Further economies in fabrication and erection are achieved by the elimination of stiffeners and transverse diaphragms other than at the supports. The clean external appearance of this l-ype of bridge is aesthetically very pleasing.
METHOD OF ANALYSIS
A box girder bridge of the type described may be considered as a simply supported folded plate structure, since it consists of a series of adjoining thin plates rigidly connected along their edges, and since the encl diaphragms effect;.vely p1·event displacements in their planes b1.1t offer negligible resistance normal to these planes.
A computer program was written for the analysis of simply supported folded plate structures of general form. The stiffness method of analysis was used allowing four degrees of freedom at each joint (1 rotational, 3 translational). The stiffness coefficients used were obtained from the exact solution of the folded plate problem produced by Goldberg and Leve (1). The computer program is discussed in more detail elsewhere (2). -
For a given load system the computer program yields the displacements and forces acting at each joint. To obtain displaceme11ts and stresses within a plate, the plate is hypothetically subdivided into a number of coplanar plates joined at their edges. The displacements and stresses at the locations of the hypothetical joints can then be obtained by use of the computer program.
Paper sponsored by Committee on Steel Superstructures and presented at the 46th Annual Meeting . 25
26
Figure l. Typical composite box girder bridge.
RELIABILITY OF THE ANALYSIS
The folded plate theory assumes that the materials of which the structure is made are linearly elastic and that the constituent plates are isotropic in their properties. An actual bridge structure is unlikely to satisfy these assumptions exactly, although it should come close to doing so at service load level. Of particular relevance is the behavior of the rein-forced concrete deck slab which is neither isotropic nor perfectly elastic. To provide
a check on the analysis and computer program, it was decided to build and test a onequarter scale model of an 80-ft span, two-lane highway bridge of the type under consideration. A detailed description of the fabrication and testing of this moctel is given elsewhere (~, ~).
Design of Test Bridge
Particulars of the design of the prototype bridge are as follows:
Span-80 ft Number of lanes- 2 Width of roadway-28 ft Overall width of bridge-34 ft Number of box girders-3 Design Load-HS20-44 Assumed AASHO Load Distribution Factor-S/ 6. 5 Steel in box girders-type ASTM A 36 (allowable stress 20 ksi) Deck slab reinforcement-Intermediate grade Deck slab concrete strength -f~ = 4000 psi
The use of an AASHO load distribution factor of S/6. 5 was based on judgment. It was anticipated that the lateral load distribution characteristics of this type of bridge
Figure 2. Dimensions of prototype bridge. Figure 3. Dimensions of model bridge {inches).
TABLE 1
TRUE SCALE AND ACTUAL PLATE THICKNESSES
Proto- True Dimension type Scale
(in.) (in.)
Top flange thickness 0. 500 0. 125 Web thickness 0.375 0. 096 Bottom plate thickness 0. 625 0. 156
Actually Used (in. )
0. 134 0. 100 0. 164
composite section would resist the live of the curbs, guardrails, etc.
27
would be somewhat better than those of composite bridges with I-section girders for which the AASHO load distribution factor is S/5. 5. The tests and analytical studies subsequently made showed that this was a reasonable assumption.
The design for flexure was in accordance with Section 9 of the 1961 AASHO specifications (4). It was assumed that the trapezoidal section steel girder would act alone when carrying its own weight and that of the concrete slab, and that the
load moments and those due to the weight
The design for shear was in accordance with paragraph 1. 6. 409 of the 1963 AASHO Interim Specifications (5). The webs were made the minimum thickness permitted without the use of stiffeners.
The concrete deck slab was made the thinnest possible to resist the design bending moments specified in AASHO specifications. Since the lateral distribution of loads is very dependent on the stiffness of the deck slab, use of the thinnest possible slab will yield the worst lateral distribution for a given girder size and configuration.
The cross section of the prototype bridge is shown in Figure 2. As far as possible the model was made a true quarter-scale model of the prototype bridge. The only deviafions were in the thicknesses of the steel plate used in the fabrication of the trapezoidal girders. The deviations arose because of the necessity of using available standard thicknesses of steel sheet metal. They are as shown in Table 1.
The dimensions of the test model are shown in Figure 3. The actual dimensions of the model were used when calculating its behavior using the computer program.
The deck slab was of reinforced mortar to simulate the reinforced concrete of the prototype. The ba1· sizes and spacing were reproduced exactly to scale. At the time of test the mortar had a compressive strength ol 3340 psi, somewhat less than the 4000-psi concrete strength assumed in the prototype design.
Comparison of Calculated and Actual Behavior
Two types of test were carried out on the model bridge, influence line tests and truck loading tests.
D LJ
Figure 4. Influence lines for average strain in bottom plate of girders I and 2 of the model bridge.
LJ
3
Figure 5. Influence lines for girder deflection in model bridge.
28
Influence Line Tests-In these tests a concentrated load was placed at nine successive locations across lhe width of the bridge at midspan. For each location of the load, the deflections of the girders and the strains in the bottom plates of the girders were measured. It was thus possible to construct experimentally transverse influence lines for deflection of each girder and for average strain in the bottom of each girder. This last may be regarded as a measure of the bending moment carried by each girder.
The experimental influence line ordinates are plotted in Figures 4 and 5 together with the influence lines calculated using the folded plate £omputer program. The agreement is seen to be good, the actual behavior of the model being slightly better than the calculated behavior. The calculated influence liJ1es are based on the first three terms of the Fourier series representing a concentrated load.
Truck Loading Tests-In these tests six concentrated loads were applied to the bridge deck simultaneously. The distribution and relative mag·nitudes of these loads simulated to one-quarter scale the wheel loads of the HS20-44 AASHO standard design truck load. The loads were applied by placing a block of concrete on top of an articulated steel frame resting on the bridge deck as shown in Figure 6. Measurements were made at midspan of girder deflection and strain in the girder bottom plates.
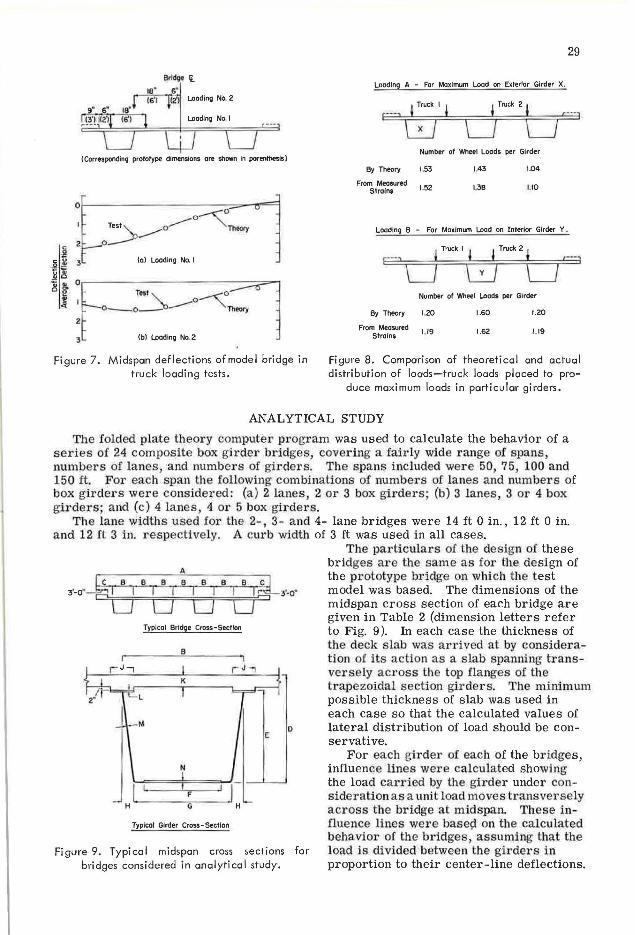
The loads were applied in both lanes of the bridge, in the extreme lateral positions as considered in design that the truck can occupy. In Figure 7a the measured deflec tions are 1.:umµared with the calculated deflections for th truck loading placed as r.loi:rn to the curb as is required by AASHO specifications. Similarly, in Figure 7b' the deflections are plotted for the case of the truck loading placed as close to the center line of the bridge as required by AASHO specifications. The agreement between measured and calculated behavior is seen to be close in both cases, with the bridge once again behaving a little better than was calculated.
By superposing the results obtained in these tests it was possible to obtain the distribution of wheel loads between the three supporting box girders when two standard trucks are placed on the bridge, (a) so as to produce maximum moment in an exterior
Figure 6. Truck loading test of model bridge.
girder, and (b) so as to produce maximum moment in the interior girder. The experimentally determined distributions of load are compared in Figure 8 with the distributions of load obtained from the calculated deflection influence lines, it being assumed that the total load is distributed between the three girders in proportion to their midspan deflections. It can be seen that the calculated transverse distribution of loads is in close agreement with the measured distribution, and in particular that the calculated maximum loads carried both by an exterior girder and by an interior girder are in very close agreement with the measured maximum loads.
The measured maximum loads carried by an exlerior girder and by the interior girder are respectively equivalent to AASHO load distribution factors of S/6. 91 and S/6. 48. This result justifies the prior assumption of a load distribution factor of S/ 6. 5 in the design of the prototype bridge.
The close agreement between the observed behavior of the model bridge and the behavior predicted by the folded plate theory computer program indicates that the program is reliable and can reasonably be used to predict the behavior of other bridges of this type.
( CorrespondinQ prototype dimensions ore shown in parenthesis)
(al Looding No. I
2
3 (b) Loodlng No. 2
Figure 7. Midspan deflections of model bridge in truck loading tests.
29
Loading A - For Maximum Load on Exterior Girder X.
r--i {jj I I d Truck 2 b , ___ 1
Number of Wheel Loads per Girder
By Theory 1.53 1.43 1.04
From5t~a~:Ured 1.52 1.38 1.10
Loading 8 - For Maximum Load on Interior Girder Y .
Number of Wheel Loads per Girder
By Theory 1.20
From Measured Strains 1.19
1.60 1.20
1.62 1.19
Figure 8. Comparison of theoretical and actual distribution of loads-truck loads placed to pro
duce maximum loads in particular girders.
ANALYTICAL STUDY
The .folded plate theor y computer progr am was used to calculate the behavior of a seri es of 24 composite box girder br idges, covering a fairly wide range of spans, numbers of lanes, and number s of girders. The spa ns included wer e 50, 75, 100 a nd 150 I t. For each span the following combinations of numbers of lanes and number s of box girder s wer e conside r ed: (a ) 2 lanes, 2 or 3 box girders; (b) 3 lanes, 3 or 4 box girder s; and (c ) 4 lanes, 4 or 5 box girder s.
The lane widths used for the 2- , 3- and 4- lane bridges were 14 ft 0 in., 12 ft 0 in. and 12 ft 3 in. respectively. A curb width of 3 ft was used in all cases.
A
3'-0"~ I B I B I B I B I B I = LJ D D
8 I
8 1..CL 3·-o• o= Typical Bridge Cross-Section
8
K
L
D E
N
F
H
Typical Girder Cross-Section
Figure 9. Typical midspan cross sections for bridges considered in analytical study.
The par ticular s of the design of these bridges are the same a s for the design of the prototype br idge on which the test model was based. The dimensions of the midspan cross section of each bridge are given in Table 2 (dimension letters refer to Fig. 9 ). In each case the thickness of the deck slab was arrived at by consider ation of i ts action as a slab spanning transver sely acr oss the top fla nges of the trapezoidal section girders. The minimum possible thickness of slab was used in each case so that the calculated values of lateral distribution of load should be conservative.
For each girder of each of the bridges, influence lines wer e calculated showing the load carried by the girder under consider ation as a unit load moves transversely acros s the bridge at midspan. These influence lines wer e base9 on the calculated beha vior of the bridges, assumi ng that the load is divided between the gir ders in proportion to their center-line deflections.
30
TABLE 2
DIMENSION SUMMARY FOR BRIDGES CONSIDERED IN ANALYTICAL STUDY
Bridge Span No. of No. of Dimension (See Fig. 9)3-
No. (ft) Lanes Girders A B c D E F G H J K L M N
50-1 50 2 2 34 ft 0 in. 96 60 29 20 76 88 4 12 7 % % % 50-2 50 2 3 34 ft 0 in. 63 46'/, 28 20 43 55 4 12 6 t,2 l" {'.2 50-3 50 3 3 44 ft 6 in. !Hi b2 2a'/. 2ll 00 70 4 12 6'1 /1b Y. y, /4
50-4 50 3 4 44 ft 6 in. 63 46Y, 28 20 43 55 4 12 6 '12 % y, 50-5 50 4 4 55 ft 0 in. 80 50 28 % 20 60 72 4 12 6% l' % '12 50-6 50 4 5 55ft0in. 63 46'/2 28 20 43 55 4 12 6 1'2 % % '15-1 75 2 2 34 ft 0 in. ()6 60 44 35 72 84 6 13 7 "f, 7/1e % 75-2 75 2 3 34 ft 0 in. 63 46'/, 43 35 39 51 6 12 6 '!, % % 75-3 75 3 3 44 ft 6 in. 86 52 433/. 35 62 74 6 13 6'/. "!. % % 75-4 75 3 4 44 ft 6 in. 63 46'/2 43 35 39 51 6 12 6 % 'la % 75-5 75 4 4 55 ft 0 in. 80 50 43% 35 56 68 6 12 61, '1· % % 75-6 75 4 5 55 ft 0 in. 63 46'/2 43 35 39 51 6 12 6 y, 'la %
100-1 100 2 2 34 ft 0 in. 96 60 58 49 72 84 6 14 7 1 y, % 100-2 100 2 3 34 ft 0 in. 63 46Y, 57 49 39 51 6 12 6 "/. 1'1e "/. 100-3 100 3 3 44 ft 6 in. 86 52 57o/. 49 62 74 6 13 6"/. 1 7/10 "!. 100-4 100 3 4 44 ft 6 in. 63 461/2 57 49 39 51 6 12 6 "!. 'lie % 100-5 100 4 4 55 ft 0 In. 80 GO u7'/a 49 56 68 6 12 6'/, 1 ~/" % 100-6 100 4 5 55 ft 0 in. 63 46'/a 57 49 39 51 6 12 6 "/. /'i. "/. 150-1 150 2 2 34 ft 0 in. 96 60 85 76 72 84 6 14 7 l '/2 % 150-2 150 2 3 34 ft 0 in. 63 46'/2 84 76 41 51 6 13 6 1 'la 150- 3 150 3 3 44 ft 6 in. 86 52 84"/. 76 58 70 8 13 6"/. l '/2 %. 150-4 150 3 4 44 ft 6 in. 63 46'/2 84 76 41 51 6 13 6 1 'la 150-5 150 4 4 55 ft 0 in. 80 50 84'/a 76 52 64 8 12 6'/. l'/2 'Y .. 150-6 150 4 5 55 ft 0 in. 63 46'/, 84 76 41 51 6 13 6 1 y,
0Dimensions are given in inches except for A, the overall width of the bridge.
It is thought that this procedure is justified by the agreement between the measured distribution of loads in the model bridge and the distribution of loads calcu~ated using this assumption (Fig. 8 ). A typical set of influence lines is shown in Figure 10.
The maximum load carried by each girder of each bridge was calculated using the influence lines, the worst possible combinations of truck locations on the bridge deck being considered in each case. The maximum loads carried by each girder were ex-
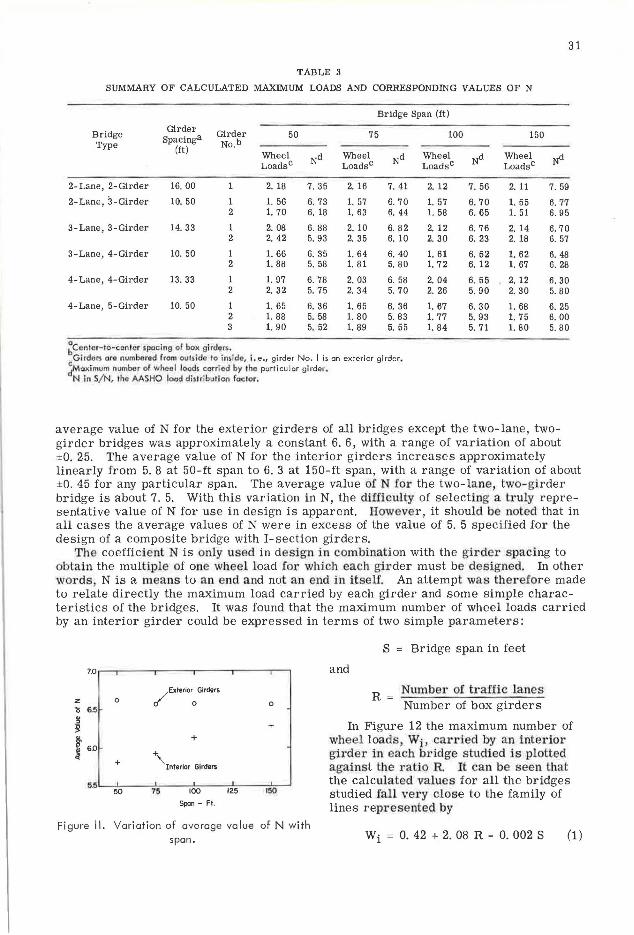
pressed in terms of multiples of one "wheel load" of the AASHO standard truck and are summarized in Table 3, along with the values of N (in S/N, the AASHO load distribution factor) which correspond to the number of wheel loads carried by the girder and the center-to-center spacing o·f the box girders. No reduction in intensity of loads for simultaneous loading of more than two lanes was inc:luded in the calculation of the values shown in Table 3.
It can be seen in Table 3 that the values of N vary considerably both with span and type of bridge. An attempt was first made to correlate the values of N with span and some parameter related to the type oi bridge, but this was not successful. The general trend of variation of N with span can readily be seen in Figure 11, where the average values of N are plotted for all except the two girder bridges. The
31
TABLE 3
SUMMARY OF CALCULATED MAXIMUM LOADS AND CORRESPONDING VALUES OF N
~Center-10-conter spacing of bo>< girc!ors. Girdnn. ore nurnbercd from out5ide to jnsldo, i.e., girder No. I is an exterior girder. ~aximum number or wheel loods carried by tho particular girder.
N In S/ N, tho AASHO load dislribution factor.
average value of N for the exterior girders of all bridges except the two-lane, twogirder bridges was approximately a constant 6. 6, with a range of variation of about ±0. 25. The average value of N for the interior girders increases approximately linearly from 5. 8 at 50-ft span to 6. 3 at 150-ft span, with a range of variation of about ±0. 45 for any particular span. The average value of N for the two-lane, two-girder bridge is about 7. 5. With this variation in N, the difficulty of selecting a truly representative value of N for use in design is apparent. However, it should be noted that in all cases the average values of N were in excess of the value of 5. 5 specified for the design of a composite bridge with I-section girders.
The coefficient N is only used in design in combination with the girder spacing to obtain the multiple of one wheel load for which each girder must be designed. In other words N is a means to an end and not an end in itself. An attempt was therefore made to relate directly the maximum load carried by each girder and some simple characteristics of the bridges. It was found that the maximum number of wheel loads carried by an interior girder could be expressed in terms of two simple parameters:
7.0
z 0 /Exterior
0
Girders
0 6.5
~ :!l
f 6.0 +
"' + +'\ Interior Girder$
5.5 50 75 100 125
Span - Ft.
Figure II. Variation of average value span.
0
+
150
of N with
and
S = Bridge span in feet
R = Number of traffic lanes Number of box girders
In Figure 12 the maximum number of wheel loads Wi, carried by an interior girder in each bridge studied is plotted against the ratio R It can be seen that the calculated values for all the bridges studied fall very close to the family of lines represented by
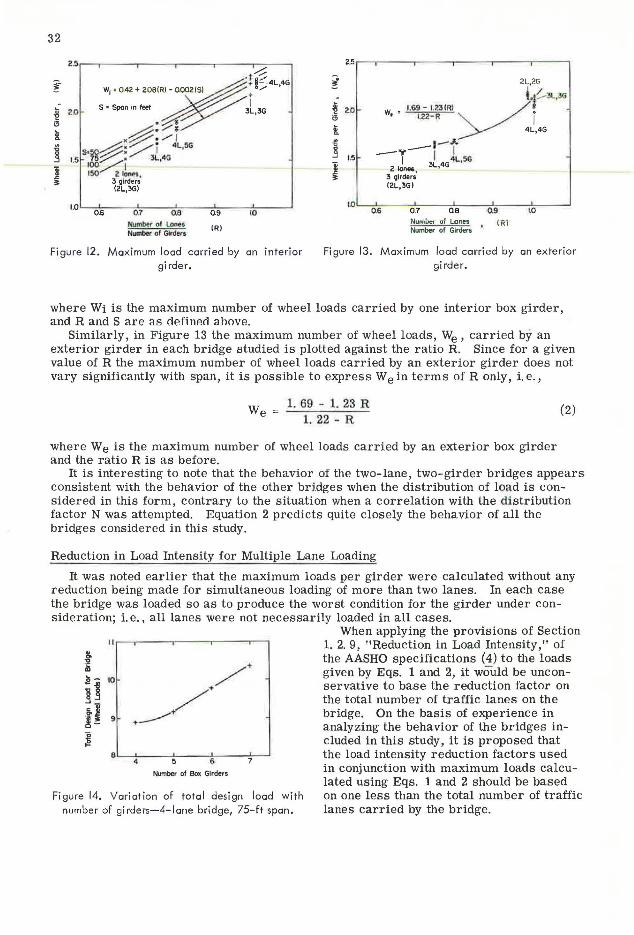
Wi = 0. 42 + 2. 08 R - 0. 002 S (1)
32
2~.---r----.----.----.-------,.----,
S • Span in feet
. ' ..---%· /'; .~ ......... , .. ~· :/':i 4L,5G
~ 15 s-rg~: 3L,4G . 100,........- _ _ 1
j 150 z lonu, ;t 3 Qirders
l2L,3G)
~ •! 8:0:.4L 4G g,..... '
1.o--0.~6--~07---0~ll---0-.9--~LO~-~
Number ol U!nef Number or Glrders
(R)
Figure 12. Maximum load carried by an interior girder.
Figure 13. Maximum load carried by an exterior girder.
where Wi is the maximum number of wheel loads carried by one interior box girder, and Rand S are as definP.cl a.hove.
Similarly, in Figure 13 the maximum number of wheel loads, We, carried by an exterior girder in each bridge studied is plotted against the ratio R. Since for a given value of R the maximum number of wheel loads carried by an exterior girder does not vary significantly with span, it is possible to express We in terms of R only, i.e.,
W _ 1. 69 - 1. 23 R e - 1. 22 - R
(2)
where We is the maximum number of wheel loads carried by an exterior box girder and the ratio R is as before.
It is interesting to note that the behavior of the two-lane , two-girder bridges appears consistent with the behavior of the other brtdges when the distribution of load is considered in this form, contrary to the situation when a correlation with the di stribution factor N was attempted. Equation 2 predicts quite closely the behavior of all the bridges considered in this study.
Reduction in Load Intensity for Multiple Lane Loading
It was noted earlier that the maximum loads per girder were calculated without any reduction being made for simultaneous loading of more than two lanes. In each case the bridge was loaded so as to produce the worst condition for the girder under consideration; i.e., all lanes were not necessarily loaded in all cases.
1 1 ~-r----.----.----.--,
Number of Box GlrdefS
Figure 14. Variation of total design load with number of girders- 4- lane bridge, 75-ft span.
When applying the provisions of Section 1. 2. 9, "Reduction in Load Intensity," of the AASHO specifications (4) to the loads given by Eqs. 1 and 2, it would be unconservative to base the reduction factor on the total number of traffic lanes on the bridge. On the basis of experience in analyzing the behavior of the bridges included in this study, it is proposed that the load intensity reduction factors used in conjunction with maximum loads calculated using Eqs. 1 and 2 should be based on one less than the total number of traffic lanes carried by the bridge.
33
Optimum Number of Girders
Using the equations proposed, the total number of wheel loads for which a bridge must be designed was calculated for a number of bridges with various combinations of numbers of lanes of traffic, numbers of box gi.rders and lengtl1s of span. For a bridge carrying a given number of lanes of traffic over a given span, in every case the total number of wheel loads for which the bridge must be designed was a minimum when one box girder was provided for each lane of traffic.
An example of the variation of total load-carrying capacity required with inc1·easing number of box girders is shown in Figure 14. It appears therefore that the most economical arrangement of girders for this type of bridge is one box girder for each lane of traffic.
CONCLUSIONS
Agreement between the observed and calculated behavior of a one-quarter scale model of an 80-ft span composite steel-concrete box girder bridge without transverse diaphragms or internal stiffeners confirmed the applicability of folded plate theory to bridges of this type.
A study was made of the behavior of 24 composite box girder bridges using a computer program based on folded plate theory. As a result of the study, Eqs. 1 and 2 are proposed for the maximum number of wheel loads carried by the box girders in this type of bridge. Load intensity factors used in conjunction with maximum loads calculated using the given equations should be based on one less than the total number of traffic lanes carried by the bridge.
The study also indicated that the most economical arrangement of girders in this type of bridge was one box girder for each line of traffic.
ACKNOWLEDGMENTS
This investigation was carried out in the Structural Research Laboratory of the Department of Civil Engineering, University of Washington. Contributions were made by several members of the laboratory staff, to whom thanks is given.
The study was sponsored PY th United States Stee l Corporation.
REFERENCES
1. Goldberg, J . .. E., and Leve, H. L. Theory of Prismatic Folded Plate Structures. Internat. Assoc. for Bridge and Structural Eng., Publications, Vol. 16, 1957, pp. 59-86.
2. Johnston, S. B., and Mattock, A. H. An Experimental and Analytical Study of the Lateral Distribution of Load in Composite Box Girder Bridges. Final Report to United States Steel Corp., 1967.
3. · Johnston, S. B., and Mattock , A. H. An Analytical and Model Study of Composite Box Girder Bridges. To be presented at ASCE Structural Conf., Seattle, May 1967.
4. American Association of State Highway Officials. Standard Specifications for Highway Bl'idges. Eighth Edition, 1961.
5. American Association of State Highway Officials. Interim Specifications, 1963. Developed by AASHO Committee on Bridges and Structures.