25
Damir Novosel Quanta Technology President March 2020 Key Success Factors for Green, Resilient, and Affordable Electrical Energy Delivery PEAC Power & Energy Automation Conference

Confidential & Proprietary | Copyright © 2019 Slide 1
Damir NovoselQuanta Technology President
March 2020
Key Success Factors for Green, Resilient, and Affordable Electrical Energy Delivery
PEAC Power & Energy Automation Conference

Confidential & Proprietary | Copyright © 2019 Slide 2
If Edison and Tesla came back… 2

Confidential & Proprietary | Copyright © 2019 Slide 3
Society Targets and Solutions
Germany 2020 2030 2050
Greenhouse gas reduction (1990) 40% 55% 80%
Renewable energy share 18% 30% 60%
Energy efficiency increase (2008) 20% 50%
TARGETS
Decarbonization Reliability and Resilience Affordable Electricity Prices
California Senate Bill 100 50% renewable energy by 2026, 60% by 2030 100% renewable and zero-carbon resources by 2045
New York Clean Energy Standard Reduce greenhouse gas 85% by 2050 70% renewables by 2030 and 100% carbon-free by 2040 Energy storage: 1.5GW 2025, 3GW 2030 Doubling energy efficiency by 2025
Electrification Transportation: Light-, Medium-, Heavy-Duty, Buses Buildings: Residential & Commercial Industrial and Agriculture
Energy/Fuel Transformation Renewable generation (solar, wind, etc.) Electrical Storage
Energy Efficiency
1891: First successful electric car 1904: ~1/3 cars were electrical
SOLUTIONS
US: ~10 ¢/kWhCA: ~15 ¢/kWhEU: ~27 ¢/kWh

Confidential & Proprietary | Copyright © 2019 Slide 4
Amazon, UPS, FedEx, PepsiCo have alternative
vehicle programs Total system load is OK, but
impact at the charging point needs to be managed
30 UPS Trucks charging at 500 kW = 15 MW
A big driver is cities aiming for zero emission zones
Source: US EIA
Source: NREL
Decarbonization though Electrification
Transportation drives growth –leading to 2% CAGR
Electrification leads to significant emission reductions for cities

Confidential & Proprietary | Copyright © 2019 Slide 5
Peak load growth even with managed charging (e.g., transformer overloading)
Understanding impact of increased loading on entire load profile – accelerate re-rating and replacement
Load increase due to the evolution of the charging station from Level II to Fast Chargers -e.g. spike with metro bus charging (projected between 7-20 MW)
Building sector heat pump conversion results in increased winter load
Mapping Charging Facilities Locations to Substations – Localizing Impact
Electrification Impact
Key for de-carbonization is electrification, which requires investments in a robust, hybrid grid

Confidential & Proprietary | Copyright © 2019 Slide 6
Getting the Grid Modernization Priorities Right
Resilience and Asset Management• Aging Infrastructure• Reliability and Security (Cyber & Physical)• Hardening for weather events/climate change• Gas and electrical interdependency
Distributed Energy Resources, Microgrids, Energy Storage
Smarter Grid• Energy Efficiency/Demand Response (DR)• Electrification, Smart Cities and Villages• Data Analytics, Grid Visibility, etc.
Balanced and mixed resource portfolio to achieve reliability and economic targets
Balanced Investment Strategy
Value of the Grid Increase penetration of renewables Increased Electrification Improve Resilience Market Access for DER/Lower Market Prices Transactive Energy/Customer Choice
New York City July 13, 2019
Value of DER and Storage Values recognized (e.g. non-wire alternatives) Formalized or mandated for examination in
some jurisdictions
Appropriately compare DER/Storage benefits and costs with Grid benefits and costs

Confidential & Proprietary | Copyright © 2019 Slide 7
New Investments and Technologies Affecting Grid Performance
Investment alternatives and operating practices (e.g. non-wire alternatives) to defer or avoid traditional T&D projects (e.g. installing new wires and transformers)
Distributed Energy Resources, Storage, Flexible AC and DC
Systems, Dynamic ratings
Energy efficiency, demand response, and generation
efficiency
Values need to be accurately determined
depending on time, location, and size
Planning and operational tools should incorporate deployed resources and
technologies
Having subsidized asset provide market services has to be evaluated based on regional differences

Confidential & Proprietary | Copyright © 2019 Slide 8
New Investments and Technologies Affecting Grid Performance
Generation Bucket – Market products (frequency regulation, reserve, voltage mgmt., restoration)
T&D Bucket – Asset deferral, reliability, DER integration, congestion mgmt., power quality
Consumer Bucket – PV Integration, backup, resilience
Supply & Demand Bucket – Buffering variable “inventory” to achieve balance across different times and locations
Transportation Bucket - Charging infrastructure of Busses, Trains, Cars/Trucks
Stacking benefits to achieve a better business case
Storage is a New Asset Class
Regulation and proper market design are key factors to monetization of all possible benefits
N-1 Congestion Relief Example

Confidential & Proprietary | Copyright © 2019 Slide 9
Wire vs./& Non-Wire Technology Selection
The system-wide methodology relies on a combination of:• Load and DER forecasting analysis
• Detailed engineering analysis of the conventional and storage benefits (e.g. reliability indices) via time-series power flow, 8760 hours/year simulations
• Storage sizing and location: Repeatable and scalable models and control algorithms for the combined applications and 10-year, stochastic cost projections for selected technologies, e.g. Lithium-ion and Vanadium Redox
• Detailed costs-benefit analysis for conventional, storage, and hybrid applications
Select solution based on high confidence financial analysis
Time-series Power Flow Simulations
Cost Forecast Model
Cost-Benefit Analysis
Load and DER Forecasting

Confidential & Proprietary | Copyright © 2019 Slide 10
Non-Wire Alternatives: Transmission Example
Alternative Alternative Name1 Original Solution: Substation2 Wire alternative: Tie to a neighbor3 Hybrid Solution: Energy Storage plus transmission line4 Energy Storage Solution: Phased approach5 …
Potential wire and non-wire alternatives to comply with Capacity, Reliability, and Flexibility objectives and align with Commission comments
Reliability Indices Expected Energy Not Served Maximum Interrupted Power Load Bank level SAID/SAIFI Losses
Flexibility Indices Availability of Flexibility - Additional margin (MW)
for maintenance, operations, and emergency events Period of Deficit - Periods when the available
generation resources are less than required Restoration Time

Confidential & Proprietary | Copyright © 2019 Slide 11
Non-Wire Alternatives: Distribution Example
Motivation Voltage, flicker, and back feed issues arising from
projected installation of large PV facilities in two 13.2-kV circuits
Underground network
Planning Considerations Congestion usually occurs after N-1 contingency Reliability of radial distribution feeders are
deteriorating (running ~ full capacity in recent years) Siting and sizing energy storage DER portfolio (Storage + PV + DR)
Potential wire and non-wire alternatives to address High PV Accommodation and Reliability Enhancement and align with Commission comments
Four 2MW PV systems interconnected to radial feeder Construction of new circuit (~7 miles) along with
switch gear, breaker and relaying NWA: Distributed BESS (2 MW, 6MW, 2 MW – 4 hours) Considering BESS value stacking, NWA is a favorable
economic solution
Siting and Sizing of Storage to
Accommodate High PV

Confidential & Proprietary | Copyright © 2019 Slide 12
Operational Aspects – “Duck” Curves
Demand Curve, Winter 2019, CENACE Mexico
…reduce ramping impacts and balancing costs
Source: California ISO
Source: VELCO
Source: CENACE
Managing growth of new renewables – Need for Upgrading the grid
Little visibility of operators to monitor distributed generation levels
Controlling voltage to customers Loss of large amounts of renewables Weather forecasting/climate change

Confidential & Proprietary | Copyright © 2019 Slide 13
Renewables Integration Challenges and Solutions
T&D planning & operations require accurate modeling
Monitoring & control of smart inverters to mitigate impact and enhance the DER benefits => Grid Management System
Increased visibility needs –Synchronized Measurements
Low fault currents & dynamic system changes requiring adaptive protection
Inverter Based Resources (IBR) Less Inertia Things Happen Faster! + Low Fault Currents
Southern California Solar Resource Loss, Aug. 2016 Frequency Decay for Loss of 1,000 MW
Source: IEEE/NERC report on Impact of Inverter Based Generation on Bulk Power System Dynamics and Short-Circuit Performance
• Address inverter ride-through settings and calculations of voltages and frequency
• Re-evaluate NERC PRC-024-2 –inverters should not trip instantaneously
• Inverter-Based Resources can provide reserve margins if recognized in the marketplace
• IEEE Std. 1547-2018 defines reliability services, e.g. frequency response, ramping and voltage support

Confidential & Proprietary | Copyright © 2019 Slide 14
DER Aggregation & Control Platform (DERMS)
Hybrid Architecture:
E-DERMS: Enterprise DERMS (DERMS at control center)
R-DERMS: Regional Aggregation, Monitoring, and DER Optimizer
L-DERMS: Local Resource Aggregator and Monitoring
Primary DERs with site controllers
Embedded controls in Grid-Edge device
E-DERMS
R-DERMS
L-DERMS (distributed)
PV, EV, ESS
Plant Controller
Centralized DER
R-DERMS
Site Controller
PV, EV, ESS
Grid-Edge Device
PV, EV, ESSMicrogrid Controllers
DMS/SCADA or Enterprise Bus

Confidential & Proprietary | Copyright © 2019 Slide 15
DERMS and Site Controller Objectives

Confidential & Proprietary | Copyright © 2019 Slide 16
Field Area Communications for DER Monitoring & Controls
PV
PV
PV
PV
Inverter
Inverter
Inverter
Inverter
Network
Aggregator
HMI
Datalogger
Remote Access
DNPModbus
TCP Utility InterfaceController
Protocol Translator, Data Aggregator,
Local Control, Etc.
Define “monitoring & control” NODEs
Define Communication Architecture
Implement “Aggregators” and deploy “site Controllers”
Integrate to DMS/SCADA

Confidential & Proprietary | Copyright © 2019 Slide 17
Example: Bronzeville Microgrid One of the 6 microgrids to be build and operated by ComEd Located adjacent to IIT Campus microgrid to form Cluster Microgrid 7 MW load, mix generation: PV = ~1 MW, ESS = 500 kW/2 MWh,
CHP + Diesel + Fuel cell= 7 MW) Selected as one of the DOE funded projects for microgrid controller
design and testing Using loop scheme with supply from two substations and
automated fault detecting, clearing and fast restoration Two separate islands or connected together
2×2MW
POI1B1
B4
POI2Tie
IIT Microgrid
5 MW
POI4
POI3
4.16/12.5 kV
CO
BES
GS
FC
DLI
PD
RC
CC
MA
GL
BC
B6B5
Roof-top PV
Automated switches
ComEd Microgrid
B2
B3
Vista Switch
FC Fuel cell
BESS Site
Dearborn Homes PV Site
Microgrid Footprint
Extended System
Boundary
Source: ComEd
Aggregating 17 roof-top PV Systems as part of Microgrid

Confidential & Proprietary | Copyright © 2019 Slide 18
Definition of resiliencyThe ability to withstand and reduce the magnitude and/or duration of disruptive events, which includes the capability to anticipate, absorb, adapt to, and/or rapidly recover from such event
Ensuring resiliency requires• Determine which risks (events) to
the grid to protect against• Identify the steps, if any, needed to
ensure those risks are addressed
Examples of high-impact, low frequency disruptive events• Fuel supply interruptions• Extreme weather events• HEMP attack/GMD
FERC’s 2018 Resiliency Order Resiliency evaluation methods and metrics are key areas of research, however, there is
no widely accepted industry standard yet
Source: https://energy.gov/sites/prod/files/2015/09/f26/EnergyResilie
nceReport_(Final)_SAND2015-18019.pdf
Resilience Definitions

Confidential & Proprietary | Copyright © 2019 Slide 19
Resilience Targets Fast changing environment requires
continuous and adaptive response to various risks/events (e.g. cyber risks, DER integration)
Important not to lose sights of priorities to invest time and funds (fire risk vs. HEMP risk)
Metrics and Industry Standards• System dependent (e.g. hurricane vs. snow-
storm risks)• Measure base and future states to define
metrics - data analytics• Resilient system is more reliable – Is there a
need to update reliability standards? Focus on Solutions to improve current state:
• DER, storage, microgrids• Advanced monitoring, control, and
protection• Tools, processes, and training• Etc.
Cyber Security NERC CIP 002-011 and CIP 013 (Supply Chain, July ‘20)
Physical Vulnerability NERC CIP 014 - Physical Security Substation and System - Critical substations
Geomagnetic Disturbance (GMD)High-altitude Electromagnetic Pulse (HEMP)
Prevention – Detection – Mitigation - Recovery
Physical Security Cyber SecuritySource: NERC
Resilience Issues and Targets

Confidential & Proprietary | Copyright © 2019 Slide 20
Annual Protection System Misoperation Rate Q4 2013 - Q3 2018
Source:NERC
Protection Misoperationsby Cause Code
(4Q 2013 - 3Q 2018)
Increasing Complexity of Protection and Control Systems
Resilience Metrics and Solutions
ExtractsUni-
directional Link to
Operating Centers
Fixed Asset Data (existing & investments)
Customer Connections & Asset loading
Employee Data
Bi-directional interface
Planned Outages
Event Logs, Line Peaks
Protection & Control Device Data
Work Order Management
Manual InputData Entry Applications
Common Information Model
Nodal Network Model
Power Flow Model
Short Circuit Model
Uni-directional Link from
Reports & Custom Views
Internal Web Applications
Performance Management
Schematic & Drawing Repository
Custom Views
ISO Reports
Communication Platform
Compliance Audits
Remote Field Access
Achieve Single Source of Data and eliminate redundant manual
entry/calculations
Automation of NERC PRC/CIP compliance and reporting Give fast, clear information and decision guidance to engineers Assess mis-operations and correct relay margins Improve life cycle asset
replacement strategy: report failed or malfunctioning apparatus, relays, etc.
Process IEC 61850 data continuously and after fault or event
Automated and accurate fault location
Solutions through Automation
Confidential & Proprietary | Copyright © 2019 Slide 21
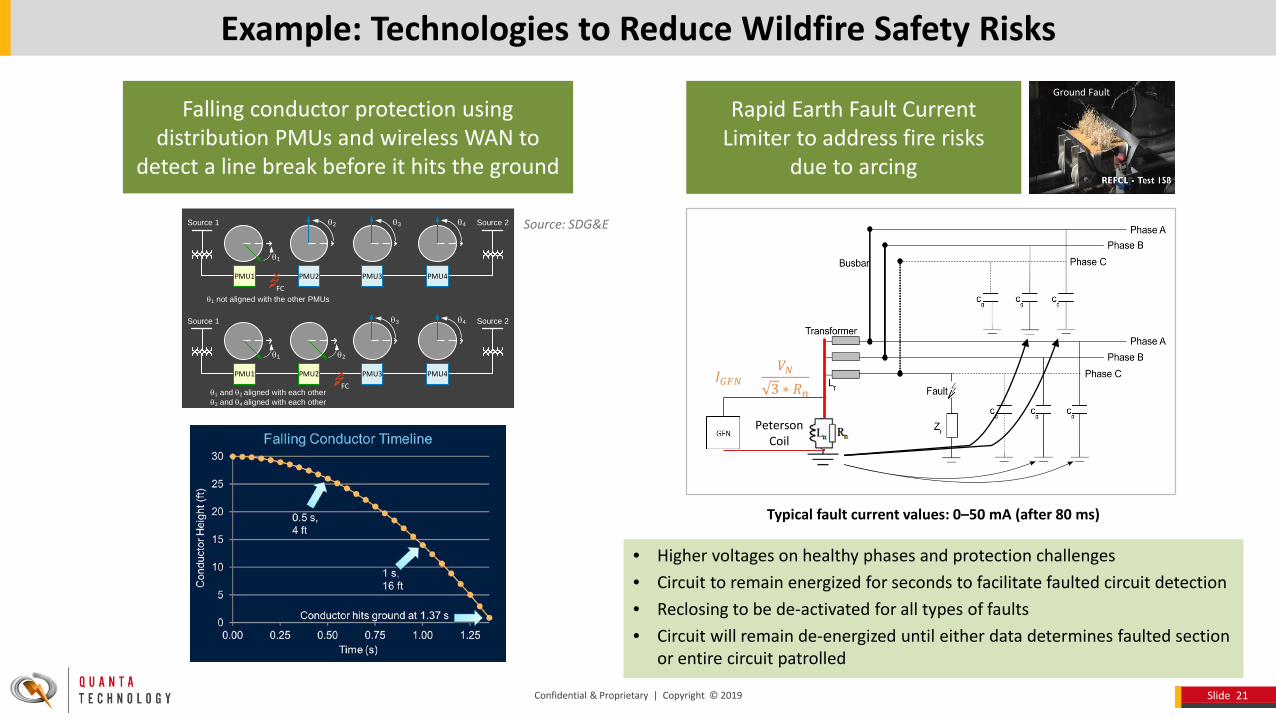
Example: Technologies to Reduce Wildfire Safety Risks
Falling conductor protection using distribution PMUs and wireless WAN to
detect a line break before it hits the ground
PMU1 PMU2 PMU3 PMU4
θ2 θ3 θ4
θ1
PMU1 PMU2 PMU3 PMU4
θ3 θ4
θ1 θ2
FC
θ1 not aligned with the other PMUs
θ1 and θ2 aligned with each otherθ3 and θ4 aligned with each other
Source 1 Source 2
Source 1 Source 2
FC
Source: SDG&E
Rapid Earth Fault Current Limiter to address fire risks
due to arcing
Peterson Coil
𝐼𝐼𝐺𝐺𝐺𝐺𝐺𝐺 =𝑉𝑉𝐺𝐺
3 ∗ 𝑅𝑅𝑛𝑛
Typical fault current values: 0–50 mA (after 80 ms)
• Higher voltages on healthy phases and protection challenges• Circuit to remain energized for seconds to facilitate faulted circuit detection• Reclosing to be de-activated for all types of faults• Circuit will remain de-energized until either data determines faulted section
or entire circuit patrolled
Ground Fault

Confidential & Proprietary | Copyright © 2019 Slide 22
Example: Automated Fault Location System
Traveling-wave
calculation
Impedance -based
calculation
Traveling- wave records
COMTRADE & relay data files
Expert System
Rule-based synthesis of fault location
Control Centerfault
location report with tower map
GIS lightning
database
Faulted-circuit
indicator(FCI) results
SCADA/ EMS/DMS
status report
Traveling wave locations
Relay fault report files
GIS towerdatabase
Power system & line data
Automatic Fault Data Retrieval
Automatic Fault
Location Reporting &
Archiving
Automatic Fault
Notification
Automatic Fault Location Calculation
Aspen OneLiner
Fault Simulations
Quick and Automatic With map location identifying
the most probable tower and error estimate
With best accuracy
ReactanceRE-XE-compensationIo compensationTakagiNovosel

Confidential & Proprietary | Copyright © 2019 Slide 23
Climate Change and Asset Risk Management
Quantifying this Risk
Higher Ambient = Less Cooling
Higher Loading for More Hours
= Higher Internal Temperatures
Higher Internal Temperatures
= Faster Insulation Degradation, More
Annealing, Etc. Higher Ambient = Greater Cooling
Loads
Higher Humidity = Higher
Nighttime Temps= Higher Off Peak
Loads
Elevated and Flatter Load Profiles
More Faster Degradation= Loss of Life Expectancy
= Higher Failure Rates=More/Faster Replacement
2-4 degree C increase will increase peak electrical load by 5% and the overall loading - Loss-of-life impact, e.g. transformers
Higher humidity means evening temps stay higher longer
More severe weather will cause reliability issues and higher costs to maintain reliability (SAIDI/SAIFI)
Sea level rise and severe weather mean flooding of facilities

Confidential & Proprietary | Copyright © 2019 Slide 24
Key Success Factors for the Energy Future Electricity is key for achieving societal and economic goals, such
as decarbonization and growth Demand for electricity will increase - electrification and fuel
transformation
Need for clear and balanced society & regulatory policies
Hybrid, modernized grid is key for resilient, safe, reliable, and efficient energy delivery Mix of synchronous generation, inverter-based resources, and
dynamic and active distribution grids with conventional and new loads (e.g. electrical transportation and home heating)
Innovations and optimal utilization of technologies and processes
Robust and reliable analytics
Prioritize investments to achieve reliability and resilience targets in the most cost-effective way
Key Factors for Resilient Grid: Technology Advancements, Educated Workforce, Standards,
and Sharing Global Best-Practices
Back to the Future
Source: US EIA

Confidential & Proprietary | Copyright © 2019 Slide 25
(919) 334-3000
quanta-technology.com
Facebook.com/quanta-technology-LLC
@QuantaTech
Linkedin.com/company/quanta-technology
Quanta Technology, LLC4020 Westchase Blvd., Suite 300
Raleigh, NC 27607
Thank you!


