5 Peak-to-Average Ratio of CDMA Systems Vincent Lau The peak-to-average ratio (PAR) of a signal is an important parameter in CDMA systems because it determines the backoff factor that needs to be applied to the power amplifier in order to avoid clipping of the input signal and hence spectral regrowth. In this chapter, we analyze the PAR of the signals from several CDMA systems, namely, the single-carrier IS-95 system, direct-spread CDMA2000 system, UMTS WCDMA system, multicarrier IS-95 system, and multicarrier CDMA2000 system. In Section 5.1, we give a brief introduction on the background of the problem. We formally define the PAR and explain how the PAR is related to spectral regrowth in the power amplifier design. In Section 5.2, we discuss the analysis of PAR. For instance, we discuss and compare the PAR of signals from single-carrier direct-spread CDMA systems (IS-95, CDMA2000, and WCDMA) by simulation in Section 5.1. In Section 5.2, an analytical model is developed to describe the PAR distribution of multicarrier CDMA systems. Closed-form expressions are obtained. Results are compared with simulations, and a near-exact match is found. This is very useful because simulations of PAR distributions are very costly. The analytical model could provide significant insights into the PAR distribution. In Section 5.3, we discuss the synthesis methods of PAR control in both single-carrier and multicarrier CDMA systems. For the single-carrier CDMA, the algorithm and the effectiveness of PAR control by Walsh code 227
Transcript
5Peak-to-Average Ratio of CDMASystemsVincent Lau
The peak-to-average ratio (PAR) of a signal is an important parameter inCDMA systems because it determines the backoff factor that needs to beapplied to the power amplifier in order to avoid clipping of the input signaland hence spectral regrowth. In this chapter, we analyze the PAR of thesignals from several CDMA systems, namely, the single-carrier IS-95 system,direct-spread CDMA2000 system, UMTS WCDMA system, multicarrierIS-95 system, and multicarrier CDMA2000 system.
In Section 5.1, we give a brief introduction on the background of theproblem. We formally define the PAR and explain how the PAR is relatedto spectral regrowth in the power amplifier design. In Section 5.2, we discussthe analysis of PAR. For instance, we discuss and compare the PAR of signalsfrom single-carrier direct-spread CDMA systems (IS-95, CDMA2000, andWCDMA) by simulation in Section 5.1.
In Section 5.2, an analytical model is developed to describe the PARdistribution of multicarrier CDMA systems. Closed-form expressions areobtained. Results are compared with simulations, and a near-exact match isfound. This is very useful because simulations of PAR distributions are verycostly. The analytical model could provide significant insights into the PARdistribution. In Section 5.3, we discuss the synthesis methods of PAR controlin both single-carrier and multicarrier CDMA systems. For the single-carrierCDMA, the algorithm and the effectiveness of PAR control by Walsh code
227
228 Advances in 3G Enhanced Technologies for Wireless Communications
selection are examined in both the static scenario and dynamic scenario.For the multicarrier CDMA systems, the effectiveness of PAR control bycontrolling the combining phase angles is investigated.
5.1 Background and Introduction of PAR
In CDMA systems, a power amplifier is used to boost radiation power outof the antenna. The transfer characteristic of the power amplifier should belinear to avoid distortions [1]. However, a linear class A amplifier is expensiveand exhibits poor power efficiency. In practice, a class B amplifier is employedthat exhibits a linear transfer characteristic only at a low-input signal level.When the input signal level is too high, nonlinear distortions result, leadingto clipping and spectral regrowth. To maintain tight spectral confinementof the transmitted signal, the efficiency of the power amplifier is reduced.Figure 5.1 shows a comparison of power amplifier efficiency versus PAR forboth class A and class B amplifiers.
In CDMA systems, the PAR of the aggregate signal for multiple usersis usually quite high (above 10 dB). This puts a stringent requirement onthe power amplifier and reduces the efficiency in the sense that a higherinput backoff factor is needed before the peaks in the signal experiencesignificance distortion1 due to power amplifier nonlinearity. In other words,
Figure 5.1 Linear amplifier theoretical efficiency limits.
1. Distortion in peaks will cause undesirable spectral regrowth in the adjacent bands.
229Peak-to-Average Ratio of CDMA Systems
a more expensive power amplifier is required to cater for the large peak’ssignal. With the same rating of power amplifier, an input signal with smallerPAR translates into larger average output power. In the base station, thistranslates into larger cell coverage and capacity of the forward link. In themobile station, this translates into a higher burst rate in the reverse link.
PAR analysis for orthogonal frequency division multiplexing (OFDM)has appeared in [2–7]. However, the PAR behavior of the CDMA signal isquite different from that of OFDM.2 Before we begin our analysis of thePAR of signals from CDMA systems, we present a general definition andexamples of the PAR for various signals.
5.1.1 General PAR Definition
The average power of a signal is well defined to be
Px = limT→ ∞
1T E
T /2
−T /2
|x (t ) |2dt (5.1)
However, there are different interpretations of the meaning of the peakof a signal. Intuitively, a peak of a signal x (t ) is given by the maximum ofits envelope, max t ∈ [−T /2,T /2] |x (t ) | . However, for a continuous randomprocess, max t |x (t ) | could reach infinity provided that the observationinterval, T, is long enough. Even in a discrete random process wheremax t ∈ [−T /2,T /2] |x (t ) | is bounded, it may occur at very low probability,which is not very useful in practice [8]. Therefore, we need a more practicaldefinition of peak in probability terms:
Definition 1
A signal x (t ) is said to have a peak at xp at cutoff probability Pc if
Pr[ |x (t ) | < xp ] = Pc (5.2)
The definition of peak is not unique. The important measure is thelevel of spectral regrowth as a result of the clipping at the defined ‘‘peak’’
2. For example, each carrier is modulated by a binary bit in OFDM, whereas each carrierin a multicarrier CDMA system is modulated by a random process of essentially continuousvalues and the number of carriers is much smaller than the OFDM systems.
230 Advances in 3G Enhanced Technologies for Wireless Communications
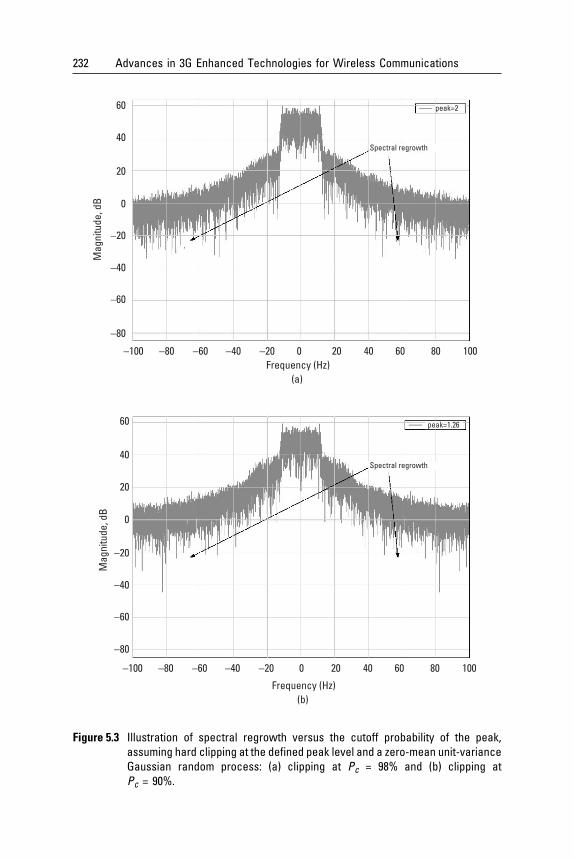
level. It has been shown in [9] that the traditional definition of absolutepeak could lead to contrary choices of design with respect to the spectralregrowth. For instance, the PAR of O-QPSK modulated signals (accordingto the tradition definition of absolute peak) is less than the conventionalQPSK signals. On the contrary, the O-QPSK signal has a higher adjacentchannel power than the regular QPSK signals. In fact, the spectral regrowthdepends on the statistical properties of the signal. Hence, the definition ofpeak should bear a probabilistic structure associated with the signal. Basedon the above definition of peak (5.2), the level of spectral regrowth of aGaussian random process versus the cutoff probability, Pc , is illustrated inFigures 5.2 and 5.3.
Therefore, the PAR of a random process, x (t ), could be completelyspecified by its histogram.3 If an operation is performed on x (t ), the PARof the output will be changed if and only if its PDF is also changed by theoperation. The following gives examples of how the output PAR could beaffected by some operations.
Example 1
Let x1(t ) and x2(t ) be two uncorrelated, zero-mean stationary Gaussian
processes with variance s2, then y (t ) =1
√2[x1(t ) + x2(t )] will have the
same PAR because y (t ) is still a stationary Gaussian process and the distribu-tion (across the time domain) is unchanged (Gaussian). Therefore, the PARsof x1(t ), x2(t ), and y (t ) are the same.
Example 2
In this example, we illustrate the effect of I-Q imbalance to the PAR ofsignals. Let x c (t ) and x s (t ) be two uncorrelated, stationary Gaussian processes(unit variance, zero mean). Consider the general bandpass (BP) Gaussianprocess:
zBP(t ) = a c x c (t ) cos(v0 t ) − a s x s (t ) sin(v0 t ) (5.3)
3. The PAR definition in (5.2) refers to the probability density function (PDF) (or histogram)generated from its time samples That is, collect N samples of x (t ) and plot its histogram.PDF is resulted as N tends to infinity. For an ergodic random process, its PDF in thetime domain and ensemble domain is identical. Otherwise, the histogram (or PDF)in the time domain and ensemble domain is, in general, different, and we always referto the time domain PDF.
231Peak-to-Average Ratio of CDMA Systems
Figure 5.2 Illustration of spectral regrowth versus the cutoff probability of the peak,assuming hard clipping at the defined peak level and a zero-mean unit-varianceGaussian random process: (a) no clipping and (b) clipping at Pc = 99.9%.
where a c2 + a s
2 = 2.Unless a c = a s , the random process is not stationary and hence is not
ergodic. If we collect N samples over an observation time, we could producea histogram of {zBP(t i )}. Because of the nonergodic nature of zBP(t i ), thehistogram (PDF across the time domain) will be distorted from a GaussianPDF, resulting in a different PAR (increased) compared with a regular
232 Advances in 3G Enhanced Technologies for Wireless Communications
Figure 5.3 Illustration of spectral regrowth versus the cutoff probability of the peak,assuming hard clipping at the defined peak level and a zero-mean unit-varianceGaussian random process: (a) clipping at Pc = 98% and (b) clipping atPc = 90%.
233Peak-to-Average Ratio of CDMA Systems
Gaussian distribution. This is illustrated in Figure 5.4. We see that thedistribution of the random process zBP(t i ) is changed with the higher proba-bility of having the same peak as before. In other words, the PAR of zBP(t i )is increased and the amount of PAR increase is determined by the amountof I-Q imbalance a c /a s .
5.2 PAR Analysis of CDMA Signals
In this section, we analyze the PAR of CDMA signals for both single-carrierand multicarrier systems. Specifically, we analyze the PAR of single-carrierCDMA systems by detailed simulation and analyze the PAR of multicarrierCDMA systems by both simulation and analytical formulation.
5.2.1 PAR for Single-Carrier DS-CDMA Systems
In this section, we discuss the PAR of signals from single-carrier DS-CDMAsystems such as the IS-95, CDMA2000, and WCDMA systems. As men-tioned in the introduction, forward link signals of CDMA systems could beapproximated by a Gaussian random process. However, this approximationis accurate only when the number of users in the forward link signal issufficiently large. For practical purposes, we study the mechanism of PARvariations in DS-CDMA signals when the number of users is not very large.For such a case, the traditional Gaussian approximation is not accurateenough to model the PAR dynamics. We evaluate the PAR by detailed linklevel simulations.
Specifically, we study the dependency of PAR with respect to thecombination of Walsh codes in the forward link signal, the modulation format,and the spreading format.
5.2.1.1 Walsh Code Dependency of PAR
In the forward link of IS-95-based CDMA systems, channels correspondingto different users are separated by a different orthogonal code sequence calledthe Walsh code. We found that the PAR of a DS-CDMA signal actuallydepends on the Walsh code combination in the forward link signal. Severalcombinations of Walsh codes will give a large PAR in an aggregate forwardlink signal. Several combinations of Walsh codes will give a small PAR inthe forward link signal. In this section, we investigate the detail dependencyof PAR on the Walsh codes. We also suggest an algorithm to optimallyselect the best combination of Walsh codes in Section 5.3.
234 Advances in 3G Enhanced Technologies for Wireless Communications
Figure 5.4 Distortions of PDF due to different degree of I-Q imbalance: (a) linear scaleand (b) log scale.
235Peak-to-Average Ratio of CDMA Systems
Without loss of generality, consider a coded bit duration Tb . Thecomplex envelope of a DS-CDMA forward link signal could be modeledby:
s̃ (t ) = ∑L
l=1(l l PNI (l ) + jl l PNQ (l ))p (t − lTc ) (5.4)
where L is the number of chips per Tb , l l is defined as the digital transmissionsequence given by:
l l = ∑Nu −1
n=0dn wn (l ) (5.5)
Nu is the number of users, dn is the traffic data bit for user n , wn (l ) is thel th chip of Walsh code assigned to user n , PNI and PNQ are the pseudoran-dom short codes, and p (t ) is the transmission pulse shape. Index l is usedto indicate the chip interval and index n is used to indicate the n th user.
Term l l depends only on the choice of Walsh codes and the applieddata bits dn . Due to the band-limited nature of the channel, the pulse widthof p (t ) will generally span over several chip intervals, causing interchipinterference at instances other than the ideal sampling times. Because of theinterchip interference and the fact that different users share the same PNsequence, a certain combination of Walsh codes and data bits could resultin a particular digital transmission sequence, l l , that has a higher peak com-pared with the others. Let’s illustrate the above idea with the following casesusing the transmit pulse as specified in IS-95.
The overall digital transmission sequences, l l (1) and l l (2), are shownin Figure 5.5(a) and (b), respectively.
Because of the consecutive peaks at l = 14, 15, and 16, the transmitpulse, p (t ), could overlap and add constructively with each other, resultingin a high peak for Walsh set 1 as shown in Figure 5.6(a). However, theprevious bad combination of consecutive peaks is broken in Walsh set 2 andthe resulting peak of the transmitted signal is smaller as shown in Figure5.6(b). This explains the reason for the Walsh code dependency of PAR.
236 Advances in 3G Enhanced Technologies for Wireless Communications
Figure 5.5 Illustrations of (a) bad and (b) good Walsh code combinations.
237Peak-to-Average Ratio of CDMA Systems
Figure 5.6 Transmitted baseband signal of (a) bad and (b) good Walsh code combinations.
238 Advances in 3G Enhanced Technologies for Wireless Communications
5.2.1.2 Comparison Between IS-95, CDMA2000, and WCDMA Systems
Considering a CDMA2000-1X system4 or a WCDMA5 forward link signal,the complex envelope of the signal could be modeled as:
s̃ (t ) = ∑L
l=1(l
(I )l + jl (Q )
l )(PNI (l ) + j PNQ (l ))p (t − lTc ) (5.6)
where l(I )l and l
(Q )l are given by:
l(I )l = ∑
Nu −1
n=0d (I )
n wn (l ) l(Q )l = ∑
Nu −1
n=0d (Q )
n wn (l ) (5.7)
Comparing with IS-95, both the CDMA2000-1X system and theWCDMA system use QPSK modulation. By QPSK modulation, we meanthat the I and Q branches are modulated with independent data symbols.QPSK is used to increase the modulation throughput relative to BPSKmodulation as in IS-95. In Section 5.3.1.1 it is shown by simulation thatthe CDMA2000 system or WCDMA system has a lower PAR value comparedwith the IS-95 system at any fixed Walsh code selection. We show in thefollowing that the PAR reduction is due to QPSK.
5.2.1.3 PAR Dependency of Modulation Formats: BPSK and QPSK
For an IS-95 system forward link signal, BPSK is employed, and the I andQ signals are given by:
s̃I (t ) = ∑l
l l PNI (l )p (t − lTc ) s̃Q (t ) = ∑l
l l PNQ (l )p (t − lTc )
(5.8)
Because PNI and PNQ are independent pseudorandom binary sequences{+1, −1}, they just toggle the sign of the peaks.
Peak position is totally determined by the digital transmission sequence.Hence, for a particular set of data bits dn that causes l l (and hence the Isignal) to peak at chip position l , the Q signal, being affected by the samel l , is very likely to be large in magnitude at the same chip position. Inother words, the I and Q signals are highly correlated in magnitude. This
4. CDMA2000-1X system refers to a CDMA2000 system with a 1.25-MHz bandwidth.5. WCDMA system refers to the WCDMA system specified by the UMTS2000.
239Peak-to-Average Ratio of CDMA Systems
could be illustrated by the I-Q plot of the IS-95 CDMA complex envelopein Figure 5.7.
However, QPSK is used for CDMA2000 or WCDMA systems and,
hence, l(I )l and l
(Q )l are independent because they are driven by independent
data bits {d (I )n } and {d (Q )
n }. Therefore, I and Q signals become uncorrelatedas illustrated by the spherical shape of the I-Q plot in Figure 5.7(b).
The overall peak of the complex envelope is given by
√(s̃ 2I (t ) + s̃ 2
Q (t )). A large peak will occur only when both the I and Qsignals are large in magnitude. For the IS-95 system, I and Q signals areheavily correlated. For the CDMA2000 or WCDMA systems, I and Qsignals are uncorrelated. Hence, the probability of having a large overall peakfor CDMA2000 or WCDMA systems is smaller than for the IS-95 systemas illustrated in Figure 5.7. Note that the I-Q correlation of the IS-95 signalis due to the fact the different users use the same PNI and PNQ sequence.If there is only one single user, the I-Q correlation will disappear.
5.2.1.4 PAR Dependency of Spreading Format: Real Spreading and ComplexSpreading
The IS-95 system employs real spreading while CDMA2000 or WCDMAsystems employ complex spreading.6 When complex spreading is applied,the I and Q signals are given by:
s̃I (t ) = ∑l
(l(I )l PNI (l ) − l
(Q )l PNQ (l ))p (t − lTc ) (5.9)
s̃Q (t ) = ∑l
(l(I )l PNQ (l ) + l
(Q )l PNI (l ))p (t − lTc ) (5.10)
In the reverse links of CDMA2000 or WCDMA systems, the gainsapplied to the I channel data and the Q channel data are different becauseI channel and Q channel are mapped to the dedicated control channel andthe traffic channels, respectively. Without complex spreading, the power ofthe I branch and the power of the Q branch will be different causing anI-Q imbalance. As illustrated in Example 2 of Section 5.1.1, an I-Q imbalancewill induce a large PAR.
When complex spreading is applied, the I-signal power and the Q-signalpower are given by:
6. Real spreading refers to spreading the I data signal with PNI and the Q data signal withPNQ . Complex spreading refers to spreading the complex data (I + jQ ) with a complexspreading sequence (PNI + jPNQ ).
240 Advances in 3G Enhanced Technologies for Wireless Communications
Figure 5.7 Complex envelope of the forward link signal of (a) IS-95 and (b) CDMA2000or WCDMA systems for Nu = 10. Signals are normalized to have the sameroot-mean-square power.
241Peak-to-Average Ratio of CDMA Systems
s2I = lim
T→ ∞
1T E
T /2
−T /2
s̃ 2I (t )dt
= % [(l(I )l PNI (l ))2 ] + % [(l
(Q )l PNQ (l ))2 ] (5.11)
− % [(l(I )l l
(Q )l PNI (l )PNQ (l ))]
and
s2Q = lim
T→ ∞
1T E
T /2
−T /2
s̃ 2Q (t )dt
= % [(l(I )l PNI (l ))2 ] + % [(l
(Q )l PNQ (l ))2 ] (5.12)
+ % [(l(I )l l
(Q )l PNI (l )PNQ (l ))]
where % (•) is the expectation operator. Because PNI and PNQ are uncorre-lated pseudorandom sequences, the third terms in s
2I and s
2Q are zero.
Hence, s2I = s
2Q and one important benefit of complex spreading is to
remove the I-Q unbalance that would otherwise occur. As explained inSection 5.1.1, an I-Q imbalance is undesirable because it could raise thePAR due to the loss of ergodicity.
5.2.2 PAR for Multicarrier CDMA Systems
The PAR for multicarrier systems has received much attention during recentyears [10–12]. In this section, we present a novel analytical approach to thePAR problems of multicarrier systems. The analytical approach will help usto gain significant insight into the PAR dynamics and save us expensivesimulation efforts.
As mentioned in Section 5.1.1, the necessary and sufficient conditionfor a change in PAR is the change or distortion of the histogram (or PDF)of a signal. In this section, we propose a mathematical model so as to describethe PAR change via analytical formulas. To do that, several assumptions aremade to simplify the analysis and the results are compared with simulations.The resulting expression could help us to gain insight into the problem andavoid costly simulations. We first introduce the following theorem.
242 Advances in 3G Enhanced Technologies for Wireless Communications
Theorem 1
Let {x̃1(t ), x̃2(t ), . . , x̃Nc (t )} be a set of Nc complex lowpass randomprocesses and s̃ (t ) be the Nc carriers combined complex signal given by:
where vk and uk are the k th combining frequency and phase. Let f s be thesampling frequency such that
f1f s
=P1Q1
,f2f s
=P2Q2
. . .fNc
f s=
PNc
QNc
(5.14)
where Pi and Qi are relatively prime and Q = LCM{Q1, Q2, . . . , QNc }.If x̃ k (t) is ergodic for all k , then the histogram or PDF derived from thetime samples of | s̃ (t ) | is given by:
f | s̃ | (a ) =1Q F ∑
q : | s̃q | ≠0f q (a ) + ∑
q : | s̃q | =0d (a )G (5.15)
where f q (a ) is the PDF (in ensemble sense) of | s̃q | = | s̃ (t q ,n ) | witht q ,n = nQ + q , q ∈ [1, Q ].
Proof
Suppose we collect NQ samples from s̃ (t ). To derive the histogram forthese NQ samples, we divide the samples into Q subsets, each having Nsamples in such a way that subset q consists of s̃ (t ) sampled at t q ,n = nQ+ q {n = [1, N ], q = [1, Q ]}. Note that within the subset q , the samplesare given by:
s̃q (n ) = x̃1(t q ,n ) expF jS2pP1Q1
(nQ + q ) + u1DG+ x̃2(t q ,n ) expF jS2pP2
Q2(nQ + q ) + u2DG + . . . (5.16)
= x̃1(t q ,n ) expF jS2pP1qQ1
+ u1DG+ x̃2(t q ,n ) expF jS2pP2q
Q2+ u2DG + . . .
243Peak-to-Average Ratio of CDMA Systems
Observe that all complex sinusoids are independent of n and they arejust scaling factors. Hence, all samples within subset q correspond to acomplex ergodic random process. This means that the PDF or histogramof the samples in subset q alone is identical to the PDF in the ensemblesense. Let the individual PDF (in the ensemble sense) of subset q bef | s̃q | (a ) or just f q (a ). The PDF, f | s̃ | (a ), is given by:
f | s̃ | (a ) = limDs→0H 1
Dslim
N→ ∞ FN{ | | s̃ | − a | < Ds }
NQ GJ= lim
Ds→0H 1Ds
limN→ ∞ FS
Qq=1N{ | | s̃q | − a | < Ds }
NQ GJ (5.17)
= limDs→0H 1
Q ∑q
1d s
limN→ ∞ FN{ | | s̃q | − a | < Ds }
N GJ=
1Q F ∑
q : | s̃q | ≠0f q (a ) + ∑
q : | s̃q | =0d (a )G
5.2.2.1 Application of the Analytical Formulation to CDMA2000 or WCDMASystems
As described above, x̃ i (t ) is the complex baseband signal of the DS-CDMAsignal for carrier i. Because all CDMA carriers share the same common pilotand different carriers use the same PNI and PNQ , there would be correlationsbetween baseband signals x̃ i (t ) and x̃ j (t ). In general, since the pilot compo-nent is deterministic, it could be taken out and x̃ i (t ) could be expressed asthe sum of a deterministic component and a zero-mean random process.
n , c , d (i )n , s } are the transmitted digital gain and the [I,Q]
data bits for carrier i and user n , respectively. Because of QPSK, d (i )n , c and
d ( j )n , s are uncorrelated. To include the effect of the correlation between traffic
data bits of different carriers, we assume that {d (i )n , c , d ( j )
n , c } and
244 Advances in 3G Enhanced Technologies for Wireless Communications
{d (i )n , s , d ( j )
n , s } are equally correlated [as shown in (5.19)]. At large Nu , therandom component, x̃ i′(t ), could be approximated by a zero-mean complexstationary Gaussian process. To simplify the expression, we assume that allcarriers are equally loaded and hence, % [ | x̃ i′(t ) |2] = % [ | x̃ j′(t ) |2] = 2s
20 .
Therefore, we have
% [x̃ ′i , c x̃ ′j , s ] = 0
% [(x̃ ′i , c )2] = % [(x̃ ′i , s )2] = s20 = 2 ∑
Nu −1
n=1(c
(i )n )2 (5.19)
% [x̃ ′i , c x̃ ′j , c ] = % [x̃ ′i , s x̃ ′j , s ] = s20r ∀i ≠ j
Consider taking 4NQ time samples from s̃ (t ) and subdivide the samplesinto Q subsets with Q defined in Theorem 1. The real part and the imaginarypart of the signal samples in subset q are given by:
R[s̃q (n )] = ∑Nc
m=1Fc
(m )0 SPNI (t q ,n ) cosS2pPm
Qmq + umD
− PNQ (t q ,n ) sinS2pPmQm
q + umDDG (5.20)
+ ∑Nc
m=1Fx̃ ′m , c (t q ,n ) cosS2pPm
Qmq + umD
− x̃ ′m , s (t q ,n ) sinS2pPmQm
q + umDGI[s̃q (n )] = ∑
Nc
m=1Fc
(m )0 SPNI (t q ,n ) sinS2pPm
Qmq + umD
+ PNQ (t q ,n ) cosS2pPmQm
q + umDDG (5.21)
+ ∑Nc
m=1Fx̃ ′m , c (t q ,n ) sinS2pPm
Qmq + umD
+ x̃ ′m , s (t q ,n ) cosS2pPmQm
q + umDG
245Peak-to-Average Ratio of CDMA Systems
Within each subset q , the 4N samples could be further subdividedinto four smaller subsets of N samples, each corresponding to {PNI , PNQ } ={1,1}, {1,−1}, {−1,1}, and {−1,−1}. Each of these smaller subsets is labeledby p ∈ [1,4]. For these N samples in each of these subsets, their real andimaginary parts, R[s̃q ,p ] and I[s̃q ,p ] could be modeled by two independentGaussian processes with means, [m q ,p (c), m q ,p (s)], given by the first summa-tion terms of (5.20) and (5.21) and variance, [S
2q] given by:
S2q =
def% [R(s̃q ,p )2] = % [I(s̃q ,p )2] (5.22)
= Nc s20 + 2s
20r ∑
Nc
i=1∑Nc
j=1j > i
cosF2pqSPiQi
−Pj
QjD + (ui − uj )G
Note that in the ideal case when traffic data bits are uncorrelatedbetween different carriers, S2
q = Nc s20∀q .
The envelope, | s̃q ,p (n ) | , is given by √[R(s̃q ,p )2 + I(s̃q ,p )2], whichis the square root of the sum-of-the-square of two independent but nonzeromean Gaussian variables. Hence, the PDF of the envelope, f q ,p (a ), is Riciandistributed and is given by:
f q ,p (a ) =a
S2q
expF−Sa2 + g2q ,p
2S2q
DG I0Sag q ,p
S2qD (5.23)
where g q ,p is given by √m2q ,p (c ) + m2
q ,p (s ) and S2q is given by (5.22). From
Theorem 1, the overall PDF (or histogram) of the envelope derived fromthe 4NQ samples of s̃ (t ) is given by:
f | s̃ | (a ) =1
4Q ∑Q
q=1∑4
p=1f q ,p (a ) (5.24)
To derive the peak envelope according to the probabilistic definitionin (5.2), we consider
Pc = Pr[ | s̃ | > a0] = 1 − Ea 0
0
f | s̃q | (a )da (5.25)
=1
4Q ∑Q
q=1∑4
p=1H}1Fg q ,p
Sq,
a0SqGJ
246 Advances in 3G Enhanced Technologies for Wireless Communications
where }1(a, b ) is the Marcum’s function given by:
}1 (a , b ) = e −a 2 + b 2
2 ∑∞
k=0
ak
bIk (ab ) (5.26)
Note that since the x̃ i (t ) values are lowpass random processes, thecombined signal power, S2, is given by:
S2 =def 1
N ∑N
n=1| s̃ [n ] |2
=1
4Q ∑Q
q=1∑4
p=1Fm
2q ,p (c ) + m
2q ,p (s ) + 2S
2qG (5.27)
= 4Nc c20 + 2Nc s
20 = 4Nc ∑
Nu − 1
m=0c
2m
Therefore, the PAR of the multicarrier signal is given by:
PAR (dB) = 20 log10Ha0S J (5.28)
To verify the closeness of the analytical results, we considered combiningthree DS-CDMA baseband signals, each modulated by v1, v2, v3, respec-tively. The histograms obtained from simulations and (5.28) are comparedas shown in Figure 5.8.
The calculated PDF matches that obtained from simulations closelyfor different combining phases. In Figure 5.9, the simulated and calculatedPARs of CDMA2000 three-carrier signals varied with respect to the combin-ing phases (Du ) and traffic data correlation, r , are plotted with differentvalues of pilot transmit gain.
A large pilot transmit gain is used to exaggerate the variations in thePARs and to test the analytical results under extreme conditions. As shownin the figure, individual carriers are essentially uncorrelated at small pilotpower where the combined signal, s̃ (t ), becomes stationary and the envelopePDF becomes Rayleigh distributed and hence independent of the combiningphases. We can see that the simulated PARs fall within 0.05 dB of thecalculated PARs for most of pilot transmit gain and du. Furthermore, thedifference in PARs between using the best Walsh codes and the worst Walsh
247Peak-to-Average Ratio of CDMA Systems
Figure 5.8 Histograms of CDMA2000 three-carrier DS-CDMA signal envelope simulationsand analytical results. All pilot dgu = 500. + and o correspond to the simulatedhistograms using Walsh sets Wmax and Wmin, respectively.
codes vanished in the multicarrier situation. This could be explained by thefact that without loss of generality, the combined three-carrier basebandsignal, s̃ (t ), is given by (5.29) when the middle carrier frequency is factoredout:
because D f is the carrier spacing which is approximately equal to the chipfrequency. Any peak variations due to the effect of Walsh code combinations[13] would be smoothed out by the term exp[± j (2pDft + u )]. A peak willshow up only when the subchip interval (corresponding to the peak) alignswith the time when exp[± j (2pDft + u )] = 1, which is quite unlikely inprobability. Therefore, the Walsh code dependency of PAR vanished inmulticarrier systems.
Moreover, it is important to distinguish the effect of sharing a commonpilot between different carriers and the effect of traffic data correlations onthe PAR. For the case without traffic data correlations between different
248 Advances in 3G Enhanced Technologies for Wireless Communications
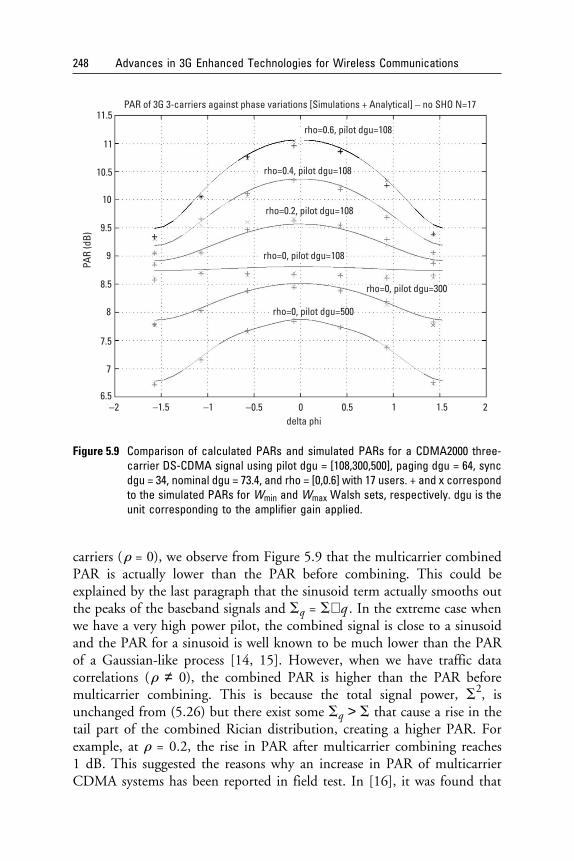
Figure 5.9 Comparison of calculated PARs and simulated PARs for a CDMA2000 three-carrier DS-CDMA signal using pilot dgu = [108,300,500], paging dgu = 64, syncdgu = 34, nominal dgu = 73.4, and rho = [0,0.6] with 17 users. + and x correspondto the simulated PARs for Wmin and Wmax Walsh sets, respectively. dgu is theunit corresponding to the amplifier gain applied.
carriers (r = 0), we observe from Figure 5.9 that the multicarrier combinedPAR is actually lower than the PAR before combining. This could beexplained by the last paragraph that the sinusoid term actually smooths outthe peaks of the baseband signals and Sq = S∀q . In the extreme case whenwe have a very high power pilot, the combined signal is close to a sinusoidand the PAR for a sinusoid is well known to be much lower than the PARof a Gaussian-like process [14, 15]. However, when we have traffic datacorrelations (r ≠ 0), the combined PAR is higher than the PAR beforemulticarrier combining. This is because the total signal power, S2, isunchanged from (5.26) but there exist some Sq > S that cause a rise in thetail part of the combined Rician distribution, creating a higher PAR. Forexample, at r = 0.2, the rise in PAR after multicarrier combining reaches1 dB. This suggested the reasons why an increase in PAR of multicarrierCDMA systems has been reported in field test. In [16], it was found that
249Peak-to-Average Ratio of CDMA Systems
the traffic data bits used to measure the PAR are actually highly correlatedand the long code mask for each traffic channel is turned off, causing hightraffic data correlations between carriers.
Finally, because of the close match between the analytical and thesimulation results, (5.28) could be used to optimize the PAR without doingcostly simulations. This is elaborated upon more in Section 5.3.1.
5.2.2.2 Application of the Analytical Formulation to Multicarrier IS-95DS-CDMA Systems
We apply the analytical model of PAR to IS-95 systems with several carriersdeployed in a cell. Following a technique similar to that in Section 5.2.1,the common pilot signal is taken out of each baseband signal. The real andimaginary parts of the N samples in subset (q , p ) are given by:
R[s̃q ,p (n )] = c0 ∑Nc
i=1FPNI (t q ,p ,n ) cosS2pPi q
Qi+ uiD
− PNQ (t q ,p ,n ) sinS2pPi qQi
+ uiDG+ ∑
Nc
i=1Fx̃ ′i , c (t q ,p ,n ) cosS2pPi q
Qi+ uiD (5.30)
− x̃ ′i , s (t q ,p ,n ) sinS2pPi qQi
+ uiDG= m q ,p (c ) + R[s̃ ′q ,p (t q ,p ,n )]
I[s̃q ,p (n )] = c0 ∑Nc
i=1FPNQ (t q ,p ,n ) cosS2pPi q
Qi+ uiD
+ PNI (t q ,p ,n ) sinS2pPi qQi
+ uiDG+ ∑
Nc
i=1Fx̃ ′i , s (t q ,p ,n ) cosS2pPi q
Qi+ uiD (5.31)
+ x̃ ′i , c (t q ,p ,n ) sinS2pPi qQi
+ uiDG= m q ,p (s ) + I[s̃ ′q ,p (t q ,p ,n )]
250 Advances in 3G Enhanced Technologies for Wireless Communications
Because of BPSK, the I and Q channels share the same data bits for eachcarrier and hence R[x̃ ′i , c ] and I[x̃ ′i , s ] are heavily correlated. Furthermore, toillustrate the effect of traffic channel bits correlation on PAR, we assumethat R[x̃ ′i , c ] and I[x̃ ′j , s ] are correlated as well. Define s
and R(s̃ ′q ,p ) and I(s̃ ′q ,p ) are correlated, the PDF of | s̃ q ,p |2 is no longer achi-square. It is shown that the PDF is given by [17]:
f q ,p (b ) =1
2p E∞
−∞
Fq ,p ( jv )e −jvb dv (5.41)
where Fq ,p (b ) is the characteristic function of the PDF. From Theorem1 again, the peak-square envelope, b0 = a2
0, at probability Pc is given bythe solution to the equation:
252 Advances in 3G Enhanced Technologies for Wireless Communications
Pc = 1 −1
8pQ ∑Q
q=1∑4
p=1E
∞ + je
−∞ + je
Fq ,p ( jv )[1 − e −jvb0 ]
jvdv (5.42)
Similar to (5.27), the total signal power of s̃ (t ) is given by:
S2 =1
4Q ∑Q
q=1∑4
p=1(m2
q ,p (c ) + m2q ,p (s ) + S2
q (c ) + S2q (s )) = 2Nc ∑
Nu −1
m=0c2
m
(5.43)
A comparison of simulated and calculated PARs for IS-95 three-carriersystems at various r and pilot transmit gains is shown in Figure 5.10. Similarobservations are found with respect to the behavior of PAR.
Figure 5.10 Comparison of calculated PARs and simulated PARs for an IS-95 three-carrierDS-CDMA signal using pilot dgu = [108,300,500], paging dgu = 64, sync dgu =34, nom dgu = 73.4, and rho = [0,0.6] with 17 users. + and x correspond tosimulated PARs using Wmax and Wmin, respectively.
253Peak-to-Average Ratio of CDMA Systems
5.2.2.3 Comparison of PAR Between IS-95 and CDMA2000 MulticarrierSystems
As a conclusion to this section, the change of PAR before multicarriercombining and after multicarrier combining is due to the loss of ergodicityin the combined signal. For a CDMA2000 multicarrier system, the loss ofergodicity is due to the common pilot and traffic data correlation in eachcarrier. For an IS-95 multicarrier system, the loss of ergodicity is due to thecommon pilot, the traffic data correlation, and the high correlation (inmagnitude) between the I and Q components.7 For this reason, the PAR forIS-95 systems is higher than the CDMA2000 systems at the same condition inmulticarrier environment.
Another important observation is that a multicarrier PAR does notdepend on Walsh code combinations of individual carrier anymore in boththe IS-95 and CDMA2000 systems (compared to the single-carrier situationin [13]). When traffic data symbols are uncorrelated, the combined PAR isactually lower than the PAR of the baseband signal.
5.3 PAR Control for CDMA Signals
As mentioned in Section 5.1, a large backoff factor is needed to accommodatethe forward link CDMA signal with a large PAR. This effectively reducesthe allowable average transmitting power for a given linear power amplifierand, therefore, the forward link coverage, capacity, and burst rate are reduced.Hence, it would be desirable to reduce the PAR of the CDMA forward linksignal.
In general, PAR control schemes could be classified as synthesis techniquesand predistortion techniques. Synthesis techniques refer to the reduction ofPAR by the adjustments or manipulations of the source data or parametersin the process of producing the transmitted signal. Predistortion techniques,in contrast, refer to the reduction of PAR by signal processing techniqueson the synthesized transmit signals. Predistortion techniques have the advan-tage of, in general, better PAR control. In fact, a number of such techniqueshave been proposed for satellite communication [18, 19]. However, thetradeoff is usually the performance of the physical layer after the signalpredistortion, which depends on the required adjacent band power suppres-sion. For example, in [18], a fourth-order Butterworth filter is used forpostamplification filtering of MPSK signals. While this may provide adequate
7. The correlation between I and Q signals for an IS-95 system is due to BPSK modulation.
254 Advances in 3G Enhanced Technologies for Wireless Communications
adjacent-channel interference suppression, it will not be sufficient for cellularor PCS applications where the requirement for adjacent band spectralregrowth is quite stringent. However, synthesis techniques have been pro-posed to tackle the PAR problems of OFDM systems. Much of the workfocuses on different coding strategies to avoid a few specific data patterns(that would produce large signal peaks) through data translation. However,such techniques were designed for OFDM signals and, therefore, could notbe applied directly to WCDMA systems. Furthermore, data translation meansdata nontransparency and the requirement to change the specification ofCDMA systems. Therefore, in this section, we focus on the possible synthesistechniques for PAR control without requiring any changes in the specifica-tions. The predistortion PAR control techniques specifically for CDMAsignaling are still currently under investigation.
5.3.1 PAR Control for Single-Carrier DS-CDMA Systems
Several schemes have been proposed in the literature [4, 20, 21] to deal withthe PAR of an OFDM signal by selective mapping or redundancy coding.Such schemes could not be directly applied to DS-CDMA signals. For single-carrier DS-CDMA signals, we introduce a PAR control algorithm by selectiveassignment of a Walsh code combination in the forward link. This approachhas the advantage of being simple and does not require any modification tothe existing specifications.
As illustrated in Section 5.2, the PAR of a DS-CDMA forward linksignal is determined by the transmit digital sequence, l
(I )l and l
(Q )l . From
(5.4),
l(I )l = ∑
Nu −1
n=0d (I )
n wn (l ) l(Q )l = ∑
Nu −1
n=0d (Q )
n wn (l ) (5.44)
As shown in (5.44), we could either manipulate the data bits{d (I )
n , d (Q )n } or the Walsh codes {wn (l )} to control l
(I )l and l
(Q )l . The
simplest way is to selectively assign Walsh codes to each user so as to minimizethe PAR because it does not require changes in the MS receiver. This iselaborated in the next section.
5.3.1.1 Static Analysis of Selective Walsh Code Assignment
Due to the limited transmitted bandwidth, interchip interference will resultdue to the transmit pulse width spanning more than one chip interval.Assume that the transmit pulse, p (t ), spans 2L + 1 chip intervals. On each
255Peak-to-Average Ratio of CDMA Systems
chip interval, we oversample the pulse by K times [i.e., there are K samples(subchips) of transmit pulse, p (t ), on each chip]. Without a loss of generality,we consider the peak of either the I signal or the Q signal. Let SNu (k , l )be the magnitude of the envelope of the I or Q signal at the k th subchipbetween t = lTc and t = (l + 1)Tc . It is given by:
SNu (k , l ) = ∑L
l ′=−Ll l + l ′ PNl + l ′ pF(l − l ′K )Tc
K G = ∑L
l ′=−Ll l + l ′ PNl + l ′ pk− l ′K
(5.45)
For any given set of Walsh codes, 0Nu = {wn1, wn2
, . . . , wnNu},
there exist a unique set of data bits $Nu = {d1*, d2*, . . . , dn* } such thatl l = Nu . Since PNl ∈ [1, −1], the worst-case peak of the envelope (5.45)between t = lTc and t = (l + 1)Tc . is given by:
S *Nu (l ) = maxk ∈ [0,K−1]
F ∑L
l ′=−L|l l + l ′ pk− l ′K |G (5.46)
The problem of Walsh code selection is formulated as follows: Tominimize the worst-case peak, S *Nu = max l ∈ [0,M−1] [S *Nu (l )], over the set ofWalsh codes, 0Nu , for Nu users with the constraint:
0N ′ ⊂ 0N ′ + 1 N ′ ∈ [1, 2, . . . , Nu − 1] (5.47)
where M is the number of chips per coded bit (i.e., M = Tb /Tc ). Theconstraint is needed because we want to keep the peak to be minimal forall N as new users are added incrementally into the system.
This optimization problem is solved sequentially in [13]. The followingis the result of a computer search.
The set of Walsh codes that gives a minimal worst-case peak, S *Nu , forNu = 1–17 is sorted as 0min = {w0, w32, w1, w27, w25, w13, w26, w20,w14, w15, . . . }. For the sake of comparison, the set of Walsh codes thatgives a maximal worst-case peak is given by 0max = {w0, w32, w4, w24,w40, w48, w8, w16, w56, w13, . . . }. Figure 5.7 shows the difference inPAR (in decibels) of the IS-95 and CDMA2000 signals resulting from 0minand 0max, respectively.
As shown in Figure 5.11(a), a 1.5- to 2-dB PAR difference existsbetween the system using 0min and 0max Walsh codes for the IS-95 andCDMA2000 systems. Furthermore, given the same Walsh code, there is a
256 Advances in 3G Enhanced Technologies for Wireless Communications
Figure 5.11 Static comparison of PAR for IS-95 and CDMA2000 systems with 0max, 0min,and Nu as variables: (a) no SHO and (b) two-way SHO (handoff factor = 1.5).
257Peak-to-Average Ratio of CDMA Systems
1.5- to 2.5-dB reduction of PAR for the CDMA2000 system. As the numberof users per sector increases, the difference between the PARs of 0max and0min decreases. This is because the transmitting signal approaches a Gaussiandistribution as Nu increases. Because the PDF (histogram) of a Gaussiansignal is fixed, the PAR difference tends to vanish.
When an MS is in SHO, the transmitting power of the forward linkpower control bits is increased by a certain factor (SHO factor) to compensatefor the drop in transmitting power of the traffic channel.8 Hence, SHO willhave an adverse effect on the PAR. Figure 5.11(b) shows the difference inPAR when the SHO factor of 1.5 is included. Similar PAR differences areobserved.
In current IS-95 systems, the normal loading of a sector is about 14users. Therefore, the selective Walsh code mapping method could contributeto a 1- to 2-dB reduction in PAR.
5.3.1.2 Dynamic Analysis of Selective Walsh Code Assignment
As shown in the previous section, a considerable PAR improvement resultswhen an appropriately chosen Walsh code combination is used. However,the comparison is static in the sense that we freeze (1) Walsh code sets and(2) individual traffic channel transmit gain (dgu). Therefore, the comparisonmay be optimistic. In this section, we consider the PAR difference under amore dynamic situation.
Simulations were undertaken to study the PAR difference in a dynamicenvironment as users enter and leave the system. In the simulation model,the following is included:
1. Call attempts and call completion are modeled as a Poisson process.
2. As a new user enters the system, a Walsh code is assigned in oneof three ways: (a) assigned sequentially (implemented in currentsystem); (b) assigned from 0min; or (c) assigned from 0max. Thismodels the dynamic variation of the Walsh code set as calls comeand go.
3. The transmit dgu for each new call is obtained from a truncatedlog-normal distribution with zero mean and 8-dB variance. Thismodels the dynamic variation of transmit gain for each user dueto power control.
8. Power control bits are not combined between SHO legs and hence they need to betransmitted at a higher power to compensate for the reduction in the forward linktransmitted power due to power control.
258 Advances in 3G Enhanced Technologies for Wireless Communications
Therefore, the Walsh code set and the composition of the dgu gainsare varied dynamically as users come and go. The simulation is executed for105 call attempts. Figure 5.12 shows the results of PAR difference amongthe three ways of assigning Walsh codes.
As shown in the figure, an approximately 0.5-dB PAR gain is seenbetween Walsh code assignment schemes (a) and (b) relative to the staticsituation (1- to 2-dB PAR gain). We could infer from this that it is quiteunlikely for a bad Walsh code combination to show up by just simply assigningthe Walsh code sequentially. When a bad Walsh code combination doesshow up (artificially by scheme c), the PAR is increased by about 1.3 dB(as shown in the upper curve). Similarly, the comparison for the CDMA2000system is shown in the same figure.
5.3.2 PAR Reduction Technique for Multicarrier CDMA Systems
For multicarrier CDMA systems, the dependency of PAR on the Walshcode combination is not obvious. For example, as shown in Figure 5.9, thePAR of a three-carrier system is not affected by the selection of Walsh codes.At Du = 0, the PAR difference between the best Walsh code and the worstWalsh code (in the single-carrier sense) is less than 0.05 dB. In multicarriersystems, another possibility for controlling PAR is to adjust the combiningphases (u1, u2, u3) of the component signals in multicarrier signals. In[3, 5, 10, 11] this technique has been shown to be effective in reducing thePAR of OFDM systems. However, in OFDM systems, the number of carriersis usually quite large, whereas in multicarrier CDMA signals, the numberof carriers is relatively small. This basic difference is important in the effective-ness of the PAR control by phase adjustment. In this section, we study theeffectiveness of reducing the PAR by adjusting the combining phases inmulticarrier CDMA systems.
For a CDMA2000 multicarrier system, PAR is determined by (5.28).Therefore, the best case and the worst case combining phases are found byoptimizing (5.28) with respect to the combining phases. Similar optimizationis performed on (5.42) for IS-95 systems.
Figure 5.13 shows the PAR gain9 of IS-95 and CDMA2000 three-carrier systems with regard to the pilot dgu, c0. As shown in the figure,little PAR gain is seen at low c0. The PAR gains are negligible at low pilottransmit gain and low traffic channel correlation (r ).
9. PAR gain refers to the difference between the best phases and the worst phases.
259Peak-to-Average Ratio of CDMA Systems
Figure 5.12 Dynamic comparison of PAR difference for three Walsh code assignmentschemes for IS-95 and CDMA2000 systems: (a) no SHO and (b) SHO factor =1.5.
260 Advances in 3G Enhanced Technologies for Wireless Communications
Figure 5.13 PAR gain for (a) IS-95 and (b) CDMA2000 three-carrier systems with regardto pilot dgu (c 0) and traffic channel correlation (r ).
261Peak-to-Average Ratio of CDMA Systems
5.4 Conclusion
In this chapter, we have discussed the PAR issues for both single-carrier andmulticarrier DS-CDMA signals. We considered IS-95, CDMA2000, andWCDMA systems as illustrations. For the single-carrier systems, we foundthat the signal could not be modeled by a Gaussian random process unlessthe number of users in the forward link is sufficiently large. To accuratelystudy the mechanics of the PAR, we investigate the system by detailedsimulation. We found that the PAR depends on (1) the Walsh code combina-tion in the forward link, (2) BPSK or QPSK modulation, and (3) real spreadingor complex spreading in the reverse link. An algorithm for controlling thePAR by Walsh code selection is presented. The following are the mainconclusions found for the single-carrier situation:
1. The PAR for the IS-95 system is larger than that of CDMA2000or WCDMA systems.
2. The PAR of the forward link is dependent on the Walsh codecombination.
3. The PAR of CDMA2000 or WCDMA systems benefits from QPSKmodulation.
4. The PAR of CDMA2000 or WCDMA reverse link signals benefitsfrom complex spreading.
For multicarrier CDMA systems, analytical expressions are formulatedto model the histogram (PDF) and the PAR of the signals for IS-95 andCDMA2000 systems. Analytical results matched the simulation resultsclosely. In the process of deriving the expressions, better insight into thereasons for the PAR variations can be obtained. Finally, an algorithm forPAR control that selects the optimal combining phases has been consideredand its effect on the PAR is discussed.
The following are the main conclusions found for the multicarriersituation:
1. The PAR of the CDMA2000 system is smaller than that of theIS-95 system in the multicarrier situations.
2. At low pilot transmit gain and traffic channel correlation, the PARgain of combining phases adjustment is less than 0.3 dB for IS-95and CDMA2000 multicarrier systems.
262 Advances in 3G Enhanced Technologies for Wireless Communications
3. When traffic data bits (or assigned Walsh codes) are uncorrelatedbetween different carriers, the PAR of the multicarrier combinedsignal is lower than the baseband PAR. However, when data bitsare correlated, the combined PAR is raised.
Therefore, in general, a more active PAR control scheme, namely, apredistortion technique, is needed, which is under further investigation.
References
[1] Miller, S. L., and R. J. O’Dea, ‘‘Peak Power and Bandwidth Efficient Linear Modula-tion,’’ IEEE Trans. on Communications, Vol. 46, No. 12, Dec. 1998, pp. 1639–1648.
[2] O’Neill, R., and L. B. Lopes, ‘‘Envelope Variations and Spectral Splatter in ClippedMulticarrier Signals,’’ Proceedings of 6th IEEE PIMRC’95, New York, June 1995,pp. 71–75.
[3] Boyd, S., ‘‘Multitone Signals with Low Crest Factor,’’ IEEE Trans. on Communications,Vol. 45, No. 10, Oct. 1997, pp. 1338–1344.
[4] Popovic, B. M., ‘‘Synthesis of Power Efficient Multitone Signals with Flat AmplitudeSpectrum,’’ IEEE Trans. on Communications, Vol. 39, No. 7, July 1991,pp. 1031–1033.
[5] Sumasu, A., et al., ‘‘A Method to Reduce the Peak Power with Signal Space Expansion(ESPAR) for OFDM System,’’ IEEE 51st Vehicular Technology Conf. Proc., VTC2000,Tokyo, July 2000, pp. 405–409.
[6] Paterson, K. G., and V. Tarokh, ‘‘On the Existence and Construction of Good Codeswith Low Peak-to-Average Power Ratios,’’ Proc. IEEE Intl. Symp. Information Theory,July 2000, p. 271.
[7] Fan, P., and X.-G. Xia, ‘‘Block Coded Modulation for the Reduction of the Peak toAverage Power Ratio in OFDM Systems,’’ Proc. Wireless Communications and Net-working Conf.—WCNC, July 1999, pp. 1095–1099.
[8] Freiberg, L., A. Annamalai, and V. K. Bhargava, ‘‘Crest Factor Reduction UsingOrthogonal Spreading Codes in Multicarrier CDMA Systems,’’ Proc. IEEE PIMRC’97,New York, June 1997, pp. 120–124.
[9] Sevic, J. F., and M. B. Steer, ‘‘On the Significance of PAR in Estimating the SpectralRegrowth for Microwave RF Power Amplifier,’’ IEEE Trans. on Microwave Theoryand Techniques, July 2000, pp. 1068–1072.
[10] Tarokh, V., and H. Jafarkhani, ‘‘An Algorithm for Reducing the Peak to AveragePower Ratio Is a Multicarrier Communications System,’’ Proc. IEEE 49th VehicularTechnology Conf., July 1999, pp. 680–684.
[11] Smith, J. A., J. R. Cruz, and D. Pinckley, ‘‘Method for Reducing the Peak-to-Averageof a Multicarrier Waveform,’’ Proc. Vehicular Technology Conf., VTC 2000, Tokyo,June 2000, pp. 542–546.
263Peak-to-Average Ratio of CDMA Systems
[12] Lau, K. N., ‘‘Peak-to-Average Ratio (PAR) of Multicarrier IS-95 and CDMA2000Signals,’’ IEEE Trans. on Vehicular Technologies, Vol. 49, No. 6, Nov. 2000,pp. 2174–2188.
[13] Lau, K. N., ‘‘Analysis of Peak-to-Average Ratio (PAR) of Single Carrier IS-95 andCDMA2000 Signals,’’ Internal Technical Memo, Lucent Technologies, Dec. 1998.
[14] Li, X., and L. J. Cimini, Jr., ‘‘Effects of Clipping and Filtering on the Performanceof OFDM,’’ IEEE Commun. Lett., May 1998, pp. 131–133.
[15] Dinis, R., and A. Gusmao, ‘‘Performance Evaluation of a Multicarrier ModulationTechnique Allowing Strongly Nonlinear Amplification,’’ Proc. ICC’98, Atlanta, GA,June 1998, pp. 791–796.
[16] Ma, Z., H. Wu, and P. Polakos, ‘‘On the Peak-to-Average Ratio (PAR) of CDMASignals,’’ Internal Technical Memo, Lucent Technologies, June 1998.
[17] Johnson, N. L., Continuous Univariate Distributions, 2nd ed., New York: WileyInterscience, 1994.
[18] Feher, H., Advanced Digital Communications, Systems and Signal Processing Techniques,Upper Saddle River, NJ: Prentice Hall, 1987.
[19] Simon, M. K., and J. G. Smith, ‘‘Hexagonal Multiple Phase-and-Amplitude-Shift-Keyed Signal Sets,’’ IEEE Trans. on Communications, Vol. 11, No. 5, June 1971,pp. 1108–1115.
[20] Caswell, A. C., ‘‘Multicarrier Transmission in a Mobile Radio Channel,’’ Electron.Lett., Oct. 1996, pp. 1962–1964.
[21] Shepherd, S., J. Orriss, and S. Barton, ‘‘Simple Coding Scheme to Reduce Peak Factorin QPSK Multicarrier Modulation,’’ Electron. Lett., July 1995, pp. 1131–1132.


![1 Filterbank Multicarr ier and Multicarrier CDMA for ...rolke/content/gpx7iep1t1.pdfApr 15, 2007 · of CDMA and multicarrier technology [11], where pack ets are spread in the frequenc](https://static.documents.pub/doc/80x56/6002cb91ff3e600ce77a0b9a/1-filterbank-multicarr-ier-and-multicarrier-cdma-for-rolkecontent-apr-15.jpg)


