126
1 ICCC Peatland Definition and Peatland Mapping Methodology Assessment Report
| Date post: | 24-Mar-2016 |
| Category: |
Documents |
| Upload: | indonesia-climate-change-center |
| View: | 260 times |
| Download: | 3 times |
1
ICCC Peatland Definition and Peatland Mapping Methodology Assessment Report

2
ICCC Peatland Definition and Peatland Mapping Methodology Assessment Report
3
ICCC Peatland Definition and Peatland Mapping Methodology Assessment Report
Suggested Citation: ICCC, 2014. ICCC Peatland Definition and Peatland Mapping Methodology Assessment Report. Indonesia Climate Change Center. Jakarta, Indonesia.
This report was prepared by Mazars Starling Resources (MSR) for the Peatland Definition and Peatland Mapping Methodology Assessment commissioned by Indonesia Climate Change Center (ICCC) and funded by United States Forest Service (USFS).
ICCC Primary Contact:
Badan Pengkajian dan Penerapan Teknologi I (BPPT) building, 16th FloorJalan M.H.Thamrin 8, Jakarta 10340, IndonesiaEmail: [email protected]
USFS Primary Contact:
United States Forest Service International Programs1 Thomas CircleWashington, DC. 2009Tel: +1 (202) 644-4571
Mazars Starling Resources Primary Contact:
Mazars Starling ResourcesIkat Plaza Building, 3rd Floor,Jl. Bypass Ngurah Rai No. 505Denpasar, Bali 80361, IndonesiaTel: +62-(0)361-847-3141
4
ICCC Peatland Definition and Peatland Mapping Methodology Assessment Report
Acknowledgement
The Research Report of Peatland Definition and Peatland Mapping Methodology Assessment is developed based on research conducted from April to September 2013 in collaboration with several universities, agencies and organizations.
ICCC would like to thank all contributors, researchers as well as administrative, field survey and technical staff, local communities of Teluk Meranti and Pangkalan Kapau villages, Pelalawan District, and local communities of Tewang Kampung and Kampung Melayu villages, Katingan District, for their support. We also would like to thank to all project team members: Mazars Starling Resources, Hokkaido University, Japan Space Systems, Bandung Institute of Technology, University of Riau, University of Palangkaraya, Yayasan Puter Indonesia, and Institute Social and Economic Change.
*All images © Indonesia Climate Change Center
5
ICCC Peatland Definition and Peatland Mapping Methodology Assessment Report
Table of Contents
Acknowledgement List of Acronyms ForewordSummary
ICCC Peatland Definition and Peatland Mapping Methodology Assessment
Section A: Peatland Mapping A1. Introduction A2. Methodology
A2.1. Theoretical Background of the Shimada Model A2.2. Limitations and Assumptions of the Shimada Model A2.3. Methodological Procedures
A3. Results and Discussions A3.1. Results of Spatial Analysis A3.2. Results of Peat Depth Measurement and Sampling A3.3. Results of Peatland Mapping
Section B: Historical Peatland Management Practices and Implications for Land-Use Land-Cover Changes B1. Introduction B2. Methodology
B2.1. Remote-Sensing Analysis B2.2. Focus Group Discussions and Social Baseline Surveys
B3. Results and Discussions B3.1. Historical Overview of LULCC Patterns B3.2. Remote Sensing Analysis of LULCC in Pelalawan District B3.3. Remote Sensing Analysis of LULCC in Katingan District
Section C: Climate Change and Its Potential Impacts on Peatland C1. Introduction C2. Methodology
C2.1. Data Acquisition C2.2. Methods C2.3. Limitations
C3. Results and Discussions C3.1. Historical Observation of Climatic Variations in Pelalawan District C3.2. Historical Observation of Climatic Variations in Katingan District C3.3. Climate Projection for Pelalawan District C3.4. Climate Projection for Katingan District C3.5. Climate Extremes for Pelalawan District C3.6. Climate Extremes for Katingan District C3.7. Potential Impacts of Climate Change on Peatland
4 7 9 10 29
34 34 35 35 36 3645 455156
60
6060606162626670
7373747475767777798284868789
6
ICCC Peatland Definition and Peatland Mapping Methodology Assessment Report
Section D: Use of Satellite-Based Ground Water Table (GWT) Data for Estimating Net CO2 Emissions From Peatland D1. Introduction D2. Methodology
D2.1. Theoretical Background of The Estimation of CO2 Emissions From Satellite- Based GWT Data D2.2. Methodological Steps D2.3. Limitations
D3. Results and Discussions D3.1. Empirical GWT Measurement D3.2. Estimation of CO2 Emissions Based on The Satellite-Based GWT Modeling D3.3. Estimation of The Volume of Peat Drainage
Section E: Toward Sustainable Peatland Management in Indonesia E1. Implications of Sustainable Peatland Management for Climate Change Mitigation E2. Recommendations for Sustainable Peatland Management in Indonesia
E2.1. One Accurate Peatland Map and Spatial Planning E2.2. Protection of The Remaining Peatlands E2.3. Peatland Best Management Practices E2.4. Prevention of Peatland Fires E2.5. Peatland Ecosystem Restoration
References Annexes Annex 1. New Peatland Map of Pelalawan District Annex 2. New Peatland Map of Katingan District Annex 3. Land-Use, Land-Cover Change Analysis of Peatland Area in Pelalawan District Annex 4. Land-Use, Land-Cover Change Analysis of Peatland Area in Katingan District
91 91 9191
9399100100 102103
106106108108109110111112
114119120121122123
7
ICCC Peatland Definition and Peatland Mapping Methodology Assessment Report
List of Acronyms
AR4 Fourth Assessment Report (IPCC)AVHRR Advanced Very High Resolution RadiometerBIG Badan Informasi GeospasialBMKG Badan Meteorologi, Klimatologi dan GeofisikaCO2 Carbon dioxideCDF Cumulative Density FunctionCRU Climate Research Unit (University of East Anglia)DB Drained Burnt PeatlandDBH Diameter at breast height (1.3 meters)DEM Digital Elevation ModelDF Drained ForestDNPI Dewan Nasional Perubahan Iklim (National Council on Climate Change)ENSO El Niño Southern OscillationERC Ecosystem Restoration ConcessionFGD Focus Group DiscussionGCM Global Circulation ModelGHG Greenhouse GasGIS Geographic Information SystemGPP Gross Primary Production (ecosystem photosynthesis)GPS Global Positioning SystemGWL Ground Water LevelGWP Global Warming PotentialGWT Ground Water TableHa HectareHCV High Conservation ValueHPH Hak Pengusahaan Hutan (forest concession license)HP Hutan Produksi (production forest) HTI Hutan Tanaman Industri (industrial timber plantation)HV Horizontal transmitting, Vertical receiving (PALSAR)ICCC Intergovernmental Panel on Climate ChangeIPCC Intergovernmental Panel on Climate ChangeITB Institut Teknologi BandungITCZ Inter-Tropical Convergence ZoneJICA Japan International Cooperation AgencyLULC Land Use and Land CoverLULCC Land Use and Land Cover ChangeLULUCF Land Use, Land-Use Change and Forestrym Metermm MillimeterMoA Ministry of Agriculture IndonesiaMODIS Moderate Resolution Imaging SpectroradiometerMoE Ministry of the EnvironmentMoF Ministry of Forestry IndonesiaMSR Mazars Starling ResourcesMT Metric tonneNDVI Normalized Difference Vegetation indexNEE Net Ecosystem ExchangeNGO Non-governmental OrganizationNOAA National Oceanic and Atmospheric Administration (US Government)PALSAR Phased Array type L-band Synthetic Aperture Radar

8
ICCC Peatland Definition and Peatland Mapping Methodology Assessment Report
PET Potential EvapotranspirationPDF Probability Density FunctionPDO Pacific Decadal OscillationPSF Plant-Soil FeedbackRE Ecosystem RespirationRePPProt Regional Physical Planning Program for TransmigrationRGB Red/Green/Blue (satellite imagery)RSNI Rancangan Standarisasi Nasional Indonesia (Indonesia National Standardization Program)SAR Strategic Assessment Report (IPCC)SRES Special Report on Emissions ScenariosSRTM Shutter Radar Topography MissiontC Tonnes of CarbontCO2e Metric tonne of Carbon Dioxide equivalentTM Landsat Thematic MapperTS Time SeriesUF Undrained ForestUNEP United Nations Environment ProgrammeUSGS United States Geological Survey VV Vertical transmitting, Vertical receiving (PALSAR)WI Wetlands International
9
ICCC Peatland Definition and Peatland Mapping Methodology Assessment Report
Foreword
Indonesia Climate Change Center (ICCC) through several Expert Meetings has formulated a consensus Peatland Definition and Peatland Mapping Methodology. As a follow up, to provide information on scientific analyses supporting policy and actions dealing with greenhouse gas (GHG) emissions from peatland, and to accommodate the robust policy making, ICCC has conducted a ‘Peatland Definition and Peatland Mapping Methodology Assessment’ in Pelalawan District, Riau Province, and Katingan District, Central Kalimantan Province. This study was conducted to test the Peatland Definition and Peatland Mapping Methodology developed by ICCC.
This assessment has been carried out in close consultation with Experts from universities and agencies. The assessment by ICCC includes all the activities of: 1) Testing the Peatland Definition; 2) Testing the Peatland Mapping Methodology; 3) Collecting time series data and information related to socio-economic activity, demographic, disaster (fires, droughts, and floods) and other information related to the interaction of communities with peatland. With this result, ICCC is targeted to support the policy makers in developing the robust policies towards sustainable peatland management. From assessment in those two pilot sites, ICCC provides: 1) Data and analysis results based on scientific; 2) Key findings; and 3) Recommendations for further work to develop robust peatland assessments.
It is our pleasure to share this assessment results with you.
We thank all partners who have contributed to this effort and join us in finding solution for climate change issues, particularly on peatland.
Farhan Helmy
Manager Indonesia Climate Change Center (ICCC)
10
ICCC Peatland Definition and Peatland Mapping Methodology Assessment Report
Summary
INTRODUCTION
An objective of Peatland and Peatland Mapping Cluster (PPMC) of the Indonesia Climate Change Center (ICCC) is to disseminate information on scientific analyses supporting policy and actions dealing with greenhouse gas (GHG) emissions from peatland. Accordingly, ICCC needs to present reliable scientific information to policy makers to facilitate renewed policy on peatland management in support of Government of Indonesia’s GHG emission reduction target. To accommodate robust science-based peatland policy development, PPMC has developed a Peatland Definition and Peatland Mapping Methodology to assist in improving existing peatland maps. The next step, which is critical to the PPMC objective, is to conduct analyses based on field data collected from identified sites to evaluate the PPMC Peatland Definition and Peatland Mapping Methodology based on the existing Wetlands International and Ministry of Agriculture maps in selected sample areas. Recognizing the need for an ecosystem-based sustainable approach, PPMC aims to: 1) Assess the applicability of the PPMC Peatland Definition; 2) Demonstrate and assess the PPMC Peatland Mapping Methodology; and 3) Collect time series data and information related to socio-economic activity, demographics, disasters (fires, droughts, and floods), water management, agriculture in peatland, and information related to community-based peatland interactions in the project areas. Supported by reliable data, these activities will enhance ICCC efforts to support science-based policy towards sustainable peatland management in Indonesia.
In order to achieve the program objectives, ICCC carry out a science-based assessment of peatland methodologies with the following objectives:
• To assess peatland mapping methodologies;
• To develop new accurate peatland maps for the target sites;
• To recommend a sustainable peatland management model by considering the balance between GHG emission reductions and socio-economic needs; and
• To build collaborative partnerships with national and international universities, NGOs, and communities to exchange knowledge and facilitate capacity building.
11
ICCC Peatland Definition and Peatland Mapping Methodology Assessment Report
STUDY SITE
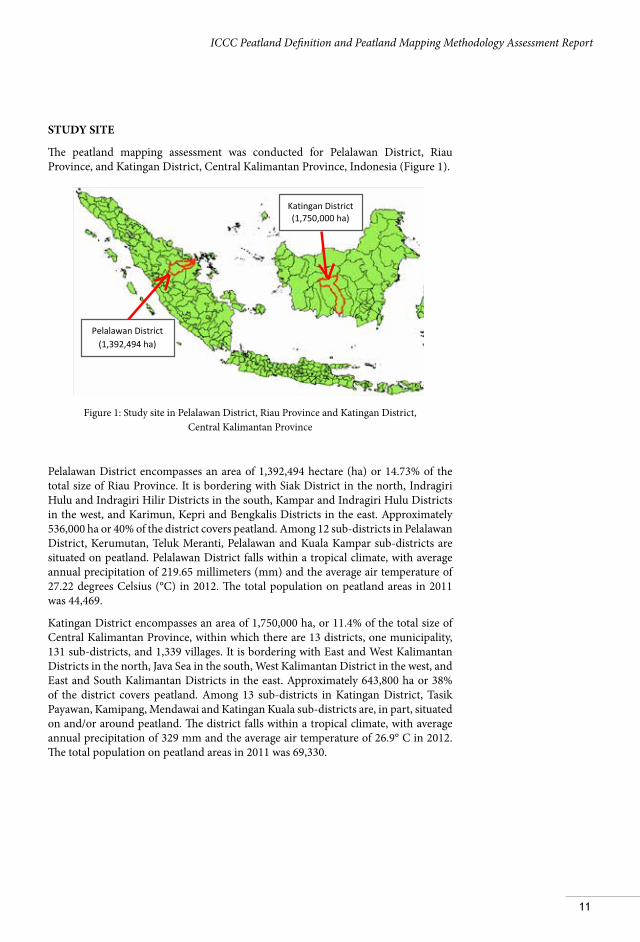
The peatland mapping assessment was conducted for Pelalawan District, Riau Province, and Katingan District, Central Kalimantan Province, Indonesia (Figure 1).
Figure 1: Study site in Pelalawan District, Riau Province and Katingan District, Central Kalimantan Province
Pelalawan District encompasses an area of 1,392,494 hectare (ha) or 14.73% of the total size of Riau Province. It is bordering with Siak District in the north, Indragiri Hulu and Indragiri Hilir Districts in the south, Kampar and Indragiri Hulu Districts in the west, and Karimun, Kepri and Bengkalis Districts in the east. Approximately 536,000 ha or 40% of the district covers peatland. Among 12 sub-districts in Pelalawan District, Kerumutan, Teluk Meranti, Pelalawan and Kuala Kampar sub-districts are situated on peatland. Pelalawan District falls within a tropical climate, with average annual precipitation of 219.65 millimeters (mm) and the average air temperature of 27.22 degrees Celsius (°C) in 2012. The total population on peatland areas in 2011 was 44,469.
Katingan District encompasses an area of 1,750,000 ha, or 11.4% of the total size of Central Kalimantan Province, within which there are 13 districts, one municipality, 131 sub-districts, and 1,339 villages. It is bordering with East and West Kalimantan Districts in the north, Java Sea in the south, West Kalimantan District in the west, and East and South Kalimantan Districts in the east. Approximately 643,800 ha or 38% of the district covers peatland. Among 13 sub-districts in Katingan District, Tasik Payawan, Kamipang, Mendawai and Katingan Kuala sub-districts are, in part, situated on and/or around peatland. The district falls within a tropical climate, with average annual precipitation of 329 mm and the average air temperature of 26.9° C in 2012. The total population on peatland areas in 2011 was 69,330.
Pelalawan District (1,392,494 ha)
Katingan District (1,750,000 ha)
12
ICCC Peatland Definition and Peatland Mapping Methodology Assessment Report
Section A: PEATLAND MAPPING EXERCISE IN PELALAWAN AND KATINGAN
DISTRICTS
BACKGROUND
Peatland maps developed by each source have indicated different and inconsistent results. This is because different data, definitions, methods and precision levels were adopted in the process of analyzing peatland distribution and depths. Such inconsistencies have hindered the effective implementation of policies, regulations, and spatial planning and zoning at the district, provincial and national levels. Creating one accurate, integrated and consistent peatland map based on a well-developed methodology throughout Indonesia is essential for sustainable peatland management. To accommodate the accuracy improvement of existing peatland map, Indonesia Climate Change Center (ICCC) has conducted a peatland mapping exercise in Pelalawan District, Riau Province and Katingan District, Central Kalimantan Province. The aims of the exercise are as follows,
• A quick review of existing peatland maps (i.e., MoA 2012 and WI 2004) and identification of gaps for target study sites;
• Testsoftheproposedmethodologyinthefield;
• Calibrationofpeatdepthsandpeatlandboundarybasedonfielddataandspatialmodeling (i.e., the Shimada Model) integrated with satellite data such as Landsat and Palsar; and
• Peatlandmappingwithmoreaccurateestimationofpeatdistributionanddepths.
FINDINGS
• The results suggested different peat depths from WI peatland maps
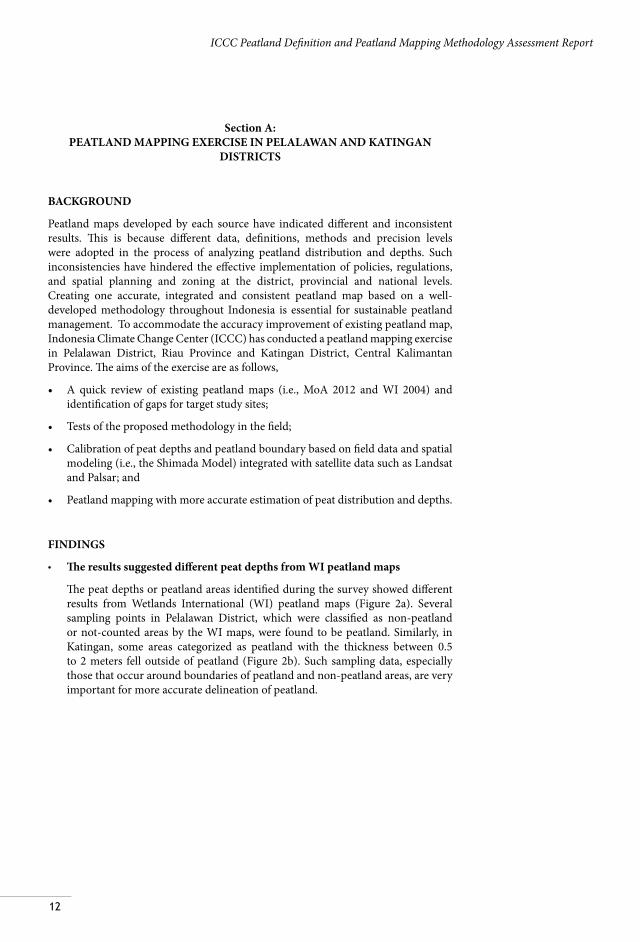
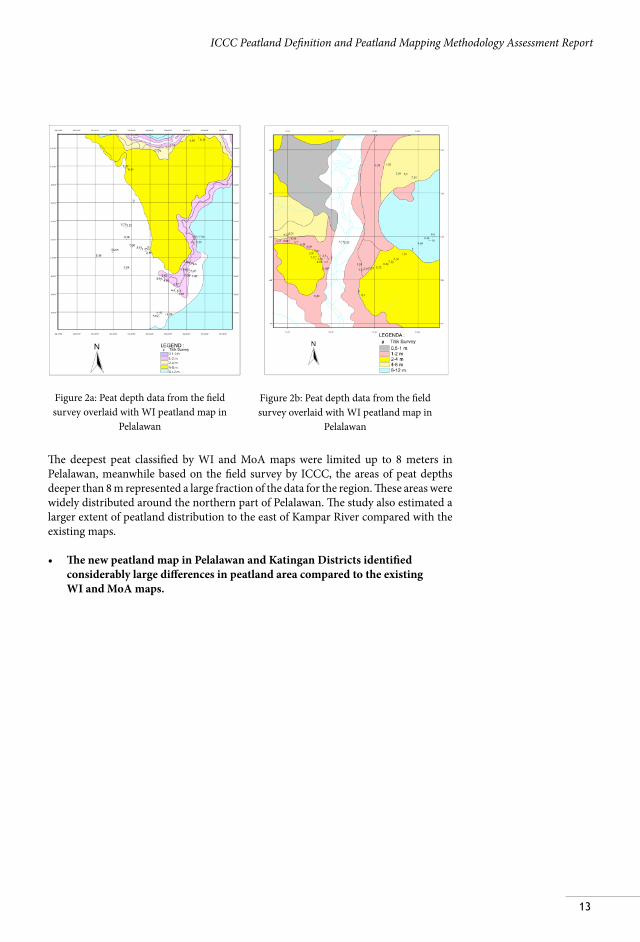
The peat depths or peatland areas identified during the survey showed different results from Wetlands International (WI) peatland maps (Figure 2a). Several sampling points in Pelalawan District, which were classified as non-peatland or not-counted areas by the WI maps, were found to be peatland. Similarly, in Katingan, some areas categorized as peatland with the thickness between 0.5 to 2 meters fell outside of peatland (Figure 2b). Such sampling data, especially those that occur around boundaries of peatland and non-peatland areas, are very important for more accurate delineation of peatland.
13
ICCC Peatland Definition and Peatland Mapping Methodology Assessment Report
The deepest peat classified by WI and MoA maps were limited up to 8 meters in Pelalawan, meanwhile based on the field survey by ICCC, the areas of peat depths deeper than 8 m represented a large fraction of the data for the region. These areas were widely distributed around the northern part of Pelalawan. The study also estimated a larger extent of peatland distribution to the east of Kampar River compared with the existing maps.
• The new peatland map in Pelalawan and Katingan Districts identified considerably large differences in peatland area compared to the existing WI and MoA maps.
Figure 2b: Peat depth data from the field survey overlaid with WI peatland map in
Pelalawan
Figure 2a: Peat depth data from the field survey overlaid with WI peatland map in
Pelalawan
14
ICCC Peatland Definition and Peatland Mapping Methodology Assessment Report
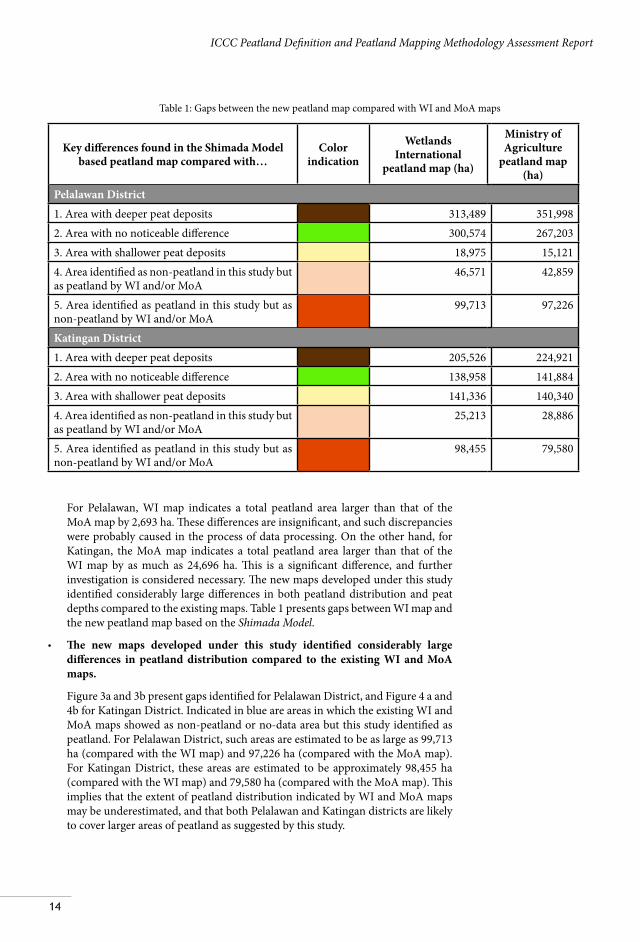
Key differences found in the Shimada Model based peatland map compared with…
Color indication
Wetlands International
peatland map (ha)
Ministry of Agriculture
peatland map (ha)
Pelalawan District1. Area with deeper peat deposits 313,489 351,9982. Area with no noticeable difference 300,574 267,2033. Area with shallower peat deposits 18,975 15,1214. Area identified as non-peatland in this study but as peatland by WI and/or MoA
46,571 42,859
5. Area identified as peatland in this study but as non-peatland by WI and/or MoA
99,713 97,226
Katingan District1. Area with deeper peat deposits 205,526 224,9212. Area with no noticeable difference 138,958 141,8843. Area with shallower peat deposits 141,336 140,3404. Area identified as non-peatland in this study but as peatland by WI and/or MoA
25,213 28,886
5. Area identified as peatland in this study but as non-peatland by WI and/or MoA
98,455 79,580
For Pelalawan, WI map indicates a total peatland area larger than that of the MoA map by 2,693 ha. These differences are insignificant, and such discrepancies were probably caused in the process of data processing. On the other hand, for Katingan, the MoA map indicates a total peatland area larger than that of the WI map by as much as 24,696 ha. This is a significant difference, and further investigation is considered necessary. The new maps developed under this study identified considerably large differences in both peatland distribution and peat depths compared to the existing maps. Table 1 presents gaps between WI map and the new peatland map based on the Shimada Model.
• The new maps developed under this study identified considerably large differences in peatland distribution compared to the existing WI and MoA maps.
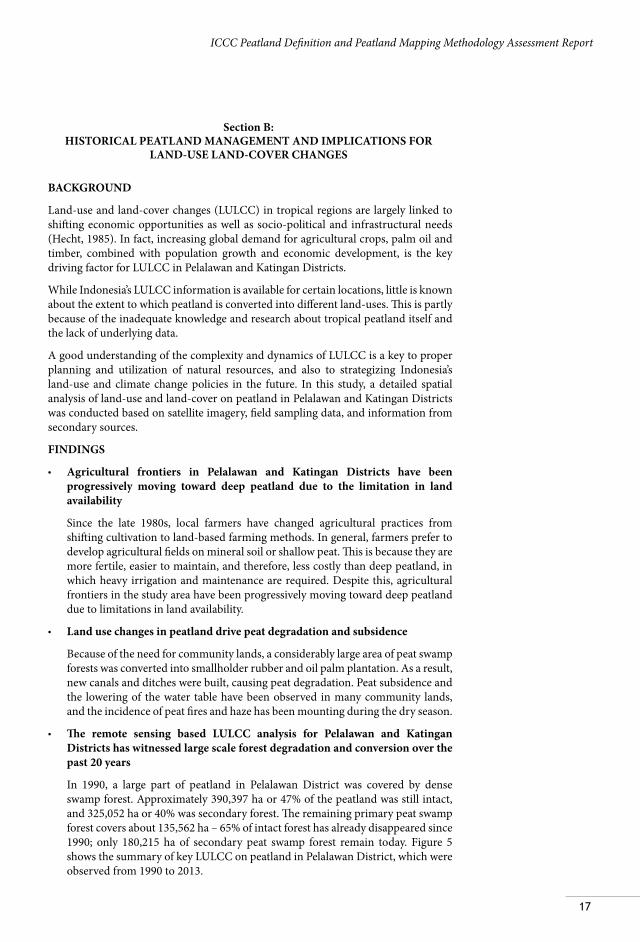
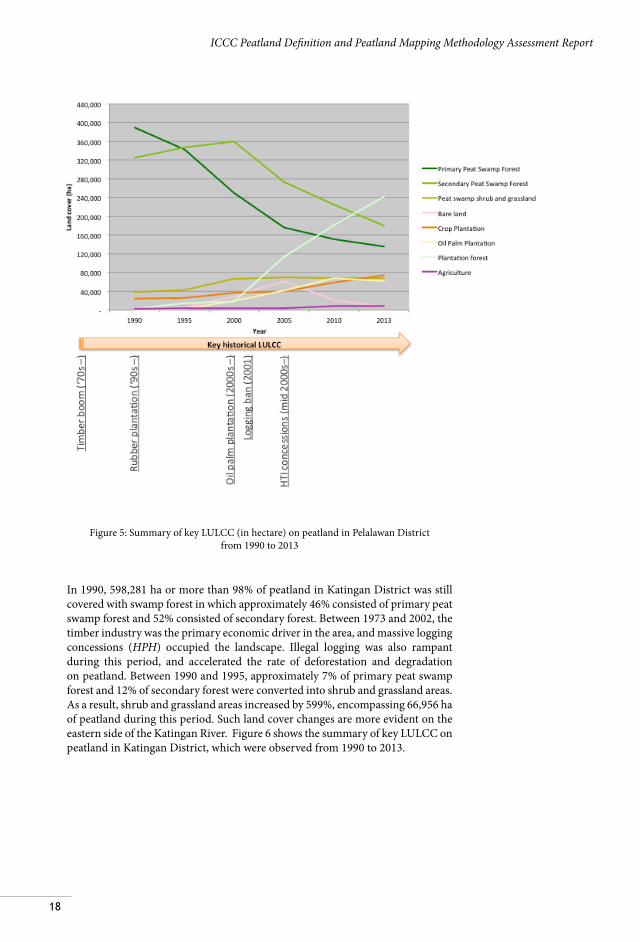
Figure 3a and 3b present gaps identified for Pelalawan District, and Figure 4 a and 4b for Katingan District. Indicated in blue are areas in which the existing WI and MoA maps showed as non-peatland or no-data area but this study identified as peatland. For Pelalawan District, such areas are estimated to be as large as 99,713 ha (compared with the WI map) and 97,226 ha (compared with the MoA map). For Katingan District, these areas are estimated to be approximately 98,455 ha (compared with the WI map) and 79,580 ha (compared with the MoA map). This implies that the extent of peatland distribution indicated by WI and MoA maps may be underestimated, and that both Pelalawan and Katingan districts are likely to cover larger areas of peatland as suggested by this study.
Table 1: Gaps between the new peatland map compared with WI and MoA maps
15
ICCC Peatland Definition and Peatland Mapping Methodology Assessment Report
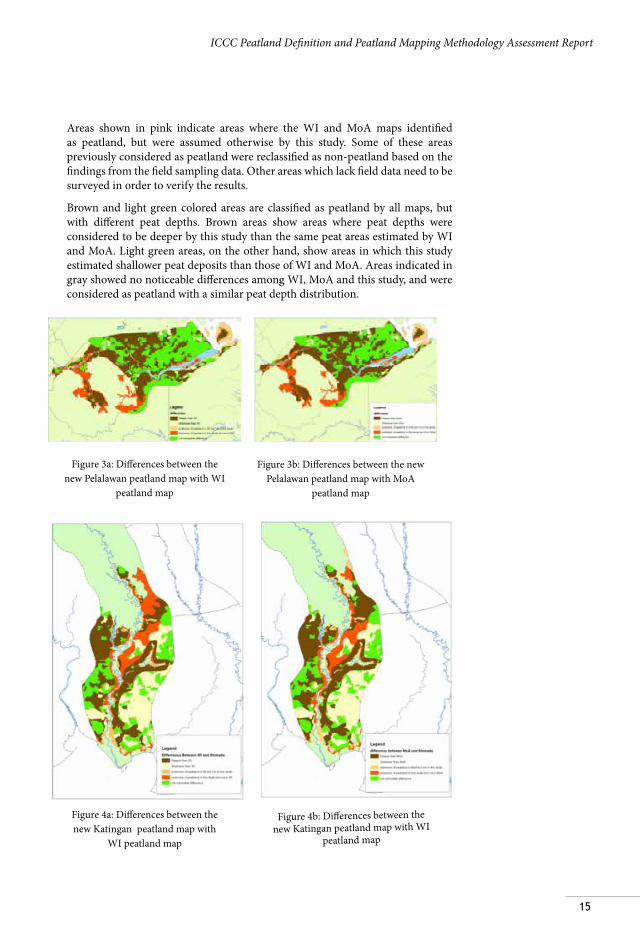
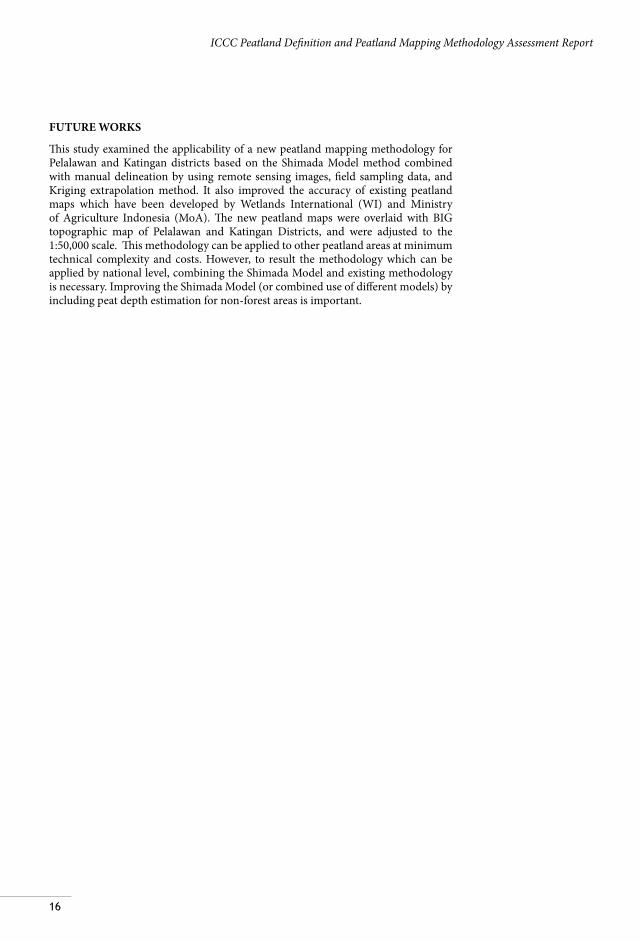
Areas shown in pink indicate areas where the WI and MoA maps identified as peatland, but were assumed otherwise by this study. Some of these areas previously considered as peatland were reclassified as non-peatland based on the findings from the field sampling data. Other areas which lack field data need to be surveyed in order to verify the results.
Brown and light green colored areas are classified as peatland by all maps, but with different peat depths. Brown areas show areas where peat depths were considered to be deeper by this study than the same peat areas estimated by WI and MoA. Light green areas, on the other hand, show areas in which this study estimated shallower peat deposits than those of WI and MoA. Areas indicated in gray showed no noticeable differences among WI, MoA and this study, and were considered as peatland with a similar peat depth distribution.
Figure 3b: Differences between the new Pelalawan peatland map with MoA
peatland map
Figure 3a: Differences between the new Pelalawan peatland map with WI
peatland map
Figure 4b: Differences between the new Katingan peatland map with WI
peatland map
Figure 4a: Differences between the new Katingan peatland map with
WI peatland map
16
ICCC Peatland Definition and Peatland Mapping Methodology Assessment Report
FUTURE WORKS
This study examined the applicability of a new peatland mapping methodology for Pelalawan and Katingan districts based on the Shimada Model method combined with manual delineation by using remote sensing images, field sampling data, and Kriging extrapolation method. It also improved the accuracy of existing peatland maps which have been developed by Wetlands International (WI) and Ministry of Agriculture Indonesia (MoA). The new peatland maps were overlaid with BIG topographic map of Pelalawan and Katingan Districts, and were adjusted to the 1:50,000 scale. This methodology can be applied to other peatland areas at minimum technical complexity and costs. However, to result the methodology which can be applied by national level, combining the Shimada Model and existing methodology is necessary. Improving the Shimada Model (or combined use of different models) by including peat depth estimation for non-forest areas is important.
17
ICCC Peatland Definition and Peatland Mapping Methodology Assessment Report
Section B: HISTORICAL PEATLAND MANAGEMENT AND IMPLICATIONS FOR
LAND-USE LAND-COVER CHANGES
BACKGROUND
Land-use and land-cover changes (LULCC) in tropical regions are largely linked to shifting economic opportunities as well as socio-political and infrastructural needs (Hecht, 1985). In fact, increasing global demand for agricultural crops, palm oil and timber, combined with population growth and economic development, is the key driving factor for LULCC in Pelalawan and Katingan Districts.
While Indonesia’s LULCC information is available for certain locations, little is known about the extent to which peatland is converted into different land-uses. This is partly because of the inadequate knowledge and research about tropical peatland itself and the lack of underlying data.
A good understanding of the complexity and dynamics of LULCC is a key to proper planning and utilization of natural resources, and also to strategizing Indonesia’s land-use and climate change policies in the future. In this study, a detailed spatial analysis of land-use and land-cover on peatland in Pelalawan and Katingan Districts was conducted based on satellite imagery, field sampling data, and information from secondary sources.
FINDINGS
• Agricultural frontiers in Pelalawan and Katingan Districts have been progressively moving toward deep peatland due to the limitation in land availability
Since the late 1980s, local farmers have changed agricultural practices from shifting cultivation to land-based farming methods. In general, farmers prefer to develop agricultural fields on mineral soil or shallow peat. This is because they are more fertile, easier to maintain, and therefore, less costly than deep peatland, in which heavy irrigation and maintenance are required. Despite this, agricultural frontiers in the study area have been progressively moving toward deep peatland due to limitations in land availability.
• Land use changes in peatland drive peat degradation and subsidence
Because of the need for community lands, a considerably large area of peat swamp forests was converted into smallholder rubber and oil palm plantation. As a result, new canals and ditches were built, causing peat degradation. Peat subsidence and the lowering of the water table have been observed in many community lands, and the incidence of peat fires and haze has been mounting during the dry season.
• The remote sensing based LULCC analysis for Pelalawan and Katingan Districts has witnessed large scale forest degradation and conversion over the past 20 years
In 1990, a large part of peatland in Pelalawan District was covered by dense swamp forest. Approximately 390,397 ha or 47% of the peatland was still intact, and 325,052 ha or 40% was secondary forest. The remaining primary peat swamp forest covers about 135,562 ha – 65% of intact forest has already disappeared since 1990; only 180,215 ha of secondary peat swamp forest remain today. Figure 5 shows the summary of key LULCC on peatland in Pelalawan District, which were observed from 1990 to 2013.
18
ICCC Peatland Definition and Peatland Mapping Methodology Assessment Report
Figure 5: Summary of key LULCC (in hectare) on peatland in Pelalawan District from 1990 to 2013
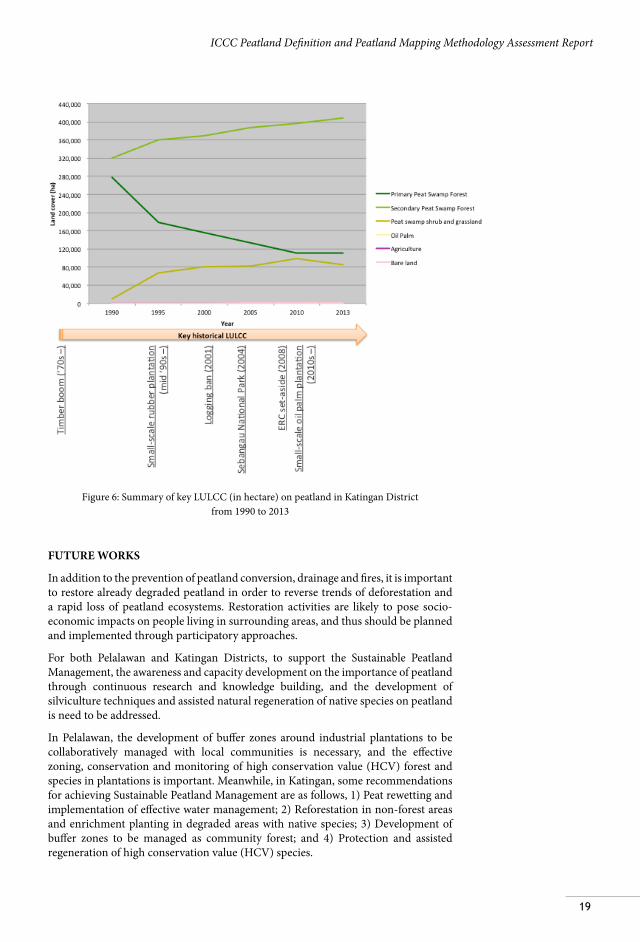
In 1990, 598,281 ha or more than 98% of peatland in Katingan District was still covered with swamp forest in which approximately 46% consisted of primary peat swamp forest and 52% consisted of secondary forest. Between 1973 and 2002, the timber industry was the primary economic driver in the area, and massive logging concessions (HPH) occupied the landscape. Illegal logging was also rampant during this period, and accelerated the rate of deforestation and degradation on peatland. Between 1990 and 1995, approximately 7% of primary peat swamp forest and 12% of secondary forest were converted into shrub and grassland areas. As a result, shrub and grassland areas increased by 599%, encompassing 66,956 ha of peatland during this period. Such land cover changes are more evident on the eastern side of the Katingan River. Figure 6 shows the summary of key LULCC on peatland in Katingan District, which were observed from 1990 to 2013.
19
ICCC Peatland Definition and Peatland Mapping Methodology Assessment Report
Figure 6: Summary of key LULCC (in hectare) on peatland in Katingan District from 1990 to 2013
FUTURE WORKS
In addition to the prevention of peatland conversion, drainage and fires, it is important to restore already degraded peatland in order to reverse trends of deforestation and a rapid loss of peatland ecosystems. Restoration activities are likely to pose socio-economic impacts on people living in surrounding areas, and thus should be planned and implemented through participatory approaches.
For both Pelalawan and Katingan Districts, to support the Sustainable Peatland Management, the awareness and capacity development on the importance of peatland through continuous research and knowledge building, and the development of silviculture techniques and assisted natural regeneration of native species on peatland is need to be addressed.
In Pelalawan, the development of buffer zones around industrial plantations to be collaboratively managed with local communities is necessary, and the effective zoning, conservation and monitoring of high conservation value (HCV) forest and species in plantations is important. Meanwhile, in Katingan, some recommendations for achieving Sustainable Peatland Management are as follows, 1) Peat rewetting and implementation of effective water management; 2) Reforestation in non-forest areas and enrichment planting in degraded areas with native species; 3) Development of buffer zones to be managed as community forest; and 4) Protection and assisted regeneration of high conservation value (HCV) species.
20
ICCC Peatland Definition and Peatland Mapping Methodology Assessment Report
Section C: CLIMATE CHANGE AND ITS POTENTIAL IMPACTS ON PEATLAND
BACKGROUND
Climate change is often associated with increasing extreme weather events. IPCC defines that “[a] changing climate leads to changes in the frequency, intensity, spatial extent, duration, and timing of extreme weather and climate events, and can result in unprecedented extreme weather and climate events” (IPCC, 2000). Information on climate extremes is essential to understand implications of climate change and assess social and environmental risks. Peatland ecosystems are of most vulnerable and exposed to climate stress. Furthermore, natural hazards pose considerable impacts on people living on and around peatland in Indonesia. When peat is dry, especially during the dry season, it can easily spread fires which can continue to burn down to the water table for an extended period of time. Peat degradation also deteriorates the water retention ability of soil and often causes unseasonal floods. Unpredictable weather patterns also pose adverse impacts on economic activities such as farming and fishing, and crop productivity.
A science-based understanding of climate change, climate projection and its potential impacts has important implications for society and sustainable development. It will allow policy makers to determine climate change mitigation strategies, while also supporting appropriate interventions to disaster and disaster risk management. It is also key to developing sustainable peatland management approaches, in which GHG emission reduction objectives and socioeconomic needs are balanced. Therefore, ICCC initiated study in Pelalawan and Katingan District which aiming to provide the historical climate variations and provide climate change projections up to 2050 based on seven Global Circulation Models. In this study, it will be discussed about the occurrence and projection of climate extremes by conducting statistical probably analysis.
FINDINGS
• An average air temperature has shown an uprising trend of 1.33° C in the period of 1950-2011 in Pelalawan District
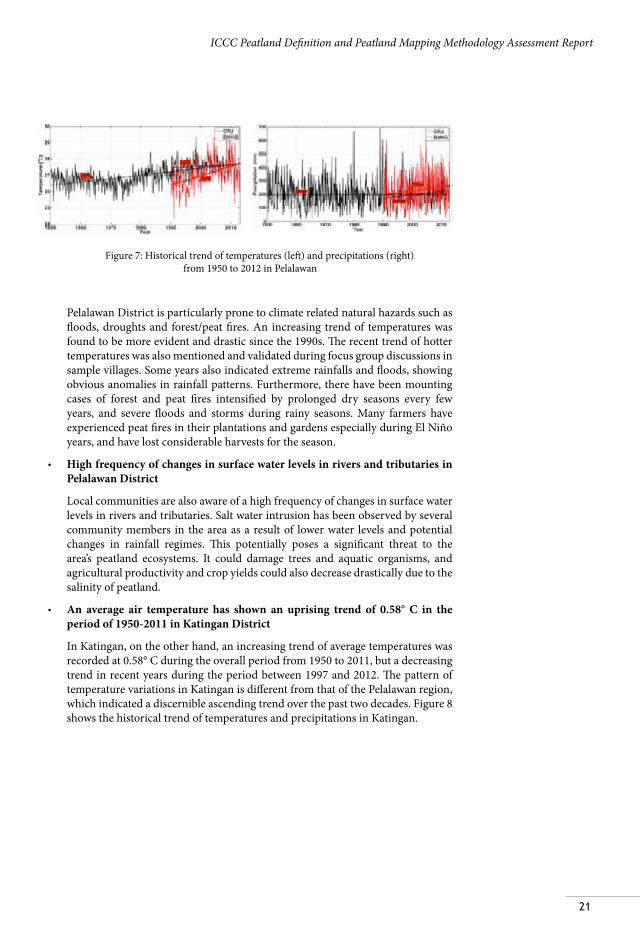
The historical observation of temperature and precipitation trends for Pelalawan District has shown large variability in local climate patterns since 1950. Average air temperature has shown an uprising trend of 1.33° C and rainfall patterns have indicated an increasing trend of anomalies (i.e., more frequent extremes such as drought and flood events) over the period of 1950-2011. The occurrence of extreme weather in the study area has been more frequent with increasing intensity. Figure 7 shows the historical trend of temperatures and precipitations in Pelalawan.
21
ICCC Peatland Definition and Peatland Mapping Methodology Assessment Report
Figure 7: Historical trend of temperatures (left) and precipitations (right) from 1950 to 2012 in Pelalawan
Pelalawan District is particularly prone to climate related natural hazards such as floods, droughts and forest/peat fires. An increasing trend of temperatures was found to be more evident and drastic since the 1990s. The recent trend of hotter temperatures was also mentioned and validated during focus group discussions in sample villages. Some years also indicated extreme rainfalls and floods, showing obvious anomalies in rainfall patterns. Furthermore, there have been mounting cases of forest and peat fires intensified by prolonged dry seasons every few years, and severe floods and storms during rainy seasons. Many farmers have experienced peat fires in their plantations and gardens especially during El Niño years, and have lost considerable harvests for the season.
• High frequency of changes in surface water levels in rivers and tributaries in Pelalawan District
Local communities are also aware of a high frequency of changes in surface water levels in rivers and tributaries. Salt water intrusion has been observed by several community members in the area as a result of lower water levels and potential changes in rainfall regimes. This potentially poses a significant threat to the area’s peatland ecosystems. It could damage trees and aquatic organisms, and agricultural productivity and crop yields could also decrease drastically due to the salinity of peatland.
• An average air temperature has shown an uprising trend of 0.58° C in the period of 1950-2011 in Katingan District
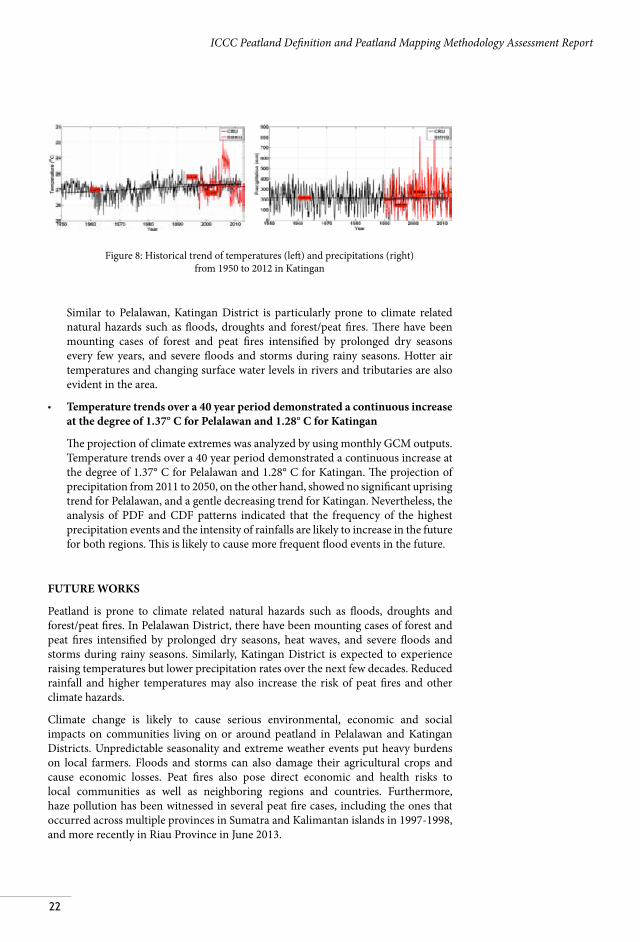
In Katingan, on the other hand, an increasing trend of average temperatures was recorded at 0.58° C during the overall period from 1950 to 2011, but a decreasing trend in recent years during the period between 1997 and 2012. The pattern of temperature variations in Katingan is different from that of the Pelalawan region, which indicated a discernible ascending trend over the past two decades. Figure 8 shows the historical trend of temperatures and precipitations in Katingan.
22
ICCC Peatland Definition and Peatland Mapping Methodology Assessment Report
Figure 8: Historical trend of temperatures (left) and precipitations (right) from 1950 to 2012 in Katingan
Similar to Pelalawan, Katingan District is particularly prone to climate related natural hazards such as floods, droughts and forest/peat fires. There have been mounting cases of forest and peat fires intensified by prolonged dry seasons every few years, and severe floods and storms during rainy seasons. Hotter air temperatures and changing surface water levels in rivers and tributaries are also evident in the area.
• Temperature trends over a 40 year period demonstrated a continuous increase at the degree of 1.37° C for Pelalawan and 1.28° C for Katingan
The projection of climate extremes was analyzed by using monthly GCM outputs. Temperature trends over a 40 year period demonstrated a continuous increase at the degree of 1.37° C for Pelalawan and 1.28° C for Katingan. The projection of precipitation from 2011 to 2050, on the other hand, showed no significant uprising trend for Pelalawan, and a gentle decreasing trend for Katingan. Nevertheless, the analysis of PDF and CDF patterns indicated that the frequency of the highest precipitation events and the intensity of rainfalls are likely to increase in the future for both regions. This is likely to cause more frequent flood events in the future.
FUTURE WORKS
Peatland is prone to climate related natural hazards such as floods, droughts and forest/peat fires. In Pelalawan District, there have been mounting cases of forest and peat fires intensified by prolonged dry seasons, heat waves, and severe floods and storms during rainy seasons. Similarly, Katingan District is expected to experience raising temperatures but lower precipitation rates over the next few decades. Reduced rainfall and higher temperatures may also increase the risk of peat fires and other climate hazards.
Climate change is likely to cause serious environmental, economic and social impacts on communities living on or around peatland in Pelalawan and Katingan Districts. Unpredictable seasonality and extreme weather events put heavy burdens on local farmers. Floods and storms can also damage their agricultural crops and cause economic losses. Peat fires also pose direct economic and health risks to local communities as well as neighboring regions and countries. Furthermore, haze pollution has been witnessed in several peat fire cases, including the ones that occurred across multiple provinces in Sumatra and Kalimantan islands in 1997-1998, and more recently in Riau Province in June 2013.
23
ICCC Peatland Definition and Peatland Mapping Methodology Assessment Report
Section D: USE OF SATELLITE-BASED GROUND WATER TABLE DATA FOR ESTIMAT-
ING NET CO2 EMISSIONS FROM PEATLAND
BACKGROUND
Tropical peatland is one of the largest terrestrial carbon stores, and plays a major role in global hydrological cycles and atmospheric circulation. Although the decomposition of organic matters occurs naturally over time, in Indonesia, it has been extensively and rapidly caused by the degradation of peat compounds due to anthropogenic activities. Peatland degradation in Indonesia is often associated with forest conversion, deforestation and peat fires. Peat drainage due to the construction of canals and ditches for irrigation and transportation purposes lowers ground water table (GWT) depths, resulting in the loss of hydrological integrity, peat oxidation and subsidence. This results in greenhouse gases being released into the atmosphere in mass quantities, and consequently leads to climate change.
While there are a number of researches which have studied the effect of drainage on CO2 emissions based on subsidence data and chamber methods, the magnitude of ecosystem-scale carbon balance on tropical peatland is still unknown (Hirano, et. al., 2012). GWT is one of the key parameters to understand carbon cycling on peatland, and the monitoring and recording of GWT fluctuations is crucial to quantify their net CO2 emissions. Thus, this section of the report presents key steps and preliminary results from the assessment of a satellite-based net CO2 estimation methodology based on the eddy covariance technique and empirical GWT measurements on peatland in Pelalawan and Katingan Districts.
Moreover, this study aimed to assess the methodology for the estimation of the volume of water released from peatland into canals at maximum and minimum scenarios. Although the preliminary results from the hydrological drainage model could not be integrated into the overall estimation of CO2 emissions from peatland during this assignment (due to time and resource constraints), this model is instrumental to analyze the potential effect of canal and irrigation trench development on peatland in future research.
FINDINGS
This study found that ground water table (GWT) is one of the key parameters to understand carbon cycling on peatland, and the monitoring and recording of GWT fluctuations is crucial to quantify their net CO2 emissions. Based on the eddy covariance technique and empirical GWT measurements, we examined relationships between net ecosystem exchange (NEE) in the atmosphere and GTW levels to estimate net CO2 emissions from three distinctive sample sites – Undrained peat swamp forest (UF), Drained peat swamp forest (DF), and Drained and burned peatland (DB). At all sites, net CO2 emissions increased as GWT lowered. On the UF sample sites, net CO2 emissions (positive NEE) occurred when the GWT lowered by 6 cm from the surface. On the DF sample sites, net CO2 emissions occurred when the GWT lowered by 31 cm. On the DB sample sites, we found consistent net CO2 emissions at all GWT levels, even the surface was inundated.
24
ICCC Peatland Definition and Peatland Mapping Methodology Assessment Report
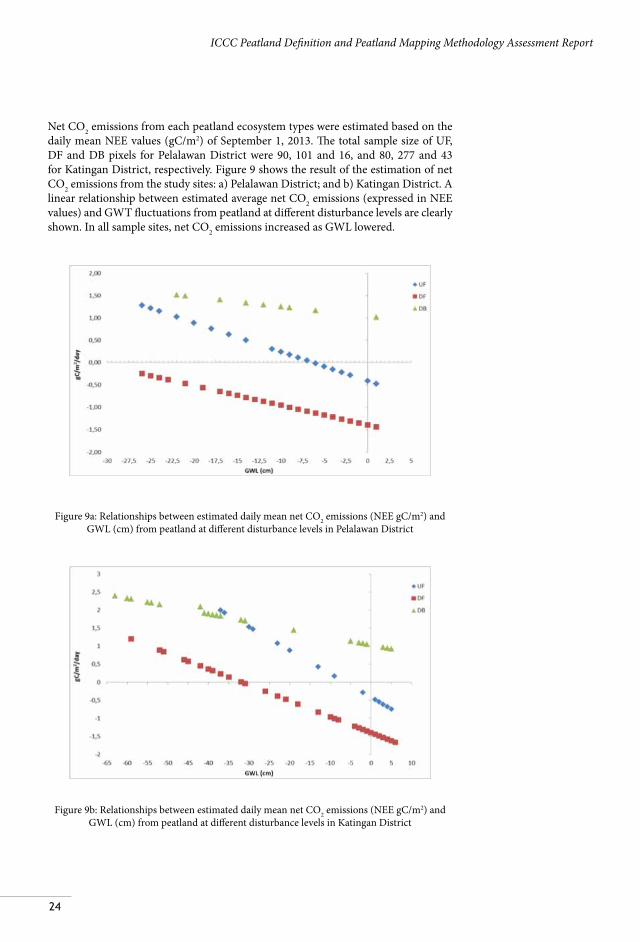
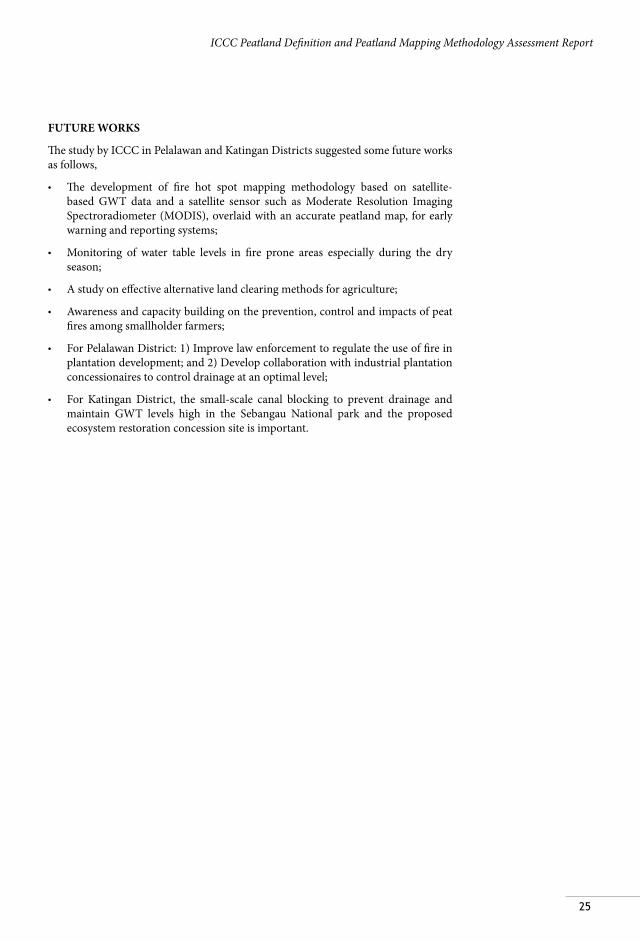
Net CO2 emissions from each peatland ecosystem types were estimated based on the daily mean NEE values (gC/m2) of September 1, 2013. The total sample size of UF, DF and DB pixels for Pelalawan District were 90, 101 and 16, and 80, 277 and 43 for Katingan District, respectively. Figure 9 shows the result of the estimation of net CO2 emissions from the study sites: a) Pelalawan District; and b) Katingan District. A linear relationship between estimated average net CO2 emissions (expressed in NEE values) and GWT fluctuations from peatland at different disturbance levels are clearly shown. In all sample sites, net CO2 emissions increased as GWL lowered.
Figure 9a: Relationships between estimated daily mean net CO2 emissions (NEE gC/m2) and GWL (cm) from peatland at different disturbance levels in Pelalawan District
Figure 9b: Relationships between estimated daily mean net CO2 emissions (NEE gC/m2) and GWL (cm) from peatland at different disturbance levels in Katingan District
25
ICCC Peatland Definition and Peatland Mapping Methodology Assessment Report
FUTURE WORKS
The study by ICCC in Pelalawan and Katingan Districts suggested some future works as follows,
• The development of fire hot spot mapping methodology based on satellite-based GWT data and a satellite sensor such as Moderate Resolution Imaging Spectroradiometer (MODIS), overlaid with an accurate peatland map, for early warning and reporting systems;
• Monitoring of water table levels in fire prone areas especially during the dry season;
• A study on effective alternative land clearing methods for agriculture;
• Awareness and capacity building on the prevention, control and impacts of peat fires among smallholder farmers;
• For Pelalawan District: 1) Improve law enforcement to regulate the use of fire in plantation development; and 2) Develop collaboration with industrial plantation concessionaires to control drainage at an optimal level;
• For Katingan District, the small-scale canal blocking to prevent drainage and maintain GWT levels high in the Sebangau National park and the proposed ecosystem restoration concession site is important.

26
ICCC Peatland Definition and Peatland Mapping Methodology Assessment Report
Section E: TOWARD SUSTAINABLE PEATLAND MANAGEMENT IN INDONESIA
BACKGROUND
This study provided science-based methodological, empirical and conceptual approaches to climate change mitigation potentials and needs for peatland in Pelalawan and Katingan Districts. While the degree of climate change impacts varies across regions, it is important to incorporate scientifically rigorous methodologies and practical mitigation strategies into climate policies at national, provincial and district levels. Both general and region specific recommendations are provided below to conclude this report.
FINDINGS AND RECOMMENDATIONS
Based on the study results by ICCC, the components should be considered to achieve the Sustainable Peatland Management are as follows,
1. One accurate peatland map and spatial planning
Creating one integrated, transparent, consistent and collaboratively developed peatland map throughout Indonesia is essential for effectively implementing policies, regulations, and sustainable peatland management strategies. The map should be developed upon a standardized and scientifically rigorous methodology, and serve as the basis for low emission land-use planning and zoning at the district, provincial and national levels.
2. Protection of the remaining peatland
The foremost threat to the area’s peatland ecosystems is the conversion of peatland and peat swamp forest into other land uses such as oil palm plantations, pulpwood plantations (e.g., acacia), non-food crop plantations (e.g., rubber), and/or agricultural lands. In order to reduce ecological pressures and GHG emissions from peatland conversion, the government must protect the remaining peatland through effective policies and multi-stakeholder engagement.
3. Peatland best management practices
In addition to the protection of remaining peatland through various legal measures as presented above, peatland best management practices must be developed and communicated among stakeholders in order to reduce GHG emissions and other socio-ecological pressures. Best practices should be science-based, socio-culturally acceptable, environmentally appropriate and financially feasible, and draw on the experience of experts and local communities.
27
ICCC Peatland Definition and Peatland Mapping Methodology Assessment Report
4. Prevention of peatland fires
Peatland fires usually occur because of unsustainable land-use practices, and are one of the main causes of massive deforestation and peatland degradation, and pose negative environmental and social impacts. Fires almost always occur on non-forest and degraded peatland during the dry season, often caused by land clearing for farming and by accident (e.g., cigarettes and cooking fires) on drained peatland. The prevention of peatland fires is critical for sustainable peatland management and mitigation of GHG emissions.
5. Peatland ecosystem restoration
In addition to the prevention of peatland conversion, drainage and fires, it is important to restore already degraded peatland in order to reverse trends of deforestation and a rapid loss of peatland ecosystems. Restoration activities are likely to pose socio-economic impacts on people living in surrounding areas, and thus should be planned and implemented through participatory approaches.
28
ICCC Peatland Definition and Peatland Mapping Methodology Assessment Report
29
ICCC Peatland Definition and Peatland Mapping Methodology Assessment Report
INTRODUCTION
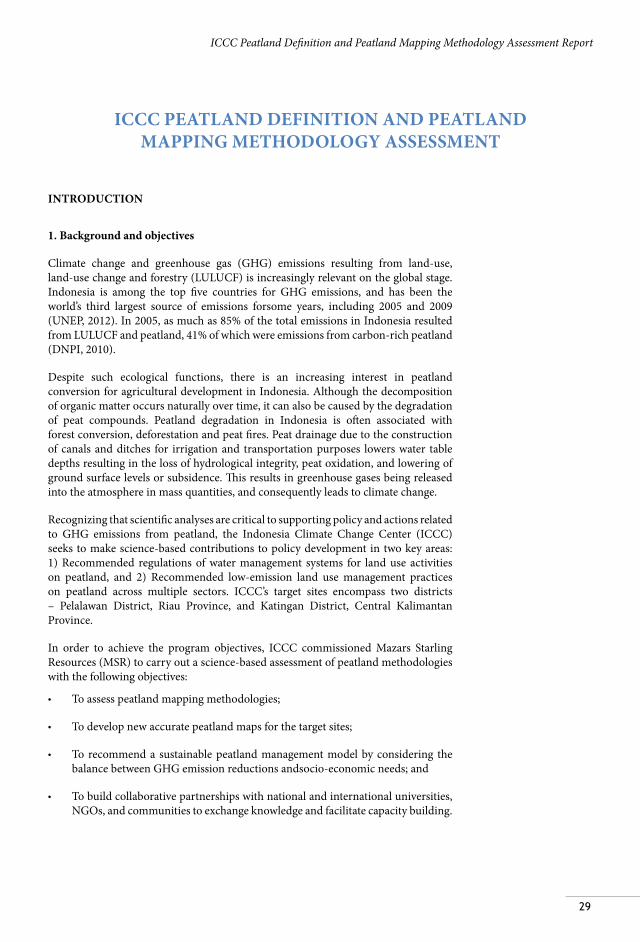
1. Background and objectives
Climate change and greenhouse gas (GHG) emissions resulting from land-use, land-use change and forestry (LULUCF) is increasingly relevant on the global stage. Indonesia is among the top five countries for GHG emissions, and has been the world’s third largest source of emissions forsome years, including 2005 and 2009 (UNEP, 2012). In 2005, as much as 85% of the total emissions in Indonesia resulted from LULUCF and peatland, 41% of which were emissions from carbon-rich peatland (DNPI, 2010).
Despite such ecological functions, there is an increasing interest in peatland conversion for agricultural development in Indonesia. Although the decomposition of organic matter occurs naturally over time, it can also be caused by the degradation of peat compounds. Peatland degradation in Indonesia is often associated with forest conversion, deforestation and peat fires. Peat drainage due to the construction of canals and ditches for irrigation and transportation purposes lowers water table depths resulting in the loss of hydrological integrity, peat oxidation, and lowering of ground surface levels or subsidence. This results in greenhouse gases being released into the atmosphere in mass quantities, and consequently leads to climate change.
Recognizing that scientific analyses are critical to supporting policy and actions related to GHG emissions from peatland, the Indonesia Climate Change Center (ICCC) seeks to make science-based contributions to policy development in two key areas: 1) Recommended regulations of water management systems for land use activities on peatland, and 2) Recommended low-emission land use management practices on peatland across multiple sectors. ICCC’s target sites encompass two districts – Pelalawan District, Riau Province, and Katingan District, Central Kalimantan Province.
In order to achieve the program objectives, ICCC commissioned Mazars Starling Resources (MSR) to carry out a science-based assessment of peatland methodologies with the following objectives:
• To assess peatland mapping methodologies;
• To develop new accurate peatland maps for the target sites;
• To recommend a sustainable peatland management model by considering the balance between GHG emission reductions andsocio-economic needs; and
• To build collaborative partnerships with national and international universities, NGOs, and communities to exchange knowledge and facilitate capacity building.
ICCC PEATLAND DEFINITION AND PEATLAND MAPPING METHODOLOGY ASSESSMENT
30
ICCC Peatland Definition and Peatland Mapping Methodology Assessment Report
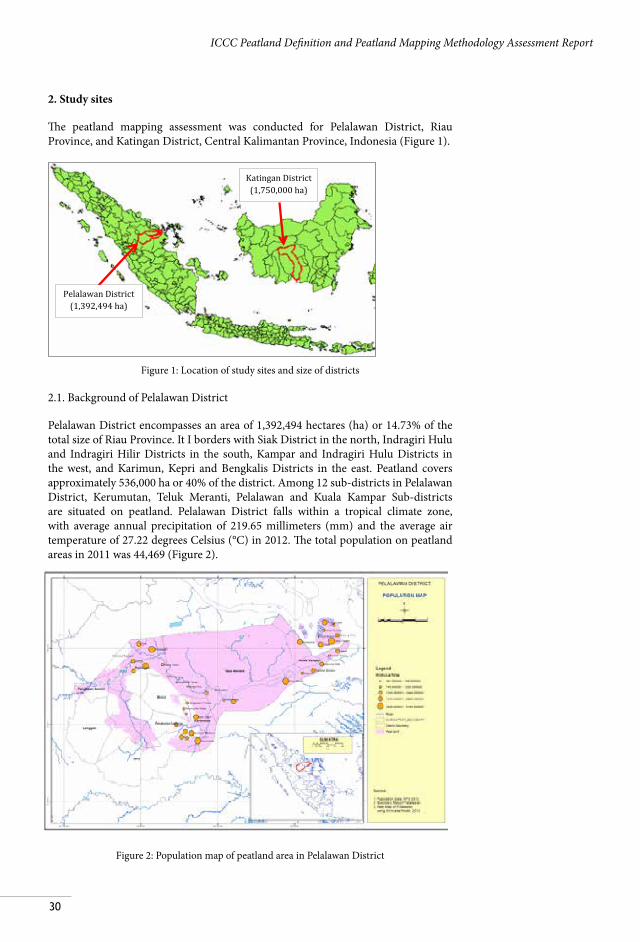
2. Study sites
The peatland mapping assessment was conducted for Pelalawan District, Riau Province, and Katingan District, Central Kalimantan Province, Indonesia (Figure 1).
Figure 1: Location of study sites and size of districts
2.1. Background of Pelalawan District
Pelalawan District encompasses an area of 1,392,494 hectares (ha) or 14.73% of the total size of Riau Province. It I borders with Siak District in the north, Indragiri Hulu and Indragiri Hilir Districts in the south, Kampar and Indragiri Hulu Districts in the west, and Karimun, Kepri and Bengkalis Districts in the east. Peatland covers approximately 536,000 ha or 40% of the district. Among 12 sub-districts in Pelalawan District, Kerumutan, Teluk Meranti, Pelalawan and Kuala Kampar Sub-districts are situated on peatland. Pelalawan District falls within a tropical climate zone, with average annual precipitation of 219.65 millimeters (mm) and the average air temperature of 27.22 degrees Celsius (°C) in 2012. The total population on peatland areas in 2011 was 44,469 (Figure 2).
Figure 2: Population map of peatland area in Pelalawan District
Pelalawan District (1,392,494 ha)
Katingan District (1,750,000 ha)
31
ICCC Peatland Definition and Peatland Mapping Methodology Assessment Report
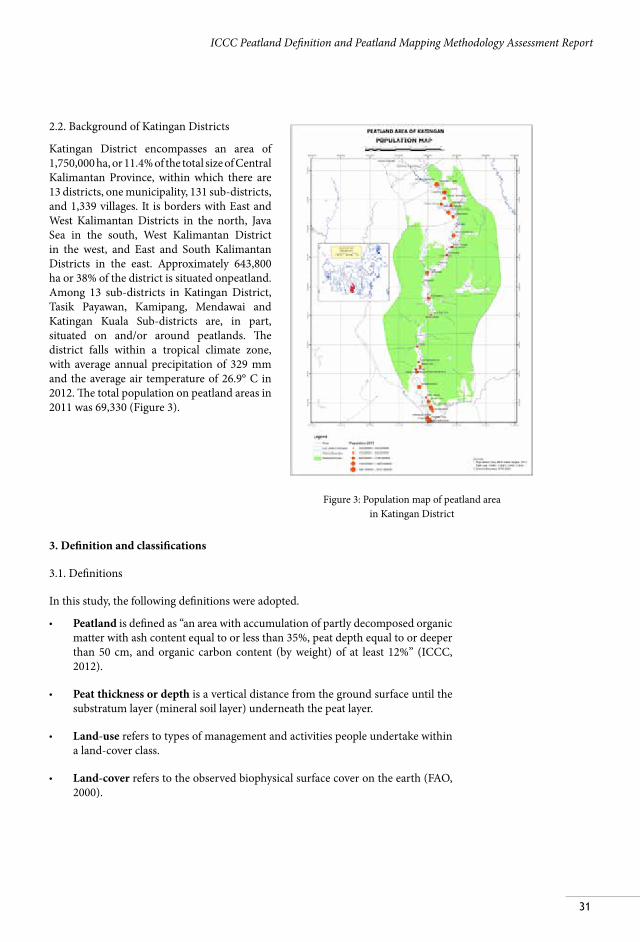
2.2. Background of Katingan Districts
Katingan District encompasses an area of 1,750,000 ha, or 11.4% of the total size of Central Kalimantan Province, within which there are 13 districts, one municipality, 131 sub-districts, and 1,339 villages. It is borders with East and West Kalimantan Districts in the north, Java Sea in the south, West Kalimantan District in the west, and East and South Kalimantan Districts in the east. Approximately 643,800 ha or 38% of the district is situated onpeatland. Among 13 sub-districts in Katingan District, Tasik Payawan, Kamipang, Mendawai and Katingan Kuala Sub-districts are, in part, situated on and/or around peatlands. The district falls within a tropical climate zone, with average annual precipitation of 329 mm and the average air temperature of 26.9° C in 2012. The total population on peatland areas in 2011 was 69,330 (Figure 3).
3. Definition and classifications
3.1. Definitions
In this study, the following definitions were adopted.
• Peatland is defined as “an area with accumulation of partly decomposed organic matter with ash content equal to or less than 35%, peat depth equal to or deeper than 50 cm, and organic carbon content (by weight) of at least 12%” (ICCC, 2012).
• Peat thickness or depth is a vertical distance from the ground surface until the substratum layer (mineral soil layer) underneath the peat layer.
• Land-use refers to types of management and activities people undertake within a land-cover class.
• Land-cover refers to the observed biophysical surface cover on the earth (FAO, 2000).
Figure 3: Population map of peatland area in Katingan District
32
ICCC Peatland Definition and Peatland Mapping Methodology Assessment Report
3.2. Classifications
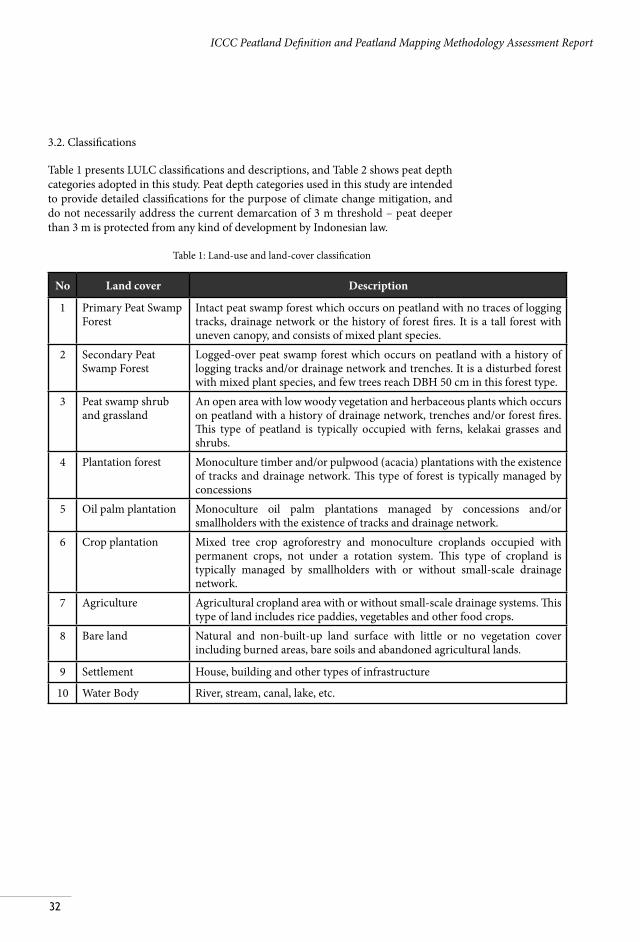
Table 1 presents LULC classifications and descriptions, and Table 2 shows peat depth categories adopted in this study. Peat depth categories used in this study are intended to provide detailed classifications for the purpose of climate change mitigation, and do not necessarily address the current demarcation of 3 m threshold – peat deeper than 3 m is protected from any kind of development by Indonesian law.
Table 1: Land-use and land-cover classification
No Land cover Description
1 Primary Peat Swamp Forest
Intact peat swamp forest which occurs on peatland with no traces of logging tracks, drainage network or the history of forest fires. It is a tall forest with uneven canopy, and consists of mixed plant species.
2 Secondary Peat Swamp Forest
Logged-over peat swamp forest which occurs on peatland with a history of logging tracks and/or drainage network and trenches. It is a disturbed forest with mixed plant species, and few trees reach DBH 50 cm in this forest type.
3 Peat swamp shrub and grassland
An open area with low woody vegetation and herbaceous plants which occurs on peatland with a history of drainage network, trenches and/or forest fires. This type of peatland is typically occupied with ferns, kelakai grasses and shrubs.
4 Plantation forest Monoculture timber and/or pulpwood (acacia) plantations with the existence of tracks and drainage network. This type of forest is typically managed by concessions
5 Oil palm plantation Monoculture oil palm plantations managed by concessions and/or smallholders with the existence of tracks and drainage network.
6 Crop plantation Mixed tree crop agroforestry and monoculture croplands occupied with permanent crops, not under a rotation system. This type of cropland is typically managed by smallholders with or without small-scale drainage network.
7 Agriculture Agricultural cropland area with or without small-scale drainage systems. This type of land includes rice paddies, vegetables and other food crops.
8 Bare land Natural and non-built-up land surface with little or no vegetation cover including burned areas, bare soils and abandoned agricultural lands.
9 Settlement House, building and other types of infrastructure
10 Water Body River, stream, canal, lake, etc.

33
ICCC Peatland Definition and Peatland Mapping Methodology Assessment Report
Table 2: Peat depth categories
Category Peat depth (m) Category Peat depth (m)PEATY 0-0.5 D3 6.0-8.0
D0 0.5-2.0 D4 8.0-10.0D1 2.0-4.0 D5 > 10.0D2 4.0-6.0
4. Outline of this report
This report is organized into five sections. Each section is composed of a brief introduction, methodology and results.
Section A. Peatland mapping Section B. Historical peatland management and implications for land-use land-cover changes Section C. Climate change and its potential impacts on peatland Section D. Use of satellite-based ground water table data for estimating net CO2 emissions from peatland Section E. Toward sustainable peatland management
34
ICCC Peatland Definition and Peatland Mapping Methodology Assessment Report
Section A:
PEATLAND MAPPING A1. Introduction
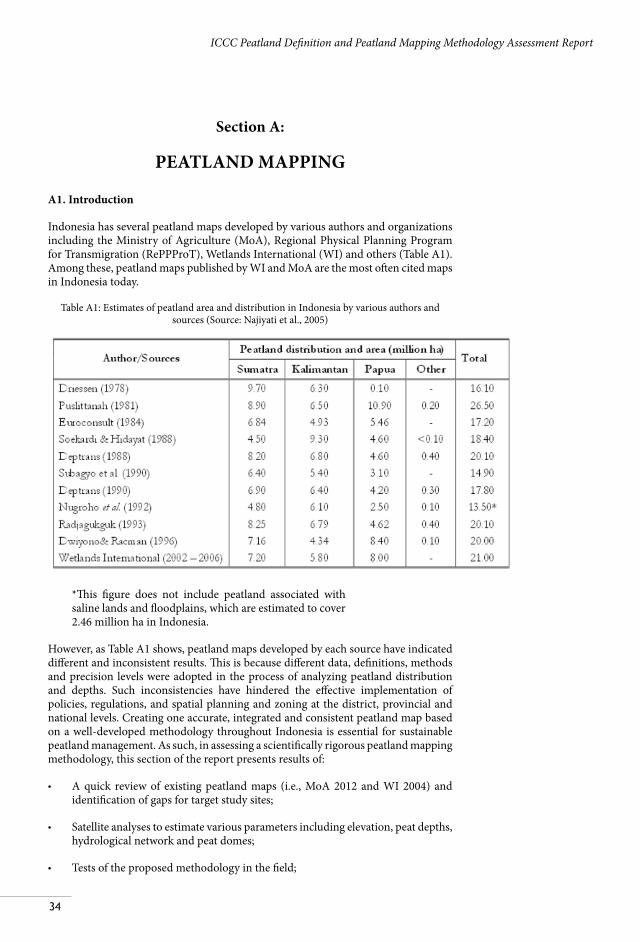
Indonesia has several peatland maps developed by various authors and organizations including the Ministry of Agriculture (MoA), Regional Physical Planning Program for Transmigration (RePPProT), Wetlands International (WI) and others (Table A1). Among these, peatland maps published by WI and MoA are the most often cited maps in Indonesia today.
Table A1: Estimates of peatland area and distribution in Indonesia by various authors and sources (Source: Najiyati et al., 2005)
*This figure does not include peatland associated with saline lands and floodplains, which are estimated to cover 2.46 million ha in Indonesia.
However, as Table A1 shows, peatland maps developed by each source have indicated different and inconsistent results. This is because different data, definitions, methods and precision levels were adopted in the process of analyzing peatland distribution and depths. Such inconsistencies have hindered the effective implementation of policies, regulations, and spatial planning and zoning at the district, provincial and national levels. Creating one accurate, integrated and consistent peatland map based on a well-developed methodology throughout Indonesia is essential for sustainable peatland management. As such, in assessing a scientifically rigorous peatland mapping methodology, this section of the report presents results of:
• A quick review of existing peatland maps (i.e., MoA 2012 and WI 2004) and identification of gaps for target study sites;
• Satellite analyses to estimate various parameters including elevation, peat depths, hydrological network and peat domes;
• Tests of the proposed methodology in the field;
35
ICCC Peatland Definition and Peatland Mapping Methodology Assessment Report
• Calibration of peat depths and peatland boundary based on field data and spatial modeling (i.e., the Shimada Model) integrated with satellite data such as Landsat and Palsar; and
• Peatland mapping with more accurate estimation of peat distribution and depths.
A2. Methodology
A2.1. Theoretical background of the Shimada Model
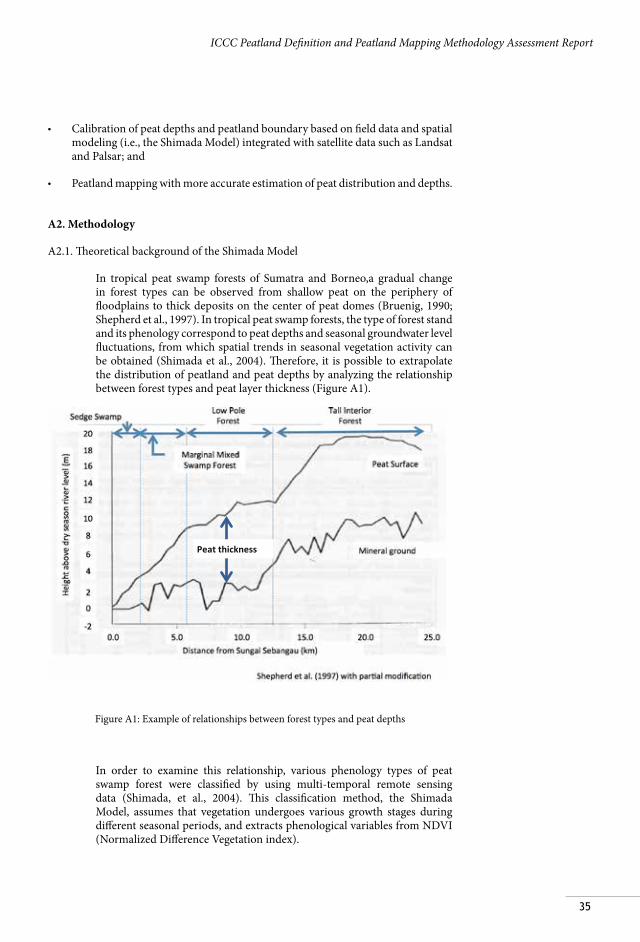
In tropical peat swamp forests of Sumatra and Borneo,a gradual change in forest types can be observed from shallow peat on the periphery of floodplains to thick deposits on the center of peat domes (Bruenig, 1990; Shepherd et al., 1997). In tropical peat swamp forests, the type of forest stand and its phenology correspond to peat depths and seasonal groundwater level fluctuations, from which spatial trends in seasonal vegetation activity can be obtained (Shimada et al., 2004). Therefore, it is possible to extrapolate the distribution of peatland and peat depths by analyzing the relationship between forest types and peat layer thickness (Figure A1).
Peat thickness
Figure A1: Example of relationships between forest types and peat depths
In order to examine this relationship, various phenology types of peat swamp forest were classified by using multi-temporal remote sensing data (Shimada, et al., 2004). This classification method, the Shimada Model, assumes that vegetation undergoes various growth stages during different seasonal periods, and extracts phenological variables from NDVI (Normalized Difference Vegetation index).
36
ICCC Peatland Definition and Peatland Mapping Methodology Assessment Report
A2.2. Limitations and assumptions of the Shimada Model
The Shimada Model method requires that the season of study areas be clearly divided into dry and wet periods. However, Pelalawan District did not show a distinctive dry period, and precipitation patterns indicated variations with two peaks in April and November. On the other hand, precipitation patterns in Katingan District indicated only one rainfall peak in a year period, observed between the months of December and April (Figures C4b and d; C7b and d). For this reason, there are several difficulties in directly adopting the Shimada Model for our study area in Pelalawan.
With this methodology, peat depth classification accuracy is strongly dependent on the quantity and quality of the field survey dataset. Although there exists a relatively large activity database for Riau and Central Kalimantan, the density of peat drilling locations is still low. Furthermore, peat sampling locations are spatially biased due to limited accessibility and logistical challenges. The maximum likelihood method used for the classification of peat depths (see Section 2.2.5.) required at least two to three times more activity data for each satellite image (1-km grid cells) than was available (Oki et al., 2005). For this reason, some of the peat depth classification categories(i.e., 0 – 0.5 m and 0.5 – 1 m for Pelalawan, and 8 – 10 m and above for Katingan) were restricted in the Shimada Model, and alternatively, we used the Ordinary Kriging method to re-classify these particular categories. More uniformly distributed sampling locations would improve the classification results.
Furthermore, because this methodology is based on vegetation activities in response to hydro-periods, the Shimada Model is limited to swamp vegetation covers, and currently is not valid for non-forest areas such as bare ground or grasslands.
A2.3. Methodological procedures
A2.3.1. Spatial analysis
Cloud- and haze-free remote sensing images are limited for the tropical regions. In order to reduce data gaps and improve interpretation,initial spatial analysis was conducted by using a combination of medium-resolution optical satellite images and Synthetic Aperture Radar (SAR) data (see Table A2) as well as empirical field data. SAR data, a microwave imaging system that is able to penetrate cloud cover regardless of day or night, provided interpretation on structural characteristics of different forest and land cover types. Optical satellite sensors, on the other hand, use visible, near and short-wave infrared sensors, and detect solar radiation reflected or scattered from the earth, forming images similar to photographs.
37
ICCC Peatland Definition and Peatland Mapping Methodology Assessment Report
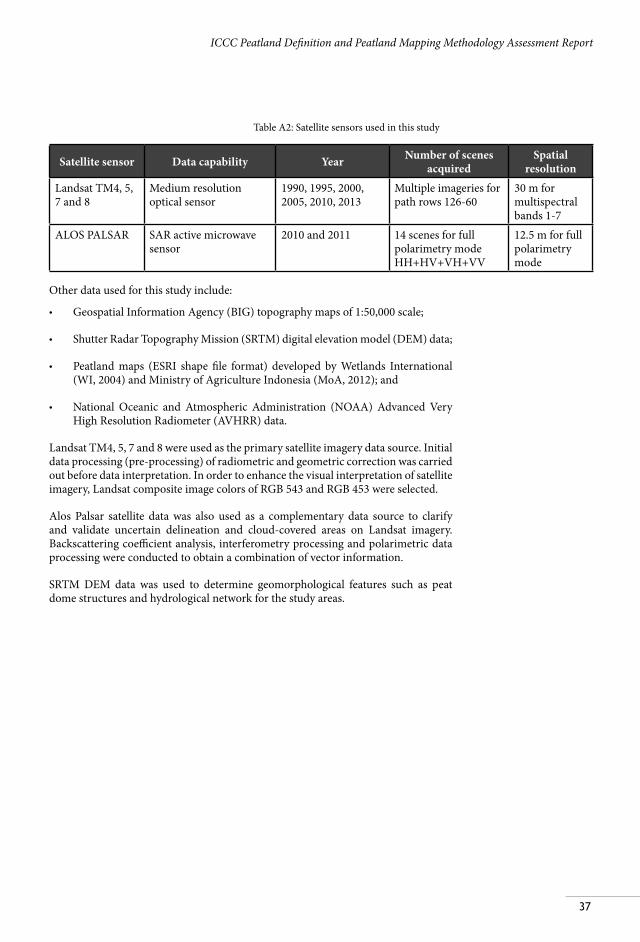
Table A2: Satellite sensors used in this study
Satellite sensor Data capability Year Number of scenes acquired
Spatial resolution
Landsat TM4, 5, 7 and 8
Medium resolution optical sensor
1990, 1995, 2000, 2005, 2010, 2013
Multiple imageries for path rows 126-60
30 m for multispectral bands 1-7
ALOS PALSAR SAR active microwave sensor
2010 and 2011 14 scenes for full polarimetry mode HH+HV+VH+VV
12.5 m for full polarimetry mode
Other data used for this study include:
• Geospatial Information Agency (BIG) topography maps of 1:50,000 scale;
• Shutter Radar Topography Mission (SRTM) digital elevation model (DEM) data;
• Peatland maps (ESRI shape file format) developed by Wetlands International (WI, 2004) and Ministry of Agriculture Indonesia (MoA, 2012); and
• National Oceanic and Atmospheric Administration (NOAA) Advanced Very High Resolution Radiometer (AVHRR) data.
Landsat TM4, 5, 7 and 8 were used as the primary satellite imagery data source. Initial data processing (pre-processing) of radiometric and geometric correction was carried out before data interpretation. In order to enhance the visual interpretation of satellite imagery, Landsat composite image colors of RGB 543 and RGB 453 were selected.
Alos Palsar satellite data was also used as a complementary data source to clarify and validate uncertain delineation and cloud-covered areas on Landsat imagery. Backscattering coefficient analysis, interferometry processing and polarimetric data processing were conducted to obtain a combination of vector information.
SRTM DEM data was used to determine geomorphological features such as peat dome structures and hydrological network for the study areas.
38
ICCC Peatland Definition and Peatland Mapping Methodology Assessment Report
A2.3.2. Sample data collection
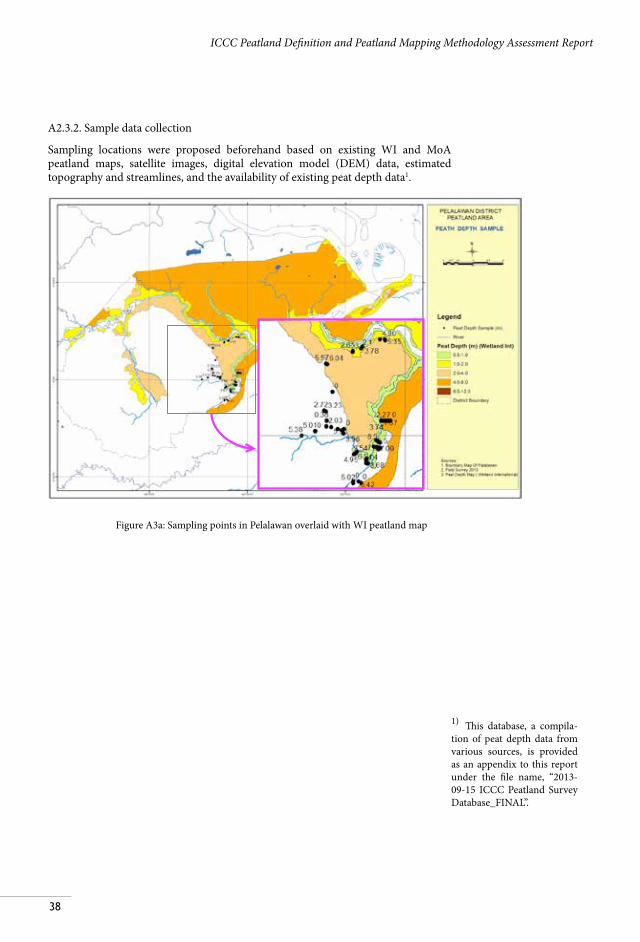
Sampling locations were proposed beforehand based on existing WI and MoA peatland maps, satellite images, digital elevation model (DEM) data, estimated topography and streamlines, and the availability of existing peat depth data1.
1) This database, a compila-tion of peat depth data from various sources, is provided as an appendix to this report under the file name, “2013-09-15 ICCC Peatland Survey Database_FINAL”.
Figure A3a: Sampling points in Pelalawan overlaid with WI peatland map
39
ICCC Peatland Definition and Peatland Mapping Methodology Assessment Report
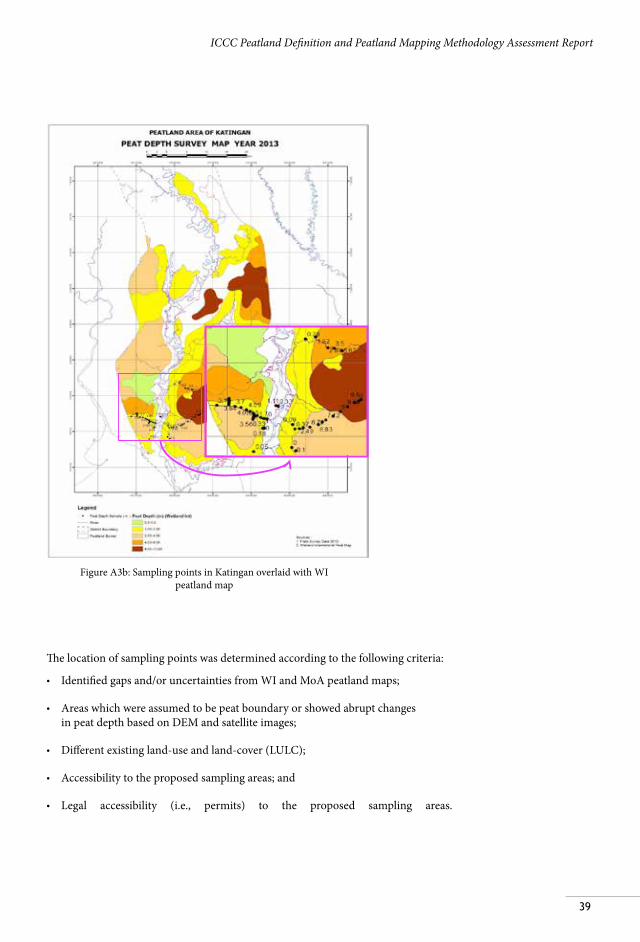
The location of sampling points was determined according to the following criteria:
• Identified gaps and/or uncertainties from WI and MoA peatland maps;
• Areas which were assumed to be peat boundary or showed abrupt changes in peat depth based on DEM and satellite images;
• Different existing land-use and land-cover (LULC);
• Accessibility to the proposed sampling areas; and
• Legal accessibility (i.e., permits) to the proposed sampling areas.
Figure A3b: Sampling points in Katingan overlaid with WI peatland map
40
ICCC Peatland Definition and Peatland Mapping Methodology Assessment Report
Above criteria were reviewed and determined by a remote sensing analysis prior to conducting field surveys. Further, field surveyors conducted a rapid observation to the surrounding areas. Based on findings from the remote sensing analysis and field observation, sampling points were determined and, whenever necessary, adjusted in the field. Total 50 sampling points were surveyed in Pelalawan District, and 51 plots in Katingan District (Figure A3a and A3b).
In this study, three types of field survey were conducted – peat thickness measurement, peat core sampling, and ground water table (GWT) measurement. Each survey was carried out in close collaboration with local people and universities.
A2.3.2.1. Peat thickness measurement
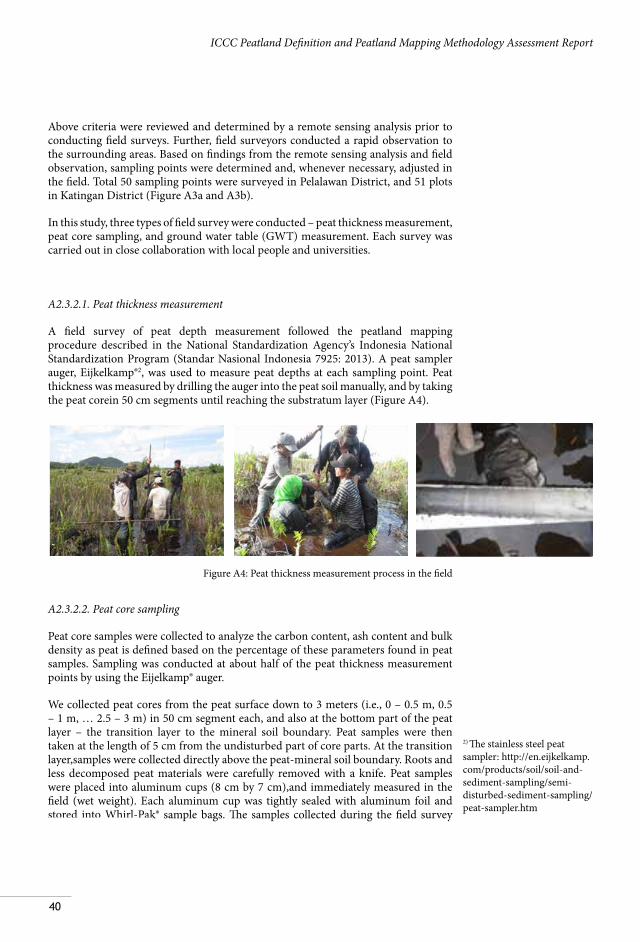
A field survey of peat depth measurement followed the peatland mapping procedure described in the National Standardization Agency’s Indonesia National Standardization Program (Standar Nasional Indonesia 7925: 2013). A peat sampler auger, Eijkelkamp®2, was used to measure peat depths at each sampling point. Peat thickness was measured by drilling the auger into the peat soil manually, and by taking the peat corein 50 cm segments until reaching the substratum layer (Figure A4).
Figure A4: Peat thickness measurement process in the field
A2.3.2.2. Peat core sampling
Peat core samples were collected to analyze the carbon content, ash content and bulk density as peat is defined based on the percentage of these parameters found in peat samples. Sampling was conducted at about half of the peat thickness measurement points by using the Eijelkamp® auger.
We collected peat cores from the peat surface down to 3 meters (i.e., 0 – 0.5 m, 0.5 – 1 m, … 2.5 – 3 m) in 50 cm segment each, and also at the bottom part of the peat layer – the transition layer to the mineral soil boundary. Peat samples were then taken at the length of 5 cm from the undisturbed part of core parts. At the transition layer,samples were collected directly above the peat-mineral soil boundary. Roots and less decomposed peat materials were carefully removed with a knife. Peat samples were placed into aluminum cups (8 cm by 7 cm),and immediately measured in the field (wet weight). Each aluminum cup was tightly sealed with aluminum foil and stored into Whirl-Pak® sample bags. The samples collected during the field survey
2) The stainless steel peat sampler: http://en.eijkelkamp.com/products/soil/soil-and-sediment-sampling/semi-disturbed-sediment-sampling/peat-sampler.htm
41
ICCC Peatland Definition and Peatland Mapping Methodology Assessment Report
were sent to Biotrop3 in Bogor, West Java, for a laboratory analysis of ash contents, bulk density and carbon contents in peat samples.
A2.3.3. Vegetation activity index
A simple supervised classification method based on previous research and the existing peat depth data4 were applied to estimate spatial trends of peat depths by swamp forest types. In this classification, multi-temporal normalized difference vegetation index (NDVI) values derived from National Oceanic and Atmospheric Administration (NOAA) Advanced Very High Resolution Radiometer (AVHRR) data were used to evaluate vegetation activities. In order to estimate accurate peatland depths and distribution in the study areas, the analysis was based on the land cover of the early 1990s, when peatland was relatively undisturbed and the original condition could be assessed. The following expression applies:
(1)
Where: NIR = near-infrared wavelength (Channel 2 of AVHRR) RED = the visible red wavelength (Channel 1 of AVHRR)
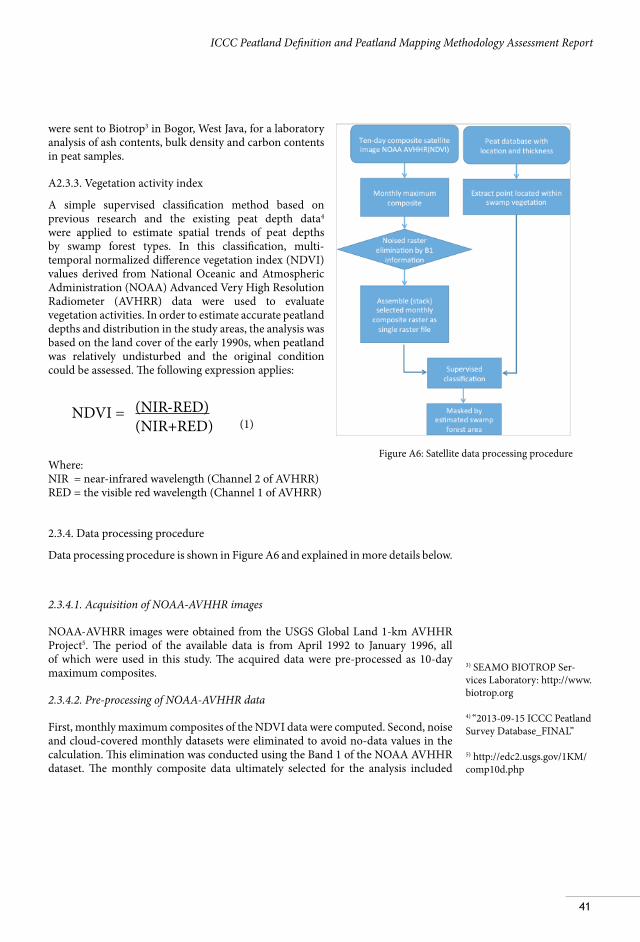
2.3.4. Data processing procedure
Data processing procedure is shown in Figure A6 and explained in more details below.
2.3.4.1. Acquisition of NOAA-AVHHR images
NOAA-AVHRR images were obtained from the USGS Global Land 1-km AVHHR Project5. The period of the available data is from April 1992 to January 1996, all of which were used in this study. The acquired data were pre-processed as 10-day maximum composites.
2.3.4.2. Pre-processing of NOAA-AVHHR data
First, monthly maximum composites of the NDVI data were computed. Second, noise and cloud-covered monthly datasets were eliminated to avoid no-data values in the calculation. This elimination was conducted using the Band 1 of the NOAA AVHHR dataset. The monthly composite data ultimately selected for the analysis included
NDVI = (NIR-RED)(NIR+RED)
Figure A6: Satellite data processing procedure
3) SEAMO BIOTROP Ser-vices Laboratory: http://www.biotrop.org
4) “2013-09-15 ICCC Peatland Survey Database_FINAL”
5) http://edc2.usgs.gov/1KM/comp10d.php
42
ICCC Peatland Definition and Peatland Mapping Methodology Assessment Report
17 months for Pelalawan and 22 months for Katingan Districts. Finally, monthly composite raster data were stacked (assembled) as multi-temporal raster files for classification.
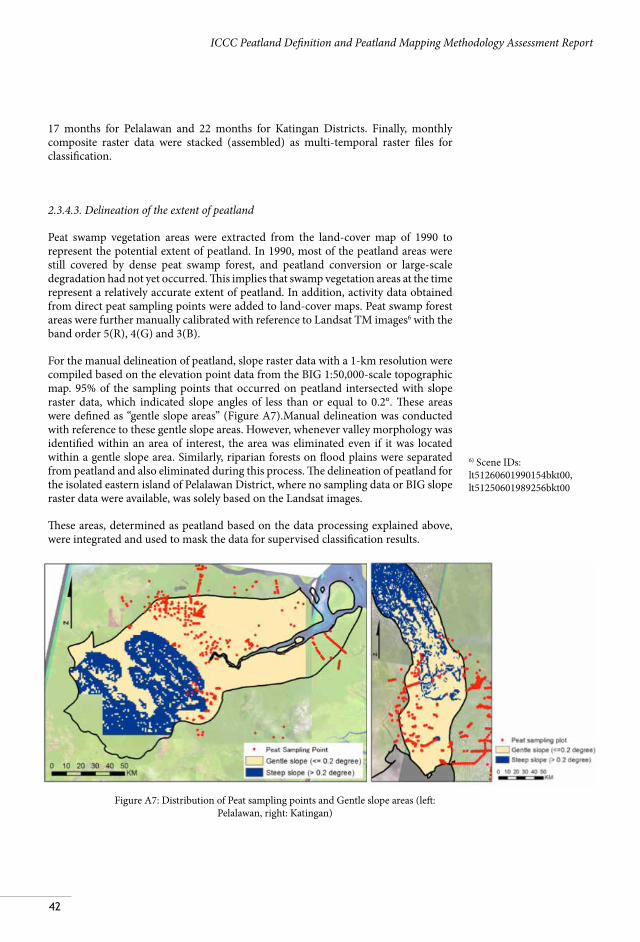
2.3.4.3. Delineation of the extent of peatland
Peat swamp vegetation areas were extracted from the land-cover map of 1990 to represent the potential extent of peatland. In 1990, most of the peatland areas were still covered by dense peat swamp forest, and peatland conversion or large-scale degradation had not yet occurred. This implies that swamp vegetation areas at the time represent a relatively accurate extent of peatland. In addition, activity data obtained from direct peat sampling points were added to land-cover maps. Peat swamp forest areas were further manually calibrated with reference to Landsat TM images6 with the band order 5(R), 4(G) and 3(B).
For the manual delineation of peatland, slope raster data with a 1-km resolution were compiled based on the elevation point data from the BIG 1:50,000-scale topographic map. 95% of the sampling points that occurred on peatland intersected with slope raster data, which indicated slope angles of less than or equal to 0.2°. These areas were defined as “gentle slope areas” (Figure A7).Manual delineation was conducted with reference to these gentle slope areas. However, whenever valley morphology was identified within an area of interest, the area was eliminated even if it was located within a gentle slope area. Similarly, riparian forests on flood plains were separated from peatland and also eliminated during this process. The delineation of peatland for the isolated eastern island of Pelalawan District, where no sampling data or BIG slope raster data were available, was solely based on the Landsat images.
These areas, determined as peatland based on the data processing explained above, were integrated and used to mask the data for supervised classification results.
6) Scene IDs: lt51260601990154bkt00, lt51250601989256bkt00
Figure A7: Distribution of Peat sampling points and Gentle slope areas (left: Pelalawan, right: Katingan)
43
ICCC Peatland Definition and Peatland Mapping Methodology Assessment Report
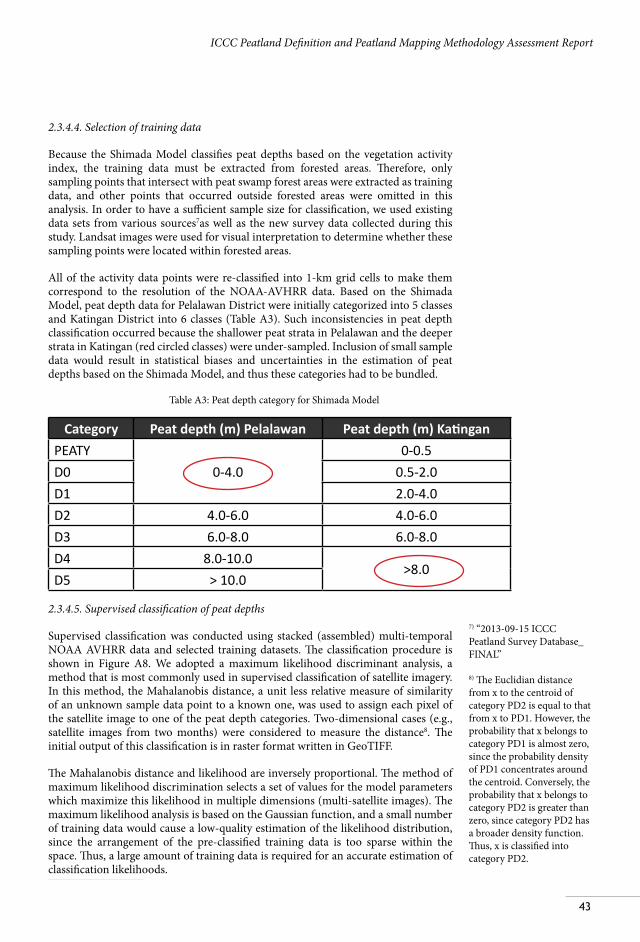
2.3.4.4. Selection of training data
Because the Shimada Model classifies peat depths based on the vegetation activity index, the training data must be extracted from forested areas. Therefore, only sampling points that intersect with peat swamp forest areas were extracted as training data, and other points that occurred outside forested areas were omitted in this analysis. In order to have a sufficient sample size for classification, we used existing data sets from various sources7as well as the new survey data collected during this study. Landsat images were used for visual interpretation to determine whether these sampling points were located within forested areas.
All of the activity data points were re-classified into 1-km grid cells to make them correspond to the resolution of the NOAA-AVHRR data. Based on the Shimada Model, peat depth data for Pelalawan District were initially categorized into 5 classes and Katingan District into 6 classes (Table A3). Such inconsistencies in peat depth classification occurred because the shallower peat strata in Pelalawan and the deeper strata in Katingan (red circled classes) were under-sampled. Inclusion of small sample data would result in statistical biases and uncertainties in the estimation of peat depths based on the Shimada Model, and thus these categories had to be bundled.
Table A3: Peat depth category for Shimada Model
Category Peat depth (m) Pelalawan Peat depth (m) KatinganPEATY
0-4.00-0.5
D0 0.5-2.0D1 2.0-4.0D2 4.0-6.0 4.0-6.0D3 6.0-8.0 6.0-8.0D4 8.0-10.0
>8.0D5 > 10.0
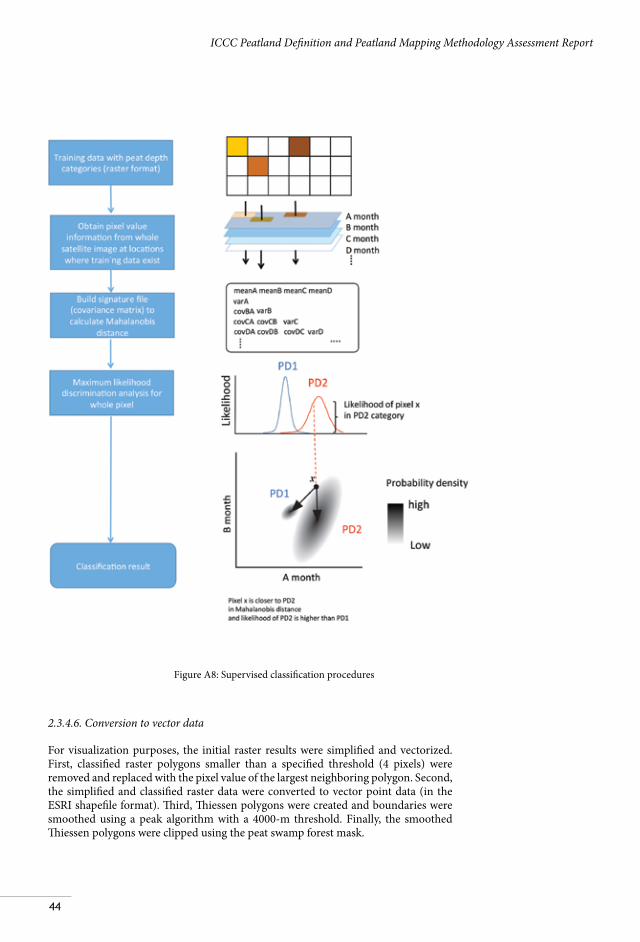
2.3.4.5. Supervised classification of peat depths
Supervised classification was conducted using stacked (assembled) multi-temporal NOAA AVHRR data and selected training datasets. The classification procedure is shown in Figure A8. We adopted a maximum likelihood discriminant analysis, a method that is most commonly used in supervised classification of satellite imagery. In this method, the Mahalanobis distance, a unit less relative measure of similarity of an unknown sample data point to a known one, was used to assign each pixel of the satellite image to one of the peat depth categories. Two-dimensional cases (e.g., satellite images from two months) were considered to measure the distance8. The initial output of this classification is in raster format written in GeoTIFF.
The Mahalanobis distance and likelihood are inversely proportional. The method of maximum likelihood discrimination selects a set of values for the model parameters which maximize this likelihood in multiple dimensions (multi-satellite images). The maximum likelihood analysis is based on the Gaussian function, and a small number of training data would cause a low-quality estimation of the likelihood distribution, since the arrangement of the pre-classified training data is too sparse within the space. Thus, a large amount of training data is required for an accurate estimation of classification likelihoods.
7) “2013-09-15 ICCC Peatland Survey Database_FINAL”
8) The Euclidian distance from x to the centroid of category PD2 is equal to that from x to PD1. However, the probability that x belongs to category PD1 is almost zero, since the probability density of PD1 concentrates around the centroid. Conversely, the probability that x belongs to category PD2 is greater than zero, since category PD2 has a broader density function. Thus, x is classified into category PD2.
44
ICCC Peatland Definition and Peatland Mapping Methodology Assessment Report
Figure A8: Supervised classification procedures
2.3.4.6. Conversion to vector data
For visualization purposes, the initial raster results were simplified and vectorized. First, classified raster polygons smaller than a specified threshold (4 pixels) were removed and replaced with the pixel value of the largest neighboring polygon. Second, the simplified and classified raster data were converted to vector point data (in the ESRI shapefile format). Third, Thiessen polygons were created and boundaries were smoothed using a peak algorithm with a 4000-m threshold. Finally, the smoothed Thiessen polygons were clipped using the peat swamp forest mask.
45
ICCC Peatland Definition and Peatland Mapping Methodology Assessment Report
2.3.4.7. Re-classification into detailed peat depth categories
Further to develop peatland maps, classifications used by the Shimada Model (5 for Pelalawan; 6 for Katingan) were divided into more detailed and consistent peat depth categories. An interpolation technique, known as Ordinary Kriging, was adopted in this process. This method allows the prediction of values for unmeasured locations based on the spatial analysis of the distance between measured points and their relationships to the distance. Thus, by combining two techniques, the Shimada Model and Kriging, this study ultimately classified peat depths into 7 categories for both Pelalawan and Katingan districts (Table A4).
Table A4: Peat depth category by a combination of Shimada Model and Kriging adopted in this study
Category Peat depth (m) Category Peat depth (m)PEATY 0-0.5 D3 6.0-8.0
D0 0.5-2.0 D4 8.0-10.0D1 2.0-4.0 D5 > 10.0D2 4.0-6.0
2.3.5. Software
For satellite data processing and analysis, Grass GIS 6.4 RC3 (GRASS Development Team, 2013), Quantum GIS 1.8 (Quantum GIS Development Team, 2013), and R 2.14.2 were used.
A3. Results and Discussions
A3.1. Results of spatial analysis
A3.1.1. Review of existing peatland maps
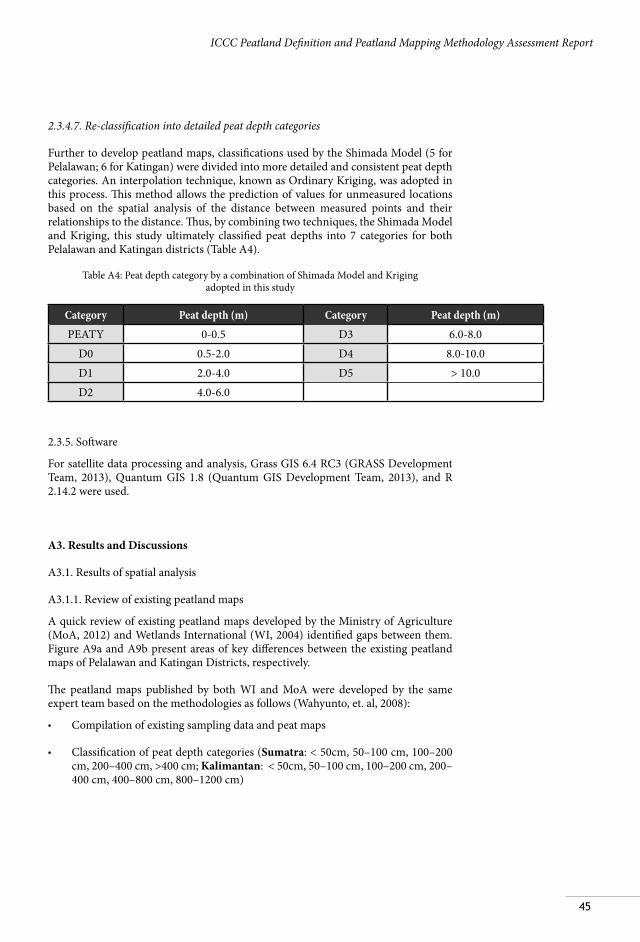
A quick review of existing peatland maps developed by the Ministry of Agriculture (MoA, 2012) and Wetlands International (WI, 2004) identified gaps between them. Figure A9a and A9b present areas of key differences between the existing peatland maps of Pelalawan and Katingan Districts, respectively.
The peatland maps published by both WI and MoA were developed by the same expert team based on the methodologies as follows (Wahyunto, et. al, 2008):
• Compilation of existing sampling data and peat maps
• Classification of peat depth categories (Sumatra: < 50cm, 50–100 cm, 100–200 cm, 200–400 cm, >400 cm; Kalimantan: < 50cm, 50–100 cm, 100–200 cm, 200–400 cm, 400–800 cm, 800–1200 cm)
46
ICCC Peatland Definition and Peatland Mapping Methodology Assessment Report
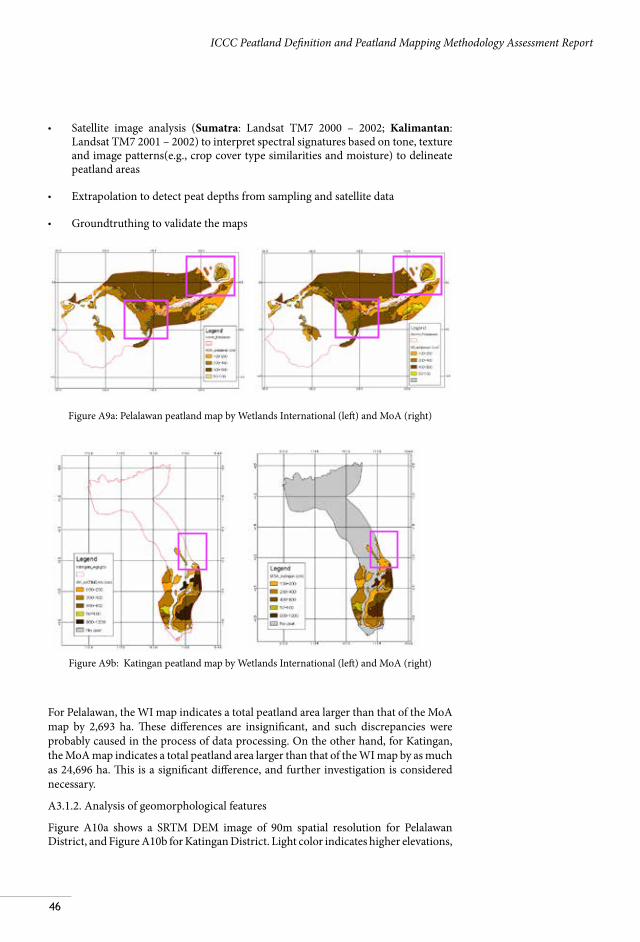
• Satellite image analysis (Sumatra: Landsat TM7 2000 – 2002; Kalimantan: Landsat TM7 2001 – 2002) to interpret spectral signatures based on tone, texture and image patterns(e.g., crop cover type similarities and moisture) to delineate peatland areas
• Extrapolation to detect peat depths from sampling and satellite data
• Groundtruthing to validate the maps
Figure A9a: Pelalawan peatland map by Wetlands International (left) and MoA (right)
Figure A9b: Katingan peatland map by Wetlands International (left) and MoA (right)
For Pelalawan, the WI map indicates a total peatland area larger than that of the MoA map by 2,693 ha. These differences are insignificant, and such discrepancies were probably caused in the process of data processing. On the other hand, for Katingan, the MoA map indicates a total peatland area larger than that of the WI map by as much as 24,696 ha. This is a significant difference, and further investigation is considered necessary.
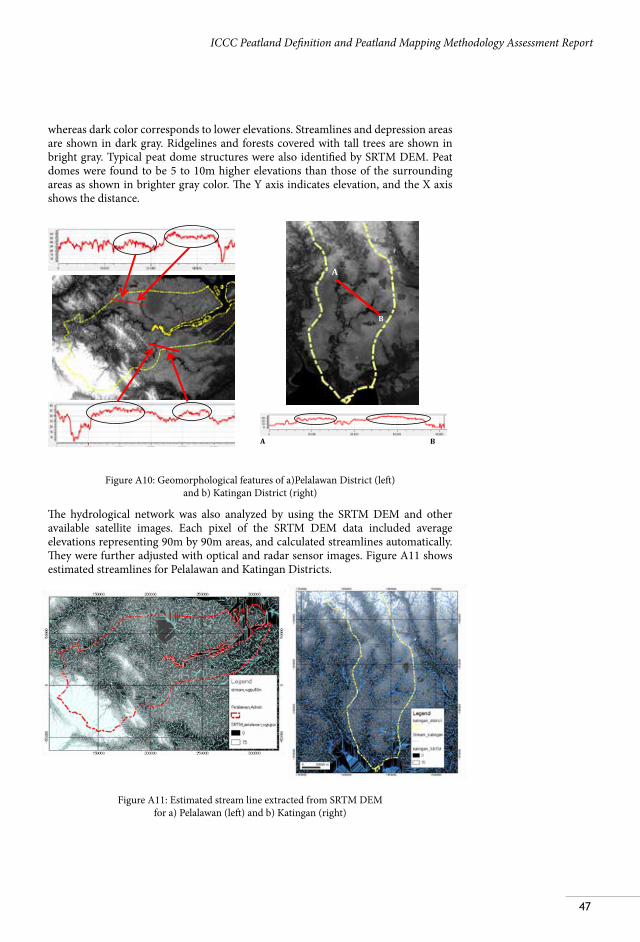
A3.1.2. Analysis of geomorphological features
Figure A10a shows a SRTM DEM image of 90m spatial resolution for Pelalawan District, and Figure A10b for Katingan District. Light color indicates higher elevations,
47
ICCC Peatland Definition and Peatland Mapping Methodology Assessment Report
whereas dark color corresponds to lower elevations. Streamlines and depression areas are shown in dark gray. Ridgelines and forests covered with tall trees are shown in bright gray. Typical peat dome structures were also identified by SRTM DEM. Peat domes were found to be 5 to 10m higher elevations than those of the surrounding areas as shown in brighter gray color. The Y axis indicates elevation, and the X axis shows the distance.
Figure A10: Geomorphological features of a)Pelalawan District (left) and b) Katingan District (right)
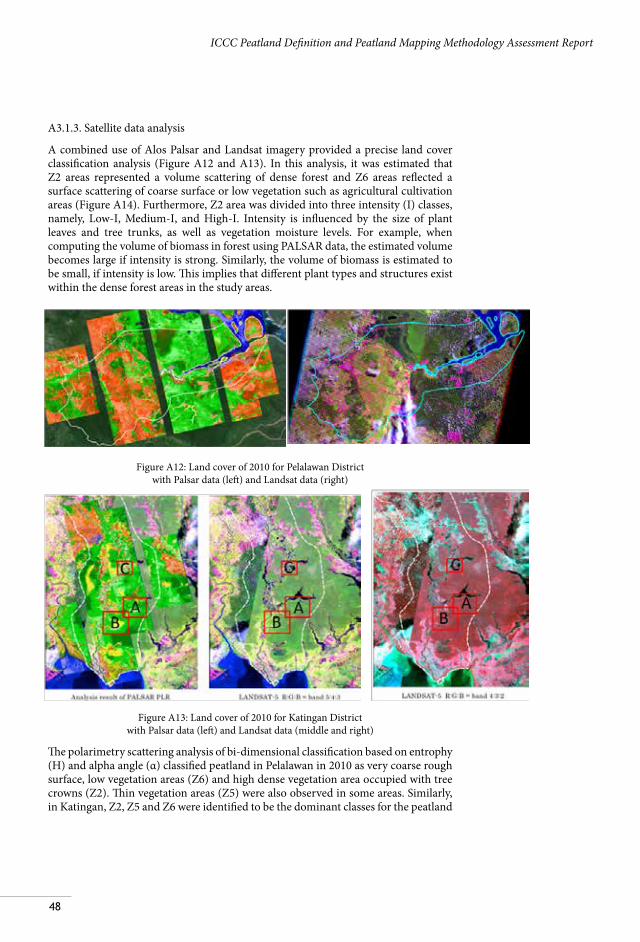
The hydrological network was also analyzed by using the SRTM DEM and other available satellite images. Each pixel of the SRTM DEM data included average elevations representing 90m by 90m areas, and calculated streamlines automatically. They were further adjusted with optical and radar sensor images. Figure A11 shows estimated streamlines for Pelalawan and Katingan Districts.
Figure A11: Estimated stream line extracted from SRTM DEM for a) Pelalawan (left) and b) Katingan (right)
A
B
A B
48
ICCC Peatland Definition and Peatland Mapping Methodology Assessment Report
A3.1.3. Satellite data analysis
A combined use of Alos Palsar and Landsat imagery provided a precise land cover classification analysis (Figure A12 and A13). In this analysis, it was estimated that Z2 areas represented a volume scattering of dense forest and Z6 areas reflected a surface scattering of coarse surface or low vegetation such as agricultural cultivation areas (Figure A14). Furthermore, Z2 area was divided into three intensity (I) classes, namely, Low-I, Medium-I, and High-I. Intensity is influenced by the size of plant leaves and tree trunks, as well as vegetation moisture levels. For example, when computing the volume of biomass in forest using PALSAR data, the estimated volume becomes large if intensity is strong. Similarly, the volume of biomass is estimated to be small, if intensity is low. This implies that different plant types and structures exist within the dense forest areas in the study areas.
Figure A12: Land cover of 2010 for Pelalawan District with Palsar data (left) and Landsat data (right)
Figure A13: Land cover of 2010 for Katingan District with Palsar data (left) and Landsat data (middle and right)
The polarimetry scattering analysis of bi-dimensional classification based on entrophy (H) and alpha angle (α) classified peatland in Pelalawan in 2010 as very coarse rough surface, low vegetation areas (Z6) and high dense vegetation area occupied with tree crowns (Z2). Thin vegetation areas (Z5) were also observed in some areas. Similarly, in Katingan, Z2, Z5 and Z6 were identified to be the dominant classes for the peatland
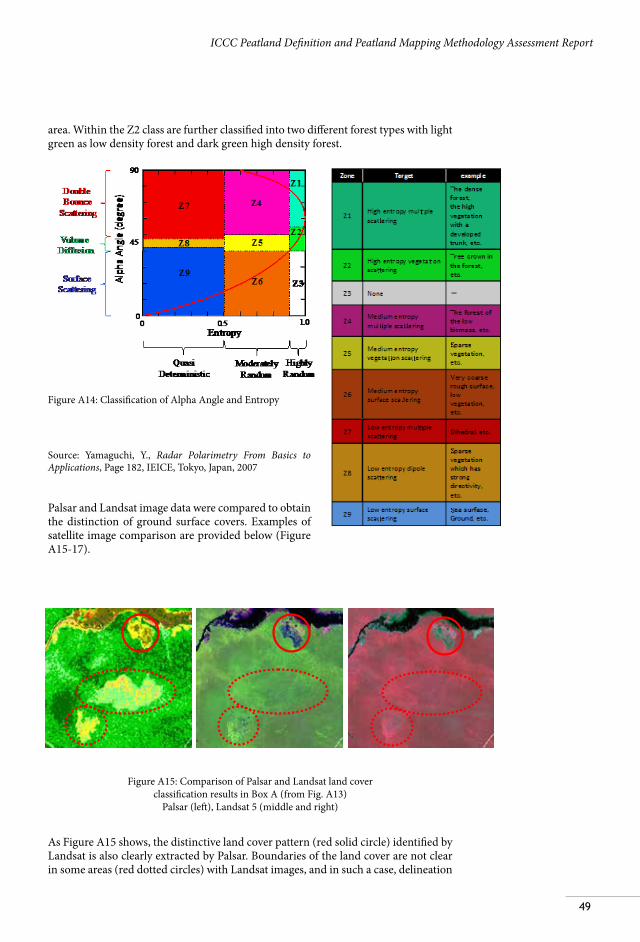
49
ICCC Peatland Definition and Peatland Mapping Methodology Assessment Report
area. Within the Z2 class are further classified into two different forest types with light green as low density forest and dark green high density forest.
Figure A14: Classification of Alpha Angle and Entropy
Source: Yamaguchi, Y., Radar Polarimetry From Basics to Applications, Page 182, IEICE, Tokyo, Japan, 2007
Palsar and Landsat image data were compared to obtain the distinction of ground surface covers. Examples of satellite image comparison are provided below (Figure A15-17).
Figure A15: Comparison of Palsar and Landsat land cover classification results in Box A (from Fig. A13)
Palsar (left), Landsat 5 (middle and right)
As Figure A15 shows, the distinctive land cover pattern (red solid circle) identified by Landsat is also clearly extracted by Palsar. Boundaries of the land cover are not clear in some areas (red dotted circles) with Landsat images, and in such a case, delineation
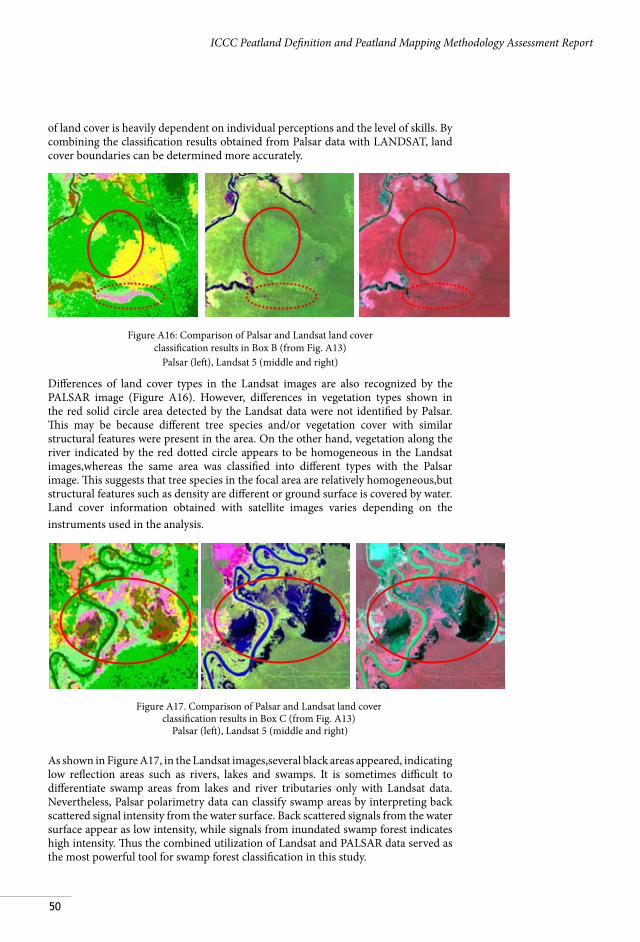
50
ICCC Peatland Definition and Peatland Mapping Methodology Assessment Report
of land cover is heavily dependent on individual perceptions and the level of skills. By combining the classification results obtained from Palsar data with LANDSAT, land cover boundaries can be determined more accurately.
Figure A16: Comparison of Palsar and Landsat land cover classification results in Box B (from Fig. A13)
Palsar (left), Landsat 5 (middle and right)
Differences of land cover types in the Landsat images are also recognized by the PALSAR image (Figure A16). However, differences in vegetation types shown in the red solid circle area detected by the Landsat data were not identified by Palsar. This may be because different tree species and/or vegetation cover with similar structural features were present in the area. On the other hand, vegetation along the river indicated by the red dotted circle appears to be homogeneous in the Landsat images,whereas the same area was classified into different types with the Palsar image. This suggests that tree species in the focal area are relatively homogeneous,but structural features such as density are different or ground surface is covered by water. Land cover information obtained with satellite images varies depending on the instruments used in the analysis.
As shown in Figure A17, in the Landsat images,several black areas appeared, indicating low reflection areas such as rivers, lakes and swamps. It is sometimes difficult to differentiate swamp areas from lakes and river tributaries only with Landsat data. Nevertheless, Palsar polarimetry data can classify swamp areas by interpreting back scattered signal intensity from the water surface. Back scattered signals from the water surface appear as low intensity, while signals from inundated swamp forest indicates high intensity. Thus the combined utilization of Landsat and PALSAR data served as the most powerful tool for swamp forest classification in this study.
Figure A17. Comparison of Palsar and Landsat land cover classification results in Box C (from Fig. A13)
Palsar (left), Landsat 5 (middle and right)
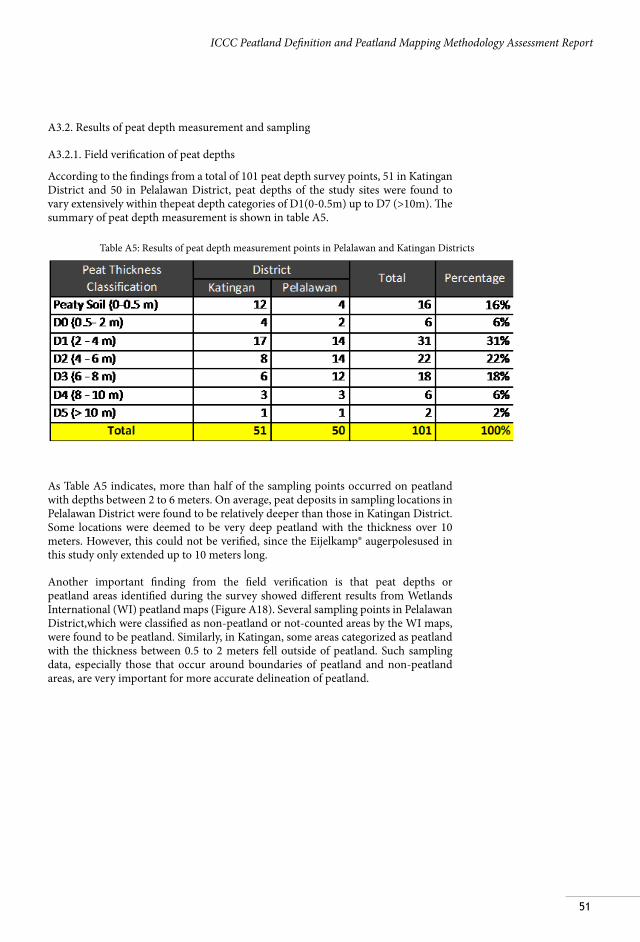
51
ICCC Peatland Definition and Peatland Mapping Methodology Assessment Report
A3.2. Results of peat depth measurement and sampling
A3.2.1. Field verification of peat depths
According to the findings from a total of 101 peat depth survey points, 51 in Katingan District and 50 in Pelalawan District, peat depths of the study sites were found to vary extensively within thepeat depth categories of D1(0-0.5m) up to D7 (>10m). The summary of peat depth measurement is shown in table A5.
As Table A5 indicates, more than half of the sampling points occurred on peatland with depths between 2 to 6 meters. On average, peat deposits in sampling locations in Pelalawan District were found to be relatively deeper than those in Katingan District. Some locations were deemed to be very deep peatland with the thickness over 10 meters. However, this could not be verified, since the Eijelkamp® augerpolesused in this study only extended up to 10 meters long.
Another important finding from the field verification is that peat depths or peatland areas identified during the survey showed different results from Wetlands International (WI) peatland maps (Figure A18). Several sampling points in Pelalawan District,which were classified as non-peatland or not-counted areas by the WI maps, were found to be peatland. Similarly, in Katingan, some areas categorized as peatland with the thickness between 0.5 to 2 meters fell outside of peatland. Such sampling data, especially those that occur around boundaries of peatland and non-peatland areas, are very important for more accurate delineation of peatland.
Table A5: Results of peat depth measurement points in Pelalawan and Katingan Districts
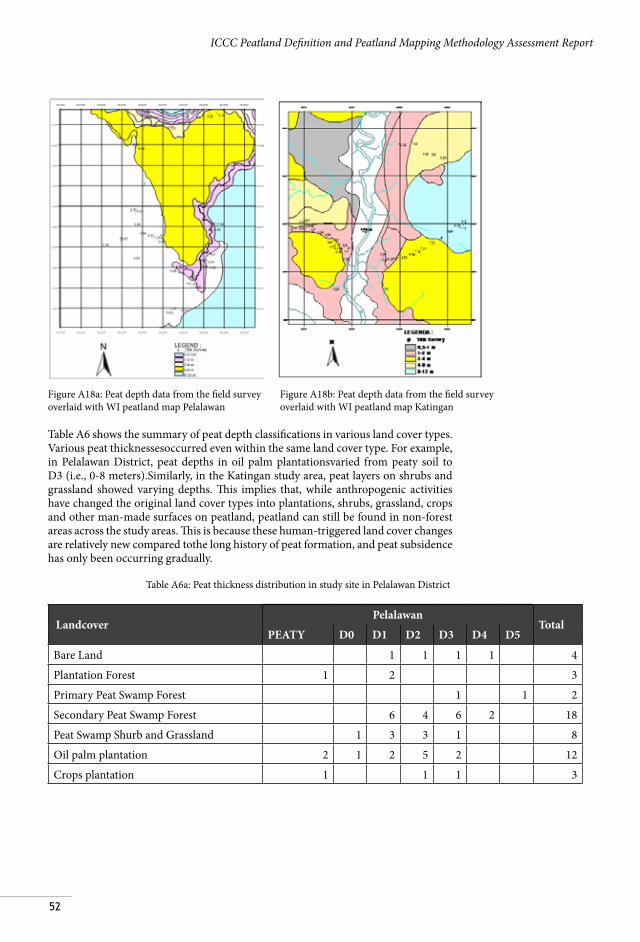
52
ICCC Peatland Definition and Peatland Mapping Methodology Assessment Report
Table A6 shows the summary of peat depth classifications in various land cover types. Various peat thicknessesoccurred even within the same land cover type. For example, in Pelalawan District, peat depths in oil palm plantationsvaried from peaty soil to D3 (i.e., 0-8 meters).Similarly, in the Katingan study area, peat layers on shrubs and grassland showed varying depths. This implies that, while anthropogenic activities have changed the original land cover types into plantations, shrubs, grassland, crops and other man-made surfaces on peatland, peatland can still be found in non-forest areas across the study areas. This is because these human-triggered land cover changes are relatively new compared tothe long history of peat formation, and peat subsidence has only been occurring gradually.
Table A6a: Peat thickness distribution in study site in Pelalawan District
Figure A18a: Peat depth data from the field survey overlaid with WI peatland map Pelalawan
Figure A18b: Peat depth data from the field survey overlaid with WI peatland map Katingan
LandcoverPelalawan
TotalPEATY D0 D1 D2 D3 D4 D5
Bare Land 1 1 1 1 4
Plantation Forest 1 2 3
Primary Peat Swamp Forest 1 1 2
Secondary Peat Swamp Forest 6 4 6 2 18
Peat Swamp Shurb and Grassland 1 3 3 1 8
Oil palm plantation 2 1 2 5 2 12
Crops plantation 1 1 1 3
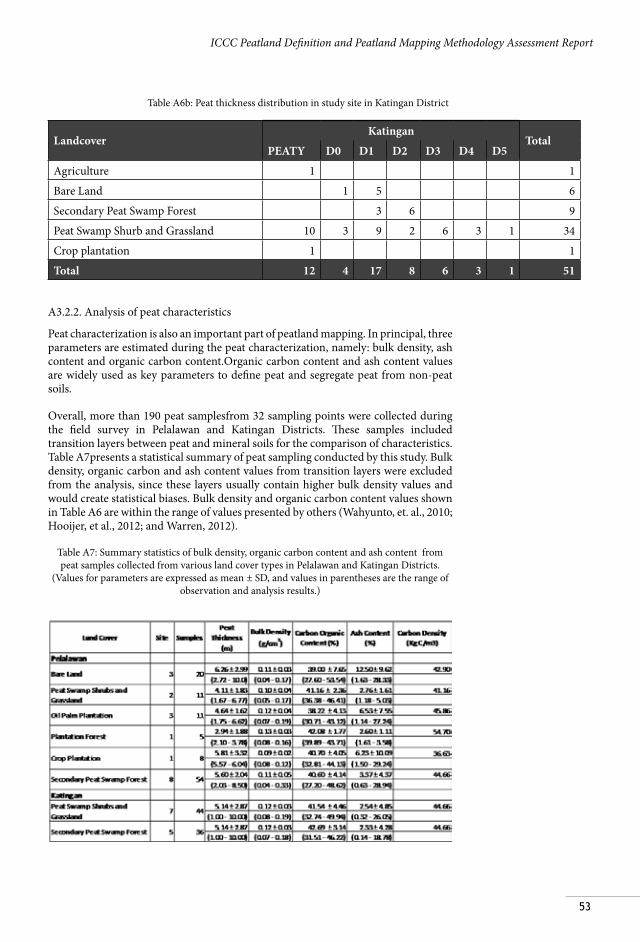
53
ICCC Peatland Definition and Peatland Mapping Methodology Assessment Report
Table A6b: Peat thickness distribution in study site in Katingan District
LandcoverKatingan
TotalPEATY D0 D1 D2 D3 D4 D5
Agriculture 1 1
Bare Land 1 5 6
Secondary Peat Swamp Forest 3 6 9
Peat Swamp Shurb and Grassland 10 3 9 2 6 3 1 34
Crop plantation 1 1
Total 12 4 17 8 6 3 1 51
A3.2.2. Analysis of peat characteristics
Peat characterization is also an important part of peatland mapping. In principal, three parameters are estimated during the peat characterization, namely: bulk density, ash content and organic carbon content.Organic carbon content and ash content values are widely used as key parameters to define peat and segregate peat from non-peat soils.
Overall, more than 190 peat samplesfrom 32 sampling points were collected during the field survey in Pelalawan and Katingan Districts. These samples included transition layers between peat and mineral soils for the comparison of characteristics. Table A7presents a statistical summary of peat sampling conducted by this study. Bulk density, organic carbon and ash content values from transition layers were excluded from the analysis, since these layers usually contain higher bulk density values and would create statistical biases. Bulk density and organic carbon content values shown in Table A6 are within the range of values presented by others (Wahyunto, et. al., 2010; Hooijer, et al., 2012; and Warren, 2012).
Table A7: Summary statistics of bulk density, organic carbon content and ash content from peat samples collected from various land cover types in Pelalawan and Katingan Districts.
(Values for parameters are expressed as mean ± SD, and values in parentheses are the range of observation and analysis results.)
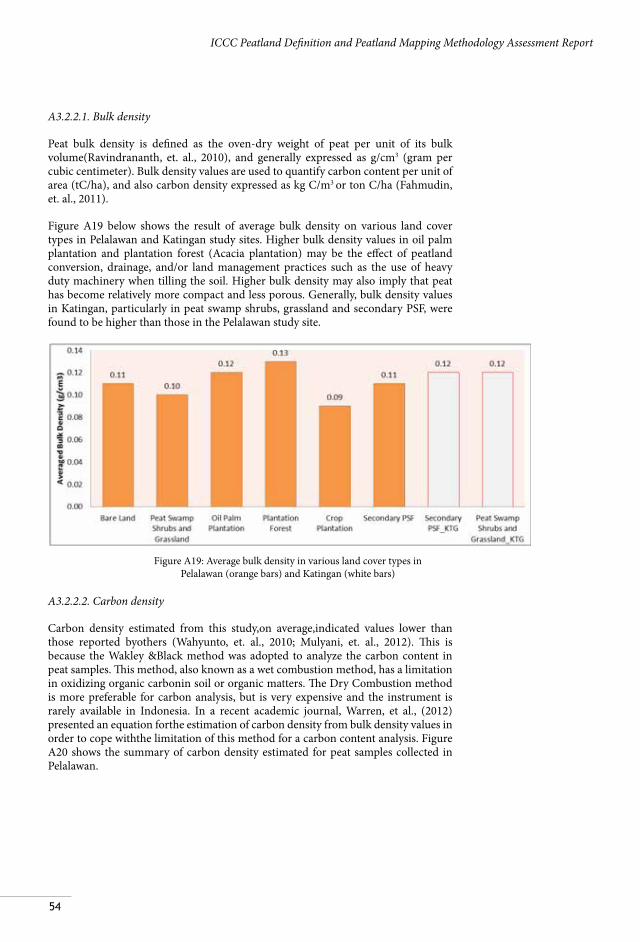
54
ICCC Peatland Definition and Peatland Mapping Methodology Assessment Report
A3.2.2.1. Bulk density
Peat bulk density is defined as the oven-dry weight of peat per unit of its bulk volume(Ravindrananth, et. al., 2010), and generally expressed as g/cm3 (gram per cubic centimeter). Bulk density values are used to quantify carbon content per unit of area (tC/ha), and also carbon density expressed as kg C/m3 or ton C/ha (Fahmudin, et. al., 2011).
Figure A19 below shows the result of average bulk density on various land cover types in Pelalawan and Katingan study sites. Higher bulk density values in oil palm plantation and plantation forest (Acacia plantation) may be the effect of peatland conversion, drainage, and/or land management practices such as the use of heavy duty machinery when tilling the soil. Higher bulk density may also imply that peat has become relatively more compact and less porous. Generally, bulk density values in Katingan, particularly in peat swamp shrubs, grassland and secondary PSF, were found to be higher than those in the Pelalawan study site.
A3.2.2.2. Carbon density
Carbon density estimated from this study,on average,indicated values lower than those reported byothers (Wahyunto, et. al., 2010; Mulyani, et. al., 2012). This is because the Wakley &Black method was adopted to analyze the carbon content in peat samples. This method, also known as a wet combustion method, has a limitation in oxidizing organic carbonin soil or organic matters. The Dry Combustion method is more preferable for carbon analysis, but is very expensive and the instrument is rarely available in Indonesia. In a recent academic journal, Warren, et al., (2012) presented an equation forthe estimation of carbon density from bulk density values in order to cope withthe limitation of this method for a carbon content analysis. Figure A20 shows the summary of carbon density estimated for peat samples collected in Pelalawan.
Figure A19: Average bulk density in various land cover types in Pelalawan (orange bars) and Katingan (white bars)
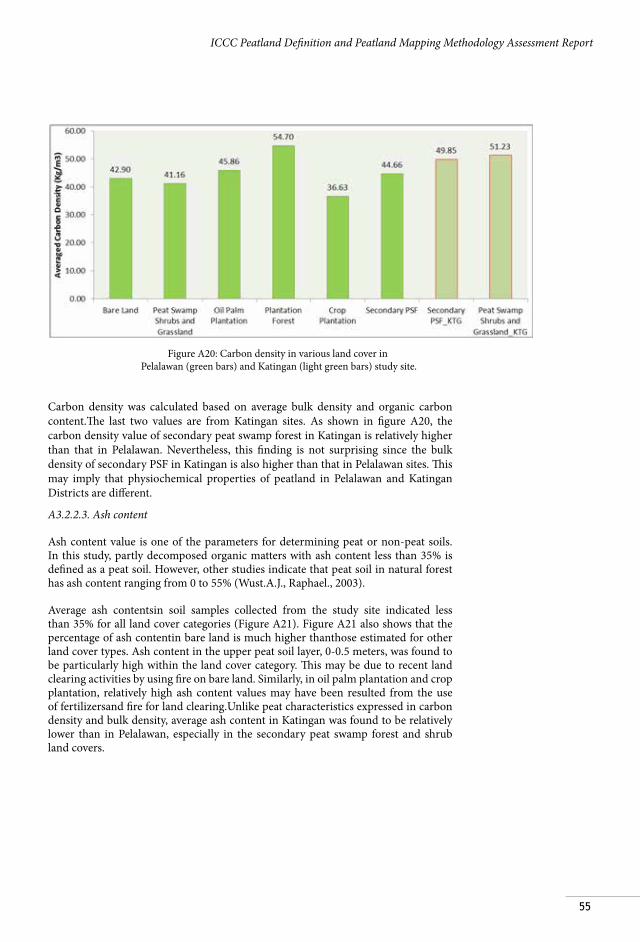
55
ICCC Peatland Definition and Peatland Mapping Methodology Assessment Report
Carbon density was calculated based on average bulk density and organic carbon content.The last two values are from Katingan sites. As shown in figure A20, the carbon density value of secondary peat swamp forest in Katingan is relatively higher than that in Pelalawan. Nevertheless, this finding is not surprising since the bulk density of secondary PSF in Katingan is also higher than that in Pelalawan sites. This may imply that physiochemical properties of peatland in Pelalawan and Katingan Districts are different.
A3.2.2.3. Ash content
Ash content value is one of the parameters for determining peat or non-peat soils. In this study, partly decomposed organic matters with ash content less than 35% is defined as a peat soil. However, other studies indicate that peat soil in natural forest has ash content ranging from 0 to 55% (Wust.A.J., Raphael., 2003).
Average ash contentsin soil samples collected from the study site indicated less than 35% for all land cover categories (Figure A21). Figure A21 also shows that the percentage of ash contentin bare land is much higher thanthose estimated for other land cover types. Ash content in the upper peat soil layer, 0-0.5 meters, was found to be particularly high within the land cover category. This may be due to recent land clearing activities by using fire on bare land. Similarly, in oil palm plantation and crop plantation, relatively high ash content values may have been resulted from the use of fertilizersand fire for land clearing.Unlike peat characteristics expressed in carbon density and bulk density, average ash content in Katingan was found to be relatively lower than in Pelalawan, especially in the secondary peat swamp forest and shrub land covers.
Figure A20: Carbon density in various land cover in Pelalawan (green bars) and Katingan (light green bars) study site.
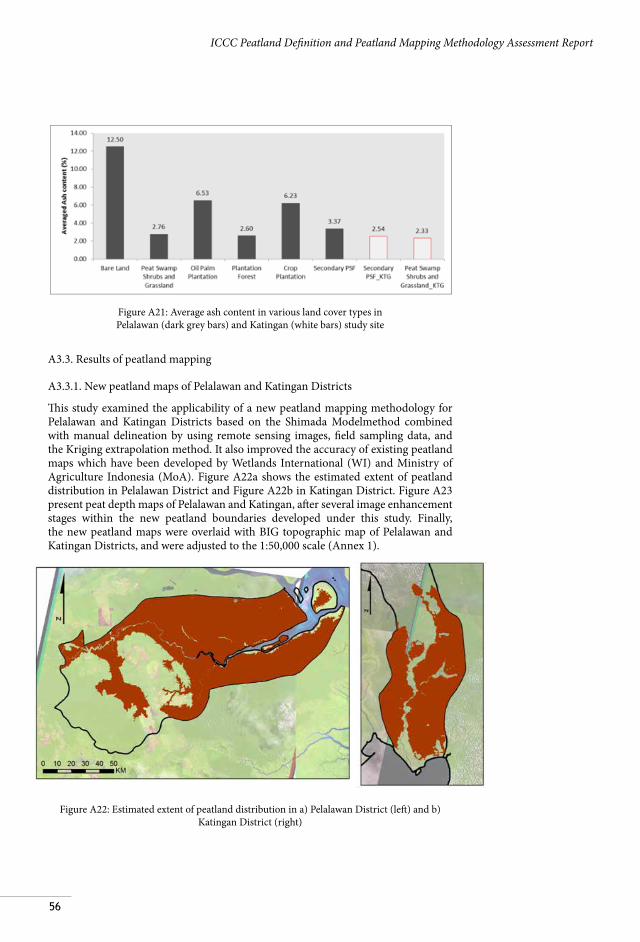
56
ICCC Peatland Definition and Peatland Mapping Methodology Assessment Report
A3.3. Results of peatland mapping
A3.3.1. New peatland maps of Pelalawan and Katingan Districts
This study examined the applicability of a new peatland mapping methodology for Pelalawan and Katingan Districts based on the Shimada Modelmethod combined with manual delineation by using remote sensing images, field sampling data, and the Kriging extrapolation method. It also improved the accuracy of existing peatland maps which have been developed by Wetlands International (WI) and Ministry of Agriculture Indonesia (MoA). Figure A22a shows the estimated extent of peatland distribution in Pelalawan District and Figure A22b in Katingan District. Figure A23 present peat depth maps of Pelalawan and Katingan, after several image enhancement stages within the new peatland boundaries developed under this study. Finally, the new peatland maps were overlaid with BIG topographic map of Pelalawan and Katingan Districts, and were adjusted to the 1:50,000 scale (Annex 1).
Figure A22: Estimated extent of peatland distribution in a) Pelalawan District (left) and b) Katingan District (right)
Figure A21: Average ash content in various land cover types in Pelalawan (dark grey bars) and Katingan (white bars) study site
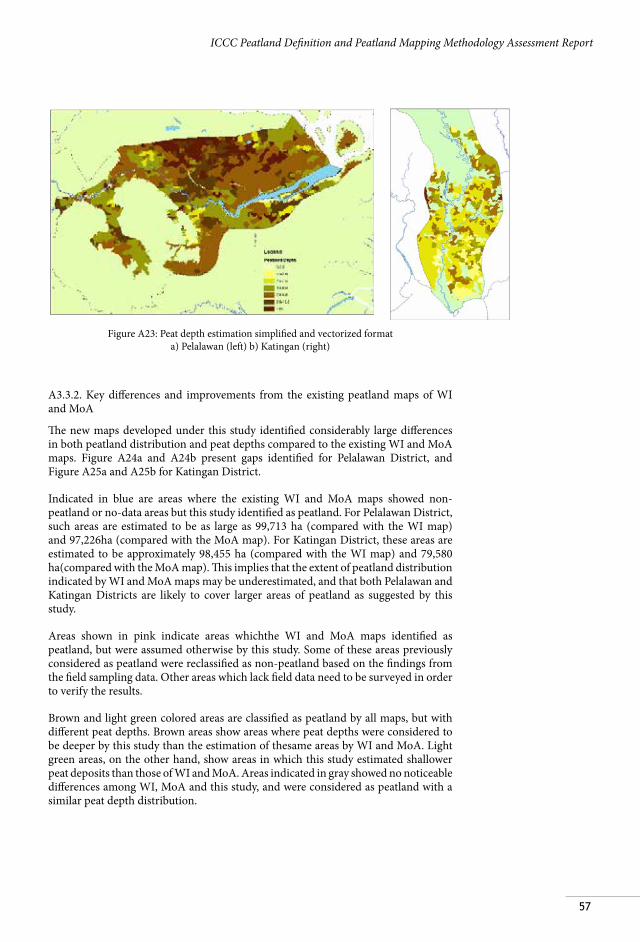
57
ICCC Peatland Definition and Peatland Mapping Methodology Assessment Report
Figure A23: Peat depth estimation simplified and vectorized format a) Pelalawan (left) b) Katingan (right)
A3.3.2. Key differences and improvements from the existing peatland maps of WI and MoA
The new maps developed under this study identified considerably large differences in both peatland distribution and peat depths compared to the existing WI and MoA maps. Figure A24a and A24b present gaps identified for Pelalawan District, and Figure A25a and A25b for Katingan District.
Indicated in blue are areas where the existing WI and MoA maps showed non-peatland or no-data areas but this study identified as peatland. For Pelalawan District, such areas are estimated to be as large as 99,713 ha (compared with the WI map) and 97,226ha (compared with the MoA map). For Katingan District, these areas are estimated to be approximately 98,455 ha (compared with the WI map) and 79,580 ha(compared with the MoA map). This implies that the extent of peatland distribution indicated by WI and MoA maps may be underestimated, and that both Pelalawan and Katingan Districts are likely to cover larger areas of peatland as suggested by this study.
Areas shown in pink indicate areas whichthe WI and MoA maps identified as peatland, but were assumed otherwise by this study. Some of these areas previously considered as peatland were reclassified as non-peatland based on the findings from the field sampling data. Other areas which lack field data need to be surveyed in order to verify the results.
Brown and light green colored areas are classified as peatland by all maps, but with different peat depths. Brown areas show areas where peat depths were considered to be deeper by this study than the estimation of thesame areas by WI and MoA. Light green areas, on the other hand, show areas in which this study estimated shallower peat deposits than those of WI and MoA. Areas indicated in gray showed no noticeable differences among WI, MoA and this study, and were considered as peatland with a similar peat depth distribution.
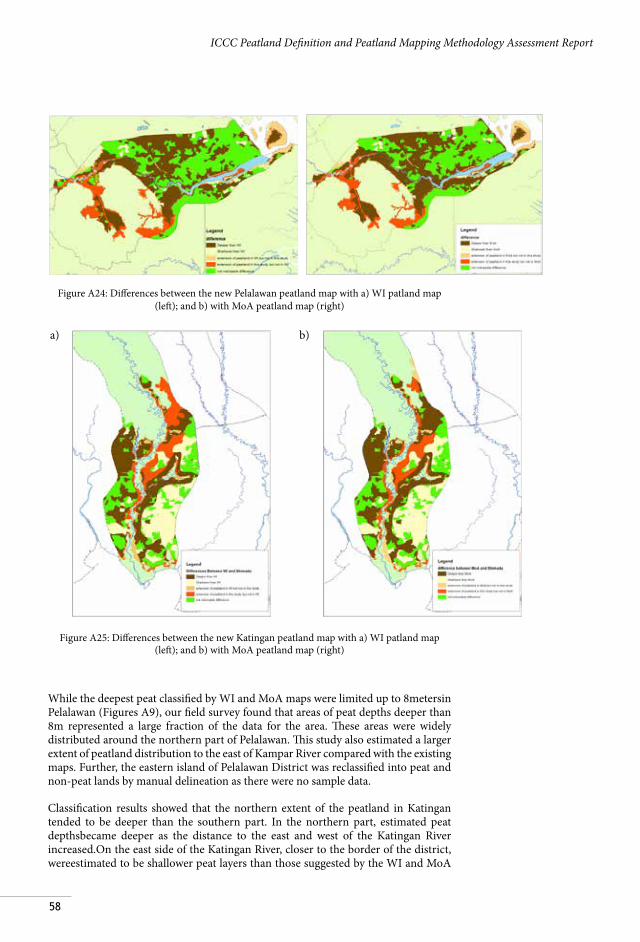
58
ICCC Peatland Definition and Peatland Mapping Methodology Assessment Report
Figure A24: Differences between the new Pelalawan peatland map with a) WI patland map (left); and b) with MoA peatland map (right)
Figure A25: Differences between the new Katingan peatland map with a) WI patland map (left); and b) with MoA peatland map (right)
While the deepest peat classified by WI and MoA maps were limited up to 8metersin Pelalawan (Figures A9), our field survey found that areas of peat depths deeper than 8m represented a large fraction of the data for the area. These areas were widely distributed around the northern part of Pelalawan. This study also estimated a larger extent of peatland distribution to the east of Kampar River compared with the existing maps. Further, the eastern island of Pelalawan District was reclassified into peat and non-peat lands by manual delineation as there were no sample data.
Classification results showed that the northern extent of the peatland in Katingan tended to be deeper than the southern part. In the northern part, estimated peat depthsbecame deeper as the distance to the east and west of the Katingan River increased.On the east side of the Katingan River, closer to the border of the district, wereestimated to be shallower peat layers than those suggested by the WI and MoA
b)
a) b)
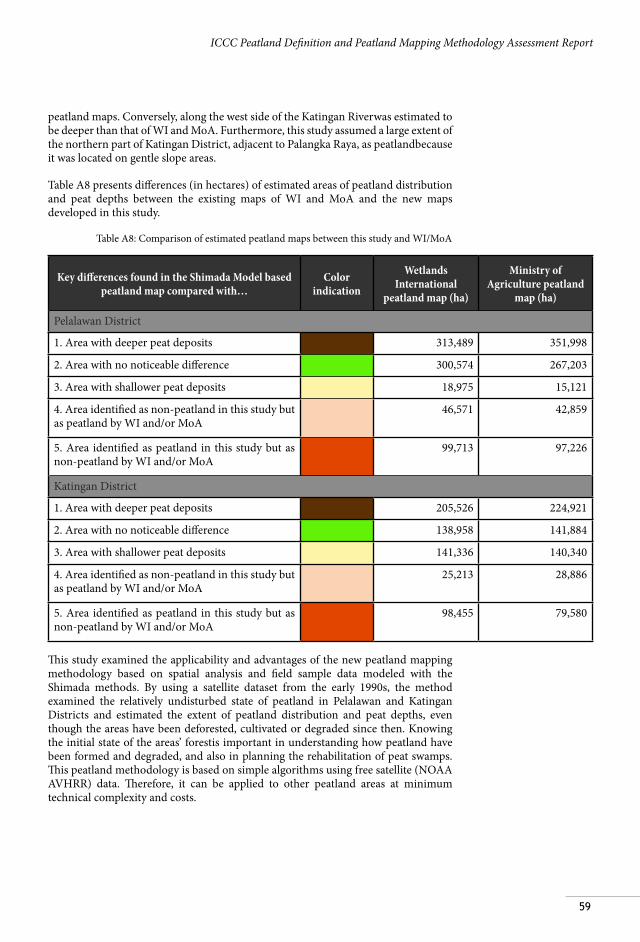
59
ICCC Peatland Definition and Peatland Mapping Methodology Assessment Report
peatland maps. Conversely, along the west side of the Katingan Riverwas estimated to be deeper than that of WI and MoA. Furthermore, this study assumed a large extent of the northern part of Katingan District, adjacent to Palangka Raya, as peatlandbecause it was located on gentle slope areas.
Table A8 presents differences (in hectares) of estimated areas of peatland distribution and peat depths between the existing maps of WI and MoA and the new maps developed in this study.
Table A8: Comparison of estimated peatland maps between this study and WI/MoA
Key differences found in the Shimada Model based peatland map compared with…
Color indication
Wetlands International
peatland map (ha)
Ministry of Agriculture peatland
map (ha)
Pelalawan District
1. Area with deeper peat deposits 313,489 351,998
2. Area with no noticeable difference 300,574 267,203
3. Area with shallower peat deposits 18,975 15,121
4. Area identified as non-peatland in this study but as peatland by WI and/or MoA
46,571 42,859
5. Area identified as peatland in this study but as non-peatland by WI and/or MoA
99,713 97,226
Katingan District
1. Area with deeper peat deposits 205,526 224,921
2. Area with no noticeable difference 138,958 141,884
3. Area with shallower peat deposits 141,336 140,340
4. Area identified as non-peatland in this study but as peatland by WI and/or MoA
25,213 28,886
5. Area identified as peatland in this study but as non-peatland by WI and/or MoA
98,455 79,580
This study examined the applicability and advantages of the new peatland mapping methodology based on spatial analysis and field sample data modeled with the Shimada methods. By using a satellite dataset from the early 1990s, the method examined the relatively undisturbed state of peatland in Pelalawan and Katingan Districts and estimated the extent of peatland distribution and peat depths, even though the areas have been deforested, cultivated or degraded since then. Knowing the initial state of the areas’ forestis important in understanding how peatland have been formed and degraded, and also in planning the rehabilitation of peat swamps. This peatland methodology is based on simple algorithms using free satellite (NOAA AVHRR) data. Therefore, it can be applied to other peatland areas at minimum technical complexity and costs.
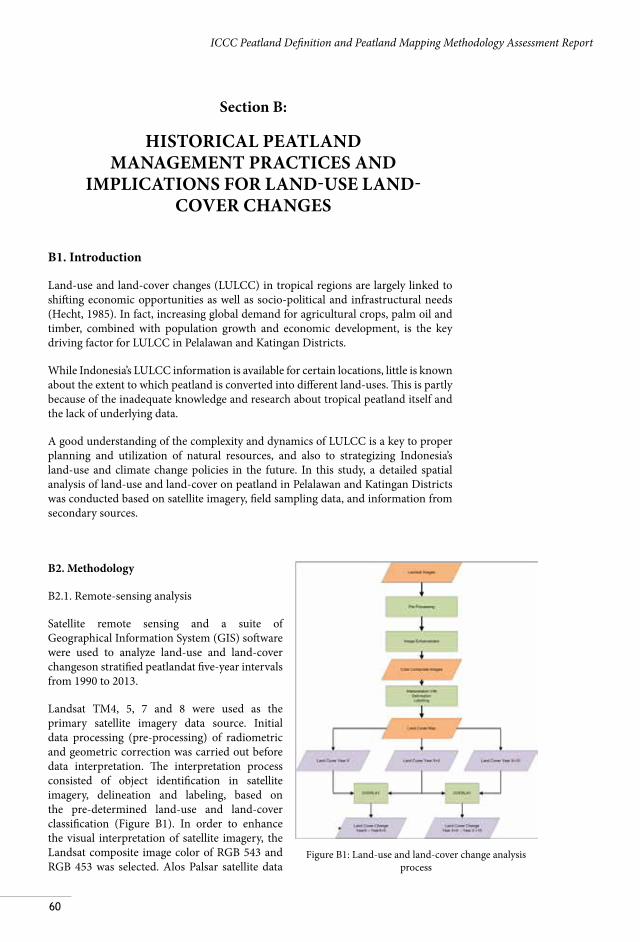
60
ICCC Peatland Definition and Peatland Mapping Methodology Assessment Report
Section B:
HISTORICAL PEATLAND MANAGEMENT PRACTICES AND
IMPLICATIONS FOR LAND-USE LAND-COVER CHANGES
B1. Introduction
Land-use and land-cover changes (LULCC) in tropical regions are largely linked to shifting economic opportunities as well as socio-political and infrastructural needs (Hecht, 1985). In fact, increasing global demand for agricultural crops, palm oil and timber, combined with population growth and economic development, is the key driving factor for LULCC in Pelalawan and Katingan Districts.
While Indonesia’s LULCC information is available for certain locations, little is known about the extent to which peatland is converted into different land-uses. This is partly because of the inadequate knowledge and research about tropical peatland itself and the lack of underlying data.
A good understanding of the complexity and dynamics of LULCC is a key to proper planning and utilization of natural resources, and also to strategizing Indonesia’s land-use and climate change policies in the future. In this study, a detailed spatial analysis of land-use and land-cover on peatland in Pelalawan and Katingan Districts was conducted based on satellite imagery, field sampling data, and information from secondary sources.
B2. Methodology
B2.1. Remote-sensing analysis
Satellite remote sensing and a suite of Geographical Information System (GIS) software were used to analyze land-use and land-cover changeson stratified peatlandat five-year intervals from 1990 to 2013.
Landsat TM4, 5, 7 and 8 were used as the primary satellite imagery data source. Initial data processing (pre-processing) of radiometric and geometric correction was carried out before data interpretation. The interpretation process consisted of object identification in satellite imagery, delineation and labeling, based on the pre-determined land-use and land-cover classification (Figure B1). In order to enhance the visual interpretation of satellite imagery, the Landsat composite image color of RGB 543 and RGB 453 was selected. Alos Palsar satellite data
Figure B1: Land-use and land-cover change analysis process
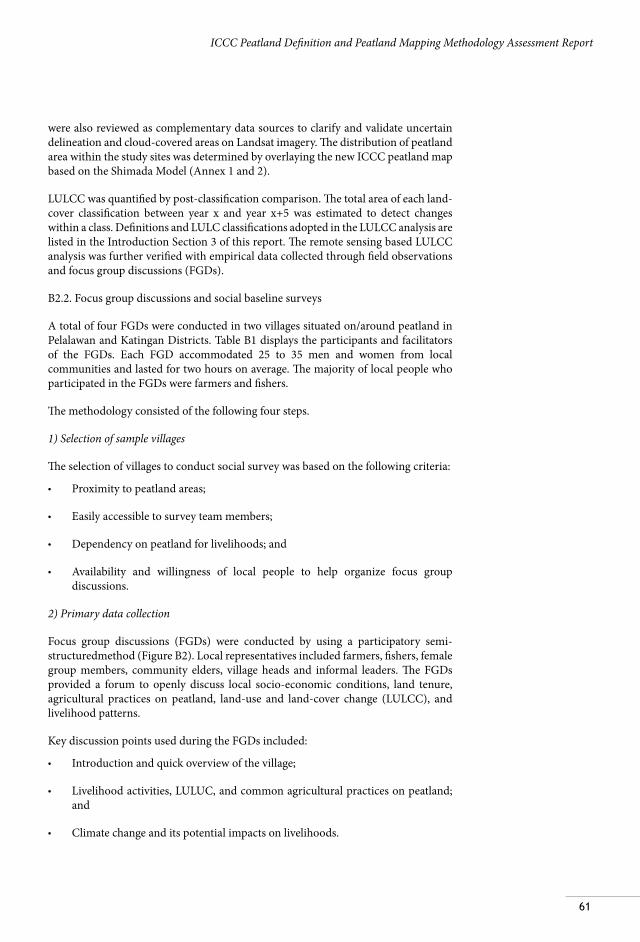
61
ICCC Peatland Definition and Peatland Mapping Methodology Assessment Report
were also reviewed as complementary data sources to clarify and validate uncertain delineation and cloud-covered areas on Landsat imagery. The distribution of peatland area within the study sites was determined by overlaying the new ICCC peatland map based on the Shimada Model (Annex 1 and 2).
LULCC was quantified by post-classification comparison. The total area of each land-cover classification between year x and year x+5 was estimated to detect changes within a class. Definitions and LULC classifications adopted in the LULCC analysis are listed in the Introduction Section 3 of this report. The remote sensing based LULCC analysis was further verified with empirical data collected through field observations and focus group discussions (FGDs).
B2.2. Focus group discussions and social baseline surveys
A total of four FGDs were conducted in two villages situated on/around peatland in Pelalawan and Katingan Districts. Table B1 displays the participants and facilitators of the FGDs. Each FGD accommodated 25 to 35 men and women from local communities and lasted for two hours on average. The majority of local people who participated in the FGDs were farmers and fishers.
The methodology consisted of the following four steps.
1) Selection of sample villages
The selection of villages to conduct social survey was based on the following criteria:
• Proximity to peatland areas;
• Easily accessible to survey team members;
• Dependency on peatland for livelihoods; and
• Availability and willingness of local people to help organize focus group discussions.
2) Primary data collection
Focus group discussions (FGDs) were conducted by using a participatory semi-structuredmethod (Figure B2). Local representatives included farmers, fishers, female group members, community elders, village heads and informal leaders. The FGDs provided a forum to openly discuss local socio-economic conditions, land tenure, agricultural practices on peatland, land-use and land-cover change (LULCC), and livelihood patterns.
Key discussion points used during the FGDs included:
• Introduction and quick overview of the village;
• Livelihood activities, LULUC, and common agricultural practices on peatland; and
• Climate change and its potential impacts on livelihoods.
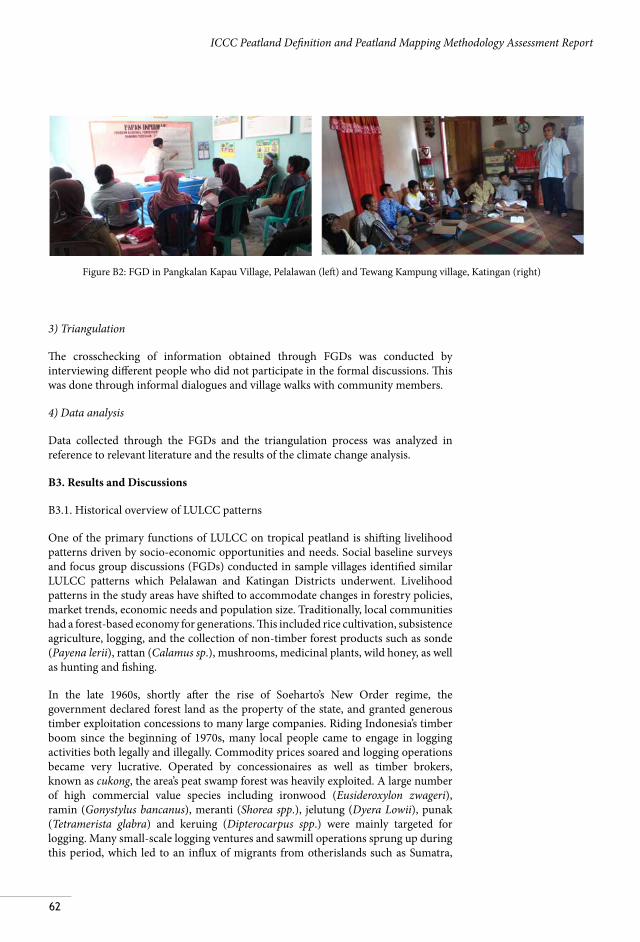
62
ICCC Peatland Definition and Peatland Mapping Methodology Assessment Report
3) Triangulation
The crosschecking of information obtained through FGDs was conducted by interviewing different people who did not participate in the formal discussions. This was done through informal dialogues and village walks with community members.
4) Data analysis
Data collected through the FGDs and the triangulation process was analyzed in reference to relevant literature and the results of the climate change analysis.
B3. Results and Discussions
B3.1. Historical overview of LULCC patterns
One of the primary functions of LULCC on tropical peatland is shifting livelihood patterns driven by socio-economic opportunities and needs. Social baseline surveys and focus group discussions (FGDs) conducted in sample villages identified similar LULCC patterns which Pelalawan and Katingan Districts underwent. Livelihood patterns in the study areas have shifted to accommodate changes in forestry policies, market trends, economic needs and population size. Traditionally, local communities had a forest-based economy for generations. This included rice cultivation, subsistence agriculture, logging, and the collection of non-timber forest products such as sonde (Payena lerii), rattan (Calamus sp.), mushrooms, medicinal plants, wild honey, as well as hunting and fishing.
In the late 1960s, shortly after the rise of Soeharto’s New Order regime, the government declared forest land as the property of the state, and granted generous timber exploitation concessions to many large companies. Riding Indonesia’s timber boom since the beginning of 1970s, many local people came to engage in logging activities both legally and illegally. Commodity prices soared and logging operations became very lucrative. Operated by concessionaires as well as timber brokers, known as cukong, the area’s peat swamp forest was heavily exploited. A large number of high commercial value species including ironwood (Eusideroxylon zwageri), ramin (Gonystylus bancanus), meranti (Shorea spp.), jelutung (Dyera Lowii), punak (Tetramerista glabra) and keruing (Dipterocarpus spp.) were mainly targeted for logging. Many small-scale logging ventures and sawmill operations sprung up during this period, which led to an influx of migrants from otherislands such as Sumatra,
Figure B2: FGD in Pangkalan Kapau Village, Pelalawan (left) and Tewang Kampung village, Katingan (right)
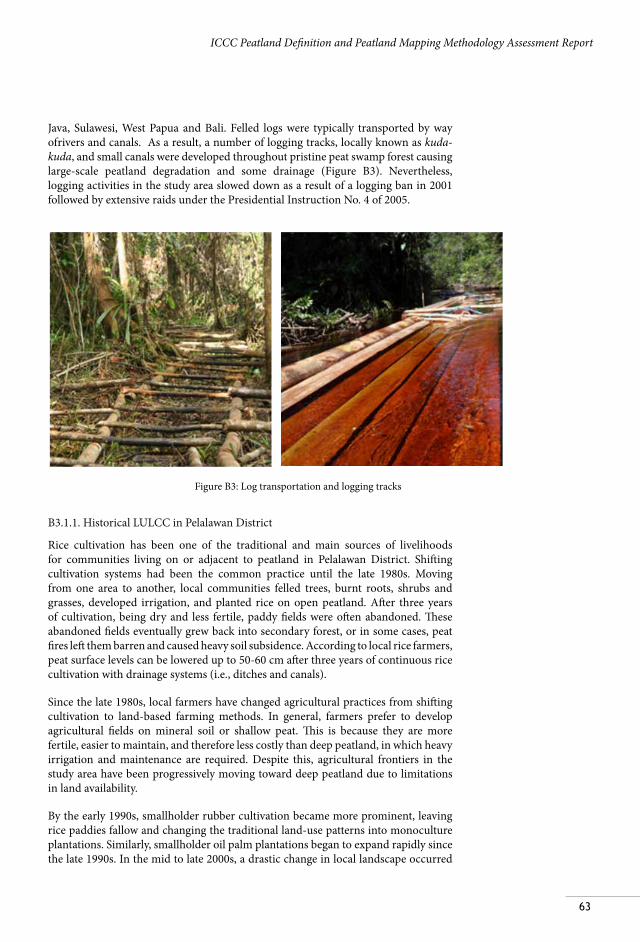
63
ICCC Peatland Definition and Peatland Mapping Methodology Assessment Report
Java, Sulawesi, West Papua and Bali. Felled logs were typically transported by way ofrivers and canals. As a result, a number of logging tracks, locally known as kuda-kuda, and small canals were developed throughout pristine peat swamp forest causing large-scale peatland degradation and some drainage (Figure B3). Nevertheless, logging activities in the study area slowed down as a result of a logging ban in 2001 followed by extensive raids under the Presidential Instruction No. 4 of 2005.
Figure B3: Log transportation and logging tracks
B3.1.1. Historical LULCC in Pelalawan District
Rice cultivation has been one of the traditional and main sources of livelihoods for communities living on or adjacent to peatland in Pelalawan District. Shifting cultivation systems had been the common practice until the late 1980s. Moving from one area to another, local communities felled trees, burnt roots, shrubs and grasses, developed irrigation, and planted rice on open peatland. After three years of cultivation, being dry and less fertile, paddy fields were often abandoned. These abandoned fields eventually grew back into secondary forest, or in some cases, peat fires left them barren and caused heavy soil subsidence. According to local rice farmers, peat surface levels can be lowered up to 50-60 cm after three years of continuous rice cultivation with drainage systems (i.e., ditches and canals).
Since the late 1980s, local farmers have changed agricultural practices from shifting cultivation to land-based farming methods. In general, farmers prefer to develop agricultural fields on mineral soil or shallow peat. This is because they are more fertile, easier to maintain, and therefore less costly than deep peatland, in which heavy irrigation and maintenance are required. Despite this, agricultural frontiers in the study area have been progressively moving toward deep peatland due to limitations in land availability.
By the early 1990s, smallholder rubber cultivation became more prominent, leaving rice paddies fallow and changing the traditional land-use patterns into monoculture plantations. Similarly, smallholder oil palm plantations began to expand rapidly since the late 1990s. In the mid to late 2000s, a drastic change in local landscape occurred
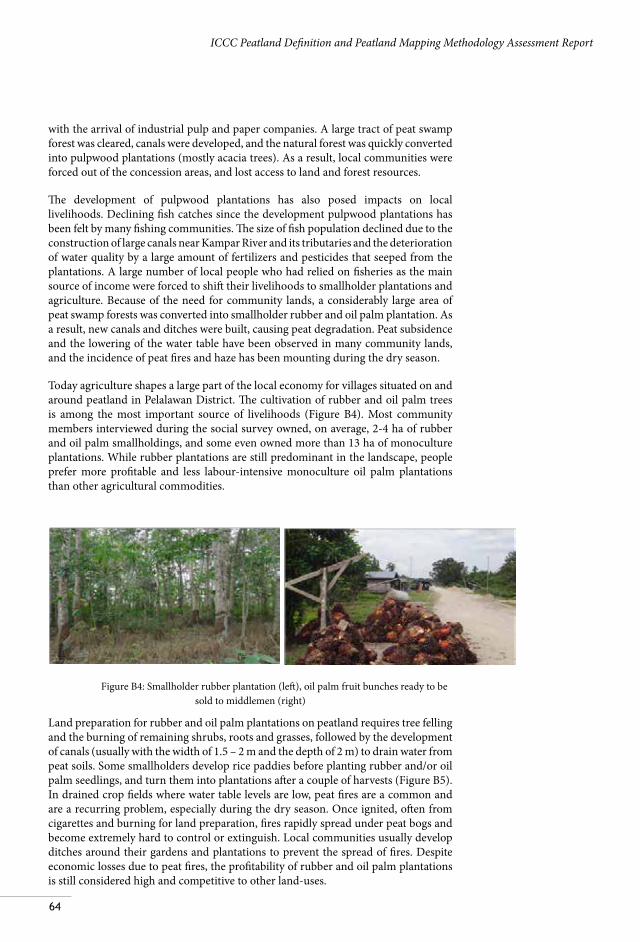
64
ICCC Peatland Definition and Peatland Mapping Methodology Assessment Report
with the arrival of industrial pulp and paper companies. A large tract of peat swamp forest was cleared, canals were developed, and the natural forest was quickly converted into pulpwood plantations (mostly acacia trees). As a result, local communities were forced out of the concession areas, and lost access to land and forest resources.
The development of pulpwood plantations has also posed impacts on local livelihoods. Declining fish catches since the development pulpwood plantations has been felt by many fishing communities. The size of fish population declined due to the construction of large canals near Kampar River and its tributaries and the deterioration of water quality by a large amount of fertilizers and pesticides that seeped from the plantations. A large number of local people who had relied on fisheries as the main source of income were forced to shift their livelihoods to smallholder plantations and agriculture. Because of the need for community lands, a considerably large area of peat swamp forests was converted into smallholder rubber and oil palm plantation. As a result, new canals and ditches were built, causing peat degradation. Peat subsidence and the lowering of the water table have been observed in many community lands, and the incidence of peat fires and haze has been mounting during the dry season.
Today agriculture shapes a large part of the local economy for villages situated on and around peatland in Pelalawan District. The cultivation of rubber and oil palm trees is among the most important source of livelihoods (Figure B4). Most community members interviewed during the social survey owned, on average, 2-4 ha of rubber and oil palm smallholdings, and some even owned more than 13 ha of monoculture plantations. While rubber plantations are still predominant in the landscape, people prefer more profitable and less labour-intensive monoculture oil palm plantations than other agricultural commodities.
Figure B4: Smallholder rubber plantation (left), oil palm fruit bunches ready to be sold to middlemen (right)
Land preparation for rubber and oil palm plantations on peatland requires tree felling and the burning of remaining shrubs, roots and grasses, followed by the development of canals (usually with the width of 1.5 – 2 m and the depth of 2 m) to drain water from peat soils. Some smallholders develop rice paddies before planting rubber and/or oil palm seedlings, and turn them into plantations after a couple of harvests (Figure B5). In drained crop fields where water table levels are low, peat fires are a common and are a recurring problem, especially during the dry season. Once ignited, often from cigarettes and burning for land preparation, fires rapidly spread under peat bogs and become extremely hard to control or extinguish. Local communities usually develop ditches around their gardens and plantations to prevent the spread of fires. Despite economic losses due to peat fires, the profitability of rubber and oil palm plantations is still considered high and competitive to other land-uses.
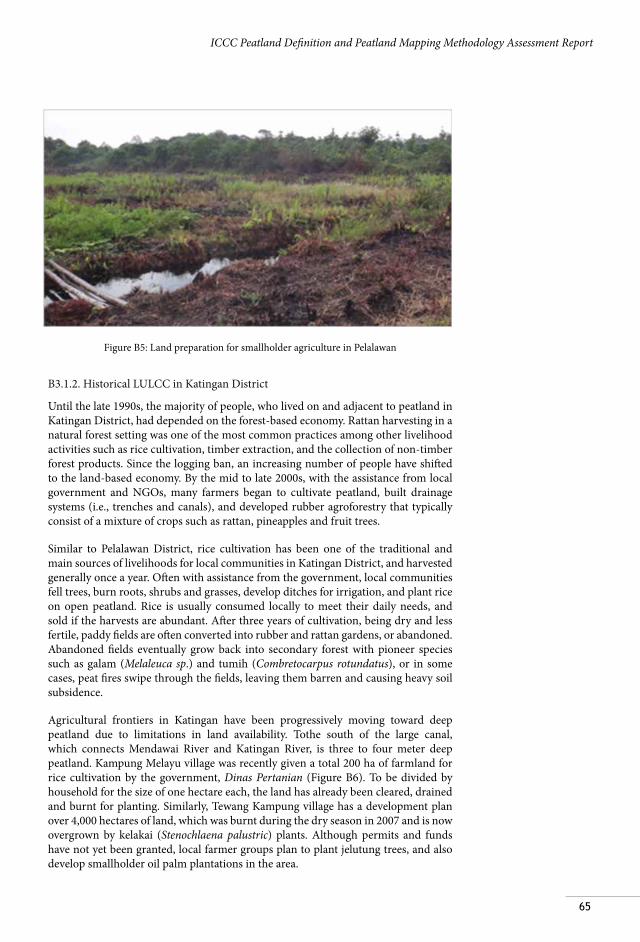
65
ICCC Peatland Definition and Peatland Mapping Methodology Assessment Report
Figure B5: Land preparation for smallholder agriculture in Pelalawan
B3.1.2. Historical LULCC in Katingan District
Until the late 1990s, the majority of people, who lived on and adjacent to peatland in Katingan District, had depended on the forest-based economy. Rattan harvesting in a natural forest setting was one of the most common practices among other livelihood activities such as rice cultivation, timber extraction, and the collection of non-timber forest products. Since the logging ban, an increasing number of people have shifted to the land-based economy. By the mid to late 2000s, with the assistance from local government and NGOs, many farmers began to cultivate peatland, built drainage systems (i.e., trenches and canals), and developed rubber agroforestry that typically consist of a mixture of crops such as rattan, pineapples and fruit trees.
Similar to Pelalawan District, rice cultivation has been one of the traditional and main sources of livelihoods for local communities in Katingan District, and harvested generally once a year. Often with assistance from the government, local communities fell trees, burn roots, shrubs and grasses, develop ditches for irrigation, and plant rice on open peatland. Rice is usually consumed locally to meet their daily needs, and sold if the harvests are abundant. After three years of cultivation, being dry and less fertile, paddy fields are often converted into rubber and rattan gardens, or abandoned. Abandoned fields eventually grow back into secondary forest with pioneer species such as galam (Melaleuca sp.) and tumih (Combretocarpus rotundatus), or in some cases, peat fires swipe through the fields, leaving them barren and causing heavy soil subsidence.
Agricultural frontiers in Katingan have been progressively moving toward deep peatland due to limitations in land availability. Tothe south of the large canal, which connects Mendawai River and Katingan River, is three to four meter deep peatland. Kampung Melayu village was recently given a total 200 ha of farmland for rice cultivation by the government, Dinas Pertanian (Figure B6). To be divided by household for the size of one hectare each, the land has already been cleared, drained and burnt for planting. Similarly, Tewang Kampung village has a development plan over 4,000 hectares of land, which was burnt during the dry season in 2007 and is now overgrown by kelakai (Stenochlaena palustric) plants. Although permits and funds have not yet been granted, local farmer groups plan to plant jelutung trees, and also develop smallholder oil palm plantations in the area.
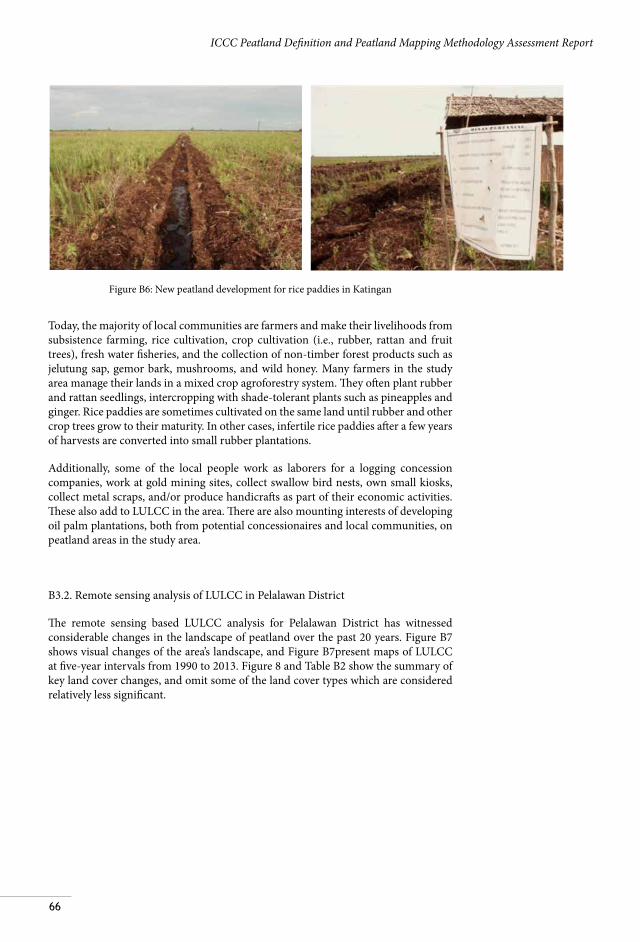
66
ICCC Peatland Definition and Peatland Mapping Methodology Assessment Report
Figure B6: New peatland development for rice paddies in Katingan
Today, the majority of local communities are farmers and make their livelihoods from subsistence farming, rice cultivation, crop cultivation (i.e., rubber, rattan and fruit trees), fresh water fisheries, and the collection of non-timber forest products such as jelutung sap, gemor bark, mushrooms, and wild honey. Many farmers in the study area manage their lands in a mixed crop agroforestry system. They often plant rubber and rattan seedlings, intercropping with shade-tolerant plants such as pineapples and ginger. Rice paddies are sometimes cultivated on the same land until rubber and other crop trees grow to their maturity. In other cases, infertile rice paddies after a few years of harvests are converted into small rubber plantations.
Additionally, some of the local people work as laborers for a logging concession companies, work at gold mining sites, collect swallow bird nests, own small kiosks, collect metal scraps, and/or produce handicrafts as part of their economic activities. These also add to LULCC in the area. There are also mounting interests of developing oil palm plantations, both from potential concessionaires and local communities, on peatland areas in the study area.
B3.2. Remote sensing analysis of LULCC in Pelalawan District
The remote sensing based LULCC analysis for Pelalawan District has witnessed considerable changes in the landscape of peatland over the past 20 years. Figure B7 shows visual changes of the area’s landscape, and Figure B7present maps of LULCC at five-year intervals from 1990 to 2013. Figure 8 and Table B2 show the summary of key land cover changes, and omit some of the land cover types which are considered relatively less significant.
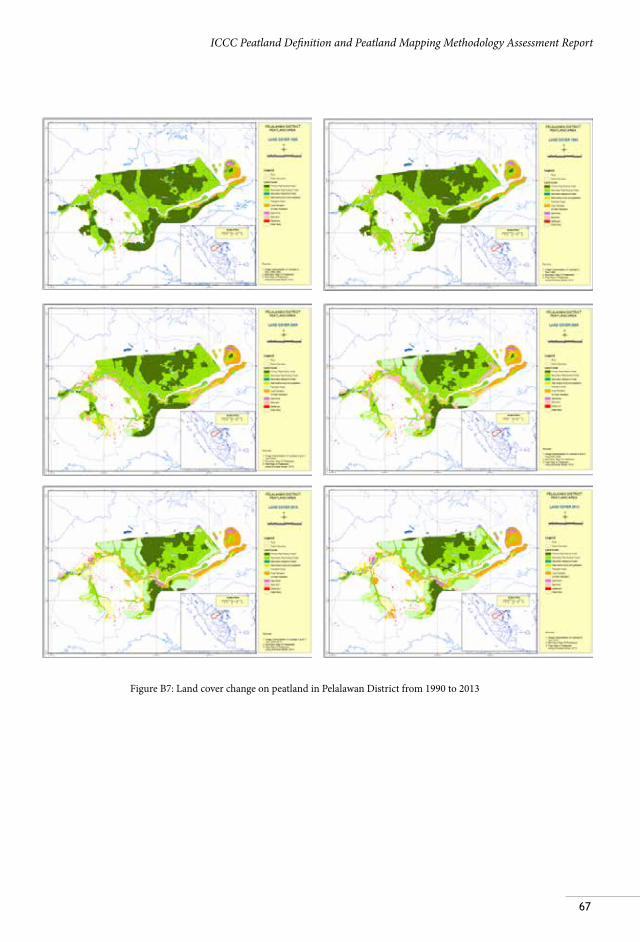
67
ICCC Peatland Definition and Peatland Mapping Methodology Assessment Report
Figure B7: Land cover change on peatland in Pelalawan District from 1990 to 2013
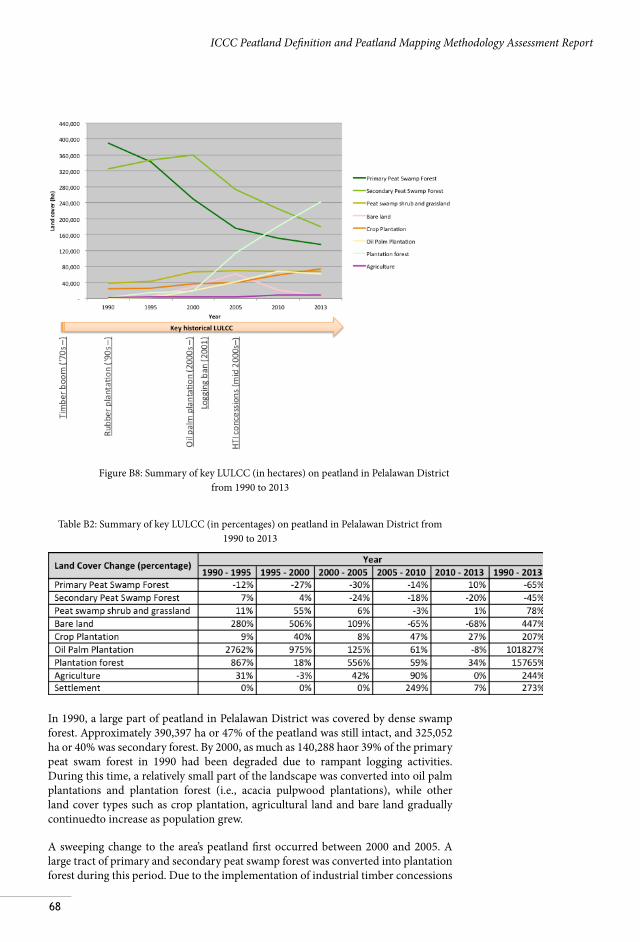
68
ICCC Peatland Definition and Peatland Mapping Methodology Assessment Report
Figure B8: Summary of key LULCC (in hectares) on peatland in Pelalawan District from 1990 to 2013
Table B2: Summary of key LULCC (in percentages) on peatland in Pelalawan District from
1990 to 2013
In 1990, a large part of peatland in Pelalawan District was covered by dense swamp forest. Approximately 390,397 ha or 47% of the peatland was still intact, and 325,052 ha or 40% was secondary forest. By 2000, as much as 140,288 haor 39% of the primary peat swam forest in 1990 had been degraded due to rampant logging activities. During this time, a relatively small part of the landscape was converted into oil palm plantations and plantation forest (i.e., acacia pulpwood plantations), while other land cover types such as crop plantation, agricultural land and bare land gradually continuedto increase as population grew.
A sweeping change to the area’s peatland first occurred between 2000 and 2005. A large tract of primary and secondary peat swamp forest was converted into plantation forest during this period. Due to the implementation of industrial timber concessions
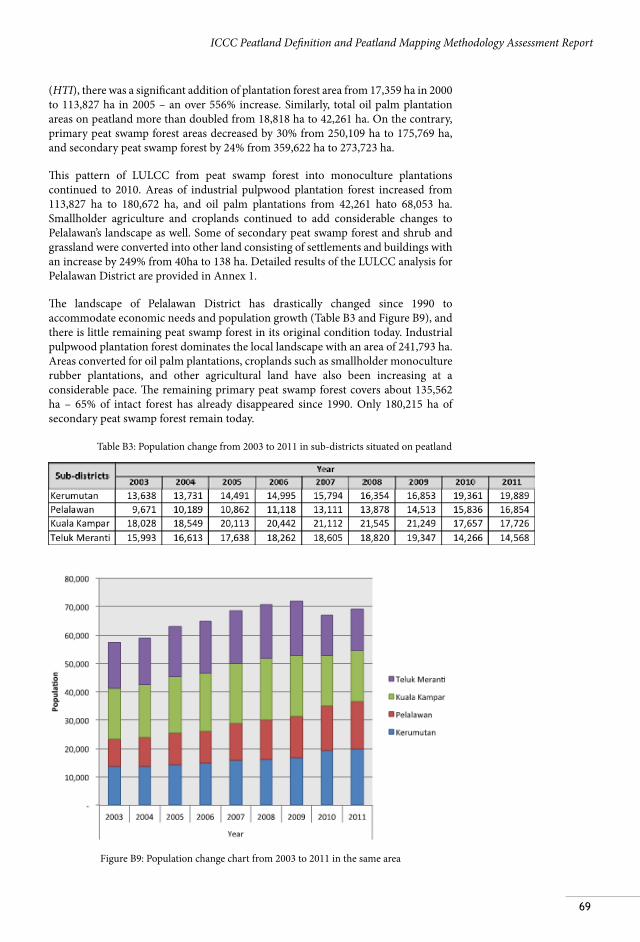
69
ICCC Peatland Definition and Peatland Mapping Methodology Assessment Report
(HTI), there was a significant addition of plantation forest area from 17,359 ha in 2000 to 113,827 ha in 2005 – an over 556% increase. Similarly, total oil palm plantation areas on peatland more than doubled from 18,818 ha to 42,261 ha. On the contrary, primary peat swamp forest areas decreased by 30% from 250,109 ha to 175,769 ha, and secondary peat swamp forest by 24% from 359,622 ha to 273,723 ha.
This pattern of LULCC from peat swamp forest into monoculture plantations continued to 2010. Areas of industrial pulpwood plantation forest increased from 113,827 ha to 180,672 ha, and oil palm plantations from 42,261 hato 68,053 ha. Smallholder agriculture and croplands continued to add considerable changes to Pelalawan’s landscape as well. Some of secondary peat swamp forest and shrub and grassland were converted into other land consisting of settlements and buildings with an increase by 249% from 40ha to 138 ha. Detailed results of the LULCC analysis for Pelalawan District are provided in Annex 1.
The landscape of Pelalawan District has drastically changed since 1990 to accommodate economic needs and population growth (Table B3 and Figure B9), and there is little remaining peat swamp forest in its original condition today. Industrial pulpwood plantation forest dominates the local landscape with an area of 241,793 ha. Areas converted for oil palm plantations, croplands such as smallholder monoculture rubber plantations, and other agricultural land have also been increasing at a considerable pace. The remaining primary peat swamp forest covers about 135,562 ha – 65% of intact forest has already disappeared since 1990. Only 180,215 ha of secondary peat swamp forest remain today.
Table B3: Population change from 2003 to 2011 in sub-districts situated on peatland
Figure B9: Population change chart from 2003 to 2011 in the same area
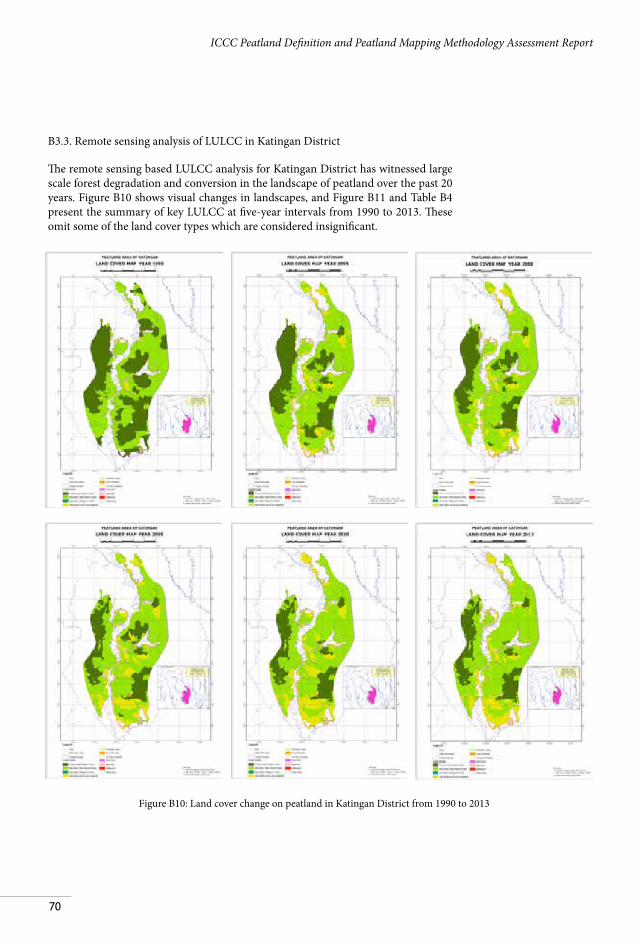
70
ICCC Peatland Definition and Peatland Mapping Methodology Assessment Report
B3.3. Remote sensing analysis of LULCC in Katingan District
The remote sensing based LULCC analysis for Katingan District has witnessed large scale forest degradation and conversion in the landscape of peatland over the past 20 years. Figure B10 shows visual changes in landscapes, and Figure B11 and Table B4 present the summary of key LULCC at five-year intervals from 1990 to 2013. These omit some of the land cover types which are considered insignificant.
Figure B10: Land cover change on peatland in Katingan District from 1990 to 2013
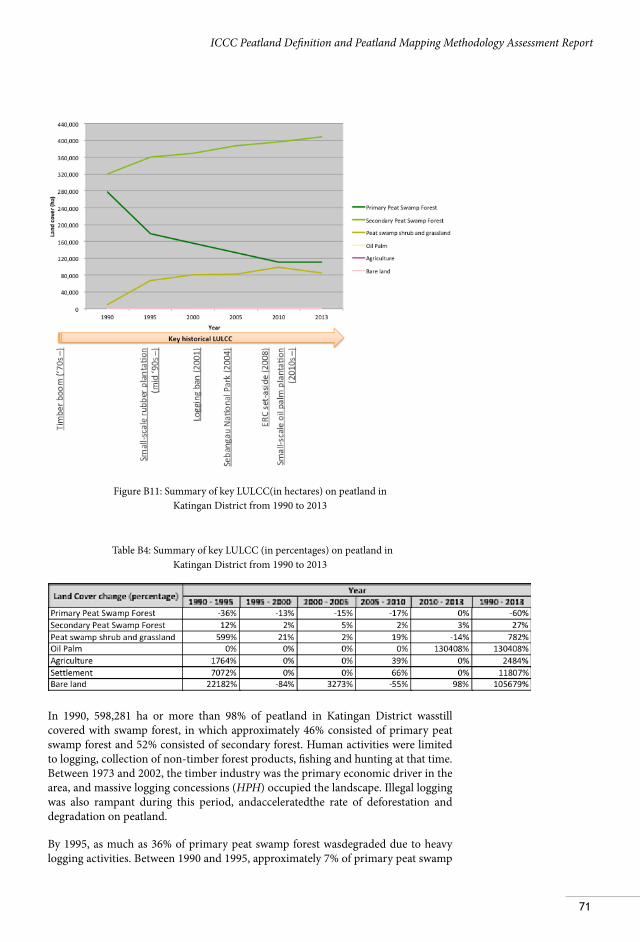
71
ICCC Peatland Definition and Peatland Mapping Methodology Assessment Report
Figure B11: Summary of key LULCC(in hectares) on peatland in Katingan District from 1990 to 2013
Table B4: Summary of key LULCC (in percentages) on peatland in Katingan District from 1990 to 2013
In 1990, 598,281 ha or more than 98% of peatland in Katingan District wasstill covered with swamp forest, in which approximately 46% consisted of primary peat swamp forest and 52% consisted of secondary forest. Human activities were limited to logging, collection of non-timber forest products, fishing and hunting at that time. Between 1973 and 2002, the timber industry was the primary economic driver in the area, and massive logging concessions (HPH) occupied the landscape. Illegal logging was also rampant during this period, andacceleratedthe rate of deforestation and degradation on peatland.
By 1995, as much as 36% of primary peat swamp forest wasdegraded due to heavy logging activities. Between 1990 and 1995, approximately 7% of primary peat swamp
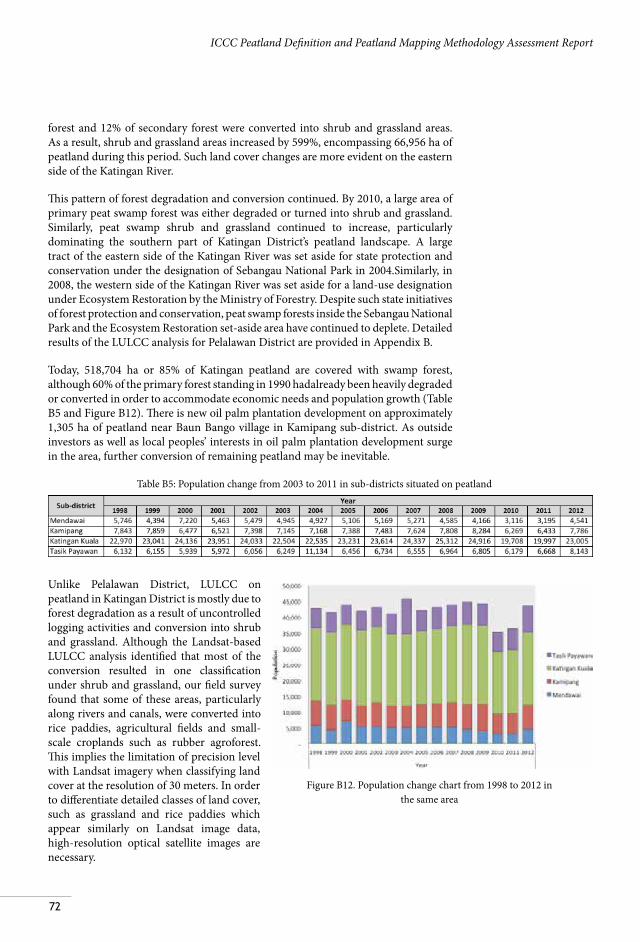
72
ICCC Peatland Definition and Peatland Mapping Methodology Assessment Report
forest and 12% of secondary forest were converted into shrub and grassland areas. As a result, shrub and grassland areas increased by 599%, encompassing 66,956 ha of peatland during this period. Such land cover changes are more evident on the eastern side of the Katingan River.
This pattern of forest degradation and conversion continued. By 2010, a large area of primary peat swamp forest was either degraded or turned into shrub and grassland. Similarly, peat swamp shrub and grassland continued to increase, particularly dominating the southern part of Katingan District’s peatland landscape. A large tract of the eastern side of the Katingan River was set aside for state protection and conservation under the designation of Sebangau National Park in 2004.Similarly, in 2008, the western side of the Katingan River was set aside for a land-use designation under Ecosystem Restoration by the Ministry of Forestry. Despite such state initiatives of forest protection and conservation, peat swamp forests inside the Sebangau National Park and the Ecosystem Restoration set-aside area have continued to deplete. Detailed results of the LULCC analysis for Pelalawan District are provided in Appendix B.
Today, 518,704 ha or 85% of Katingan peatland are covered with swamp forest, although 60% of the primary forest standing in 1990 hadalready been heavily degraded or converted in order to accommodate economic needs and population growth (Table B5 and Figure B12). There is new oil palm plantation development on approximately 1,305 ha of peatland near Baun Bango village in Kamipang sub-district. As outside investors as well as local peoples’ interests in oil palm plantation development surge in the area, further conversion of remaining peatland may be inevitable.
Unlike Pelalawan District, LULCC on peatland in Katingan District is mostly due to forest degradation as a result of uncontrolled logging activities and conversion into shrub and grassland. Although the Landsat-based LULCC analysis identified that most of the conversion resulted in one classification under shrub and grassland, our field survey found that some of these areas, particularly along rivers and canals, were converted into rice paddies, agricultural fields and small-scale croplands such as rubber agroforest. This implies the limitation of precision level with Landsat imagery when classifying land cover at the resolution of 30 meters. In order to differentiate detailed classes of land cover, such as grassland and rice paddies which appear similarly on Landsat image data, high-resolution optical satellite images are necessary.
Table B5: Population change from 2003 to 2011 in sub-districts situated on peatland
Figure B12. Population change chart from 1998 to 2012 in the same area
73
ICCC Peatland Definition and Peatland Mapping Methodology Assessment Report
Section C:
CLIMATE CHANGE AND ITS POTENTIAL IMPACTS ON
PEATLAND C1. Introduction
Climate change leads to variations in the mean and/or the variability of air and sea surface temperatures, rainfall patterns, humidity, sea levels and hydrological regimes (IPCC, 2012). Rising annual mean temperatures will likely translate into climatic anomalies, which may increase the frequency of the El Niño Southern Oscillation (ENSO) phenomena and induce extreme weather events and climate-related hazards (MoE, 2007). Over the past two decades, the number of climate related natural disasters such as floods, droughts, landslides, storms, heat waves and forest fires has doubled globally causing major losses in human lives and livelihoods, as well as economic and environmental damage (Guterres, 2009). Millions of people have already been displaced due to extreme weather, and the frequencies and intensities of these hazards are only expected to increase as atmospheric concentrations of greenhouse gases continue to rise (Sivakumar, 2005).
Climate change is often associated with increasing extreme weather events. IPCC defines that “[a] changing climate leads to changes in the frequency, intensity, spatial extent, duration, and timing of extreme weather and climate events, and can result in unprecedented extreme weather and climate events” (IPCC, 2000). Information on climate extremes is essential to understand implications of climate change and assess social and environmental risks. Peatland ecosystems are of most vulnerable and exposed to climate stress. Furthermore, natural hazards impose considerable impacts on people living on and around peatland in Indonesia. When peat is dry, especially during the dry season, it can easily spread fires which can continue to burn down to the water table for an extended period of time. Peat degradation also deteriorates the water retention ability of soil and often causes unseasonal floods. Unpredictable weather patterns also impose adverse impacts on economic activities such as farming and fishing, and crop productivity.
A science-based understanding of climate change, climate projection and its potential impacts has important implications for society and sustainable development. It will allow policy makers to determine climate change mitigation strategies, while also supporting appropriate interventions to disaster and disaster risk management. It is also key to developing sustainable peatland management approaches, in which GHG emission reduction objectives and socioeconomic needs are balanced.
This section of the report presents an overview of historical climate variations in Pelalawan District, Riau Province, and Katingan District, Central Kalimantan Province, and discusses their implications in the region. It also aims to provide climate change projections up to 2050 based on seven Global Circulation Models. Finally, it discusses the occurrence and projection of climate extremes by conducting statistical probably analysis.
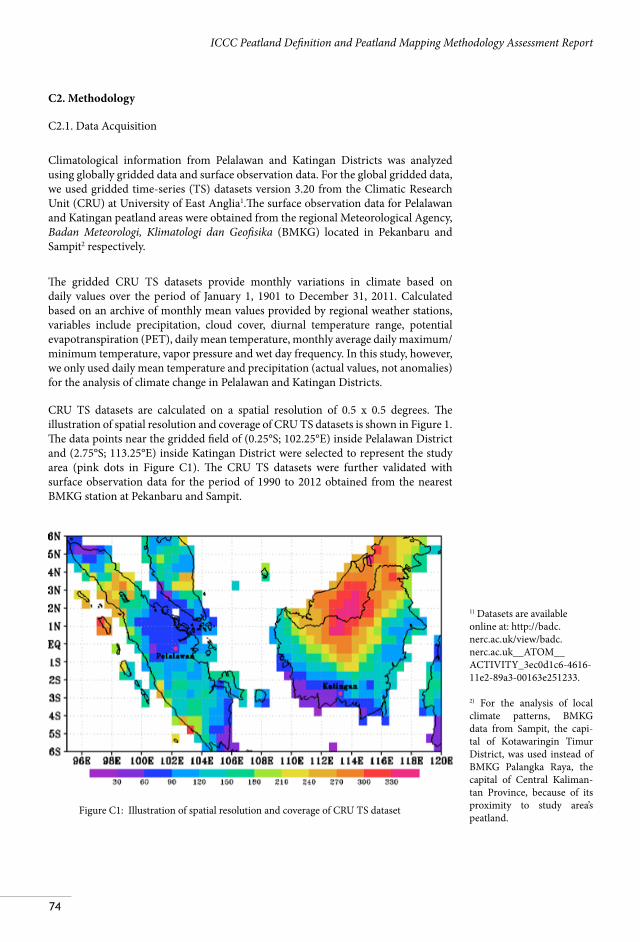
74
ICCC Peatland Definition and Peatland Mapping Methodology Assessment Report
C2. Methodology
C2.1. Data Acquisition
Climatological information from Pelalawan and Katingan Districts was analyzed using globally gridded data and surface observation data. For the global gridded data, we used gridded time-series (TS) datasets version 3.20 from the Climatic Research Unit (CRU) at University of East Anglia1.The surface observation data for Pelalawan and Katingan peatland areas were obtained from the regional Meteorological Agency, Badan Meteorologi, Klimatologi dan Geofisika (BMKG) located in Pekanbaru and Sampit2 respectively.
The gridded CRU TS datasets provide monthly variations in climate based on daily values over the period of January 1, 1901 to December 31, 2011. Calculated based on an archive of monthly mean values provided by regional weather stations, variables include precipitation, cloud cover, diurnal temperature range, potential evapotranspiration (PET), daily mean temperature, monthly average daily maximum/minimum temperature, vapor pressure and wet day frequency. In this study, however, we only used daily mean temperature and precipitation (actual values, not anomalies) for the analysis of climate change in Pelalawan and Katingan Districts.
CRU TS datasets are calculated on a spatial resolution of 0.5 x 0.5 degrees. The illustration of spatial resolution and coverage of CRU TS datasets is shown in Figure 1. The data points near the gridded field of (0.25°S; 102.25°E) inside Pelalawan District and (2.75°S; 113.25°E) inside Katingan District were selected to represent the study area (pink dots in Figure C1). The CRU TS datasets were further validated with surface observation data for the period of 1990 to 2012 obtained from the nearest BMKG station at Pekanbaru and Sampit.
1) Datasets are available online at: http://badc.nerc.ac.uk/view/badc.nerc.ac.uk__ATOM__ACTIVITY_3ec0d1c6-4616-11e2-89a3-00163e251233.
2) For the analysis of local climate patterns, BMKG data from Sampit, the capi-tal of Kotawaringin Timur District, was used instead of BMKG Palangka Raya, the capital of Central Kaliman-tan Province, because of its proximity to study area’s peatland.
Figure C1: Illustration of spatial resolution and coverage of CRU TS dataset
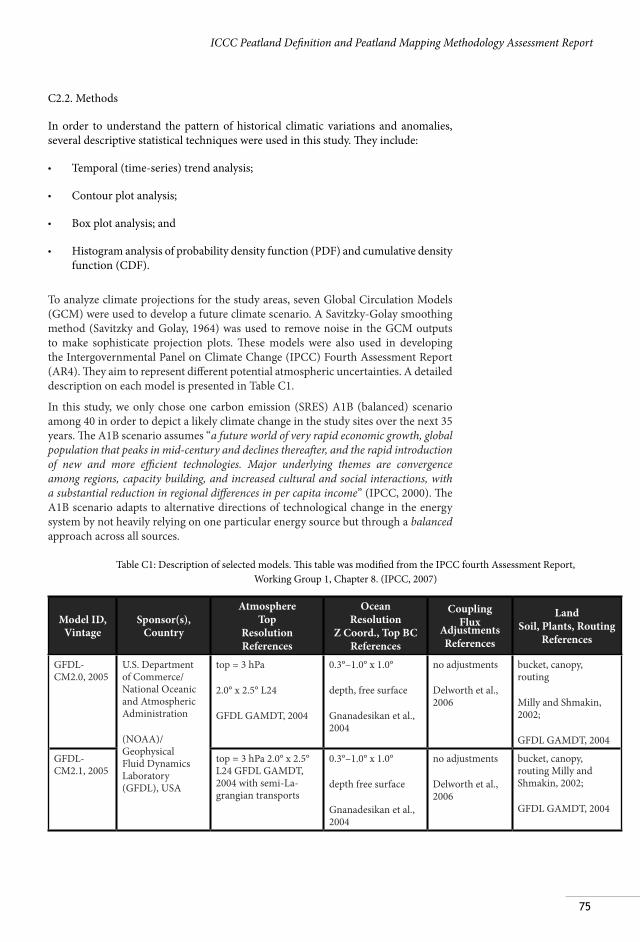
75
ICCC Peatland Definition and Peatland Mapping Methodology Assessment Report
C2.2. Methods
In order to understand the pattern of historical climatic variations and anomalies, several descriptive statistical techniques were used in this study. They include:
• Temporal (time-series) trend analysis;
• Contour plot analysis;
• Box plot analysis; and
• Histogram analysis of probability density function (PDF) and cumulative density function (CDF).
To analyze climate projections for the study areas, seven Global Circulation Models (GCM) were used to develop a future climate scenario. A Savitzky-Golay smoothing method (Savitzky and Golay, 1964) was used to remove noise in the GCM outputs to make sophisticate projection plots. These models were also used in developing the Intergovernmental Panel on Climate Change (IPCC) Fourth Assessment Report (AR4). They aim to represent different potential atmospheric uncertainties. A detailed description on each model is presented in Table C1.
In this study, we only chose one carbon emission (SRES) A1B (balanced) scenario among 40 in order to depict a likely climate change in the study sites over the next 35 years. The A1B scenario assumes “a future world of very rapid economic growth, global population that peaks in mid-century and declines thereafter, and the rapid introduction of new and more efficient technologies. Major underlying themes are convergence among regions, capacity building, and increased cultural and social interactions, with a substantial reduction in regional differences in per capita income” (IPCC, 2000). The A1B scenario adapts to alternative directions of technological change in the energy system by not heavily relying on one particular energy source but through a balanced approach across all sources.
Model ID, Vintage
Sponsor(s), Country
AtmosphereTop
ResolutionReferences
OceanResolution
Z Coord., Top BCReferences
CouplingFlux
AdjustmentsReferences
LandSoil, Plants, Routing
References
GFDL-CM2.0, 2005
U.S. Department of Commerce/National Oceanic and Atmospheric Administration
(NOAA)/Geophysical Fluid Dynamics Laboratory (GFDL), USA
top = 3 hPa
2.0° x 2.5° L24
GFDL GAMDT, 2004
0.3°–1.0° x 1.0°
depth, free surface
Gnanadesikan et al., 2004
no adjustments
Delworth et al., 2006
bucket, canopy, routing
Milly and Shmakin, 2002;
GFDL GAMDT, 2004
GFDL-CM2.1, 2005
top = 3 hPa 2.0° x 2.5° L24 GFDL GAMDT, 2004 with semi-La-grangian transports
0.3°–1.0° x 1.0°
depth free surface
Gnanadesikan et al., 2004
no adjustments
Delworth et al., 2006
bucket, canopy, routing Milly and Shmakin, 2002;
GFDL GAMDT, 2004
Table C1: Description of selected models. This table was modified from the IPCC fourth Assessment Report, Working Group 1, Chapter 8. (IPCC, 2007)
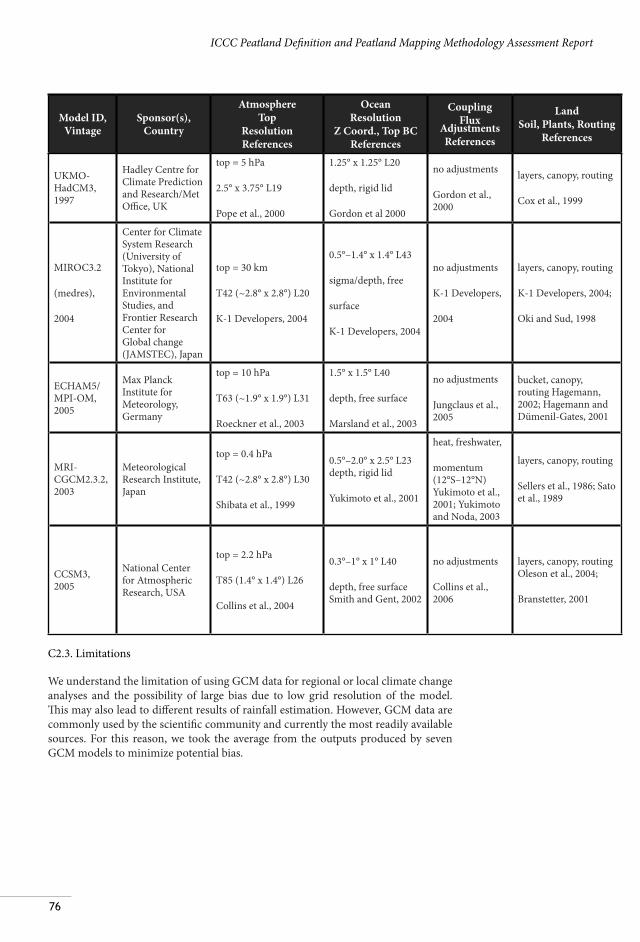
76
ICCC Peatland Definition and Peatland Mapping Methodology Assessment Report
Model ID, Vintage
Sponsor(s), Country
AtmosphereTop
ResolutionReferences
OceanResolution
Z Coord., Top BCReferences
CouplingFlux
AdjustmentsReferences
LandSoil, Plants, Routing
References
UKMO-HadCM3, 1997
Hadley Centre for Climate Prediction and Research/Met Office, UK
top = 5 hPa
2.5° x 3.75° L19
Pope et al., 2000
1.25° x 1.25° L20
depth, rigid lid
Gordon et al 2000
no adjustments
Gordon et al., 2000
layers, canopy, routing
Cox et al., 1999
MIROC3.2
(medres),
2004
Center for Climate System Research (University of Tokyo), National Institute for Environmental Studies, and Frontier Research Center for Global change (JAMSTEC), Japan
top = 30 km
T42 (~2.8° x 2.8°) L20
K-1 Developers, 2004
0.5°–1.4° x 1.4° L43
sigma/depth, free
surface
K-1 Developers, 2004
no adjustments
K-1 Developers,
2004
layers, canopy, routing
K-1 Developers, 2004;
Oki and Sud, 1998
ECHAM5/MPI-OM, 2005
Max Planck Institute for Meteorology, Germany
top = 10 hPa
T63 (~1.9° x 1.9°) L31
Roeckner et al., 2003
1.5° x 1.5° L40
depth, free surface
Marsland et al., 2003
no adjustments
Jungclaus et al., 2005
bucket, canopy, routing Hagemann, 2002; Hagemann and Dümenil-Gates, 2001
MRI-CGCM2.3.2, 2003
Meteorological Research Institute, Japan
top = 0.4 hPa
T42 (~2.8° x 2.8°) L30
Shibata et al., 1999
0.5°–2.0° x 2.5° L23 depth, rigid lid
Yukimoto et al., 2001
heat, freshwater,
momentum (12°S–12°N) Yukimoto et al., 2001; Yukimoto and Noda, 2003
layers, canopy, routing
Sellers et al., 1986; Sato et al., 1989
CCSM3, 2005
National Center for Atmospheric Research, USA
top = 2.2 hPa
T85 (1.4° x 1.4°) L26
Collins et al., 2004
0.3°–1° x 1° L40
depth, free surface Smith and Gent, 2002
no adjustments
Collins et al., 2006
layers, canopy, routing Oleson et al., 2004;
Branstetter, 2001
C2.3. Limitations
We understand the limitation of using GCM data for regional or local climate change analyses and the possibility of large bias due to low grid resolution of the model. This may also lead to different results of rainfall estimation. However, GCM data are commonly used by the scientific community and currently the most readily available sources. For this reason, we took the average from the outputs produced by seven GCM models to minimize potential bias.
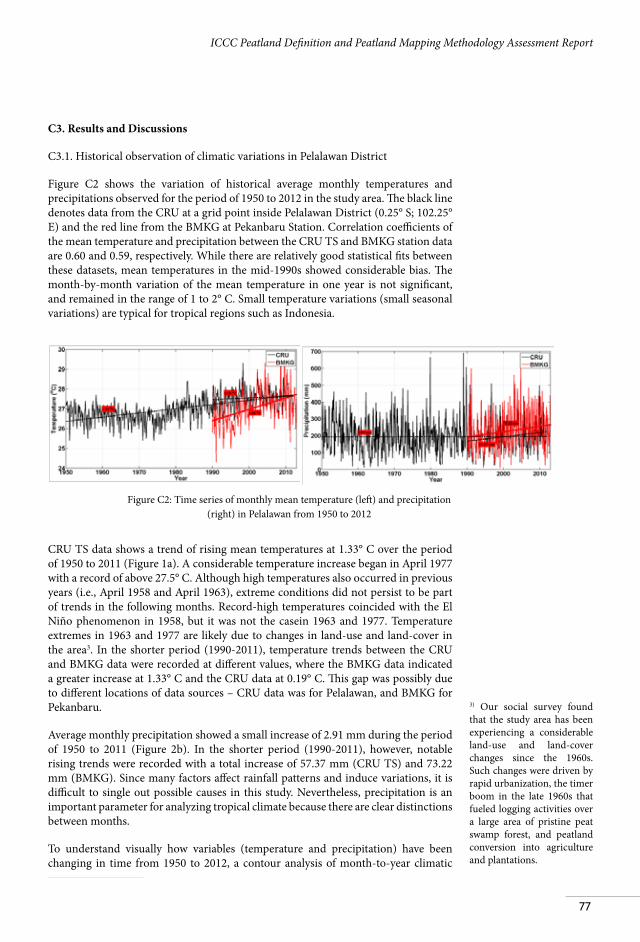
77
ICCC Peatland Definition and Peatland Mapping Methodology Assessment Report
C3. Results and Discussions
C3.1. Historical observation of climatic variations in Pelalawan District
Figure C2 shows the variation of historical average monthly temperatures and precipitations observed for the period of 1950 to 2012 in the study area. The black line denotes data from the CRU at a grid point inside Pelalawan District (0.25° S; 102.25° E) and the red line from the BMKG at Pekanbaru Station. Correlation coefficients of the mean temperature and precipitation between the CRU TS and BMKG station data are 0.60 and 0.59, respectively. While there are relatively good statistical fits between these datasets, mean temperatures in the mid-1990s showed considerable bias. The month-by-month variation of the mean temperature in one year is not significant, and remained in the range of 1 to 2° C. Small temperature variations (small seasonal variations) are typical for tropical regions such as Indonesia.
CRU TS data shows a trend of rising mean temperatures at 1.33° C over the period of 1950 to 2011 (Figure 1a). A considerable temperature increase began in April 1977 with a record of above 27.5° C. Although high temperatures also occurred in previous years (i.e., April 1958 and April 1963), extreme conditions did not persist to be part of trends in the following months. Record-high temperatures coincided with the El Niño phenomenon in 1958, but it was not the casein 1963 and 1977. Temperature extremes in 1963 and 1977 are likely due to changes in land-use and land-cover in the area3. In the shorter period (1990-2011), temperature trends between the CRU and BMKG data were recorded at different values, where the BMKG data indicated a greater increase at 1.33° C and the CRU data at 0.19° C. This gap was possibly due to different locations of data sources – CRU data was for Pelalawan, and BMKG for Pekanbaru.
Average monthly precipitation showed a small increase of 2.91 mm during the period of 1950 to 2011 (Figure 2b). In the shorter period (1990-2011), however, notable rising trends were recorded with a total increase of 57.37 mm (CRU TS) and 73.22 mm (BMKG). Since many factors affect rainfall patterns and induce variations, it is difficult to single out possible causes in this study. Nevertheless, precipitation is an important parameter for analyzing tropical climate because there are clear distinctions between months.
To understand visually how variables (temperature and precipitation) have been changing in time from 1950 to 2012, a contour analysis of month-to-year climatic
3) Our social survey found that the study area has been experiencing a considerable land-use and land-cover changes since the 1960s. Such changes were driven by rapid urbanization, the timer boom in the late 1960s that fueled logging activities over a large area of pristine peat swamp forest, and peatland conversion into agriculture and plantations.
Figure C2: Time series of monthly mean temperature (left) and precipitation (right) in Pelalawan from 1950 to 2012
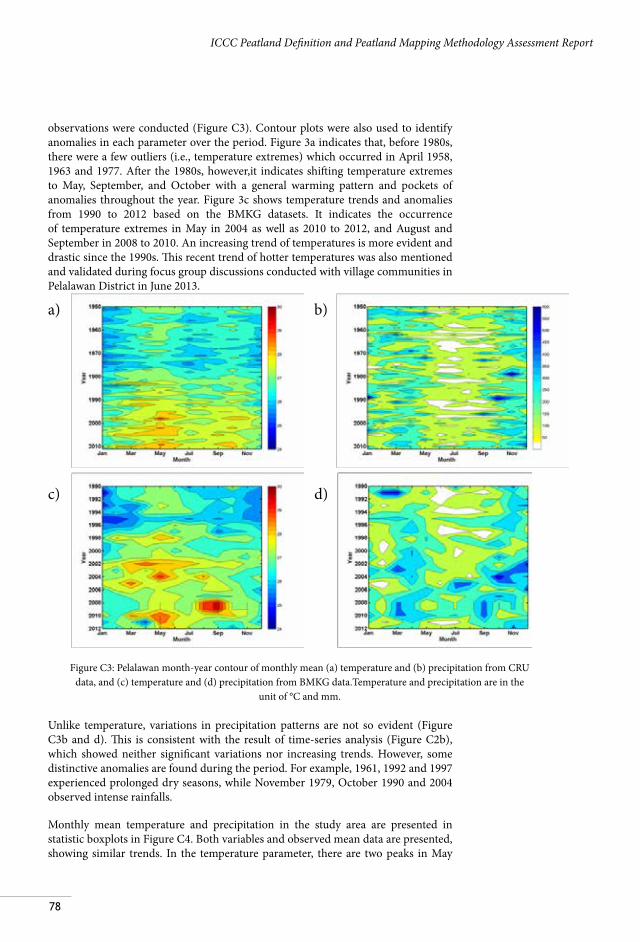
78
ICCC Peatland Definition and Peatland Mapping Methodology Assessment Report
observations were conducted (Figure C3). Contour plots were also used to identify anomalies in each parameter over the period. Figure 3a indicates that, before 1980s, there were a few outliers (i.e., temperature extremes) which occurred in April 1958, 1963 and 1977. After the 1980s, however,it indicates shifting temperature extremes to May, September, and October with a general warming pattern and pockets of anomalies throughout the year. Figure 3c shows temperature trends and anomalies from 1990 to 2012 based on the BMKG datasets. It indicates the occurrence of temperature extremes in May in 2004 as well as 2010 to 2012, and August and September in 2008 to 2010. An increasing trend of temperatures is more evident and drastic since the 1990s. This recent trend of hotter temperatures was also mentioned and validated during focus group discussions conducted with village communities in Pelalawan District in June 2013.
Unlike temperature, variations in precipitation patterns are not so evident (Figure C3b and d). This is consistent with the result of time-series analysis (Figure C2b), which showed neither significant variations nor increasing trends. However, some distinctive anomalies are found during the period. For example, 1961, 1992 and 1997 experienced prolonged dry seasons, while November 1979, October 1990 and 2004 observed intense rainfalls.
Monthly mean temperature and precipitation in the study area are presented in statistic boxplots in Figure C4. Both variables and observed mean data are presented, showing similar trends. In the temperature parameter, there are two peaks in May
a)
c)
b)
d)
Figure C3: Pelalawan month-year contour of monthly mean (a) temperature and (b) precipitation from CRU data, and (c) temperature and (d) precipitation from BMKG data.Temperature and precipitation are in the
unit of °C and mm.
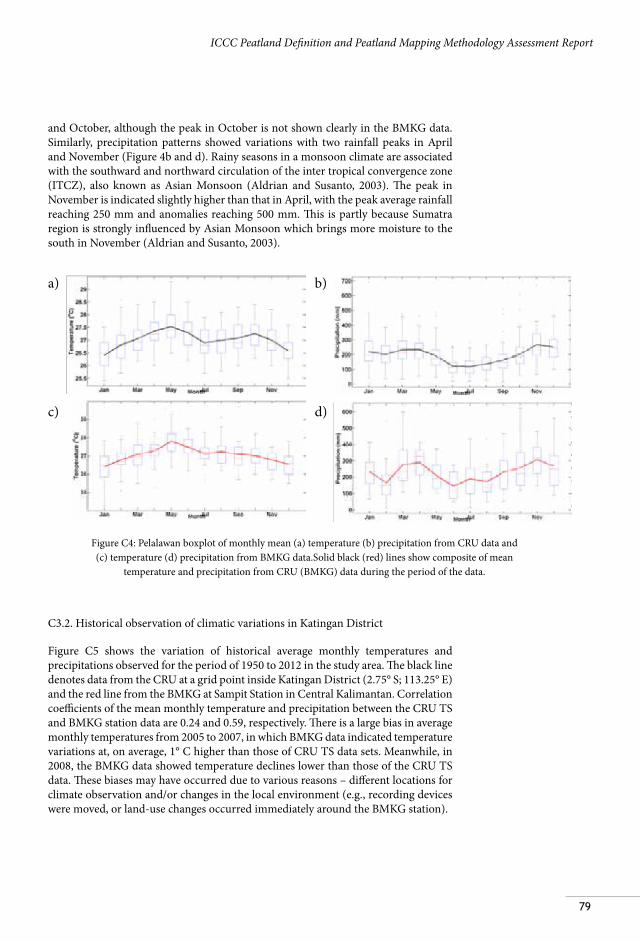
79
ICCC Peatland Definition and Peatland Mapping Methodology Assessment Report
and October, although the peak in October is not shown clearly in the BMKG data. Similarly, precipitation patterns showed variations with two rainfall peaks in April and November (Figure 4b and d). Rainy seasons in a monsoon climate are associated with the southward and northward circulation of the inter tropical convergence zone (ITCZ), also known as Asian Monsoon (Aldrian and Susanto, 2003). The peak in November is indicated slightly higher than that in April, with the peak average rainfall reaching 250 mm and anomalies reaching 500 mm. This is partly because Sumatra region is strongly influenced by Asian Monsoon which brings more moisture to the south in November (Aldrian and Susanto, 2003).
C3.2. Historical observation of climatic variations in Katingan District
Figure C5 shows the variation of historical average monthly temperatures and precipitations observed for the period of 1950 to 2012 in the study area. The black line denotes data from the CRU at a grid point inside Katingan District (2.75° S; 113.25° E) and the red line from the BMKG at Sampit Station in Central Kalimantan. Correlation coefficients of the mean monthly temperature and precipitation between the CRU TS and BMKG station data are 0.24 and 0.59, respectively. There is a large bias in average monthly temperatures from 2005 to 2007, in which BMKG data indicated temperature variations at, on average, 1° C higher than those of CRU TS data sets. Meanwhile, in 2008, the BMKG data showed temperature declines lower than those of the CRU TS data. These biases may have occurred due to various reasons – different locations for climate observation and/or changes in the local environment (e.g., recording devices were moved, or land-use changes occurred immediately around the BMKG station).
a)
c)
b)
d)
Figure C4: Pelalawan boxplot of monthly mean (a) temperature (b) precipitation from CRU data and (c) temperature (d) precipitation from BMKG data.Solid black (red) lines show composite of mean
temperature and precipitation from CRU (BMKG) data during the period of the data.
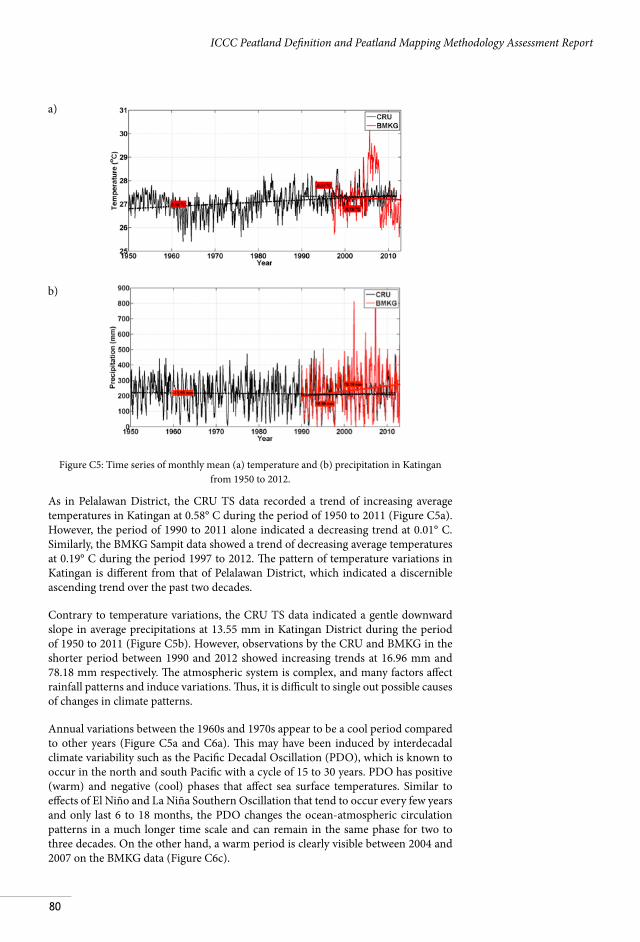
80
ICCC Peatland Definition and Peatland Mapping Methodology Assessment Report
Figure C5: Time series of monthly mean (a) temperature and (b) precipitation in Katingan from 1950 to 2012.
As in Pelalawan District, the CRU TS data recorded a trend of increasing average temperatures in Katingan at 0.58° C during the period of 1950 to 2011 (Figure C5a). However, the period of 1990 to 2011 alone indicated a decreasing trend at 0.01° C. Similarly, the BMKG Sampit data showed a trend of decreasing average temperatures at 0.19° C during the period 1997 to 2012. The pattern of temperature variations in Katingan is different from that of Pelalawan District, which indicated a discernible ascending trend over the past two decades.
Contrary to temperature variations, the CRU TS data indicated a gentle downward slope in average precipitations at 13.55 mm in Katingan District during the period of 1950 to 2011 (Figure C5b). However, observations by the CRU and BMKG in the shorter period between 1990 and 2012 showed increasing trends at 16.96 mm and 78.18 mm respectively. The atmospheric system is complex, and many factors affect rainfall patterns and induce variations. Thus, it is difficult to single out possible causes of changes in climate patterns.
Annual variations between the 1960s and 1970s appear to be a cool period compared to other years (Figure C5a and C6a). This may have been induced by interdecadal climate variability such as the Pacific Decadal Oscillation (PDO), which is known to occur in the north and south Pacific with a cycle of 15 to 30 years. PDO has positive (warm) and negative (cool) phases that affect sea surface temperatures. Similar to effects of El Niño and La Niña Southern Oscillation that tend to occur every few years and only last 6 to 18 months, the PDO changes the ocean-atmospheric circulation patterns in a much longer time scale and can remain in the same phase for two to three decades. On the other hand, a warm period is clearly visible between 2004 and 2007 on the BMKG data (Figure C6c).
a)
b)
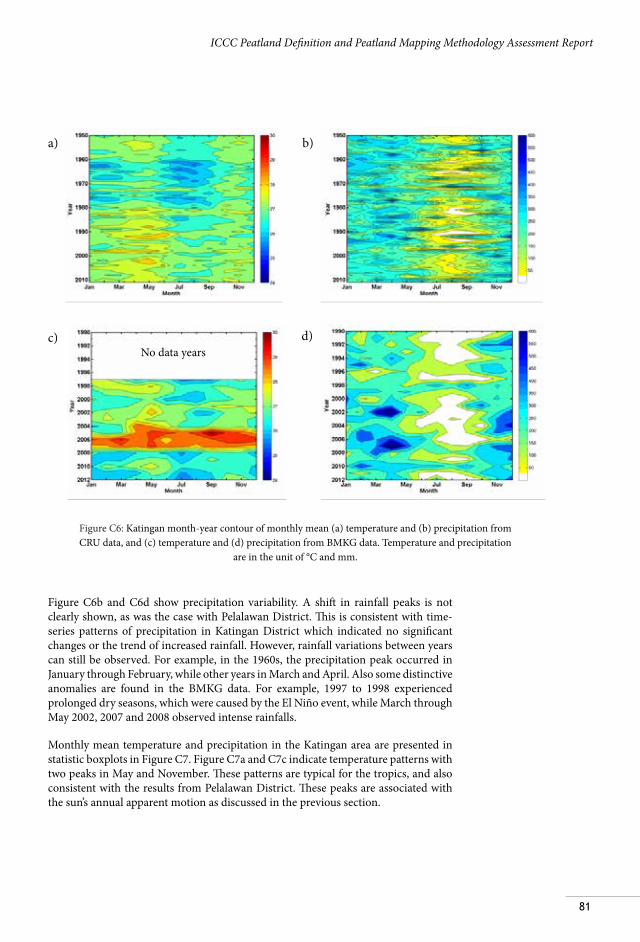
81
ICCC Peatland Definition and Peatland Mapping Methodology Assessment Report
Figure C6b and C6d show precipitation variability. A shift in rainfall peaks is not clearly shown, as was the case with Pelalawan District. This is consistent with time-series patterns of precipitation in Katingan District which indicated no significant changes or the trend of increased rainfall. However, rainfall variations between years can still be observed. For example, in the 1960s, the precipitation peak occurred in January through February, while other years in March and April. Also some distinctive anomalies are found in the BMKG data. For example, 1997 to 1998 experienced prolonged dry seasons, which were caused by the El Niño event, while March through May 2002, 2007 and 2008 observed intense rainfalls.
Monthly mean temperature and precipitation in the Katingan area are presented in statistic boxplots in Figure C7. Figure C7a and C7c indicate temperature patterns with two peaks in May and November. These patterns are typical for the tropics, and also consistent with the results from Pelalawan District. These peaks are associated with the sun’s annual apparent motion as discussed in the previous section.
a)
c)
b)
d)
Figure C6: Katingan month-year contour of monthly mean (a) temperature and (b) precipitation from CRU data, and (c) temperature and (d) precipitation from BMKG data. Temperature and precipitation
are in the unit of °C and mm.
No data years

82
ICCC Peatland Definition and Peatland Mapping Methodology Assessment Report
Precipitation in the Katingan area, on the other hand, shows a different pattern from that of Pelalawan District (Figure C7b and C7d). In Katingan, only one rainfall peak tends to occur in a year period, whereas in Pelalawan observed two distinctive peaks. This is a typical pattern in many regions in Indonesia, strongly influenced by the Asia Monsoon, and the peak rainfall in the study area can be observed between the months of December and April.
C3.3. Climate projection for Pelalawan District
As presented in Figure C8, temperature projections from 2001 to 2050 indicated a large difference between the seven GCM models used in this study. The UKMO-HadCM3 model tended to produce higher temperatures compared with other models, while the GFDL-CM2.1 model projected lower ranges. The other five models projected temperatures in between. The range between the highest to the lowest temperature was 3 to 4° C. This range is greater than the monthly variation of temperature itself.
a)
c)
b)
d)
Figure C7: Katingan boxplot of monthly mean (a) temperature (b) precipitation from CRU data and (c) temperature (d) precipitation from BMKG data.Solid black (red) lines show composite of mean temperature and
precipitation from CRU (BMKG) data during the period of the data.
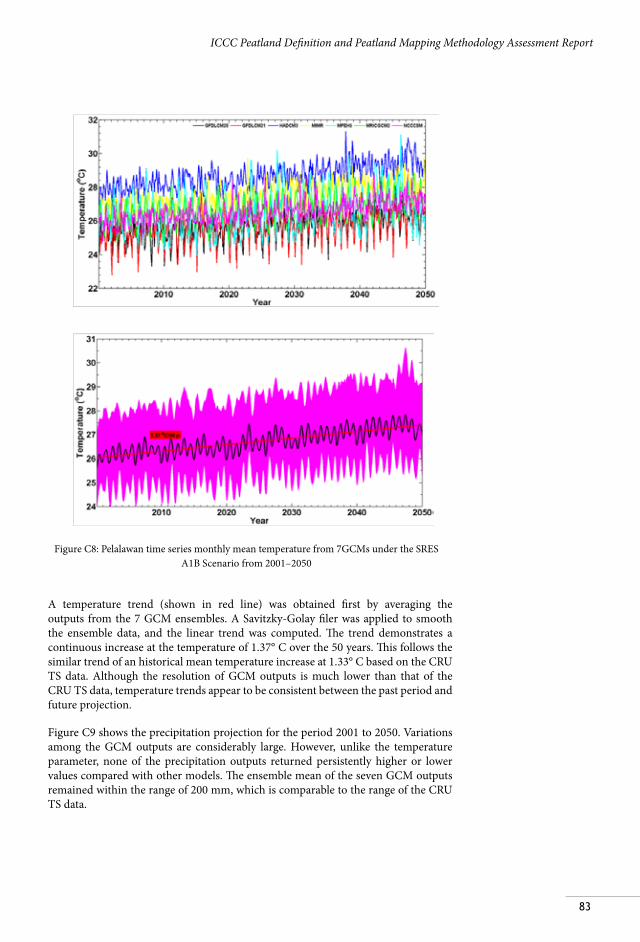
83
ICCC Peatland Definition and Peatland Mapping Methodology Assessment Report
A temperature trend (shown in red line) was obtained first by averaging the outputs from the 7 GCM ensembles. A Savitzky-Golay filer was applied to smooth the ensemble data, and the linear trend was computed. The trend demonstrates a continuous increase at the temperature of 1.37° C over the 50 years. This follows the similar trend of an historical mean temperature increase at 1.33° C based on the CRU TS data. Although the resolution of GCM outputs is much lower than that of the CRU TS data, temperature trends appear to be consistent between the past period and future projection.
Figure C9 shows the precipitation projection for the period 2001 to 2050. Variations among the GCM outputs are considerably large. However, unlike the temperature parameter, none of the precipitation outputs returned persistently higher or lower values compared with other models. The ensemble mean of the seven GCM outputs remained within the range of 200 mm, which is comparable to the range of the CRU TS data.
Figure C8: Pelalawan time series monthly mean temperature from 7GCMs under the SRES A1B Scenario from 2001–2050
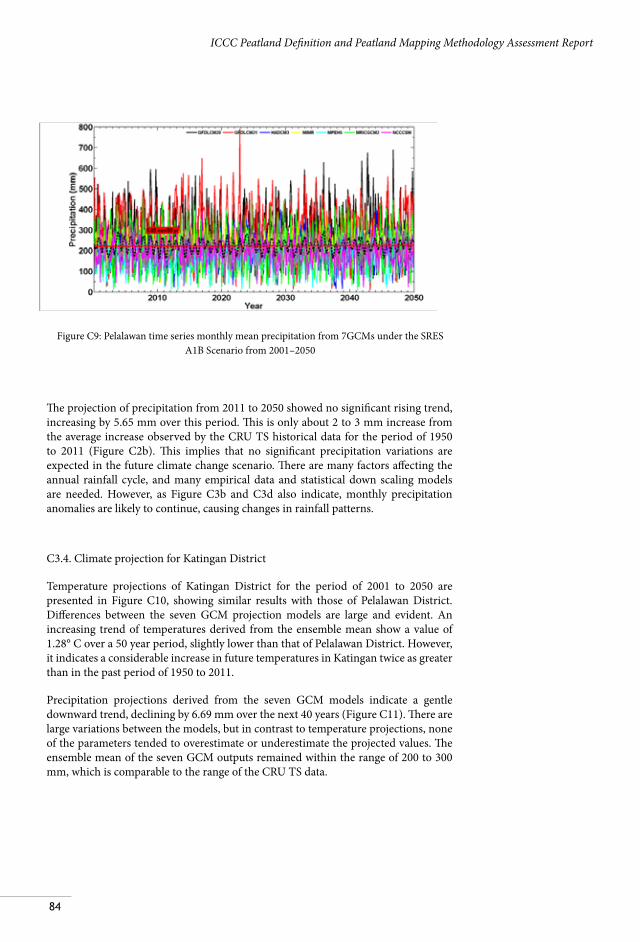
84
ICCC Peatland Definition and Peatland Mapping Methodology Assessment Report
The projection of precipitation from 2011 to 2050 showed no significant rising trend, increasing by 5.65 mm over this period. This is only about 2 to 3 mm increase from the average increase observed by the CRU TS historical data for the period of 1950 to 2011 (Figure C2b). This implies that no significant precipitation variations are expected in the future climate change scenario. There are many factors affecting the annual rainfall cycle, and many empirical data and statistical down scaling models are needed. However, as Figure C3b and C3d also indicate, monthly precipitation anomalies are likely to continue, causing changes in rainfall patterns.
C3.4. Climate projection for Katingan District
Temperature projections of Katingan District for the period of 2001 to 2050 are presented in Figure C10, showing similar results with those of Pelalawan District. Differences between the seven GCM projection models are large and evident. An increasing trend of temperatures derived from the ensemble mean show a value of 1.28° C over a 50 year period, slightly lower than that of Pelalawan District. However, it indicates a considerable increase in future temperatures in Katingan twice as greater than in the past period of 1950 to 2011.
Precipitation projections derived from the seven GCM models indicate a gentle downward trend, declining by 6.69 mm over the next 40 years (Figure C11). There are large variations between the models, but in contrast to temperature projections, none of the parameters tended to overestimate or underestimate the projected values. The ensemble mean of the seven GCM outputs remained within the range of 200 to 300 mm, which is comparable to the range of the CRU TS data.
Figure C9: Pelalawan time series monthly mean precipitation from 7GCMs under the SRES A1B Scenario from 2001–2050
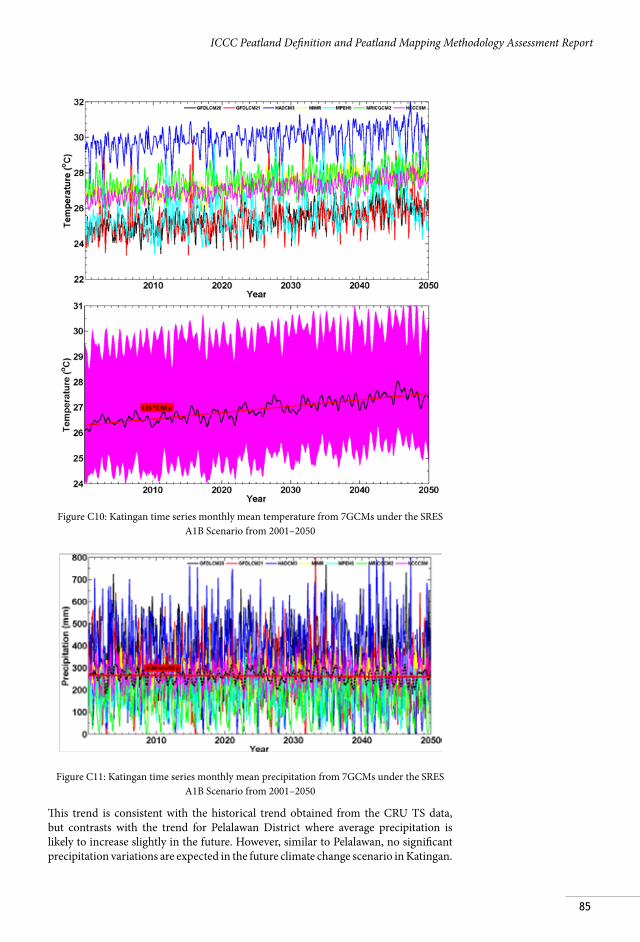
85
ICCC Peatland Definition and Peatland Mapping Methodology Assessment Report
Figure C10: Katingan time series monthly mean temperature from 7GCMs under the SRES A1B Scenario from 2001–2050
Figure C11: Katingan time series monthly mean precipitation from 7GCMs under the SRES A1B Scenario from 2001–2050
This trend is consistent with the historical trend obtained from the CRU TS data, but contrasts with the trend for Pelalawan District where average precipitation is likely to increase slightly in the future. However, similar to Pelalawan, no significant precipitation variations are expected in the future climate change scenario in Katingan.
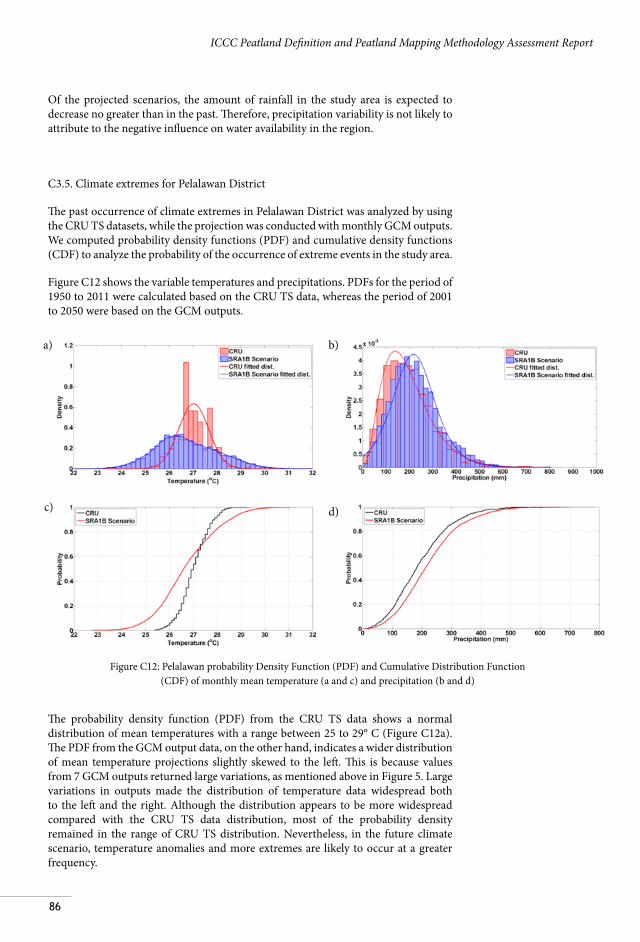
86
ICCC Peatland Definition and Peatland Mapping Methodology Assessment Report
Of the projected scenarios, the amount of rainfall in the study area is expected to decrease no greater than in the past. Therefore, precipitation variability is not likely to attribute to the negative influence on water availability in the region.
C3.5. Climate extremes for Pelalawan District
The past occurrence of climate extremes in Pelalawan District was analyzed by using the CRU TS datasets, while the projection was conducted with monthly GCM outputs. We computed probability density functions (PDF) and cumulative density functions (CDF) to analyze the probability of the occurrence of extreme events in the study area.
Figure C12 shows the variable temperatures and precipitations. PDFs for the period of 1950 to 2011 were calculated based on the CRU TS data, whereas the period of 2001 to 2050 were based on the GCM outputs.
The probability density function (PDF) from the CRU TS data shows a normal distribution of mean temperatures with a range between 25 to 29° C (Figure C12a). The PDF from the GCM output data, on the other hand, indicates a wider distribution of mean temperature projections slightly skewed to the left. This is because values from 7 GCM outputs returned large variations, as mentioned above in Figure 5. Large variations in outputs made the distribution of temperature data widespread both to the left and the right. Although the distribution appears to be more widespread compared with the CRU TS data distribution, most of the probability density remained in the range of CRU TS distribution. Nevertheless, in the future climate scenario, temperature anomalies and more extremes are likely to occur at a greater frequency.
Figure C12: Pelalawan probability Density Function (PDF) and Cumulative Distribution Function (CDF) of monthly mean temperature (a and c) and precipitation (b and d)
a)
c)
b)
d)
87
ICCC Peatland Definition and Peatland Mapping Methodology Assessment Report
On the contrary, the projection of average precipitation distribution patterns appeared to shift to the right compared with the historical precipitation patterns (Figure C12b). This implies that the frequency of the highest precipitation events (i.e., precipitation extremes) is likely to increase slightly. Furthermore, this also indicates that the more heavy rain falls are expected to occur at a greater frequency in the future.
By using the cumulative distribution function (CDF),we can determine the values which fall under the extreme category and the probability of its occurrence. Figure C12c shows the probability of the incidence of temperatures above 28° C and below 26° C, which occurred less than 10% of all events captured by the CRU TS data. High temperatures which occurred in April 1958, 1963 and 1977 (Figure C2) are examples of extreme events. The distribution of the probability for temperature extremes in the A1B future scenario is also widespread, creating extreme values (either high or low) in temperature that are quite different between the GCM outputs and the CRU TS data. These variations are due to the large difference between GCM projection values.
The shift in the frequency of extreme precipitation events shown in the PDF can also be observed in the CDF analysis. Extreme values with the probability of 10% on the CRU TS data increase by approximately 25 to 50 mm in the A1B future climate scenario. This magnitude is proportional to the increase in projected precipitation trends, and remains to be in the same range. Although the increase is relatively small, this still needs to be taken into consideration for future water management planning in the region.
C3.6. Climate extremes for Katingan District
Figure C13 shows the temperature and precipitation variables. Probability density functions (PDFs) for the period of 1950 to 2011 were calculated based on the CRU TS data, whereas the period of 2001 to 2050 were based on the GCM outputs.
The PDF of the CRU TS temperature data shows a normal distribution of mean temperatures with a range between 25 to 29° C (Figure C13a). GCM projection outputs indicated a wide range of mean temperature distribution due to large variations derived from the models. Nonetheless, the PDF form of projection data for Katingan District showed a slightly different projection pattern compared with that of Pelalawan District. The Katingan PDF indicated three mean temperature peaks.
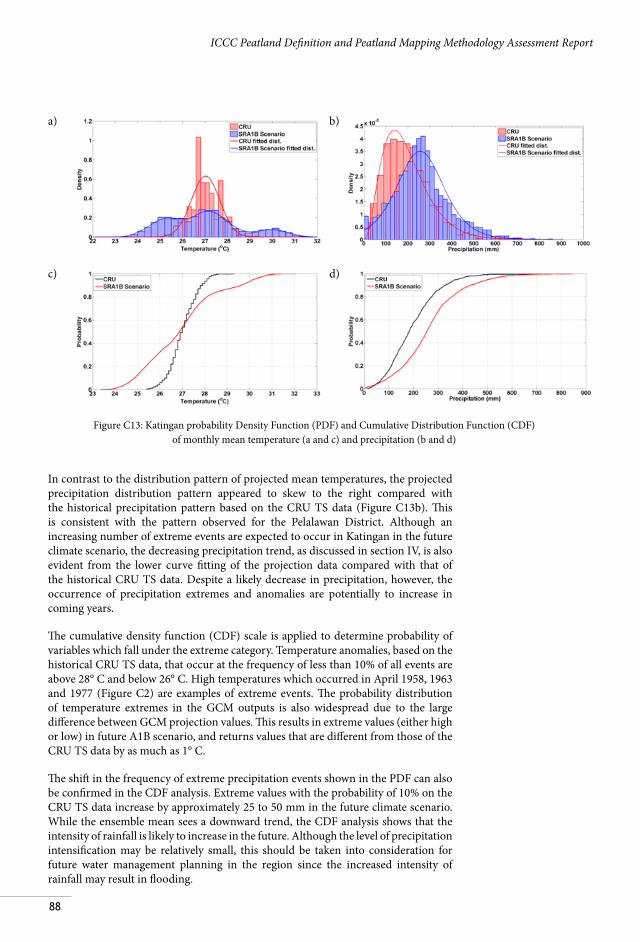
88
ICCC Peatland Definition and Peatland Mapping Methodology Assessment Report
In contrast to the distribution pattern of projected mean temperatures, the projected precipitation distribution pattern appeared to skew to the right compared with the historical precipitation pattern based on the CRU TS data (Figure C13b). This is consistent with the pattern observed for the Pelalawan District. Although an increasing number of extreme events are expected to occur in Katingan in the future climate scenario, the decreasing precipitation trend, as discussed in section IV, is also evident from the lower curve fitting of the projection data compared with that of the historical CRU TS data. Despite a likely decrease in precipitation, however, the occurrence of precipitation extremes and anomalies are potentially to increase in coming years.
The cumulative density function (CDF) scale is applied to determine probability of variables which fall under the extreme category. Temperature anomalies, based on the historical CRU TS data, that occur at the frequency of less than 10% of all events are above 28° C and below 26° C. High temperatures which occurred in April 1958, 1963 and 1977 (Figure C2) are examples of extreme events. The probability distribution of temperature extremes in the GCM outputs is also widespread due to the large difference between GCM projection values. This results in extreme values (either high or low) in future A1B scenario, and returns values that are different from those of the CRU TS data by as much as 1° C.
The shift in the frequency of extreme precipitation events shown in the PDF can also be confirmed in the CDF analysis. Extreme values with the probability of 10% on the CRU TS data increase by approximately 25 to 50 mm in the future climate scenario. While the ensemble mean sees a downward trend, the CDF analysis shows that the intensity of rainfall is likely to increase in the future. Although the level of precipitation intensification may be relatively small, this should be taken into consideration for future water management planning in the region since the increased intensity of rainfall may result in flooding.
a) b)
d)c)
Figure C13: Katingan probability Density Function (PDF) and Cumulative Distribution Function (CDF) of monthly mean temperature (a and c) and precipitation (b and d)
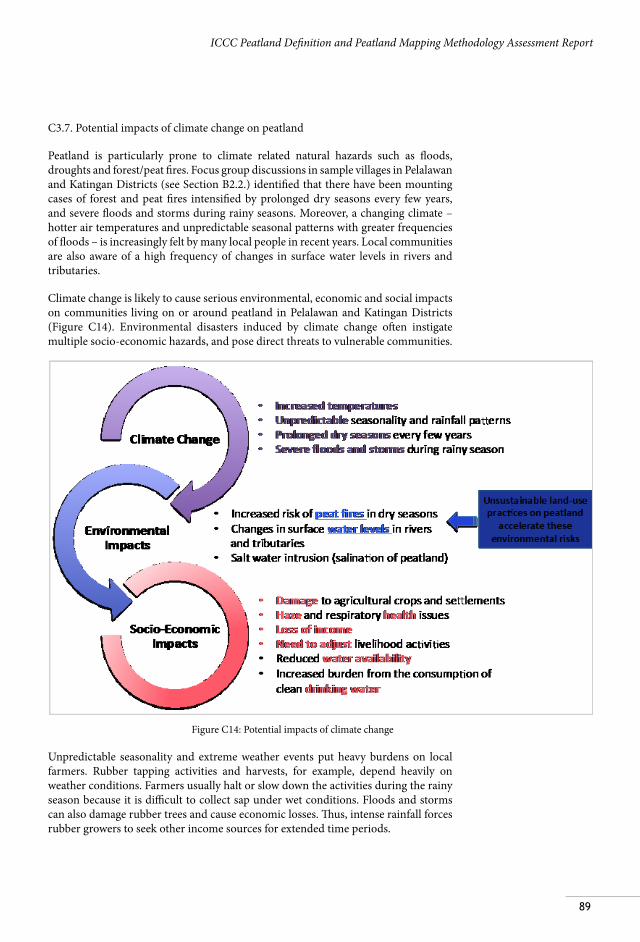
89
ICCC Peatland Definition and Peatland Mapping Methodology Assessment Report
C3.7. Potential impacts of climate change on peatland
Peatland is particularly prone to climate related natural hazards such as floods, droughts and forest/peat fires. Focus group discussions in sample villages in Pelalawan and Katingan Districts (see Section B2.2.) identified that there have been mounting cases of forest and peat fires intensified by prolonged dry seasons every few years, and severe floods and storms during rainy seasons. Moreover, a changing climate – hotter air temperatures and unpredictable seasonal patterns with greater frequencies of floods – is increasingly felt by many local people in recent years. Local communities are also aware of a high frequency of changes in surface water levels in rivers and tributaries.
Climate change is likely to cause serious environmental, economic and social impacts on communities living on or around peatland in Pelalawan and Katingan Districts (Figure C14). Environmental disasters induced by climate change often instigate multiple socio-economic hazards, and pose direct threats to vulnerable communities.
Figure C14: Potential impacts of climate change
Unpredictable seasonality and extreme weather events put heavy burdens on local farmers. Rubber tapping activities and harvests, for example, depend heavily on weather conditions. Farmers usually halt or slow down the activities during the rainy season because it is difficult to collect sap under wet conditions. Floods and storms can also damage rubber trees and cause economic losses. Thus, intense rainfall forces rubber growers to seek other income sources for extended time periods.
90
ICCC Peatland Definition and Peatland Mapping Methodology Assessment Report
Communities who live in the study areas face an increasing risk of peat fires during the dry season. Peat fires cause a number of hazards including CO2 emissions, haze, respiratory health problems, and socio-economic losses. They spread quickly, and pose immediate threats to agricultural crops, plantations and settlements. In Pelalawan, peat fire has been a serious problem because of a large-scale land-cover change on peatland (see Section B3.2.). Many farmers have experienced peat fires in their plantations and gardens especially during El Niño years, and have lost considerable harvests for the season. In Katingan, on the other hand, most fires have occurred on barren lands and grasslands. However, some farmers have experienced recurring peat fires in their agricultural lands during the dry periods.
Healthy peat swamp forest is constantly inundated, and plays an important role in preventing the spread of fires. Thus, peat fires are almost always caused by direct or indirect human activities. Unsustainable land-use practices, such as the construction of canals and trenches on plantations, lower water table levels, and accelerate the risk of peat fires in the study areas.
Another potential climate impact is salt water intrusion into surrounding peatland and agricultural lands as a result of lower water levels and changes in rainfall regimes. Salt water intrusion has been observed by several community members in the study areas. This potentially poses a significant threat to the area’s peatland ecosystems. It could damage trees and aquatic organisms, and agricultural productivity and crop yields could also decrease drastically due to the salinaty of peatland.
Changing rainfall patterns put heavy burdens on local communities because they affect agricultural/fishing calendars, crop selections and planting/harvesting practices. In order to cope with climate risks, most communities in the study areas adjust their livelihoods and rely on more than a single source of income to diversify economic uncertainties due to undesirable weather, fires, floods or droughts.
91
ICCC Peatland Definition and Peatland Mapping Methodology Assessment Report
Section D:
USE OF SATELLITE-BASED GROUND WATER TABLE DATA FOR ESTIMATING NET CO2
EMISSIONS FROM PEATLAND
D1. Introduction
Tropical peatland is one of the largest terrestrial carbon stores, and plays a major role in global hydrological cycles and atmospheric circulation. Although the decomposition of organic matters occurs naturally over time, in Indonesia, it has been extensively and rapidly caused by the degradation of peat compounds due to anthropogenic activities. Peatland degradation in Indonesia is often associated with forest conversion, deforestation and peat fires. Peat drainage due to the construction of canals and ditches for irrigation and transportation purposes lowers ground water table (GWT) depths, resulting in the loss of hydrological integrity, peat oxidation and subsidence. This results in greenhouse gases being released into the atmosphere in mass quantities, and consequently leads to climate change.
While there are a number of pieces of research which have studied the effect of drainage on CO2 emissions based on subsidence data and chamber methods, the magnitude of ecosystem-scale carbon balance on tropical peatland is still unknown (Hirano, et. al., 2012). GWT is one of the key parameters to understand carbon cycling on peatland, and the monitoring and recording of GWT fluctuations is crucial to quantify their net CO2 emissions. Thus, this section of the report presents key steps and preliminary results from the assessment of a satellite-based net CO2 estimation methodology based on the eddy covariance technique and empirical GWT measurements on peatland in Pelalawan and Katingan Districts.
Moreover, this study aimed to assess the methodology for the estimation of the volume of water released from peatland into canals at maximum and minimum scenarios. Although the preliminary results from the hydrological drainage model could not be integrated into the overall estimation of CO2 emissions from peatland during this assignment (due to time and resource constraints), this model is instrumental to analyze the potential effect of canal and irrigation trench development on peatland in future research.
D2. Methodology
D2.1. Theoretical background of the estimation of CO2 emissions from satellite-based GWT data
The estimation of net ecosystem CO2 exchange (NEE) values is key to defining the role of peatland ecosystems within the global carbon cycle. The annual NEE in particular peatland ecosystems can be estimated by the satellite-based GWT data, because there seems to be a linear relationship between NEE in the atmosphere and ground water level (GWL) (Hirano, et. al., 2012). NEE can be expressed as follows:
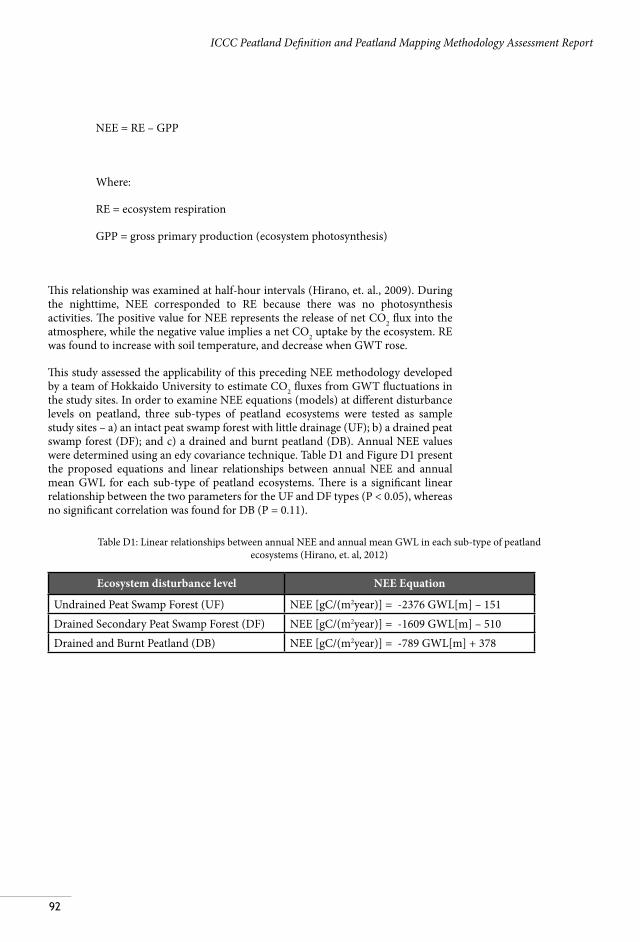
92
ICCC Peatland Definition and Peatland Mapping Methodology Assessment Report
NEE = RE – GPP
Where:
RE = ecosystem respiration
GPP = gross primary production (ecosystem photosynthesis)
This relationship was examined at half-hour intervals (Hirano, et. al., 2009). During the nighttime, NEE corresponded to RE because there was no photosynthesis activities. The positive value for NEE represents the release of net CO2 flux into the atmosphere, while the negative value implies a net CO2 uptake by the ecosystem. RE was found to increase with soil temperature, and decrease when GWT rose.
This study assessed the applicability of this preceding NEE methodology developed by a team of Hokkaido University to estimate CO2 fluxes from GWT fluctuations in the study sites. In order to examine NEE equations (models) at different disturbance levels on peatland, three sub-types of peatland ecosystems were tested as sample study sites – a) an intact peat swamp forest with little drainage (UF); b) a drained peat swamp forest (DF); and c) a drained and burnt peatland (DB). Annual NEE values were determined using an edy covariance technique. Table D1 and Figure D1 present the proposed equations and linear relationships between annual NEE and annual mean GWL for each sub-type of peatland ecosystems. There is a significant linear relationship between the two parameters for the UF and DF types (P < 0.05), whereas no significant correlation was found for DB (P = 0.11).
Ecosystem disturbance level NEE Equation
Undrained Peat Swamp Forest (UF) NEE [gC/(m2year)] = -2376 GWL[m] – 151Drained Secondary Peat Swamp Forest (DF) NEE [gC/(m2year)] = -1609 GWL[m] – 510Drained and Burnt Peatland (DB) NEE [gC/(m2year)] = -789 GWL[m] + 378
Table D1: Linear relationships between annual NEE and annual mean GWL in each sub-type of peatland ecosystems (Hirano, et. al, 2012)
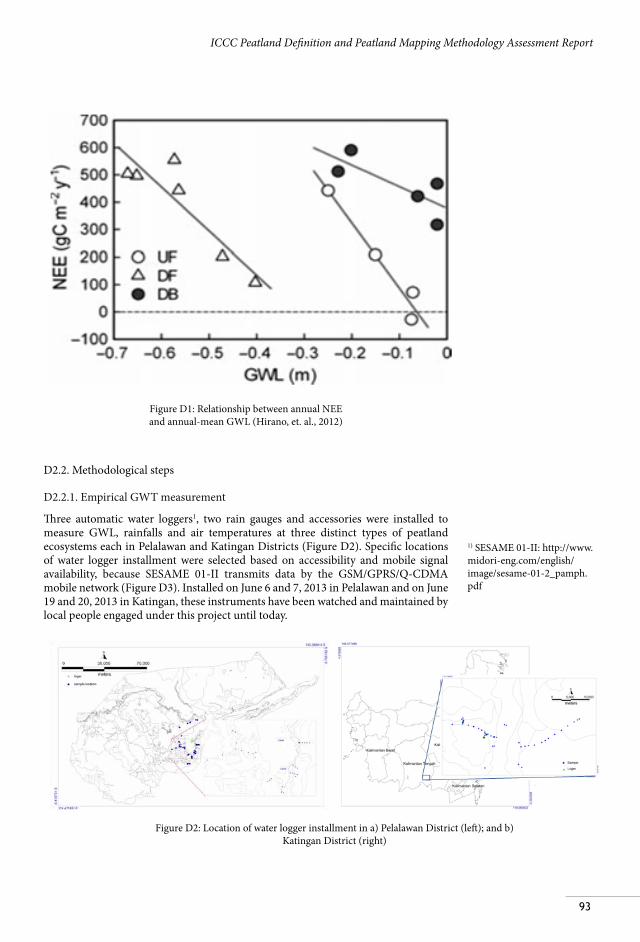
93
ICCC Peatland Definition and Peatland Mapping Methodology Assessment Report
Figure D1: Relationship between annual NEE and annual-mean GWL (Hirano, et. al., 2012)
D2.2. Methodological steps
D2.2.1. Empirical GWT measurement
Three automatic water loggers1, two rain gauges and accessories were installed to measure GWL, rainfalls and air temperatures at three distinct types of peatland ecosystems each in Pelalawan and Katingan Districts (Figure D2). Specific locations of water logger installment were selected based on accessibility and mobile signal availability, because SESAME 01-II transmits data by the GSM/GPRS/Q-CDMA mobile network (Figure D3). Installed on June 6 and 7, 2013 in Pelalawan and on June 19 and 20, 2013 in Katingan, these instruments have been watched and maintained by local people engaged under this project until today.
1) SESAME 01-II: http://www.midori-eng.com/english/image/sesame-01-2_pamph.pdf
Figure D2: Location of water logger installment in a) Pelalawan District (left); and b) Katingan District (right)
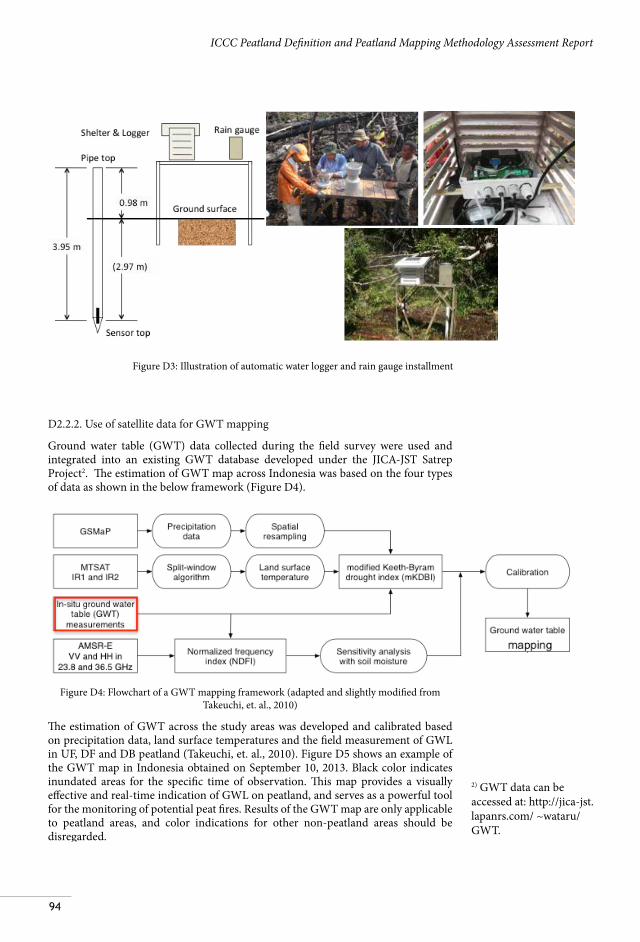
94
ICCC Peatland Definition and Peatland Mapping Methodology Assessment Report
2) GWT data can be accessed at: http://jica-jst.lapanrs.com/ ~wataru/GWT.
D2.2.2. Use of satellite data for GWT mapping
Ground water table (GWT) data collected during the field survey were used and integrated into an existing GWT database developed under the JICA-JST Satrep Project2. The estimation of GWT map across Indonesia was based on the four types of data as shown in the below framework (Figure D4).
Figure D4: Flowchart of a GWT mapping framework (adapted and slightly modified from Takeuchi, et. al., 2010)
The estimation of GWT across the study areas was developed and calibrated based on precipitation data, land surface temperatures and the field measurement of GWL in UF, DF and DB peatland (Takeuchi, et. al., 2010). Figure D5 shows an example of the GWT map in Indonesia obtained on September 10, 2013. Black color indicates inundated areas for the specific time of observation. This map provides a visually effective and real-time indication of GWL on peatland, and serves as a powerful tool for the monitoring of potential peat fires. Results of the GWT map are only applicable to peatland areas, and color indications for other non-peatland areas should be disregarded.
Figure D3: Illustration of automatic water logger and rain gauge installment

95
ICCC Peatland Definition and Peatland Mapping Methodology Assessment Report
Figure D5: Example of GWT estimation map in Indonesia (Takeuchi, et. al., 2010)
D2.2.3. Sub-types of peatland at the study sites for NEE estimation
The land cover analysis conducted in this study (see Sections B3.2. and B3.3.) classified peatland ecosystems of Pelalawan and Katingan Districts into 10 distinctive land cover types. Yet, the currently available NEE equations (models) are only eligible for three sub-types of peatland ecosystems, namely undrained peat swamp forest (UF), drained peat swamp forest (DF) and drained and burnt peatland (DB). Thus, defining the existing peat land cover types in study areas into these three eligible peatland ecosystems is crucial.
This study used only three land cover types from 2013 to be classified into these three types (Table D2), and other land cover types were excluded. This model uses the spatial resolution of 1/30 x 1/30 degrees, or 13.7 km2 per pixel. Therefore, the existing land cover types were converted into the same pixel size first, and reclassified into the eligible peatland ecosystems. When multiple land cover types were found inside one pixel, we selected only one land cover type which occupied more than 50% of the pixel and classified accordingly.
Due to the lack of empirical GWT data for the study sites, daily mean GWL was used for the estimation.
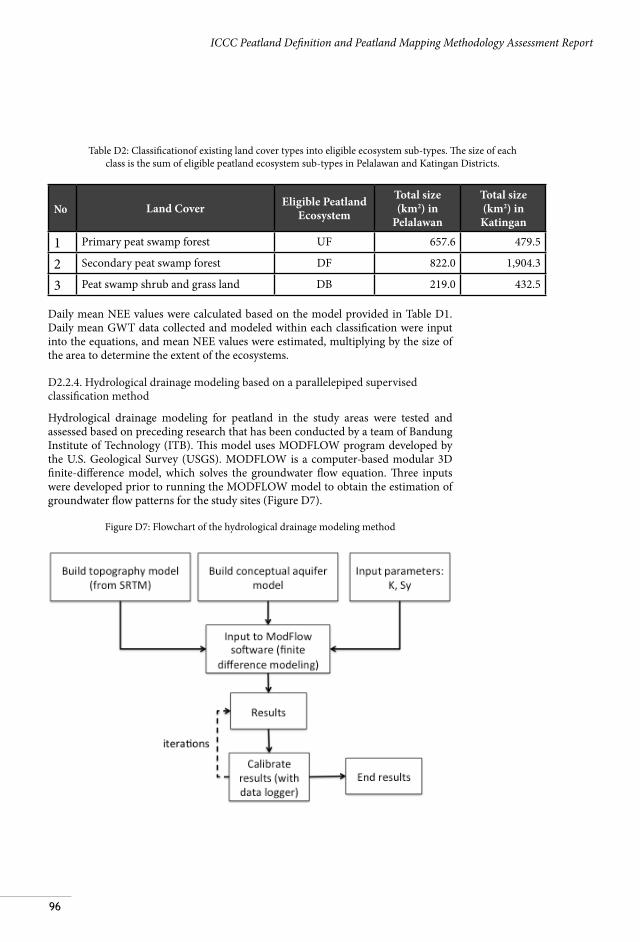
96
ICCC Peatland Definition and Peatland Mapping Methodology Assessment Report
No Land Cover Eligible Peatland Ecosystem
Total size (km2) in
Pelalawan
Total size (km2) in Katingan
1 Primary peat swamp forest UF 657.6 479.5
2 Secondary peat swamp forest DF 822.0 1,904.3
3 Peat swamp shrub and grass land DB 219.0 432.5
Daily mean NEE values were calculated based on the model provided in Table D1. Daily mean GWT data collected and modeled within each classification were input into the equations, and mean NEE values were estimated, multiplying by the size of the area to determine the extent of the ecosystems.
D2.2.4. Hydrological drainage modeling based on a parallelepiped supervised classification method
Hydrological drainage modeling for peatland in the study areas were tested and assessed based on preceding research that has been conducted by a team of Bandung Institute of Technology (ITB). This model uses MODFLOW program developed by the U.S. Geological Survey (USGS). MODFLOW is a computer-based modular 3D finite-difference model, which solves the groundwater flow equation. Three inputs were developed prior to running the MODFLOW model to obtain the estimation of groundwater flow patterns for the study sites (Figure D7).
Figure D7: Flowchart of the hydrological drainage modeling method
Table D2: Classificationof existing land cover types into eligible ecosystem sub-types. The size of each class is the sum of eligible peatland ecosystem sub-types in Pelalawan and Katingan Districts.
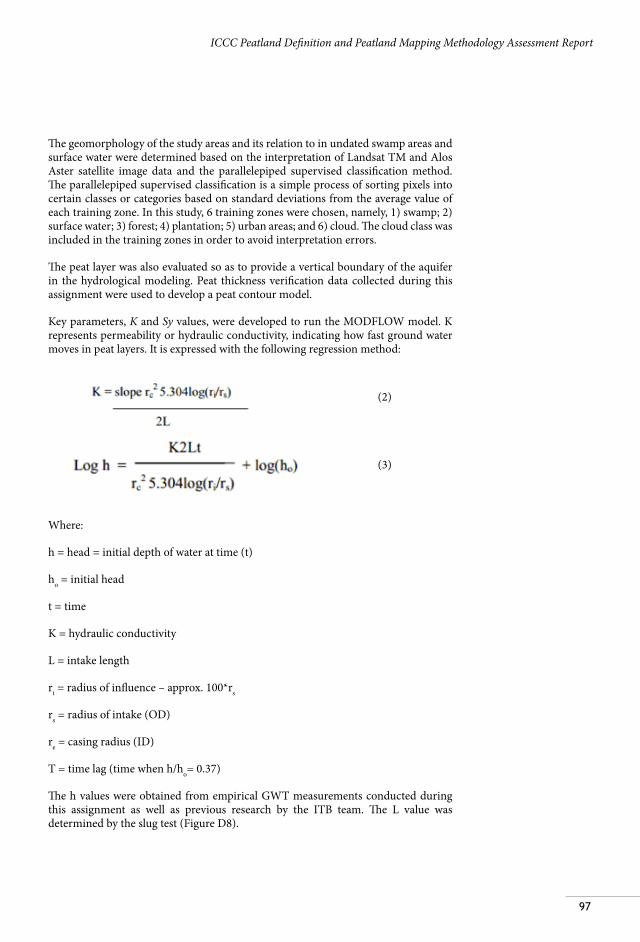
97
ICCC Peatland Definition and Peatland Mapping Methodology Assessment Report
The geomorphology of the study areas and its relation to in undated swamp areas and surface water were determined based on the interpretation of Landsat TM and Alos Aster satellite image data and the parallelepiped supervised classification method. The parallelepiped supervised classification is a simple process of sorting pixels into certain classes or categories based on standard deviations from the average value of each training zone. In this study, 6 training zones were chosen, namely, 1) swamp; 2) surface water; 3) forest; 4) plantation; 5) urban areas; and 6) cloud. The cloud class was included in the training zones in order to avoid interpretation errors.
The peat layer was also evaluated so as to provide a vertical boundary of the aquifer in the hydrological modeling. Peat thickness verification data collected during this assignment were used to develop a peat contour model.
Key parameters, K and Sy values, were developed to run the MODFLOW model. K represents permeability or hydraulic conductivity, indicating how fast ground water moves in peat layers. It is expressed with the following regression method:
Where:
h = head = initial depth of water at time (t)
ho = initial head
t = time
K = hydraulic conductivity
L = intake length
ri = radius of influence – approx. 100*rs
rs = radius of intake (OD)
re = casing radius (ID)
T = time lag (time when h/ho= 0.37)
The h values were obtained from empirical GWT measurements conducted during this assignment as well as previous research by the ITB team. The L value was determined by the slug test (Figure D8).
(2)
(3)
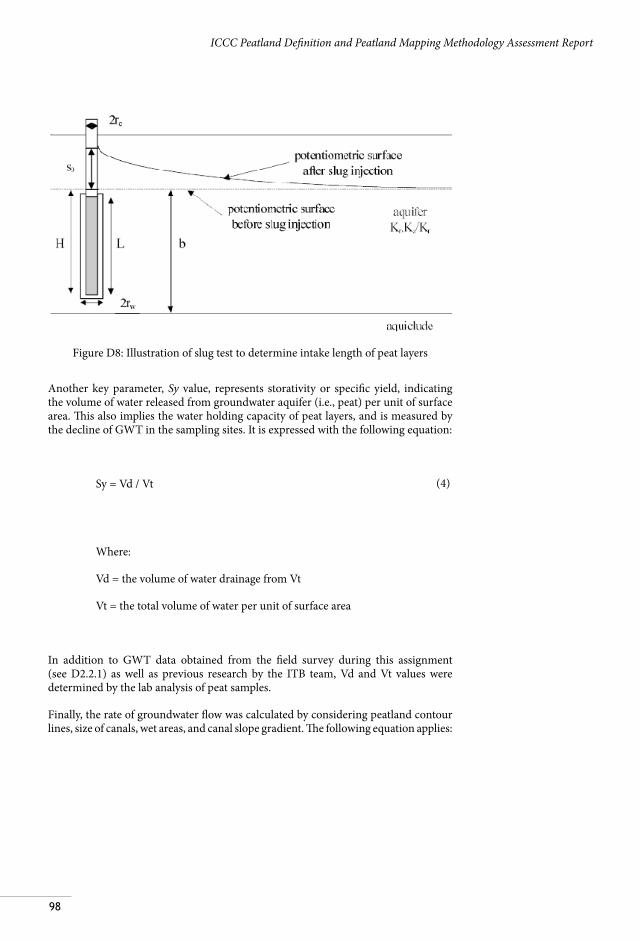
98
ICCC Peatland Definition and Peatland Mapping Methodology Assessment Report
Figure D8: Illustration of slug test to determine intake length of peat layers
Another key parameter, Sy value, represents storativity or specific yield, indicating the volume of water released from groundwater aquifer (i.e., peat) per unit of surface area. This also implies the water holding capacity of peat layers, and is measured by the decline of GWT in the sampling sites. It is expressed with the following equation:
Sy = Vd / Vt
Where:
Vd = the volume of water drainage from Vt
Vt = the total volume of water per unit of surface area
In addition to GWT data obtained from the field survey during this assignment (see D2.2.1) as well as previous research by the ITB team, Vd and Vt values were determined by the lab analysis of peat samples.
Finally, the rate of groundwater flow was calculated by considering peatland contour lines, size of canals, wet areas, and canal slope gradient. The following equation applies:
(4)
99
ICCC Peatland Definition and Peatland Mapping Methodology Assessment Report
Where:
Q = flow rate (LT-3) in m3 per second
A = wet surface area (L2)
S = canal slope gradient
n = manning coefficient
P = wet surface circumfence (L)
D2.3. Limitations
Although this methodology has a great potential for the estimation of CO2 fluxes and emissions from peatland throughout Indonesia, the precision of the model heavily depends on the number of empirical GWT data collected across regions. The quality of satellite-based GWT maps can be improved by installing more meteorological measurement units on the ground, especially in peatland ecosystems.
In this study, we examined the applicability of the satellite-based CO2 emission estimation model for both Pelalawan and Katingan study sites mostly based on empirical data from Central Kalimantan province provided by the JICA-JST Satrep Project. This model requires annual mean GWT data, and thus, ground data over an extended time period is necessary. Due to time and resource constraints during this study, we adopted GWT data of Central Kalimantan for Pelalawan District. Since characteristics of peatland in Pelalawan may be quite different from those in Katingan (in this case, Central Kalimantan), a long-term research and GWT data collection in both sites are important for a more accurate estimation.
Currently, NEE equations (models) areonly applicable for three sub-types of peatland ecosystems, namely undrained peat swamp forest (UF), drained peat swamp forest (DF) and drained and burnt peatland (DB). Other existing land cover types in the study areas, such as oil palm plantation, plantation forest, agriculture, crop plantation and bare land, were excluded from the estimation of NEE. Furthermore, existing land cover types were reclassified into three eligible sub-types by converting them into pixels. In this process, even though there were multiple land cover types identified in one pixel, we adopted only one type which occupied more than 50% in the pixel. This created certain biases in estimating NEE values in each eligible peatland ecosystem sub-types.
Limitations on the hydrological drainage model also may have caused biases in the results. Firstly, the model was built based on limited transverse data from the field. Therefore it would make a certain level of bias for the area with no data. Secondly, the parameters (K and Sy) were calculated based onexisting data obtained from other peatland areas in Indonesia with similar characteristics. Finally, this model has only 2 scenarios (minimum and maximumGWT scenarios, explained in the result section), whereas GWT data obtained from the water loggers showed fluctuations.
(5)
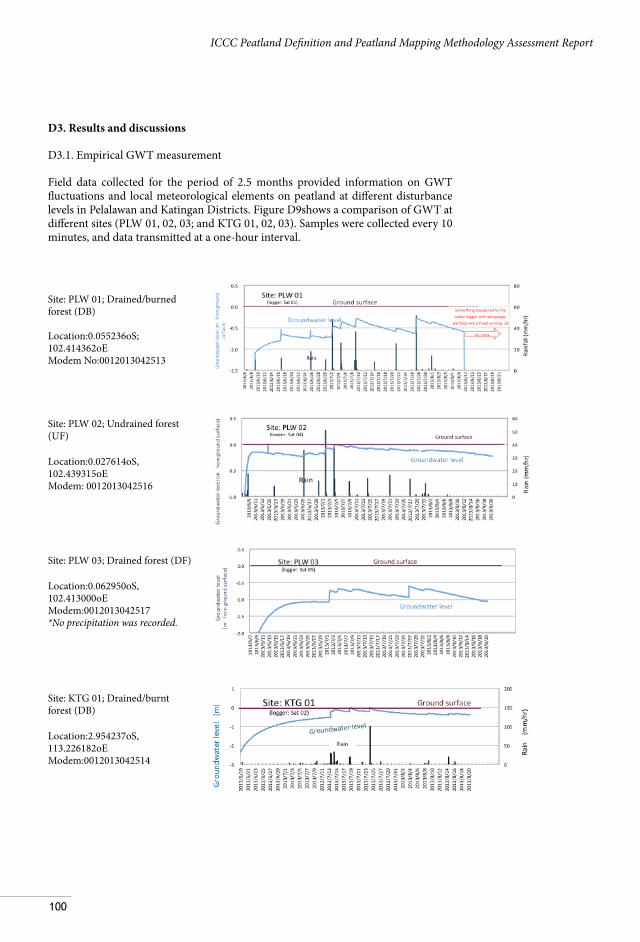
100
ICCC Peatland Definition and Peatland Mapping Methodology Assessment Report
D3. Results and discussions
D3.1. Empirical GWT measurement
Field data collected for the period of 2.5 months provided information on GWT fluctuations and local meteorological elements on peatland at different disturbance levels in Pelalawan and Katingan Districts. Figure D9shows a comparison of GWT at different sites (PLW 01, 02, 03; and KTG 01, 02, 03). Samples were collected every 10 minutes, and data transmitted at a one-hour interval.
Site: PLW 01; Drained/burned forest (DB) Location:0.055236oS; 102.414362oE Modem No:0012013042513
Site: PLW 02; Undrained forest (UF)
Location:0.027614oS, 102.439315oE Modem: 0012013042516
Site: PLW 03; Drained forest (DF)
Location:0.062950oS, 102.413000oE Modem:0012013042517 *No precipitation was recorded.
Site: KTG 01; Drained/burnt forest (DB)
Location:2.954237oS, 113.226182oE Modem:0012013042514
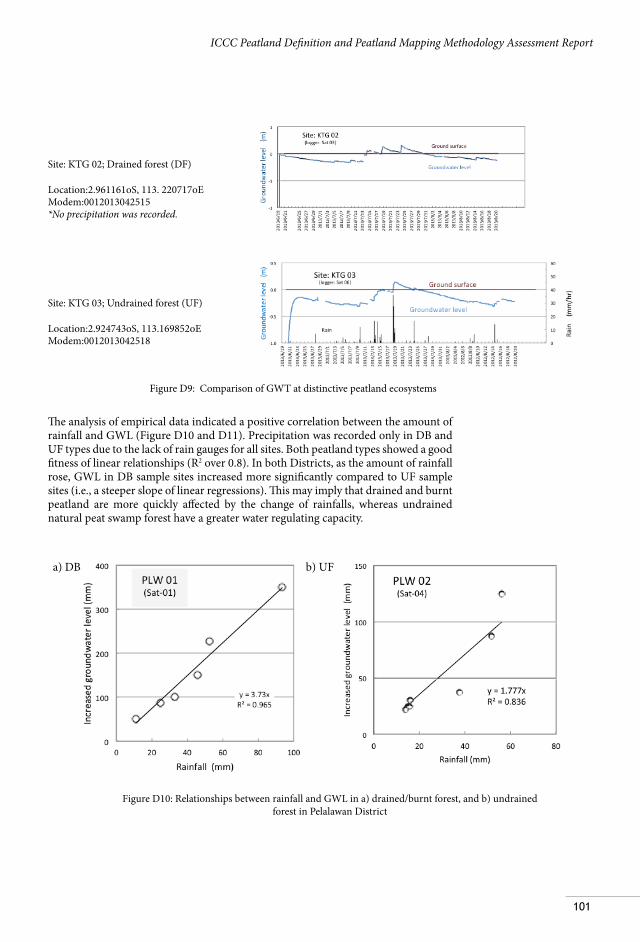
101
ICCC Peatland Definition and Peatland Mapping Methodology Assessment Report
Site: KTG 02; Drained forest (DF)
Location:2.961161oS, 113. 220717oE Modem:0012013042515 *No precipitation was recorded.
Site: KTG 03; Undrained forest (UF)
Location:2.924743oS, 113.169852oE Modem:0012013042518
The analysis of empirical data indicated a positive correlation between the amount of rainfall and GWL (Figure D10 and D11). Precipitation was recorded only in DB and UF types due to the lack of rain gauges for all sites. Both peatland types showed a good fitness of linear relationships (R2 over 0.8). In both Districts, as the amount of rainfall rose, GWL in DB sample sites increased more significantly compared to UF sample sites (i.e., a steeper slope of linear regressions). This may imply that drained and burnt peatland are more quickly affected by the change of rainfalls, whereas undrained natural peat swamp forest have a greater water regulating capacity.
Figure D10: Relationships between rainfall and GWL in a) drained/burnt forest, and b) undrained forest in Pelalawan District
a) DB b) UF
Figure D9: Comparison of GWT at distinctive peatland ecosystems
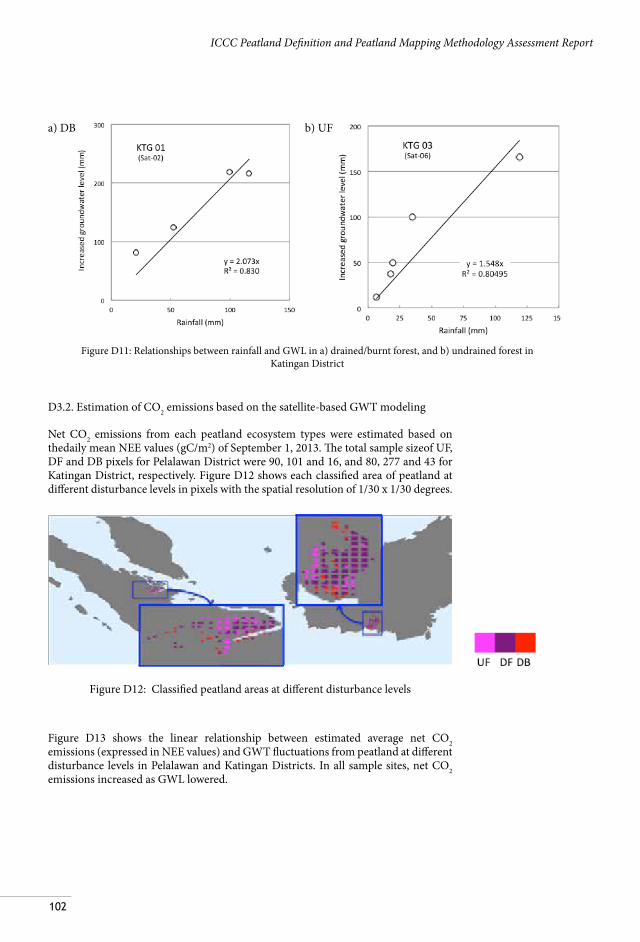
102
ICCC Peatland Definition and Peatland Mapping Methodology Assessment Report
D3.2. Estimation of CO2 emissions based on the satellite-based GWT modeling
Net CO2 emissions from each peatland ecosystem types were estimated based on thedaily mean NEE values (gC/m2) of September 1, 2013. The total sample sizeof UF, DF and DB pixels for Pelalawan District were 90, 101 and 16, and 80, 277 and 43 for Katingan District, respectively. Figure D12 shows each classified area of peatland at different disturbance levels in pixels with the spatial resolution of 1/30 x 1/30 degrees.
Figure D12: Classified peatland areas at different disturbance levels
Figure D13 shows the linear relationship between estimated average net CO2 emissions (expressed in NEE values) and GWT fluctuations from peatland at different disturbance levels in Pelalawan and Katingan Districts. In all sample sites, net CO2 emissions increased as GWL lowered.
Figure D11: Relationships between rainfall and GWL in a) drained/burnt forest, and b) undrained forest in Katingan District
a) DB b) UF
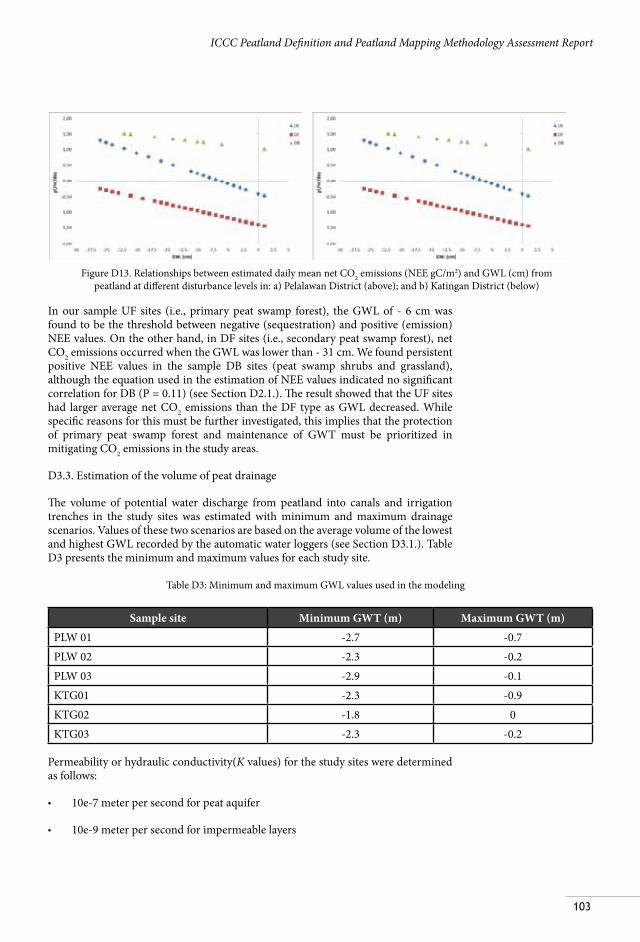
103
ICCC Peatland Definition and Peatland Mapping Methodology Assessment Report
In our sample UF sites (i.e., primary peat swamp forest), the GWL of - 6 cm was found to be the threshold between negative (sequestration) and positive (emission) NEE values. On the other hand, in DF sites (i.e., secondary peat swamp forest), net CO2 emissions occurred when the GWL was lower than - 31 cm. We found persistent positive NEE values in the sample DB sites (peat swamp shrubs and grassland), although the equation used in the estimation of NEE values indicated no significant correlation for DB (P = 0.11) (see Section D2.1.). The result showed that the UF sites had larger average net CO2 emissions than the DF type as GWL decreased. While specific reasons for this must be further investigated, this implies that the protection of primary peat swamp forest and maintenance of GWT must be prioritized in mitigating CO2 emissions in the study areas.
D3.3. Estimation of the volume of peat drainage
The volume of potential water discharge from peatland into canals and irrigation trenches in the study sites was estimated with minimum and maximum drainage scenarios. Values of these two scenarios are based on the average volume of the lowest and highest GWL recorded by the automatic water loggers (see Section D3.1.). Table D3 presents the minimum and maximum values for each study site.
Sample site Minimum GWT (m) Maximum GWT (m)PLW 01 -2.7 -0.7PLW 02 -2.3 -0.2PLW 03 -2.9 -0.1KTG01 -2.3 -0.9KTG02 -1.8 0KTG03 -2.3 -0.2
Permeability or hydraulic conductivity(K values) for the study sites were determined as follows:
• 10e-7 meter per second for peat aquifer
• 10e-9 meter per second for impermeable layers
Table D3: Minimum and maximum GWL values used in the modeling
Figure D13. Relationships between estimated daily mean net CO2 emissions (NEE gC/m2) and GWL (cm) from peatland at different disturbance levels in: a) Pelalawan District (above); and b) Katingan District (below)
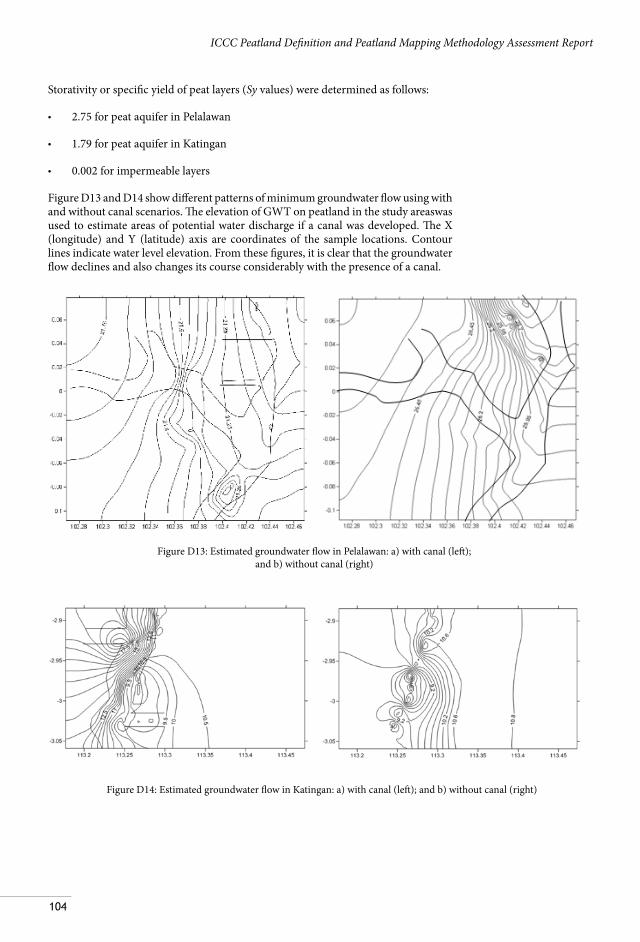
104
ICCC Peatland Definition and Peatland Mapping Methodology Assessment Report
Storativity or specific yield of peat layers (Sy values) were determined as follows:
• 2.75 for peat aquifer in Pelalawan
• 1.79 for peat aquifer in Katingan
• 0.002 for impermeable layers
Figure D13 and D14 show different patterns of minimum groundwater flow using with and without canal scenarios. The elevation of GWT on peatland in the study areaswas used to estimate areas of potential water discharge if a canal was developed. The X (longitude) and Y (latitude) axis are coordinates of the sample locations. Contour lines indicate water level elevation. From these figures, it is clear that the groundwater flow declines and also changes its course considerably with the presence of a canal.
Figure D13: Estimated groundwater flow in Pelalawan: a) with canal (left); and b) without canal (right)
Figure D14: Estimated groundwater flow in Katingan: a) with canal (left); and b) without canal (right)
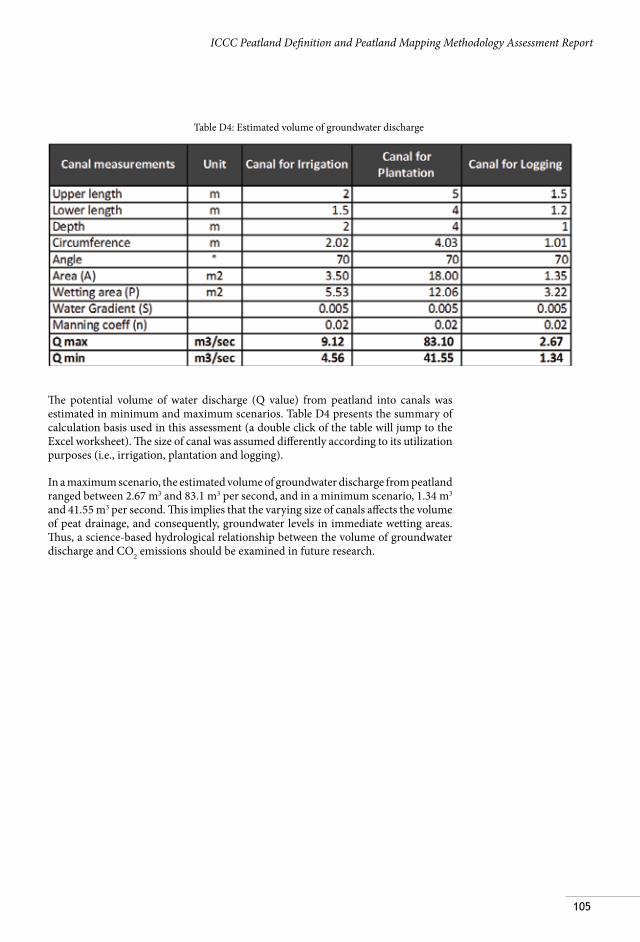
105
ICCC Peatland Definition and Peatland Mapping Methodology Assessment Report
The potential volume of water discharge (Q value) from peatland into canals was estimated in minimum and maximum scenarios. Table D4 presents the summary of calculation basis used in this assessment (a double click of the table will jump to the Excel worksheet). The size of canal was assumed differently according to its utilization purposes (i.e., irrigation, plantation and logging).
In a maximum scenario, the estimated volume of groundwater discharge from peatland ranged between 2.67 m3 and 83.1 m3 per second, and in a minimum scenario, 1.34 m3 and 41.55 m3 per second. This implies that the varying size of canals affects the volume of peat drainage, and consequently, groundwater levels in immediate wetting areas. Thus, a science-based hydrological relationship between the volume of groundwater discharge and CO2 emissions should be examined in future research.
Table D4: Estimated volume of groundwater discharge
106
ICCC Peatland Definition and Peatland Mapping Methodology Assessment Report
Section E:
TOWARD SUSTAINABLE PEATLAND MANAGEMENT IN INDONESIA
E1. Implications of sustainable peatland management for climate change mitigation
Climate change is likely to have devastating impacts on all sectors in Indonesia, and has already been observed in many parts of the country. As Section C of this report indicated, the historical observation of temperature and precipitation trends for Pelalawan and Katingan Districts has shown large variability in local climate patterns since 1950.
In Pelalawan, average air temperature has shown a rising trend of 1.33° C and rainfall patterns have indicated an increasing trend of anomalies (i.e., more frequent extremes such as drought and flood events) over the period of 1950-2011. The occurrence of extreme weather in the study area has been more frequent with increasing intensity. In Katingan, on the other hand, atrend of increasing average temperatures was recorded at 0.58° C during the overall period from 1950 to 2011, but a decreasing trend in recent years during the period between 1997 and 2012.The pattern of temperature variations in Katingan is different from that of the Pelalawan District, which indicated a discernible ascending trend over the past two decades.
Peatland is prone to climate related natural hazards such as floods, droughts and forest/peat fires. In Pelalawan District, there have been mounting cases of forest and peat fires intensified by prolonged dry seasons every few years, heat waves, and severe floods and storms during rainy seasons. Similarly, Katingan District is expected to experience rising temperatures but lower precipitations over the next few decades. Despite the decreasing precipitation trend, the intensity of rainfall is likely to increase, resulting in a greater risk of floods. Reduced rainfall and higher temperatures may also increase the risk of peat fires and other climate hazards.
Such climate hazards and their potential impacts can be further intensified by the recent trend of rapid land-use and land-cover change (LULCC) on peatland. In Pelalawan, peatland conversion for industrial pulp and paper plantations and smallholder agricultural lands (oil palm and rubber plantations) are the main drivers of deforestation and peatland degradation. Peatland in Katingan District has been heavily degraded since the early 1970s, and more so in recent years. Due to rampant illegal logging and concession-based timber harvesting, the area’s forest resources depleted rapidly. While all concessions had expired by 2002 and the case of illegal logging declined sharply after 2005, peatland conversion for smallholder rubber plantations and agricultural lands has been escalating as the population and local economy grow.
LULCC in the study sites typically entails deforestation and/or drainage of peatland. Peat drainage due to the construction of canals and trenches for irrigation and transportation purposes lowers ground water table (GWT) depths, resulting in the loss of hydrological integrity, peat oxidation and subsidence. This results in greenhouse gases being released into the atmosphere in mass quantities, and consequently leads to climate change. Moreover, fire is often used for land clearing for agriculture and plantation development on peatland in the region. The combustion of peat soil is a
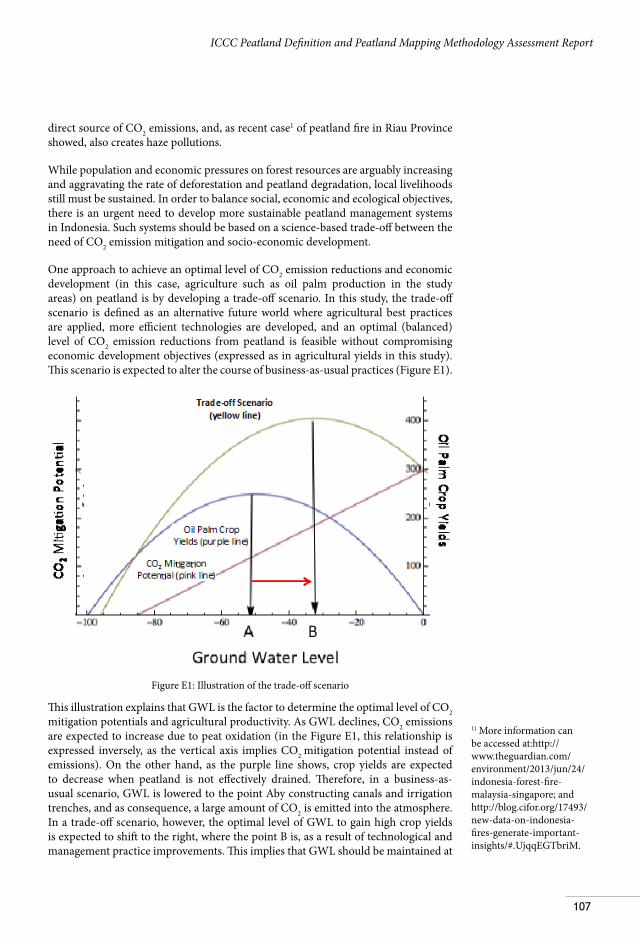
107
ICCC Peatland Definition and Peatland Mapping Methodology Assessment Report
direct source of CO2 emissions, and, as recent case1 of peatland fire in Riau Province showed, also creates haze pollutions.
While population and economic pressures on forest resources are arguably increasing and aggravating the rate of deforestation and peatland degradation, local livelihoods still must be sustained. In order to balance social, economic and ecological objectives, there is an urgent need to develop more sustainable peatland management systems in Indonesia. Such systems should be based on a science-based trade-off between the need of CO2 emission mitigation and socio-economic development.
One approach to achieve an optimal level of CO2 emission reductions and economic development (in this case, agriculture such as oil palm production in the study areas) on peatland is by developing a trade-off scenario. In this study, the trade-off scenario is defined as an alternative future world where agricultural best practices are applied, more efficient technologies are developed, and an optimal (balanced) level of CO2 emission reductions from peatland is feasible without compromising economic development objectives (expressed as in agricultural yields in this study). This scenario is expected to alter the course of business-as-usual practices (Figure E1).
Figure E1: Illustration of the trade-off scenario
This illustration explains that GWL is the factor to determine the optimal level of CO2 mitigation potentials and agricultural productivity. As GWL declines, CO2 emissions are expected to increase due to peat oxidation (in the Figure E1, this relationship is expressed inversely, as the vertical axis implies CO2 mitigation potential instead of emissions). On the other hand, as the purple line shows, crop yields are expected to decrease when peatland is not effectively drained. Therefore, in a business-as-usual scenario, GWL is lowered to the point Aby constructing canals and irrigation trenches, and as consequence, a large amount of CO2 is emitted into the atmosphere. In a trade-off scenario, however, the optimal level of GWL to gain high crop yields is expected to shift to the right, where the point B is, as a result of technological and management practice improvements. This implies that GWL should be maintained at
1) More information can be accessed at:http://www.theguardian.com/environment/2013/jun/24/indonesia-forest-fire-malaysia-singapore; and http://blog.cifor.org/17493/new-data-on-indonesia-fires-generate-important-insights/#.UjqqEGTbriM.
108
ICCC Peatland Definition and Peatland Mapping Methodology Assessment Report
this level to balance between CO2 emission reduction objectives and economic needs.
While Figure E1 only shows a conceptual framework of the trade-off scenario, estimated values of CO2 emissions from LULCC and GWT fluctuations on different types of peatland ecosystems must be further investigated and verified. Moreover, there is still a need to develop a good understanding of the effect of GWT on key agricultural and plantation crop yields (e.g., oil palm, rubber, acacia and rice paddies) on peatland in the study areas. More empirical case studies and scientific research are required to obtain credible values to be input for the estimation of trade-off relationships.
E2. Recommendations for sustainable peatland management in Indonesia
This study providesscience-based methodological, empirical and conceptual approaches to climate change mitigation potentials and needs for peatland in Pelalawan and Katingan Districts. While the degree of climate change impacts varies across regions, it is important to incorporate scientifically rigorous methodologies and practical mitigation strategies into climate policies at national, provincial and district levels. Both general and region specific recommendations are provided below to conclude this report.
E2.1. One accurate peatland map and spatial planning
Creating one integrated, transparent, consistent and collaboratively developed peatland map throughout Indonesia is essential for effectively implementing policies, regulations, and sustainable peatland management strategies. The map should be developed upon a standardized and scientifically rigorous methodology, and serve as the basis for low emission land-use planning and zoning at the district, provincial and national levels.
This study presented:
• A scientifically rigorous yet practical methodology for peatland mapping,which can be replicated in other peatland areas throughout Indonesia;
• New peatland maps of Pelalawan and Katingan Districts with greater accuracy; and
• A new database with an additional 101 peat depth sampling points and 197 peat characteristic analysis results.
Further research needs and considerations include:
• In general:
109
ICCC Peatland Definition and Peatland Mapping Methodology Assessment Report
o The improvement of the Shimada Model (or combined use of different models) to include peat depth estimation for non-forest areas;
o The formal adoption of an agreed-upon standard methodology for peatland mapping in Indonesia.
• For Pelalawan:
o Groundtruthing and measurements of peat depths along peatland boundaries and the shallower strata (i.e., 0.5 – 4 m) based on the agreed-upon methodology.
• For Katingan:
o Groundtruthing and measurements of peat depths along peatland boundaries and the deeper strata (i.e., 8 m above) based on the agreed-upon methodology.
E2.2. Protection of the remaining peatland
The foremost threat to the area’s peatland ecosystems is the conversion of peatland and peat swamp forest into other land uses such as oil palm plantations, pulpwood plantations (e.g., acacia), non-food crop plantations (e.g., rubber), and/or agricultural lands. In order to reduce ecological pressures and GHG emissions from peatland conversion, the government must protect the remaining peatland through effective policies and multi-stakeholder engagement.
This study presented:
• Land-use and land-cover changes on peatland in Pelalawan and Katingan Districts from 1990 to 2013;
• Key drivers of peatland deforestation and degradation.
Further research needs and considerations include:
• In general:
o Stringent restrictions on new plantation development on peatland after the moratorium (Presidential Instruction No. 6/2013) on primary forests and peatland expires in two years;
o Enforcement of laws and regulations on illegal logging and conversion, encroachment, and use of fire on peatland;
o Effective spatial planning and zoning with community participation to prevent the development of smallholder plantations on peatland;
o Landswaps to relocate existing and new concessions on peatland to degraded lands;
110
ICCC Peatland Definition and Peatland Mapping Methodology Assessment Report
o Promotion of ecosystem restoration concessions (ERC) on peatland.
• For Pelalawan:
o Identification of opportunities for land swaps with oil palm and pulpwood concessionaires.
• For Katingan:
o Implementation of an ecosystem restoration concession (ERC) on peatland on production forest;
o Improvement of Sebangau National Park management on conservation forest.
E2.3. Peatland best management practices
In addition to the protection of remaining peatland through various legal measures as presented above (E2.2.), peatland best management practices must be developed and communicated among stakeholders in order to reduce GHG emissions and other socio-ecological pressures. Best practices should be science-based, socio-culturally acceptable, environmentally appropriate and financially feasible, and draw on the experience of experts and local communities.
This study presented:
• A satellite-based methodology to estimate CO2 emissions based on groundwater table (GWT) fluctuations on different land-cover types;
• Continuous measurements of GWT levels in 3 locations in Pelalawan and 3 locations in Katingan;
• A theoretical framework of trade-off scenario, a balanced target between CO2 emission reductions from different types of peatland ecosystems and an optimal level of economic (i.e., agricultural) development;
• A hydrological model to estimate the magnitude of water drainage from canals and trenches on peatland.
Further research needs and considerations include:
• In general:
o The development of science-based trade-off model, which indicates an optimal GWT level that is low enough to ensure crop production but high enough to minimize peat oxidation and decomposition of peat;
o Continuous scientific research on relationships between the effect of GWT and CO2 emissions, as well as expected yields of key agricultural and plantation crops;
o A scientific research on hydrological relationships between the volume of groundwater discharge and CO2 emissions;
111
ICCC Peatland Definition and Peatland Mapping Methodology Assessment Report
o The development of drainage control methodsto maintain the GWT at an optimal level;
o Selection of agricultural and tree crops that are suitable and resilient to peatland;
o Collaborative peatland management based on multi-stakeholder consensus in order to reduce the risk of social conflicts, encroachment and unsustainable practices.
• For Pelalawan:
o Agricultural intensification and improved land management to boost per hectare yields of cropland and plantations, while maintaining the GWT at an optimal level;
o Improved management of small-scale fisheries and aquaculture.
• For Katingan:
o Development of alternative livelihoods which are ecologically and socio-economically sustainable (e.g., non-timber forest products, agroforestry products, small-scale fisheries and aquaculture, and ecotourism);
o Improved land management to boost per hectare yields of rice paddies and agroforestry commodities, while maintaining the GWT at an optimal level.
E2.4. Prevention of peatland fires
Peatland firesusually occur because of unsustainable land-use practices, and are one of the main causes of massive deforestation and peatland degradation, and pose negative environmental and social impacts. Fires almost always occur on non-forest and degraded peatland during the dry season, often caused by land clearing for farming and by accident (e.g., cigarettes and cooking fires)on drained peatland. The prevention of peatland fires is critical for sustainable peatland management and mitigation of GHG emissions.
This study presented:
• A possible use of satellite-based GWT map for early fire detection
Further research needs and considerations include:
• In general:
o The development of fire hot spot mapping methodologybased on satellite-based GWT data and a satellite sensor such as Moderate Resolution Imaging Spectroradiometer (MODIS), overlaid with an accurate peatland map,for early warning and reporting systems;
112
ICCC Peatland Definition and Peatland Mapping Methodology Assessment Report
o Monitoring of water table levels in fire prone areas especially during the dry season;
o A study on effective alternative land clearing methods for agriculture;
o Awareness and capacity building on the prevention, control and impacts of peat fires among smallholder farmers.
• For Pelalawan:
o Law enforcement to regulate the use of fire in plantation development
o Collaboration with industrial plantation concessionaires to control drainage at an optimal level (as discussed in Section E2.3.).
• For Katingan:
o Small-scale canal blocking to prevent drainage and maintain GWT levels high in the Sebangau National park and the proposed ecosystem restoration concession site.
E2.5. Peatland ecosystem restoration
In addition to the prevention of peatland conversion, drainage and fires, it is important to restore already degraded peatland in order to reverse trends of deforestation and a rapid loss of peatland ecosystems. Restoration activities are likely to imposesocio-economic impacts on people living in surrounding areas, and thus should be planned and implemented through participatory approaches.
This study presented:
• A land-use and land-cover analysis to be used as a reference to critical areas for peatland ecosystem restoration in Pelalawan and Katingan Districts.
Further research needs and considerations include:
• In general:
o Awareness and capacity development on the importance of peatland through continuous research and knowledge building;
o Development of silviculture techniques and assisted natural regeneration of native species on peatland.
• For Pelalawan:
o Development of buffer zones around industrial plantations to be collaboratively managed with local communities;
o Effective zoning, conservation and monitoring of high conservation value (HCV) forest and species in plantations.

113
ICCC Peatland Definition and Peatland Mapping Methodology Assessment Report
• For Katingan:
o Peat rewetting and implementation of effective water management;
o Reforestation in non-forest areas and enrichment planting in degraded areas with native species;
o Development of buffer zones to be managed as community forest;
o Protection and assisted regeneration of high conservation value (HCV) species.
114
ICCC Peatland Definition and Peatland Mapping Methodology Assessment Report
References
Aldrian, E., and Dwi Susanto, R. (2003). Identification of three dominant rainfall regions within Indonesia and their relationship to sea surface temperature. International Journal of Climatology 23: 1435-1452.
Badan Pusat Statistik.(2012). Katingan Dalam Angka 2012. Available online at: http:// katingankab.bps.go.id/Ruangbaca_kda12.php.
Bruenig, E. F. (1990). Oligotrophic forested wetlands in Borneo. In: Lugo,A.E., Brinson M & Brown S (Eds). Ecosystems of The World 15 (pp 299-334), Forested Wetlands, Elsevier
Dinas Kehutanan.(2013). Luas hutan berdasarkan Tata Guna Hutan Kesepakatan Kabupaten Katingan Tahun 2009. Available online at: http://www. katingankab.go.id/selayang-pandang/pengembangan-produk/kehutanan. html.
DNPI.(2010). Indonesia’s Greenhouse Gas Abatement Cost Curve. Dewan Nasional Perubahan Iklim. Jakarta, Indonesia.
Fahmudin, A., Hairiah, K., and Mulyani, A. (2011). Measuring carbon stock in peat soils: practical guideline. Bogor: World Agroforestry Centre (ICRAF) Southeast Asia Regional Program, Indonesia Centre for Agricultural Land Resources Research and Development.
FAO.(2000). Land Cover Classification System (LCCS): Classification Concepts and User Manual. Food and Agriculture Organization of the United Nations. Rome, Italy.
GRASS Development Team. (2013). Geographic Resources Analysis Support System (GRASS) Software, Version 6.4. Open Source Geospatial Foundation. http://grass.osgeo.org.
Guterres, Antonio. (2009). Climate change, natural disasters and human displacement: a UNHCR perspective. Unite Nations High Commissioner for Refugees (UNHCR), Geneva, Switzerland.
Hecht, S.B.(1985). Environment, development, and politics: capital accumulation and the livestock sector in Amazonia. World Development 13 (6), 663–684.
Hirano, T., Segah, H., Kusin, K., Limin, S., Takahashi, H., and Osaki, M. (2012). Effects of disturbances on the carbon balance of tropical peat swamp forests. Global Change Biology, 18, 3410-3422. Hooijer, A., Page, S., Jauhiainen, J., Lee, W., Lu, X., and Idris, A. (2012). Subsidence and carbon loss in drained tropical peatlands. Biogeosciences , 1053-1071. Indonesia Climate Change Center. (2012). Policy memo: Peatland definition from uncertainty to certainty. Jakarta: Indonesia Climate Change Center.
115
ICCC Peatland Definition and Peatland Mapping Methodology Assessment Report
IPCC.(2000). Summary for Policy Makers: Emission Scenarios. A Special Report of Working Group III of the Intergovernmental Panel on Climate Change. Geneva, Switzerland. p4.
IPCC.(2007). Climate Change 2007: Synthesis Report. Contribution of Working Groups I, II and III to the Fourth Assessment Report of the Intergovernmental Panel on Climate Change [Core Writing Team, Pachauri, R.K and Reisinger, A. (eds.)]. Geneva, Switzerland, 104 pp.
Jaenicke J., Rieley J.O., Mott C., Kimman P. and Siegert F. (2008) Determination of the amount of carbon stored in Indonesian peatlands, Geoderma 147, 151-158
Najiyati, S., L. Muslihat, I. Nyoman N., andSuryadiputra. (2005). Panduan Pengelolaan Lahan Gambut Untuk Pertanian Berkelanjutan. Wetlands International, ix + 241. ISBN 979-97373-2-9.
MoE.(2007). Indonesia Country Report: Climate Variability and Climate Change, and their Implication. Ministry of Environment, Republic of Indonesia, Jakarta.
Mulyani, A., Susanti, E., Dariah, A., Maswar, Wahyunto, & Agus, F. (2012). Basis Data Karakteristik Tanah Gambut di Indonesia. (11).
Oki, K., Sruwatari, T., Nogawa, Y., Suhama, T., and Omasa, K. (2005). Classification Method for Vegetation in Urban Area using Hyperspectral Data, Eco- Engineering 17(1), 67-72.
Quantum GIS Development Team. (2013). Quantum GIS Geographic Information System. Open Source Geospatial Foundation Project. http://qgis.osgeo.org.
Ravindrananth, N., and Ostwald, M. (2010). Carbon Inventory Methods-handbooks for greenhouse Gas Inventory, carbon mitigation and roundwood production project. Springer.
R Core Team. (2013). R: A language and environment for statistical computing. R Foundation for Statistical Computing, Vienna, Austria. ISBN 3-900051-07- 0, URL: http://www.R-project.org.
RSNI-2. (2012). Pemetaan lahan gambut skala 1:50.000.Rencangan Standar Nasional Indonesia-2.Badan Standarisasi Nasional. Jakarta.
Savitzky, A. and Golay, M.J.E. (1964). Smoothing and Differentiation of Data by Simplified Least Squares Procedures. Analytical Chemistry 36 (8): 1627– 1639.
Shepherd, P. A, Rieley, J. O.,and Page, S. E. (1997). The relationship between forest vegetation and peat characteristics in the upper catchment of Sungai Sebangau, Central Kalimantan. In: Rieley, J. O. & Page, S.E. (Eds) Biodiversity and Sustainability of Tropical Peatland (pp 191-210). Samara Publishing Limited
116
ICCC Peatland Definition and Peatland Mapping Methodology Assessment Report
Shimada, S., Takahashi, H., Kaneko, M. and Toyoda, H. (2004).Predicting Peat Layer Mass Using Remote Sensing Data in Central Kalimantan, Indonesia. In: Participatory Strategy for Soil and Water Conservation. Edited by M. Mihara & E.Yamaji, Institute of Environment Rehabilitation and Conservation, Soubun Co., Ltd., pp. 193-196.
Sivakumar, M.V.K., Brunini, O., and Das, H.P. (2005).Impacts of present and future climate variability on agriculture and forestry in the arid and semi-arid tropics. Climatic Change. 70:31-72 pp.
Sumartadipura A.S., and Margono U., (1996). Geological map of the Tewah (Kualakurun) Quadrangle, Kalimantan (1:250,000), Geological Survey Institute, Index No.1614.
Takeuchi, W., Hirano, T., Anggraini, N., and Roswintiarti, O. (2010). Estimation of ground water table at forested peatland in Kalimantan usingdrought index toward wildfire control. JICA-JST.
UNEP. (2012). The Emissions Gap Report. United Nations Environment Programme (UNEP), Nairobi.
Wahyunto, I Nyoman N. Suryadiputra. (2008). Atlas Sebaran Lahan Gambut di Sumatera dan Kalimantan:penjelasan terhadap sumber data, tingkat ketelitian, faktor pembatas dan celah kelemahan dalam penyusunannya. Wetlands International, Bogor.
Wahyunto, Dairah, A., and Fahmudin, A. (2010). Distribution, properties and carbon stock in Indonesia Peatland.
Warren, M., Kauffman, J., & Murdiyarso, D. (2012). A cost-efficient method to assess carbon stock in tropical peat soil. Biogeosciences , 4477-4485.
Wust.A.J., and Raphael., B. M. (2003). New Classification system for tropical organic- rich deposits based on study of Tasek Bera Basin, Malaysia. Catena 53.
Yamaguchi, Y. (2007). Radar Polarimetry From Basics to Applications, P.182, IEICE, Tokyo, Japan.
117
ICCC Peatland Definition and Peatland Mapping Methodology Assessment Report
Annexes List of Annexes:
1. New peatland map of Pelalawan District
2. New peatland map of Katingan District
3. Land-use, Land-cover Change analysis of Peatland Area In Pelalawan District
4. Land-use, Land-cover Change analysis of Peatland Area In Katingan District
Annex 1. New peatland map of Pelalawan District
Annex 2. New peatland map of Katingan District
Annex 3. Land-use, Land-cover Change analysis of Peatland Area In Pelalawan District
Table A.1. Land Cover Change of Peatland Area In Pelalawan District 1990-1995 (in Ha)
Table A.2. Land Cover Change of Peatland Area In Pelalawan District 1995-2000 (in Ha)
Table A.3. Land Cover Change of Peatland Area In Pelalawan District 2000 - 2005 (in Ha)
Table A.4. Land Cover Change of Peatland Area In Pelalawan District 2005 – 2010 (in Ha)
Table A.5. Land Cover Change of Peatland Area In Pelalawan District 2010 - 2013 (in Ha)
118
ICCC Peatland Definition and Peatland Mapping Methodology Assessment Report
Annex 4. Land-use, Land-cover Change analysis of Peatland Area In Katingan District
Table B.1. Land Cover Change of Peatland Area in Katingan District 1990-1995 (in Ha)
Table B.2. Land Cover Change of Peatland Area in Katingan District 1995-2000 (in Ha)
Table B.3. Land Cover Change of Peatland Area in Katingan District 2000 - 2005 (in Ha)
Table B.4. Land Cover Change of Peatland Area in Katingan District 2005 - 2010 (in Ha)
Table B.5. Land Cover Change of Peatland Area in Katingan District 2010 - 2013 (in Ha)
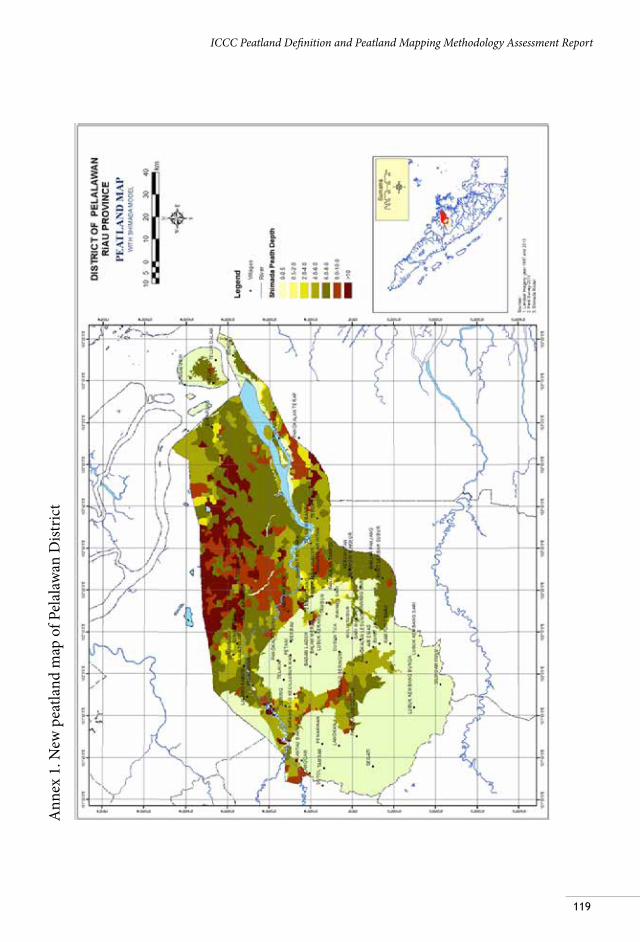
119
ICCC Peatland Definition and Peatland Mapping Methodology Assessment ReportA
nnex
1. N
ew p
eatla
nd m
ap o
f Pel
alaw
an D
istric
t
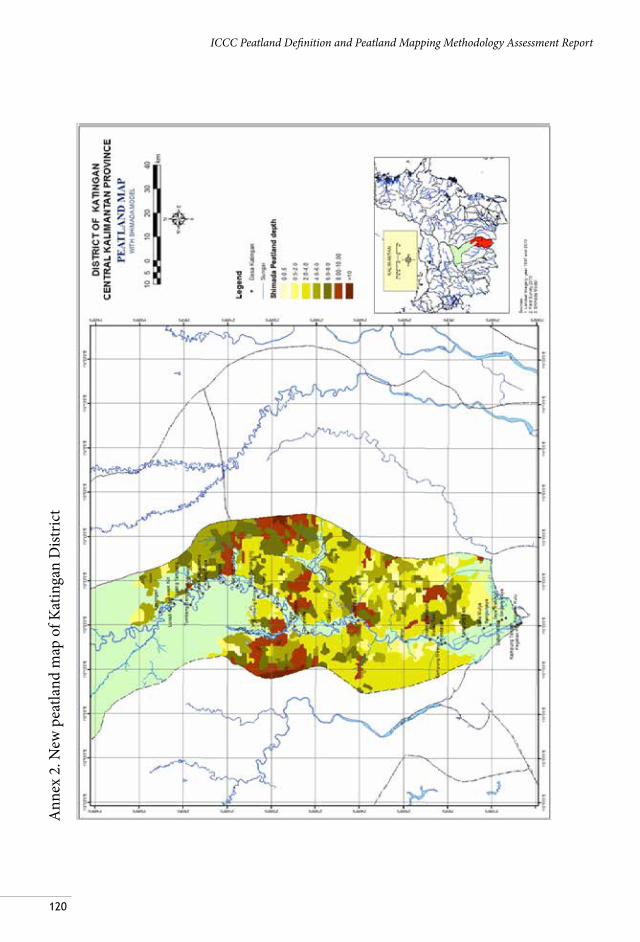
120
ICCC Peatland Definition and Peatland Mapping Methodology Assessment ReportA
nnex
2. N
ew p
eatla
nd m
ap o
f Kat
inga
n D
istric
t
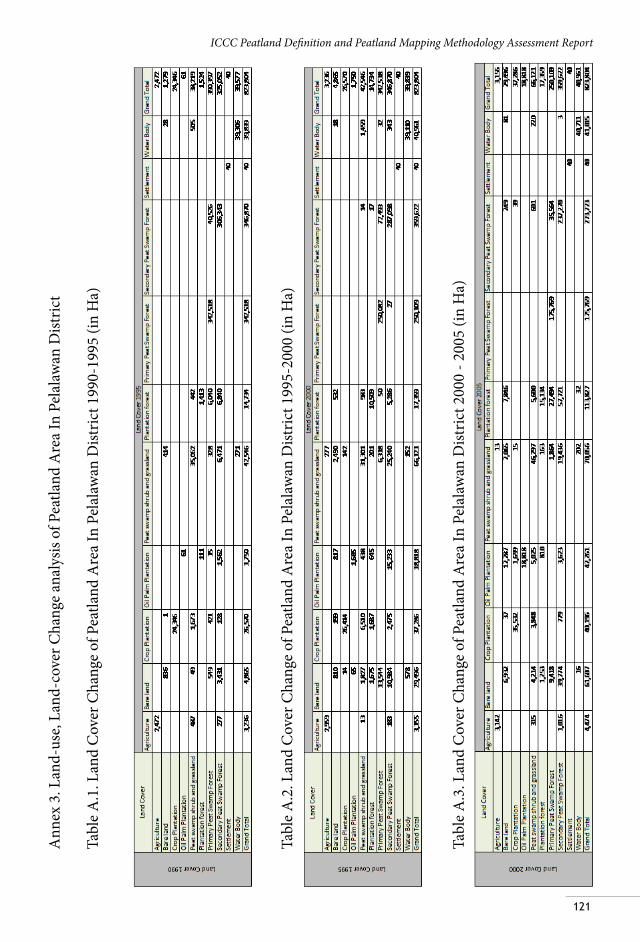
121
ICCC Peatland Definition and Peatland Mapping Methodology Assessment ReportA
nnex
3. L
and-
use,
Land
-cov
er C
hang
e an
alys
is of
Pea
tland
Are
a In
Pel
alaw
an D
istric
t
Tabl
e A
.1. L
and
Cov
er C
hang
e of
Pea
tland
Are
a In
Pel
alaw
an D
istric
t 199
0-19
95 (i
n H
a)
Tabl
e A
.2. L
and
Cov
er C
hang
e of
Pea
tland
Are
a In
Pel
alaw
an D
istric
t 199
5-20
00 (i
n H
a)
Tabl
e A
.3. L
and
Cov
er C
hang
e of
Pea
tland
Are
a In
Pel
alaw
an D
istric
t 200
0 - 2
005
(in H
a)
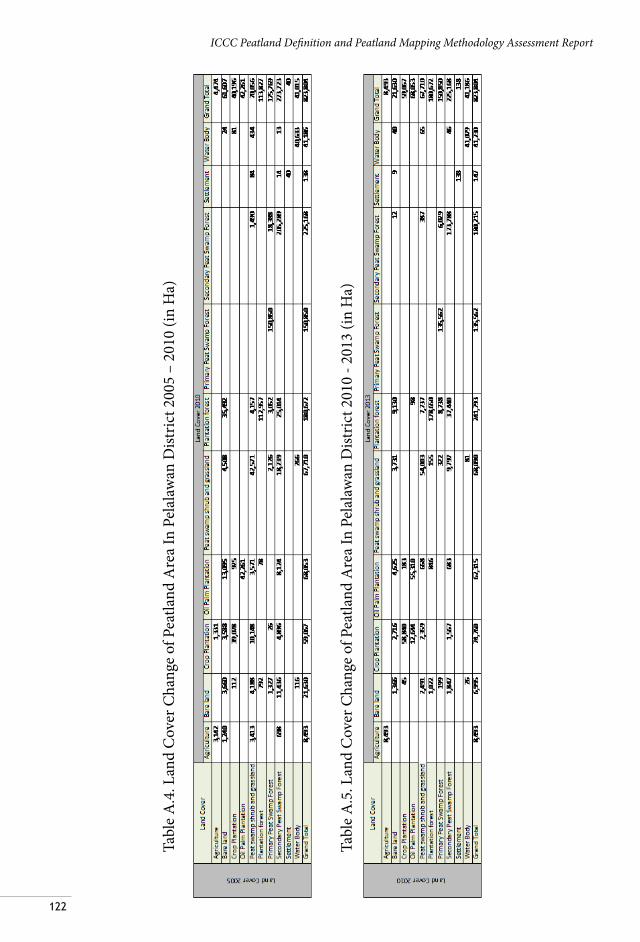
122
ICCC Peatland Definition and Peatland Mapping Methodology Assessment Report
Tabl
e A
.4. L
and
Cov
er C
hang
e of
Pea
tland
Are
a In
Pel
alaw
an D
istric
t 200
5 –
2010
(in
Ha)
Tabl
e A
.5. L
and
Cov
er C
hang
e of
Pea
tland
Are
a In
Pel
alaw
an D
istric
t 201
0 - 2
013
(in H
a)
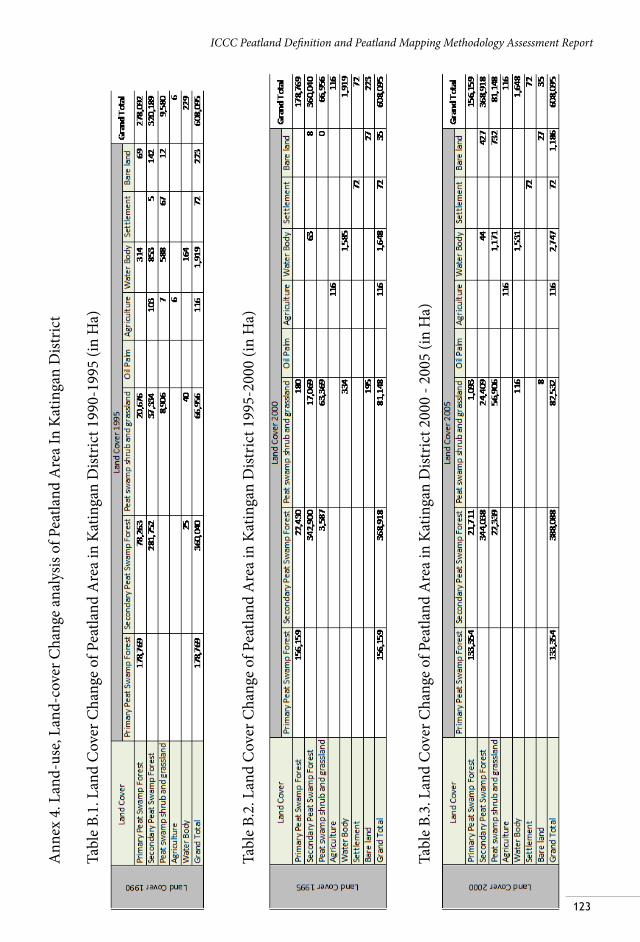
123
ICCC Peatland Definition and Peatland Mapping Methodology Assessment ReportA
nnex
4. L
and-
use,
Land
-cov
er C
hang
e an
alys
is of
Pea
tland
Are
a In
Kat
inga
n D
istric
t
Tabl
e B.
1. L
and
Cov
er C
hang
e of
Pea
tland
Are
a in
Kat
inga
n D
istric
t 199
0-19
95 (i
n H
a)
Tabl
e B.
2. L
and
Cov
er C
hang
e of
Pea
tland
Are
a in
Kat
inga
n D
istric
t 199
5-20
00 (i
n H
a)
Tabl
e B.
3. L
and
Cov
er C
hang
e of
Pea
tland
Are
a in
Kat
inga
n D
istric
t 200
0 - 2
005
(in H
a)
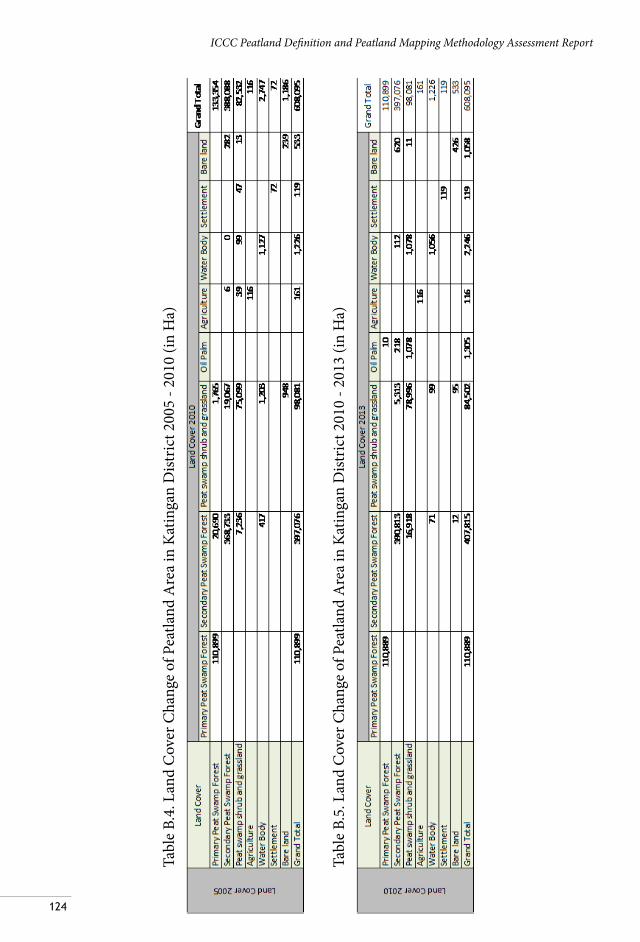
124
ICCC Peatland Definition and Peatland Mapping Methodology Assessment Report
Tabl
e B.
4. L
and
Cov
er C
hang
e of
Pea
tland
Are
a in
Kat
inga
n D
istric
t 200
5 - 2
010
(in H
a)
Tabl
e B.
5. L
and
Cov
er C
hang
e of
Pea
tland
Are
a in
Kat
inga
n D
istric
t 201
0 - 2
013
(in H
a)

125
ICCC Peatland Definition and Peatland Mapping Methodology Assessment Report

126
ICCC Peatland Definition and Peatland Mapping Methodology Assessment Report


