24
1 Peatlands A summary of research outputs supported or facilitated by the Environmental Change Programme of the Scottish Government’s Portfolio of Strategic Research 2011-2016

1
PeatlandsA summary of research outputs supported or facilitated by the
Environmental Change Programme of the Scottish Government’s Portfolio of Strategic Research 2011-2016

Introduction
2
Peatlands form part of the iconic landscape of Scotland and account for nearly a quarter of the land area. The peat itself constitutes a significant carbon store, while the overlying flora and fauna represent unique biodiversity. Scotland holds 13% of the world’s blanket bog, with the Flow Country and the Lewis Peatlands probably representing the largest contiguous areas globally. Historically, peatlands have been seen as wasteland and various efforts, through draining, burning, afforestation, grazing and other ‘improvements’, have been made to make them ‘productive’. Many areas have been mined while others are subject to erosion.
A consequence is that over 80% of our peatlands are degraded, with an altered biodiversity and losing carbon rather than sequestering it. However, the value of peatlands is being increasingly recognised with peatland restoration forming part of the Scottish Government’s policies on climate change mitigation, as expressed in the Climate Change (Scotland) Act 2009, and on biodiversity, as outlined in ‘Scotland’s Biodiversity - a Route Map to 2020’.
Priority project 1 in ‘Scotlands Biodiversity - a Route Map to 2020’ aims to ‘restore peatland condition and function in order to generate benefits through ecosystem services; carbon sequestration, carbon storage, water quality, flood management and more abundant nature’. Underpinning any work on peat restoration is knowledge of the peat resource itself. We have been refining the parameters that define our peatland carbon stocks (Chapter 1). A full understanding of peatland condition is also important, and recourse to modern remote sensing methodology can provide this whilst reducing the need for laborious ground survey (Chapter 2). While the restoration of vegetation communities can be readily appreciated, the impacts on other flora and fauna are largely unknown. Studies on fungi and invertebrates show how these groups also respond to restoration (Chapter 3). The special case of tick abundance, which has health implications, has also been investigated (Chapter 4). The carbon benefits of peatland restoration can only be measured if we know the greenhouse gas (GHG) emissions under different conditions (Chapter 5). These and other values from the literature have been collated to inform National Greenhouse Gas Inventory calculations and have been used in a predictive model of the abatement potential of peatland restoration (Chapter 6).
It is recognised that the restoration process incurs a cost, which may or may not be realised in carbon terms. We have used some simple approaches to explore this for a wide range of scenarios (Chapter 7). A recent pressure on peatlands has been from wind farm development. We have assessed the extent of these developments and contributed to the refinement of the carbon calculator, a tool that is used to estimate the carbon losses from development and the payback time required to achieve carbon neutrality (Chapter 8). The public perception of peatland restoration may vary and depend upon personal experience; this has been gauged through a series of workshops (Chapter 9). Making decisions on exactly where to focus restoration efforts requires pulling in information from a number of sources; the WISE peatland decision support tool is designed to facilitate this process (Chapter 10).
Rebekka Artz and Steve Chapman [email protected], [email protected]

ContentsIntroduction 2
CHAPTER 1Peatland locations and carbon stocks 4 Steve Chapman (James Hutton Institute)
CHAPTER 2Remote sensing of peatland condition 6 Laura Poggio, Matt Aitkenhead, Alessandro Gimona, Rebekka Artz (James Hutton Institute), Sally Johnson, Patricia Bruneau and Andrew McBride (Scottish Natural Heritage)
CHAPTER 3 Biodiversity in peatlands – what are we aiming to restore? 8 Nick Littlewood, Catherine Smart, Rebekka Artz (James Hutton Institute) and Neil Cowie (RSPB Scotland)
CHAPTER 4 The effect of restoration of afforested peatland on tick abundance 10 Lucy Gilbert (James Hutton Institute)
CHAPTER 5 Greenhouse gas emissions from degraded and restored peatlands 12 Matt Saunders (Trinity College Dublin), Rebekka Artz and Robin Matthews (James Hutton Institute)
CHAPTER 6 Including emissions from peatlands in the UK Greenhouse Gas Inventory 14 Rebekka Artz and Steve Chapman (James Hutton Institute)
CHAPTER 7 Economic costs and benefits of peatland restoration 16 Steve Chapman, Rebekka Artz (James Hutton Institute), Andrew Moxey (Pareto Consulting), Laetitia Pettinotti, Klaus Glenk and Dominic Moran (Scotland’s Rural College)
CHAPTER 8 Windfarms on peatlands 18 Steve Chapman and Jagadeesh Yeluripati (James Hutton Institute)
CHAPTER 9 Public perceptions of peatland value 20 Anja Byg (James Hutton Institute), Julia Martin-Ortega (University of Leeds), Andrew McBride (Scottish Natural Heritage) and Klaus Glenk (Scotland’s Rural College)
CHAPTER 10
The WISE Peatlands decision support tool 22 Rebekka Artz, David Donnelly, Steve Chapman, Alessandro Gimona, Matt Aitkenhead (James Hutton Institute) and Andrew Coupar (Scottish Natural Heritage)
Citation:Peatlands (2016).Edited by Rebekka Artz and Steve Chapman, The James Hutton Institute, Craigiebucker, Aberdeen, 24 pp.
3
Series editors: Glenn Iason and Robin PakemanGraphics: Sarah Horne

Background
Peatlands cover nearly a quarter of the Scottish landscape, though in many areas the typical peatland vegetation has
been lost and replaced by ‘degraded’ blanket bog, heath, acid grassland or woodland. Some locations are bare due to erosion or peat mining. There are also areas covered with shallow organic soils which nevertheless carry a peatland-like vegetation (Fig. 1). Peatlands constitute a significant carbon stock, which has been estimated at 1620 Mt or 56% of the total carbon in Scottish soils. However, this estimate was based on limited data and there is a need to update it. Additionally, accurate estimation of carbon stock at a local scale is important for
the carbon calculator, used for assessing the impacts of windfarm development.
ApproachData on both dry bulk density of soil, which reflects its mass per volume, and data on its carbon content, has been collated from several recent studies, namely the National Soil Inventory of Scotland (NSIS) and the Countryside Survey (CS), as well as legacy data from the Scottish Peat Surveys (SPS). An examination of the potential factors influencing these parameters, such as peatland type and condition, vegetation type and peat depth, has been made. A preliminary collation of peat depth data from the sites being restored under the Peatland Action Project (PAP) was also obtained.
Peatland locations and carbon stocks
4
CHAPTER 1

5
Results• Based on the NSIS, mean dry bulk density
was 0.122 g cm-3, not significantly different from that previously used. The mean carbon content, 48.5%, was slightly less than that previously used (mean of 52.3%).
• Bulk density did not vary significantly with depth (to 100 cm) but was significantly greater in amorphous peat than in fibrous peat, in semi-natural grassland than in bog, moorland or woodland, and greater in shallow blanket peat than in deep blanket peat.
• Carbon content increased slightly with depth and with degree of decomposition but was unaffected by vegetation type.
• Values of bulk density and carbon content from the CS (restricted to the surface 0-15 cm) and bulk densities estimated from the SPS tended to be slightly lower than those from the NSIS but not significantly so.
• Using the SPS data, it was clear that blanket peats have higher bulk density values than basin peats and that, generally, deeper bogs of both types have lower bulk density values.
• Interestingly, the mean depth of sites (78) from the PAP was 2.0 m (Fig. 2), identical to the country-wide area-weighted mean used in the original estimate of C stock.
ConclusionThis appraisal of more recent data on peatland carbon stock parameters broadly upholds the values previously used and suggests that the original estimate of 1620 Mt for Scotland holds good. Some refinement may be possible if vegetation can be taken into account and if the carbon content values are updated. More confidence can be given to default bulk density values for use in the carbon calculator. A remaining area of uncertainty is that of peat depth across the country, which remains patchy; hopefully further data from the Peatland Action Project and other sources will go some way to plugging this gap.
Author: Steve Chapman (James Hutton Institute) Contact: Steve Chapman ([email protected])
Fig. 1: Vegetation cover on peat and peat-containing mixed organic soils across Scotland.
Fig. 2: Measuring peat depth.

Remote sensing of peatland condition
Background
Except for a rolling 6 year programme of habitat condition on designated peatlands, there is no information on the national
state of peatland condition. Peatland condition is often used as a proxy for the likely GHG emissions from peatlands. Remote sensing techniques, combined with modelling, are potentially powerful tools to assess peatland condition at a range of scales including the national scale. We present some promising early results.
ApproachAcross Scotland, weekly data between 2000 and 2011 from the Moderate Resolution Imaging Spectrometer (MODIS) were modelled against precise peatland condition status from 959 point locations from sites used in the latest round of
the Common Standards Monitoring assessment (SNH). The available ‘point’ information about peat condition was modelled with morphological features and information derived from the MODIS sensor. In particular we used time series of indices describing vegetation greenness (Enhanced Vegetation Index), water availability (Normalised Water Difference Index), Land Surface Temperature and vegetation productivity (Gross Primary Productivity). The statistical relationships between peatland condition at observed locations and the environmental indices listed above were modelled using a geostatistical approach to generate a continuous map. At the regional scale, Landsat images were used to create higher resolution data. However it was not possible to obtain good quality coverage for the entire country because of cloud cover coupled with the relatively coarse temporal resolution of Landsat images.
6
CHAPTER 2

7
Results• The MODIS based model utilises temporal
differences in various remotely sensed indices. The most significant of these, the Soil Adjusted Vegetation Index, Normalised Water Difference Index and Land Surface Temperature at Night, were combined to form the basis of the current site condition model (Fig. 1). An internal validation (leave-one-out) provided a misclassification error of around 0.25. This model is still in development at present.
• The Landsat based model allows us to identify four categories of peat: healthy, drained, eroding and hagged (Fig. 2). It is possible to determine temperature variation (using mid-infrared) and vegetation cover density (using visible and near-infrared). These allow us to detect local variation in topsoil moisture (drier soils are warmer) and erosion in peatland. If the soil is drier than expected but has plenty of vegetation cover, then it is possibly being drained. If it is drier and there is little or no vegetation, then this indicates erosion.
ConclusionsRemote sensing data show good potential to model peatland condition at various spatial scales, however some further work is required to field validate the models. The completed models will ultimately be useful in the decision-making process for the selection of sites for restoration. Further work is on-going in combining these approaches with other datasets and innovative techniques, such as use of unmanned aerial vehicles (UAV) for assessment of the recovery of peatland restoration sites in the chronosequence at RSPB’s Forsinard Flows Reserve. This UAV approach is illustrated in the header photograph above.
Authors: Laura Poggio, Matt Aitkenhead, Alessandro Gimona, Rebekka Artz (James Hutton Institute) and Sally Johnson, Patricia Bruneau and Andrew McBride (Scottish Natural Heritage)
Contact: Laura Poggio ([email protected])
Fig. 1: The draft MODIS-based peatland condition model (red – high likelihood of being in favourable condition (above threshold); yellow – low likelihood of being in favourable condition).
Fig 2: Example of a high resolution modelled map of peatland condition types on the Isle of Lewis using Landsat data.
Biodiversity in peatlands - what are we aiming to restore?
CHAPTER 3
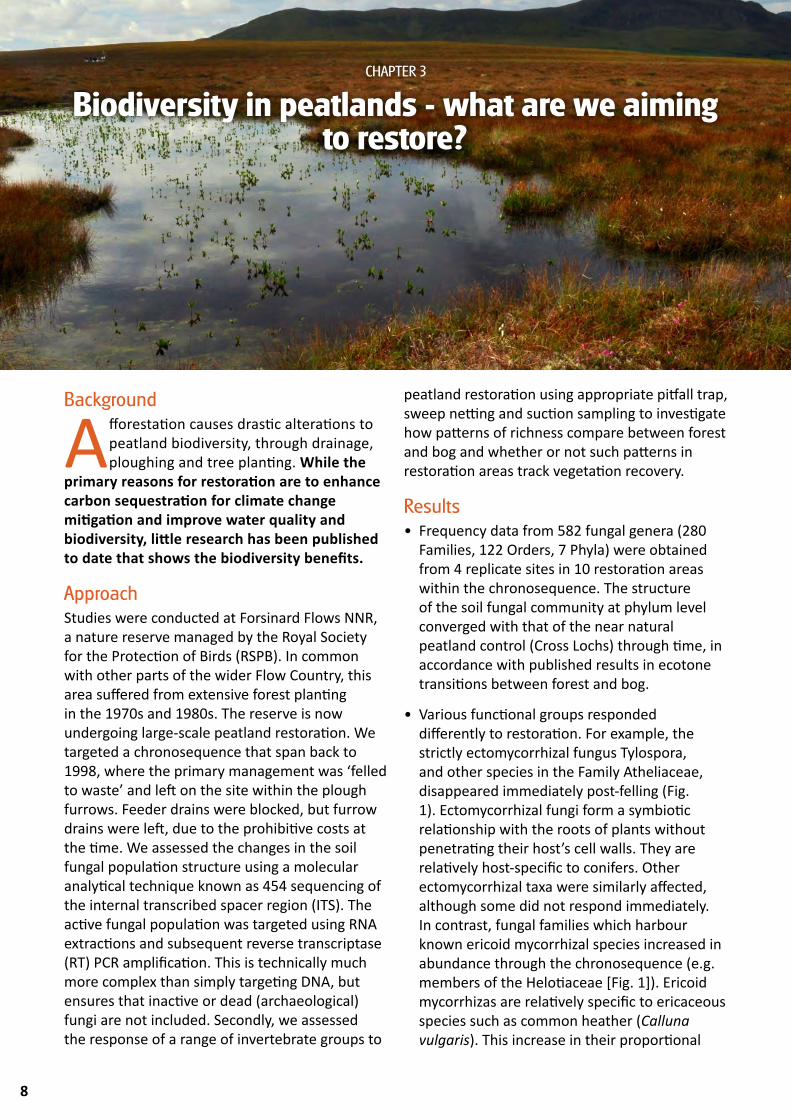
Background
Afforestation causes drastic alterations to peatland biodiversity, through drainage, ploughing and tree planting. While the
primary reasons for restoration are to enhance carbon sequestration for climate change mitigation and improve water quality and biodiversity, little research has been published to date that shows the biodiversity benefits.
ApproachStudies were conducted at Forsinard Flows NNR, a nature reserve managed by the Royal Society for the Protection of Birds (RSPB). In common with other parts of the wider Flow Country, this area suffered from extensive forest planting in the 1970s and 1980s. The reserve is now undergoing large-scale peatland restoration. We targeted a chronosequence that span back to 1998, where the primary management was ‘felled to waste’ and left on the site within the plough furrows. Feeder drains were blocked, but furrow drains were left, due to the prohibitive costs at the time. We assessed the changes in the soil fungal population structure using a molecular analytical technique known as 454 sequencing of the internal transcribed spacer region (ITS). The active fungal population was targeted using RNA extractions and subsequent reverse transcriptase (RT) PCR amplification. This is technically much more complex than simply targeting DNA, but ensures that inactive or dead (archaeological) fungi are not included. Secondly, we assessed the response of a range of invertebrate groups to
peatland restoration using appropriate pitfall trap, sweep netting and suction sampling to investigate how patterns of richness compare between forest and bog and whether or not such patterns in restoration areas track vegetation recovery.
Results• Frequency data from 582 fungal genera (280
Families, 122 Orders, 7 Phyla) were obtained from 4 replicate sites in 10 restoration areas within the chronosequence. The structure of the soil fungal community at phylum level converged with that of the near natural peatland control (Cross Lochs) through time, in accordance with published results in ecotone transitions between forest and bog.
• Various functional groups responded differently to restoration. For example, the strictly ectomycorrhizal fungus Tylospora, and other species in the Family Atheliaceae, disappeared immediately post-felling (Fig. 1). Ectomycorrhizal fungi form a symbiotic relationship with the roots of plants without penetrating their host’s cell walls. They are relatively host-specific to conifers. Other ectomycorrhizal taxa were similarly affected, although some did not respond immediately. In contrast, fungal families which harbour known ericoid mycorrhizal species increased in abundance through the chronosequence (e.g. members of the Helotiaceae [Fig. 1]). Ericoid mycorrhizas are relatively specific to ericaceous species such as common heather (Calluna vulgaris). This increase in their proportional
8

9
abundance, coupled with a decline in ectomycorrhizal fungi, is indicative of a return of the microbial community structure to that of near natural peatlands.
• Invertebrates comprise the largest proportion of peatland species richness. Abundance and species richness of plant bugs and leafhoppers (Auchenorrhyncha) was markedly higher in bog samples than on the forest floor, with an intermediate response in areas undergoing restoration (Figure 2A). As phytophagous (plant-consuming) insects, their abundance correlates with the degree of ground vegetation cover present. Species differ in their foodplant choices and degree of specialism with, for example, some species that are associated with dwarf shrubs being best represented in bog samples
• Moth abundance was highest in forest but species richness was highest in restoration areas (Fig. 2B). An increase in the cover of
grasses and rushes appeared to provide resources for an additional suite of species, for which these are the larval food plants. Restoration areas host some typical bog species. They also host a range of other “mid-successional” species.
ConclusionThis study demonstrates the potential for peatland restoration to benefit biodiversity, as all of the communities studied became more like those found in near natural peatlands following restoration efforts. It also shows that recovery of bog assemblages may not always be a linear process, at least over the timescales studied thus far. Vegetation data from high resolution aerial photography, to aid the interpretation of these results, are still being analysed.
Authors: Nick Littlewood, Catherine Smart, Rebekka Artz (James Hutton Institute) and Neil Cowie (RSPB)
Contact: Rebekka Artz ([email protected])
Fig. 1: Examples of observed shifts in two active soil fungal communities (Heliotiaceae and Atheliaceae) expressesd as their proportion of all operational taxonomic units present (OTU).
Fig. 2: Relative abundance of plant bugs and leafhoppers (A) and comparative species richness of moths (B) at different bog restoration stages.
Increasing age since restoration (before felling to near natural)
A B
forest undergoing restoration
bog forest undergoing restoration
bog

Background
Of all the modes of peatland damage, perhaps afforestation changes peatlands the most, through drainage, ploughing
and tree planting, creating a completely new ecosystem. While the primary reasons for peatland restoration are to improve carbon sequestration, water quality and biodiversity, there is another potential unforeseen ecosystem service: regulation of pests and diseases. In particular, reverting forest to open peatland will involve changes to the water table, vegetation and the vertebrate communities that host ticks. Ixodes ricinus ticks can carry many pathogens, including Borrelia burgdorferi that causes Lyme disease, and have been increasing in Scotland over the past few decades. Here we ask: How will restoring afforested peatlands affect I. ricinus abundance?
ApproachOur approach was to survey ticks, ground vegetation and host abundance at multiple adjacent areas of commercial conifer forestry (6 areas), brash where forest had been felled (between 5 and 13 years old) as part of the restoration process (8 areas) and undamaged blanket bog (7 areas). The study was conducted at Forsinard Flows, a nature reserve managed by the Royal Society for the Protection of Birds (RSPB). This area of peatland suffered from extensive forest planting in the 1980s but the RSPB are now conducting large-scale peatland restoration.
Results• There was a striking effect of restoring
afforested peatlands on tick abundance, with high densities of ticks in conifer forestry,
10
The effect of restoration of afforested peatland on tick abundance
CHAPTER 4

11
intermediate densities in the felled areas of brash, and virtually no ticks found in undamaged blanket bog (Fig. 1).
• The decline in ticks was progressive throughout the restoration process, as recently felled areas contained more ticks than older felled areas, until 13 years after felling when the tick densities were almost as low as in undamaged blanket bog (Fig. 2).
• Surveys of host abundance (as estimated from dung counts) revealed that the reason why there were almost no ticks in blanket bog was because deer, which are the main hosts for ticks in Scotland, preferred forest and felled areas, spending very little time on open blanket bog. There were probably more ticks in forestry
than in felled areas due the dense forest canopy maintaining a mild microclimate that promotes tick activity and survival.
ConclusionsThis study implies additional ecosystem service benefits of restoring afforested peatlands that have not been hitherto considered: that of regulating pests/diseases through dramatic declines in tick abundance and enhancing both human and animal health benefits through reduced tick-borne disease risk.
Author: Lucy Gilbert (James Hutton Institute) with thanks to Norrie Russell (RSPB)
Contact: Lucy Gilbert ([email protected])
Fig. 1: The number of ticks counted per transect in unfelled forest restoration areas, and undamaged blanket bog (Mean + 1 Standard Error).
Fig. 2: The decline in tick abundance with age of the felled areas.

Background
The Climate Change (Scotland) Act 2009 places a statutory target to lower GHG emissions by 80% by 2050, and an interim
target for a 42% reduction by 2020, against 1990 emissions set as the baseline. For the land use sector, this includes carbon dioxide, methane and nitrous oxide emissions. It is widely accepted that peatlands in their near natural state are low to moderate net GHG sinks, whilst degraded peatlands are GHG sources and thus contribute to the overall annual emissions. Restoration of damaged peatlands could therefore significantly contribute to lowering existing emissions in the land use sector. However, there is a paucity of data on the emissions from restored peatlands, specifically from blanket and lowland raised bogs. Hence we investigated the net GHG emissions of a variety of degraded and restored peatlands, which, in the longer term, can help to inform updated emission factors for UK peatlands in the UK Greenhouse Gas Inventory.
ApproachOn the ground GHG exchange measurements, using portable chambers or static eddy covariance towers, have been conducted at a number of peatland sites across Scotland. Some of these included other experimental variables, such as superimposed summer drought, grazing or N deposition. One noteworthy experimental site is the current flux tower at Lonielist, which is a formerly afforested peatland that was restored in 2004 and is part of the RSPB’s Forsinard restoration chronosequence. There are three further flux towers in other sites (an older restoration site, a near natural control and a site still under forestry plantation) which are run by other organisations (CEH, UHI, Universities of St Andrews/Stirling).
Results• Experiments using portable chambers have
varied in the extent of their measurement period and were not always long enough to calculate complete annual carbon budgets;
12
Greenhouse gas emissions from degraded and restored peatlands
CHAPTER 5

13
however, these experiments showed the carbon benefits of restored grazed moorlands and rainfall dependency of C losses in drained peatlands.
• Some of our data from cutover peatlands were included in a larger collaborative synthesis of the CO2 emissions from harvested peatlands in the UK and Ireland and showed that emissions are lower than the IPCC default value suggests.
• Ongoing monitoring at the Forsinard sites suggests some variability in the carbon sink strength of these ecosystems after restoration. For example, the Lonielist site which was restored in 2004 emitted 80 g C m-2 between June 2014 and June 2015 (Fig. 1). In comparison the Tallaheel site, restored in 1998, sequestered 71 g C m-2 over the same period (Hambley, pers comm), while the average carbon sequestration rate over 6 years of a near pristine peatland in the Flow Country was 114 g C m-2 (Levy 2015, CEH Edinburgh data).
ConclusionsAssessing the benefits of peatland restoration in terms of the GHG savings requires a detailed knowledge of the emission factors from both restored and various categories of degraded peatlands. Using the best available UK and UK-relevant data, we have characterised these emission factors and their associated uncertainty. There is currently still a lack of data on the change of emissions through time following restoration efforts, specifically for UK-specific scenario’s such as restoration of formerly afforested or drained blanket bog sites. Ongoing research is aimed at plugging the knowledge gaps and reducing the uncertainties. Nevertheless, it is clear from the data that there are significant carbon savings to be made from peatland restoration, particularly from those categories with currently high emissions.
Authors: Matt Saunders (University College Dublin), Rebekka Artz and Robin Matthews (James Hutton Institute)
Contact: Robin Matthews ([email protected])
Fig. 1: Carbon dioxide exchange at a 10 year old restored blanket bog (Lonielist, Sutherland, UK) over a one year period. Data shown are gross primary production (GPP) and ecosystem respiration (Reco), which, when combined, make up net ecosystem exchange (NEE). NEE is shown cumulative over the course of the measurement period, showing net uptake of carbon during most of the second half of the 2014 calendar year, followed by net loss to the atmosphere during most of the first half of the 2015 calendar year.
Background
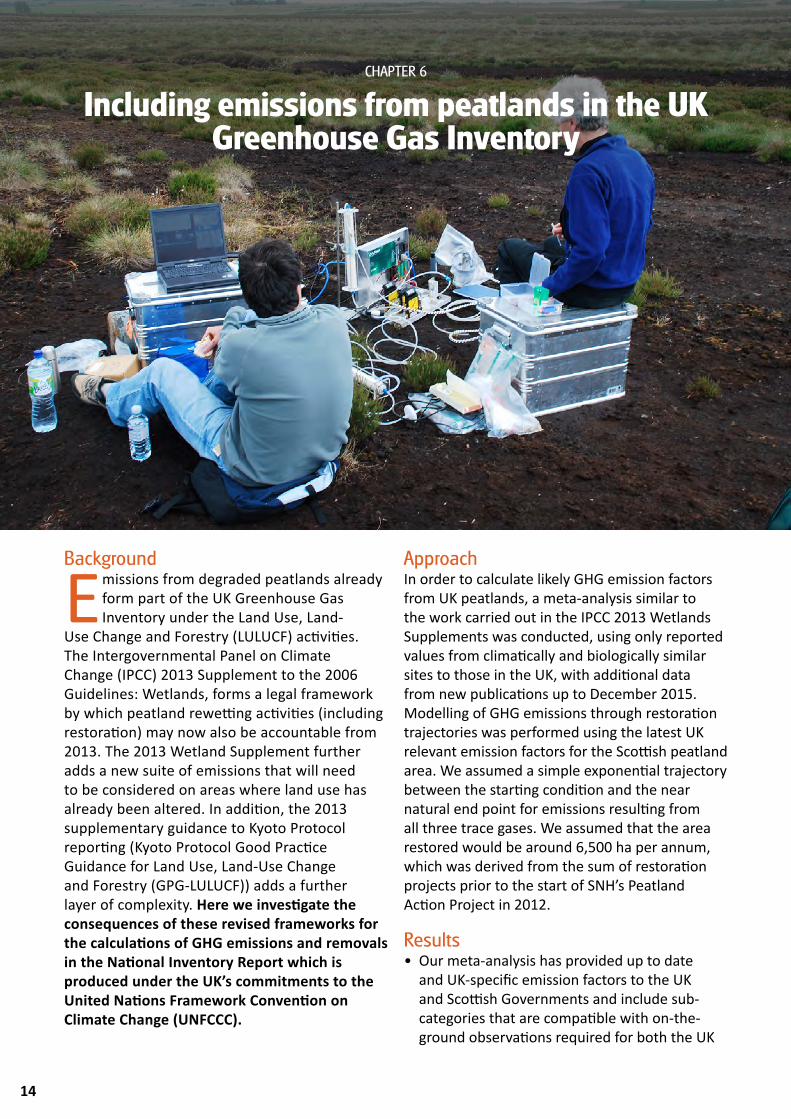
Emissions from degraded peatlands already form part of the UK Greenhouse Gas Inventory under the Land Use, Land-
Use Change and Forestry (LULUCF) activities. The Intergovernmental Panel on Climate Change (IPCC) 2013 Supplement to the 2006 Guidelines: Wetlands, forms a legal framework by which peatland rewetting activities (including restoration) may now also be accountable from 2013. The 2013 Wetland Supplement further adds a new suite of emissions that will need to be considered on areas where land use has already been altered. In addition, the 2013 supplementary guidance to Kyoto Protocol reporting (Kyoto Protocol Good Practice Guidance for Land Use, Land-Use Change and Forestry (GPG-LULUCF)) adds a further layer of complexity. Here we investigate the consequences of these revised frameworks for the calculations of GHG emissions and removals in the National Inventory Report which is produced under the UK’s commitments to the United Nations Framework Convention on Climate Change (UNFCCC).
ApproachIn order to calculate likely GHG emission factors from UK peatlands, a meta-analysis similar to the work carried out in the IPCC 2013 Wetlands Supplements was conducted, using only reported values from climatically and biologically similar sites to those in the UK, with additional data from new publications up to December 2015. Modelling of GHG emissions through restoration trajectories was performed using the latest UK relevant emission factors for the Scottish peatland area. We assumed a simple exponential trajectory between the starting condition and the near natural end point for emissions resulting from all three trace gases. We assumed that the area restored would be around 6,500 ha per annum, which was derived from the sum of restoration projects prior to the start of SNH’s Peatland Action Project in 2012.
Results• Our meta-analysis has provided up to date
and UK-specific emission factors to the UK and Scottish Governments and include sub-categories that are compatible with on-the-ground observations required for both the UK
14
Including emissions from peatlands in the UK Greenhouse Gas Inventory
CHAPTER 6

15
Peatland Code and the UK National Emissions Inventory (Table 1). More up to date emissions factors have been produced and used for the modelling of total abatement potential, but the figures have not yet passed peer-review and can therefore not be published in this document. These figures could be used for Tier 2 calculations in the UK National Greenhouse Gas Inventory, i.e. calculations based on country specific data rather than Tier 1 (default) values.
• By our latest calculations, the total annual abatement from peatland restoration for Scotland by 2050 is likely to be around 1 megatonne of CO2 equivalents. On a cumulative basis, this would total 16 megatonnes of CO2 equivalents; however there is a reasonably large uncertainty around these values (Fig. 1). Interim annual abatement figures for 2020 and
2030 are around 0.1 and 0.4 megatonnes of CO2 equivalents, respectively.
ConclusionsPeatland restoration has significant potential to contribute to Scotland’s efforts to reduce greenhouse gas emissions. While our model used a relatively conservative figure for annual restoration effort, it may be possible to increase this up to three-fold. However, it is likely that this would begin to stretch resources in terms of man-power with the necessary skills. It has been suggested that 10,000 ha per annum might be an upper limit for some interventions. Based on an estimated cost per hectare of £880, then an effort of 6,500 ha peatland restoration per annum would cost in the region of £5-6M per annum.
Authors: Rebekka Artz and Steve Chapman (James Hutton Institute)Contact: Rebekka Artz ([email protected])
Fig. 1: Annual GHG abatement from peatland restoration (±95% confidence interval). Terms included are carbon dioxide, methane, nitrous oxide and dissolved organic carbon emissions.
Table 1: Figures for GHG emissions factors for different land uses on UK blanket bog, in tons of CO2 equivalents per hectare per year. Data shown are averages, with the 95% confidence interval in brackets. Latest published data from the UK Peatland Carbon Code, provided by James Hutton Institute and BioSS staff.
Land use category Carbon dioxide Methane Nitrous oxide
Near natural
Drained
Eroded and cutover
Modified
Rewetted
-3.0 (-4.5 to -1.6)
1.4 (-2.5 to 5.4)
2.6 (-1.9 to 7.0)
-0.1 (-4.8 to 4.7)
-1.2 (-4.4 to 2.0)
3.2 (0.6 to 5.8)
2.0 (0.3 to 3.7)
0.8 (-0.2 to 1.9)
1.0 (-0.2 to 2.3)
4.1 (1.2 to 6.9)
0.0 (-0.1 to 0)
0.0 (-0.1 to 0.1)
0.0 (0.0 to 0.1)
0.5 (-0.01 to 1.01)
0.2 (-0.1 to 0.5)

Background
Peatland restoration has long been assumed to have carbon benefits as degraded peatlands have generally been shown
to be strong net GHG emitters, whereas near-natural peatlands are low to moderate GHG sinks. This perceived carbon benefit, as well as associated benefits for other ecosystem services, has led to large scale peatland restoration efforts since the late 1990s. Calculation of the likely carbon benefits of peatland restoration led to its inclusion as a policy tool in Scotland’s Report on Proposals and Policies. Since 2012, there has been >£15 million spent on peatland restoration under the Peatland Action Project and work carried out under the UK Peatland Code. Economic analysis of the merits of restoration may highlight whether these resources are warranted.
ApproachRestoration cost data were taken from literature and industry sources. To enable an initial cost:benefit analysis to be completed, emission differentials were calculated under different climate change scenarios: these scenarios (in the absence of data) were characterised as emission differentials increasing by 0.5% and 1.5% per year. The differential between emission profiles under the restored and (baseline) non-restored cases was valued using DECC’s central non-traded carbon price to 2027, 2050 and 2080. The discount rate used followed the HM Treasury Green Book: 3.5% from year 0 to 30 and 3% from year 31 to 67. An alternative method used a ‘ready reckoner’ of possible net benefits under different ‘what if’ assumptions of a range of opportunity costs, as well as capital and ongoing maintenance and monitoring costs, including estimates of non-carbon benefits.
16
Economic costs and benefits of peatland restoration
CHAPTER 7

17
Table 1. Economic Benefit:Cost ratios for peatlands restoration under no and high climate change scenarios.
Results • Both studies identified that restoration costs
are complex to evaluate since they depend on numerous site-specific parameters such as heterogeneity of degradation, remoteness of sites and scale of intervention.
• The value of net carbon savings was compared to the upfront capital costs plus on-going opportunity, management and monitoring costs, to generate illustrative benefit:cost (B:C) ratios and discounted Net Present Values (NPV). All other things being equal, higher emission savings, more rapid emission savings and lower costs all yield greater net benefits, as do longer time-horizons and the pressure of accelerating climate change. The case for restoration is generally positive (B:C > 1) once sufficient time has elapsed (Table 1). Simulated climate change strongly increased the support for restoration.
• The ‘ready reckoner’ approach generated similar economic outcomes (Table 2). Restoration is most readily supported where emission differentials are high and ongoing costs are low. In areas where emissions differentials are likely to be very low
(e.g. young plantations or grazed peatlands), restoration would only be justifiable if ongoing and/or capital costs are very low, or possibly if non-carbon benefits are also considered.
ConclusionsThe two methodologies led to similar conclusions. They suggest that in many cases, but not all, restoration appears to be merited, despite the uncertainty arising from our current scientific understanding and available data. This can hold even for carbon benefits alone over a relatively short time-period, with the inclusion of non-carbon and longer-term benefits reinforcing the case. However, the results are sensitive to a number of assumptions and some areas for further research have been identified. For example, there is a need for a better understanding of how emission profiles change over time with and without restoration, taking account of anticipated climate change pressures.
Authors: Steve Chapman, Rebekka Artz (James Hutton Institute), Andrew Moxey (Pareto Consulting), Laetitia Pettinotti, Klaus Glenk and Dominic Moran (Scotland’s Rural College).
Contact: Steve Chapman ([email protected])
Table 2. Possible positions of peatland categories within ready reckoner grid. Ongoing costs would stem mainly from the opportunity costs of displaced land uses.
Peatland categoryNo climate change High climate change
2027 2050 2080 2027 2050 2080
ArableImproved grasslandDrained for grazingAfforestedErodedBareHeathland
0.220.070.230.03-0.23-0.350.44
1.260.681.290.200.650.510.88
2.981.652.750.451.941.401.23
0.320.180.380.04-0.13-0.370.44
1.881.101.910.311.190.690.96
4.912.774.330.803.492.021.82
Low
LowMediumHigh
Grazing/grouse moorsGrazing/grouse moorsRapidly growing forestry
Grazing/grouse moorsGrazing/grouse moorsRapidly growing forestry
Bare & eroded peatBare & eroded peatArable & improved grass
Medium HighOngoing costs
Emission differential (tCO2e /ha/year)

Background
As part of the Scottish Government’s commitment to increased reliance on renewable energy, there has been a rapid
expansion in the development of wind farms across the country. Wind farms are necessarily placed in areas of high wind exposure and these often coincide with peatlands and other carbon-rich soils. Such developments can lead to carbon loss from disturbance of the peat resource. Applications for developments of ≥ 50 MW are required to use the carbon calculator, which provides a life cycle assessment
of the greenhouse gas emissions and the carbon payback time. In collaboration with other organisations (Universities of Glasgow and Aberdeen, University College Dublin, ClimateXChange), we report on wind farm development in Scotland, and on refinements of the carbon calculator, an assessment of its use and its utility in planning.
ApproachWe contributed to the updating of the carbon calculator and provided guidelines on site detail requirements, whilst ensuring that the calculator
18
Wind farms on peatCHAPTER 8

19
meets needs of stakeholders. We conducted a survey amongst stakeholders on the current use of the carbon calculator and the extent to which it has been used in planning. The potential for the wider application of the carbon calculator for other developments on peatland, including wind farms of < 50 MW, was assessed. We collated available information on the scale of wind farm developments on peat and organic soils across Scotland and reviewed the impacts of land man-agement options, covering current knowledge and best practice.
Results• Updates have been made to the carbon
calculator and this process is ongoing.
• Stakeholders have found the calculator to be useful for estimating payback times and generally raising awareness of the potential carbon losses from developments on peat. There were cases where it had been used voluntarily on < 50 MW wind farms.
• The tool could potentially be used for other developments on peatland, such as road infrastructure, but would require modification.
• From the GIS-based analysis of wind farm location (Fig. 1) it was estimated that 23% of < 50 MW and 50% of ≥ 50 MW operational wind farms were on peatland (Table 1).
• Good practice guidelines were found for wind energy developments on peatlands from Scotland, Ireland and England and Wales; however, the carbon calculator is unique to Scotland.
ConclusionThe commissioning and refinement of the wind farm carbon calculator has resulted in a unique tool for supporting decision-making and increasing awareness of the carbon costs associated with developments on peatland, which has been of value to developers and planners. With some further refinement it could potentially be applied to types of development other than wind farms.
Authors: Steve Chapman and Jagadeesh Yeluripati (James Hutton Institute)
Contact: Jagadeesh Yeluripati ([email protected])
Fig. 1: Wind farms in Scotland
Table. 1: Number of operational wind turbines in Scotland (2014 data) in relation to peat depth.
Depth of peat/organic matter (m)
Number of turbines in wind farm developments
0>0.0 – 0.5>0.5 – 1.0>1.0 – 1.5>1.5 – 2.0
>2.0Total
< 50 MW7083961311042176
1436
≥ 50 MW264283192295
160
1095

20
Background
The National Peatland Plan emphasises the multiple benefits of peatlands to society and that the future of peatlands
should not only be of interest to the scientific community, policy makers, developers and land managers, but also to the wider public. This requires an improved understanding of public perceptions of peatlands. To lay a foundation for public engagement and communication, our research addressed the following:
• What are the perceived associations, uses, benefits and dis-benefits of peatlands?
• How are the uses, benefits and activities perceived to be affected by peatland condition?
• Is there support for restoration and what are the reasons?
• Where should restoration take place?
ApproachTwo workshops were held in Aberdeen and one on Lewis. Participants in Aberdeen were primari-ly urban dwellers with no close or direct connec-tion to peatlands, whereas participants on Lewis were rural dwellers or crofters in peatland areas used for grazing land and peat cutting. In both areas, participants represented a wide spectrum in terms of gender, age and socio-economic background. The workshops consisted of a series of individual and group exercises and discussions (Figs. 1 and 2).
Results• Within the views on peatlands, there were
marked differences between the two areas: participants on Lewis emphasised productive uses such as peat cutting and grazing along with their cultural values. Aberdeen participants were more likely to emphasise benefits such as biodiversity and carbon sequestration.
Public perceptions of peatland valueCHAPTER 9

21
• Perceptions of peatlands as inhospitable, ‘featureless’ areas were present in both locations.
• Most participants in Aberdeen recognised negative impacts of human use on peatlands and thought that peatlands should be protected or restored. On Lewis, some participants regarded under-utilisation as a problem, but the majority considered that the current use does not have negative effects and should continue to benefit society.
• In both locations, trade-offs between (i) negative impacts on the environment, landscape amenity, natural heritage and tourism/recreation and (ii) enhancing the productive capacity of the land and maintaining cultural heritage (peat cutting) became apparent.
• On the preferred locations for restoration, Aberdeen participants selected a wide range of locations for a variety of reasons. On Lewis, those participants who saw a need for restoration emphasised the degree of degradation and involvement of local communities in the selection of sites.
Conclusion Differences in historical and current uses influence the cultural character of peatlands and people’s views of peatland management and restoration, and help explain the wide range of nuanced perceptions and opinions voiced by the workshop participants. Our research shows that members of the wider public recognise the importance of the environmental benefits provided by peatlands. However, people also see trade-offs between conserving peatlands and making use of their productive capacity. Public engagement and awareness-raising should therefore not solely consist of conveying the importance of environmental benefits. Instead, it should build on the plurality of views, values and uses in order to develop an understanding of peatlands and their future that is shared by experts, local communities and the general public. This will enhance the long-term sustainability of our efforts to safeguard peatlands as an important part of Scotland’s natural capital.
Authors: Anja Byg (James Hutton Institute), Julia Martin-Ortega (University of Leeds), Andrew McBride (Scottish Natural Heritage) and Klaus Glenk (Scotland’s Rural College).
Contact: Anja Byg ([email protected])
Fig. 1: Pictorial representations of peatlands in bad, intermediate and good ecological condition (from left to right) developed together with scientists and an artist as a useful communicative tool about peatland degradation and restoration.
Fig. 2: Workshop participants in one of the exercises on peatland restoration.

22
Background
An important consideration for peatland conservation and restoration, given the high government targets for emissions
reduction and habitat restoration, is to consider where such restoration may be most desirable. To aid this process, a decision support tool has been developed that utilises all of the information that is available at the national scale on peatland location and various condition indicators.
ApproachThe WISE (Winning Interventions for Sustainable Ecosystems) Peatland Choices decision support tool is based upon a spatially explicit form of multiple criteria decision-making. It uses layered national scale datasets in GIS format that are weighted on the basis of expert opinion. Data included are peatland-relevant extracts from The Land Cover of Scotland (1988), the Land Cover Map (2007, CEH), the 1:250,000 Soils of Scotland, the 1:25,000 Soils of Scotland, Forestry Commission Scotland holdings (FCS), Common Standards Monitoring data on designated sites
(SNH), onshore renewables location and status (SNH) and land ownership information from the Who Owns Scotland database (Andy Wightman). We asked a group of 62 workshop attendees for a list of restoration criteria that they would wish to have data on for a given candidate site. The initial list of 45 criteria was condensed by the same group of attendees to 19 site selection criteria. We subsequently conducted a web-based survey of the weight that people would attribute to each of these criteria, i.e. whether they felt that certain criteria would be more important than others. Decision rules were built for those site selection criteria where there was sufficient and suitable information in GIS format and data were displayed as categories (low, medium, high) at 100 m resolution.
Results• At present, 6 out of 19 potential site
selection criteria have been implemented in the tool. Their inclusion was determined by the availability of data, and they were integrated onto a single map showing a spatial representation across Scotland of the potential
The WISE Peatland Choices decision support tool
CHAPTER 10

23
for peatland restoration.
• The WISE Peatland Choices tool returns summary site scores at 100 m resolution (Fig. 1). The darker the shade, the higher the cell score for the total assessed criteria. Higher scores indicate higher probability of being suitable for peatland conservation or restoration. Areas with lighter shades, however, should not be excluded from further assessment as these generally carry higher uncertainties.
• The uncertainty associated with the scoring was assessed by calculation of uncertainty scores. The uncertainty derives from the layers underpinning the tool, e.g. the Land Cover of Scotland 1988 can have an up to 30% misclassification error for some land cover types. The highest source of uncertainty occurs within the rule weights and rule classes.
ConclusionThe areas scoring highest in their potential for peatland restoration are the large expanses of blanket bog in the Flow Country and Western Isles; these also show the lowest uncertainties in the assessment. The tool is still in development and the latest report can be accessed at http://www.climatexchange.org.uk/reducing-emissions/carbon-benefits-peatland-restoration/. In future iterations of the tool, we aim to be able to add spatial information on the likely carbon abatement that may be achieved through restoration.
Authors: Rebekka Artz, David Donnelly, Steve Chapman, Alessandro Gimona, Matt Aitkenhead (James Hutton Institute) and Andrew Coupar (Scottish Natural Heritage)
Contact: Rebekka Artz ([email protected])
Fig. 1: WISE Peatland Choices probability scores, as based on currently implemented site selection criteria. Darker shades indicate areas with higher probability of suitability for peatland restoration or conservation efforts.

This booklet summarises some recent research findings concerning peatlands, their biodiversity, condition, restoration and consequences for greenhouse gases. It was undertaken as part of, or under other contracts that were facilitated by, the Environmental Change Programme of the Scottish Government’s Rural and Environment Science and Analytical Services Division’s (RESAS) portfolio of Strategic Research (2011-16).
This synthesis focusses on a subset of the work on peatlands and involved researchers from:
• The James Hutton Institute• Scotland’s Rural College
Funded by:
This booklet, and others in the same series, including Ecosystem Services, Grassland Biodiversity, Biodiversity and Upland Management, Woodland Biodiversity and Ecosystems, Utilising Biodiversity for Sustainable Agriculture and Soils: Environment, Health and Society are available online at www.hutton.ac.uk.
In collaboration with:


