23
P P E E E E R R 2002 PEER Annual Meeting PEER 2002 Annual Meeting Helmut Krawinkler Seismic Demand Analysis
| Date post: | 22-Dec-2015 |
| Category: |
Documents |
| Upload: | keenan-pinnick |
| View: | 215 times |
| Download: | 1 times |
PPEEEERR
2002 PEER Annual Meeting
PEER 2002 Annual Meeting
Helmut Krawinkler
Seismic Demand Analysis

Performance Assessment
( ) ∫∫∫= )(||| IMdIMEDPdGEDPDMdGDMDVGDVv λ
Performance (Loss) Models and Simulation HazardImpact
Please accept my apologies for showing the(in)famous framework equation

Engineering Demand Parameters
Collapse: Maximum Story Drift (and others)
Struct. Damage: Story Drifts (each story) andComponent Deformations
Nonstr. Damage: Story Drift (each story)
Content Damage: Floor Acceleration andVelocity (each story)

Probabilistic Seismic Demand Analysis (PSDA)
Given:•Structural system•Base shear strength, = Vy/W•Story shear strength distribution
•Ground motion hazard, (Sa(T1))•Set of representative ground motions
Asked:•EDP hazard, (EDP), max. drift, average drift, floor accel.
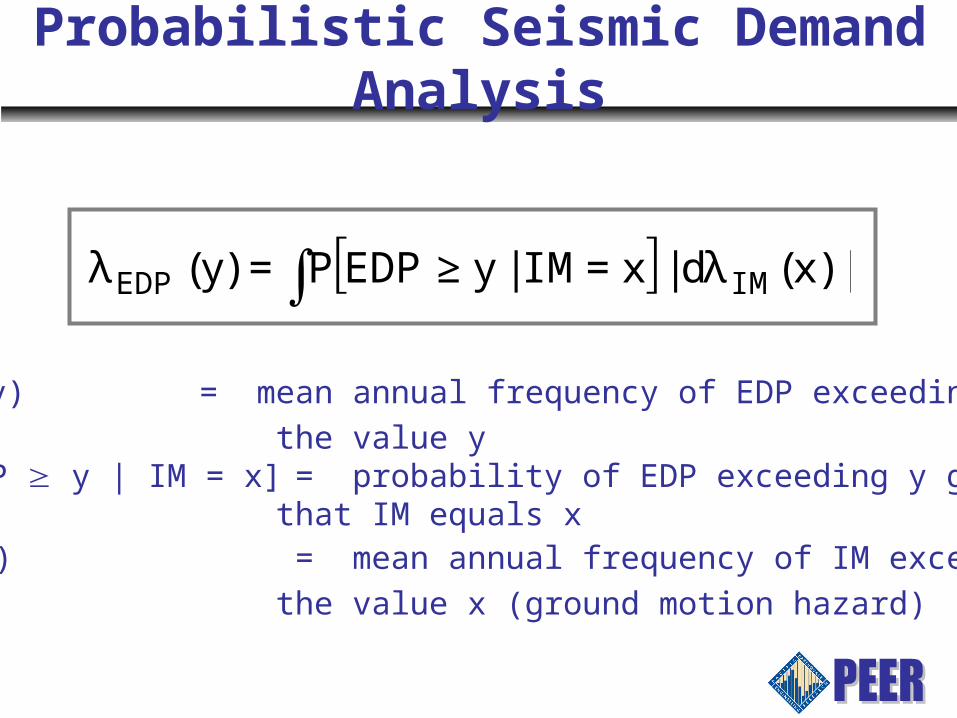
[ ] |)x(d|xIM|yEDPP)y( IMEDP λ=≥=λ ∫
Probabilistic Seismic Demand Analysis
EDP(y) = mean annual frequency of EDP exceeding
the value yP[EDP y | IM = x] = probability of EDP exceeding y given
that IM equals xIM(x) = mean annual frequency of IM exceeding
the value x (ground motion hazard)

EDP (e.g., max. interstory drift)
IM (
e.g.
, Sa(
T1)
)
IM Hazard curve(annual freq. of exceedance)
Individual recordsMedian84%
Incremental Dynamic Analysis (IDA)

Hazard Curve for Average of Max. Drifts
AVERAGE DRIFT HAZARD CURVE-T1=1.8 sec.N=9, =0.10, =0.05, Peak-oriented model, =0.060, BH, K1, S1, LMSR
0.0001
0.001
0.01
0.1
1
10
0 0.005 0.01 0.015 0.02 0.025Average of Maximum Story Drifts,
si
,ave(
)
Numerical Integration

Ground Motion Hazard:
[ ] koIM xkxIMP)x( −=≥=λ
Median EDP-IM relationship:
( )bIMaPD̂E =
EDP Hazard Curve:
[ ] ( )[ ]⎥⎥⎦
⎤
⎢⎢⎣
⎡σ=≥=
− 2IM|EDPln2
2kb/1oEDP
b
k
2
1expa/ykyEDPP)y(
Closed Form Expression for EDP Hazard

AVERAGE DRIFT HAZARD CURVE-T1=1.8 sec.N=9, =0.10, =0.05, Peak-oriented model, =0.060, BH, K1, S1, LMSR
0.0001
0.001
0.01
0.1
1
10
0 0.005 0.01 0.015 0.02 0.025Average of Maximum Story Drifts,
si
,ave(
)
Analytical Sol.-Variable Std. Dev.of Log. Drfit/Given Sa
Analytical Sol.-Constant Std. Dev. of Log. Drift/Given Sa
Numerical Integration
Hazard Curve for Average of Max. Drifts
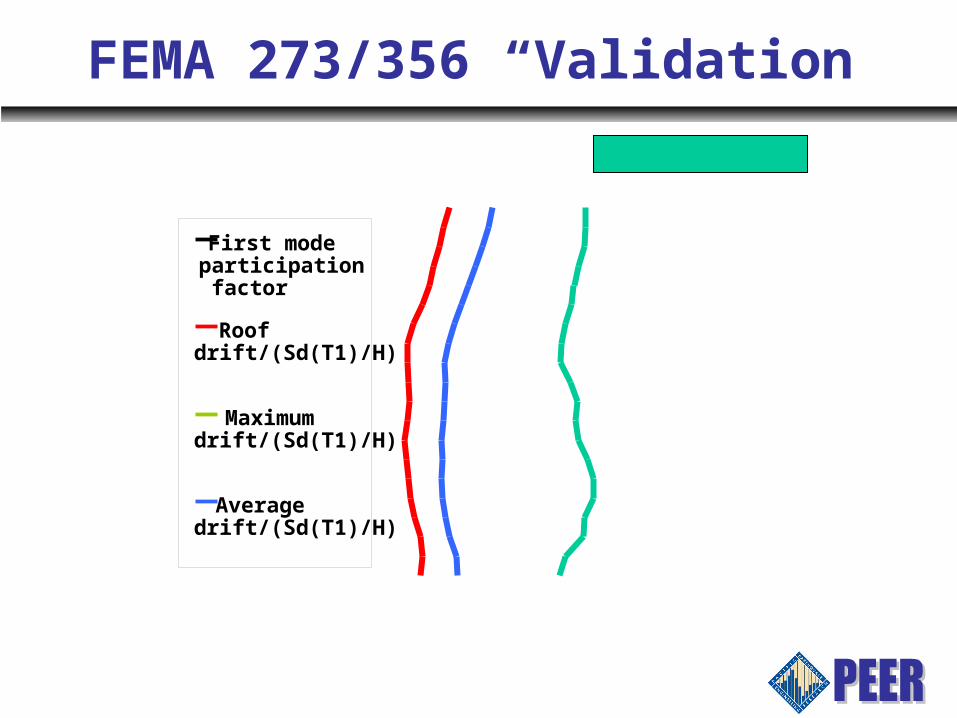
First modeparticipationfactor
Roofdrift/(Sd(T1)/H)
Maximumdrift/(Sd(T1)/H)
Averagedrift/(Sd(T1)/H)
FEMA 273/356 “Validation”

Median
84%
Design – Strong Column Concept
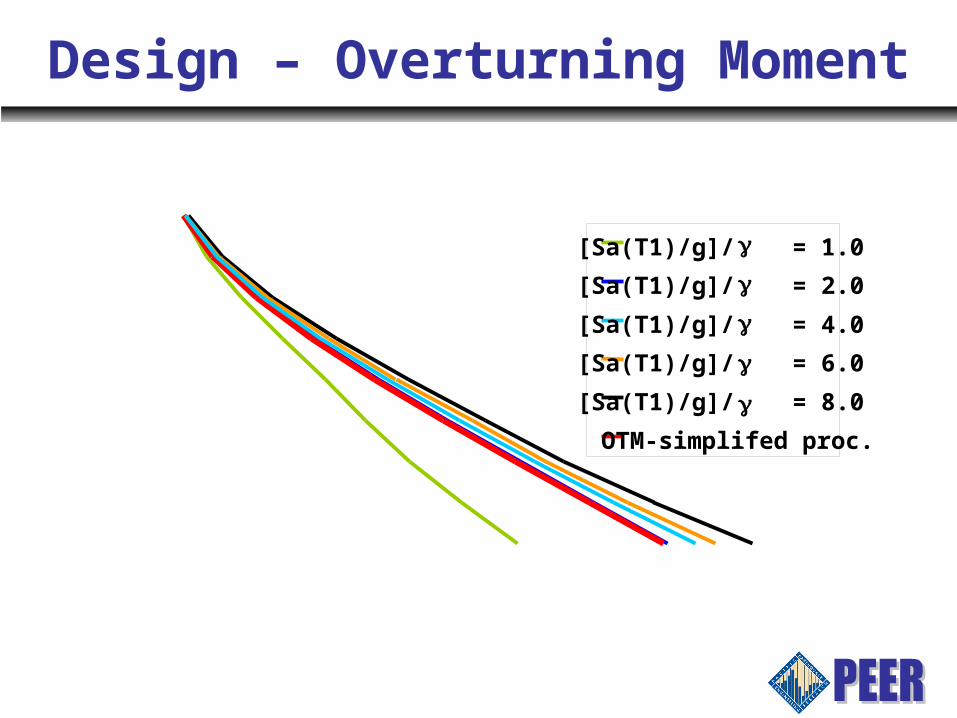
[Sa(T1)/g]/ = 1.0
[Sa(T1)/g]/ = 2.0
[Sa(T1)/g]/ = 4.0
[Sa(T1)/g]/ = 6.0
[Sa(T1)/g]/ = 8.0
OTM-simplifed proc.
Design – Overturning Moment
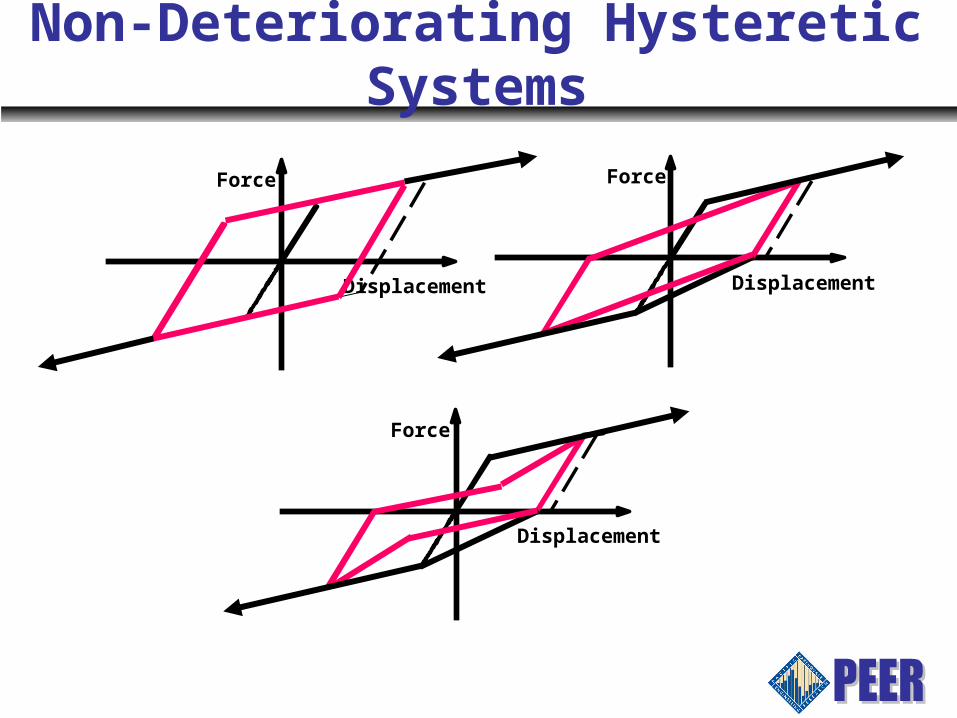
Non-Deteriorating Hysteretic Systems
Displacement
Force
Displacement
Force
Displacement
Force
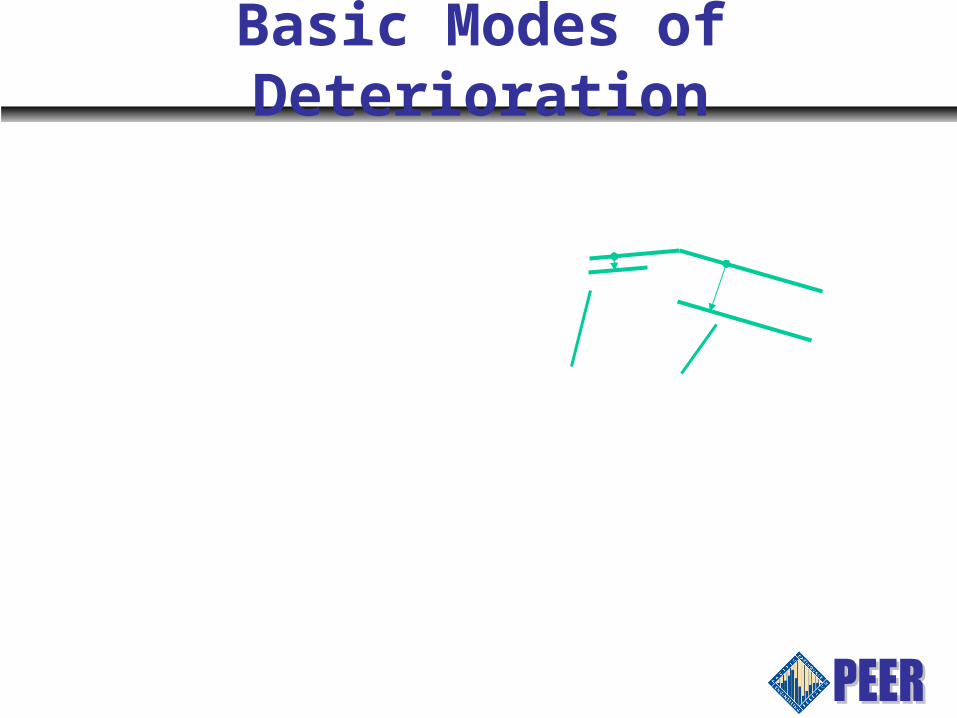
Basic Modes of Deterioration

Calibration - RC Component

Very Ductile – Slow Deterioration

Medium Ductile – Moderate Deterioration
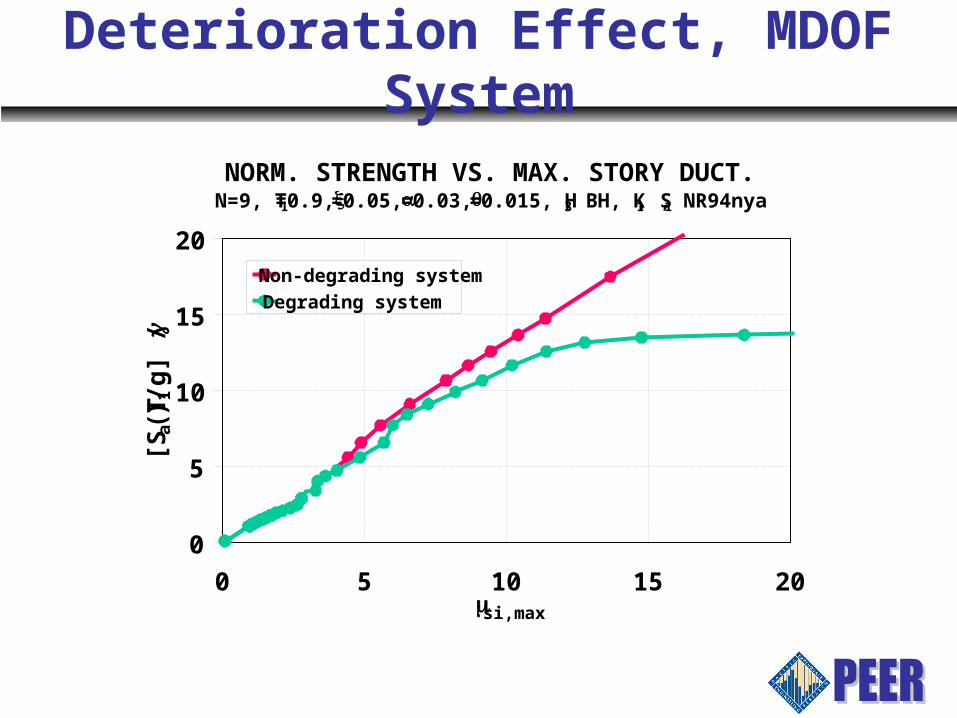
Deterioration Effect, MDOF System
NORM. STRENGTH VS. MAX. STORY DUCT.N=9, T1=0.9, =0.05, =0.03, =0.015, H3, BH, K1, S1, NR94nya
0
5
10
15
20
0 5 10 15 20si,max
[Sa(
T1)
/g]
/
Non-degrading system
Degrading system

Median
Global Collapse Assessment

Collapse Fragility Curves – SDOF Systems

Collapse Fragility Curves – SDOF Systems

Median R-factors at Collapse - SDOF Systems
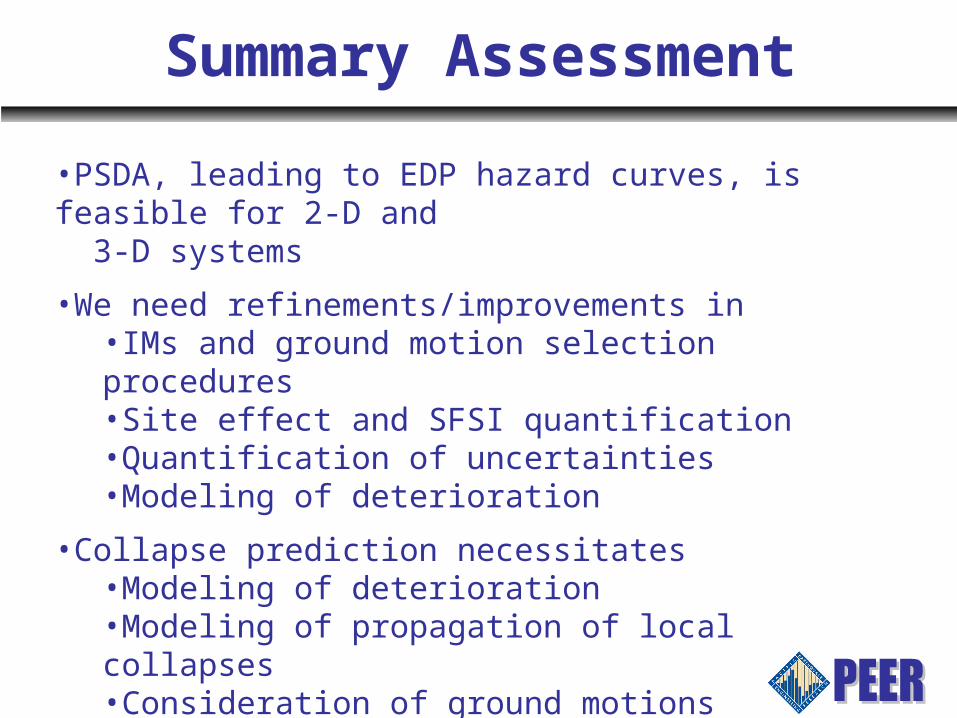
Summary Assessment
•PSDA, leading to EDP hazard curves, is feasible for 2-D and 3-D systems
•We need refinements/improvements in•IMs and ground motion selection procedures•Site effect and SFSI quantification•Quantification of uncertainties•Modeling of deterioration
•Collapse prediction necessitates •Modeling of deterioration•Modeling of propagation of local collapses•Consideration of ground motions associated with long return period hazards (near-fault)


![ESS Peer Review 2002 - Sandia National Laboratories · ESS Peer Review 2002 Alaska [Battery Diesel System] Modeling and Analysis Project November 19, 2002 ... • Smoothwall ... •](https://static.documents.pub/doc/80x56/5b94dd2d09d3f272648b9536/ess-peer-review-2002-sandia-national-ess-peer-review-2002-alaska-battery.jpg)


