A study on the characteristics of liquid interface and condensation process of superheated vapour near a solid wall by Molecular Dynamics method
Peng-Fei Chen, Lei Chen, Ya-Ling He and Wen-Quan Tao* Key Laboratory of Thermo-Fluid Science and Engineering, Ministry of Education, Xi’an Jiaotong University, Xi’an 710049, China Fax: 029-82669106 E-mail: [email protected] E-mail: [email protected] E-mail: [email protected] E-mail: [email protected] *Corresponding author
Abstract: A vapour-liquid-solid three-phase model is constructed to simulate liquid interface characteristics and condensation process near a solid wall by Molecular Dynamics (MD) simulation method. The three-phase model shows laminated liquid density distribution and oscillating distribution of tangential stress in the near-wall region. The density and temperature changing with time in the condensation process of superheated vapour argon on difform platinum surfaces are investigated. It is found that heat transfer enhancement of roughened surfaces is no longer obvious after the formation of a stable liquid film on them.
Reference to this paper should be made as follows: Chen, P-F., Chen, L., He, Y-L. and Tao, W-Q. (2011) ‘A study on the characteristics of liquid interface and condensation process of superheated vapour near a solid wall by Molecular Dynamics method’, Progress in Computational Fluid Dynamics, Vol. 11, Nos. 3/4, pp.131–138.
Biographical notes: Peng-Fei Chen graduated from School of Energy and Power Engineering of Xi’an Jiaotong University, China, in 2006 for Bachelor Degree. Than he began his graduate course for a Master Degree in Engineering Thermophysics of Xi’an Jiaotong University, and got Master Degree after three years. He works in Xi’an Aerospace Propulsion Institute now. His current research interests is micro/nano scale heat and mass transfer.
Lei Chen graduated from Henan University in 2006 for Bachelor Degree. He began his graduate course for a Doctor Degree in the MOE Key Laboratory of Thermo-Fluid Science and Engineering of Xi’an Jiaotong University, China, from 2007. His current research interests are micro/nano scale heat and mass transfer and proton exchange membrane fuel cell.
Ya-Ling He is a Professor in the MOE Key Laboratory of Thermo-Fluid Science and Engineering at Xi’an Jiaotong University. She is the Associate Regional Editor of an International Journal – Applied Thermal Engineering and the Vice President of Commission B1 of International Institute of Refrigeration. Her research interests include new refrigeration technology, high-efficient heat exchangers, micro/nano scale heat and mass transfer, bioheat transfer and fuel cells.
Wen-Quan Tao is a Professor of Engineering Thermophysics at Xi’an Jiaotong University, Xi’an China. He graduated from Xi’an Jiaotong University in 1962 and received his graduate Diploma in 1966. From 1980 to 1982 he worked with Professor E.M. Sparrow as a visiting scholar at the Heat Transfer Laboratory in Department of Mechanical Engineering of University of Minnesota. He has published more than 500 journal papers and international conference papers in the areas of numerical heat transfer, enhancement of convective heat transfer, phase change heat transfer, etc. His recent research interests include advanced numerical methods in fluid flow and heat transfer, multiscale simulations, enhancement of heat transfer, heat transfer in micro- and nano configurations, applications of solar energy.
132 P-F.Chen, L. Chen, Y-L. He and W-Q. Tao
This paper is a revised and expanded version of a paper entitled ‘Molecular Dynamics Simulation of the Condensation Process of Superheated Vapour on a Platinum Surface’ presented at Asian Symposium on Computational Heat Transfer and Fluid Flow, Jeju, Korea, 20–23 October, 2009.
1 Introduction
In micro-nanoscale systems, it is an important way to study the mechanism of phase change behaviours in solid-liquid and vapour-liquid interfaces using Molecular Dynamics (MD) simulation (Rapaport, 2004) in that it is difficult to carry out experimental measurements in such small scales. Tsuruta et al. (1999) studied the coefficient of condensation and interface rate distribution. Although the coefficient of condensation is different from the macro-coefficient of condensation (Wang et al., 2003), it is conducive to exploring the micro-mechanism of interface. Maruyama and Kimura (1999) simulated directly heat transfer process with non-equilibrium MD method and gained the thermal resistance of solid-liquid interface. Yi et al. (2002) simulated evaporation process of ultrathin liquid film at solid surface and observed the similar phenomenon with macroscopic process, such as the Leiden Frost phenomenon. Wang et al. (2007) simulated heat transfer process of a triangular nano-tube and pointed out that the total thermal resistance of micro-channel including the interfacial thermal resistance and internal resistance could be minimised by selecting the appropriate wall infiltration. They also found that the nano-channel simulated is equivalent to a heat pipe when there is a strong action between wall and fluid (Wang et al., 2007).
In this paper, based on the upper studies, we simulate the liquid interface characteristics and dynamic condensation process of superheated vapour argon on difform platinum surfaces with MD simulation method.
2 Simulation method
2.1 System model
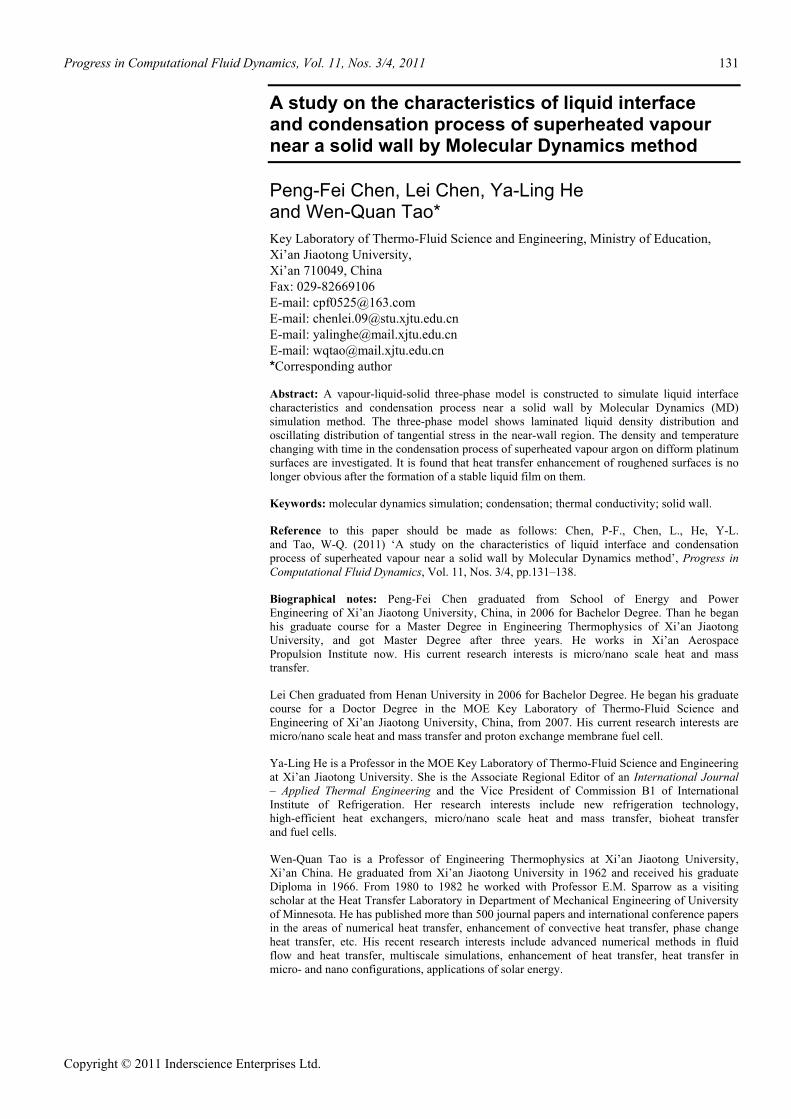
The simulation domain is composed of gas zone, fluid zone of argon molecules and solid zone of Pt atoms. The origin of coordinates of system model lies in the geometric centre of the system and three directions are shown in Figure 1. The periodic boundary condition is applied for x-direction and y-direction (Tsuruta et al., 1999); mirror boundary condition is applied for z-direction. The solid zone is at the bottom of the system and is treated as solid wall, which is composed by 3-layer ‘real’ Pt atoms and 2-layer ‘image’ Pt atoms in accordance with the face-centred cubic structure. The (111) crystal surface is vertical to the z-axis, and the ‘image method’ (Maruyama and Kimura, 1999) is applied to keep wall temperature constant. The size of simulation domain of interest selected to simulate the liquid interface characteristics is 5.0 × 4.8 × 10.9 nm3, in which there are 2048 argon molecules. To describe accurately condensation processes of superheated vapour argon on difform platinum surfaces, the size of simulation domain selected is
6.1 × 5.8 × 21.8 nm3, in which there are 4096 argon molecules.
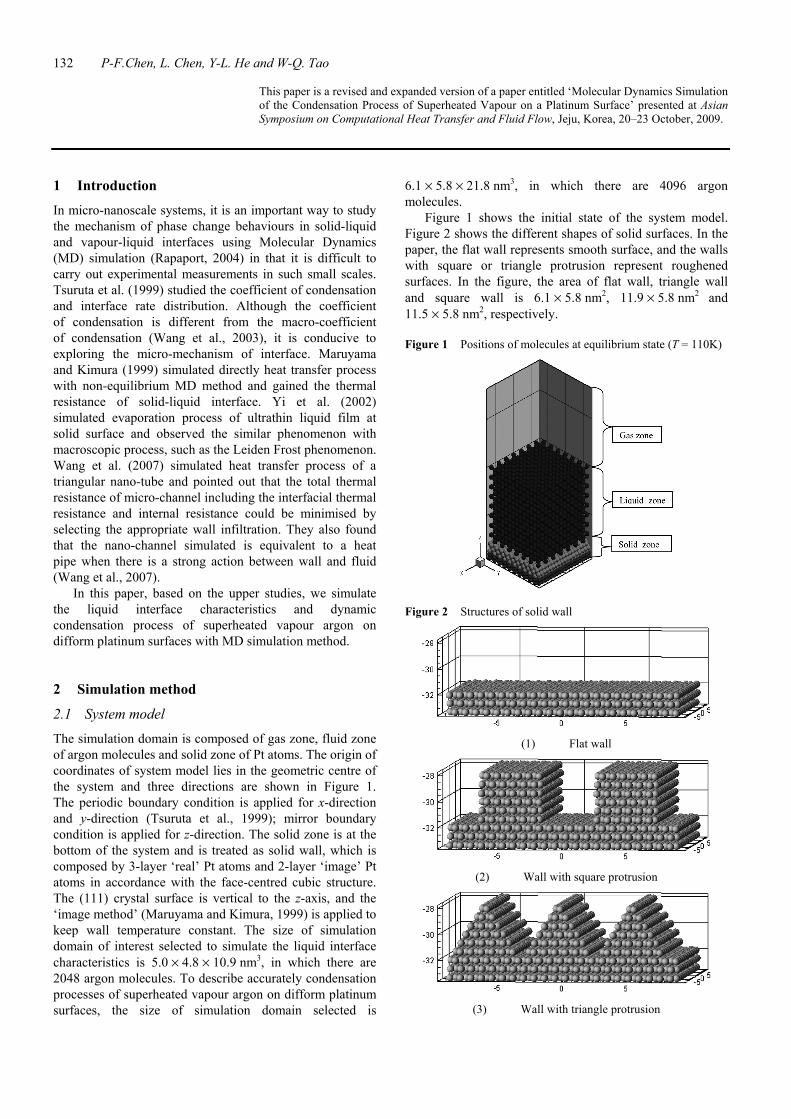
Figure 1 shows the initial state of the system model. Figure 2 shows the different shapes of solid surfaces. In the paper, the flat wall represents smooth surface, and the walls with square or triangle protrusion represent roughened surfaces. In the figure, the area of flat wall, triangle wall and square wall is 6.1 × 5.8 nm2, 11.9 × 5.8 nm2 and 11.5 × 5.8 nm2, respectively.
Figure 1 Positions of molecules at equilibrium state (T = 110K)
Figure 2 Structures of solid wall
(1) Flat wall
(2) Wall with square protrusion
(3) Wall with triangle protrusion
A study on the characteristics of liquid interface and condensation process of superheated vapour 133
2.2 Potential energy function
In fluid domain, the primary potential between argon atoms is treated by the Lennard-Jones equation
12 6( ) 4 [( / ) ( / ) ]ij ij iju r r rε σ σ= − (1)
where εAr = 1.67 × 10⁻²¹ J, σAr = 0.34 nm. The interaction between argon atoms and wall is also
treated by the Lennard-Jones potential. The parameters of characteristic scales and energy are obtained by the mixing rule. The form of the potential energy function as follows
12 6( ) 4 [( / ) ( / ) ]ij INT INT ij INT iju r r rε σ σ= − (2)
where 210.89 10 J INT Ar Ptε ε ε −= = × , and it can change slightly in certain range (Maruyama et al., 2002). σINT = (σAr + σPt)/2 = 0.31 nm.
2.3 Simulation process
In the paper, to integrate the Newton’s equation of motion, the Leap-Frog method is adopted with the time step of 5fs and the cut-off radius is 3.5σAr (Tsuruta et al., 1999).
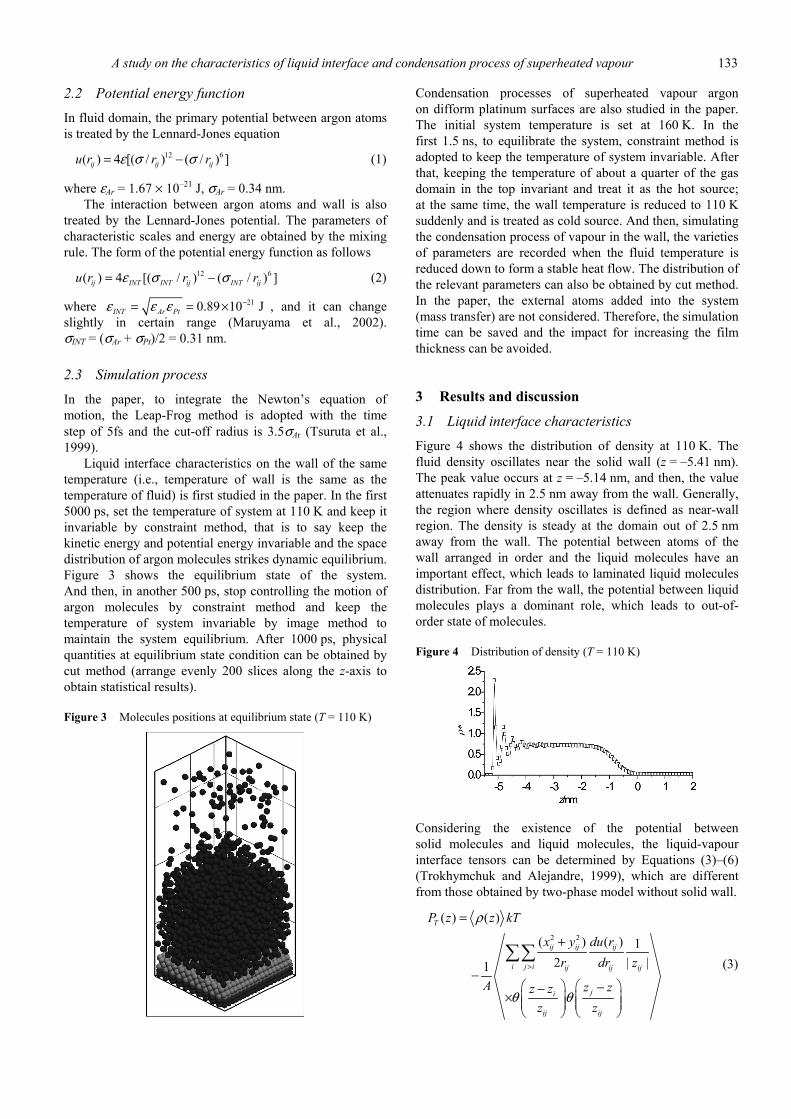
Liquid interface characteristics on the wall of the same temperature (i.e., temperature of wall is the same as the temperature of fluid) is first studied in the paper. In the first 5000 ps, set the temperature of system at 110 K and keep it invariable by constraint method, that is to say keep the kinetic energy and potential energy invariable and the space distribution of argon molecules strikes dynamic equilibrium. Figure 3 shows the equilibrium state of the system. And then, in another 500 ps, stop controlling the motion of argon molecules by constraint method and keep the temperature of system invariable by image method to maintain the system equilibrium. After 1000 ps, physical quantities at equilibrium state condition can be obtained by cut method (arrange evenly 200 slices along the z-axis to obtain statistical results).
Figure 3 Molecules positions at equilibrium state (T = 110 K)
Condensation processes of superheated vapour argon on difform platinum surfaces are also studied in the paper. The initial system temperature is set at 160 K. In the first 1.5 ns, to equilibrate the system, constraint method is adopted to keep the temperature of system invariable. After that, keeping the temperature of about a quarter of the gas domain in the top invariant and treat it as the hot source; at the same time, the wall temperature is reduced to 110 K suddenly and is treated as cold source. And then, simulating the condensation process of vapour in the wall, the varieties of parameters are recorded when the fluid temperature is reduced down to form a stable heat flow. The distribution of the relevant parameters can also be obtained by cut method. In the paper, the external atoms added into the system (mass transfer) are not considered. Therefore, the simulation time can be saved and the impact for increasing the film thickness can be avoided.
3 Results and discussion
3.1 Liquid interface characteristics
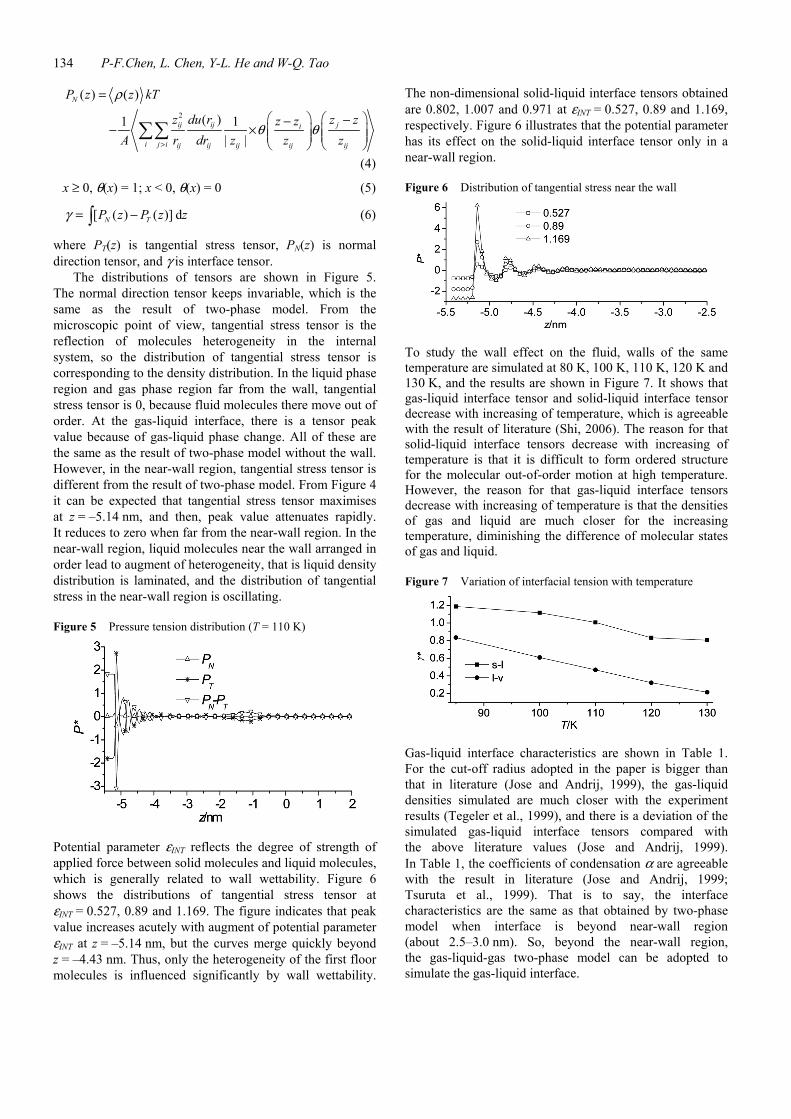
Figure 4 shows the distribution of density at 110 K. The fluid density oscillates near the solid wall (z = –5.41 nm). The peak value occurs at z = –5.14 nm, and then, the value attenuates rapidly in 2.5 nm away from the wall. Generally, the region where density oscillates is defined as near-wall region. The density is steady at the domain out of 2.5 nm away from the wall. The potential between atoms of the wall arranged in order and the liquid molecules have an important effect, which leads to laminated liquid molecules distribution. Far from the wall, the potential between liquid molecules plays a dominant role, which leads to out-of-order state of molecules.
Figure 4 Distribution of density (T = 110 K)
Considering the existence of the potential between solid molecules and liquid molecules, the liquid-vapour interface tensors can be determined by Equations (3)–(6) (Trokhymchuk and Alejandre, 1999), which are different from those obtained by two-phase model without solid wall.
2 2
( ) ( )
( ) ( ) 12 | |1
T
ij ij ij
i j i ij ij ij
ji
ij ij
P z z kT
x y du rr dr z
A z zz zz z
ρ
θ θ
>
=
+
− −−
×
∑∑ (3)
134 P-F.Chen, L. Chen, Y-L. He and W-Q. Tao
2
( ) ( )
( )1 1| |
N
ij ij ji
i j i ij ij ij ij ij
P z z kT
z du r z zz zA r dr z z z
ρ
θ θ>
=
−−− ×
∑∑
(4)
x ≥ 0, θ(x) = 1; x < 0, θ(x) = 0 (5)
[ ( ) ( )] dN TP z P z zγ = −∫ (6)
where PT(z) is tangential stress tensor, PN(z) is normal direction tensor, and γ is interface tensor.
The distributions of tensors are shown in Figure 5. The normal direction tensor keeps invariable, which is the same as the result of two-phase model. From the microscopic point of view, tangential stress tensor is the reflection of molecules heterogeneity in the internal system, so the distribution of tangential stress tensor is corresponding to the density distribution. In the liquid phase region and gas phase region far from the wall, tangential stress tensor is 0, because fluid molecules there move out of order. At the gas-liquid interface, there is a tensor peak value because of gas-liquid phase change. All of these are the same as the result of two-phase model without the wall. However, in the near-wall region, tangential stress tensor is different from the result of two-phase model. From Figure 4 it can be expected that tangential stress tensor maximises at z = –5.14 nm, and then, peak value attenuates rapidly. It reduces to zero when far from the near-wall region. In the near-wall region, liquid molecules near the wall arranged in order lead to augment of heterogeneity, that is liquid density distribution is laminated, and the distribution of tangential stress in the near-wall region is oscillating.
Figure 5 Pressure tension distribution (T = 110 K)
Potential parameter εINT reflects the degree of strength of applied force between solid molecules and liquid molecules, which is generally related to wall wettability. Figure 6 shows the distributions of tangential stress tensor at εINT = 0.527, 0.89 and 1.169. The figure indicates that peak value increases acutely with augment of potential parameter εINT at z = –5.14 nm, but the curves merge quickly beyond z = –4.43 nm. Thus, only the heterogeneity of the first floor molecules is influenced significantly by wall wettability.
The non-dimensional solid-liquid interface tensors obtained are 0.802, 1.007 and 0.971 at εINT = 0.527, 0.89 and 1.169, respectively. Figure 6 illustrates that the potential parameter has its effect on the solid-liquid interface tensor only in a near-wall region.
Figure 6 Distribution of tangential stress near the wall
To study the wall effect on the fluid, walls of the same temperature are simulated at 80 K, 100 K, 110 K, 120 K and 130 K, and the results are shown in Figure 7. It shows that gas-liquid interface tensor and solid-liquid interface tensor decrease with increasing of temperature, which is agreeable with the result of literature (Shi, 2006). The reason for that solid-liquid interface tensors decrease with increasing of temperature is that it is difficult to form ordered structure for the molecular out-of-order motion at high temperature. However, the reason for that gas-liquid interface tensors decrease with increasing of temperature is that the densities of gas and liquid are much closer for the increasing temperature, diminishing the difference of molecular states of gas and liquid.
Figure 7 Variation of interfacial tension with temperature
Gas-liquid interface characteristics are shown in Table 1. For the cut-off radius adopted in the paper is bigger than that in literature (Jose and Andrij, 1999), the gas-liquid densities simulated are much closer with the experiment results (Tegeler et al., 1999), and there is a deviation of the simulated gas-liquid interface tensors compared with the above literature values (Jose and Andrij, 1999). In Table 1, the coefficients of condensation α are agreeable with the result in literature (Jose and Andrij, 1999; Tsuruta et al., 1999). That is to say, the interface characteristics are the same as that obtained by two-phase model when interface is beyond near-wall region (about 2.5–3.0 nm). So, beyond the near-wall region, the gas-liquid-gas two-phase model can be adopted to simulate the gas-liquid interface.
A study on the characteristics of liquid interface and condensation process of superheated vapour 135
Table 1 Numerical results on different temperature of the wall
Figure 8 shows variations of temperature and density in the vapour condensation process. The initial equilibrium temperature of simulated system is set at 160 K, greater than the critical temperature (150.7 K) of argon. Now, gas-liquid interface is not existed for overheating vapour and the entire space is filled with gas atoms. In Figure 8, density distribution at 1.5 ns shows that density distribution near the wall presents a weak ‘layered’ structure, and there is a peak of density near the wall. So, it can be considered that gas-solid interface is existed.
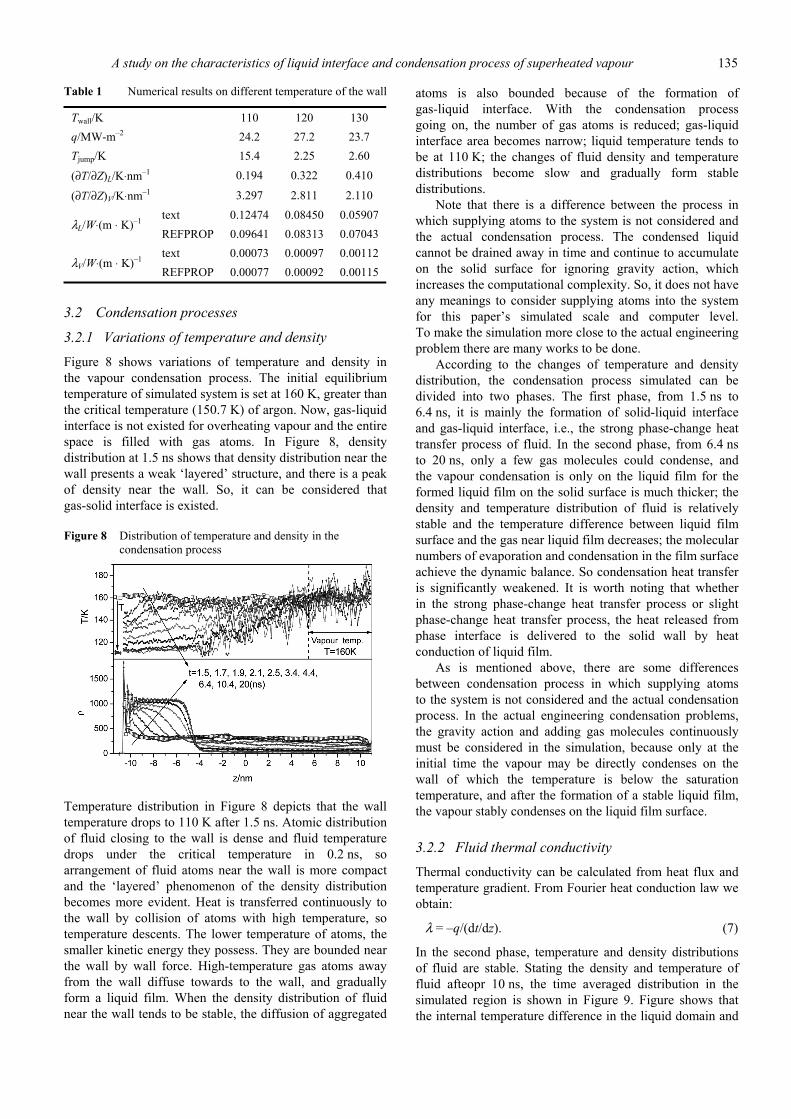
Figure 8 Distribution of temperature and density in the condensation process
Temperature distribution in Figure 8 depicts that the wall temperature drops to 110 K after 1.5 ns. Atomic distribution of fluid closing to the wall is dense and fluid temperature drops under the critical temperature in 0.2 ns, so arrangement of fluid atoms near the wall is more compact and the ‘layered’ phenomenon of the density distribution becomes more evident. Heat is transferred continuously to the wall by collision of atoms with high temperature, so temperature descents. The lower temperature of atoms, the smaller kinetic energy they possess. They are bounded near the wall by wall force. High-temperature gas atoms away from the wall diffuse towards to the wall, and gradually form a liquid film. When the density distribution of fluid near the wall tends to be stable, the diffusion of aggregated
atoms is also bounded because of the formation of gas-liquid interface. With the condensation process going on, the number of gas atoms is reduced; gas-liquid interface area becomes narrow; liquid temperature tends to be at 110 K; the changes of fluid density and temperature distributions become slow and gradually form stable distributions.
Note that there is a difference between the process in which supplying atoms to the system is not considered and the actual condensation process. The condensed liquid cannot be drained away in time and continue to accumulate on the solid surface for ignoring gravity action, which increases the computational complexity. So, it does not have any meanings to consider supplying atoms into the system for this paper’s simulated scale and computer level. To make the simulation more close to the actual engineering problem there are many works to be done.
According to the changes of temperature and density distribution, the condensation process simulated can be divided into two phases. The first phase, from 1.5 ns to 6.4 ns, it is mainly the formation of solid-liquid interface and gas-liquid interface, i.e., the strong phase-change heat transfer process of fluid. In the second phase, from 6.4 ns to 20 ns, only a few gas molecules could condense, and the vapour condensation is only on the liquid film for the formed liquid film on the solid surface is much thicker; the density and temperature distribution of fluid is relatively stable and the temperature difference between liquid film surface and the gas near liquid film decreases; the molecular numbers of evaporation and condensation in the film surface achieve the dynamic balance. So condensation heat transfer is significantly weakened. It is worth noting that whether in the strong phase-change heat transfer process or slight phase-change heat transfer process, the heat released from phase interface is delivered to the solid wall by heat conduction of liquid film.
As is mentioned above, there are some differences between condensation process in which supplying atoms to the system is not considered and the actual condensation process. In the actual engineering condensation problems, the gravity action and adding gas molecules continuously must be considered in the simulation, because only at the initial time the vapour may be directly condenses on the wall of which the temperature is below the saturation temperature, and after the formation of a stable liquid film, the vapour stably condenses on the liquid film surface.
3.2.2 Fluid thermal conductivity
Thermal conductivity can be calculated from heat flux and temperature gradient. From Fourier heat conduction law we obtain:
λ = –q/(dt/dz). (7)
In the second phase, temperature and density distributions of fluid are stable. Stating the density and temperature of fluid afteopr 10 ns, the time averaged distribution in the simulated region is shown in Figure 9. Figure shows that the internal temperature difference in the liquid domain and
136 P-F.Chen, L. Chen, Y-L. He and W-Q. Tao
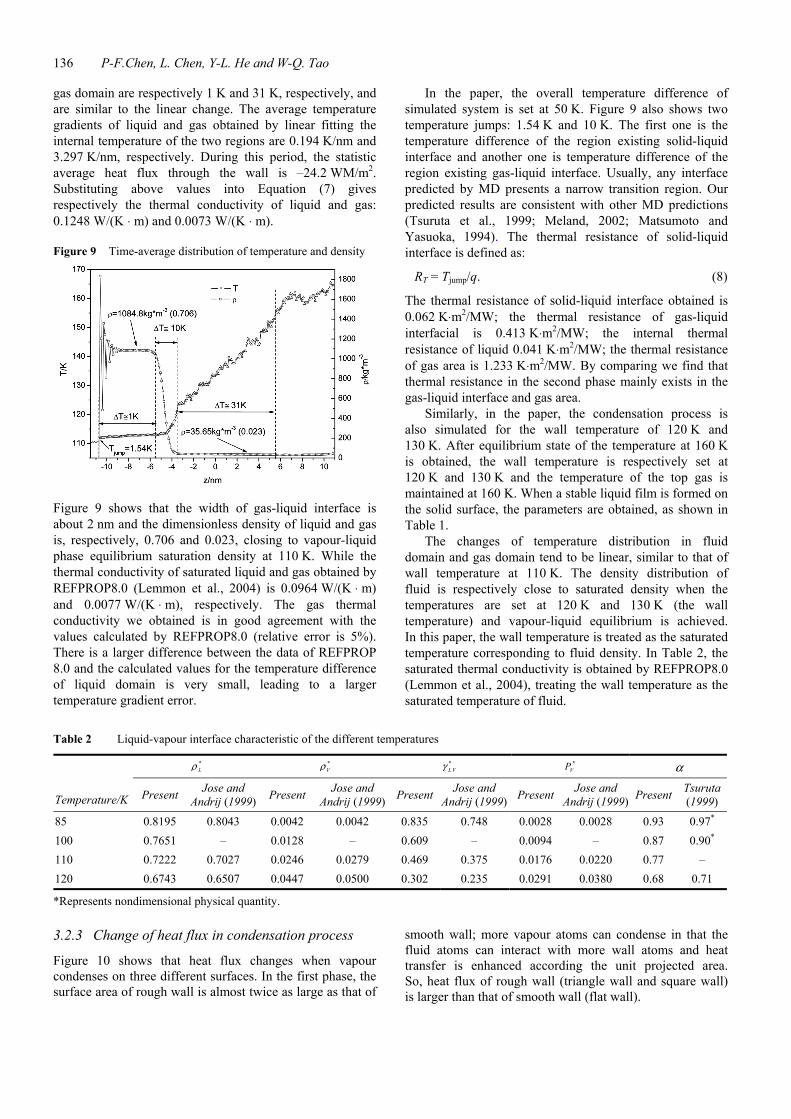
gas domain are respectively 1 K and 31 K, respectively, and are similar to the linear change. The average temperature gradients of liquid and gas obtained by linear fitting the internal temperature of the two regions are 0.194 K/nm and 3.297 K/nm, respectively. During this period, the statistic average heat flux through the wall is –24.2 WM/m2. Substituting above values into Equation (7) gives respectively the thermal conductivity of liquid and gas: 0.1248 W/(K ⋅ m) and 0.0073 W/(K ⋅ m).
Figure 9 Time-average distribution of temperature and density
Figure 9 shows that the width of gas-liquid interface is about 2 nm and the dimensionless density of liquid and gas is, respectively, 0.706 and 0.023, closing to vapour-liquid phase equilibrium saturation density at 110 K. While the thermal conductivity of saturated liquid and gas obtained by REFPROP8.0 (Lemmon et al., 2004) is 0.0964 W/(K ⋅ m) and 0.0077 W/(K ⋅ m), respectively. The gas thermal conductivity we obtained is in good agreement with the values calculated by REFPROP8.0 (relative error is 5%). There is a larger difference between the data of REFPROP 8.0 and the calculated values for the temperature difference of liquid domain is very small, leading to a larger temperature gradient error.
In the paper, the overall temperature difference of simulated system is set at 50 K. Figure 9 also shows two temperature jumps: 1.54 K and 10 K. The first one is the temperature difference of the region existing solid-liquid interface and another one is temperature difference of the region existing gas-liquid interface. Usually, any interface predicted by MD presents a narrow transition region. Our predicted results are consistent with other MD predictions (Tsuruta et al., 1999; Meland, 2002; Matsumoto and Yasuoka, 1994). The thermal resistance of solid-liquid interface is defined as:
RT = Tjump/q. (8)
The thermal resistance of solid-liquid interface obtained is 0.062 K⋅m2/MW; the thermal resistance of gas-liquid interfacial is 0.413 K⋅m2/MW; the internal thermal resistance of liquid 0.041 K⋅m2/MW; the thermal resistance of gas area is 1.233 K⋅m2/MW. By comparing we find that thermal resistance in the second phase mainly exists in the gas-liquid interface and gas area.
Similarly, in the paper, the condensation process is also simulated for the wall temperature of 120 K and 130 K. After equilibrium state of the temperature at 160 K is obtained, the wall temperature is respectively set at 120 K and 130 K and the temperature of the top gas is maintained at 160 K. When a stable liquid film is formed on the solid surface, the parameters are obtained, as shown in Table 1.
The changes of temperature distribution in fluid domain and gas domain tend to be linear, similar to that of wall temperature at 110 K. The density distribution of fluid is respectively close to saturated density when the temperatures are set at 120 K and 130 K (the wall temperature) and vapour-liquid equilibrium is achieved. In this paper, the wall temperature is treated as the saturated temperature corresponding to fluid density. In Table 2, the saturated thermal conductivity is obtained by REFPROP8.0 (Lemmon et al., 2004), treating the wall temperature as the saturated temperature of fluid.
Table 2 Liquid-vapour interface characteristic of the different temperatures
*Lρ *
Vρ *LVγ *
VP α
Temperature/K Present Jose and Andrij (1999) Present Jose and
Andrij (1999) Present Jose and Andrij (1999) Present Jose and
*Represents nondimensional physical quantity. 3.2.3 Change of heat flux in condensation process
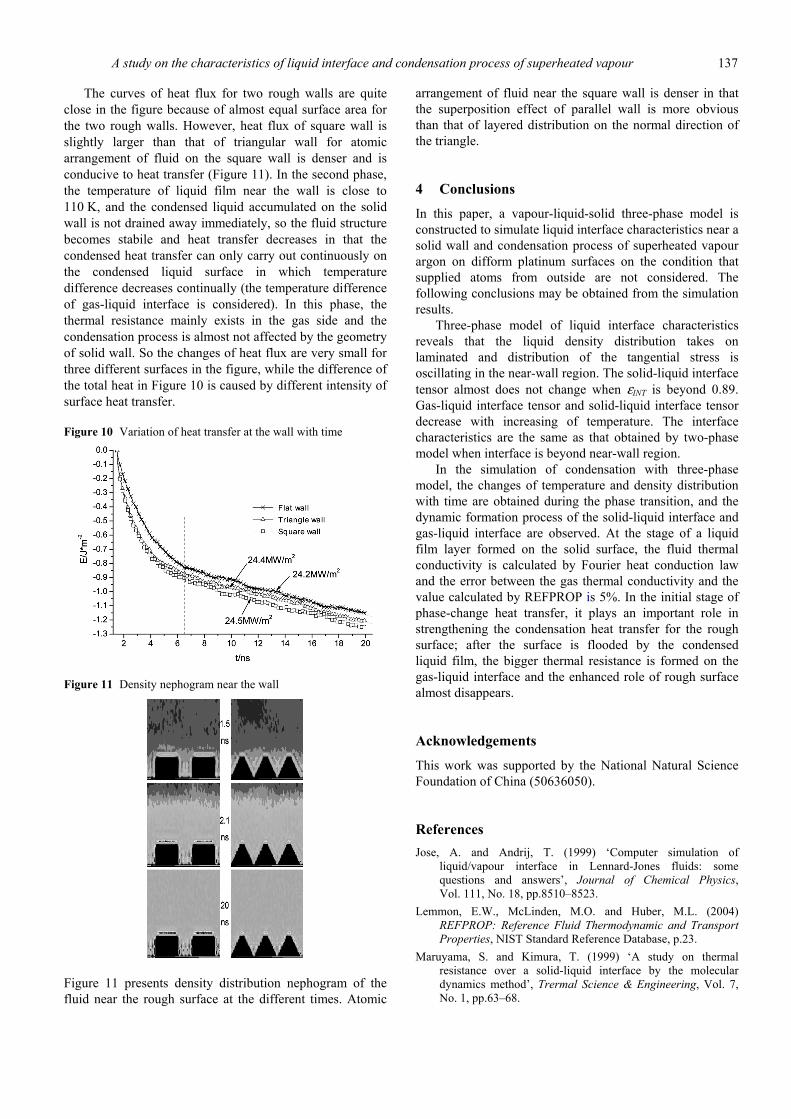
Figure 10 shows that heat flux changes when vapour condenses on three different surfaces. In the first phase, the surface area of rough wall is almost twice as large as that of
smooth wall; more vapour atoms can condense in that the fluid atoms can interact with more wall atoms and heat transfer is enhanced according the unit projected area. So, heat flux of rough wall (triangle wall and square wall) is larger than that of smooth wall (flat wall).
A study on the characteristics of liquid interface and condensation process of superheated vapour 137
The curves of heat flux for two rough walls are quite close in the figure because of almost equal surface area for the two rough walls. However, heat flux of square wall is slightly larger than that of triangular wall for atomic arrangement of fluid on the square wall is denser and is conducive to heat transfer (Figure 11). In the second phase, the temperature of liquid film near the wall is close to 110 K, and the condensed liquid accumulated on the solid wall is not drained away immediately, so the fluid structure becomes stabile and heat transfer decreases in that the condensed heat transfer can only carry out continuously on the condensed liquid surface in which temperature difference decreases continually (the temperature difference of gas-liquid interface is considered). In this phase, the thermal resistance mainly exists in the gas side and the condensation process is almost not affected by the geometry of solid wall. So the changes of heat flux are very small for three different surfaces in the figure, while the difference of the total heat in Figure 10 is caused by different intensity of surface heat transfer.
Figure 10 Variation of heat transfer at the wall with time
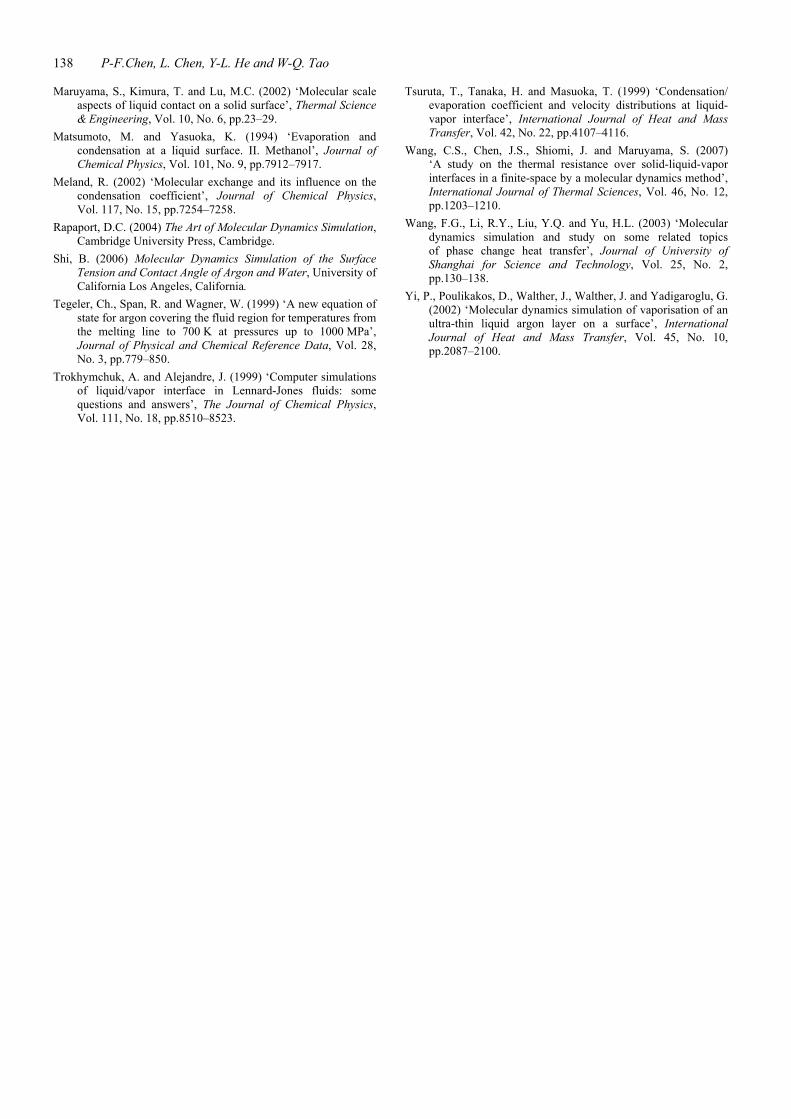
Figure 11 Density nephogram near the wall
Figure 11 presents density distribution nephogram of the fluid near the rough surface at the different times. Atomic
arrangement of fluid near the square wall is denser in that the superposition effect of parallel wall is more obvious than that of layered distribution on the normal direction of the triangle.
4 Conclusions
In this paper, a vapour-liquid-solid three-phase model is constructed to simulate liquid interface characteristics near a solid wall and condensation process of superheated vapour argon on difform platinum surfaces on the condition that supplied atoms from outside are not considered. The following conclusions may be obtained from the simulation results.
Three-phase model of liquid interface characteristics reveals that the liquid density distribution takes on laminated and distribution of the tangential stress is oscillating in the near-wall region. The solid-liquid interface tensor almost does not change when εINT is beyond 0.89. Gas-liquid interface tensor and solid-liquid interface tensor decrease with increasing of temperature. The interface characteristics are the same as that obtained by two-phase model when interface is beyond near-wall region.
In the simulation of condensation with three-phase model, the changes of temperature and density distribution with time are obtained during the phase transition, and the dynamic formation process of the solid-liquid interface and gas-liquid interface are observed. At the stage of a liquid film layer formed on the solid surface, the fluid thermal conductivity is calculated by Fourier heat conduction law and the error between the gas thermal conductivity and the value calculated by REFPROP is 5%. In the initial stage of phase-change heat transfer, it plays an important role in strengthening the condensation heat transfer for the rough surface; after the surface is flooded by the condensed liquid film, the bigger thermal resistance is formed on the gas-liquid interface and the enhanced role of rough surface almost disappears.
Acknowledgements
This work was supported by the National Natural Science Foundation of China (50636050).
References Jose, A. and Andrij, T. (1999) ‘Computer simulation of
liquid/vapour interface in Lennard-Jones fluids: some questions and answers’, Journal of Chemical Physics, Vol. 111, No. 18, pp.8510–8523.
Lemmon, E.W., McLinden, M.O. and Huber, M.L. (2004) REFPROP: Reference Fluid Thermodynamic and Transport Properties, NIST Standard Reference Database, p.23.
Maruyama, S. and Kimura, T. (1999) ‘A study on thermal resistance over a solid-liquid interface by the molecular dynamics method’, Trermal Science & Engineering, Vol. 7, No. 1, pp.63–68.
138 P-F.Chen, L. Chen, Y-L. He and W-Q. Tao
Maruyama, S., Kimura, T. and Lu, M.C. (2002) ‘Molecular scale aspects of liquid contact on a solid surface’, Thermal Science & Engineering, Vol. 10, No. 6, pp.23–29.
Matsumoto, M. and Yasuoka, K. (1994) ‘Evaporation and condensation at a liquid surface. II. Methanol’, Journal of Chemical Physics, Vol. 101, No. 9, pp.7912–7917.
Meland, R. (2002) ‘Molecular exchange and its influence on the condensation coefficient’, Journal of Chemical Physics, Vol. 117, No. 15, pp.7254–7258.
Rapaport, D.C. (2004) The Art of Molecular Dynamics Simulation, Cambridge University Press, Cambridge.
Shi, B. (2006) Molecular Dynamics Simulation of the Surface Tension and Contact Angle of Argon and Water, University of California Los Angeles, California.
Tegeler, Ch., Span, R. and Wagner, W. (1999) ‘A new equation of state for argon covering the fluid region for temperatures from the melting line to 700 K at pressures up to 1000 MPa’, Journal of Physical and Chemical Reference Data, Vol. 28, No. 3, pp.779–850.
Trokhymchuk, A. and Alejandre, J. (1999) ‘Computer simulations of liquid/vapor interface in Lennard-Jones fluids: some questions and answers’, The Journal of Chemical Physics, Vol. 111, No. 18, pp.8510–8523.
Tsuruta, T., Tanaka, H. and Masuoka, T. (1999) ‘Condensation/ evaporation coefficient and velocity distributions at liquid-vapor interface’, International Journal of Heat and Mass Transfer, Vol. 42, No. 22, pp.4107–4116.
Wang, C.S., Chen, J.S., Shiomi, J. and Maruyama, S. (2007) ‘A study on the thermal resistance over solid-liquid-vapor interfaces in a finite-space by a molecular dynamics method’, International Journal of Thermal Sciences, Vol. 46, No. 12, pp.1203–1210.
Wang, F.G., Li, R.Y., Liu, Y.Q. and Yu, H.L. (2003) ‘Molecular dynamics simulation and study on some related topics of phase change heat transfer’, Journal of University of Shanghai for Science and Technology, Vol. 25, No. 2, pp.130–138.
Yi, P., Poulikakos, D., Walther, J., Walther, J. and Yadigaroglu, G. (2002) ‘Molecular dynamics simulation of vaporisation of an ultra-thin liquid argon layer on a surface’, International Journal of Heat and Mass Transfer, Vol. 45, No. 10, pp.2087–2100.