ORIGINAL RESEARCH ARTICLE published: 17 October 2014 doi: 10.3389/fpsyg.2014.01189 Perceptual learning in patients with macular degeneration Tina Plank 1† , Katharina Rosengarth 1† , Carolin Schmalhofer 1 , Markus Goldhacker 1 , Sabine Brandl-Rühle 2 and Mark W. Greenlee 1 * 1 Institute for Experimental Psychology, University of Regensburg, Regensburg, Germany 2 Department of Ophthalmology, University Medical Center Regensburg, Regensburg, Germany Edited by: Gianluca Campana, Università degli Studi di Padova, Italy Reviewed by: Angelika Lingnau, University ofTrento, Italy, Italy Michael B. Hoffmann, Otto-von-Guericke University, Germany *Correspondence: Mark W. Greenlee, Institute for Experimental Psychology, University of Regensburg, Universitaetsstrasse 31, Regensburg 93053, Germany e-mail: mark.greenlee@psychologie. uni-regensburg.de † Tina Plank and Katharina Rosengarth have contributed equally to this work. Patients with age-related macular degeneration (AMD) or hereditary macular dystrophies (JMD) rely on an efficient use of their peripheral visual field. We trained eight AMD and five JMD patients to perform a texture-discrimination task (TDT) at their preferred retinal locus (PRL) used for fixation. Six training sessions of approximately one hour duration were conducted over a period of approximately 3 weeks. Before, during and after training twelve patients and twelve age-matched controls (the data from two controls had to be discarded later) took part in three functional magnetic resonance imaging (fMRI) sessions to assess training-related changes in the BOLD response in early visual cortex. Patients benefited from the training measurements as indexed by significant decrease (p = 0.001) in the stimulus onset asynchrony (SOA) between the presentation of the texture target on background and the visual mask, and in a significant location specific effect of the PRL with respect to hit rate (p = 0.014).The following trends were observed: (i) improvement in Vernier acuity for an eccentric line-bisection task; (ii) positive correlation between the development of BOLD signals in early visual cortex and initial fixation stability (r = 0.531); (iii) positive correlation between the increase in task performance and initial fixation stability (r = 0.730). The first two trends were non-significant, whereas the third trend was significant at p = 0.014, Bonferroni corrected. Consequently, our exploratory study suggests that training on the TDT can enhance eccentric vision in patients with central vision loss.This enhancement is accompanied by a modest alteration in the BOLD response in early visual cortex. Keywords: perceptual learning, fMRI BOLD, cortical plasticity, visual cortex, macular degeneration INTRODUCTION Visual performance in a variety of tasks, for example in the detection or discrimination of certain stimulus patterns, has been shown to improve with training. The results of this perceptual learning appear to have long lasting effects (e.g., Gibson, 1963; Goldstone, 1998; Fahle and Poggio, 2002; Seitz and Watanabe, 2005; Sagi, 2011; Frank et al., 2014). At the same time it often takes only hours or days of practice to enhance perceptual abilities dramatically. This has been shown for texture discrimination (Karni and Sagi, 1991), orientation discrimi- nation (Schoups et al., 2001), spatial frequency discrimination (Fiorentini and Berardi, 1981; Sireteanu and Rettenbach, 1995), Vernier discrimination tasks (Poggio et al., 1992), and the dis- crimination of motion direction (Ball and Sekuler, 1982), among others. Perceptual learning thus appears to provide an ideal approach to be used in clinical settings as well, in the attempt to improve the abilities of visually impaired persons. Recent studies have focused on amblyopia, where perceptual learning proved to improve vision in the amblyopic eye (e.g., Polat et al., 2004; Zhou et al., 2006; Levi and Li, 2009; Astle et al., 2010, 2011; Levi, 2012; Chung et al., 2012; Hussain et al., 2012). Other applications include applying perceptual learning in myopia and presbyopia (Polat, 2009; Polat et al., 2012), in adults with impairments in stereopsis (Ding and Levi, 2011) and in children with visual impairment (Huurneman et al., 2013) and developmental dyslexia (Gori and Facoetti, 2014). In patients with central vision loss, Chung (2011) used rapid serial visual presentation (RSVP) in an oral sentence-reading task to improve patients’ reading ability, a paradigm that has already been shown to improve reading speed in the peripheral visual field in both younger (Chung et al., 2004; Yu et al., 2010b) and older (Yu et al., 2010a) normally sighted adults. In Chung’s (2011) study, RSVP reading speed improved on average by 53%. Central vision loss is often caused by atrophy of photore- ceptor cells in the macula, as can be observed in age-related macular degeneration (AMD) or hereditary retinal dystrophies (juvenile form, JMD) like Stargardt’s disease or cone-rod dys- trophy. Patients with central scotoma often develop eccentric viewing to cope with visual tasks like reading. The so-called “pre- ferred retinal locus” (PRL) is a location in the eccentric visual field that is habitually used by MD patients as a pseudo-fovea (Bäckman, 1979; Timberlake et al., 1987; Whittaker et al., 1988; Guez et al., 1993; Fletcher and Schuchard, 1997). In this study, we trained AMD/JMD patients to perform a TDT (Karni and Sagi, 1991) with the target located at or near the PRL, with the aim to improve patients’ visual abilities at this specific loca- tion in their visual field. To investigate possible transfer effects to other tasks or abilities, we used the Freiburg Visual Acuity and Contrast Test (FrACT; Bach, 1996) before and after train- ing. Possible effects on quality of life issues were assessed with www.frontiersin.org October 2014 | Volume 5 | Article 1189 | 1
Transcript
ORIGINAL RESEARCH ARTICLEpublished: 17 October 2014
doi: 10.3389/fpsyg.2014.01189
Perceptual learning in patients with macular degenerationTina Plank1†, Katharina Rosengarth1†, Carolin Schmalhofer1, Markus Goldhacker 1, Sabine Brandl-Rühle 2
and Mark W. Greenlee1*
1 Institute for Experimental Psychology, University of Regensburg, Regensburg, Germany2 Department of Ophthalmology, University Medical Center Regensburg, Regensburg, Germany
Edited by:
Gianluca Campana, Università degliStudi di Padova, Italy
Reviewed by:
Angelika Lingnau, University of Trento,Italy, ItalyMichael B. Hoffmann,Otto-von-Guericke University,Germany
*Correspondence:
Mark W. Greenlee, Institute forExperimental Psychology, Universityof Regensburg, Universitaetsstrasse31, Regensburg 93053, Germanye-mail: [email protected]†Tina Plank and Katharina Rosengarthhave contributed equally to this work.
Patients with age-related macular degeneration (AMD) or hereditary macular dystrophies(JMD) rely on an efficient use of their peripheral visual field. We trained eight AMD andfive JMD patients to perform a texture-discrimination task (TDT) at their preferred retinallocus (PRL) used for fixation. Six training sessions of approximately one hour durationwere conducted over a period of approximately 3 weeks. Before, during and after trainingtwelve patients and twelve age-matched controls (the data from two controls had to bediscarded later) took part in three functional magnetic resonance imaging (fMRI) sessionsto assess training-related changes in the BOLD response in early visual cortex. Patientsbenefited from the training measurements as indexed by significant decrease (p = 0.001)in the stimulus onset asynchrony (SOA) between the presentation of the texture targeton background and the visual mask, and in a significant location specific effect of the PRLwith respect to hit rate (p = 0.014). The following trends were observed: (i) improvementin Vernier acuity for an eccentric line-bisection task; (ii) positive correlation between thedevelopment of BOLD signals in early visual cortex and initial fixation stability (r = 0.531);(iii) positive correlation between the increase in task performance and initial fixationstability (r = 0.730). The first two trends were non-significant, whereas the third trendwas significant at p = 0.014, Bonferroni corrected. Consequently, our exploratory studysuggests that training on the TDT can enhance eccentric vision in patients with centralvision loss.This enhancement is accompanied by a modest alteration in the BOLD responsein early visual cortex.
INTRODUCTIONVisual performance in a variety of tasks, for example inthe detection or discrimination of certain stimulus patterns,has been shown to improve with training. The results ofthis perceptual learning appear to have long lasting effects(e.g., Gibson, 1963; Goldstone, 1998; Fahle and Poggio, 2002;Seitz and Watanabe, 2005; Sagi, 2011; Frank et al., 2014). At thesame time it often takes only hours or days of practice to enhanceperceptual abilities dramatically. This has been shown for texturediscrimination (Karni and Sagi, 1991), orientation discrimi-nation (Schoups et al., 2001), spatial frequency discrimination(Fiorentini and Berardi, 1981; Sireteanu and Rettenbach, 1995),Vernier discrimination tasks (Poggio et al., 1992), and the dis-crimination of motion direction (Ball and Sekuler, 1982), amongothers.
Perceptual learning thus appears to provide an ideal approachto be used in clinical settings as well, in the attempt to improve theabilities of visually impaired persons. Recent studies have focusedon amblyopia, where perceptual learning proved to improve visionin the amblyopic eye (e.g., Polat et al., 2004; Zhou et al., 2006; Leviand Li, 2009; Astle et al., 2010, 2011; Levi, 2012; Chung et al.,2012; Hussain et al., 2012). Other applications include applyingperceptual learning in myopia and presbyopia (Polat, 2009; Polatet al., 2012), in adults with impairments in stereopsis (Ding andLevi, 2011) and in children with visual impairment (Huurneman
et al., 2013) and developmental dyslexia (Gori and Facoetti, 2014).In patients with central vision loss, Chung (2011) used rapid serialvisual presentation (RSVP) in an oral sentence-reading task toimprove patients’ reading ability, a paradigm that has already beenshown to improve reading speed in the peripheral visual field inboth younger (Chung et al., 2004; Yu et al., 2010b) and older (Yuet al., 2010a) normally sighted adults. In Chung’s (2011) study,RSVP reading speed improved on average by 53%.
Central vision loss is often caused by atrophy of photore-ceptor cells in the macula, as can be observed in age-relatedmacular degeneration (AMD) or hereditary retinal dystrophies(juvenile form, JMD) like Stargardt’s disease or cone-rod dys-trophy. Patients with central scotoma often develop eccentricviewing to cope with visual tasks like reading. The so-called “pre-ferred retinal locus” (PRL) is a location in the eccentric visualfield that is habitually used by MD patients as a pseudo-fovea(Bäckman, 1979; Timberlake et al., 1987; Whittaker et al., 1988;Guez et al., 1993; Fletcher and Schuchard, 1997). In this study,we trained AMD/JMD patients to perform a TDT (Karni andSagi, 1991) with the target located at or near the PRL, withthe aim to improve patients’ visual abilities at this specific loca-tion in their visual field. To investigate possible transfer effectsto other tasks or abilities, we used the Freiburg Visual Acuityand Contrast Test (FrACT; Bach, 1996) before and after train-ing. Possible effects on quality of life issues were assessed with
Plank et al. Perceptual learning in macular degeneration
the Visual Function Questionnaire VFQ-25 (Mangione et al.,2001).
We were also interested in the neural correlates of trainingusing functional magnetic resonance imaging (fMRI). The neu-ral correlates of perceptual learning are still not well understood.Results so far indicate an increase of the BOLD signal in pri-mary visual cortex (Schwartz et al., 2002) with the training of aTDT. But it was also shown with fMRI that with repeated train-ing learning is accompanied by an initial increase followed bya decrease in response (Yotsumoto et al., 2008). We observed asimilar development in a recent study on the effect of trial-by-trial feedback on a challenging coherent-motion discriminationtask (Goldhacker et al., 2014). In the initial phase of trainingwe observed an increase in the fMRI-BOLD signal in primaryvisual cortex. With repeated training the BOLD signal in earlyvisual cortex decreases. At the same time the performance of par-ticipants increases further or remains constant at a high level.We interpret this development in the BOLD signal over sev-eral measurements and days as an indication for neuroplasticchanges in visual cortex as a consequence of intensive train-ing. In the initial training phase, additional neural resources arerecruited to learn the new perceptual task. After the task hasbeen well practiced, neural processing becomes more automaticwith equivalent high performance, thus less neural resources areneeded. As suggested by Yotsumoto et al. (2008), the increaseof brain activation in early visual cortex in the initial phaseof learning could be mediated by an increase in the numberor strength of synaptic connections, while the drop in activa-tion at a later stage could be explained by synaptic downscalingafter performance becomes saturated. This pattern is also in linewith reports of participants, suggesting that they only guess atthe beginning of training, while later they claim to “see” thedifferences in the stimuli clearly and almost without any effort(Goldhacker et al., 2014). Further studies show that perceptuallearning can even lead to a parallelization of a visual conjunctionsearch task which can only be solved in a serial manner initially(Frank et al., 2014).
In this study we explored the effects of perceptual learningin patients with central visual field loss. We investigate whetherrepeated intensive training can improve performance on the TDT,while altering the response of neurons in early visual cortexresponsible for the processing of peripheral information. To testfor the visual-field specificity of training, during fMRI we testedpatients for targets located at their PRL or at a location oppositeof the PRL (OppPRL). Comparison with an age-matched controlgroup should indicate the extent to which this form of learning isspecific for persons with central vision loss.
MATERIALS AND METHODSPATIENTS AND CONTROL SUBJECTSEight patients with diagnosed AMD and five patients with juvenilemacular dystrophy (JMD; i.e., three patients with cone-rod dystro-phy and two patients with Stargardt’s disease) participated in thestudy (8 males, 5 females; mean age 63.8 years, range 47–79 years).Additionally twelve healthy age-matched control subjects took partin the experiment (4 males, 8 females; mean age 62.1 years, range47–78 years). All participants signed an informed consent form
prior to participating in the study and received modest monetarycompensation for their participation. The study was approved bythe Ethics Committee of the University of Regensburg and con-ducted in accordance with the ethical guidelines of the Declarationof Helsinki.
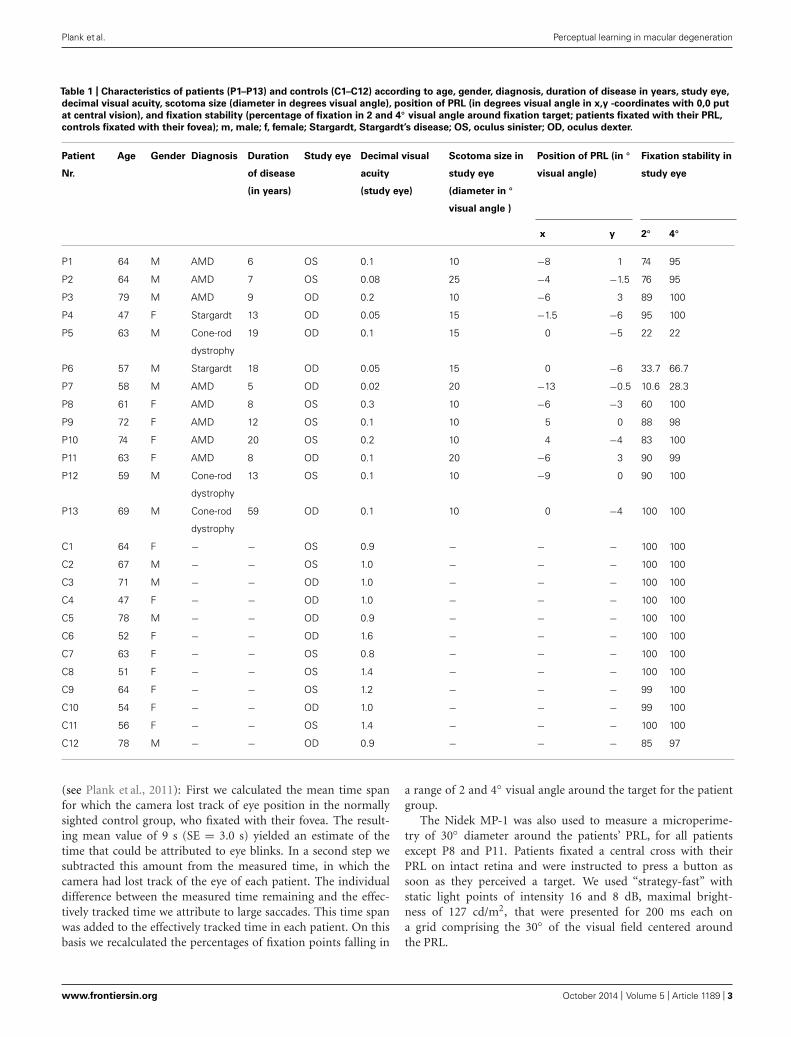
CLINICAL CHARACTERISTICS AND VISUAL FIELD MEASUREMENTSTable 1 presents details on demographic characteristics of patientsand controls, including the gender, age, diagnosis, duration of dis-ease at time of study, study eye, scotoma size, visual acuity, positionof PRL, and fixation stability in the study eye. The dominant eyewas chosen as the study eye. Eye dominance was determined bya modified version of the A-B-C Vision Test (Miles, 1930; Poracand Coren, 1976), by aiming a distant target through an openingformed by their hands. The study eye of the controls was always theeye corresponding to the study eye of their age-matched patient.Since some of our measures were conducted in the Eye Hospital,fixation stability, and visual acuity could only be determined at thestart of the study.
Best-corrected visual acuity was determined by using a VisionScreener (Rodenstock Rodavist 524/S1) and Eye Charts for dis-tant visual acuity (Oculus Nr. 4616). Scotoma size was measuredusing kinetic Goldmann perimetry with the isopters III/4e, I/4e,I/3e, I/2e, and I/1e in all patients except patients P8, P10,and P11. Defined as edges of the scotomata, those points weremarked, where isopter III/4e were no longer detected. Scotomasize is reported in Table 1 as scotoma diameter in degrees ofvisual angle as an average and approximation of rounded verticaland horizontal dimensions. Reliability of the Goldmann peri-metric measures depends on fixation stability. For patients P8,P10, and P11 no Goldmann perimetry was available. Scotomasize was inferred from fundus photography (autofluorescenceimaging as described in Rosengarth et al., 2013) instead. Con-trols did not undergo Goldmann perimetry. Figure 1 depictsthe shape of each patient’s scotoma in the respective study eyeas inferred from fundus photography. The techniques differ inprinciple as Goldmann perimetry provides direct visual fieldmeasures based on measures of visual function while fundus pho-tography provides indirect evidence based on changes to fundusmorphology.
As described in Rosengarth et al. (2013), we used a Nidek MP-1microperimeter (Nidek Co, Japan) to measure fixation stability.Patients were requested to fixate (eccentrically) a red cross of 4◦visual angle in diameter for approximately 30 s, whereas controlsfixated the target with their fovea. The technique measures 25samples per second, resulting in 750 fixation samples over 30 s.During the measurement the camera sometimes lost track of thesubject’s eye. This can be due to eye blinks or fixation instabil-ity in the form of large saccades. The Nidek software recordsthe time period that was measured and the proportion of thetime span that was effectively tracked, as well as the percentagesof fixation points that fell in a range of 2 or 4◦ diameter visualangle around the center of the fixation target, based on the timespans effectively tracked. Thus fixation stability can be overesti-mated by long or frequent time spans where the camera had losttrack of eye position due to large saccades. To compensate forthis we corrected the given fixation stability in the following way
Frontiers in Psychology | Perception Science October 2014 | Volume 5 | Article 1189 | 2
Plank et al. Perceptual learning in macular degeneration
Table 1 | Characteristics of patients (P1–P13) and controls (C1–C12) according to age, gender, diagnosis, duration of disease in years, study eye,
decimal visual acuity, scotoma size (diameter in degrees visual angle), position of PRL (in degrees visual angle in x,y -coordinates with 0,0 put
at central vision), and fixation stability (percentage of fixation in 2 and 4◦ visual angle around fixation target; patients fixated with their PRL,
controls fixated with their fovea); m, male; f, female; Stargardt, Stargardt’s disease; OS, oculus sinister; OD, oculus dexter.
Patient
Nr.
Age Gender Diagnosis Duration
of disease
(in years)
Study eye Decimal visual
acuity
(study eye)
Scotoma size in
study eye
(diameter in ◦
visual angle )
Position of PRL (in ◦
visual angle)
Fixation stability in
study eye
x y 2◦ 4◦
P1 64 M AMD 6 OS 0.1 10 −8 1 74 95
P2 64 M AMD 7 OS 0.08 25 −4 −1.5 76 95
P3 79 M AMD 9 OD 0.2 10 −6 3 89 100
P4 47 F Stargardt 13 OD 0.05 15 −1.5 −6 95 100
P5 63 M Cone-rod
dystrophy
19 OD 0.1 15 0 −5 22 22
P6 57 M Stargardt 18 OD 0.05 15 0 −6 33.7 66.7
P7 58 M AMD 5 OD 0.02 20 −13 −0.5 10.6 28.3
P8 61 F AMD 8 OS 0.3 10 −6 −3 60 100
P9 72 F AMD 12 OS 0.1 10 5 0 88 98
P10 74 F AMD 20 OS 0.2 10 4 −4 83 100
P11 63 F AMD 8 OD 0.1 20 −6 3 90 99
P12 59 M Cone-rod
dystrophy
13 OS 0.1 10 −9 0 90 100
P13 69 M Cone-rod
dystrophy
59 OD 0.1 10 0 −4 100 100
C1 64 F − − OS 0.9 − − − 100 100
C2 67 M − − OS 1.0 − − − 100 100
C3 71 M − − OD 1.0 − − − 100 100
C4 47 F − − OD 1.0 − − − 100 100
C5 78 M − − OD 0.9 − − − 100 100
C6 52 F − − OD 1.6 − − − 100 100
C7 63 F − − OS 0.8 − − − 100 100
C8 51 F − − OS 1.4 − − − 100 100
C9 64 F − − OS 1.2 − − − 99 100
C10 54 F − − OD 1.0 − − − 99 100
C11 56 F − − OS 1.4 − − − 100 100
C12 78 M − − OD 0.9 − − − 85 97
(see Plank et al., 2011): First we calculated the mean time spanfor which the camera lost track of eye position in the normallysighted control group, who fixated with their fovea. The result-ing mean value of 9 s (SE = 3.0 s) yielded an estimate of thetime that could be attributed to eye blinks. In a second step wesubtracted this amount from the measured time, in which thecamera had lost track of the eye of each patient. The individualdifference between the measured time remaining and the effec-tively tracked time we attribute to large saccades. This time spanwas added to the effectively tracked time in each patient. On thisbasis we recalculated the percentages of fixation points falling in
a range of 2 and 4◦ visual angle around the target for the patientgroup.
The Nidek MP-1 was also used to measure a microperime-try of 30◦ diameter around the patients’ PRL, for all patientsexcept P8 and P11. Patients fixated a central cross with theirPRL on intact retina and were instructed to press a button assoon as they perceived a target. We used “strategy-fast” withstatic light points of intensity 16 and 8 dB, maximal bright-ness of 127 cd/m2, that were presented for 200 ms each ona grid comprising the 30◦ of the visual field centered aroundthe PRL.
Plank et al. Perceptual learning in macular degeneration
FIGURE 1 | Continued
Schematic depiction of positions of PRLs for all patients (upper left;
blue triangles mark the left eye as study eye, blue diamonds mark the
right eye as study eye, labeled with patient numbers 1–13) and
schematic depictions of the shape of each patient’s scotoma as
inferred from fundus photography (autofluorescence (P2, P3, P4, P5, P6,
P8, P10, P11, P12, P13) or infrared reflection imaging (P1, P7, P9; blue
symbols code the trained PRL position, red symbols code the
untrained OppPRL position). The x- and y-axis of the plots give theeccentricity in degrees of visual angle.
The positions of PRLs were also assessed via the Nidek fundusimages. They were later verified using a video eyetracker (HighSpeed Video Eyetracker Toolbox, Cambridge Research Systems,UK), while the patients fixated a target on a computer monitor.The distribution of positions of patients’ PRLs in the visual fieldis given in Figure 1.
STIMULI AND TASKPatients and controls were trained in a modified version of theTDT described by Karni and Sagi (1991). During training subjectswere positioned with a distance of 60 cm in front of a 19-inchscreen with a refresh rate of 75 Hz, while the luminance for blackwas 0.93 cd/m2 and for white 106 cd/m2. We used Matlab (ver-sion 7.12.0) and the Psychophysics Toolbox (Brainard, 1997) forprogramming the stimuli and the experimental design. Subjectswere instructed to fixate with their individual PRL while controlshad to hold their fixation in the center of the screen. To supportpatients’ fixation a white dot (0.75◦) was placed at their individualPRL position. Controls fixated at a white circle (0.5◦ visual angle)at the center of the screen. During a trial, participants had todiscriminate the global orientation (horizontal/vertical) of threetilted lines, located in their PRL, against a uniform background ofhorizontal lines (see Figure 2).
Stimulus size was increased in comparison to the originalparadigm (Karni and Sagi, 1991), with a line length of 2◦ andline width of 0.3◦ visual angle. We did not scale the target ele-ments nor the distractors in the background for different eccentriclocations, since stimulus displays had to fit into a 30-degree diam-eter display. Target position was individually adjusted accordingto each patient’s PRL position. Each control subject was assignedto one particular patient and adopted that patient’s PRL positionas target position in the task. On each trial, the target stimulus
was shown for 13.3 ms, followed by a blank screen with variablestimulus onset asynchrony (SOA) and a mask stimulus (106.4 msduration), after which the participants responded with a but-ton press (two buttons on a standard keyboard; see Figure 2).In each block the SOA was adjusted by using an adaptive pro-cedure (two–down, one-up), starting with a SOA of 492.1 ms,to determine the 70.7% correct threshold (Levitt, 1971). Initialstep size was 53.2 ms, which was decreased by 13.3 ms (i.e., theduration of one frame on the display) after each turning point. Ablock stopped after 32 trials and the last measured SOA was takenas the 70.7% threshold of this block. In a pre-training sessionthe initial individual SOA threshold was determined by runningfive experimental blocks. This initial SOA threshold was thenused in all fMRI sessions. All patients and controls performedsix training sessions on separate days over a period of approxi-mately 3–4 weeks. Each session consisted of 20 blocks, each with32 trials. One block took about 2 min, depending on individualSOA and reaction times, and each session lasted approximately45 min.
EYETRACKING DURING PSYCHOPHYSICAL MEASUREMENTSA trial only could be evoked if fixation was stable, which wasassured by an eye tracking system (resolution 0.05◦, 250 Hz, High-Speed Video Eye-Tracker Toolbox, Cambridge Research Systems,Rochester, UK), thus the onset of trials could be delayed in caseof unstable fixation. Calibration was done by controls with theirfovea and by patients with their PRLs, resulting in a constant shiftwith respect to the position of the fovea. This constant shift, incoordinates of the individual PRL, was added as a correction factorto the tracked position of the eye.
STIMULI AND TASK DURING fMRIDuring the fMRI sessions, visual stimuli were projected onto acircular screen (31◦ visual angle in diameter at a distance of60 cm) placed behind the head of the participant at the endof the scanner bore and visible via a mirror placed within theMRI head coil. Subjects underwent an fMRI session before train-ing, after three training sessions and again after another threetraining sessions. The stimuli as described above appeared in adistance of 60 cm on the screen (luminance of the dark back-ground was 1.7 cd/ m2, luminance of the white line elementswas 193 cd/m2). The fMRI sessions differed somewhat from the
FIGURE 2 | Schematic depiction of a single trial in the training
sessions. While subjects were successfully fixating with their PRL(white dot) the target stimulus appeared for 13.3 ms followed by amask, which was shown for 106.4 ms. The time between stimulus
and mask (SOA) was adjusted to provide a constant hit rate of70.7%. At the end of each trial subjects had to indicate by buttonpress whether the three lines of the target formed a horizontal orvertical array.
Plank et al. Perceptual learning in macular degeneration
training sessions, since the target stimulus was presented ran-domly in half of the trials in the PRL position and in half ofthe trials in the opposite hemifield (OppPRL), leading to slightlylower performance (see below). This was indicated by a briefcolor change of the white fixation dot before appearance of thetarget stimulus. In most subjects the fixation dot at the targetlocation turned to red at the PRL or blue to indicate that the tar-get would appear at the OppPRL. In some patients the color ofthe dot only changed when the target was to appear in the Opp-PRL because those patients had problems in differentiating thecolors red and blue. This color cueing was kept constant for thematched control subjects. As in the training session patients fix-ated with their PRL, while control subjects kept fixation in thecenter of the screen. No eyetracker was used during fMRI, butfixation stability could be estimated from psychophysical test ses-sions. The SOA achieved before training sessions served as fixedSOA for all three fMRI sessions. At the beginning of a trial thedot changed its colour for 505.4 ms, followed by the target for13.3 ms. After an individual SOA the mask was presented for106.4 ms. Then a fixation pause with temporal jitter of 3–4 ssucceeded before a new trial started. Each block consisted of 100trials (50 PRL, 50 OppPRL), lasting for, on average, 8 min, againdepending on individual SOA and reaction times. Three blockswere conducted in one fMRI session. The participants viewed alltest stimuli in all training and testing situations monocularly withtheir study eye.
FREIBURG VISUAL ACUITY AND CONTRAST TESTBefore and after training subjects’ visual acuities and contrast sen-sitivity at the trained position in the visual field were assessedby applying the FrACT1 (Bach, 1996) to monitor for possi-ble improvements induced by training. Thereby the Landolt Ccontrast sensitivity test with 100 and 50 arcmin diameter, the con-trast grating test and the Vernier test were chosen. Luminancelinearization was applied as implemented in the software.
VISUAL FUNCTION QUESTIONNAIRETo assess the patients’ own perception of their visual func-tion before and after perceptual learning we used the NationalEye Institute’s VFQ-25 (Mangione et al., 2001) in its Germantranslation.
BEHAVIORAL DATA ANALYSISAccording to stimulus onset asynchronies obtained in the train-ing sessions a 2 × 6 ANOVA for the factors group (patients,controls) and session (training session 1–6) was performed. Totest explicitly for group differences in SOAs between trainingsessions 1 and 6, we applied two t-tests. For the fMRI ses-sions we conducted 2 × 2 × 3 ANOVAs related to the factorsgroup (patients, controls), location (PRL, Opposite PRL) andsession (before, during and after training) with respect to thedependent variables hit rate and reaction time. Additionally, weperformed two 2 × 3 ANOVAs with the factors location (PRL,OppPRL) and session (before, during and after training), sep-arately for each group, with respect to the dependent variables
1http://www.michaelbach.de/fract/download.html
hit rate and reaction time. To test explicitly for group differ-ences in hit rates between fMRI session 1 (before training) and3 (after training), at the PRL and OppPRL, we applied fourt-tests.
Additionally we performed correlation analysis between initialfixation stability, assessed before training started, and the develop-ment of hit rate and BOLD percent signal change in the PRL andOppPRL associated area in the early visual cortex.
For all ANOVAs, we corrected for violation of sphericityassumption if necessary by using Greenhouse–Geisser correction(p < 0.05). All statistical tests were performed using PASW 21 forWindows.
One patient (P13) was not able to participate in the fMRI ses-sions for physical reasons. We only included his behavioral valuesfor the group analysis of the SOA measurement (see below). Intotal, data from 13 patients and 12 control subjects entered theSOA analysis of the behavioral data acquired during the trainingsessions. During the fMRI sessions, hit rate and reaction time wererecorded in 11 patients and 10 control subjects. Behavioral datafrom one patient (P12) and two control subjects (C4 and C12)were lost due to technical problems with the response box.
According to the subtest of the FrACT and the VFQ a possibleimpact of training was assessed by paired t-tests (before and aftertraining). Data from the FrACT were acquired in 13 patients and 12control subjects. Data from one patient (P7) was excluded from theanalysis of Landolt C contrast sensitivity, because he was not ableto do the test. The data from another patient (P2) was excludedfrom the analysis of the Vernier test, owing to his inability toexecute the Vernier test before training. Data from all 13 patientswere available for the VFQ analysis.
STRUCTURAL AND FUNCTIONAL MRI MEASUREMENTSMagnetic resonance imaging scanning was performed with a 3-Tesla Allegra head scanner (Siemens, Erlangen, Germany) anda one-channel head coil. Functional whole-brain images wereacquired interleaved with a T2∗-weighted gradient echo planarimaging (EPI) sequence (time-to-repeat, TR = 2 s; time-to-echo,TE = 30 ms; flip angle, FA = 90◦) consisting of 34 trans-verse slices (voxel-size = 3 mm × 3 mm × 3 mm; field ofview, FOV = 192 mm × 192 mm). In addition, we collected ahigh-resolution structural scan (160 sagittal slices each) with aT1-weighted, magnetization prepared rapid gradient echo (MP-RAGE) sequence (TR = 2.25 s, TE = 2.6 ms, FA = 9◦, voxelsize = 1 mm × 1 mm × 1 mm, FOV = 240 mm × 256 mm).The sequence was optimized for the differentiation of gray andwhite matter by using parameters from the Alzheimer’s diseaseNeuroimaging Initiative project2.
MRI DATA ANALYSISMagnetic resonance imaging data analysis was performed with Sta-tistical Parametric Mapping 8 (Wellcome Center of Neuroimaging,London3). First a temporal interpolation of the functional datausing the slice time function in SPM8 was conducted. After-ward a motion correction over all sessions was applied to the
Plank et al. Perceptual learning in macular degeneration
functional images followed by co-registering each participant’sstructural brain scan of the first session (before training) to thefunctional images. Then images were normalized to the MNIspace, re-sampled to a 2 mm × 2 mm × 2 mm resolution andsmoothed with a three-dimensional Gaussian kernel (full-widthat half-maximum = 8 mm).
In the first-level statistical design the possible positions of thePRL and the OppPRL as prediction variable for each session weremodeled separately and then convolved with the hemodynamicresponse function.
For a region-of-interest (ROI) analysis the SPM toolbox Mars-bar was applied (Brett et al., 2002). A functional localizer wasused to assess the individual representation area of the PRL,the OppPRL, and the fovea in the early visual cortex of thepatients. Accordingly, during a separate fMRI scan contrastreverting checkerboard disks (size: 9◦ × 9◦ visual angle, pre-sented with a reversal rate of 8 Hz) and chromatic images ofeveryday objects (e.g., animals, tools, vehicles, musical instru-ments; 7.3◦ × 7.3◦ visual angle) were visually presented onthe individually determined position of the PRL, a locationof the same eccentricity OppPRL and the fovea (correspond-ing to the scotoma region in the patients). For the controlsubjects the PRL/OppPRL coordinates of their age-matchedpatient were used. The PRL localizer scans were also conductedmonocularly with the same study eye. The photographs usedin the PRL localizer paradigm were collected from free Inter-net databases or taken by the authors. Stimuli were presentedblockwise on a gray background, together with a baseline con-dition (gray background of medium luminance). The blockswere presented in four repetitions. Contrast reverting checker-boards and meaningful pictures were presented in the center,the PRL or the opposite PRL in separate blocks of 13 s each,the baseline condition (blank screen) in blocks of 18 s. In ablock with meaningful pictures, the picture changed every 2.2 swithout a gap, so that six different pictures were presentedsequentially in each object block (for a detailed description seeRosengarth et al., 2013).
In a GLM analysis we modeled six regressors for the two typesof stimuli (checkerboards, everyday objects) and the three loca-tions (fovea, PRL, OppPRL) while the baseline condition (blankscreen) served as an implicit baseline for the analysis to avoid anoverspecification of the statistical design. Individually weightedT-maps for contrasts PRL > OppPRL and OppPRL > PRL werecalculated. A sphere of 5-mm radius was placed on the voxel withthe highest t-value of the resulting cluster in striate and extras-triate visual cortex. ROIs were always located in the hemispherecontralateral to the PRL/OppPRL location in the visual field. Sinceno explicit retinotopic mapping of visual area borders was con-ducted, we cannot separate these activations into the respectivevisual areas. These spheres served as ROIs for calculation of theindividual percent signal changes in projection zones for the PRLand OppPRL in the visual cortex by applying these ROIs for theindividual GLMs applied to the data of the main experiment.
The individual percent signal changes were integrated in a2 × 2 × 3 factorial ANOVA with the factors group (patients, con-trols), location (PRL, OppPRL) and sessions (before, during, aftertraining).
We also tested for the existence of a linear or quadratic trend inthe factor session, with one-factorial ANOVAs, separately for eachlocation (PRL, OppPRL) and group (patients, controls).
Because of technical issues two control subjects (C4 and C12)had to be excluded from the analysis of the fMRI data resulting in12 patients and 10 controls for that analysis.
We also correlated patients’ fixation stability with the devel-opment of percent signal change of the BOLD response with thetraining.
RESULTSBEHAVIORAL DATAIn agreement with the original results of Karni and Sagi (1991),during training patients and controls showed a training-inducedimprovement in performance, as reflected in a significantlydecreasing SOA over the six training sessions [F(1,23) = 14.47;p = 0.001; see Figure 3). No significant effect of group wasobserved, suggesting that both patients and controls learnedthe task equally well. Although not significant, there was atrend toward an interaction between the factors group and ses-sion [F(1,23) = 3.5; p = 0.074]. This trend in the resultsappears to be due to the fact that patients started gener-ally with higher SOAs, which were followed by a steeperdecrease of SOAs over training compared to control sub-jects. Differences in SOAs in training session 1 between thepatient and control group just failed to reach significance[t(23) = 2.2; p = 0.08, Bonferroni corrected for multi-ple comparisons]. SOAs in training session 6 were indistin-guishable between patient and control group [t(23) = 0.46;p = 1.00].
During the fMRI sessions there was a significant effect of ses-sion [F(1,19) = 13.6; p = 0.002] for the dependent variable hitrate, but there was no effect of location nor group in the omnibusANOVA (Figure 4, upper panel). Additionally hit rates exhibiteda significant interaction between target location (PRL, OppPRL)and group [F(1,19) = 4.6; p = 0.045]. As can be seen in Figure 4,and was also tested by additional ANOVAs separately for patientsand controls, there was a significant effect of target location (PRL,
FIGURE 3 | Mean of stimulus onset asynchrony (SOA in ms) over six
training sessions. The SOA decreases significantly (p = 0.001) from thefirst to the last training session in both patient (n = 13) and control (n = 12)groups. Error bars show ±1 SE of the mean.
Plank et al. Perceptual learning in macular degeneration
FIGURE 4 | Mean hit rates (A) and reaction times (B) in the PRL
(trained location, blue symbols) and the OppPRL (untrained location,
red symbols) for the patient (n = 11, left panel) and the control
groups (n = 10, right panel) before the first, fourth and after the
sixth training session. Error bars show ±1 SE of the mean. Data werecollected during the fMRI sessions, with individually fixed SOA. Anomnibus ANOVA revealed a significant effect of session [F (1,19) = 13.6;
p = 0.002] for the dependent variable hit rate, but no main effect oftarget location nor group. Additionally hit rates exhibited a significantinteraction between target location (PRL, OppPRL) and group[F (1,19) = 4.6; p = 0.045]. For reaction times an omnibus ANOVArevealed again a main effect of session [F (2,38) = 6.6; p = 0.003], butno main effect for location nor group. Also no significant interactionswere apparent.
OppPRL) in the patient group [F(1,10) = 8.78; p = 0.014]. Accord-ingly, the hit rate was significantly higher when the TDT target waslocated in or near the PRL compared to when it was located in theopposite visual hemifield. The control group showed no significantlocation effect. Both groups, patients [F(2,20) = 9.5; p = 0.001]and controls [F(1,9) = 5.7; p = 0.04], showed a significant sessioneffect, but no significant interactions.
For reaction times during the fMRI sessions we observed againa main effect of session [F(2,38) = 6.6; p = 0.003], indicating adecrease of reaction times with training, but no effect for location
nor group (see Figure 4, lower panel). No significant interactionswere apparent.
TRANSFER OF TDT TRAININGThe results of the FrACT, analyzed with paired t-tests, showeda trend toward improvement of the Vernier task [t(11) = 2.22;p = 0.048, not corrected for multiple comparisons; otherwisep = 0.2, Bonferroni corrected] in the patient group (see Figure 5).Here it has to be noted that an additional patient (P2) was not ableto perform the task before the perceptual training, but achieved a
Frontiers in Psychology | Perception Science October 2014 | Volume 5 | Article 1189 | 8
Plank et al. Perceptual learning in macular degeneration
FIGURE 5 | Results from the FrACT (Bach, 1996). Two Landolt-C tests (with50 and 100 arcmin optotypes, in % Michelson contrast), a grating contrasttest and a Vernier test were conducted. Improvements in patients’performance with training were only apparent in the Vernier task [t (11) = 2.22;p = 0.048, not corrected for multiple comparisons; p = 0.2 Bonferroni
corrected]. One patient (P2) was not able to perform the task before theperceptual training, but achieved a threshold of 5.58 arcmin in the task afterthe perceptual training. One patient (P7) was not able to perform theLandolt-C contrast sensitivity test, neither before nor after TDT training. Errorbars show ±1 SE of the mean.
Table 2 | Correlation coefficients (r ) and p-values (p; not corrected for
multiple comparisons) between initial fixation stability (percentage of
fixations within 2◦ of fixation target) and difference in mean percent
signal change (upper rows) before the first and fourth training
session, as well as before the first and after the sixth training session
for PRL and OppPRL target locations.
Delta % signal
change
Difference
“during–before”
Difference
“after–before”
r p r p
PRL 0.155 0.629 0.531 0.075
OppPRL 0.042 0.896 0.444 0.148
Delta Hit rate
PRL 0.730 0.007 0.361 0.275
OppPRL −0.145 0.652 0.015 0.966
Significant values are shown in bold font. These values are based on patient dataonly (n = 12).
threshold of 5.58 arcmin in the task after the perceptual training.Contrast sensitivity measures did not differ before and after train-ing, neither for Landolt-C with 100 arcmin diameter [t(11) = 0.05;p = 0.96] nor with 50 arcmin diameter [t(11) = −0.5; p = 0.62],nor for the contrast grating test [t(12) = 0.85; p = 0.41, all p-values not corrected for multiple comparisons]. One patient (P7)was not able to perform the Landolt-C contrast sensitivity test,neither before nor after TDT training. The control group did notimprove significantly with training in any subtests of the FrACT.
Compared to values acquired before TDT training, patientsyielded higher scores in the VFQ in the category of social func-tioning [t(12) = 2.79; p = 0.016, not corrected for multiplecomparisons; otherwise p = 0.18, Bonferroni corrected] aftertraining. All other scales showed no significant differences beforeand after training.
EFFECT OF FIXATION STABILITY IN BEHAVIORAL DATAWhen we correlated fixation stability before training (percentageof fixations around 2◦ visual angle of the fixation point) and the
development of hit rate in the patient group, separately for thetrained PRL and the untrained OppPRL, we found a significantpositive correlation with difference in hit rate between before andduring training, but only for the trained PRL (p = 0.007, notcorrected for multiple comparisons; otherwise p = 0.014, Bon-ferroni corrected; see Table 2; Figure 6). A correlation betweenfixation stability and development of reaction times in the patientgroup, separately for PRL and OppPRL, revealed no significantresults.
fMRI DATAPatients exhibited a trend for increased percent signal changesfrom the second to the third fMRI session which was similar for thePRL and OppPRL projection zones in the early visual cortex, butwhich failed to reach statistical significance (see Figure 7, upperpanel). While patients showed no obvious change in percent signalchange from the first to the second fMRI session control subjectsrevealed an increase of percent signal change from the first to thesecond fMRI session in both the trained and untrained projectionzones in the early visual cortex. From the second to the thirdfMRI session, patients exhibited a modest increase in BOLD signal,whereas controls showed a decrease for the signal in the trainedPRL associated area and a stabilization of the OppPRL associatedarea.
A repeated-measures ANOVA revealed no significant effectof session [F(2,40) = 1.7; p = 0.20], nor an effect of location[F(1,20) = 0.02; p = 0.89] or group [F(1,20) = 2.09; p = 0.16]in the omnibus ANOVA. Also no interactions were significant.One-factorial ANOVAs for the factor session for the patients andcontrols separately with target locations either PRL or OppPRLindicated a marginally significant quadratic trend (blue line inFigure 7, upper right panel) for the control group [F(1,9) = 5.05;p = 0.05, not corrected for multiple comparisons; otherwisep = 0.1, Bonferroni corrected]. Moreover, a non-significant lineartrend (blue line in Figure 7, upper left panel) was apparent forthe patient group [F(1,11) = 3.04; p = 0.11, not corrected formultiple comparisons; otherwise p = 0.22, Bonferroni corrected]with respect to the effect of training (sessions performed before,
Plank et al. Perceptual learning in macular degeneration
FIGURE 6 | Correlations between the difference in hit rate (before the
first and fourth training session (“during”), left panel, as well as before
the first and after the sixth training session (“after”), right panel, and
initial fixation stability for the trained PRL location (A) or the untrained
OppPRL location (B) for patient data only. Squares correspond to valuesfrom JMD patients, diamonds to those from AMD patients. Correlation
coefficients for the trained PRL location are r = 0.730 (p = 0.007; p = 0.014,Bonferroni corrected) for the difference in hit rate “during–before,” andr = 0.361 (p = 0.275) for the difference in hit rate “after–before.” For theuntrained OppPRL location correlation coefficients are r = −0.145 (p = 0.652)for the difference in hit rate “during–before,” and r = 0.015 (p = 0.966) for thedifference in hit rate “after–before.”
during and after) on percent signal change in the PRL projectionzone in the early visual cortex. For the OppPRL condition (redlines in Figure 7, upper left and right panel), no such trends wereobserved (p = 0.42 and p = 0.35, respectively, not corrected formultiple comparisons).
EFFECT OF FIXATION STABILITY IN FMRI DATAWhen we correlated fixation stability (percentage of fixationsaround 2◦ visual angle of the fixation point) and the developmentof BOLD signal in visual cortex, we found a positive correlationbetween fixation stability and difference in percent signal changebefore and after training that just failed to reach significance(p = 0.075, not corrected for multiple comparisons; otherwisep = 0.15, Bonferroni corrected; see Table 2; Figure 8).
As becomes evident from Figures 6 and 8, a gap in fixationstability could be observed between three patients (P5, P6, andP7) with fixation stability <40% and the remaining patients, whoexhibit more stable fixation (≥60%). After excluding the data fromthese three patients with fixation stability <40%, an ANOVA of
BOLD percent signal change revealed a significant effect of trainingsession [F(2,16) = 4.1; p = 0.038; see Figure 7, lower panel] withinthe patient group.
DISCUSSIONIn this study we investigated whether patients with central visionloss can benefit from perceptual learning. We wanted to determinewhether patients with central vision loss can be efficiently trainedat their eccentric PRL to perform a challenging TDT and if sucha learning effect might be reflected in fMRI-BOLD signal changesin the respective projection zone in early visual cortex. Further weinvestigated whether the gains accruing via TDT training at thePRL could generalize to other aspects of visual performance andvision-related aspects of quality of life.
Both patients and control subjects exhibited a typical learningeffect on the TDT which was indicated by a significant reductionin SOA in both groups. This result is consistent with the classi-cal findings of Karni and Sagi (1991), Schwartz et al. (2002), orYotsumoto et al. (2008). Behavioral data acquired during fMRI
Frontiers in Psychology | Perception Science October 2014 | Volume 5 | Article 1189 | 10
Plank et al. Perceptual learning in macular degeneration
FIGURE 7 | Mean of percent signal change in the projection zones in
the early visual cortex of the PRL (trained location, blue symbols)
and the OppPRL (untrained location, red symbols) for patients
(n = 12) and controls (n = 10; upper row) before the first, fourth and
after the sixth training session. An omnibus ANOVA revealed no
significant effects. The lower row shows these values for those patientswho exhibited fixation stability over 60% (n = 9). Here, arepeated-measures ANOVA within the patient group revealed a significanteffect of training session (p = 0.038). Error bars show ±1 SE of themean.
indicated a significant effect of training on hit rates and reactiontimes. Considering the two groups (patients, controls) separatelythere was a significant effect of training in the patient groupfor the factor location (PRL, OppPRL), which was not the casefor the control group. We further observed a significant interac-tion between target location and group with respect to hit rates(see Figure 4A). Before training patients showed similar hit ratesfor targets presented at the PRL and OppPRL locations in thevisual field. During training their hit rate increased for targetspresented at the PRL compared to when they were presented atthe location OppPRL. In contrast control subjects showed alsoan increase in hit rates with training but no difference betweenthe trained and untrained locations. One explanation for thisfinding could be that patients use their PRL additionally in theirdaily life which could influence the training procedure and effi-ciency. Therefore it might also be more intuitive for the patientsto train on targets presented in their PRL since the PRL func-tions as a pseudo fovea, which is not the case for the controlsubjects.
In the fMRI results, we found neither a significant effect ofsession, nor of location nor of group in the omnibus ANOVA.We could observe a linear trend for the factor “training session”at the signal in the PRL projection zone in early visual cortex inthe patient group while the control group seemed to exhibit aquadratic trend in that area. McGovern et al. (2012) claim thatthe low signal change which is sometimes found in studies dealingwith perceptual learning in early visual areas (e.g., Ghose et al.,2002) might not be associated with the increase of performancedirectly. This suggestion also seems to hold here, since we couldfind clear learning effects according to SOA, hit rates and reac-tion times but only subtle changes of the amplitude of the BOLDsignal with training. McGovern et al. (2012) argue that probablymore brain areas than the early visual cortex might be involved inperceptual learning. The linear trend in patients of the signal inthe PRL associated area in early visual cortex according to train-ing is expressed in an increase of signal from the second to thethird fMRI session. When we restricted our analysis to the sub-group of patients with high fixation stability (≥60%), we found a
Plank et al. Perceptual learning in macular degeneration
FIGURE 8 | Correlations between the difference in percent signal
change (before the first and fourth training session (“during”), left
panel, as well as before the first and after the sixth training
session (“after”), right panel, and initial fixation stability for the
trained PRL location (A) or the untrained OppPRL location (B) for
patient data only (n = 12). As in Figure 6, squares correspond tovalues from JMD patients, diamonds to those from AMD patients.
Correlation coefficients for the trained PRL location are r = 0.155(p = 0.629) for the difference in percent signal change “during–before,”and r = 0.531 (p = 0.075) for the difference in percent signal change“after–before.” For the untrained OppPRL location correlation coefficientsare r = 0.042 (p = 0.896) for the difference in percent signal change“during–before,” and r = 0.444 (p = 0.148) for the difference in percentsignal change “after–before.”
significant increase of BOLD response in early visual cortex withtraining. This result is consistent with several other studies whichreport an increase in neural signal in early visual cortex with train-ing. Frank et al. (2014) show also an increase of percent signalchange over learning sessions while subjects trained in a challeng-ing perceptual learning task. The time course of the neural signalreferring to the trained location in early visual cortex in the controlgroup follows the pattern observed in the study by Yotsumoto et al.(2008) who also used a TDT. Similar to the trend of the presentresults for the control group, they found an increase of signal fromthe pre-training session to the second fMRI session followed by aslight decrease of signal in the post-training session. Interestinglythis was only the case for the PRL associated area in early visualcortex where subjects received training and not for the untrainedOppPRL associated area. As described in the Introduction, theincrease in BOLD signal observed in the initial phase of learningsuggests the recruitment of respective brain areas in early visualcortex (Yotsumoto et al., 2008). The decline in the BOLD signal
would accordingly correspond to a consolidation process. In ourstudy the control subjects appeared to have reached the consol-idation phase already after the first post-training session, whilepatients still showed an increase in BOLD-signal up to the secondpost-training session.
Considering the patients’ fixation stability there was on the onehand a significant positive correlation between fixation stabilityand hit rate (difference during and before training) if the tar-get appeared at the position of the PRL and on the other handa positive correlation between fixation stability and percent sig-nal change (difference after and before training) if the target waslocated in the PRL projection zone in early visual cortex, thatjust failed to reach significance. There was further a significanteffect of session when three patients, who exhibited extremelypoor fixation stability, were omitted from analysis. This find-ing suggests that fixation stability might be a prerequisite for asuccessful learning curve in perceptual learning. Moreover, othervisual tasks seem to be affected by fixation stability. Plank et al.
Frontiers in Psychology | Perception Science October 2014 | Volume 5 | Article 1189 | 12
Plank et al. Perceptual learning in macular degeneration
(2013) reported that patients suffering from hereditary maculardystrophies (JMD) with stable eccentric fixation performed bet-ter in a visual search task than patients with less stable eccentricfixation. Interestingly this was also the case, if the target stimuliwere not in or near the position of the PRL. Fixation stability hasalso usually been shown to be positively correlated with readingspeed in patients with central vision loss (e.g., Sunness et al., 1996;Trauzettel-Klosinski and Tornow, 1996; Nilsson et al., 1998; Nils-son et al., 2003; Crossland et al., 2004; Rubin and Feely, 2009).Please note that, since eye movements were not recorded duringfMRI sessions, we had to assume that the level of fixation stabilitymeasured during psychophysical testing was also evident duringfMRI testing.
The FrACT sensitivity (Bach, 1996) revealed a training asso-ciated improvement in the patient group for the Vernier subtest.However, it should be noted that the significance level of thiseffect does not survive correction for multiple testing, suggestingthat caution must be exercised here and that further studies arewarranted. The other tasks seemed not to be influenced by thetraining intervention. The reason for the marginal improvementin the Vernier task might be due to the similarity among the stimuliin the TDT and the Vernier task.
With respect to the transfer of TDT training the findingsreported above suggest that caution should be exercised wheninterpreting their implications with respect to potential applica-tion in visual rehabilitation. Obviously studies with larger patientsamples are required that assess the amount of transfer of percep-tual training at the PRL to other visual functions. The addition of a“sham” training group would establish the extent to which placeboeffects influence perceptual learning in select patient groups. Withrespect to the effects of oculomotor and eccentric-fixation trainingin a similar patient group, we could recently rule out that the ben-eficial effects of training could be explained by a general placeboeffect (Rosengarth et al., 2013).
Earlier studies have pointed to a persistence of perceptual learn-ing effects. Polat et al. (2004) found a two to fourfold increase incontrast sensitivity in the amblyopic eye of trainees 12 monthsafter training on a flanker-task had ended. Our group has recentlyshown that in healthy participants the effects of perceptual learn-ing of a difficult conjunction visual search task are still evident at9-month follow-up (Frank et al., 2014). We are currently retestingthe patients and controls of the present study with respect to thisaspect of the results (Plank et al., unpublished observations).
With respect to the results of the VFQ, patients exhibited higherscores after training on the category of social functioning, whichconsiders personal contact und communication with other peo-ple. Šiaudvytyte et al. (2012) report differences in quality of life ofAMD patients compared to age-matched control subjects in sev-eral categories of the VFQ including social functioning. Possibleimplications of these trends require further investigation in largerpatient samples.
CONCLUSIONIn this study we trained patients with central vision loss in a TDT,with the target appearing on their respective PRL, and comparedtheir results to an age-matched normal sighted control group. Wewere also interested in the neural correlates of the learning process
in the visual cortex. Although the task appeared to be more diffi-cult for the patient group than for the control group, patients wereable to do the task and showed significant learning effects. Patientswith stable eccentric fixation showed better performance accom-panied by a larger increase in BOLD-signal in the PRL projectionzone of the early visual cortex. Owing to our strict inclusion andexclusion criteria with respect to disease manifestation in the studyand companion eye of our patients, our results are limited to thepresent patient sample, thereby demanding further verification ofbeneficial effects of perceptual training in patients with differentforms of macular disease. Nevertheless, the present results supportthe idea that perceptual learning can improve the efficient use ofthe PRL location in patients with central vision loss.
ACKNOWLEDGMENTSThis work was supported by the Deutsche Forschungsgemein-schaft within the framework of Research Group FOR 1075:Regulation and Pathology of Homeostatic Processes in VisualFunction. The authors thank Susanne Hammer for her helpwith data collection and the City of Regensburg (Senior Citizens’Office) for their assistance in participant recruitment, as well as allparticipants of our study.
REFERENCESAstle, A. T., McGraw, P. V., and Webb, B. S. (2011). Recovery of stereo acu-
ity in adults with amblyopia. BMJ Case Rep. 2011, bcr0720103143. doi:10.1136/bcr.07.2010.3143
Astle, A. T., Webb, B. S., and McGraw, P. V. (2010). Spatial frequency discriminationlearning in normal and developmentally impaired human vision. Vision Res. 50,2445–2454. doi: 10.1016/j.visres.2010.09.004
Bach, M. (1996). The “Freiburg Visual Acuity Test” – automatic measurement ofvisual acuity. Optom. Vis. Sci. 73, 49–53. doi: 10.1097/00006324-199601000-00008
Bäckman, Ö., and Inde, K. (1979). Low Vision Training. Malmö: Hermods.Ball, K., and Sekuler, R. (1982). A specific and enduring improvement in visual
motion discrimination. Science 218, 697–698. doi: 10.1126/science.7134968Brainard, D. H. (1997). The psychophysics toolbox. Spat. Vis. 10, 433–436. doi:
10.1163/156856897X00357Brett, M., Anton, J. L., Valabregue, R., and Poline, J. B. (2002). Region of interest
analysis using the MarsBar toolbox for SPM 99. Neuroimage 16, S497.Chung, S. T. (2011). Improving reading speed for people with central vision loss
through perceptual learning. Invest. Ophthalmol. Vis. Sci. 52, 1164–1170. doi:10.1167/iovs.10-6034
Chung, S. T., Legge, G. E., and Cheung, S. H. (2004). Letter-recognition and readingspeed in peripheral vision benefit from perceptual learning. Vision Res. 44, 695–709. doi: 10.1016/j.visres.2003.09.028
Chung, S. T., Li, R. W., and Levi, D. M. (2012). Learning to identify near-acuity letters, either with or without flankers, results in improved lettersize and spacing limits in adults with amblyopia. PLoS ONE 7:e35829. doi:10.1371/journal.pone.0035829
Crossland, M. D., Culham, L. E., and Rubin, G. S. (2004). Fixation stability andreading speed in patients with newly developed macular disease. OphthalmicPhysiol. Opt. 24, 327–333. doi: 10.1111/j.1475-1313.2004.00213.x
Ding, J., and Levi, D. M. (2011). Recovery of stereopsis through perceptual learningin human adults with abnormal binocular vision. Proc. Natl. Acad. Sci. U.S.A.108, E733–E741. doi: 10.1073/pnas.1105183108
Fahle, M., and Poggio, T. (eds). (2002). Perceptual Learning. Cambridge, MA: MITPress.
Fiorentini, A., and Berardi, N. (1981). Learning in grating waveform discrimination:specificity for orientation and spatial frequency. Vision Res. 21, 1149–1158. doi:10.1016/0042-6989(81)90017-1
Fletcher, D. C., and Schuchard, R. A. (1997). Preferred retinal loci relationship tomacular scotomas in a low-vision population. Ophthalmology 104, 632–638. doi:10.1016/S0161-6420(97)30260-7
Plank et al. Perceptual learning in macular degeneration
Frank, S. M., Reavis, E. A., Tse, P. U., and Greenlee, M. W. (2014). Neural mechanismsof feature conjunction learning: enduring changes in occipital cortex after a weekof training. Hum. Brain Mapp. 35, 1201–1211. doi: 10.1002/hbm.22245
Ghose, G. M., Yang, T., and Maunsell, J. H. R. (2002). Physiological cor-relates of perceptual learning in monkey V1 and V2. J. Neurophysiol. 87,1867–1888.
Gibson, E. J. (1963). Perceptual learning. Annu. Rev. Psychol. 14, 29–56. doi:10.1146/annurev.ps.14.020163.000333
Goldhacker, M., Rosengarth, K., Plank, T., and Greenlee, M. W. (2014). The effect offeedback on performance and brain activation during perceptual learning. VisionRes. 99, 99–110. doi: 10.1016/j.visres.2013.11.010
Goldstone, R. L. (1998). Perceptual learning. Annu. Rev. Psychol. 49, 585–612. doi:10.1146/annurev.psych.49.1.585
Gori, S., and Facoetti, A. (2014). Perceptual learning as a possible new approachfor remediation and prevention of developmental dyslexia. Vision Res. 99, 78–87.doi: 10.1016/j.visres.2013.11.011
Guez, J. E., Le Gargasson, J. F., Rigaudiere, F., and O’Regan, J. K. (1993). Is there asystematic location for the pseudo-fovea in patients with central scotoma? VisionRes. 33, 1271–1279. doi: 10.1016/0042-6989(93)90213-G
Hussain, Z., Webb, B. S., Astle, A. T., and McGraw, P. V. (2012). Perceptual learningreduces crowding in amblyopia and in the normal periphery. J. Neurosci. 32,474–480. doi: 10.1523/JNEUROSCI.3845-11.2012
Huurneman, B., Boonstra, F. N., Cox, R., van Rens, G. H., and Cillessen, A. H.(2013). Perceptual learning in children with visual impairment improves nearvisual acuity. Invest. Ophthalmol. Vis. Sci. 54, 6208–6216. doi: 10.1167/iovs.13-12220
Karni, A., and Sagi, D. (1991). Where practice makes perfect in texture discrimina-tion: evidence for primary visual cortex plasticity. Proc. Natl. Acad. Sci. U.S.A. 88,4966–4970. doi: 10.1073/pnas.88.11.4966
Levi, D. M. (2012). Prentice award lecture 2011: removing the brakes onplasticity in the amblyopic brain. Optom. Vis. Sci. 89, 827–838. doi:10.1097/OPX.0b013e318257a187
Levi, D. M., and Li, R. W. (2009). Perceptual learning as a potentialtreatment for amblyopia: a mini-review. Vision Res. 49, 2535–2549. doi:10.1016/j.visres.2009.02.010
Levitt, H. C. C. H. (1971). Transformed up-down methods in psychoacoustics. J.Acoust. Soc. Am. 49, 467–477. doi: 10.1121/1.1912375
Mangione, C. M., Lee, P. P., Gutierrez, P. R., Spritzer, K., Berry, S., and Hays, R.D. (2001). Development of the 25-item National Eye Institute Visual FunctionQuestionnaire. Arch. Ophthalmol. 119, 1050–1058. doi: 10.1001/archopht.119.7.1050
McGovern, D. P., Webb, B. S., and Peirce, J. W. (2012). Transfer of perceptual learningbetween different visual tasks. J. Vis. 12, 4. doi: 10.1167/12.11.4
Miles, W. R. (1930). Ocular dominance in human adults. J. Gen. Psychol. 3, 412–430.doi: 10.1080/00221309.1930.9918218
Nilsson, U. L., Frennesson, C., and Nilsson, S. E. G. (1998). Location and stabil-ity of a newly established eccentric retinal locus suitable for reading, achievedthrough training of patients with a dense central scotoma. Optom. Vis. Sci. 75,873–878.
Nilsson, U. L., Frennesson, C., and Nilsson, S. E. G. (2003). Patients with AMDand a large absolute central scotoma can be trained successfully to use eccentricviewing, as demonstrated in a scanning laser ophthalmoscope. Vision Res. 43,1777–1787. doi: 10.1016/S0042-6989(03)00219-0
Plank, T., Frolo, J., Brandl-Rühle, S., Renner, A. B., Hufendiek, K., Helbig, H., et al.(2011). Gray matter alterations in visual cortex of patients with loss of centralvision due to hereditary retinal dystrophies. Neuroimage 56, 1556–1565. doi:10.1016/j.neuroimage.2011.02.055
Plank, T., Frolo, J., Farzana, F., Brandl-Rühle, S., Renner, A. B., and Greenlee,M. W. (2013). Neural correlates of visual search in patients with hereditaryretinal dystrophies. Hum. Brain Mapp. 34, 2607–2623. doi: 10.1002/hbm.22088
Poggio, T., Fahle, M., and Edelman, S. (1992). Fast perceptual learning in visualhyperacuity. Science 256, 1018–1021. doi: 10.1126/science.1589770
Polat, U. (2009). Perceptual learning induces neuroplasticity, enabling improve-ment of visual functions. Expert Rev. Ophthalmol. 4, 573–576. doi: 10.1586/eop.09.54
Polat, U., Ma-Naim, T., Belkin, M., and Sagi, D. (2004). Improving vision in adultamblyopia by perceptual learning. Proc. Natl. Acad. Sci. U.S.A. 101, 6692–6697.doi: 10.1073/pnas.0401200101
Polat, U., Schor, C., Tong, J. L., Zomet, A., Lev, M., Yehezkel, O., et al. (2012).Training the brain to overcome the effect of aging on the human eye. Sci. Rep. 2,278. doi: 10.1038/srep00278
Porac, C., and Coren, S. (1976). The dominant eye. Psychol. Bull. 83, 880–897. doi:10.1037/0033-2909.83.5.880
Rosengarth, K., Keck, I., Brandl-Rühle, S., Frolo, J., Hufendiek, K., Greenlee, M. W.,et al. (2013). Functional and structural brain modifications induced by oculo-motor training in patients with age-related macular degeneration. Front. Psychol.4:428. doi: 10.3389/fpsyg.2013.00428
Rubin, G. S., and Feely, M. (2009). The role of eye movements during reading inpatients with age-related macular degeneration (AMD). Neuroophthalmology 33,120–126. doi: 10.1080/01658100902998732
Sagi, D. (2011). Perceptual learning in Vision Research. Vision Res. 51, 1552–1566.doi: 10.1016/j.visres.2010.10.019
Schoups, A., Vogels, R., Qian, N., and Orban, G. (2001). Practising orientationidentification improves orientation coding in V1 neurons. Nature 412, 549–553.doi: 10.1038/35087601
Schwartz, S., Maquet, P., and Frith, C. (2002). Neural correlates of perceptuallearning: a functional MRI study of visual texture discrimination. Proc. Natl.Acad. Sci. U.S.A. 99, 17137–17142. doi: 10.1073/pnas.242414599
Seitz, A., and Watanabe, T. (2005). A unified model for perceptual learning. TrendsCogn. Sci. 9, 329–334. doi: 10.1016/j.tics.2005.05.010
Šiaudvytyte, L., Mitkute, D., and Balciuniene, J. (2012). Quality of life in patientswith age-related macular degeneration. Medicina (Kaunas) 48, 109–111.
Sireteanu, R., and Rettenbach, R. (1995). Perceptual learning in visual search:fast, enduring, but non-specific. Vision Res. 35, 2037–2043. doi: 10.1016/0042-6989(94)00295-W
Sunness, J. S., Applegate, C. A., Haselwood, D., and Rubin, G. S. (1996). Fixa-tion patterns and reading rates in eyes with central scotomas from advancedatrophic age-related macular degeneration and Stargardt disease. Ophthalmology103, 1458–1466. doi: 10.1016/0042-6989(94)00295-W
Timberlake, G. T., Peli, E., Essock, E. A., and Augliere, R. A. (1987). Reading with amacular scotoma. II. Retinal locus for scanning text. Invest. Ophthalmol. Vis. Sci.28, 1268–1274.
Trauzettel-Klosinski, S., and Tornow, R. P. (1996). Fixation behaviour andreading ability in macular scotoma. Neuroophthalmology 16, 241–253. doi:10.3109/01658109609044632
Whittaker, S. G., Budd, J., and Cummings, R. W. (1988). Eccentric fixation withmacular scotoma. Invest. Ophthalmol. Vis. Sci. 29, 268–278.
Yotsumoto, Y., Watanabe, T., and Sasaki, Y. (2008). Different dynamics of perfor-mance and brain activation in the time course of perceptual learning. Neuron 57,827–833. doi: 10.1016/j.neuron.2008.02.034
Yu, D., Cheung, S. H., Legge, G. E., and Chung, S. T. (2010a). Reading speed in theperipheral visual field of older adults: does it benefit from perceptual learning?Vision Res. 50, 860–869. doi: 10.1016/j.neuron.2008.02.034
Yu, D., Legge, G. E., Park, H., Gage, E., and Chung, S. T. (2010b). Development ofa training protocol to improve reading performance in peripheral vision. VisionRes. 50, 36–45. doi: 10.1016/j.visres.2009.10.005
Zhou, Y., Huang, C., Xu, P., Tao, L., Qiu, Z., Li, X., et al. (2006). Perceptual learn-ing improves contrast sensitivity and visual acuity in adults with anisometropicamblyopia. Vision Res. 46, 739–750. doi: 10.1016/j.visres.2005.07.031
Conflict of Interest Statement: The authors declare that the research was conductedin the absence of any commercial or financial relationships that could be construedas a potential conflict of interest.