Performance-Based Codes: Economics, Documentation, and Design by Jason D. Averill A Thesis Submitted to the Faculty of the WORCESTER POLYTECHNIC INSTITUTE in partial fulfillment of the requirements for the Degree of Master of Science in Fire Protection Engineering by ________________________________ May 1998 APPROVED: ____________________________________ Dr. Jonathan Barnett, Advisor ____________________________________ Richard W. Bukowski, Reader ____________________________________ David A. Lucht, Head of Department
Transcript
Performance-Based Codes: Economics, Documentation, and Design
by
Jason D. Averill
A Thesis
Submitted to the Faculty
of the
WORCESTER POLYTECHNIC INSTITUTE
in partial fulfillment of the requirements for the
Degree of Master of Science
in
Fire Protection Engineering
by
________________________________
May 1998
APPROVED:
____________________________________
Dr. Jonathan Barnett, Advisor
____________________________________
Richard W. Bukowski, Reader
____________________________________
David A. Lucht, Head of Department
Jason D. Averill
ii
AbstractThe advent of performance-based codes in the United States underscores the need for a
thorough, systematic approach to the documentation and accomplishment of a
performance-based design. This project has three objectives: economic analysis of
performance-based codes from a social view point, documentation of a performance-
based design, and an example application of the ICC Performance-Based Code to high-
rise office building. Economic issues explored include the externalities, insurance, and
liabilities associated with performance-based codes. Documentation of a performance-
based design includes delineation of the scope and goals with agreement between the
designer, architect, building owner, and authority having jurisdiction, examination of the
relevant code statutes, development of appropriate fire scenarios which meet the
requirements of the performance matrices, thorough documentation of all design tool and
calculation assumptions and limitations, and a clear demonstration of satisfactory
accomplishment of stated goals and objectives. Finally, performance-based design
alternatives to a prescriptively-designed 40 story office building were developed. There
were three major design alternatives. The first design feature was the evacuation of
occupants using elevators. The second alternative was the use of the assured fire safety
system, which combined emerging technologies in fire detection, alarm, and suppression.
The final design alternative was the routing of the domestic water supply through the
sprinkler riser in order increase the reliability of the sprinkler system and save design,
material, and installation costs associated with the domestic water supply risers. Finally,
Performance-Based Codes: Economics, Documentation, and Design
iii
this project analyzed the specific life-cycle economic impact of the design alternatives
when compared to the prescriptive design.
Jason D. Averill
iv
AcknowledgmentsThis project was completed with dual, complementary objectives. The personal objective
of the author was to perform an analysis of performance-based codes from a social
perspective to complete degree requirements of a Master’s of Fire Protection Engineering
at Worcester Polytechnic Institute. The author recognizes the contributions of Prof.
Jonathan R. Barnett who advised the project, both technically and as a friend. The help
and support of Prof. David A. Lucht, department head of the Center for Firesafety
Studies is also appreciated. The project also met the goals of the Building and Fire
Research Laboratory at the National Institute of Standards and Technology. Mr. Richard
Bukowski acted as a thesis co-advisor and NIST liaison. The assistance of Dr. Walter
Jones, Mr. Paul Reneke, Mr. Richard Peacock, Dr. Glenn Forney, and Dr. William Davis
is also appreciated. Additionally, Joseph Fleming, chief fire marshall from Boston Fire
Department, assisted on the technical content and acted as an Authority Having
Jurisdiction. Jay Waters and the staff at HKS Architecture in Dallas, TX performed the
prescriptive-based building design and provided drawings and assistance. Prof. Tom
Kisko from the University of Florida provided software support with the evacuation
modeling. The members of the International Code Council provided the performance-
based design regulation, sponsored the American entry into the conference, and lent
technical feedback and expertise. Finally the author thanks his mother and sister for their
support and encouragement throughout his studies.
Performance-Based Codes: Economics, Documentation, and Design
v
Table of Contents
ABSTRACT.................................................................................................................................................... II
TABLE OF FIGURES ...............................................................................................................................VIII
TABLE OF TABLES ..................................................................................................................................... X
SCOPE AND OBJECTIVES .........................................................................................................................1
ECONOMIC ANALYSIS OF PERFORMANCE-BASED CODES ............................................................4
OPTIMIZATION OF PRIVATE COSTS.................................................................................................................4EXTERNALITIES..............................................................................................................................................6BEST AVAILABLE TECHNOLOGY..................................................................................................................11PROBABILITY AND MAGNITUDE OF FAILURE.................................................................................................12CONCLUSIONS.............................................................................................................................................13
DOCUMENTATION OF PERFORMANCE-BASED DESIGN ...............................................................14
SCOPE OF PROJECT DESIGN.........................................................................................................................15GOALS OF THE DESIGN PROCESS.................................................................................................................16FUNCTIONAL OBJECTIVES............................................................................................................................17PERFORMANCE CRITERIA AND DESIGN OBJECTIVES.....................................................................................18DEVELOPMENT OF FIRE SCENARIOS AND EVALUATION OF BUILDING PERFORMANCE..................................19
Design Tools ..........................................................................................................................................21Zone Fire Models...................................................................................................................................21Computational Fluid Dynamics (CFD) .................................................................................................27Small and Real Scale Testing ................................................................................................................29
QUALIFICATIONS OF THE ENGINEERS...........................................................................................................30
FUEL CHARACTERISTICS OF OFFICE OCCUPANCIES ....................................................................32
WORK STATION FIRES.................................................................................................................................32SHIELDED OFFICE FIRES...............................................................................................................................34OTHER OFFICE FURNISHING FIRES...............................................................................................................35
HISTORICAL SUMMARY OF MAJOR HIGH-RISE OFFICE FIRES ..................................................37
ONE MERIDIAN PLAZA FIRE.........................................................................................................................38The Building...........................................................................................................................................38The Fire..................................................................................................................................................38Failure Modes Contributing to Fire......................................................................................................40
FIRST INTERSTATE BANK FIRE.....................................................................................................................42The Building...........................................................................................................................................42The Fire..................................................................................................................................................42Failure Modes Contributing to Fire......................................................................................................44
PEACHTREE 25TH BUILDING FIRE..................................................................................................................46
The Building...........................................................................................................................................46The Fire..................................................................................................................................................46
Jason D. Averill
vi
Failure Modes Contributing to Fire......................................................................................................47COMMON FAILURE MODES OF MAJOR HIGH-RISE FIRES..............................................................................49
PERFORMANCE-BASED DESIGN: A CASE STUDY............................................................................52
OBJECTIVES AND REQUIREMENTS OF THE CASE STUDY ................................................................................52GENERIC BUILDING REQUIREMENTS............................................................................................................53BUILDING SELECTION..................................................................................................................................54ICC PERFORMANCE-BASED CODE...............................................................................................................55
ELEVATOR EVACUATION .............................................................................................................................59Design Issues Regarding Elevator Egress ............................................................................................59
STAIRWELL EVACUATION ............................................................................................................................68Factors Affecting Total Egress Time.....................................................................................................68Computer Modeling of People Movement .............................................................................................72
CYBERNETIC BUILDING FEATURES...............................................................................................................76COMBINED SPRINKLER AND DOMESTIC PIPING............................................................................................79
FIRE SCENARIOS.......................................................................................................................................81
PERFORMANCE OBJECTIVES.........................................................................................................................85Life Safety Performance: Fire Event.....................................................................................................85Operational Performance Levels: Fire Event .......................................................................................87Structural Performance: Fire Event......................................................................................................89
MODELING FIRE SCENARIOS........................................................................................................................92CFAST 3.1 ..............................................................................................................................................92Modeling Sprinkler Activation and Suppression...................................................................................92
SMOKE DETECTOR ACTIVATION ..................................................................................................................94Temperature Correlations .....................................................................................................................94Disadvantages of Temperature Correlations........................................................................................97
RESULTS OF FIRE SCENARIO COMPUTER MODELING..................................................................................100Multi-Tenant Cubicle Fire...................................................................................................................100One Tenant Cubicle Fire .....................................................................................................................102Multi-Tenant Shielded Fire .................................................................................................................102One Tenant Shielded Fire....................................................................................................................102Multi-Tenant Copier Fire....................................................................................................................102One Tenant Copier Fire.......................................................................................................................102Mercantile Low-Rack Storage Fire.....................................................................................................103Atrium Fire...........................................................................................................................................103Evacnet4 Model Results.......................................................................................................................104
FIRST ORDER COST ESTIMATION .....................................................................................................108
FACTORS AFFECTING TOTAL EGRESS TIME................................................................................................124COMPUTER MODELING OF PEOPLE MOVEMENT.........................................................................................127
Table of FiguresFigure 1: Upper Layer Temperature in Office of Origin for Cubicle Fire Scenario________________ 132Figure 2: Upper Layer Temperature in Hallway for Cubicle Fire Scenario ______________________ 133Figure 3: Layer Height in Office of Origin for Cubicle Fire Scenario __________________________ 134Figure 4: Layer Height in Hallway for Four Tenant Cubicle Fire Scenario ______________________ 135Figure 5: Layer Height for Room of Origin for Four Tenant Copier Fire Scenario ________________ 136Figure 6: Upper Layer Temperature for Four Tenant Copier Fire Scenario _____________________ 137Figure 7: Upper Layer Temperature in Hallway for Four Tenant Copier Fire Scenario ____________ 138Figure 8: Layer Height in Hallway for Four Tenant Copier Fire Scenario_______________________ 139Figure 9: Upper Layer Temperature for Room of Origin for Four Tenant Shielded Fire Scenario ____ 140Figure 10: Layer Height in Room of Origin for Four Tenant Shielded Fire Scenario ______________ 141Figure 11: Upper Layer Temperature in Hallway for Four Tenant Shielded Fire Scenario__________ 142Figure 12: Layer Height in Hallway for Four Tenant Shielded Fire Scenario ____________________ 143Figure 13: Upper Layer Temperature for One Tenant Shielded Fire Scenario____________________ 144Figure 14: Layer Height for One Tenant Shielded Fire Scenario ______________________________ 145Figure 15: Upper Layer Temperature for One Tenant Cubicle Fire Scenario ____________________ 146Figure 16: Layer Height for One Tenant Cubical Fire Scenario _______________________________ 147Figure 17: Upper Layer Temperature in Room of Origin for Atrium Fire with Commercial Sprinklers andNo Smoke Venting Scenario____________________________________________________________ 148Figure 18: Upper Layer Temperature in Two Story Space for Atrium Fire with Commercial Sprinklers andNo Smoke Venting Scenario____________________________________________________________ 149Figure 19: Upper Layer Temperature in Upper Level Space for Atrium Fire with Commercial Sprinklersand No Smoke Venting Scenario ________________________________________________________ 150Figure 20: Layer Height in Room of Origin for Atrium Fire with Commercial Sprinklers and No SmokeVenting Scenario ____________________________________________________________________ 151Figure 21: Layer Height in Two Story Space for Atrium Fire with Commercial Sprinklers and No SmokeVenting Scenario ____________________________________________________________________ 152Figure 22: Layer Height in Upper Level Room for Atrium Fire with Commercial Sprinklers and No SmokeVenting Scenario ____________________________________________________________________ 153Figure 23: Heat Release Rate Graph Showing the Impact of Different Sprinklers_________________ 154Figure 24: Upper Layer Temperature in Room of Origin for Atrium Fire with QR Sprinklers and SmokeVenting Scenario ____________________________________________________________________ 155Figure 25: Upper Layer Temperature in Two Story Space for Atrium Fire with QR Sprinklers and SmokeVenting Scenario ____________________________________________________________________ 156Figure 26: Upper Layer Temperature in Remote Room for Atrium Fire with QR Sprinklers and SmokeVenting Scenario ____________________________________________________________________ 157Figure 27: Layer Height in Room of Origin for Atrium Fire with QR Sprinklers and Smoke VentingScenario ___________________________________________________________________________ 158Figure 28: Layer Height in Two Story Space for Atrium Fire with QR Sprinklers and Smoke VentingScenario ___________________________________________________________________________ 159Figure 29: Layer Height in Remote Room for Atrium Fire with QR Sprinklers and Smoke Venting Scenario__________________________________________________________________________________ 160
Figure 30: Upper Layer Temperature in Room of Origin for Mercantile Fire with Commercial Sprinklersand No Smoke Venting Scenario ________________________________________________________ 161Figure 31: Upper Layer Temperature in Remote Room for Mercantile Fire with Commercial Sprinklersand No Smoke Venting ________________________________________________________________ 162Figure 32: Layer Height in Room of Origin for Mercantile Fire with Commercial Sprinklers and NoSmoke Venting Scenario ______________________________________________________________ 163Figure 33: Layer Height in Remote Room for Mercantile Fire with Commercial Sprinklers and No SmokeVenting Scenario ____________________________________________________________________ 164Figure 34: Upper Layer Temperature in Room of Origin for Mercantile Fire with QR Sprinklers andSmoke Venting Scenario ______________________________________________________________ 165
Performance-Based Codes: Economics, Documentation, and Design
ix
Figure 35: Upper Layer Temperature for Remote Room for Mercantile Fire with QR Sprinklers andSmoke Venting Scenario ______________________________________________________________ 166Figure 36: Layer Height in Room in Origin for Mercantile Fire with QR Sprinklers and Smoke VentingScenario ___________________________________________________________________________ 167Figure 37: Layer Height in Remote Room for Mercantile Fire with QR Sprinklers and Smoke VentingScenario ___________________________________________________________________________ 168
Jason D. Averill
x
Table of TablesTable 1: Workstation Fuel Package Components and Weights18 .................................................................34Table 2: Fuel Load Densities for Various Use Group Occupancies ............................................................36Table 3: Crowd Movement Characteristics for a Typical Corridor.............................................................69Table 4: Typical Fire Hazard Frequencies...................................................................................................85Table 5: Life Safety Performance Levels ......................................................................................................87Table 6 Operational Performance Levels .....................................................................................................89Table 7 Structural Performance Levels.........................................................................................................90Table 8: Results of Evacuation Modeling ...................................................................................................105Table 9: Times to Smoke Detector Activation .............................................................................................105Table 10: Total Evacuation Times for Office Fire Scenarios.....................................................................107Table 11: Elevator Door Data.....................................................................................................................122Table 12: Crowd Movement Characteristics for a Typical Corridor.........................................................125
Performance-Based Codes: Economics, Documentation, and Design
xi
Dedicated to the Memory ofDaniel Alan Averill
1951 - 1994
Performance-Based Codes: Economics, Documentation, and Design
1
Introduction
Performance-based codes have long been advertised as being beneficial to parties
involved in the construction of buildings when compared to traditional prescriptive codes.
The building owner may benefit through the lower total cost of building construction and
operation. The architect may be allowed to pursue more innovative architectural designs
if the fire protection engineer can show the subsequent design meets the fire safety
performance objectives. The party whose job potentially becomes more difficult and time
consuming is the building official charged with approving the building design. With
prescriptive design, the official had only ensure that the building met the intent of the
code. In order for the building official to ensure that the design meets the less explicit
goals of the performance-based code, engineering calculations and judgments are
necessary to ensure fulfillment of fire safety objectives.
Scope and Objectives
There are three major objectives within the scope of this thesis: 1) address significant
economic issues pertaining to the implementation of a performance-based code in the
United States; 2) develop a framework for the presentation of a performance-based
design; and, 3) complete a performance-based design which accomplishes the case study
objectives for presentation to the 2nd International Conference on Performance-Based
Codes as well as demonstrates the equivalency and flexibility of the ICC Draft
Jason D. Averill
2
Performance-Based Code. The first two objectives support thorough completion of the
latter objective.
The first objective is to determine the total economic impact of the performance-based
codification process. The total cost of performance-based design is the sum of the private
costs and the social costs. While the quantification of private costs is addressed through
the building process, the determination of total social cost is not accounted for by current
market forces. Subsequently, if performance-based codes without regulatory adjustment
for total social costs are implemented, the full potential social benefit of performance-
based codes will be unrealized. Economic issues such as externalities, development of an
insurance market given new technologies and techniques using quantitative risk and
failure techniques, and optimization of private costs are addressed.
Second, a template for the documentation and presentation of a performance-based
design is developed and justified. Careful, consistent documentation of a performance-
based design is a critical step towards assuring achievement of social design goals. Proper
documentation includes explicit listing of design goals and methods, calculation
procedures, assumptions, limitations and uncertainties, and achievement of design goals.
Finally, the project demonstrates how the flexibility of the ICC code allows for the
infusion of new technologies into building design that are not encouraged in a prescriptive
regime. New technologies evaluated here include elevator egress and ‘smart’ detection,
Performance-Based Codes: Economics, Documentation, and Design
3
alarm, and suppression systems. To demonstrate the use of these technologies to meet the
fire safety objectives of the ICC performance-based code, a 40-story, mixed-occupancy
office building, containing several underground parking levels is analyzed. The building
selection satisfies the case study requirements for the 2nd International Conference on
Performance-Based Codes.
Each of the three sections combines to form a robust analysis of the performance-based
movement in the United States. The results of parallel efforts at the National Fire
Protection Association, the International Code Council, conferences such as the
Conference on Performance-Based Codes, and similar efforts in the global fire
community should help minimize transition time and costs.
Economic Analysis of Performance-Based Codes
The justification of performance-based codes often depends to a significant extent upon
economic savings being realized by the constituents of the building process. There exists
little incentive for owners and engineers to pursue a performance-based design unless the
unique design achieves either significant cost savings or an innovative, aesthetic design.
There are two distinct components to determining the total social costs of a performance-
based design: optimization of private costs associated with the performance-based
building design process and accurate accounting of non-private, or social, costs.
Performance-based codes, when analyzed from an economic viewpoint, however, are
difficult regimes to accurately estimate total social costs. There are several distinct
components of total social costs associated with any regulatory structure:
1. Optimization of Private Costs
2. Externalities
3. Distributional Equity
4. Best Available Technology
5. Probability and Magnitude of Failure1
Optimization of Private Costs
Optimization of private costs is the most publicized component of economic efficiency
realized by the advent of performance-based codes. Private costs include labor, material,
and overhead costs associated with the construction process, in addition to continuous
Performance-Based Codes: Economics, Documentation, and Design
5
management and maintenance costs upon building completion. Performance-based codes
often focus upon the optimization of private costs because they are the easiest to
quantify. This section will review a model to examine building components for life-cycle
cost. Further, each component of the design process can then be analyzed to determine
the economically optimal design.
ALARM 1.02 is a computer program designed to maximize the cost-effectiveness of fire
code compliance. ALARM uses the equivalency provision in the Life Safety Code for
health care occupancies. While the ALARM software is not direct applicable to analysis
of a 40 story office building, the general framework provides insight into steps necessary
to fully evaluate the private costs and savings of a performance-based design. The
premise of the program is simple: iterate code-compliant building design options until
minimum cost is realized. The success of this methodology is contingent upon full
knowledge of the available options as well as the costs associated with each option. The
equivalency provision in the Life Safety Code provides a rigorous framework that is not
readily applied to all performance-based designs, but provides a starting point. The
optimization process requires that all available options be identified. The options can
then be estimated by a construction project manager for initial and life cycle costs.
Additional requirements stipulated by an involved party may change the simple
requirement that the design simply be equivalent to the prescriptive requirements.
Property protection required by the owner above and beyond the prescriptive mandate
Jason D. Averill
6
changes the nature of the comparison somewhat. Optimization of private costs upon
differing design options, each expressing equivalency to a particular standard, lends itself
to computer programming, such as the one developed in ALARM. Such analysis can be
standardized with a robust model such that subsequent optimization requires significantly
less effort than the initial project.
Externalities
Externalities are events that, due to the actions of one entity, impinges upon the activities
of another in a manner that is not explicitly or implicitly accounted for by market forces.
Externalities are often the most critical, least-understood component of a thorough cost-
benefit analysis. A classic example of the effect of externalities on decision making can
be seen by looking at an example from a manufacturing facility. Suppose, for example,
that a manufacturing facility can produce their widget using a new production process for
50% of the cost of the previous method. The company can reduce the selling price of
widget by some percentage less than 50% and realize a healthy profit, while lowering the
price of the widget to the consumer. The action seems like a situation where society
benefits by having more widgets at a lower price until the total social costs of the process
are analyzed. The costs of the new production line, materials, and labor are private costs,
and are relatively simple to calculate. The externality, in this case, is the increase in air
pollution caused by the new production process. The total social cost is the sum of
private costs and externalities. The cost of externalities is often difficult to determine,
Performance-Based Codes: Economics, Documentation, and Design
7
even if they are identified, which is not always the case. For example, society must either
pay the costs associated with illnesses due to air pollution, or pay the cost of cleaning up
the polluted air. If a proper economic analysis was used to price the widgets which
accounted for the pollution from the beginning of the production process, the price of the
widgets would be higher to account for air pollution. The higher price would accurately
reflect the optimal level of widget output for society. The price of the air pollution would
be absorbed by the company through lost income and by society through higher prices,
and hence, fewer widgets. In other words, the cost of externalities should be internalized
to the people making the decision to create the externality. People who chose not to
consume widgets would not be affected by the production of widgets, as they would be if
the widget manufacturer were allowed to pollute the air. Performance-based codes
should account for all foreseeable externalities and identify methods to internalize
associated costs. It is important to note that externalities are not by definition costs.
Externalities can be benefits to society. Prescriptive codes may create external benefits
as part of the mutual reciprocity of advantage of a regulatory regime. The engineer,
failing to account for external advantages, may overstate the true value of an
“equivalent” design. Externalities, henceforth, however, shall refer to external costs and
a reduction of external benefits.1
Jason D. Averill
8
Externalities of Performance-Based Codes
The true social cost of a performance-based design can only be determined by an
accurate accounting of externalities, in addition to the total private costs. Total private
costs will be accounted for by the parties involved in the design process since total private
costs are inherently internalized. Private costs are further discussed on page 4.
Therefore, identification and proper valuation of externalities becomes critical from a
societal viewpoint. There are several distinct regimes of externalities that arise as a result
of performance-based codes. The first is loss. The next is the real estate market and
another externality regime is public fire safety. Finally, liability creates social
externalities. These factors combine to create an inefficient market structure, which
effectively limit the social savings performance-based codes offer.
The first, and arguably the most important, externality regime is loss. Loss consists of
two distinct components: occupant loss and owner loss. Occupant loss is difficult to fully
measure. Parts of occupant loss include lost work, property, and quality of life including
injury and/or death. While lost wages and property are relatively straightforward
estimates, valuing injuries or deaths is extremely difficult.3 Allocative efficiency is
precluded by large ranges of injury and death settlements. Owner loss refers to such
immediate costs as property and rent, but may include long-term losses including liability
beacuse of legal negligence of the responsibilities as an owner. The reason that owner
and occupant costs are grouped under loss is because these costs are most often absorbed
not by the individual, but by insurance companies. While the insurance market can be
Performance-Based Codes: Economics, Documentation, and Design
9
considered a free market force, insufficient levels of insurance are often carried by
owners and occupants. Meeks and Brannigan illustrate the case of the DuPont Plaza
Hotel fire. “The DuPont Plaza Hotel…carried only 1 million dollars in insurance, despite
operating with hundreds of millions of dollars in human risk.” A simple solution is for
building owners and occupants to provide proof of adequate insurance in order to receive
an occupancy permit.
The second component of social externality is the real estate market. There are two
aspects of the real estate market. The first aspect is standardization and the second
aspect is information costs. Prescriptive codes stipulate the requirements for many
building components. Stipulations result in product standardization and economies of
scale. Performance-based codes reduce dependence of the designer upon standard
equipment and increase the necessity of various performance requirements for similar
products. Performance-based codes can result in similar buildings having different levels
of fire safety to a greater degree than exists under a prescriptive regime. Fire safety
levels include distance to the fire department, the age of the building, choice of interior
furnishings, fire safety systems, both active and passive, and the choice of building
materials. While the performance-based design process should preclude any design from
falling below an acceptable level of safety, varying levels of safety and cost will exist.
The result is two buildings with identical fire safety performance, one accomplished at a
reduced cost leading to lower rents, etc., or two building with identical cost and different
Jason D. Averill
10
levels of fire safety performance. The result is increased information costs for firms
seeking office space. The companies must now factor in levels of fire safety into their
cost analysis.
Public fire protection is a societal cost often taken for granted under any regulatory
regime, whether prescriptive or performance-based. There are two aspects of public fire
protection: regulatory and suppression. The regulatory agency is responsible for
approving all building designs and assuring the public that all buildings within its
jurisdiction meet minimum standards. Performance-based codes increase the cost of
establishing and enforcing regulatory requirements as well as inspecting buildings.
Inspection costs increase due to the fact that inspections under the prescriptive
regulations required standardized checks for code violations. With performance-based
designs interspersed among traditional designs, ensuring continued code compliance
becomes highly individual to buildings. A building in a performance-based design may
receive a “variance” due to an expressed compliance with some set of assumptions. The
building inspector must now in perpetuity ensure that the owner and occupants are aware
of the assumptions and that the assumptions are not violated, thereby compromising the
safety of the occupants and surrounding area. Additionally, the cost of verifying a
performance-based design, from the viewpoint of a building code official, is significantly
increased, particularly if the official reviewing the calculations is not a qualified fire
protection engineer, as most building officials are not. The design verification then either
becomes a long tedious process for a potentially unqualified reviewer, or requires review
Performance-Based Codes: Economics, Documentation, and Design
11
by a non-partisan third party engineer. Fleming further addresses the problems of the
building code official with regards to performance-based codes.4
The final component of social externalities is liability. Liability occurs when there is a
loss and is partially addressed through the existing legal system, however one could argue
that the current legal system is fraught with inconsistency and subjectivity. Monetary
settlements, indeed, even guilt, vary according to circumstances beyond the control or
prediction of the designer, making full accounting of liability in an economic sense
difficult. Liability refers to the fault of a party in an engineering failure and the degree to
which that party is to be held financially or criminally responsible for the failure and
ensuing consequences. Performance-based codes increase the level of responsibility
incurred by the engineer who designs the fire protection systems. Rather than being able
to rely on the prescriptive requirements to deflect responsibility for building failure,
responsibility rests chiefly upon the engineer, if none of the assumptions inherent in the
calculation procedures were later violated. Thus, a new insurance market for the
protection of engineers from design responsibility evolves. This is an additional cost
associated with performance-based design, although not necessarily an externality.
Best Available Technology
For society to realize one hundred percent efficient use of resources, the best available
technology must be implemented. While the best available technology may often incur
Jason D. Averill
12
large up-front costs, the effective lifetime costs may be lower than other technologies.
Additionally, better technology can be assumed to save lives through increases in
performance levels. The value of a life saved by implementation of a better technology
may be measured not only in the legal valuation of the particular life, but also the loss of
benefits that person is no longer able to contribute to society.
Probability and Magnitude of Failure
A significant barrier to achieving both cost savings and increased safety involves
quantification of probability and magnitude of failure in a performance-based design.
While sophisticated models currently exist to address the quantification of failure and the
resulting magnitude of the damage, the underlying tenets of the model are based upon
technology and regulatory procedures of the prescriptive market. For example, if one
were to calculate the probability of smoke detector failure, the underlying assumptions of
any available historical data would carry the bias of a prescriptive design. The use of
such data may be inappropriate for a performance-based design if any factor leading to
the potential failure of a smoke detector were designed differently than would otherwise
exist in the prescriptive design. New technology presents an even greater challenge to
anyone performing a risk/consequence analysis. First, new technology provides no
historical data for the engineer to predict performance levels in actual fire conditions.
While the laboratory testing procedures should provide guidance, products or systems
may perform differently in a real fire scenario. Secondly, new technology often has
Performance-Based Codes: Economics, Documentation, and Design
13
unanticipated consequences. The behavior of one system or product may affect the
behavior or operation of another system or product. The level of uncertainty in the
analysis is significantly increased.
ConclusionsThe promised land of performance-based codes should be traversed with an appropriate
blend of caution and optimism. The total consequences of code changes can not always
be fully anticipated, or even accounted for. Most buildings will continue to be designed
using prescriptive codes, for many reasons, including designer familiarity, economy for
simple designs, and ease of implementation. Performance-based designs have significant
design costs and can require negotiation between the design team and authority having
jurisdiction. Social costs including externalities and insurance markets further reduce the
net savings to society. However, performance-based design can result in significant
private and social savings when implemented in a thorough, deliberate manner, taking
into account more than just private costs.
1 Meeks, Carol B and Vincent Brannigan. “Performance-Based Codes: Economic Efficiency andDistributional Equity.” Conference Proceedings of Interflam 96, Seventh International Fire Science andEngineering Conference, Cambridge, England, 26-28 March 1996, pp. 573-580.2 Weber, Stephen F. and Barbara C. Lippiat. “ALARM 1.0: Decision Support Software for Cost-EffectiveCompliance with Fire safety Codes,” NISTIR 5554, December 1994.3 Landefeld, J. Steven and Eugene P. Seskin. “The Economic Value of Life: Linking Theory to Practice.” in“Economics of the Environment, Selected Readings, 3rd Edition.” Robert Dorfman and Nancy S. Dorfman,Ed. WW Norton and Company, New York, NY, 1993.4 Fleming, Joseph. “Code Official’s View of Performance-Based Codes.” Proceedings of Fire Risk andHazard Assessment Symposium, San Francisco, CA, pp. 93-117, 26-28 June 1996.
Documentation of Performance-Based Design
The primary objective of the performance-based design is to resolve the paradox of
building design: maximize safety and cost-effectiveness. The effectiveness with which a
particular design satisfies both requirements measures the value of the design. The value
must be compared to the prescriptive design and shown to either enhance life safety at
minimal cost increase or provide equivalent life safety at substantial cost savings in order
to justify the additional design time and expense associated with performance-based
design. The additional time and expense refers to not only the fire protection engineering,
but also the review by the local authority. The performance-based design must clearly
demonstrate that all facets of life safety have been satisfactorily addressed. This includes
a statement of the problem. The designer, reviewer, and building owner must all agree
which problems are to be addressed by the design. The objectives of the design needs to
be clearly delineated. The design should then address all of the important building
features, building materials, contents, and the appropriate characteristics of the
occupants. The building owner should clearly state his/her fire and life safety goals. The
engineer should then clearly show how the design will satisfy society’s, as well as the
owners, fire and life safety goals. This includes a clear description of the performance
criteria that were selected to assess the fire safety goals and objectives. Satisfaction of
the criteria should be met through a fire safety design approach, further described herein.
This approach includes selection of design fires and fire safety measures. The fire safety
measures range from equipment criteria and performance standards and objectives to
personnel and occupant responses. The performance criteria discuss tenability for
Performance-Based Codes: Economics, Documentation, and Design
15
occupants, active and passive fire detection and suppression features, capabilities, and
performance expectations, compartmentation, fire performance of the structural frame,
the expected extent of fire related damages, from heat and smoke to water, and the
expected time to return to normal business operation. Any design tools and calculations
used to analyze the design should be clearly discussed and referenced. Discussion of
post-design management responsibilities includes material control, change of occupancy
requirements, education and training, and system maintenance and testing. Finally, the
performance-based design should be compared to the prescriptive design in order to
quantify the total expected savings over the entire life of the building resulting from the
performance-based design, the relative, comparative, or absolute contrast in risk to life ,
as well as a comparison of the performance-based design objectives and the prescriptive
requirements. While this list is by no means complete, it underscores the high level of
detail which a performance-based design must address.
Scope of Project Design
The definition of the scope of the project provides a summary of the building
characteristics to an Authority Having Jurisdiction (AHJ), a reviewer, or interested party.
The nature of the project must first be described. The nature of the project characterizes
whether the project is new construction, renovation (including whether or not there will
be a change in occupancy) or upgrade of an existing facility, or repair of a structure
damaged by fire, earthquake, or other event. A general description of both the existing
Jason D. Averill
16
structure (if applicable) and the proposed finished structure frames the discussion. Many
important details must then be delineated in order for the subsequent analysis to occur in
the proper context. These details include the type of construction and building materials,
location and general characteristics of the surrounding properties, fire service location
and response time, determination of the quality of the water supply, security, assumptions
which affect the management, design, or regulation of the building, and any budgetary
constraints imposed during the design and construction process. Each characteristic
combines to define the scope of the project.5
Goals of the Design Process
The goals of a fire safety design must be clearly specified in order that performance
criteria are developed and the overall fire safety of the building is evaluated. A fire safety
goal is a broad statement that reflects society’s expectation of the level of fire safety
provided in a building.6 The fire safety goals must be qualitative, yet allow evaluation
using accepted methods. Examples of goals include, “safeguard people from or illness
when evacuating a building during fire,”7 or “safeguard people from injury due to loss of
structural stability during fire and protect household units from damage due to structural
instability caused by fire.”8 There are two types of fire safety goals: societal goals and
client goals. Client goals are only considered if the goals exceed societal goals. Examples
of client goals, which are not addressed as societal goals, include property preservation,
business continuity, and insurance mitigation. For example, a building may satisfy
Performance-Based Codes: Economics, Documentation, and Design
17
societal goals without a sprinkler system. Adding the sprinkler system may result in lower
insurance, protection of property and increased life safety, as well as decreased likelihood
of business interruption.
Clients of a fire protection engineer can be a variety of people, from architects and other
engineers to building owners or an AHJ. Careful quantification of the goals of the client
increases communication between what the client wants and what the engineer is
delivering. Explicit statement of fire safety goals ensures that the building meets societal
requirements and allows for evaluation of fire safety effectiveness using accepted
methods.
Functional ObjectivesA functional objective is a quantifiable statement intended to satisfy a fire safety goal.
Functional objectives must address both societal and client goals. For example, a societal
goal for a museum may be to ensure that people can safely egress the building in the case
of a fire. A functional objective for this goal may be to “give people not intimate with the
initial fire development adequate time to reach a safe place without being overcome by
the effects of the fire.”9 An example of a client goal may be to provide for business
continuity. The functional objective may be to “protect the piece of equipment in room
X against the effects of fire such that a return to full operation can occur within 24
Jason D. Averill
18
hours.”9 The distinction between a goal and a functional objective is the ready
quantification of the latter.
Performance Criteria and Design Objectives
A performance requirement is a quantification of the level of performance which a
building material, assembly, system, component, design factor, or construction method
must satisfy in order that the building meet the all goals established by society and the
clients. A performance criterion is a metric which building materials, etc., are evaluated
on their ability to meet specific performance requirements. An example of a performance
criteria includes, “the deflection of reinforced concrete structural members shall not
exceed that permitted by ACI 318.”10 The method of performance analysis will
determine the required inputs, including occupancy hazards, construction requirements,
size and geometry of the building, as well and process. Several issues necessary to
identify in performing a proper analysis include the level of accuracy required,
limitations, assumptions, and sensitivity of the method, justification, safety factors, design
redundancies, and a statement of the current design or configuration. Performance
criteria applicable to the present design must be included in the documentation in order
benchmark the evaluation procedure. Subsequently, the design objective is the quantified
statement that satisfies the requirements of the performance criteria. Several design
objectives may satisfy a given performance criteria, depending on the context of the
Performance-Based Codes: Economics, Documentation, and Design
19
application. The following example developed by Meacham9 illustrates the relationship
between each step of the design process.
• The fire safety goal is to protect those people not intimate with thefirst materials burning from loss of life. This is easy to agree with,yet difficult to quantify.
• One functional objective might be to provide people with adequatetime to reach a safe place without being overcome by the effects ofthe fire. One could infer that protection must be provided againstheat, thermal radiation, and smoke.
• A performance requirement may be to limit the fire spread to theroom of origin. If the fire does not leave the room, people outsidethe room of origin will not be exposed to thermal radiation orextreme temperature, and their exposure to smoke will beminimized.*
• One could then establish the performance criterion of preventingflashover in the room of origin. This is based on the fact that firespread beyond the room of origin almost always occurs afterflashover when the upper gases ignite and spread the fire front.
• Finally, to satisfy this criterion, the engineer might establish adesign objective that the upper layer temperature not exceed500°C, a temperature below which flashover is unlikely to occur.
Development of Fire Scenarios and Evaluation of Bu ilding Perfo rmance
A shortcoming of traditional fire scenario development is summarized by the following
warning:
“Keep in mind that there are always fires too severe ornot severe enough to be considered.”11
Fire scenario development encourages the engineer to consider the most common and
most severe fires to be reasonably expected in the particular building. The traditional
* However, as seen in fires such as the MGM Grand and the Dupont, smoke exposure may not be zero andfatalities may result.
Jason D. Averill
20
approach relies substantially upon the judgment of the engineer to determine what the
common and most severe fire exposures are in a given occupancy. ICC performance-
based code approach explores the range of fire scenarios, from small, frequent fires to
high-intensity, very rare fires. Additionally, the graph shows where on the range of
hazard assessment the current design lies and what the factors of safety are, as well as the
relative importance of parameter changes in the design process. In order to develop the
performance curve, however, the engineer must have design tools with which to evaluate
both the range of possible fires as well as whether or not the performance objectives have
been satisfied.
The analysis of where the current design lies along the performance curve should be as
robust as possible. All quantifiable factors which can affect the fire growth rate and fire
spread through the building should be addressed. Meacham9 lists factors which should be
taken into account when developing the likely fire scenarios encountered in the analysis.
• Pre-fire conditions: building, compartment, environmental conditions• Ignition sources: temperature, energy, time and area if contact with
potential fuels• Initial fuels: state, surface area to mass ratio, rate of heat release,
toxicity potential• Secondary fuels: proximity to initial fuels, area, same as above• Extension potential: beyond compartment, building, or area• Target locations: note target items included in societal or client loss
objectives along the expected route of fire and product spread• Occupant condition: alert, asleep, self-mobile, disabled, infant, elderly,
Performance-Based Codes: Economics, Documentation, and Design
21
Design Tools
Many design tools exist to assist the engineer in evaluating the fire safety of a building
and to determine the performance level of the current design. Design tools also allow
iteration of multiple design options to determine the most desirable (often interpreted as
cost-effective) design alternative. The most simple, yet limited, tools available to the
engineer are the correlations, equations, and methodologies compiled by the Society of
Fire Protection Engineers in The SFPE Handbook of Fire Protection Engineering.12 The
handbook is presently in the second edition and is available from the National Fire
Protection Association. Many correlation and methodologies are presented in the
handbook to calculate phenomena ranging from smoke detector activation times to
prediction of second item ignition to design of alarm and suppression systems. Most
equations and methodologies presented contain limitations, which the user must
understand and document when presented in a performance-based environment. Other,
more sophisticated, design tools also exist, the most common being fire models. In
general, two types of fire models exist to predict fire conditions in a variety of
environments: zone and CFD models.
Zone Fire ModelsZone fire models assume that each compartment in the hazard analysis can be divided
into two or more control volumes. Anyone who has observed a compartment fire
probably noticed that often, the hot gases and smoke stayed near the ceiling, while the
Jason D. Averill
22
area near the floor remained cool and relatively smoke-free. Most zone fire models
divide a compartment into these two layers. A commonly used zone fire model is CFAST
(The Consolidated Model of Fire Growth and Smoke Transport), produced by the
National Institute of Standards and Technology’s Building and Fire Research Laboratory.
Presently, CFAST is configured to calculate the fire environment of up to 30
compartments. Experimental results and a comparison to model results for a seven story
building are contained in the CFAST technical reference (Chapter 5 “Verification of the
Model”), although the model has not been verified for 30 compartments.14 Zone models
generally solve conservation of mass and energy equations for transfer between the upper
and lower layers, as well as between compartments should vents exist between them.
Vents include doors, windows, leaks, and HVAC connections. The advantage of zone
modeling of large buildings is that the model input requires relatively little time to set up
and the numerical solver usually takes between a few minutes and a couple of hours to
run, except in highly complicated scenarios where the numerical solver can slow and the
simulation may be measured in days. In theses exceptional cases, the assumptions and
design of the scenario must be evaluated to ensure the integrity of the results. Typically,
many fires and design alternatives can be considered within a short period of time13,14.
Model Input
Zone models require three important inputs: the geometry of the various compartments,
the size of the fire, and the vent flows between each compartment. Compartment
properties can subsequently affect the fire performance of a building. Properties include
Performance-Based Codes: Economics, Documentation, and Design
23
wall, floor, and ceiling materials, combustible contents, and the subsequent performance
characteristics of the materials and structural members upon exposure to a fire.
Compartment geometry is generally limited to rectangular parallelepipeds. While the
number of compartments varies from model to model, simplifications by the model user
can dramatically reduce the number of compartments analyzed. The fire input requires
either the specification of a “standard” t-square fire or a combination of two of either the
heat release rate, pyrolysis rate, or heat of combustion. The specification of the vents is
dependent upon the type of vent. If the vent is either a door or window, it requires input
of the height of the sill and soffit, whether there is a positive or negative wind exposure,
and the width of the opening. Additionally, other parameters may be entered into the
model, such as species yields (CO, CO2, soot, etc.) and detection and suppression
equipment locations.
Model Output
The specific output of a zone model varies between models. Generic parameters,
however, summarize the fire environment. The heat release rate, species yields, including
smoke, carbon monoxide, and carbon dioxide, and the pyrolysis rate all summarize the
characteristics of the fire. The environment within each compartment includes the
oxygen level, upper and lower layer temperatures, heat flux determination to various
surfaces, optical density of the upper layer, calculation of detector and active suppression
device operation, and tenability criteria. A given geometry and fire combination will
Jason D. Averill
24
result in relative levels of importance for differing criteria. Therefore, the measure of a
parameter change can be readily ascertained by a zone model sensitivity analysis.
Limitations of Zone Fire Models
The major disadvantage of the zone-type fire model is the generality and uncertainty of
the results. It is often important during the analysis of a design to determine the exact
result of a small-scale phenomena at a particular location in a compartment. CFD models
predict small-scale phenomena and small regions of compartments much more accurately
than zone-type models. For example, a CFD model will determine the vertical
temperature gradient through the upper layer, whereas a zone model will determine the
average upper layer temperature. Additionally, the uncertainty of the particular result
may be significant. For example, it may be important to determine the temperature at a
given height below the ceiling in the room of fire origin. Since the zone model considers
only an upper and the lower layer, the temperature of the point in question is simply
determined by the location of the point in either the upper or lower layer. A point one
meter above or below, if contained in the same layer, will be reported as the same
temperature. Additionally, the upper and lower layer temperatures are simply averages
across the vertical cross section of the layer. The temperature may vary significantly as
the point approaches the boundary conditions. Another shortcoming of the zone model is
the assumption of instantaneous plume spread upon impingement of the plume with a
ceiling. If a compartment is sufficiently large (a warehouse, for example) or long (a
corridor, for example), the assumption of instantaneous volume filling may be violated. It
Performance-Based Codes: Economics, Documentation, and Design
25
is well documented that a lag time exists between plume impingement upon a ceiling and
arrival of the ceili ng jet at the ends of the corridor. While many
assumptions and limitations exist in a zone fire model, it is ultimately up to the engineer
performing the analysis to understand and document these limitation and ensure that none
of the assumptions have been violated, or that the assumption violation has not
subsequently invalidated the resulting conclusion.
There are several important considerations regarding use of the CFAST zone model. The
first limitation is the fact that all rooms are modeled as rectangular parallelepipeds.
Actual geometry may include irregular shapes and curves. There are a large number of
unknown parameters, each having minor uncertainties. Taken together, however, these
parameters can have a significant effect upon the model results. The following list details
uncertainties associated with fire modeling in general and are not indicative of CFAST
uncertainties in particular:15
• Uncertainty in physical parameters. For example, thermal conductivities,
limiting oxygen percentages, and emissivities.
• Numerical solution techniques. Differential equations solved by the Runge-
Kutta method may yield slightly different answers than differential equations
solved by the Bulisrch-Stoer method. The Newton-Raphson and other
techniques have been shown to exhibit chaos under certain circumstances.
Jason D. Averill
26
• Software error. Even a long-existing zone model such as CFAST is known to
have potentially serious “bugs” in the code. Updates to fix old “bigs” or
improve the model may introduce unanticipated errors.
• Hardware error. The hardware may misinterpret software instructions. The
Pentium chip was documented to contain extraordinarily small calculation
errors. This is most likely the smallest source of error.
• User error. The user may either make an input error or misinterpret the
output.
• Entrainment coefficients are measured experimentally and the associated
predictive equations are empirically derived. Empirical equations are subject
to the boundary conditions of the test methods, which are not always explicitly
enumerated and can subsequently be exceeded or violated.14
• Vent flows are also empirical, although conservation equations generally
bound the errors. Flow through large openings pose particular problems
for orifice flow equations as the boundary conditions break down.
• Smoke concentrations in the lower layer may be underestimated as mixing
along wall, vent, and interface surfaces is not well understood.
• Upper layer temperatures may be overestimated in CFAST as radiation
from the upper layer to the lower layer is not accounted for.
• Additionally, by making the wall and ceiling surfaces adiabatic, energy
normally transferred to bounding surfaces is trapped in the upper layer.
Performance-Based Codes: Economics, Documentation, and Design
27
Clearly, the user must comprehend the equations, variables, and numerical analysis of a
fire model in order to implement it safely in the performance-based code design process.
Computational Fluid Dynamics (CFD)Several computational fluid dynamics codes exist to predict the behavior of a
compartment to a fire environment. Each model solves the Navier-Stokes equations for
the conservation of energy, mass, and momentum for each grid point in a compartment.
Compartment in a CFD model has a different connotation than in a zone-type model, for
CFD modeling allows analysis of small-scale phenomena and irregular shapes. A
compartment, whether it is a duct, or a room, or a warehouse, is divided into thousands of
tiny cubes. Each cube is a control volume. For a given time step, the CFD model will
calculate the heat, mass, and momentum equations for each control volume. In some
codes, it is possible to vary the grid size at different locations in order to more fully
understand phenomena at a given region of a compartment. The cost of such refinement,
however, is often prohibitive. CFD codes can cost thousands of dollars and require days
to complete a single simulation using high speed computers.
Model InputDeveloping the boundary conditions for a CFD model is significantly more complicated
than for a zone-type model. Days are often required to determine the grid spacing,
boundary conditions, material properties, and sub-model parameters necessary to run the
Jason D. Averill
28
model. The cost of increased input flexibility is increased complication and time
expenditure.
Model OutputThe results of a single CFD model simulation can often take days to complete. Once the
simulation is complete, significant post-processing of data is necessary with most models.
The model returns data streams for each control volume at each time step, resulting in
millions of pieces of data, few of which are relevant to the analysis at hand. The learning
curve for CFD modeling is significantly steeper than that of a zone model. However,
small scale results, such as local velocity profile and temperature gradients at a given time
in the simulation can be graphically displayed and lend invaluable insight into the nature
of a fire problem. Additionally, irregularly shaped spaces and situations which are not
well understood intuitively can be explored using a CFD model.
Limitations of CFD ModelsThe most significant limitation of the CFD model is the cost. Conventional CFD models
do not require the sophistication of a pyrolysis or combustion model. The chemistry and
physics of the combustion process is extremely complicated. Thus, CFD models which
predict fire scenarios are significantly more expensive than a conventional CFD code.
Additionally, in business, time is money, and CFD modeling is extremely time intensive,
not only involving human resources, but also involving significant CPU time on big
computers. Additionally, the training necessary to effectively implement a CFD model is
significant. The initial purchase cost of a CFD model is also considerable, often running
Performance-Based Codes: Economics, Documentation, and Design
29
thousands of dollars to commercial customers. Another limitation of the model is that the
output is only as good as the input. Often required parameters are simply not known.
Some of these parameters are critical to the model results. Statistical techniques can
identify the uncertainty and work to reduce it, however this is a limitation of all models.
Small and Real Scale Testing
The application of performance-based design most often occurs in unusual design
scenarios. In circumstances where the building design is generic, economics generally
dictate a prescriptive design. Unusual design scenarios often require information not
generally available in the engineering database. The fire properties of new materials or
the performance of a new fire safety device often requires small or real scale testing in
order to generate or validate data for the modeling process. Additionally, by testing
components of a design assembly, the individual contributions may be identified in order
to determine the relative contributions to hazard assessment. Small scale testing involves
testing of individual or groups of components using apparatus such as the cone
calorimeter or the LIFT. The advantages of small scale testing are twofold. First, small
scale testing is significantly less expensive than full scale testing. Second, individual
materials can be tested to determine their fire properties. Groups of materials may then
be combined to form a composite fire. However, small scale testing cannot determine a
composite fire with the accuracy of large scale testing. Interaction and radiation
feedback between burning objects can significantly affect the fire properties of individual
objects, thus increasing or decreasing the total hazard. A composite fire compiled from
Jason D. Averill
30
the accumulation of individual small-scale tests must have an uncertainty range
associated with it. Large scale testing reduces the uncertainty of the design outcome,
particularly where a battery of tests is performed. Interactive effects can be
demonstrated that may not be anticipated from a compilation of small-scale tests. For
example, in a large scale cubicle fire test, the rate of heat release increases dramatically
when a shelf collapses. This Is because a significant surface area of papers piled on the
shelf is then exposed to fire conditions.17 Large-scale tests, however, are extremely
expensive and time consuming. The net result of small and real scale testing is the
improvement and/or validation of model results which predict the fire performance of the
structure.
Qualifications of the Engin eers
A final component of the documentation is the qualification (certification) of the
engineers performing the analysis. The most important certification is that of the
Professional Engineer (P.E.). The engineering analysis presented in this report was
performed by Jason D. Averill, EIT under the supervision of Richard W. Bukowski, P.E.
(Illinois license 62-32829, Maryland 10202) and Prof. Jonathan Barnett. Professional
licensing is the primary method by which states qualify design professionals. Further,
every state has an ethics code to which the design professionals are bound, that prohibits
practice in area(s) in which the professional is not qualified by training and experience.
Resumes are included in Appendix D.
Performance-Based Codes: Economics, Documentation, and Design
31
5 “Performance Based Design.” Draft Summary of Steps to Perform in a Performance-Based Design compiledby the Society of Fire Protection Engineers.6 Meacham, Brian J. “Concepts of a Performance-Based System for the United States. Report of the 1996Activities of the SFPE Focus Group on Concepts of a Performance-Based System for the United States.”Society of Fire Protection Engineers, Boston, MA, January 1997.7 The Building Regulations, 1992. New Zealand. Clause C3.1.8 The Building Regulations, 1992. New Zealand. Clause C4.1 (a) and (b).9 Meacham, Brian J. “An Introduction to Performance-Based Fire Safety Design” National Fire ProtectionAssociation Research Foundation Fire Risk and Hazard Assessment Symposium, June 23, 1996.10 The BOCA National Building Code, 1993. Section 1604.5.1.11 Draft Version of the Executive Summary of Performance-Based Design Guide. Produced by the IFCPerformance Drafting Committee, September 1997.12 The SFPE Handbook of Fire Protection Engineering. Ed by DiNenno, et al. National Fire ProtectionAssociation: Quincy, MA, 1995.13 Quintiere, James G. “Compartment Fire Modeling.” in The SFPE Handbook of Fire ProtectionEngineering, 2nd Edition. Chapter 3-5. Ed. by DiNenno, et al. National Fire Protection Association:Quincy, MA, 1995.14 Peacock, Forney, Reneke, Portier, Jones. “CFAST, the Consolidated Model of Fire Growth and SmokeTransport.” NIST Technical Note 1299, 1993.15 Beard, Alan N. “Limitations of Fire Models.” Journal of Applied Fire Science, Volume 5, No. 3, 1995-1996, pp. 233 – 243.
Fuel Characteristics of Office Occupancies
One of the most important aspects of analyzing the fire safety of a building is
characterizing the probable combustible contents of the use group. While the case study
building analyzed later contains many different occupants and uses, the largest percentage
of tenants will be classified as an office occupancy. Therefore, determining the fuel
characteristics of the typical office occupancy will help establish probable fire scenarios.
It is important to note that simply characterizing the fuel characteristics of the office
space is insufficient. Spaces such as transformer rooms, storage spaces, and atrium must
also be addressed. The following fuel characteristic description should be repeated for all
appropriate spaces within the building. Table 2 summarizes fuel load densities for many
different occupancies.16 Fuel load density is the average quantity of total heat released
per unit area. There are several distinct fuel packages which represent a potential fire
hazard in an office occupancy.
Work Station FiresThe National Institute of Standards and Technology’s Building and Fire Research
Laboratory, in conjunction with the U.S. General Services Administration, conducted a
survey of typical office fuel packages. The four main fuel packages were determined to
be
1. Reception area furnishings
2. Office furnishings
3. Workstations
Performance-Based Codes: Economics, Documentation, and Design
33
4. Maintenance carts17
The workstations (office cubicles) had the highest rate of heat release. Three
configurations of workstations were tested, each without measuring the effect of
sprinklers: two-sided, three-sided, and four-sided. Each workstation is composed of wall
panels with a shelf assembly, a desk, a chair, a computer terminal and keyboard, and
paper and notebooks. The tests showed that radiation from the wall partitions
significantly augments the peak heat release rate, by a factor of two. The four-sided
workstation demonstrates a fire growth rate approximated by a fast t-square fire until
about 7 MW. The fire load for this particular test is shown in Table 1.
2 Boxes Computer Paper, One on Table, One Under Table 22.7
3 Phone Books 2.3
Newspaper 0.9
Publications 2.3
Paper for Notebooks and Files 29.5
Notebooks and Files 3.6
Total 290.9
Jason D. Averill
34
Table 1: Workstation Fuel Package Components and Weights18
Most new-construction high-rise office buildings in the United States are required by local
law to have full coverage automatic sprinkler systems, installed in compliance with NFPA
13. Therefore, the effect of automatic sprinklers upon the heat release rate of any item or
assembly must not be ignored, as automatic sprinkler systems have a very high degree of
functional reliability. The effect of sprinklers upon workstations was subsequently
studied by Madrzykowski and Vettori.18
Shielded Office FiresAn important characteristic of the fuel load in office buildings is that the arrangement
often includes large surface area objects such as desks and tables which may
subsequently block, or shield, the sprinkler spray from objects which may ignite beneath
the obstruction. While it may be assumed that the fires would eventually be extinguished
by the sprinklers in the absence of shielding, the fuel load characteristics of offices often
includes storage of files, computers, and other combustibles under desks and tables in
order to maximize available space. Lougheed, et al, at the National Research Council
Canada performed small, medium, and large scale fire tests which quantify the effect that
shielding has on the heat release rate of fires in a sprinklered office building.19
Additionally, Madrzykowski and Vettori conducted tests at NIST measuring the heat
release rate of various office assemblies with and without sprinkler activation.18 The heat
release rate data of workstations from the Madrzykowski and Vettori experiments and the
Performance-Based Codes: Economics, Documentation, and Design
35
shielded office furniture fires conducted by Lougheed, et al., can be compared, albeit
with a degree of caution. The goal of the Madrzykowski and Vettori experiments was to
develop an algorithm with which to predict the effect of sprinklers upon the heat release
rate of the fire. Lougheed, et al., attempted to reproduce or quantify the effect of
shielding upon the end state of the fire, including heat release rate, smoke production, fire
spread, and pressure changes within the office.
Other Office Furnishing FiresIn addition to a fully involved workstation scenario, another example of office furnishing
fire is necessary for robustness. Henri Mittler at the National Institute of Standards and
Technology has performed fire tests of photocopy machines.20 While yet unpublished,
the heat release rate data reveals the typical burning pattern of standard office
furnishings. Notice that the peak heat release rate of approximately 1.2 MW is
significantly lower than that associated with the workstation, as the copier fire is a single
unit in isolation.
Jason D. Averill
36
FRACTILEOCCUPANCY AVERAGE*
80% 90% 95%
Dwelling 780 870 920 970
Hospital 230 350 440 520
Hospital Storage 2000 3000 3700 4400
Hotel Bedroom 310 400 460 510
Offices 420 570 670 760
Shops 600 900 1100 1300
Manufacturing 300 470 590 720
Mfg and Storage 1180 1800 2240 2690
Libraries 1500 2250 2550 -
Schools 285 360 410 450
Table 2: Fuel Load Densities for Various Use Group Occupancies
16 Lougheed, G. D., J. R. Mawhinney, and J. K. Richardson. “Draft Version of Probability of Occurrence andExpected Size of Shielded Fires in Sprinklered Buildings – ASHRAE RP-838 – Phase 1.” Report No. A-4201.5, National Fire Laboratory, National Research Council Canada, 16 June 1995.17 Madrzykowski, Daniel. “Office Work Station Heat Release Rate Study: Full Scale vs. Bench Scale.” inConference Proceedings of the Seventh International Fire Science and Engineering Conference, Interflam ’96,Interscience Communications Limited, London, England, 1996, pp. 47 – 55.18 Madrzykowski, Daniel and Robert Vettori. “A Sprinkler Fire Suppression Algorithm.” Journal of FireProtection Engineering, Society of Fire Protection Engineers, Volume 4, No. 4, 1992, pp. 151 – 164.19 Lougheed, G.D., D.W. Carpenter, and J.K. Richardson. “Probability of Occurrence and Expected Fire Sizeof Shielded Fires in Sprinklered Buildings, ASHRAE RP-838 – Phase 2, Full-Scale Fire Tests.” NationalResearch Council Canada, Report No. A-4201.10, 17 January 1997.20 Mittler, Henri. Personal Communication. 1998.
* Fire Load Density in (MJ/m2)
Historical Summary of Major High-Rise Office FiresThe first major high-rise fire in New York City occurred in 1898 at the Home Insurance
Company building. While the fire started in an adjacent building, unprotected glass
windows allowed the fire to spread from the building of origin to the Home Insurance
Company building. Subsequently, New York City required that all new high-rise
buildings contain ¾-hour fire-rated wire glass windows.21 “Design by disaster” is how the
codification process in fire safety is often described. By analyzing the fault structure of a
fire, engineers and code-officials can determine how to design safer buildings in the
future.
High-rise office buildings present unique challenges to a fire protection engineer. The
magnitude of the structures amplifies potential problems. Large numbers of occupants,
the height of the floors above grade level, and the large square footage of each floor
contribute to the fire safety problem. The purpose of this section is to examine three
major high-rise office building fires and determine the failure mechanisms to ensure that
the failure mode is addressed in subsequent high-rise fire safety designs. There are three
major high-rise office occupancy fires which occurred in recent years: One Meridian
Plaza Fire in Philadelphia, PA, First Interstate Bank Building Fire in Los Angeles, CA,
and the Peachtree 25th Building Fire in Atlanta, GA. Each fire will be analyzed separately
and common failure modes will be determined in the conclusions.
Jason D. Averill
38
One Meridian Plaza Fire
The BuildingOne Meridian Plaza is an unsprinklered*, 38-story office building located in Philadelphia,
Pennsylvania. It is the eighth tallest of approximately 500 high-rise buildings in
Philadelphia. Using the 1949 Philadelphia Building Code, the structure was constructed
in 1968 – 1969. The structure consists of protected steel I-beams and concrete over
metal pan floors. The curtain wall is composed of granite slabs set in concrete panels, and
glass. Horizontal members were protected by sprayed-on, cementitious, fire-resistive
material and had a code compliant two-hour fire rating. Importantly, the vertical
members were encased in plaster and gypsum and had a four-hour fire rating, in excess of
the required three-hour fire rating. The building measures 223 feet by 94 feet, which
provides 16,700 square feet of open, non-compartmentalized, leasable space plus 4,000
square feet of core space. The resulting occupancy was approximately 2,500 people.
There are three stairwells, east, west, and central containing a two-hour fire rating. The
standpipe system contains non-regulated pressure reducing valves (prv). Finally, the
electrical system shares a common vertical utility shaft in the buildings core and provided
for no redundancy in power supply.22
The FireThe fire began on the 22nd floor in a private office due to the improper storage and self-
ignition of linseed-soaked rags that were being used to restore and clean wood paneling.
* Only floors 30, 31, 34, 35, and the below grade levels were protected by automatic sprinklers, although acomplete retrofit was planned.
Performance-Based Codes: Economics, Documentation, and Design
39
The fire spread to other combustible materials and furnishings within the office and
subsequently throughout the floor of origin. At approximately 8:23 p.m. on Saturday,
February 23, 1991, the buildings automatic fire detection system alerted a guard and a
maintenance worker located at the first-floor guards desk, as well as a remote, monitoring
service. The remote service called the building to verify the alarm. The maintenance
worker took the building elevator to the 22nd floor, whereupon he was confronted by heat
and dense smoke. By dropping to the floor of the elevator and contacting the guard via
radio, the elevator was brought to the main floor remotely. The fire was not reported to
the fire department until the validity of the alarm signal was verified by the maintenance
worker.23 The first fire department notification occurred at 8:27 p.m. when a person
from the street reported smoke coming out of the building. This resulted in a critical fire
department response delay. Four fire engines, two ladder trucks, and two chiefs
responded to the first-alarm. The building command post was established in the lobby
and the logistics and staging area was established on the 22nd floor.22 By the time that the
first fire fighters reached the floor of origin, they reported that the fire had already
reached the stairway door. Investigators assumed that the fire had spread through the
open area of the floor by that time. The electrical room, located 60 feet from the fire
origin, was compromised early in the fire, resulting in a loss of power, both main and
emergency.23 The main problem confronting the fire department regarding the manual
suppression efforts was the standpipe connections. The pressure reducing vales (prv’s) in
the building were incorrectly installed, through either human error or negligence. The
Jason D. Averill
40
resulting pressure at the nozzle tip of the fire fighters lines was between 40 and 50 psi.
Not only was this insufficient to control the fire, the fire fighters spent significant time
and energy ensuring that there was not a problem with their lines and connections. The
fire spread rapidly to floors above the floor of origin, predominantly by autoexposure
through the curtain wall and flame passage outside the building. The fire suppression
efforts were suspended at approximately 7 a.m. on February 24th, 11 hours after
suppression efforts began, largely due to concerns about the structural integrity of the
building. Eisner and Manning describe the extent of the structural problems:
There was continual movement and cracking in all three towers. In onestair tower, what had been a two-inch crack in the concrete wall hadgrown to a fist-sized opening. Floors had moved as much as three feet. I-beam flanges were cracked. Fire-resistive material on the beams in thestairways had fallen off, and the now-unprotected members were twisting,moving, and starting to elongate. Main structural elements were beginningto fail.22
The burning continued unabated until the 30th floor. Klem reported that, in all, 10
sprinklers activated and controlled the fire. Eisner and Manning, however, reported that
9 sprinklers, 7 along the perimeter and two in the interior of the building activated and
controlled the fire. Regardless of the number, the value of automatic sprinklers has never
been more dramatically displayed.
Failure Modes Contributing to FireThe following failure modes, compiled from the Eisner and Manning report, as well as the
Klem report, contributed significantly to the ultimate severity of the fire:
Performance-Based Codes: Economics, Documentation, and Design
41
• Lack of automatic sprinkler system on the floor of fire origin allowed the fire to grow
unchecked until the fire department arrived. 9 (or 10) sprinkler heads controlled a
fire, which the Philadelphia fire department could not. While not a strictly fair
relative comparison given extenuating circumstances imposed upon the fire
department, it is a valid absolute comparison.
• Rapid vertical fire spread through the curtain wall complicated containment efforts.
• Miscalibrated pressure reducing valves at the fire department connections to the
buildings standpipe reduced nozzle tip pressure to the extent that manual suppression
of the fire was impossible.
• When the building alarm notified the central monitoring station and the building
personnel, they did not immediately notify the fire department as the code requires,
thus causing delay during the critical early stages of the fire.
• Auto-ignition of linseed-soaked rags, or any other hazardous material, is a known fire
hazard and contributed, not only the cause of the fire, but also to the rapid growth and
spread of the fire.
• Falling glass severed many supply lines at the base of the building. This can be
remedied by protecting lines with plywood sheets.
• Primary and secondary (emergency) power should not be routed through the same
vertical shafts unless there is a redundancy built-in at a remote location.
• Open interior access stairways which connect 3 or less floors are allowed by the code.
However, two such stairwells contributed to the rapid vertical spread of the fire.
Jason D. Averill
42
First Interstate Bank Fire
The BuildingThe First Interstate Bank building is the tallest building in the state of California and is
located in Los Angeles. Built in 1973, this unsprinklered high-rise office building
contains 62 above-ground stories, a basement, garage, and pedestrian tunnel. The tower
measures 124 feet by 84 feet and contains approximately 17,500 net square feet of
leasable office space, built around a central core. Estimates of the population of the
building range between 3,500 people24 and 4,000 people25. The frame is structural steel
with sprayed-on fire-resistive cementitious coating. Several articles refer to the quality of
application of the fireproofing and the positive impact it had upon the structural integrity
of the building throughout the fire. The curtain wall is composed of glass and plastic
windows set in aluminum lintels and sills. Fiberglass separated the windows from the
horizontal members. The floor system is lightweight concrete set in fluted steel decking.26
The stairwells contained 1-½ hour rated doors constructed of wood exterior and gypsum
interior. As the wood burned away, the gypsum was left with no structural strength
thereby collapsing when opened.24
The FireThe fire began at sometime between 20:25 and 20:27 at a row of computer workstations.
The first alarm was a detector which activated and notified building authorities at 20:30.
The alarm was subsequently reset by the building monitor as the fire protection systems
Performance-Based Codes: Economics, Documentation, and Design
43
were presently being upgraded and thus prone to false alarm. After numerous other
alarms and resets, a building maintenance engineer was dispatched to determine the cause
of the alarms.24 At 20:37, three separate 9-1-1 calls were received from people outside
the building reporting a major fire at the First Interstate Bank building. 25 At the same
time, the maintenance worker is heard calling for help over the radio system. As the
elevator doors opened onto the fire floor, the car was immediately filled with hot smoke
and gases. Nelson estimates that the smoke temperature the worker was exposed to was
in excess of 260°C (500°F).26 It is important to note that the elevator opening is located
on the opposite end of the floor from where the fire began.24 The body of the
maintenance worker was found at approximately 04:00.
The fire department arrived on the scene at 20:40. There were two major modes of
vertical fire spread: a return air shaft (ras) and an interstitial space between the end of the
flooring and the outer skin of the building. The ras for the HVAC system extended from
the 12th floor (the floor of fire origin) to the mechanical equipment room on the 22nd floor.
As the fire severity increased on the 12th floor, fire damper was overcome and the fire
spread through the ras to the 13th and 14th floors via shaft wall failure.24 The second mode
of vertical fire spread involved the outer skin of the building. Virtually all of the exterior
curtain wall, comprised mainly of glass and aluminum, was destroyed in the fire. The
glass subsequently fell to the ground, where it cut hose lines and presented a hazard to the
fire fighters and public in general.25 This led to autoexposure of the upper floors.
Jason D. Averill
44
Additionally, open space between the exterior curtain wall and the flooring system
allowed rapid vertical fire spread. The fire eventually burned to involve the 12th through
15th floors, as well as part of the 16th floor. Credit is given in all accounts of the fire to the
Los Angeles Fire Department and the heroic efforts they made to stop the fire. A tactical
decision was made to make a stand on the 16th floor. The 16th floor was a logical decision
for many reasons:
• The fire had not yet fully involved the 16th floor.
• Lower fire load than other floors
• High level of compartmentation assisted manual suppression effectiveness.
• Exhaustion of fuels on lower levels.
• Advancement of suppression efforts on lower floors.24
The fire was knocked down at approximately 02:19.25
Failure Modes Contributing to FireThe following failure modes contributed significantly to the ultimate severity of the fire:
• The lack of automatic sprinklers allowed the fire to spread.
• High fuel load, particularly on the 12th floor allowed rapid fire spread.
• Open floor office plan allowed rapid full floor involvement and hampered manual
suppression efforts.
• Personnel checking a fire should never go to the fire floor. Personnel should go two
floors below a trouble alarm and use the stairwells to get to the trouble floor.
Performance-Based Codes: Economics, Documentation, and Design
45
• Delay in notification of the fire department allowed the fire to grow unchecked for an
extended period of time. All alarms should be routed to the nearest fire department.
The early stages of a fire are the most critical relative to ease of suppression.
• Internal access stairs which connect only 2 or 3 floors are a major avenue for the
spread of smoke and fire.
• Stairwell doors composed of wood on either side and gypsum on the inside failed.
The wood was consumed by the fire, subsequently leaving the gypsum interior with
no structural strength.
• One stairwell should always be designated for evacuation and kept clear from heat
and products of fire combustion.
• Fire dampers should be activated on both the inside and floor side of the shaft. Fire
was allowed to spread to upper floors through the return air shaft because the fire
damper had fusible links which activated on the floor side of the shaft and therefore
never closed during the fire.
• Building personnel were not familiar enough with fire procedures and building fire
protection features to adequately assist the fire department incident manager.
Building-specific information should be the responsibility of a building fire safety
director and they should be able to answer any and all questions regarding fire
operations of the building.
Jason D. Averill
46
Peachtree 25 th Building Fire
The BuildingThe Peachtree 25th building is an H-shaped building with two connected 10-story towers.
The population of the building is approximately 1,500 people. Each tower measures
approximately 250 feet by 65 feet, with the connection measuring 70 feet by 80 feet. The
occupancy is mixed (commercial and office) on the first floor, and strictly office on floors
2 through 10. The exit shafts provided 2-hour fire-rated protection, while the doors
provided 1-½ hours fire protection. The exterior of the building is composed of a glass
façade. The interior partitions were non-rated gypsum on steel stud construction. The
wall-finish materials were multi-layer and varied by location. Generally, a combination of
vinyl and/or plywood composed the finish. The fire protection systems included
automatic detection (smoke alarms connected directly to the fire department), building
alarm system activated by manual pull stations, as well as a standpipe system. The
building was not equipped with a sprinkler system.27
The FireThe fire began on the 6th floor of the south tower at approximately 10:30 a.m. Friday,
June 30. The ignition of the fire is attributed to an electrician working on an electrical
switchbox. He was attempting to return power to a section of the floor by replacing a 200
ampere fuse when severe arcing occurred. The arcing had sufficient energy to melt metal
and ignite the interior-finish materials in the hallway. The electrician was severely injured
and would later die, although not as a direct result of the arc, which was estimated to last
Performance-Based Codes: Economics, Documentation, and Design
47
60 seconds or more. This fire scenario involves unique and severe conditions and would
be characterized as a very rare ignition scenario. The fire growth rate was extremely high
and the fire spread was rapid. Multiple layers of wall covering promoted extraordinary
fire spread rates, which is not an unfamiliar fire hazard to fire investigators.28,29 The wall
coverings had completely burned out when the fire department arrived on the floor, only
seven minutes after notification. Occupants of the floor of origin, about 40 initially, were
quickly trapped by the intense black smoke. Most occupants found a room and closed
the door behind them, breaking out windows to vent incoming smoke and waited to be
rescued. At some point, one woman jumped from a 6th floor window and sustained severe
injuries. The fire department was not notified until a manual pull-station was activated by
an occupant of the building from a remote floor, which occurred at approximately 10:30
a.m. Most occupants of the building were leaning out of the windows in order to breathe
when the fire department arrived on the scene at approximately 10:34 a.m. 14 occupants
were rescued via ladder truck and 14 people down the stairwells. In all, five people died
as a result of this fire, the first multiple fatality high-rise office building fire in 17 years.27
Failure Modes Contributing to FireThe following failure modes, compiled from the Isner report, contributed significantly to
the severity of the fire.
• Lack of automatic sprinklers failed to control the spread of the fire. Clearly, the
ignition source was so severe that a fire in the electrical room was inevitable.
Jason D. Averill
48
However, automatic sprinklers may have controlled the fire spread and prevented the
five fire deaths.
• Multiple-layer, combustible interior-finishes contributed to the rapid spread of the
fire.
• The electrician did not follow proper procedure when changing the fuse, resulting in
the arc which ignited the wall linings and electrical equipment.
• Numerous Life Safety Code (LSC) violations may have prevented occupant egress
from the building.
• The common path of travel was greater than 75 feet (140 feet for Suite 600).
• No flame spread tests were performed to determine the performance of the
multiple layers of interior finish used in the building.
• Suite 600 did not have proper fire-rated protection, including door and wall
assemblies.
• Delay in notification played a minor role, as the delay was not long. However, the
growth rate of the fire was very high, underscoring the importance of early
notification of the fire department. Notification should come from the detectors and
not the manual pull stations, as time may pass before someone remembers to pull the
alarm.
• The partitions and doors in the building did not serve as effective barriers against
smoke and heat as most residents trapped in the building were exposed to life-
threatening conditions.
Performance-Based Codes: Economics, Documentation, and Design
49
Common Failure Modes of Major High-Rise FiresAnalysis of the failure modes associated with the three previous major high-rise fires
reveals several recurring themes which should be addressed in future high-rise office
building design projects, particularly when executing a performance-based design. The
first and foremost design solution is installation of automatic sprinklers in all high-rise
office buildings. Jennings investigated the effectiveness of sprinklers and
compartmentation in high-rise office buildings and determined:
“…the presence of sprinklers is very clearly associated with lowernumbers of injuries to firefighters, less damage to building contents, andfewer demands on the fire department in terms of hoselines used,apparatus responding, and time spent on the scene. Fires in high-riseoffice buildings are significantly less severe as measured by the variablesnoted than are fires in non-sprinklered (compartmented) high-rise officebuildings.”30
The effectiveness of automatic sprinklers in protecting life and property is underscored by
the fact that there has never been a multiple-death fire in a high-rise office building which
was fully sprinklered. A study by Powers examined the effectiveness of automatic
sprinklers in fighting high-rise fires.31 Of the 254 high-rise office building fire which
occurred between 1969 and 1978, 96.8% activated five heads or less. Additionally, the
fire department required hose lines in only 20% of the fires occurring in fully sprinklered
high-rise office buildings.
Clearly compartmentation alone is insufficient to prevent the spread of fire. The
Peachtree fire incident contained a relatively high degree of non-rated compartmentation,
Jason D. Averill
50
yet allowed very rapid fire spread. However, the open-floor office plan was cited as a
contributory factor in the severity of the First Interstate Bank and Meridian fires.
Compartmentation works most effectively when coupled with an automatic sprinkler
system in controlling the growth and spread of fire. Thirdly, the design must account for
all modes of vertical fire spread. All vertical ducts, pipe and wiring chases, access stairs,
and cable openings must be protected with fire rated enclosures, doors, or partitions. The
main mode of vertical fire spread in the 1975 World Trade Center fire was through cable
openings in telephone closets that were not firestopped.21 Presently, prescriptive codes
allow open stair connections between three or less floors in a high-rise structure to allow
tenants with multi-floor offices convenient passage. This represents a significant fire
growth path. These stairwells should be equipped with magnetic fire-rated doors that
close upon activation of an automatic detection system.
Each major high-rise fire discussed previously involved delayed notification of the fire
department personnel, which proved integral to development of the fire. Early detection
and notification is a key to fighting fires and removing all occupants from untenable
conditions within the building. Fire is easiest to suppress during the incipient stages. A
typical fire growth rate assumes t2 fire development (where t stands for time). This
stresses the importance of time in the fire development scenario.
21 Smith, Arthur C. “High-Rise Fire Spread: Learn From the Past.” Fire Engineering, Volume 143, No. 11,November 1990, pp. 62 – 63.
Performance-Based Codes: Economics, Documentation, and Design
51
22 Eisner, Harvey and Bill Manning. “One Meridian Plaza Fire.” Fire Engineering, Volume 144, No. 8,August 1991, pp. 50 – 70.23 Klem, Thomas J. “3 Major High-Rise Fires Reveal Protection Needs.” NFPA Journal, Volume 86, No. 5,September/October 1992, pp. 56 – 62.24 Chapman, Elmer F. “High-Rise: An Analysis.” Fire Engineering, Volume 141, No. 8, August 1988, pp.52 – 61.25 Routley, J. Gordon. “Interstate Bank Building Fire, Los Angeles, California.” U. S. Fire Administration,Federal Emergency Management Agency, Technical Report Series, No. 022, 1989.26 Nelson, Harold E. “An Engineering View of the Fire of May 4, 1988 in the First Interstate Bank Building,Los Angeles, California.” U. S. Department of Commerce, NISTIR 89-4061, March 1989.27 Isner, Michael S. “Five Die in High-Rise Office Building Fire.” Fire Journal, Volume 84, No. 4,July/August 1990, pp. 50 - 59.28 Demers, David. “Familiar Problems Cause 10 Deaths in Hotel Fire.” Fire Journal, Volume 74, No. 1,January 1980, pp. 52 – 56.29 Bouchard, John. “NFPA Summary Report on the Holiday Inn Fire, Kearney, Nebraska.” Fire Journal,Volume 76, No. 6, November 1982, pp. 20 – 24.30 Jennings, Charles Robert. “An Effectiveness Comparison of Sprinklers and Compartmentation for High-Rise Office Building Fire Protection as Defined by Local Law 5 (1973) for the Years 1981 – 1985.”Master’s Thesis , City University of New York, February 1990.31 Powers, W. Robert. “Sprinkler Experience in High-Rise Buildings (1969 – 1979).” Technology Report 7– 1, Society of Fire Protection Engineers, Quincy, MA, 1979.
Performance-Based Design: A Case Study
First, the important objectives of the case study will be described. A description of the
selected building as proposed under a prescriptive code is contained in the following
section. Specific design issues and supporting documentation follow. Finally, a first-
order cost-benefit analysis comparing the two designs completes the case study. All
design work is intended as an example of an application of the performance-based code
and is for demonstration purposes only and not intended for actual implementation. A
design team tasked with an entire performance-based design of this building would
complete significantly greater quantity of analysis, including further scenario
development, hazard criteria, and non-life safety issues. Neither the ICC, NIST, WPI, nor
any other involved constituents condone any fire safety design or product contained
herein.
Objectives and Requirements of the Case StudyThe major objective of the case study is to “undertake a performance-based fire safety
analysis and design for a high-rise office building and compare the resulting fire safety
recommendations with those specified by existing prescriptive requirements.”32 Two
distinct comparisons should be made: first, compare the total expected cost over the life
of the building for each design; and second, compare in relative, comparative, or absolute
terms the risk to life for the occupants of the building as well as any associated fire
department personnel resulting from each solution. The performance-based design should
accomplish the following fire and life safety goals:
Performance-Based Codes: Economics, Documentation, and Design
53
• Safeguard permanent and transient occupants from injury due to fire until they can
reach a safe place. This may include self-relocation within the building, self-
evacuation to a safe place outside of the building, evacuation with assistance from the
fire department, or any combination of the above.
• Limit flame spread and thermal damage to the floor of fire origin, and limit non-
thermal damage to the fire floor and one floor above.
• Provide sufficient structural stability to meet the first two goals.
Generic Building Requi rementsIn order to participate in the case study, the selected building must meet the following
requirements as stipulated by conference officials:
• Rectangular shaped office building
• 40 stories above ground and 2 – 3 levels below.
• 3000 m2 per level
• Should be flexible enough to support the following tenant types:
• Law offices
• Accounting and financial firms
• Insurance and brokerage offices
• Software development companies
• Consulting and general offices
• Multi-purpose meeting rooms
• Retail spaces
• Public restaurants
Jason D. Averill
54
• Storage spaces
• Mechanical and equipment rooms
• Sanitary facilities
Building SelectionThe building selected to fulfill the requirements of the case study is presently in the design
phase. Designed by an architectural firm in Dallas, the thirty-one story building is being
designed using the Universal Building Code.33 The building has four underground parking
levels, two floors of retail atrium area, an executive level, a penthouse level, with the
remainder consisting of leasable office space. The present elevator arrangement has six
elevator groups. The first group services the parking garages and the main lobby. The
second group gives express service to the main lobby, lower retail spaces, and the
executive and penthouse levels. The third group is the low-rise bank. This group services
the main lobby area and floors five through fourteen. The mid-rise elevators service the
main lobby area as well as the fourteenth through twenty-first floors. The high-rise
elevators service the twenty-first through twenty-ninth floors as well as the executive
level. Finally, a service elevator serves all floors in the building and will act as the
primary means of building ingress for the fire department operations. Each office floor
contains approximately 3,500 square meters of floor space, including 3,000 square meters
of “leasable” floor space. Leasable floor space denotes the net floor area less the area
consumed by elevators, stairwells, restrooms, and other spaces necessary for building
operations. Appendix E shows schematics of the building designed under the prescriptive
Performance-Based Codes: Economics, Documentation, and Design
55
requirements. This arrangement will be juxtaposed with the final arrangement under the
performance-based regime subsequently.
A minor point to note when comparing the design of the prescriptive building and the
design of the performance-based building is that the performance-based building was
designed as a 40 story above grade building, while the prescriptive building was designed
as a 31 story above grade building. Nine stories were added to the original building
design in order that the design satisfy the requirements of the case study. Three stories
were added to the low-rise, mid-rise, and high-rise portions of the building. See Appendix
E for a graphical schematic of the prescriptive and performance-based design elevations.
The addition has little impact upon the final design calculations of the building, save
egress and the subsequent changes to the building design where life safety concerns due
to the longer egress times warranted design improvement.
ICC Performance-Based CodeThe ICC Performance-Based Code34 is built upon a pyramid of increasing specificity.*
Each section of the code begins with a general statement of objective. Forming the base
of the pyramid, the objective states the overall goal of the section and is very broad. One
step up in the pyramid of codification, the functional statement provides a higher degree
of evaluation. The functional statement gives specific goals contained within the scope of
the original objective, yet lacks the detail of a performance requirement. The
* The original premise of the ICC Code comes from the New Zealand building code. See endnote 7.
Jason D. Averill
56
performance requirement is the detailed design objective of an engineer. This case study
concentrates on satisfactory accomplishment of the performance requirements.
Performance RequirementsThe design alternatives are concerned mainly with satisfaction of the performance
objectives related to the fire safety of the building design. In order to prove that the
performance-based design is safe, the design must demonstrate satisfactory fulfillment of
the functional objectives of each section of the ICC Performance-Based Code.
Regarding fire safety, there are several applicable functional objectives.34
Means of Egress
Means of egress shall give people adequate time to exit the building, orreach a safe place without exposure to untenable conditions and giverescue personnel adequate access to undertake rescue and emergencymanagement operations.
Fire Growth
Buildings shall be designed with safeguards against the spread of fire sothat:• Occupants have sufficient time to escape without being overcome byfire and smoke.• The building, adjacent building, and their occupants and amenities areprotected from the spread of fire and smoke.• Fire fighters can perform rescue operations, protect property, andutilize controls and fire fighting equipment and controls.
Structural Stability During Fire
Buildings shall be constructed to maintain structural stability during fireto allow people adequate time to evacuate safely, allow adequate time to
Performance-Based Codes: Economics, Documentation, and Design
57
undertake rescue operations, and avoid damage to or loss of amenity ofadjacent properties or structures.
Emergency Notification
Where required, adequate means of occupant notification shall be bymeans appropriate to the needs of the occupants the use of the buildingand the emergency egress strategy employed.When required by the anticipated use of the building, notification systemsshall be capable of alerting sleeping occupants in reasonable time toenable them to reach a safe place before the occurrence of untenableconditions at any point along the primary egress path.
Fire Detection Systems
Where required, fire detection systems shall be designed to activatebefore a fire reaches a size that represents an unreasonable hazard to thebuilding or occupants of the building itself.
Elevators and Conveyance Devices
Elevator and conveyance device installations for access into, within, andoutside of buildings shall provide for the safe movement of all peopleincluding those with disabilities and for firefighters during emergencyoperation as well as for the safety of maintenance personnel.
Each of the preceding functional statements relating to the fire safety of the
building design shall be addressed within the context of the performance-based
design case study. Note that structural, mechanical, and project management
issues are beyond the scope of this project.
Jason D. Averill
58
Performance-Based Design AlternativesSome designs proceed are initiated as performance-based building designs. This
particular application, however, is an optimization of a prescriptive design using the
flexibility afforded by performance-based codes. In order to demonstrate the versatility
and cost-effectiveness of a performance-based design, the project team chose three major
design alternatives with which to perform a performance-based analysis. The first
alternative is the use of the elevators to evacuate occupants in case of a fire or other
emergency. The theory governing elevator evacuation is described in the section titled
“Elevator Evacuation.” The second alternative is the infusion of new alarm and
suppression technologies. While infusion of new technology is not in itself challenging in
a performance-based environment, documentation proving that the technology will
provide equivalent or better safety than would otherwise exist in the prescriptive design
challenges statistical and computational comparisons. Finally, the domestic and sprinkler
water supplies have been combined. Two critical components of the performance-based
design will be explored. The first component is the documentation of each design
alternative. Documentation includes explicit descriptions of all goals, objectives,
calculation tools, assumptions, etc. The second component is the economic analysis of
the total life-cycle cost of both the prescriptive and performance-based design options.
Performance-Based Codes: Economics, Documentation, and Design
59
Elevator EvacuationUsing elevators to evacuate people has been an idea long in coming. Arguments for
elevator evacuation first appeared in 1974 with an article by Bazjanac35 which suggested
that elevators be used to evacuate occupants, particularly the elderly and people with
disabilities. He also points out that “though stairways are designed for safety, they are
rather conducive to panic.” Many articles evaluating the strengths and more importantly
the weaknesses of elevator evacuation have been published in the interim. The following
section discusses the engineering aspects of an elevator assisted evacuation plan.
Appendix A includes the calculation procedure for determining elevator travel time.
Design Issues Regarding Elevator EgressDesign of Elevator LobbyAs occupants may wait for short periods of time in the elevator waiting lobby when using
the elevators to egress a building, the lobbies must be impervious to the effects of a fire
outside of the lobby. There are three major design issues: protection from heat, radiation,
and smoke. The elevator lobbies must be designed as areas of refuge. The Life Safety
Code and the U.S. Department of Justice Americans with Disabilities Act describes an
area of refuge. Particularly important is the proper design of areas of refuge in
unsprinklered buildings. In a 1992 study by Klote, Nelson, Deal, and Levin, the authors
concluded that the “operation of a properly designed sprinkler system would eliminate the
life threat to all occupants.”36 However, given that sprinkler systems are not 100%
reliable, qualifying the elevator lobby as an area of refuge is an appropriate redundancy.
Jason D. Averill
60
NFPA 101 Chapter 5, while specifically forbidding the use of elevators as the main egress
component in large commercial buildings does provide important recommendations
regarding the design of elevator lobbies.
Lobby SizeThe population density of an elevator lobby should be 3 square feet per person, plus one
30 inch by 48 inch area for a wheelchair for every 50 people37. Stairwells will continue to
be the primary means of egress for most occupants of a building for a variety of reasons,
including the decades-long public awareness campaign against using elevators in the
event of an emergency, the feeling of control occupants experience when using the stairs
versus using the elevators because occupants are not relying on a mechanical system and
they do not have to wait in a lobby for the elevator to come. Thus, the lobby will be sized
to accommodate 50% of the population of a floor.
Passive Fire ProtectionPassive fire protection is defined by Fitzgerald as a building component that remains fixed
in the building whether or not a fire emergency exists.38 An example of a passive fire
protection feature is a rated barrier. The barrier does not require manual or automated
activation to provide protection, hence eliminating the possibility of activation failure that
exists in active fire protection systems. Elevator lobbies require several passive fire
protection features. The first feature is a rated barrier that prevents the spread of fire,
smoke, and other products of combustion. The Uniform Building Code (UBC) does not
require rated fire barriers for elevator lobbies.39 Given that elevator lobbies are not part
Performance-Based Codes: Economics, Documentation, and Design
61
of the egress system as far as the UBC is concerned, the lack of lobby protection is not
surprising. For new construction, NFPA 101 requires a one-hour fire rated barrier to
protect the elevator lobby, unless the entire building is protected by a sprinkler system.40
However, given the relatively high benefit/cost ratio of a 1-hour rated barrier, serious
consideration should be given to protection of the elevator lobby when the elevators are
to be considered the major secondary egress means. An additional passive fire protection
feature is the protection of all penetrations into the lobby. NFPA 101, Section 6-3.6
stipulates the requirements for the protection of all penetrations from smoke entry.
Active Fire ProtectionThere are several active fire protection components that help insure the fire-safe integrity
of an area of refuge. An active fire protection feature is a feature of the building that
requires either manual or mechanical activation in order to participate in the building fire
safety process. The first component is the lobby pressurization system. The second
component is the smoke dampers. Finally, the alarm and suppression systems must
activate to ensure the safety of the area of refuge. Each component of the active fire
protection system must be activated and is subsequently susceptible to activation failure.
While failure rates are quite low, they must be accounted for in an analysis of total
building fire safety.
Klote41 discusses the pressurization of an area of refuge, which can be applied to
protecting elevator lobbies during elevator evacuation. The prescriptive requirements
Jason D. Averill
62
stipulate 12.5 Pa positive pressure difference for areas of refuge. Lougheed, et al., state
that “…in most cases, a minimum design pressure of 7 Pa would be sufficient.”16 It is
important to note, however, that the Lougheed, et al., recommendations were based on
experimental studies of sprinklered fires.
Indirect pressurization of an area of refuge involves a fan pressurizing the elevator shaft,
which then overflows into the attached areas of refuge. Direct pressurization, on the
other hand, requires a fan to be attached directly to the areas of refuge. Pressurization of
the area of refuge must account for several additional pressure effects including elevator
movement, wind pressures, and fire effects. A piston effect is created by an elevator
moving in a shaft. As an elevator moves through an elevator shaft, the column of air in
the direction of travel is compressed. Subsequently the air mass in the opposite direction
has a lower pressure. The wind can create pressure differences between the windward
side of a building and the leeward side of a building. If the outside temperature is notably
different from the temperature inside the building, the air within the shaft can move up or
down due to density differentials. If the outside temperature is colder than the interior
temperature of the building, for example, then the warm interior air entering the shaft will
rise. If, however, the outside temperature is distinctly higher than the air-conditioned
inside temperature, then the interior air mass will descend the elevator shaft. Each of
these factors must be accounted for in the design of a positively-pressurized elevator
lobby.
Performance-Based Codes: Economics, Documentation, and Design
63
Smoke dampers are required in an area of refuge in order to prevent the HVAC system
from introducing smoke into the compartment. A smoke damper simply closes a vent
opening between the area of refuge and any adjoining compartments and is generally
activated by the alarm system. Finally, the detection and alarm system must protect the
area of refuge if either the pressurization system fails and sufficient smoke or heat is
introduced into the area to exceed the alarm criteria of the smoke detectors or the
sprinklers, or the compartment of fire origin is the area of refuge. If hazardous conditions
are detected in the area of refuge, the elevator will not open onto that floor. The
occupants must use the stairwells to either proceed to the discharge level or proceed to
another floor where they can use the elevator.
Phased EvacuationHigh-rise buildings present a unique scenario regarding the evacuation of occupants.
Conventional low-rise structures can evacuate the entire building at one time without
exceeding the design parameters of the evacuation system. Each stairwell in a low-rise
structure handles few occupants and additional exits can be added to the building design
at relatively low cost. High-rise buildings, however, employ fewer stairwells per capita
occupant. If the entire building were to be evacuated upon fire alarm activation, the
egress system would quickly become inadequate and the occupants most intimate with
the fire would be exposed to hazardous conditions for an extended period. Therefore,
phased evacuation is often employed in the design of egress systems in high-rise
buildings. Phased evacuation involves evacuating only the occupants of the building
Jason D. Averill
64
deemed to be in immediate danger. The general rule regarding the phased evacuation of a
high-rise building is to evacuate the floor of fire origin, one floor above the fire, and one
floor below the fire. This allows the occupants in the immediate vicinity of the fire to
have priority access to the stairwells and elevators. The fire department incident
commander, upon arrival to the fire grounds and appraisal of the situation, can then
determine whether it is necessary to evacuate any other occupants of the building on a
floor-by-floor basis. Further evacuation is accomplished via floor-by-floor
announcements giving further instructions.
Elevator Egress System Integrity AssuranceIf the elevator system is to be used as an integral, non-replaceable component of the
egress system, the elevators must be designed against systemic failure. Every system
element must have either built-in redundancy or a statistically low failure rate. The
quantification of an acceptable failure rate must be agreed upon either by industry
consensus or by agreement between the designer, owner, and authority having
jurisdiction.
Several components of the elevator integrity assurance system require attention. The first
and foremost requirement is that the elevators must have power in order to operate.
While main electrical power should be protected against failure, fire scenarios often
involve the electrical system, either as the origin of the fire (Peachtree fire)27 or as an
incidental fuel source (Meridian fire).22 A failure mode of the Meridian fire was the use
Performance-Based Codes: Economics, Documentation, and Design
65
of a common vertical shaft for both the main and emergency power supplies. If the fire
penetrates a common shaft, the redundancy provided by having a reserve supply is
negated. Emergency power should be supplied to the elevator system and provide the
same level of reliability as the supply to the lighting (emergency) and alarm system.
Power is also integral to maintaining the tenability of the elevator lobby and shaft, as well
as the continued operation of the alarm and occupant notification system.
The computer which controls the phased evacuation operation of the elevators must be
functioning correctly during the emergency situation. Therefore, the room where the
computer is stored and all associated hardware and circuitry must be protected from
injury. It may be desirable to have an off-site backup computer should the main system
need maintenance or should there be a system failure. All emergency scenarios must be
accounted for, such as emergencies on multiple floors, potentially remote from each
other, fire department override, etc. The elevators will not stop on the floor if the alarm
system has detected a fire or hazardous conditions in the lobby that the elevators open
into. This will prevent the exposure of elevator occupants to untenable conditions, such
as happened in the First Interstate Bank fire.25 The probability of untenable conditions in
the elevator lobby is low because several factors should mitigate growth and spread. First
is the presence of an automatic sprinkler system. The sprinkler should suppress or control
any fire in the lobby. Second, the fuel load in the elevator lobby is very low. If there is
no fuel for the fire to consume, the fire cannot grow or spread. Finally, the lobby is
Jason D. Averill
66
highly compartmentalized from the rest of the floor, therefore the probability of fire
extending from the lobby is extremely low.
Water from manual and automatic suppression efforts may be introduced into the
elevator lobby, either from a fire inside or outside the lobby. Either scenario presents a
unique hazard to the elevator egress system, although the fire inside the lobby certainly
represents the more severe of the two. A fire inside the elevator lobby area will expose
the elevator shaft to both water from the automatic sprinkler system (assuming that the
fire grows large enough to activate the fusible links in the sprinklers) as well as products
of combustion. A drain will be installed in each elevator lobby to collect any water from
the automatic or manual suppression efforts. The drain can be connected to the test and
drain pipes that are located in the stairwells for the domestic/sprinkler water supply.
Additionally, a small lip at the entrance to each elevator will prevent help prevent excess
water from overflowing into the elevator shaft. The alternate scenario, a fire located
outside the elevator lobby presents a smaller problem. Products of combustion should be
prevented entry into the lobby due to positive pressurization of the elevator lobby. Water
from either manual or automatic suppression systems should be largely prevented entry
into the lobby due to the walls and doors.
Upon activation of the fire detection system inside the elevator lobby, dampers close in
the ductwork and the HVAC system is shut down. These dampers are closed
electronically and should be activated on both the floor side of the duct and the inside of
Performance-Based Codes: Economics, Documentation, and Design
67
the duct. This will prevent vertical fire spread through the HVAC system, such as
happened in the First Interstate Bank fire.25 Mechanical devices such as fusible links are
not dependent upon power supply or manual activation and are therefore unlikely to fail.
With the elevators programmed not to stop on the floor once a trouble alarm in the
elevator lobby is reported and fires spread beyond the boundary of the lobby highly
improbable, a fire in an elevator lobby will have a very low probability of occupant
injury.
32 “Case Study Specifications for 2nd International Conference on Performance-Based Codes and Fire SafetyDesign Methods.” Memo to all participants of the conference.33 Uniform Building Code. International Conference of Building Officials, Whittier, CA, 1994.34 ICC Performance Based Code. Draft Version, March 17, 1998. Published by the International CodeCouncil.35 Bazjanac, V. “Another Way Out?” Progressive Architecture, April, pp. 88-89.36 Klote, J.H., H.E. Nelson, S. Deal, and B.M. Levin. “Staging Areas for Persons with Mobility Limitations.”NISTIR 4770. Gaithersburg, MD, 199237 Life Safety Code, 1997 Edition. NFPA 101, Chapter 5-2.13.2.2.38 Fitzgerald, Robert W. “Building Fire Safety Engineering Method, Draft.” Worcester Polytechnic Institute,Worcester, MA, 1993.39 Uniform Building Code, Section 3002, Elevator and Elevator Lobby Enclosures.40 Life Safety Code. NFPA 101, Chapter 5.2.12.3.4.41 Klote, John H. “Design of Smoke Control Systems for Areas of Refuge.” ASHRAE Transactions, Vol. 99,Pt. 2, 1993, pp. 793 – 807.
Stairwell EvacuationWhile elevator evacuation greatly decreases total evacuation time for a high-rise office
building, the most effective egress times are achieved using a combination of elevator and
stairwell evacuation routes. There are several reasons that stairwells must continue to
exist in high-rise buildings. The first reason is that, however unlikely, the possibility
exists that the elevators will be unusable during an emergency. This could be due to a fire
in the elevator lobby, mechanical failure, or other reason. Stairwells are passive egress
and thus are not susceptible to mechanical failure, except where pressurization is vital to
tenability maintenance. Secondly, the decades-long public education campaign has
engrained in people the fear of using elevators in a fire emergency. Thus, in spite of
education and signage to the contrary, people may still be predisposed to stairwell
evacuation. Finally, fire department procedures for high-rise fire attack in many cities
dictate that staging occur two floors below the lowest fire floor and firefighters
subsequently climb the remaining two stairwells and attack the fire from the stairwell
doors.42,22,25 Thus, it is necessary to accurately model evacuation times by people using
the stairwells.
Factors Affecting Total Egress TimeJake Pauls introduces the principle components of people movement in the 2nd Edition of
the SFPE Handbook.43 Density, speed, and flow are the fundamental characteristics of
crowd movement. Density is the number of people per unit area. Speed is the distance
traveled per unit time by an occupant. Flow is the number of occupants that pass some
reference point per unit of time. Finally, a limiting factor influencing the flow is the
Performance-Based Codes: Economics, Documentation, and Design
69
minimum width which a flow must pass through, measured in unit of length. The
fundamental traffic equation is given as:
widthdensity speedflow ××=
Equation 1
It is important to note the interactions between the variables. For example, beyond a
critical point, as density increases, speed decreases. The motion of walking becomes
more constrained until the density reaches the point where people can only shuffle along.
Additionally, as the width of the smallest restriction decreases, the subsequent flow
through that restriction decreases. Fewer people will flow t hrough a 56 cm (22 inch)
doorway than will flow t hrough a 91 cm (36 inch) doorway. Table 3 shows crowd
Table 3: Crowd Movement Characteristics for a Typical Corridor
There are egress time delays associated with evacuation initiation. Notification is the first
variable in the process of evacuating a building. People will not move unless they are
aware that there is an emergency. The recognition of a fire event and decision to act
Jason D. Averill
70
upon ambiguous information is often retarded by the presence of others. 44 Latane and
Darley performed experiments that showed a significant activity delay when test subjects
had other people in the room versus test subjects alone in a room upon introduction of
smoke into the test room.45 Alarm technology, particularly where voice enunciation
exists, has been shown to reduce occupant response initiation. The voice enunciation
system, however, must be audible to all occupants, lest misunderstanding of instructions
occur.46 Recall that the cybernetic building system provides occupants who may not
understand instruction (mentally handicapped, deaf, or those who do not understand
English) with pagers that let them know to evacuate the building. Occupants often
investigate the source of a fire, either to attempt suppression or to verify actual
emergency conditions. However, occupancy type has an effect upon the pre-fire
activities. Occupants of an office building exhibit lower initiation times than people
leaving their residences. The reasons for this are many: people evacuating homes and
apartments often gather personal belongings, get dressed, gather children or other family
members, whereas there are relatively few obligations to be tended to in a work place.
Finally, the simple act of making a decision can account for additional evacuation delay.
Proulx reports that for an apartment building where 100% of the residents hear the alarm
signal, 59% of the residents have left their apartments within the first two minutes.47 Two
minutes represents a reasonable extrapolation to office buildings for two reasons: first, the
number will be conservative, as occupants of offices act sooner than occupants of
apartments, for the reasons mentioned previously. Second, it is not necessary for 100%
of the occupants to begin evacuation in order to use a delay time. The residents who
Performance-Based Codes: Economics, Documentation, and Design
71
begin in the third or fourth minute, for example, will simply be added to the end of the
queue, as if they had begun evacuation at two minutes, provided that there is sufficient
queuing.
Once in motion, occupants must still determine the most efficient evacuation route. This
is often referred to as “way-finding.” Inefficiencies exist because occupants often choose
to leave by the same means they entered the building.47 This may result in exit
imbalance, where some exits are overtaxed and some exits are underutilized. Time delays
also exist at merge points, where flows must stop and restart.48 Several factors can
mitigate initiation and activity delays. Occupant education is clearly a critical factor. In
high-rise office evacuation studies conducted by Proulx at the National Research Council
Canada, she noted that some occupants chose the familiar route, talked with friends, and
were confused about the outside meeting point, while other, more informed occupants,
chose the nearest exit and started evacuating immediately, directing others along the
way.49 The total inefficiency associated with less than optimal evacuation must be
quantified to account for all of the above factors. MacLennan found that actual egress
times were in the range of twice the modeled egress time when an efficient system was
present.48
Jason D. Averill
72
Computer Modeling of People MovementComputer modeling of egress times is an inexact science. While computers can predict
how people may move under ideal conditions, there are several assumptions that must be
identified in order to have confidence in the results. A major assumption of any computer
model is that people will behave rationally. A computer cannot predict whether people
will stay to finish what they are working on, collect personal belongings, investigate the
fire, or warn other people. Nelson and MacLennan, in recognition of the tendency of
egress models to underestimate egress time, proposed the following equation to adjust for
inefficiencies:48
dmeae TeTT +=
Equation 2
where:
evacuation initiatingin delay theis T
cyinefficien evacuationapparent theis e
timeevacuation modeled is T
timeevacuation actual is
d
me
aeT
Thus, computer modeling represents a significant fraction of the evacuation time,
although, not a complete assessment. While several computer models exist to evaluate
egress time,50,51,52 one model (EVACNET+) will be analyzed and held as a representative
example.53
Performance-Based Codes: Economics, Documentation, and Design
73
EVACNET+ is a node-arc network model that determines the “fire-drill” evacuation
time. “Fire-drill” evacuation time is the minimum evacuation time which the occupants
may egress a building. Each space in the building through which the occupants may pass
must be entered as a node. The input for a node includes the number of people which
start the simulation within that particular node and the capacity (or maximum number of
people which may be contained within the node). The input for an arc requires a
beginning node and an ending node, a dynamic capacity (DC), and the traversal time
(TT).
0014.0×××= SPTPAFVWRDC
Equation 3
where: DC is the dynamic capacity of the arc (people/time period)
WR is the minimum width encountered along the arc path (in)
AFV is the average flow volume (people/ft-min)
SPTP is the number of seconds per time period (s)
SPTPAS
DISTTT
60×=
Equation 4
where: TT is the traversal time (s)
DIST is the distance between the beginning of end of the arc (ft)
AS is the average speed (ft/min)
There are several assumptions and limitations of EVACNET+.
Jason D. Averill
74
1. The program is a linear modeling system. Arc capacities and arc traversal times do
not change over time and do not depend on the arc flows.
2. Smoke and fire have no effect upon the evacuation time.
3. The program does not consider behavioral aspects of occupants. Behavioral aspects
include evacuation initiation delays, impaired evacuation of handicapped population,
and fatigue associated with long travel distances.
4. The program views all occupants, not an individual occupant.
5. Initial location of all individuals must be assumed.
6. Traversal times are rounded off to the nearest whole number. The calculated egress
time, therefore, is very sensitive to the chosen time step (seconds per time period).
7. The total evacuation time will be the lower bound of egress times.53
Thus, accounting for the limitations and assumptions of EVACNET+, the modeled
evacuation time can be determined. Using Equation 2, a reasonable and conservative
total evacuation time can be derived which should ensure safe building design.
42 Boston Fire Department Standard Operating Procedure No. 1. High Rise Buildings. Published by theBoston Fire Department, Boston, Massachusetts.43 Pauls, Jake. “Movement of People.” in The SFPE Handbook of Fire Protection Engineering, 2nd
Edition. DiNenno, et al., Ed. National Fire Protection Association, Quincy, MA, 1995, pp. 3-263 – 3-285.44 Bryan, John L. “Behavioral Response to Fire and Smoke” in The SFPE Handbook of Fire ProtectionEngineering, 2nd Edition. DiNenno, et al., Ed. National Fire Protection Association, Quincy, MA, 1995, pp.3-241 – 3-242.45 Latane, B. and J. M. Darley. Journal of Person. and Soc. Psych. Volume 10, 1968, page 215.46 Proulx, Guelene. “The Time Delay to Start Evacuating Upon Hearing a Fire Alarm.” 38th Annual Meetingof the Human Factors and Ergonomics Society, Nashiville, TN, October 24 – 28, 1994.47 Proulx, Guylene. “Evacuation Time and Movement in Apartment Buildings.” Fire Safety Journal, Volume24, 1995, pp. 229 – 246.
Performance-Based Codes: Economics, Documentation, and Design
75
48 Nelson, Harold E. and Hamish A. MacLennan. “Emergency Movement.” in The SFPE Handbook of FireProtection Engineering, 2nd Edition. DiNenno, et al., Ed. National Fire Protection Association, Quincy,MA, 1995, pp. 3-286 – 3-295.49 Proulx, Guylene. Abstract for “Comparison of Occupant Behaviour During Office and ApartmentEvacuations.” National Fire Protection Association Fall Meeting, Nashville, TN, 1996.50 Cooper, Leonard Y. “Estimating Safe Available Egress Time From Fires. Final Report.” NBSIR 80-2172;February 1981.51 Stahl, F. I. “BFIRES-II: A Behavior Based Computer Simulation of Emergency Egress During Fires.” FireTechnology, Vol. 18, No. 1, February 1982, pp. 49 – 65.52 Levin, B. M. “EXITT--A Simulation Model of Occupant Decisions and Actions in Residential Fires:Users Guide and Program Description.” NBSIR 87-3591; July 1987.53 Kisko, Thomas M. and Richard L. Francis. “EVACNET+: A Computer Program to Determine OptimalBuilding Evacuation Plans.” Fire Safety Journal, Volume 9, No. 2, 1985, pp. 211 – 220.
Cybernetic Building FeaturesA critical component of the fire protection system that protects a building from
emergencies is the cybernetic building system. The cybernetic building system consists of
sensors and monitors located throughout the building which are coordinated by a central
computer. Recent advances in alarm technology allow real-time monitoring of the fire
through wireless digital feedback from sensors placed throughout the building. These
sensors include measurements of temperature, optical density, and gas concentrations.
While the technology does not presently exist in a marketable form, these new
technologies will be analyzed to demonstrate the flexibility of a performance-based
design to new technologies. Sensor data, in addition to video monitoring, allow trained on-
site personnel as well as members of the response team to more accurately gauge an
appropriate response to the emergency. Computer fire models can process the incoming
information and predict likely progress of fire scenarios faster than real time in order to
assist the response team.
Temperature data in each room of the building at throughout the corridors and common
spaces help determine the heat release and growth rates of the fire. Engineering analysis
can determine the number and location of the sensors in each compartment. The sensor
data and location can be combined with the geometry of the room to determine whether
the fire should sound an alarm and help predict the growth rate of the fire. The
temperature sensors can be part of a typical heat detector which can activate the alarm
system. More sophisticated temperature measurements can result in substantial cost
savings over the life of a building when combined with the environmental regulation
Performance-Based Codes: Economics, Documentation, and Design
77
system. Temperature sensors which can detect the presence of a person in the room can
then adjust the environment accordingly. For example, a room that has not been
occupied in ten minutes can have the lights turned off, temperature adjusted, and other
energy saving techniques implemented. Additionally, this data can be invaluable to a
rescue effort, as the fire department can concentrate rescue efforts on rooms that are
known to be occupied.
Smoke data can be monitored by smoke detectors. While presently smoke detectors
alarm at threshold smoke concentrations using ionic or optical measurements, variant
current flows can indicate transient optical conditions. Multiple smoke measurements can
then measure the height of the layer interface and the optical density at different
locations. Additional gas analysis, as part of a more sophisticated detection system, can
monitor levels of oxygen, carbon monoxide, and carbon dioxide. All this information can
be relayed to a remote monitoring station, which can predict future fire conditions and
direct fire suppression efforts. Conditions, such as the pre-backdraft environment may
save fire fighters lives. Such predictive capabilities are foreseeable in the medium to long
range future.
Finally, monitoring of various building systems will increase the probability of the systems
performing as designed. Periodic flow testing of a sprinkler system will detect
obstructions, closed valves, and other failure mechanisms that decrease the reliability of a
sprinkler system. Automation of testing procedures can increase the frequency of the
Jason D. Averill
78
testing resulting in systems that are more reliable. When water does flow through the
system, flow meters can determine the quantity and location of the open sprinklers, which
can be relayed to the computer to increase the accuracy of the model predictions.
Combined Sprinkler and Do mestic P ipingCombining the sprinkler and domestic water supply piping is the ideal project for the
application of a performance-based design. Not only does the combination increase the
reliability of the system and safety of the occupants, the design results in substantial cost
savings to the owner, realized through lower material and installation costs, as well as
increased construction schedule efficiency. These are cost savings and increases in life
safety that would have been unrealized in a prescriptive regime, barring code variance
approval from the authority having jurisdiction. It is important to note that the domestic
water supply and the sprinkler water supply are completely separate entities.
Prescriptive Design Sprinkler SystemThe sprinkler system piping is divided into two sections, the low-rise and the high-rise
systems. The low rise system has main six inch risers running through each of the
stairwells. At each floor level, inside the stairwell, a standpipe connection is provided for
the fire departments suppression operations, as required by code. The low-rise sprinkler
portion uses a 6-inch riser with test and drain connection every even floor. The system is
looped at the 14th floor to provide redundancy. The high-rise portion of the system uses
an 8-inch riser through both stairwells until the 14th floor at which point they are looped
with a 6-inch connection. From the 14th floor to the penthouse level, 6-inch risers ascend
each stairwell with test and drain connections located at the even floors. The connection
to the street is provided by a 12-inch pipe which splits to supply the high- and low-rise
sprinklers. Both the low-rise and high-rise sprinkler sections are assisted by a dedicated
fire pump and jockey pair. The garage levels, located below grade and exposed to a large
range of temperatures, are supplied by a dry-pipe sprinkler system with pre-action
Jason D. Averill
80
equipment. The system was designed using the UBC Standard 9-1 as the prescriptive
standard.
Performance-Based Codes: Economics, Documentation, and Design
81
Fire ScenariosAs the building owner has specified a multi-occupancy building, special fire scenarios
specific to particular occupants will exist. Fire scenarios and building design features
Operational Performance Levels: Fire EventThe second of the three performance criteria given a fire event is the operational end
state of the building. The four acceptable end states are described below and are
acceptable according to the use group of the building and hazard level experienced.
Fully Operational: Non-structural and thermal damage should be minor.
Those non-structural systems required for normal use of the
building…shall be significantly functional although minor cleanup and
repair of some items may be required. Flame may engulf the object of fire
Jason D. Averill
88
origin; however, fire effluent should be contained to the room of fire
origin.
Functional: Minor damage, such as window breakage and slight damage
to some components shall be expected. Non-thermal damage can be
expected to be moderate. Basic access and life safety systems…shall
remain operable. Flame may spread throughout the room of fire origin and
fire effluent may spread throughout the area of fire origin and beyond.
Function Limited: moderate amounts of structural, non-structural, and
non-thermal damage shall be expected. Flame may spread throughout the
area of fire origin and fire effluent may spread throughout the floor of fire
origin and beyond. Access routes within the building may be impaired.
HVAC, plumbing, and fire suppression systems may be damaged, resulting
in local flooding as well as loss of function. The risk of life-threatening
injury shall be low.
Non-Functional: significant non-structural and non-thermal damage shall
be expected and that risk to life from fire and fire effluents can be
expected to be very high. Flame may spread throughout the floor of fire
origin and fire effluent may spread throughout the building or structure.
Egress and access routes within the building may be impaired. The
building or structure shall be designed to avoid system failures that could
injure large numbers of people, either inside or outside the building or
structure.
Hazard Levels FullyOperational
Functional FunctionLimited
Non-Functional
Frequent All use groupsexcept E, H, & I
Performance-Based Codes: Economics, Documentation, and Design
89
Occasional Educational andInstitutional
All use groupsexcept E, H, & I
Rare Hazardous Educational andInstitutional
All use groupsexcept E, H, & I
Very Rare Hazardous Educational andInstitutional
All use groupsexcept E, H, & I
Table 6 Operational Performance Levels
Structural Performance: Fire EventThe final end state performance-based analysis regarding a fire event within the building
is the post-fire structural integrity. Four end states, described herein, are acceptable,
depending upon the use group of the building and the hazard level the structure is
exposed to.
Immediate Occupancy: The basic vertical- and lateral-force-resisting
systems of the building shall retain nearly all of their pre-fire strength and
stiffness. The risk of life-threatening injury as a result of fire-induced
structural damage shall be very low. Minor structural damage that may
occur as a result of the fire shall not significantly delay reoccupancy.
Delayed Occupancy: The basic vertical- and lateral-force-resisting
systems of the building are expected to retain nearly all of their pre-fire
strength and stiffness, and the risk of life-threatening injury as a result of
fire-induced structural damage should be low. Moderate structural
damage that may occur as a result of the fire is likely to delay
reoccupancy.
Life Safety: Structural elements and components may be significantly
damaged as long as large falling debris hazards either, within or outside the
building, do not result. The overall risk of life-threatening injury as a result
Jason D. Averill
90
of structural damage shall be low. The amount of fire-induced structural
damage shall not be such that repair of the structure is not possible;
however, significant delays in reoccupancy, or a decision not to repair the
damage may result.
Collapse Prevention: Significant degradation in the stiffness and strength
of the lateral-force-resisting system, large permanent lateral deformation
of the structure, and, to a more limited extent, degradation in vertical,
load-carrying capacity shall be expected. However, all significant
components of the gravity load-resisting system must continue to carry
their gravity load demands. Significant risk of injury due to falling hazards
from structural debris may exist. The structure may not be technically
practical to repair.
Hazard Levels ImmediateOccupancy
DelayedOccupancy
Life Safety CollapsePrevention
FrequentAll use groupsexcept E, H, & I
OccasionalEducational andInstitutional
All use groupsexcept E, H, & I
Rare HazardousEducational andInstitutional
All use groupsexcept E, H, & I
Very RareHazardous
Educational andInstitutional
All use groupsexcept E, H, & I
Table 7 Structural Performance Levels
Performance-Based Codes: Economics, Documentation, and Design
91
Modeling Fire Scenarios
CFAST 3.1All modeling of fire scenarios in this case study was performed using CFAST 3.1.14
CFAST is a zone-type fire model which can model fire and smoke spread between up to
30 compartments on multiple levels. The physical and numerical theory behind zone
models was discussed previously (see page 21). CFAST is a widely zone model. It is
important with CFAST and all other computer models that the user appreciates the
boundary conditions to ensure proper application and conclusions.
Modeling Sprinkler Activation and SuppressionThe experimental studies supporting the numerical characterization of sprinkler activation
and suppression algorithms was discussed previously (see page 32). The sprinkler
suppression algorithm in CFAST was derived by Evans from the work of Madrzykowski
and Vettori.54 A fundamental assumption underlying the model is that the fire will be
extinguished. In other words, the fire size is within the design parameters of the
suppression system. The sprinkler system is assumed to be operational. Finally, the fire
must not be shielded in any way.
The properties of the sprinkler must first be determined, although defaults exist within the
model. Values such as the response time index (RTI), activation temperature, spray
density, and the distance from the ceiling of the sprinkler must be input. Once the model
has determined that the sprinkler has activated, fire suppression begins. The heat release
rate of the fire is determined by the following equation:
Performance-Based Codes: Economics, Documentation, and Design
93
( )( )
−−= −− 85.1"0.3exp
w
ttQQ act
ttt actact�
��
Equation 5
where:
(mm/s)density spray w
(s) activationsprinkler at time t
(s) timet
(kW) activationsprinkler upon rate releaseHeat Q
(kW) t at time rate releaseHeat Q
"
act
t
t
act
=
==
=
=
�
�
�
Equation 5 describes exponential decay of the fire based upon an initial condition (the
size of the fire at sprinkler activation) and the independent variables (sprinkler spray
density and time). CFAST implements this algorithm when determining the heat release
rate of the fire after the sprinkler has been determined to activate.
An alternative to allowing CFAST to calculate the heat release rate of the fire based upon
the sprinkler algorithm is to input it manually. This must be done using experimental data
and is particularly useful for recreating fire event where the assumptions of the Evans
algorithm are violated. Shielded fires are a good application for manual heat release rate
entry. The sprinkler algorithm would predict fire suppression, which would not be the
case for a shielded fire, as the heat release rate curve would simply be damped.
Jason D. Averill
94
Smoke Detector Activation
Determining the appropriate smoke detector activation criteria is an important step in
modeling the suppression of the fire as well as the evacuation time of the occupants.
Current standards such as NFPA 7255 stipulate the spacing of smoke detectors based upon
the tests by nationally-recognized testing laboratories such as Underwriters Laboratories
(UL 26856). An alternative, performance design method found in NFPA 72, Appendix B,
is limited to flaming fires and does not consider ceilings higher than 8.5m (30ft). This
method was developed from an experimental study conducted in the late 1970's for the
Fire Detection Institute (FDI)57, with the limitations related to the scope of the
experiments conducted. However, this design method introduces some important
concepts; including design of a detection system to activate for a critical fire size (heat
release rate) representing an acceptable threat level for the protected space. This is a
departure from the earlier concept of detection “as quickly as possible” which often led
to over-sensitivity.
Temperature Correlations
The most commonly accepted engineering approach to predicting smoke detector
activation is the temperature correlation. Specifically, activation for a 13 C temperature
rise at the detector location is cited in the SFPE Handbook of Fire Protection Engineering
and in the FSE guides published in the UK, Australia, and New Zealand. The approach
was originally proposed by Heskestad and Delichatsios in 197758, 59 however, the 13 C
Performance-Based Codes: Economics, Documentation, and Design
95
value was a compromise from a set of experimental results for different detectors and
fuels for which the results varied over a wide range. A thorough discussion of this is
found in a paper by Schifilitti and Pucci.
In Heskestad’s discussion of the use of temperature correlations for predicting activation
of smoke detectors, he observes that heat released by a burning fuel resulting in an
observed temperature rise is similar to smoke (soot) released by the fuel and carried in the
buoyant plume. However, while heat losses occur through heat transfer to surroundings,
smoke losses are minimal, so the temperature correlation used as a surrogate for smoke
detector activation should be done for adiabatic conditions.
Since the original experiments used detectors employing older technology sensors and
significant improvements have occurred in recent times, it is reasonable that lower
temperature correlation values might be appropriate for more modern detectors. Recent
literature has suggested that temperature correlations of 4 C or 5 C provide good
agreement with experiments in which current detectors were installed on ceilings of
normal 2.4m (8 ft) heights.
Figure 2 compares several activation temperatures to the experimental data. A 4°C
correlation (adiabatic) matches the experimental data closely. This is supported in
residential fire tests by
Jason D. Averill
96
Collier60 who found that when using CFAST, 4°C provided the best match to
experimentally observed smoke detector activation times. Additionally, Davis and
Notarianni recommended a temperature rise at the detector of 5°C for ionization
detectors alarming at 2.5% m-1 in high bay spaces using fire models other than CFAST.61
Activation Time (s)
0 10 20 30 40 50 60 70 80 90 100
Ra
dial
Dis
tanc
e (
m)
0
2
4
6
8
10
12
14
4 C w/ Ceiling4 C w/o Ceiling
Experimental
8 C
13 C
Figure 2: Comparison of Experimental and Predicted Activation Times Using Different Temperature
Correlations
Performance-Based Codes: Economics, Documentation, and Design
97
While limitations of any temperature correlation preclude the likelihood of consistently
predicting activation times as closely matched to the experimental data as that shown in
Figure 2, there is substantial evidence for the appropriate use of a value well below the
traditional 13°C criteria. Indeed, Beyler points out that in the original Heskestad and
Delichatsios experiments, the optical density at a given detector can vary by three orders
of magnitude for different fuels and fire growth conditions.62
Disadvantages of Temperature Correlations
As previously mentioned, the test data from which the13°C value was derived showed a
wide variation in values for specific detector types and for different fuels -- values range
from 2°C to over 20°C. The fundamental conclusions of the Heskestad and Delichatsios
report were supported by the further analysis of Evans and Stroup63, but several
distinctions exist between the assumptions used in the two analyses and the application of
temperature correlations in a performance-based environment. There are four basic
assumptions inherent in the 13°C activation correlation:
• the Lewis number=1**. In other words, the ratio of species mass concentration to
temperature is constant in space and time.
• species are carried passively by turbulent convective motion without significant
effects of gravity, molecular motion, or particle-fluid inertial effects.
* Lewis number = k/ρcpD, where k = conductivity, ρ = density of air, cp = specific heat capacity of ambientair, D = effective binary diffusion coefficient.
Jason D. Averill
98
• insignificant heat transfer occurs by radiation between elements of the fluid.
• heat transfer between the fluid and confining material surfaces is negligible.
An additional assumption implicit in the previous is that there is no HVAC interaction
with the room. HVAC may significantly increase or decrease the activation time of a
detector. CFAST is essentially consistent with these basic assumptions. First, the CFAST
default assumes that 30% of the fire energy is emitted by radiation from a point source,
while the remaining 70% is convection energy carried by the plume to the ceiling jet and
upper layer. There are no additional radiative losses from either the plume or the ceiling
jet. Second, by turning off the ceiling and wall materials (an option in CFAST), there is
no subsequent heat transfer to the ceiling (the confining material). Additionally, there is
no particulate deposition to bounding surfaces, therefore, the ratio of mass concentration
to temperature is constant within model space and time.
In reality, however, these assumptions may be suspect. The first is the assumption that
the ratio of mass concentration to temperature is constant. Mass concentration is affected
by several physical phenomena. As air is entrained into the plume from the lower layer,
the mass concentration is decreased. Along the ceiling jet, air is entrained from the upper
layer, assuming that an upper layer has formed and that the interface height is below the
bottom of the ceiling jet. This may or may not dilute the species mass concentration in
the ceiling jet as it progresses towards the detector element depending on the species
concentration of the upper layer. Additionally, species may be deposited on the ceiling or
Performance-Based Codes: Economics, Documentation, and Design
99
other bounding surfaces encountered en route to the detector. Particulate deposition on
ceiling surfaces becomes increasingly important as detector spacing increases.
Finally, as particulates age, they coagulate, thereby decreasing the number of particles
while increasing the average particulate size. This has a significant effect on the
activation of both ionization and light-scattering detectors. Therefore, plumes and ceiling
jets with low velocity profiles allow particulates to age and coagulate as well as detectors
located such that the particulate must travel significant distances, either from the fire to
the ceiling (high ceiling heights) or from the plume impingement point to the detector
(large detector spacing). Temperature at a given point between the fire source and the
detector is a function of several variables. The most important is the entrainment of air
into the plume and ceiling jet. This may have a significant effect on the ratio of species
concentration to temperature. The fire plume may entrain cool, clean air, or may entrain
cool, smoke air that accumulates in the compartment. The ceiling jet may entrain hot or
cool gases as well as smoky or particulate-free gases depending on the height of the layer
interface, the depth of the ceiling jet, and the age of the fire. A secondary consideration
is the radiation of the plume and ceiling jet fluid and particulate to the environment. The
greater travel time and the greater the temperature gradient between the transport gases
and the surrounding environment, the more significant this effect becomes. In summary,
the assumptions inherent in the derivation of the original 13°C smoke detector activation
Jason D. Averill
100
correlation must be appreciated, particularly for high ceiling or large area spaces,
unconventional geometry, or other applications.
Finally, manufacturers of smoke detectors are reluctant to accept the notion that a smoke
detector is nothing more than a sensitive heat detector. Ionization, photoelectric light
scattering and projected beam detectors are known to exhibit significant differences in
response to different fuels and to smoke that has been “aged” as it travels from the
source. Temperature correlations do not capture any of these known differences.
In summary, the predicted detection time contains a degree of uncertainty that should be
accounted for in the fire safety analysis. The quantification of the uncertainty level is
subject to literature review and/or negotiation between the design team and the authority
having jurisdiction. While the literature indicates that 4°C most accurately identifies the
temperature at activation, the design team chose 13°C as the activation temperature for
the inherent conservatism.
Results of Fire Scenario Computer Mode ling
Multi-Tenant Cubicle FireThe multi-tenant cubicle fire scenario was chosen to provide a rare and relatively severe
fire insult. Four tenants per floor represents a reasonable level of compartmentation.
One of the greatest determinants of tenability in a compartment is the volume of the
space. A compartment with a high volume takes longer to become untenable than a
Performance-Based Codes: Economics, Documentation, and Design
101
compartment with a small volume, when all other factors are held constant. Thus,
dividing a floor into four tenant spaces represents a more severe fire scenario than the
same fire in a one-tenant layout, assuming the tenant has not sub-divided the space.
The modeling of the cubicle fire represents one use of heat release rate input
methodology. The cubicle fire data was derived from experimental literature and input
into CFAST. Appendix C shows the modeling results of the cubicle fire in the four tenant
layout. The two spaces of interest during a fire scenario include the compartment of fire
origin and the hallway space outside the compartment of origin. An office located nearer
the stairwells was chosen as a fire on the opposite side poses less threat to the occupants.
The upper layer temperature in the room of origin stayed relatively cool, due in part to the
effect of the sprinkler system. The layer height approached one meter, but only after all
occupants were safely out of the office of origin and were either waiting near the stairwell
lobby area (an area of refuge, and hence safety) or waiting in or near the elevator lobby
(also an area of refuge). The upper layer temperature in the hallway was much less than
100°C, while the layer height remained above two meters for the duration of the
evacuation. Thus, the four occupant cubicle fire scenario is deemed safe in terms of life
safety, and the fire, with reasonable probability, will not spread beyond the fuel package
of origin as the heat release rate is quickly attenuated by the activation of the sprinkler
system, thus satisfying the requirements of the performance matrix.
Jason D. Averill
102
One Tenant Cubicle FireThe one tenant cubicle fire is exceedingly safe, owing mostly to the enormous volume
involved. Appendix C shows the results of the computer modeling. Notice that the upper
layer temperature never exceeds 100°C before the entire phased evacuation is complete
and the layer height never drops below two meters.
Multi-Tenant Shielded FireThe development of the shielded fire was discussed previously. The shielded fire
represents the direct input of heat release rate including activation of the sprinklers.
CFAST cannot predict shielded fire suppression because the algorithm assumes that the
fire will be put out, while a shielded fire, by definition, cannot be suppressed by overhead
sprinklers. The fire is simply controlled and fire spread stopped. Thus, the shielded fire
represents a more severe long-term threat to the occupancy due to the higher total mass
loss, heat release, and product generation.
Performance-Based Codes: Economics, Documentation, and Design
103
Mercantile Low-Rack Storage FireThe mercantile low-rack storage fire is intended to expose the mercantile occupancy to a
severe fire insult under realistic loading conditions. Lee64 and Kung, et al.,65 performed
experiments at Factory Mutual using a four-tier rack storage system. The commodity
contained within the rack storage of the latter tests was polystyrene cups packaged in
compartmented cartons and sitting upon a standard wooden pallet. While the goal of the
experiments was to determine the effect of water density, velocity, and source location on
the suppression of the commodity, it will be assumed that the sprinkler system has been
adequately designed to suppress the fire. Brass discs simulated the activation of quick
response fusible links. With regard to the modeling methodology, the storage fire was
simulated with a fast-growing fire (α = 0.0469) until the heat release rate was equal to
1.675 MW. This number corresponds to the total heat release rate of the fire at the time
of sprinkler activation, assuming that the convective fraction was 20%.65 The fire is then
suppressed according to the calculations of Madrzykowski and Vettori.18
Atrium FireThe atrium fire scenario represents an alternative approach to fire modeling: generic heat
release rate, using the classic heat release rate shape of growth, steady-state burn, and
decline phases of fire development. The fire represents agreement between the design
team, the owner, and the AHJ as appropriately severe. The fire chosen for the atrium was
a 5.275 MW, fast-growing (α = 0.0469) fire. This fire is specified by Section 909.9 of the
IBC 2000 Draft, per atrium regulations covered by Section 404. It is important to note
Jason D. Averill
104
that the prescriptive code mandates both automatic sprinklers and a smoke control system
in an atrium space.
The original prescriptive design was determined to inadequately address the fire safety
goals of the atrium space. As occupants evacuating the building are assumed to use the
atrium on the way from either the elevators or the stairwells to the outside, the atrium
must be kept tenable throughout the entire fire scenario. The figures showing the baseline
hazard analysis in Appendix C clearly demonstrate that the upper level atrium space is
untenable during considerable portions of the fire event due to the fact that the layer
height drops below 1 meter. Through further modeling, the sprinkler system was
upgraded from commercial sprinklers to quick response (QR) sprinklers, which activate at
lower ceiling temperatures. The effect of different sprinkler types is shown graphically in
Appendix C. The combination of QR sprinklers and a smoke management system
maintained tenable conditions throughout the entire fire event and thus, met the life
safety goals.
Evacnet4 Model ResultsThere are five basic scenarios: phased (meaning only three floors upon activation of the
initial alarm signal) evacuation of the four tenant and one tenant layouts, with both
stairwell only and elevator and stairwell evacuation, and the mercantile scenario.
Performance-Based Codes: Economics, Documentation, and Design
105
Scenario Floor Clearing
Time
One Tenant, Stairs Only 495
One Tenant with
Elevators
130
Four Tenant, Stairs
Only
370
Four Tenant with
Elevators
110
Mercantile N/A
Table 8: Results of Evacuation Modeling
Office Layout Cubical Fire Shielded Fire Copier Fire
One Tenant 85 70 25
Four Tenants 33 27 10
Table 9: Times to Smoke Detector Activation
Jason D. Averill
106
Using the guidance provided by Nelson and MacLennan (Equation 2) we can now
estimate total evacuation time. The inefficiency factor used in developing Table 10 was
50%. The inefficiency in the case study evacuation is relatively low for several reasons:
voice enunciation, which reduces occupant confusion, occupant familiarity with
evacuation routes and procedures, the fact that most occupants should be awake and
alert, the ability of the occupants (most occupants will not be elderly or children), and the
fact that only three floors are evacuating.
Fire Scenario Tenant Layout Evacuation Scheme Evacuation Time (s)
Cubicle One Stairs Only 828
Stairs and Elevators 280
Four Stairs Only 588
Stairs and Elevators 228
Copier One Stairs Only 768
Stairs and Elevators 220
Four Stairs Only 565
Stairs and Elevators 175
Shielded Fire One Stairs Only 813
Stairs and Elevators 265
Four Stairs Only 582
Stairs and Elevators 192
Performance-Based Codes: Economics, Documentation, and Design
107
Table 10: Total Evacuation Times for Office Fire Scenarios
54 Evans, David D. “Sprinkler Fire Suppression Algorithm for HAZARD.” US Department of Commerce,NISTIR 5254, August 1993.55. NFPA 72, “Appendix B: Engineering Guide for Automatic Fire Detector Spacing.” National FireProtection Association, Quincy, MA (1996).56. UL 268: “Smoke Detectors for Fire Protective Signaling Systems, 4th Edition.” UnderwritersLaboratory, Northbrook, IL (1996).57Heskestad, G. and Delacatsios, M., Environments of Fire Detectors (4 volumes)58. Heskestad, Gunnar and Michael A. Delichatsios. “Environments of Fire Detectors - Phase I: Effect of FireSize, Ceiling Height, and Material, Volume 1 - Measurements,” Factory Mutual Research CorporationTechnical Report 22427, Norwood, MA (1977).59. Heskestad, Gunnar and Michael A. Delichatsios. “Environments of Fire Detectors - Phase I: Effect of FireSize, Ceiling Height, and Material, Volume 2 - Analysis,” NBSGCR-77-95 (1977).60. Collier, P. C. R. “Fire In a Residential Building: Comparisons Between Experimental Data and a Firezone Model,” Fire Technology, Vol. 32, No. 3, Aug. 1996, pp. 195-219.61. Davis, William D. and Kathy A. Notarianni. “NASA Fire Detector Study,” NISTIR 5798 (1996).62. Beyler, Craig L. “A Design Method for Flaming Fire Detection.” Fire Technology, Volume 20, No. 4,pp. 5 – 16, November 1984.63. Evans, David D. and David W. Stroup. “Methods to Calculate the Response Time ofHeat and Smoke Detectors Installed Below Large Unobstructed Ceilings,” FireTechnology, Vol. 22, No. 1, February 1985, pp. 54.64 Lee, James L. “Extinguishment of Rack Storage Fires of Corrugated Cardboard Cartons Using Water.” inInternational Association for Fire Safety Science. Fire Safety Science. Proceedings. 2nd InternationalSymposium. June 13-17, 1988, Tokyo, Japan, Hemisphere Publishing Corp., New York, Wakamatsu, T.;Hasemi, Y.; Sekizawa, A.; Seeger, P. G., Editors, 1989 pp. 633 - 642.65 Kung, H. C.; You, H. Z.; Brown, W. R.; Vincent, B. G. “Four-Tier Array Rack Storage Fire Tests WithFast-Response Prototype Sprinklers.” in International Association for Fire Safety Science. Fire SafetyScience. Proceedings. 2nd International Symposium. June 13-17, 1988, Tokyo, Japan, Hemisphere PublishingCorp., New York, Wakamatsu, T.; Hasemi, Y.; Sekizawa, A.; Seeger, P. G., Editors, 1989, pp. 633 – 642.
First Order Cost Estimation
Three performance-based design features require preliminary cost estimates. The most
significant cost savings is the stairwell evacuation program. Relocating the two stairwells out
of the office area and into the building core results in greater leasable office space on each
floor. The second cost savings is the combination of the domestic and sprinkler water risers.
Finally, a cost analysis of the cybernetic building systems will be explored. Due to time
constraints, the scope and accuracy of the cost estimation is severely limited. Significant
issues such as time costs of up-front money, savings from potential fire losses, and other
economic issues will not be pursued due to their complexity. The important and easily
quantifiable costs will be estimated.
The first cost savings realized by the owner is related to the elevator egress system. The
benefits of the elevator egress include lower egress time for the occupants and the ability to
relocate the stairwells into the building core. Shorter egress time allows for building fire
safety performance to be relaxed, as such will not endanger any of the occupants. This can
result in direct design and installation savings to the owner. The limiting factors regarding fire
performance relaxation are the fire department, property protection, and performance-based
code guidelines. The fire must be contained to the degree that ensures fire fighter safety.
The owner may stipulate a level of property protection which raises the standard above that
intended by the performance requirements. Finally, the design may never perform to a
degree less than that stipulated by the code. The total cost savings realized by fire
performance relaxation depends upon the specific fire safety components which are adjusted
and the degree to which the designer, owner, and authority having jurisdiction agree to relax
the performance. The second component of cost savings is the relocation of the stairwells
Performance-Based Codes: Economics, Documentation, and Design
109
into the core. The quantifiable cost associated with this is the additional leasable floor space
now available to the tenants. The national average for class A office rent in the central
business district where the building is going to be built is $23.99 per square foot per year,
although this figure can be as high as $37 per square foot per year in Washington, D.C.66 The
increase in floor space per floor of the case study building is approximately 800 square feet.
There are 38 stories containing office spaces. Thus, the stairwell relocation may generate up
to US$729,000.00 additional revenue per year to the building owner.
The second component of cost adjustments due to the performance-based design is the
elimination of the domestic water supply risers. There are four basic components of cost
savings associated with the domestic supply: materials, labor, design, and maintenance. The
greatest component of savings is either the material or labor associated with installation of the
domestic water riser pipe and pumps. Additionally, the plumbing designer may design only
one set of risers, sized to either the fire protection or domestic supply requirements,
whichever is greater. Finally, by eliminating the domestic risers, they require no
maintenance. Each of these cost savings combine to save the owner a significant initial cost
and minor long-term savings.
Finally, the additional costs and long-term savings of the cybernetic building systems should
be analyzed. There are substantial initial costs, both in the design and installation of the
building systems. The owner must weigh these additional costs against the long-term benefits
of increased system reliability, occupant safety, and reduced maintenance and inspection
uncertainty. The cybernetic building systems require the most thorough economic analysis to
justify their inclusion in the building fire safety plan. The assured fire safety system may
Jason D. Averill
110
eliminate up to 90% of the conventional repair and maintenance costs associated with the fire
and life safety systems in large buildings. The current cost repair and maintenance of fire and
life safety systems is $0.07. This results in an approximate cost savings of up to
US$75,000.00 per year.66 Additionally, the increased safety and reliability the systems
provide should help justify inclusion.
Clearly, more work must be done to fully quantify the cost impact of the performance-based
building design. Long-term cost impact, however, certainly appears to be positive when
accounting for the increase in building revenue and fire safety.
66 1996 BOMA Experience Exchange Report. Building Owners and Managers International, Baltimore, MD,1996.
Conclusions
The project has effectively demonstrated an application of the ICC performance-based code
using a 40 story, mixed-use, office building. In addition to exploring the social economic
impacts of performance-based codes, the project detailed the necessary steps to document a
performance-based design. Thorough documentation of the building design is critical to
assuring that the performance-based design objectives are satisfactorily fulfilled. This
includes all assumptions, models, limitations of calculations, design fire details, statement of
goals, and a clear demonstration of accomplishment of said goals.
The third goal of the case study was to perform an example performance-based design. Using
a real 40 story building designed with the Uniform Building Code, the design team, in
cooperation with a practicing authority-having-jurisdiction, documented three significant
design changes to the prescriptive code. The first alteration was the elimination of the
domestic risers and their combination with the sprinkler risers. While increasing the
reliability of the sprinklers system, the combination also saves significant money to the
building owner during the design and construction phases. The second design aspect was to
relocate the stairwells into the building core. The result was an 800 sf increase per floor in
leasable floor space. Using elevators to evacuate the occupants significantly reduced
evacuation times and increased the safety of the building occupants. Finally, new alarm and
sensor technologies were implemented throughout the building. The sensors and alarms
increase fire protection system reliability, provide greater information to the emergency
response teams, and increase the level of safety of the building occupants.
Jason D. Averill
112
Finally, the economic impact of the performance-based design alternatives was explored.
Clearly, the greatest impact resulted from the stairwell relocation, which resulted in
approximately 2% increase per floor of leasable office space. The potential economic impact
of this relocation alone could exceed US$700,000.00 per year. Additional secondary impacts
could also include lower insurance premiums due to the increased safety levels in the
building. Up-front design and construction costs are realized by the combination of the
domestic and sprinkler risers. Additionally, the sprinkler flow is monitored by the domestic
supply, resulting in an additional margin of safety. Finally, new detection and alarm
technologies are introduced to the building. When combined with existing environmental
regulation systems, the additional costs are marginal, while the benefits to the owner,
occupants, and fire service are substantial.
This project has proved the feasibility of performance-based design in the United States.
Clearly the paradox of increased safety at reduced cost can be realized through creative
building design, if implemented in a methodical, systematic form which ensures a minimum
level of public safety.
Appendix A: Elevator Theory
Calculating Eg ress Time Us ing El evator Evacuation
The following section will present the foundation for an elevator egress calculation model.
The calculations must clearly demonstrate that using elevators as an egress tool
significantly decreases the time to evacuate the occupants of the proposed building
design. Several obstacles to using elevators as a component of the egress system exist.
The first obstacle is the decades long public awareness campaign against using elevators
in the event of a fire. Presently, the Uniform Building Code stipulates that an emergency
sign shall be posted adjacent to each call station which indicates that the elevators will not
operate in the event of an emergency and that the stairways are to be utilized for egress.67
The May 1997 Working Draft of the International Building Code, however, does not
require signage in designs utilizing elevators as a component of the egress system.68 The
second obstacle is the reliability of the elevators in the event of an emergency. The risk
of total elevator disabling is low and will be addressed in subsequent analysis.
The model used in this analysis is ELVAC.69 The evacuation time calculated herein is the
“fire drill” evacuation time. A “fire drill” evacuation time is the time taken by people to
evacuate a building that is not in an emergency situation. In other words, a “fire drill”
evacuation time does not account for the human behavior associated with emergency
situations, such as delays due to decision making, investigation of the fire, attempted
extinguishment, gathering of personal belongings, notifying of other occupants, or
unfamiliarity with the emergency exit procedure (way finding). Error! Reference
Performance-Based Codes: Economics, Documentation, and Design
115
source not found., from Nelson and MacLennan, suggests that the actual evacuation time
is the modeled evacuation time plus delays in initiating evacuation and any associated
inefficiencies during the evacuation.70
Equation 6
where: te is the total evacuation time
ta is the elevator evacuation start up time
to is the travel time from the elevator lobby to the outside or area of refuge
η is the trip inefficiency
J is the number of elevators
j is the specific trip number
m is the number of round trips
tr,j is the time for round trip j
Start Up Time
The start up time for elevator evacuation can be defined simply as the time from
activation to the beginning of the round trips.
( )( )µ+++= 1duTa tttt
Equation 7
( )∑=
+++=m
jjroae t
Jttt
1,
1 η
Jason D. Averill
116
where tT is the length of time the elevator takes to travel from the farthest floor to the
discharge floor
tu is the time for the passengers to leave the elevator
td is the time for the doors to open and close once
µ is the total transfer inefficiency
Total transfer inefficiency is the sum of basic transfer inefficiency, door inefficiency, and
people inefficiency. Error! Reference source not found. describes the total transfer
inefficiency.
γεαµ ++=
Equation 8
where α is the basic transfer inefficiency
ε is the door inefficiency
γ is the people inefficiency
The basic transfer inefficiency is generally assumed to be 0.10.Error! Bookmark not defined.
Factors that can affect the value of the basic transfer inefficiency include elevator car
arrangement and car shape. Table 11 lists appropriate values for different elevator door
inefficiencies, ε. People inefficiency accounts for mobility limi tations which affect the
speed with which people move into or out of the elevator. Mobility limi tations such as
those often encountered in hospitals would set γ = 0.05.
Performance-Based Codes: Economics, Documentation, and Design
117
Time from Elevator to Outside or Refuge Calculation
to is the time for elevator dischargees to travel from the elevator to the outside or an
equivalent point of refuge. This time can be estimated from standard evacuation models
such as EVACNET+71 or EGRSTIME.72 The layout of the elevators in the lobby or
discharge floor is critical to ensuring efficient egress. If dischargees interfere with one
another, the total egress time will be increased.
Time for Elevator Round Trip
The time for an elevator round trip, tr, starts at the discharge floor. The total round trip
time is simply the sum of the time for the following sequence: doors close, elevator travels
from the discharge floor to the pickup floor, doors open, passengers enter the elevator,
doors close, elevator travels from pickup floor to discharge floor, doors open, and
evacuees egress elevator. Error! Reference source not found. mathematically describe
the round trip time:
( )( )µ++++= 122 duiTr ttttt
Equation 9
where: tT is the travel time from the discharge floor to the pickup floor
ti is the time for people to enter the elevator
tu is the time for people to leave the elevator
td is the time for the doors to open and close
Jason D. Averill
118
Each of these times will be developed subsequently. Refer to Table 11 to determine td.
The time required for people to enter the elevator, ti, is dependent upon the number of
people waiting to board the elevator. There is a limit to the number of people the elevator
will hold and the number of people that will willingly board an elevator. If the elevator
density exceeds the individuals threshold, the person will either wait for the next elevator
or use the stairs. Strakosch observed that people will board an elevator until the density is
one person for every 0.22 m2 of elevator space73. ASTM A17.1 allows a maximum
loading of 0.17 m2.1 Since the ASTM density is rarely observed in reality, the more
conservative Strakosch values are used for analysis. The time that the elevator doors
remain open is a function of the number of people entering the elevator. Two or less
people entering the elevator result in the minimum open door time, or the dwell time, tdw.
Any additional people entering the elevator will cause the doors to remain open while
they enter the car. shows the time for people to enter the elevator:
>≤
−+=
2,
2,
)( Nfor
Nfor
NNtt
tt
dwiodw
dwi
Equation 10
where: tio is the average time it takes one person to enter the elevator
N is the number of people entering the elevator
Ndw is the number of people entering the elevator during the dwell time, or
Ndw is (tdw/tio) rounded down to the nearest integer
1 ASTM A17 is expressly referenced in the 1996 BOCA National Building Code, Chapter 30.
Performance-Based Codes: Economics, Documentation, and Design
119
The calculation of the time it takes for the elevator to empty upon arrival at the discharge
floor, tu, is equivalent to Error! Reference source not found..
Elevator Travel Time
The second major component of the determination of round trip time for an elevator is the
travel time, tT. There are three possible velocity curves for an elevator car. The first
curve is an elevator car that accelerates, reaches terminal velocity and decelerates as it
reaches the destination. Secondly, an elevator car may reach the transitional acceleration
area but fail to achieve constant velocity before decelerating. Finally, for elevators cars
traversing short distances, there is the possibility that the car will accelerate and
decelerate before reaching transitional acceleration.
Trips Reaching Normal Operating Velocity
The time to complete constant acceleration is given by Error! Reference source not
found., while the corresponding distance traveled is given by Error! Reference source
not found.:
a
Vt 11 =
Equation 11
a
VS
2
21
1 =
Equation 12
Jason D. Averill
120
where: t1 is the time to complete constant acceleration
v1 is velocity
a is acceleration
S1 is the distance traveled during constant acceleration
The time to reach the end of transitional acceleration is given by Error! Reference
source not found., while the corresponding distance traveled is given by S2:
11
21
2
22
taV
VVt m +−=
Equation 13
12
11
3
23
1SV
V
V
aS m +
−=
Equation 14
where: Vm is the normal operating velocity
Thus, the total one way travel time can be computed from Error! Reference source not
found.:
Performance-Based Codes: Economics, Documentation, and Design
121
hm
TT t
V
SStt +−+= 2
2
22
Equation 15
where: ST is the total travel distance
th is the leveling time
Trips Reaching Transitional Acceleration
The elevator may not travel far enough to reach normal operating velocity. For this
instance, the total trip time is calculated from Error! Reference source not found.:
hT ttt += 22
Equation 16
Trips Not Reaching Transitional Acceleration
If the trip does not go beyond constant acceleration, the total trip time is computed from
the following:
hT
T ta
St += 2
Equation 17
Jason D. Averill
122
Door Type Width (mm)
Time to Open
and Close
td (s)
Door Transfer
Inefficiency
Single Slide 900 6.6 0.10
1100 7.0 0.07
Two-Speed 900 5.9 0.10
1100 6.6 0.07
1200 7.7 0.02
1400 8.8 0.02
1600 9.9 0.02
Center-Opening 900 4.1 0.08
1100 4.6 0.05
1200 5.3 0
1400 6.0 0
1600 6.5 0
Two-Speed,
Center-Opening
1600 6 0
Table 11: Elevator Door Data
Performance-Based Codes: Economics, Documentation, and Design
123
67 1991 Uniform Building Code. Section 5103, Part 15 (f).68 2000 International Building Code – Working Draft Section 3002.3.69 Klote, John H., Daniel M. Alvord, Bernard M. Levin, Norman E. Groner. “Feasibility and DesignConsiderations of Emergency Evacuation by Elevators.” NISTIR 4870, U.S. Dept. of Commerce, September1992.70 Nelson, Harold E. and Hamish A. MacLennan. “Emergency Movement.” In The SFPE Handbook of FireProtection Engineering, 2nd Edition, National Fire Protection Association, Quincy, MA (1995) pp. 3-286.71 Kisko, T. M. and Francis R. L. “EVACNET +: A Computer Program to Determine Optimal BuildingEvacuation Plans.” Fire Safety Journal, 9, pp. 211-220.72 Hagiwara, Ichiro. Brief Notes on Egress Time Calculation Time Program (EGRSTIME). UnpublishedReport.73 Strakosh, G. R. “Vertical Transportation: Elevators and Escalators, 2nd Edition.” Wiley and Sons, NewYork, NY, 1983.
Appendix B: Stairwell Evacuation
Factors Affecting Total Egress Time
Jake Pauls introduces the principle components of people movement in Section 3/Chapter
13 of the 2nd Edition of the SFPE Handbook.74 Density, speed, and flow are the
fundamental characteristics of crowd movement. Density is the number of people per
unit area. Speed is the distance traveled per unit time by an occupant. Flow is the
number of occupants which pass some reference point per unit of time. Finally, a limiting
factor influencing the flow is the minimum width which a flow must pass through,
measured in unit of length. The fundamental traffic equation is given as:
widthdensity speedflow ××=
Equation 18
It is important to note the interactions between the variables. For example, beyond a
critical point, as density increases, speed decreases. The motion of walking becomes
more constrained until the density reaches the point where people can only shuffle along.
Additionally, as the width of the smallest restriction decreases, the subsequent flow
through that restriction decreases. Fewer people will flow t hrough a 56 cm (22 inch)
doorway than will flow t hrough a 91 cm (36 inch) doorway. Table 3 shows crowd
movement parameters for a typical corridor.
Performance-Based Codes: Economics, Documentation, and Design
125
Crowd Condition Density
(people/m2)
Speed
(m/s)
Flow
people/m-s
Minimum <0.0046 1.27 <0.66
Moderate 0.0092 1.01 1.10
Optimum 0.0184 0.61 1.32
Crush 0.0276 <0.30 <0.99
Table 12: Crowd Movement Characteristics for a Typical Corridor
There are egress time delays associated with evacuation initiation. Notification is the first
variable in the process of evacuating a building. People will not move unless they are
aware that there is an emergency. The recognition of a fire event and decision to act
upon ambiguous information is often retarded by the presence of others. 75 Latane and
Darley performed experiments which showed a significant activity delay when test
subjects had other people in the room versus test subjects alone in a room upon
introduction of smoke into the test room.76 Alarm technology, particularly where voice
enunciation exists, has been shown to reduce occupant response initiation. The voice
enunciation system, however, must be audible to all occupants, lest misunderstanding of
instructions occur.77 Occupants often investigate the source of a fire, either to attempt
suppression or to verify actual emergency conditions. However, occupancy type has an
effect upon the pre-fire activities. Occupants of an office building exhibit lower initiation
times than people leaving their residences. The reasons for this are many: people
evacuating homes and apartments often gather personal belongings, get dressed, gather
children or other family members, whereas there are relatively few obligations to be
Jason D. Averill
126
tended to in a work place. Finally, the simple act of making a decision can account for
additional evacuation delay. Proulx reports that for an apartment building where 100% of
the residents hear the alarm signal, 59% of the residents have left their apartments within
the first two minutes.47 Two minutes represents a reasonable extrapolation to office
buildings for two reasons: first, the number will be conservative, as occupants of offices
act sooner than occupants of apartments, for the reasons mentioned previously. Second,
it is not necessary for 100% of the occupants to begin evacuation in order to use a delay
time. The residents who begin in the third or fourth minute, for example, will simply be
added to the end of the queue, as if they had begun evacuation at two minutes, provided
that there is sufficient queuing.
Once in motion, occupants must still determine the most efficient evacuation route. This
is often referred to as “way-finding.” Inefficiencies exist because occupants often choose
to leave by the same means they entered the building.78 This may result in exit
imbalance, where some exits are overtaxed and some exits are underutilized. Time delays
also exist at merge points, where flows must stop and restart.79 Several factors can
mitigate initiation and activity delays. Occupant education is clearly a critical factor. In
high-rise office evacuation studies conducted by Proulx at the National Research Council
Canada, she noted that some occupants chose the familiar route, talked with friends, and
were confused about the outside meeting point, while other, more informed occupants,
chose the nearest exit and started evacuating immediately, directing others along the
way.80 The total inefficiency associated with less than optimal evacuation must be
quantified to account for all of the above factors. MacLennan found that actual egress
Performance-Based Codes: Economics, Documentation, and Design
127
times were in the range of twice the modeled egress time when an efficient system was
present.48
Computer Modeling of People Mo vement
Computer modeling of egress times is an inexact science. While computers can predict
how people may move under ideal conditions, there are several assumptions which must
be identified in order to have confidence in the results. A major assumption of any
computer model is that people will behave rationally. A computer cannot predict whether
people will stay to finish what they are working on, collect personal belongings,
investigate the fire, or warn other people. Nelson and MacLennan, in recognition of the
tendency of egress models to underestimate egress time, proposed the following equation
to adjust for inefficiencies:48
dmeae TeTT +=
Equation 19
where:
evacuation initiatingin delay theis T
cyinefficien evacuationapparent theis e
timeevacuation modeled is T
timeevacuation actual is
d
me
aeT
Thus, computer modeling represents a significant fraction of the evacuation time,
although, not a complete assessment. While several computer models exist to evaluate
Jason D. Averill
128
egress time,81,82,83 one model (EVACNET+) will be analyzed and held as a representative
example.84
EVACNET+ is a node-arc network model which determines the “fire-drill” evacuation
time. “Fire-drill” evacuation time is the minimum evacuation time which the occupants
may egress a building. Each space in the building through which the occupants may pass
must be entered as a node. The input for a node includes the number of people which
start the simulation within that particular node and the capacity (or maximum number of
people which may be contained within the node). The input for an arc requires a
beginning node and an ending node, a dynamic capacity (DC), and the traversal time
(TT).
0014.0×××= SPTPAFVWRDC
Equation 20
where: DC is the dynamic capacity of the arc (people/time period)
WR is the minimum width encountered along the arc path (in)
AFV is the average flow volume (people/ft-min)
SPTP is the number of seconds per time period (s)
SPTPAS
DISTTT
60×=
Equation 21
where: TT is the traversal time (s)
Performance-Based Codes: Economics, Documentation, and Design
129
DIST is the distance between the beginning of end of the arc (ft)
AS is the average speed (ft/min)
There are several assumptions and limitations of EVACNET+.
8. The program is a linear modeling system. Arc capacities and arc traversal times do
not change over time and do not depend on the arc flows.
9. Smoke and fire have no effect upon the evacuation time.
10. The program does not consider behavioral aspects of occupants. Behavioral aspects
include evacuation initiation delays, impaired evacuation of handicapped population,
and fatigue associated with long travel distances.
11. The program views all occupants, not an individual occupant.
12. Initial location of all individuals must be assumed.
13. Traversal times are rounded off to the nearest whole number. The calculated egress
time, therefore, is very sensitive to the chosen time step (seconds per time period).
14. The total evacuation time will be the lower bound of egress times.53
Thus, accounting for the limitations and assumptions of EVACNET+, the modeled
evacuation time can be determined. Using Equation 2, a reasonable and conservative
total evacuation time can be derived which should ensure safe building design.
74 Pauls, Jake. “Movement of People.” in The SFPE Handbook of Fire Protection Engineering, 2nd
Edition. DiNenno, et al., Ed. National Fire Protection Association, Quincy, MA, 1995, pp. 3-263 – 3-285.75 Bryan, John L. “Behavioral Response to Fire and Smoke” in The SFPE Handbook of Fire ProtectionEngineering, 2nd Edition. DiNenno, et al., Ed. National Fire Protection Association, Quincy, MA, 1995, pp.3-241 – 3-242.
Jason D. Averill
130
76 Latane, B. and J. M. Darley. Journal of Person. and Soc. Psych. Volume 10, 1968, page 215.77 Proulx, Guelene. “The Time Delay to Start Evacuating Upon Hearing a Fire Alarm.” 38th Annual Meetingof the Human Factors and Ergonomics Society, Nashiville, TN, October 24 – 28, 1994.78 Proulx, Guylene. “Evacuation Time and Movement in Apartment Buildings.” Fire Safety Journal, Volume24, 1995, pp. 229 – 246.79 Nelson, Harold E. and Hamish A. MacLennan. “Emergency Movement.” in The SFPE Handbook of FireProtection Engineering, 2nd Edition. DiNenno, et al., Ed. National Fire Protection Association, Quincy,MA, 1995, pp. 3-286 – 3-295.80 Proulx, Guylene. Abstract for “Comparison of Occupant Behaviour During Office and ApartmentEvacuations.” National Fire Protection Association Fall Meeting, Nashville, TN, 1996.81 Cooper, Leonard Y. “Estimating Safe Available Egress Time From Fires. Final Report.” NBSIR 80-2172;February 1981.82 Stahl, F. I. “BFIRES-II: A Behavior Based Computer Simulation of Emergency Egress During Fires.” FireTechnology, Vol. 18, No. 1, February 1982, pp. 49 – 65.83 Levin, B. M. “EXITT--A Simulation Model of Occupant Decisions and Actions in Residential Fires:Users Guide and Program Description.” NBSIR 87-3591; July 1987.84 Kisko, Thomas M. and Richard L. Francis. “EVACNET+: A Computer Program to Determine OptimalBuilding Evacuation Plans.” Fire Safety Journal, Volume 9, No. 2, 1985, pp. 211 – 220.
Performance-Based Codes: Economics, Documentation, and Design
131
APPENDIX C: CFAST OUTPUT GRAPHS
Jason D. Averill
132
Upper Layer Temperature for Office of Origin
Time (s)
0 200 400 600 800 1000
Tem
pera
ture
(C
)
0
100
200
300
400
500
Figure 1: Upper Layer Temperature in Office of Origin for Cubicle Fire Scenario
Performance-Based Codes: Economics, Documentation, and Design
133
Upper Layer Temperature in Hallway Outside Room of Origin
Time (s)
0 200 400 600 800 1000
Up
per
Lay
er
Te
mpe
ratu
re (
C)
0
100
200
300
400
500
Figure 2: Upper Layer Temperature in Hallway for Cubicle Fire Scenario
Jason D. Averill
134
Layer Height for Office of Origin
Time (s)
0 200 400 600 800 1000
Laye
r H
eig
ht (
m)
0
1
2
3
4
Figure 3: Layer Height in Office of Origin for Cubicle Fire Scenario
Performance-Based Codes: Economics, Documentation, and Design
135
Layer Height in Hallway Outside Room of Origin
Time (s)
0 200 400 600 800 1000
Laye
r H
eig
ht (
m)
0
1
2
3
4
Figure 4: Layer Height in Hallway for Four Tenant Cubicle Fire Scenario
Jason D. Averill
136
Copier Fire Layer Height Room of Origin
Time (s)
0 200 400 600 800 1000
Laye
r H
eig
ht (
m)
0
1
2
3
4
Figure 5: Layer Height for Room of Origin for Four Tenant Copier Fire Scenario
Performance-Based Codes: Economics, Documentation, and Design
137
Room of Origin Upper Layer Temperature from Copier Fire
Time (s)
0 200 400 600 800 1000
Up
per
Lay
er
Te
mpe
ratu
re (
C)
0
100
200
300
400
500
Figure 6: Upper Layer Temperature for Four Tenant Copier Fire Scenario
Jason D. Averill
138
Copier Fire Upper Layer Temperature in Hallway
Time (s)
0 200 400 600 800 1000
Up
per
Lay
er
Te
mpe
ratu
re (
C)
0
100
200
300
400
500
Figure 7: Upper Layer Temperature in Hallway for Four Tenant Copier Fire Scenario
Performance-Based Codes: Economics, Documentation, and Design
139
Copier Fire Layer Height in Hallway
Time (s)
0 200 400 600 800 1000
Laye
r H
eig
ht (
m)
0
1
2
3
4
Figure 8: Layer Height in Hallway for Four Tenant Copier Fire Scenario
Jason D. Averill
140
Time (s)
0 200 400 600 800 1000
Up
per
Lay
er
Te
mpe
ratu
re (
C)
0
100
200
300
400
500
Shielded Fire Upper Layer Temperature Room of Origin
Figure 9: Upper Layer Temperature for Room of Origin for Four Tenant Shielded Fire Scenario
Performance-Based Codes: Economics, Documentation, and Design
141
Shielded Fire Layer Height Room of Origin
Time (s)
0 200 400 600 800 1000
Laye
r H
eig
ht (
m)
0
1
2
3
4
Figure 10: Layer Height in Room of Origin for Four Tenant Shielded Fire Scenario
Jason D. Averill
142
Shielded Fire Upper Layer Temperature Hallway
Time (s)
0 200 400 600 800 1000
Up
per
Lay
er
Te
mpe
ratu
re (
C)
0
100
200
300
400
500
Figure 11: Upper Layer Temperature in Hallway for Four Tenant Shielded Fire Scenario
Performance-Based Codes: Economics, Documentation, and Design
143
Shielded Fire Layer Height in the Hallway
Time (s)
0 200 400 600 800 1000
Laye
r H
eig
ht (
m)
0
1
2
3
4
Figure 12: Layer Height in Hallway for Four Tenant Shielded Fire Scenario
Jason D. Averill
144
Upper Layer Temperature for Shielded Fire in One Occupant Floor Plan
Time (s)
0 200 400 600 800 1000
Up
per
Lay
er
Te
mpe
ratu
re (
C)
0
100
200
300
400
500
Figure 13: Upper Layer Temperature for One Tenant Shielded Fire Scenario
Performance-Based Codes: Economics, Documentation, and Design
145
Shielded Fire Layer Height Room of Origin
Time (s)
0 200 400 600 800 1000
Laye
r H
eig
ht (
m)
0.0
0.5
1.0
1.5
2.0
2.5
3.0
3.5
4.0
Figure 14: Layer Height for One Tenant Shielded Fire Scenario
Jason D. Averill
146
Cubicle Fire Upper Layer Temperature One Tenant
Time (s)
0 200 400 600 800 1000
Up
per
Lay
er T
emp
erat
ure
(C
)
0
100
200
300
400
500
Figure 15: Upper Layer Temperature for One Tenant Cubicle Fire Scenario
Performance-Based Codes: Economics, Documentation, and Design
147
Cubical Fire Layer Height One Tenant
Time (s)
0 200 400 600 800 1000
Laye
r H
eig
ht (
m)
0
1
2
3
4
Figure 16: Layer Height for One Tenant Cubical Fire Scenario
Jason D. Averill
148
Atrium Upper Layer Temperature for Compartment 1
Time (s)
0 200 400 600 800 1000
Up
per
Lay
er
Te
mpe
ratu
re (
C)
0
100
200
300
400
500
Figure 17: Upper Layer Temperature in Room of Origin for Atrium Fire with Commercial Sprinklers
and No Smoke Venting Scenario
Performance-Based Codes: Economics, Documentation, and Design
149
Atrium Upper Layer Temperature Compartment 2
Time (s)
0 200 400 600 800 1000
Up
per
Lay
er
Te
mpe
ratu
re (
C)
0
100
200
300
400
500
Figure 18: Upper Layer Temperature in Two Story Space for Atrium Fire with Commercial Sprinklers
and No Smoke Venting Scenario
Jason D. Averill
150
Atrium Fire Upper Layer Temperature Compartment 3
Time (s)
0 200 400 600 800 1000
Up
per
Lay
er
Te
mpe
ratu
re (
C)
0
100
200
300
400
500
Figure 19: Upper Layer Temperature in Upper Level Space for Atrium Fire with Commercial
Sprinklers and No Smoke Venting Scenario
Performance-Based Codes: Economics, Documentation, and Design
151
Atrium Fire Layer Height Compartment 1
Time (s)
0 200 400 600 800 1000
Laye
r H
eig
ht (
m)
0
1
2
3
4
5
6
Figure 20: Layer Height in Room of Origin for Atrium Fire with Commercial Sprinklers and No Smoke
Venting Scenario
Jason D. Averill
152
Atrium Fire Layer Height Compartment 2
Time (s)
0 200 400 600 800 1000
Laye
r H
eig
ht (
m)
0
2
4
6
8
10
12
Figure 21: Layer Height in Two Story Space for Atrium Fire with Commercial Sprinklers and No
Smoke Venting Scenario
Performance-Based Codes: Economics, Documentation, and Design
153
Atrium Fire Layer Height Compartment 3
Time (s)
0 200 400 600 800 1000
Laye
r H
eig
ht (
m)
0
1
2
3
4
5
6
Figure 22: Layer Height in Upper Level Room for Atrium Fire with Commercial Sprinklers and No
Smoke Venting Scenario
Jason D. Averill
154
Atrium Fire Sizes
Time (s)
0 200 400 600 800 1000
He
at R
elea
se R
ate
(M
W)
0.0
0.5
1.0
1.5
2.0
2.5
3.0
3.5
Sprinkler Activation Time
No Sprinklers
HRR with QR Sprinklers
HRR with Commercial Sprinklers
QR Commercial
Figure 23: Heat Release Rate Graph Showing the Impact of Different Sprinklers
Performance-Based Codes: Economics, Documentation, and Design
155
Atrium Fire Upper Layer Temperature Compartment 1
Time (s)
0 200 400 600 800 1000
Up
per
Lay
er
Te
mpe
ratu
re (
C)
0
100
200
300
400
500
Figure 24: Upper Layer Temperature in Room of Origin for Atrium Fire with QR Sprinklers and
Smoke Venting Scenario
Jason D. Averill
156
Atrium Fire Upper Layer Temperature Compartment 2
Time (s)
0 200 400 600 800 1000
Up
per
Lay
er
Te
mpe
ratu
re (
C)
0
100
200
300
400
500
Figure 25: Upper Layer Temperature in Two Story Space for Atrium Fire with QR Sprinklers and
Smoke Venting Scenario
Performance-Based Codes: Economics, Documentation, and Design
157
Atrium Fire Upper Layer Temperature Compartment 3
Time (s)
0 200 400 600 800 1000
Up
per
Lay
er
Te
mpe
ratu
re (
C)
0
100
200
300
400
500
Figure 26: Upper Layer Temperature in Remote Room for Atrium Fire with QR Sprinklers and Smoke
Venting Scenario
Jason D. Averill
158
Atrium Fire Layer Height Compartment 1
Time (s)
0 200 400 600 800 1000
Laye
r H
eig
ht (
m)
0
1
2
3
4
5
6
Figure 27: Layer Height in Room of Origin for Atrium Fire with QR Sprinklers and Smoke Venting
Scenario
Performance-Based Codes: Economics, Documentation, and Design
159
Atrium Fire Layer Height Compartment 2
Time (s)
0 200 400 600 800 1000
Laye
r H
eig
ht (
m)
0
2
4
6
8
10
12
Figure 28: Layer Height in Two Story Space for Atrium Fire with QR Sprinklers and Smoke Venting
Scenario
Jason D. Averill
160
Atrium Fire Layer Height Compartment 3
Time (s)
0 200 400 600 800 1000
Laye
r H
eig
ht (
m)
0
1
2
3
4
5
6
Figure 29: Layer Height in Remote Room for Atrium Fire with QR Sprinklers and Smoke Venting
Scenario
Performance-Based Codes: Economics, Documentation, and Design
161
Upper Layer Temperature in Room of Origin for Mercantile Fire
Time (s)
0 200 400 600 800 1000
Up
per
Lay
er
Te
mpe
ratu
re (
C)
0
100
200
300
400
500
Figure 30: Upper Layer Temperature in Room of Origin for Mercantile Fire with Commercial
Sprinklers and No Smoke Venting Scenario
Jason D. Averill
162
Upper Layer Temperature in Remote Room for Mercantile Fire
Time (s)
0 200 400 600 800 1000
Up
per
Lay
er
Te
mpe
ratu
re (
C)
0
100
200
300
400
500
Figure 31: Upper Layer Temperature in Remote Room for Mercantile Fire with Commercial Sprinklers
and No Smoke Venting
Performance-Based Codes: Economics, Documentation, and Design
163
Layer Height in Room of Origin for Mercantile Fire
Time (s)
0 200 400 600 800 1000
Laye
r H
eig
ht (
m)
0
1
2
3
4
Figure 32: Layer Height in Room of Origin for Mercantile Fire with Commercial Sprinklers and No
Smoke Venting Scenario
Jason D. Averill
164
Layer Height in Remote Room for Mercantile Fire
Time (s)
0 200 400 600 800 1000
Laye
r H
eig
ht (
m)
0
1
2
3
4
Figure 33: Layer Height in Remote Room for Mercantile Fire with Commercial Sprinklers and No
Smoke Venting Scenario
Performance-Based Codes: Economics, Documentation, and Design
165
Upper Layer Temperature in Room of Origin for Mercantile Fire
Time (s)
0 200 400 600 800 1000
Up
per
Lay
er
Te
mpe
ratu
re (
C)
0
100
200
300
400
500
Figure 34: Upper Layer Temperature in Room of Origin for Mercantile Fire with QR Sprinklers and
Smoke Venting Scenario
Jason D. Averill
166
Upper Layer Temperature in Remote Room for Mercantile Fire
Time (s)
0 200 400 600 800 1000
Up
per
Lay
er
Te
mpe
ratu
re (
C)
0
100
200
300
400
500
Figure 35: Upper Layer Temperature for Remote Room for Mercantile Fire with QR Sprinklers and
Smoke Venting Scenario
Performance-Based Codes: Economics, Documentation, and Design
167
Layer Height in Room of Origin for Mercantile Fire
Time (s)
0 200 400 600 800 1000
Laye
r H
eig
ht (
m)
0
1
2
3
4
Figure 36: Layer Height in Room in Origin for Mercantile Fire with QR Sprinklers and Smoke Venting
Scenario
Jason D. Averill
168
Layer Height in Remote Room for Mercantile Fire
Time (s)
0 200 400 600 800 1000
Laye
r H
eig
ht (
m)
0
1
2
3
4
Figure 37: Layer Height in Remote Room for Mercantile Fire with QR Sprinklers and Smoke Venting
Scenario
APPENDIX D: CERTIFICATION
Jason D. Averill
170
Jason D. Averill
Education Worcester Polytechnic Institute Worcester, MAMay 1996 Bachelor of Science, Civil EngineeringMay 1998 Master of Science, Fire Protection EngineeringMay 1999 Bachelor of Science, Economics and Technology
Project Master’s Thesis Gaithersburg, MDWork "Performance-Based Analysis of 40 Story Building"
Conducted a fire safety analysis of a mixed occupancy high-rise building usingearlydraft of International Code Committee performance based code. Results to bepresented as a case study at 2nd International Conference on Performance-
BasedCodes in May 1998.
Senior Project (Civil Engineering) Worcester, MA “Analysis and Design of the WPI Campus Center” Developed plans to renovate Alumni Gymnasium and build an addition, using the Institute Campus Center Committees program. Included Fire Protection,
Structural, and Cost Estimation elements.
Senior Project (Economics) Darmstadt, Germany “Economic Analysis of the Hazardous Waste Industry” Developed computer model to determine optimal regulatory strategies for
hazardous waste disposal. Compared regulation of markets in Germany and the UnitedStates.
Certificates Passed Fundamentals of Engineering (FE) Examination
Experience National Institute of Standards and Technology Gaithersburg, MD6/97 to Guest Researcher in the Building and Fire Research Laboratory.Present Specialize in application of computer fire models to engineering problems
from high ceilings to trains to office buildings.
5/96 - 5/97 Computational Fire Modeling Laboratory, Worcester, MA•Performed firesafety analysis of 210’ and 270’ Coast Guard cutters withthe SAFE computer model.•AutoCad modeling for Coast Guard contracts and legal cases.
Relevant •Fire Dynamics I and II •Fire Protection SystemsCourses •Process Safety Management •Fire Laboratory
171
•Building Firesafety I and II •Failure Analysis•Statistics I and II •Probability•System Dynamics
Computer Various CFD and Zone Fire Models, Evacuation Models, StatisticalAnalysis,Skills Windows Applications, AutoCad, HTML, UNIX, LaTeX, SAS, MathCad
Societies • National Fire Protection Association•Society of Fire Protection Engineers•Salamander Society (Fire Protection Honor Society, WPI Chapter)
Publications • Averill, Jason D. and Richard W. Bukowski. “Methods for Predicting Smoke Detector Activation.” 1998 Fire Suppression and Detection Symposium Proceedings, Orlando, FL, 25 – 27 February 1998, IN PRINTING.
Jason D. Averill
172
Curriculum VitaeRichard W. Bukowski, P.E.Personal data:Born - July 4, 1947 in Chicago, ILMarried to Maria (Agostino) BukowskiOne child, Richard W. Bukowski III born 1971
Education:BS EE from Illinois Institute of Technology (Chicago) in 1970.
Work History:1970 - 1973: As a project engineer at Underwriters Laboratories, Inc.Northbrook IL, conducted product evaluations for listing of all types offire alarm and emergency signaling equipment. Worked on thedevelopment of testing programs for several products never beforeevaluated, and wrote or revised a number of UL standards. With promotion to Senior ProjectLeader in 1973, assumed responsibility for special projects; i.e., project evaluations for whichthere were no standards or applicable prior work, for standards development, and for researchstudies.
1973 - 1974: Was sent by UL to the National Bureau of Standards under the Industrial ResearchAssociate program. During this 12 month assignment, conducted research on residential smokedetectors culminating in a draft performance standard which later became the UL standards forsmoke detectors.
1974 - 1975: Returning to UL, worked on a research project in conjunction with IIT ResearchInstitute to develop installation guidelines for residential smoke detectors. The findings of thisstudy resulted in a total revision of the then-accepted practice, and are the basis for current coderequirements in the US, Canada, and many other countries.
1975 - 1981: Returned to NBS, Center for Fire Research as a Research Engineer in the DetectionProject. In this capacity, responsibilities included planning and conduct of internally andexternally-funded projects on residential and commercial detection systems, test methoddevelopment, monitoring of outside grants/contracts, test instrumentation, and general electronicsproblems. Technical assistance was provided to various federal agencies including the US FireAdministration, US Secret Service, Veterans Administration, and Defense Department.Investigative assistance was provided to federal and local agencies in fires of suspected electricalorigin and where detectors were thought to have malfunctioned.
1981 - 1982: Moved into Engineering Management as Acting Head of the Product FlammabilityResearch Group, Fire Performance Evaluation Division. Management duties included directtechnical and administrative supervision of professional and support staff activities, projectplanning and execution, resource management, contracts, and grants. The research activities ofthis group involve ignition and combustion of materials and assemblies not a part of the buildingstructure.
173
1982 to 1989: Served as Research Head, Fire Hazard Analysis Group, Fire Measurement andResearch Division. The objective of the work is to develop predictive, analytical methods whichenable the quantitative assessment of hazard and risk from fires. These predictive methods arebased on computer modeling, and involve all aspects of fire science and related fields such ashuman behavior and physiology, toxicology, data bases and fire statistics, etc. To ensure use,necessary data must be readily available, and data input and presentation must be in terms readilyunderstandable by the average professional. Thus, the projects include a strong emphasis onstate-of-the-art computer graphics and computer aided design techniques and on the establishmentof data base management systems. The embodiment of these goals was the public release of theHAZARD I Fire Hazard Assessment Method and personal computer software package.
1989 to present: Serves as Senior Research Engineer in the Fire Modeling and ApplicationsGroup in the Building and Fire Research Laboratory at NIST. Responsible for technical projectsinvolving the application of fire hazard and fire risk analysis techniques to a broad range ofengineering problems. Also serves as a liaison to the community of users of the science andtechnology developed in BFRL, facilitating the identification of user needs and the utilization ofthe Laboratory's products. As such serves as the BFRL liaison to the model codes groups in theU.S. and to CIB activities related to performance-based codes, nationally and internationally.
Technical Affiliations:• Member, National Fire Protection Association.
• Member, Society of Fire Protection Engineers.
• Licensed Professional Engineer in the States of Illinois and Maryland.
NFPA Committee Memberships:• National Fire Alarm Code Correlating Committee
• Household Fire Warning Equipment (Chair).
• Carbon Monoxide Detectors
• Hazard and Risk of Contents and Furnishings.
• Life Safety Code Technical Correlating Committee, and
• Residential Occupancies,
• Alternative Approaches to Life Safety, and
• Furnishings and Contents.
Other Professional Memberships:
• Technical Advisory Council of the NFPA Center for High Risk Outreach.
• Chairman, Technology Committee, National Smoke Detector Project.
• ASCE Committee on Structural Fire Performance Prediction.
• NFPA Research Section (chair), Building Fire Safety Systems Section
• Chair, CIB W14 Task Group on Engineering Evaluation of Building Fire Safety
• Member, International Code Council Performance Criteria Committee (representingICBO) for the International Building Code.
Jason D. Averill
174
Special Awards:1986 Society of Fire Protection Engineers President's "Hats Off" Award for leadership and
innovation as co-author and instructor for the Engineering of Fire Detection and AlarmSystems course.
1990 Visiting Scientist award from the Government of Japan for study at the Building ResearchInstitute, Tsukuba, Japan.
1990 United States Department of Commerce Silver Medal Award for producing the world'sfirst quantitative fire hazard assessment methodology - HAZARD I.
1997 Automatic Fire Alarm Association, Fire Protection Person of the Year Award
MAJOR PUBLICATIONS1. Bukowski, R.W. and Bright, R.G., Some Problems Noted in the Use of Taguchi
Semiconductor Gas Sensors as Residential Fire/Smoke Detectors, NBSIR 74-591, 1974;and Fire Journal, 69, No. 3, pp 30-33, 102, 1975.
2. Bukowski, R. W. and Bright, R.G. Results of Full-Scale Tests with Photoelectric SmokeDetectors, NBSIR 75-700, 1975.
3. Bukowski, R.W., An Evaluation of Light Emitting Diodes as Source Lamps inPhotoelectric Smoke Detectors, Fire Technology, 11, No. 3, pp 157-163, 1975.
4. Bukowski, R. W., Waterman, T. E., and Christian, W. J. Detector Sensitivity and SitingRequirements for Dwellings ("The Indiana Dunes Report"), NBSGCR 75-51; NFPA SPP-43; and NTIS PB-247483, 1975.
5. Bukowski, R.W., Large-scale Laboratory Fire Tests of Smoke Detectors, Proceedings FireDetection for Life Safety, National Research Council Conference, March 31-April 1,1975, pp 78-92, 1975.
6. Bukowski, R.W., Field Investigation of Residential Smoke Detectors, NBSIR 76-1126,1976; and Fire Journal, 71, No. 2, pp 18-41, 1977.
7. Bukowski, R.W., Fire Alarm and Communication Systems, NBS Technical Note 964,1978.
8. Bukowski, R.W., Smoke Measurements in Large- and Small-Scale Fire Testing, NBSIR78-1502, 1978; and Fire Technology, Part I, 15, No. 3, pp 173-179, and Part II, 15, No. 4,pp 271-281, 1979.
9. Bukowski, R. W.; Mulholland, G. W., Smoke Detector Design and Smoke Properties,NBS Technical Note 973, 1978.
10. Bukowski, R. W., Detection of Fires in Electrical Cables, Proceedings of the NationalAcademy of Sciences Workshop on Flammability, Smoke, Toxicity, and Corrosive Gasesof Electrical Cable Materials, NMAB-342, pp 139-142, 1978.
11. Bukowski, R. W., Tests on the Performance of Automatic Fire Detectors in Health CareOccupancies - A Preliminary Report, NBSIR 79-1739, 1979.
12. Bukowski, R. W., Investigation of the Effects of Heating and Air Conditioning on thePerformance of Smoke Detectors in Mobile Homes, NBSIR 79-1915, 1979.
175
13. Bukowski, R. W. and Istvan, S. M., A Survey of Field Experience with Smoke Detectorsin Health Care Facilities, NBSIR 80-2130, 1980.
14. Bukowski, R. W., Fire Protection Systems for Rail Transportation of Class A Explosives,NBSIR 80-2170, 1980.
15. Hall, J. R., Jr., Bukowski, R. W., and Gomberg, A. Analysis of Electrical FireInvestigations in Ten Cities, NBSIR 83-2803, 1983.
16. Bukowski, R. W., Report for UJNR Panel - Detection in the USA 1980-1982, Proceedingsof the 6th UJNR, Tsukuba, Japan, pp 10-14, 1982.
17. Bukowski, R. W., NFPA Toxicity Advisory Committee Strawman Procedure forEstimating Smoke Toxicity Hazard, Proceedings of the NFPA Toxicity CommitteeWorkshop, 1984.
18. Bukowski, R. W., Toxic Hazard Evaluation of Plenum Cables, Fire Technology, 21, No.4, pp 252-266, 1985.
19. Bukowski, R. W., Development of a Method for Assessing Toxic Hazard, Fire Journal,79, No. 2, 1985.
20. Bukowski, R. W., Evaluation of Furniture Fire Hazard Using a Hazard AssessmentComputer Model, Fire and Materials, 9, No. 4, 1985.
21. Bukowski, R. W., Quantitative Assessment of Smoke Toxicity Hazard -- A PracticalApproach for Current Use, Fire Safety Science - Proceedings of the First InternationalConference, Grant, C.E. and Pagni, P.J. eds., Hemisphere Publishing Corp., N.Y., pp1089-1100, 1985.
22. Bukowski, R. W., Quantitative Assessment of Smoke Toxicity Hazards in LargeStructures, UJNR Panel on Fire Research and Safety, 8th Joint Panel Meeting, May 13-21,1985, Tsukuba, Japan, pp 85-98, 1985.
23. Bukowski, R. W., Application of Models to the Assessment of Fire Hazard fromConsumer Products, NBSIR 85-3219, 1985.
24. Bukowski, R. W., An Introduction to Fire Hazard Modeling, NBSIR 86-3349, 1986.
25. Mulholland, G. W. and Bukowski, R. W., Application of Smoke Detector Technology toQuantitative Respirator Fit Test Methodology, NBSIR 86-3481, 1986.
26. Bukowski, R. W., Fire Detection and Alarm Systems, Proceedings of a Workshop on FireProtection Technology, Cairo, Egypt, NBSIR 86-3360, pp 25-38, 1986.
27. Bukowski, R. W., Engineering Applications for Fire-Related Prediction Tools, ibid., pp19-24, 1986.
28. Bukowski, R. W., A Summary of the Assumptions and Limitations in HAZARD I,Proceedings of the 9th UJNR, Boston, MA, 1987.
29. Bukowski, R. W., HAZARD I. Vol. 1: Fire Hazard Assessment Method, NBSIR 87-3602,1987.
30. Bukowski, R. W., HAZARD I. Vol. 2: Representative Example Case Documentation,NBSIR 87-3603, 1987.
31. Bukowski, R. W., HAZARD I. Vol. 3: Data Base Listing, NBSIR 87-3604, 1987.
Jason D. Averill
176
32. Bukowski, R. W., Hazard Analysis Using Toxic Potency and Other Material PropertyData, Proceedings of the 36th International Wire and Cable Symposium, (Abstract Only),143, 1987.
33. Bukowski, R. W., Techniques for Fire Detection, Proceedings of the NASA Workshop onSpacecraft Fire Safety, Nat. Aeronautics and Space Admin. (US) pp 9-29, 1987.
34. Bukowski, R. W., Smoke Detectors, Alarms, and Controls, NFPA Round table on FireSafety in Atriums - Are the Codes Meeting the Challenge?, December 15-16, 1988, pp 1-19, 1988.
35. Bukowski, R. W., HAZARD I - Results of a User Evaluation of the Prototype Software,NISTIR 88-3878, Nat. Inst. Stand. Tech. (US), 1988.
36. Dubivsky, P. M. and Bukowski, R. W., False Alarm Study of Smoke Detectors inDepartment of Veterans Affairs Medical Centers (VAMCS), NISTIR 89-4077, 1989, Nat.Inst. Stand. and Tech. (US), 1989.
37. Bukowski, R. W., Peacock, R. D., Jones, W. W. and Forney, C. L., Vol. 1 Software Users'Guide for the HAZARD I Fire Hazard Assessment Method, Vol. 2 Technical ReferenceGuide for the HAZARD I Fire Hazard Assessment Method, Vol. 3 Example Cases for theHAZARD I Fire Hazard Assessment Method, NIST Handbook 146, 1989.
38. Bukowski, R. W., An Overview of a Method for Predicting Fire Risk, NISTIR 89-40971989.
39. Bukowski, R. W., Fire Hazard Prediction; HAZARD I and its Role in Fire Codes andStandards, ASTM Standardization News, 18, No. 1, pp 40-43, 1990.
40. Peacock, R.D. and Bukowski, R. W., A Prototype Methodology for Fire Hazard Analysis,Fire Technology, 26, No. 1, 1990.
41. Bukowski, R. W., Stiefel, S. W., Hall, J. R., Jr., and Clarke, F. B., III, Fire RiskAssessment Method: Description of Methodology, NISTIR 90-4242 (1990).
42. Stiefel, S. W., Bukowski, R. W., Hall, J. R., Jr., and Clarke, F. B., III, Fire RiskAssessment Method: Case Study 1, Upholstered Furniture in Residences, NISTIR 90-4243 (1990).
43. Stiefel, S. W., Bukowski, R. W., Hall, J. R., Jr., and Clarke, F. B., III, Fire RiskAssessment Method: Case Study 2, Carpet in Offices, NISTIR 90-4244 (1990).
44. Stiefel, S. W., Bukowski, R. W., Hall, J. R., Jr., and Clarke, F. B., III, Fire RiskAssessment Method: Case Study 3, Concealed Combustibles in Hotels, NISTIR 90-4245(1990).
45. Bukowski, R. W., Jones, W. W., Hall, J. R., Jr., and Clarke, F. B., III, Fire RiskAssessment Method: Case Study 4, Interior Finish in Restaurants, NISTIR 90-4246(1990).
46. Clarke, F. B., III, Bukowski, R. W., Stiefel, S. W., Hall, J. R., Jr., and Steele, S. A., TheNational Fire Protection Research Foundation Fire Risk Assessment Project: Final Report,NFPRF, Quincy, MA 02269 (1990).
47. Bukowski, R. W., Stiefel, S. W., Clarke, F. B., III, and Hall, J. R., Jr., Predicting ProductFire Risk: A Review of Four Case Studies. National Institute of Standards andTechnology, Gaithersburg, MD, Benjamin/Clarke Associates, Inc., Kensington, MDNational Fire Protection Association, Quincy, MA, ASTM STP 1150; American Society
177
for Testing and Materials. Fire Hazard and Fire Risk Assessment. Sponsored by ASTMCommittee E-5 on Fire Standards. ASTM STP 1150. December 3, 1990, ASTM STP1150, San Antonio, TX, ASTM, Philadelphia, PA, Hirschler, M. M., Editor, 136-160 pp,1990.
48. Bukowski, R. W., Improving the Fire Performance of Building Contents, The ConstructionSpecifier, 44, No 2, pp 42-46, (1991).
49. Bukowski, R. W., Fire Models: The Future is Now!, NFPA Journal, 85, No 2, pp 60-62,64, 66-69, March/April (1991).
50. Peacock, R. D., Jones, W. W., Bukowski, R. W., and Forney, C. L., Software User's Guidefor the HAZARD I Fire Hazard Assessment Method. Version 1.1, Volume 1, NationalInstitute of Standards and Technology, Gaithersburg, MD, NIST Handbook 146/I; 297 p.June 1991.
51. Bukowski, R. W., Peacock, R. D., Jones, W. W., and Forney, C. L., Technical ReferenceGuide for the HAZARD I Fire Hazard Assessment Method. Version 1.1, Volume 2.National Institute of Standards and Technology, Gaithersburg, MD, NIST Handbook146/II; 283 p. June 1991.
52. Bukowski, R. W.and Jason, N.H., International Fire Detection Bibliography - 1975 to1990, National Fire Protection Research Foundation, Quincy, MA 02269 (1991).
53. Babrauskas, V., Peacock, R. D., Braun, E., Bukowski, R. W., and Jones, W. W., FirePerformance of Wire and Cable: Reaction-to-fire Tests - A Critical Review of the ExistingMethods and of New Concepts, NIST TN 1291 (1991).
54. Bukowski, R. W. and Spetzler, R. C., An Analysis of the Happyland Social Club Fire withHAZARD I, Fire and Arson Investigator, 42, No 3, pp 36-47, (1992).
55. Bukowski, R. W. and Tanaka, T., Toward the Goal of a Performance Fire Code, Fire andMaterials, 15, pp 175-180, (1991).
56. Bukowski, R. W., A Review of International Fire Risk Prediction Methods, Interflam '93.Fire Safety. 6th International Fire Conference March 30-April 1, 1993, Oxford England,Interscience Communications, Ltd., London, England, C.A. Franks, editor, pp 437-466,1993.
57. Bukowski, R. W., Fire Protection Engineering Tools. Simple Tools: The Equations, Proc.of International Fire Safety Engineering Conference "The Concept & the Tools", CSIRO,Sydney, Australia (1992).
58. Bukowski, R. W., Studies Assess Performance of Residential Detectors, NFPA Journal,87, 1, pp 48-54, (1993).
59 Peacock, R. D., Jones, W. W., and Bukowski, R. W., Verification of a Model of Fire andSmoke Transport. Fire Safety Journal, 21, 2, pp 89-129, 1993.
60. Babrauskas, V., Peacock, R. D., Braun, E., Bukowski, R. W., and Jones, W. W., NewConcepts for Fire Protection of Passenger Rail Transportation Vehicles, InterscienceCommunications Ltd., 2nd Fire and Materials Conference, September 23-24, 1993,Arlington, VA, pp 171-180, 1993.
61. Bukowski, R. W., Balanced Design Concepts Workshop, June 30, July 1-2, 1993, NISTIR5264, 212p., September 1993.
Jason D. Averill
178
62. Forney, G. P., Bukowski, R. W., and Davis, W. D., Fire Modeling: Effects of Flat BeamedCeilings on Detector and Sprinkler Response. International Fire Detection ResearchProject. Technical Report. Year 1. 59p., 1993.
63. Peacock, R. D., Bukowski, R. W., Jones, W. W., Reneke, P. A., Babrauskas, V., andBrown, J. E., Fire Safety of Passenger Trains, NIST TN 1406, Nat. Inst. Stand. Tech.,Gaithersburg, MD 20899 1994; and DOT/FRA/ORD-93/23, Federal RailroadAdministration, Wash. DC, 1994.
64. Bukowski, R. W. and Scawthorn, C., Earthquake and Fire In Japan: When the ThreatBecame a Reality, NFPA Journal, 88, 3, pp 89-92, 94, 96, 1994.
65. Bukowski, R.W. and Babrauskas, V., Developing Rational, Performance-based Fire SafetyRequirements in Model Building Codes, Fire and Materials, 18, pp 173-191, 1994.
66. Davis, W. D., Forney, G. P., and Bukowski, R. W., Field Modeling: Simulating the Effectof Sloped, Beamed Ceilings on Detector and Sprinkler Response, International FireDetection Research Project.Technical Report. Year 2. 34p., 1994.
67. Peacock, R. D.; Bukowski, R. W.; Jones, W. W.; Reneke, P. A., New Concepts for FireProtection of Passenger Rail Transportation Vehicles., Interscience CommunicationsLimited. Fire and Materials. International Conference, 2nd. September 23-24, 1993,Arlington, VA, 171-180 pp, 1993 and International Association for Fire Safety Science.Fire Safety Science. Proceedings. 4th International Symposium. July 13-17, 1994,Ottawa, Ontario, Canada, International Association for Fire Safety Science, Boston, MA,Kashiwagi, T., Editor, 1007-1016 pp, 1994, 1993.
68. Bukowski, R. W., Review of International Fire Risk Prediction Methods, U. S./JapanGovernment Cooperative Program on Natural Resources (UJNR). Fire Research andSafety. 12th Joint Panel Meeting. October 27-November 2, 1992, Tsukuba, Japan,Building Research Inst., Ibaraki, Japan, 232-240 pp, 1994.
69. Bukowski, R. W., FORUM for International Cooperation on Fire Research: 1994 AnnualReport. SFPE Bulletin, 7-9, Society of Fire Protection Engineers, Boston, MA,November/December 1994.
70. Peacock, R. D., Jones, W. W., Forney, G. P., Portier, R. W., Reneke, P. A., Bukowski, R.W., and Klote, J. H., Update Guide for HAZARD I v1.2, NISTIR 5410, 159p, 1994.
71. Forney, G. P., Bukowski, R. W., and Davis, W. D., Simulating the Effect of Flat BeamedCeiling on Detector and Sprinkler Response. Virginia Polytechnic Institute and StateUniv., Blacksburg, Vatell Corp., Blacksburg, VA, American Society of MechanicalEngineers. Fire, Combustion, and Hazardous Waste Processing. HTD-Vol. 296,November 6-11, 1994, Chicago, IL, American Society of Mechanical Engineers, NY,Acharya, S.; Annamalai, K.; Presser, C.; Skocypec, R. D., Editors, 143-150 pp, 1994.
72. Peacock, R.D., Reneke, P.A., Jones, W.W., and Bukowski, R.W., Concepts for FireProtection of Passenger Rail Transportation Vehicles: Past, Present, and Future, Fire andMaterials, 19, 71-87 pp, 1995.
73. Bukowski, R.W., Fire Codes for Global Practice, Progressive Architecture, 117-119 pp,June, 1995.
74. Bukowski, R. W., How to Evaluate Alternative Designs Based on Fire Modeling, NFPAJournal, 89, 2, 68-70,72-74, March/April 1995.
179
75. Bukowski, R. W and Juilliet, E., Emergency Procedures for Employees With Disabilitiesin Office Occupancies, U.S. Fire Administration Booklet available in English, Spanish,and braille, 29 p. 1995.
76. Bukowski, R. W., Predicting the Fire Performance of Buildings: Establishing AppropriateCalculation Methods for Regulatory Applications, Interscience Communications Limited.ASIAFLAM '95. International Conference on Fire Science and Engineering, 1st.Proceedings. March 15-16, 1995, Kowloon, Hong Kong, 9-18 pp, 1995.
77. Bukowski, R.W., Modeling a Backdraft Incident: the 62 Watts St. (NY) Fire, Fire Safetyby Design, Proceedings of an International Conference, July 10-12, 1995, Vol. 2 CaseStudies and Workshop Reports, 77-82 pp, St. Peter=s Campus, Univ. of Sunderland, UK,1995. and NFPA Journal, 89, No. 6, 85-89, 1995.
78. Bukowski, R.W., International Activities for Developing Performance-based Fire Codes,Building Research Institute Fire Safety Design of Buildings and Fire Safety EngineeringMini-Symposium, June 12, 1995, Tsukuba, Japan, IV/1-3 pp., 1995.
79. Davis, W.D., Forney, G.P., and Bukowski, R.W., Developing Detector Siting Rules FromComputational Experiments in Spaces with Complex Geometries, University of Duisburg,International Conference on Automatic Fire Detection, AAUBE >95", 10th, April 4-6,1995, Duisburg, Germany, H. Luck ed., 419-428 pp, 1995.
80. Bukowski, R.W., On the Central Role of Fire Calorimetry in Modern Fire HazardAssessment, Fire Calorimetry Proceedings, July 27-28, 1995, Gaithersburg, MD, M.Hirschler and R. Lyon ed., 81 pp, 1995.
81. Peacock, R.D., Bukowski, R.W., and Babrauskas, V., Defining Flashover for Fire HazardCalculations, Fire Calorimetry Proceedings, July 27-28, 1995, Gaithersburg, MD, M.Hirschler and R. Lyon ed., 82-91 pp, 1995.
82. Bukowski, R.W. and Budnick, E.K., Guide for the Implementation of PL 102-522 for FireAlarm and Automatic Sprinkler Installations, Dept. of Housing and Urban DevelopmentHUD-1571-PDR, 94 p., 1995.
83. Bukowski, R.W., Setting Performance Code Objectives: How Do We Decide WhatPerformance the Codes Intend? Interflam >96, 7th International Conference Proceedings,Cambridge, England, C. Franks and S. Grayson, ed., 555-561 p., 1996.
84. Bukowski, R.W., Risk and Performance Standards, Proceedings, Fire Risk and HazardAssessment Symposium, June 26-28, 1996, San Francisco, CA, National Fire ProtectionResearch Foundation, Quincy MA, 1996.
85. Bukowski, R.W., Fire Hazard Assessment, Section 11, Chapter 7, NFPA Fire ProtectionHandbook, 18th edition, J. Linville, ed., 1997.
86. Bukowski, R.W., A Hypothetical Model for a Performance-based Codes System for theUnited States, Proceedings, International Conference on Performance-based Codes andFire Safety Design Methods, Sept. 24-26, 1996, Ottawa Ontario Canada, SFPE Boston,MA, B. Meacham, ed., 1996.
87. Bukowski, R.W., Fire Risk or Fire Hazard as the Basis for Building Fire SafetyPerformance Evaluation, Proceedings, Fire Safety Conference on PerformanceBased Concepts, Oct. 15-17, 1996, Zurich Switzerland, 1996.
Jason D. Averill
180
88. Bukowski, R.W., Performance-Based Fire Safety Evaluation of Large PublicOccupancies, Proceedings, Applications of the Performance Concept in Building,Dec. 9-12, Tel Aviv, Israel, R. Becker, ed., 1996.
89. Klote, J.H., Forney, G.P., Davis, W.D., and Bukowski, R.W., Field Modeling:Simulating the Effects of HVAC Induced Air Flow from Slot Diffusers on DetectorResponse, Year 3 Technical Report, National Fire Protection ResearchFoundation, Quincy, MA 02269, 1996.
90. Bukowski, R.W., Applications of FASTLite, Society of Fire Protection Engineersand WPI Center for Firesafety Studies, Technical Symposium on ComputerApplications in Fire Protection Engineering, June 20-21, 1996, Proceedings, 59-66pp, 1996.
91. Bukowski, R.W., Fire Safety Engineering in Pursuit of Performance-based Codes:Collected Papers, NISTIR 5878, CIB W14/96/5 (USA), 111 p., 1996.
92. Bukowski, R.W., What Every Chief Should Know About Performance-basedCodes, International Fire Chief, 40, 12, 34-36, December 1996.
93. Bukowski, R.W., HAZARD II: Implementation for Fire Safety Engineering, FireSafety Design and Fire Safety Engineering, Conference Compendium,Proceedings, Session 3, Fire Safety Engineering Tools, August 19-20, 1996, Oslo,Norway, 1-7 pp, 1996.
BOOKS1. Bukowski, R.W., Handbook of Building Security, Planning, and Design, Peter S.
Hopf AIA, ed., Chapter 19, "Fire Alarm and Communications Systems", McGraw-Hill Book Co., 1979.
2. Bukowski, R.W., Fire Protection Handbook - 15th edition, G. McKinnon, ed.,Section 15, Chapter 2, "Automatic and Manual Protective Signaling Systems,"Chapter 3, "Household Warning Systems," and Chapter 4, "Fire DetectionMechanisms and Devices," 1981.
3. Bukowski, R.W., Encyclopedia of Science and Technology, 6th edition, McGraw-Hill Book Co., Entries on "Fire Detector" and "Smoke", 1985.
4. Bukowski, R. W., O'Laughlin, R. J., and Zimmerman, C. E., Fire Alarm SignalingSystems Handbook, National Fire Protection Assn. and the Society of FireProtection Engineers, first edition, 1987.
5. Bukowski, R. W. and O'Laughlin, R. J., Fire Alarm Signaling Systems, National FireProtection Assn. and the Society of Fire Protection Engineers, second edition, 430pp 1994.
181
Professor Jonathan R. Barnett, Ph.D.
Associate Professor of Fire Protection Engineering
Center for Firesafety Studies
Worcester Polytechnic Institute
Dr. Jonathan R. Barnett is an Associate Professor of Fire Protection engineering at the
Worcester Polytechnic Institute (WPI) Center for Firesafety Studies. He has held various
positions with the Center since 1979. He earned his B.S. and M.S. degrees from WPI in
Civil Engineering in 1974 and 1976 and his PhD from WPI in Mechanical Engineering in
1989. His professional activities are very broad and have included appointments as the
Editor of the Society of Fire Protection Engineers (SFPE) Journal of Fire Protection
Engineering, Associate Editor of the American Society Of Civil Engineers Journal of
Structural Engineering, President of the New England Chapter of the SFPE and Chair of
the American Society of Civil Engineers Committee on Fire Protection. He holds
memberships in the National Fire Protection Association, the American Society of Civil
Engineers, the American Society of Mechanical Engineers, the New Zealand Chapter
SFPE, and the American Society of Testing and Materials.
His funded research activities have included studies in structural fire protection as well as
transit systems, submarine, building and ship computer modeling of fire. Organizations
funding his research have included the American Iron and Steel Institute, Parsons-
Brinckerhoff Quade and Douglas, the United States Coast Guard, the Electric Boat
Jason D. Averill
182
Division of General Dynamics and the Building and Fire Research Laboratory of the
National Institute of Standards and Technology and the National Science Foundation.
His consulting activities have included expert testimony in fire litigation, industrial design
activities and the firesafety design of various buildings. He is a special consultant to
Robert W. Sullivan, a building firesafety design firm in Boston, Massachusetts.
He has taught courses at the graduate level in building firesafety analysis and design,
sprinkler system design, computer application in fire protection engineering, introductory
fire dynamics and advanced topics of fire dynamics. He has been the principle advisor of
over twenty five graduate theses in fire protection engineering. In addition, he has taught
short courses in fire modeling in the USA, Australia, Canada, New Zealand and the
United Kingdom. Finally, he has done extensive studies of the New Zealand building
code, the only implementation of a performance based building code in the world. As a
result of this activity, several presentations have been given on the development and
implementation of new, performance based building codes in the United States.
Appendix E: AutoCad Drawings
Jason D. Averill
184
Figure 38: Elevation View
185
Figure 39: Elevator Schematic
Jason D. Averill
186
Figure 40: Plan View of Typical Office Level
187
Figure 41: Plan View of Typical Four Tenant Layout
Jason D. Averill
188
Figure 42: Plan View of First Floor Using the Performance Design
189
Figure 43: 2nd Floor Plan View
Jason D. Averill
190
Figure 44: Building Core using Performance-Based Design
191
Figure 45: Building Core Using Prescriptive Design Core


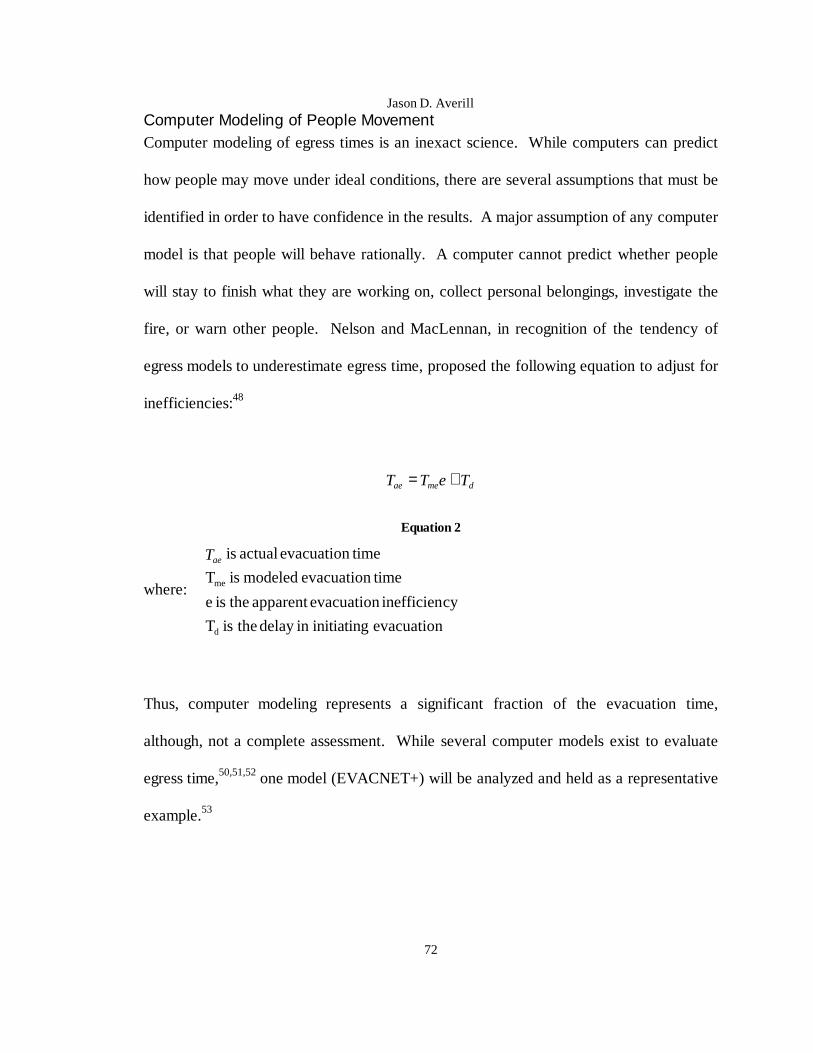


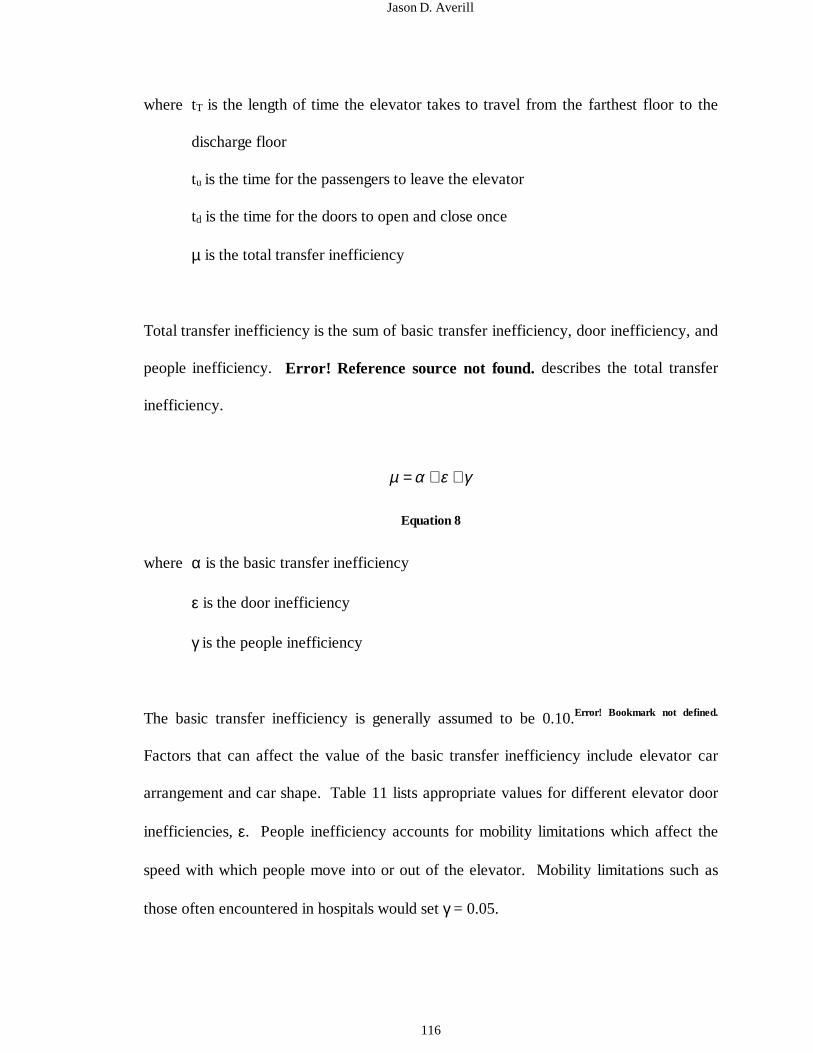
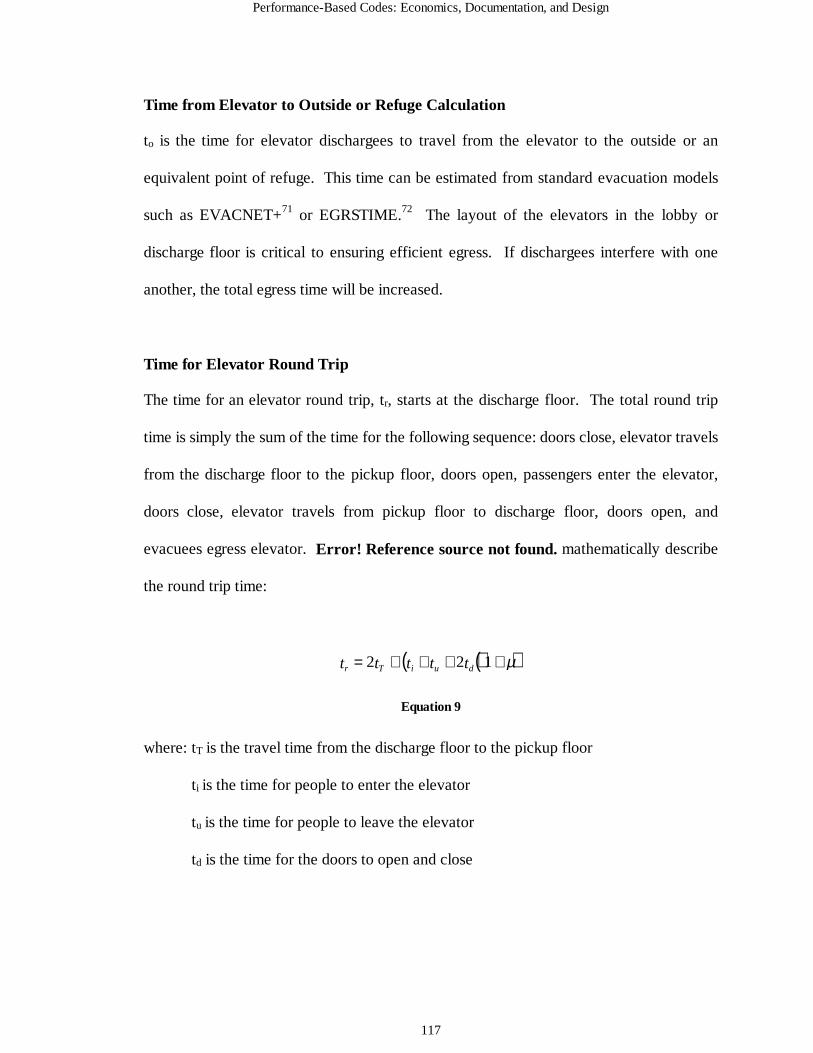
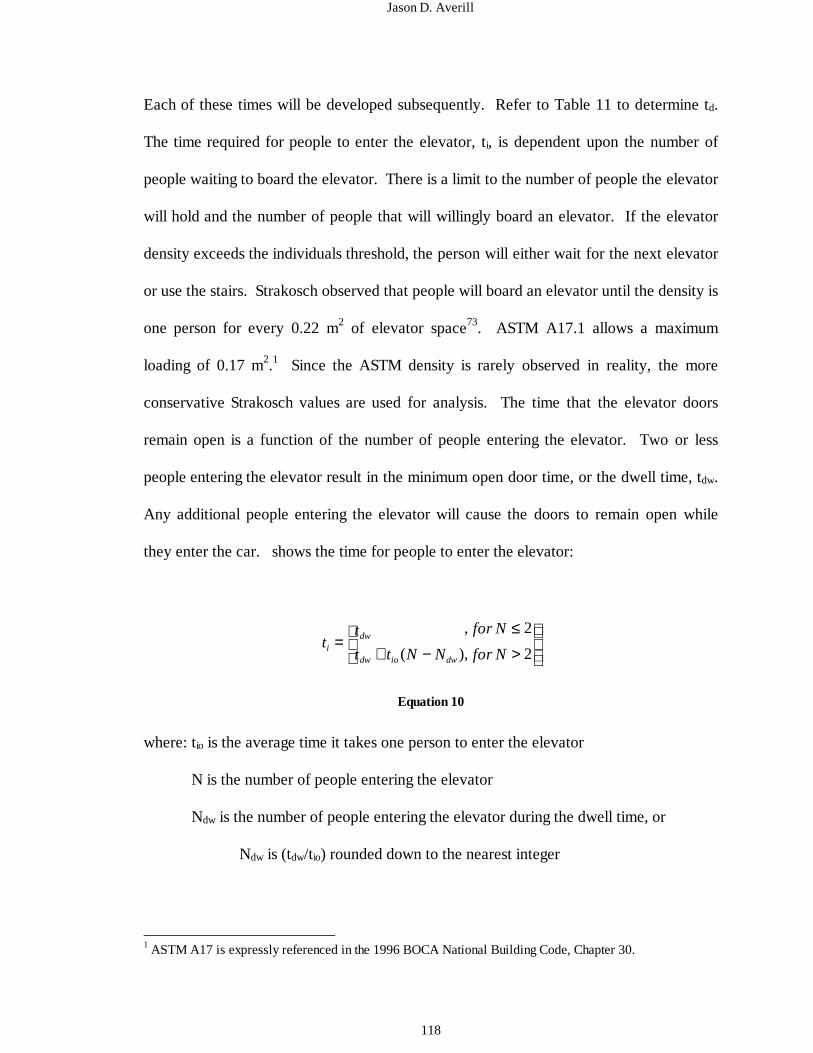


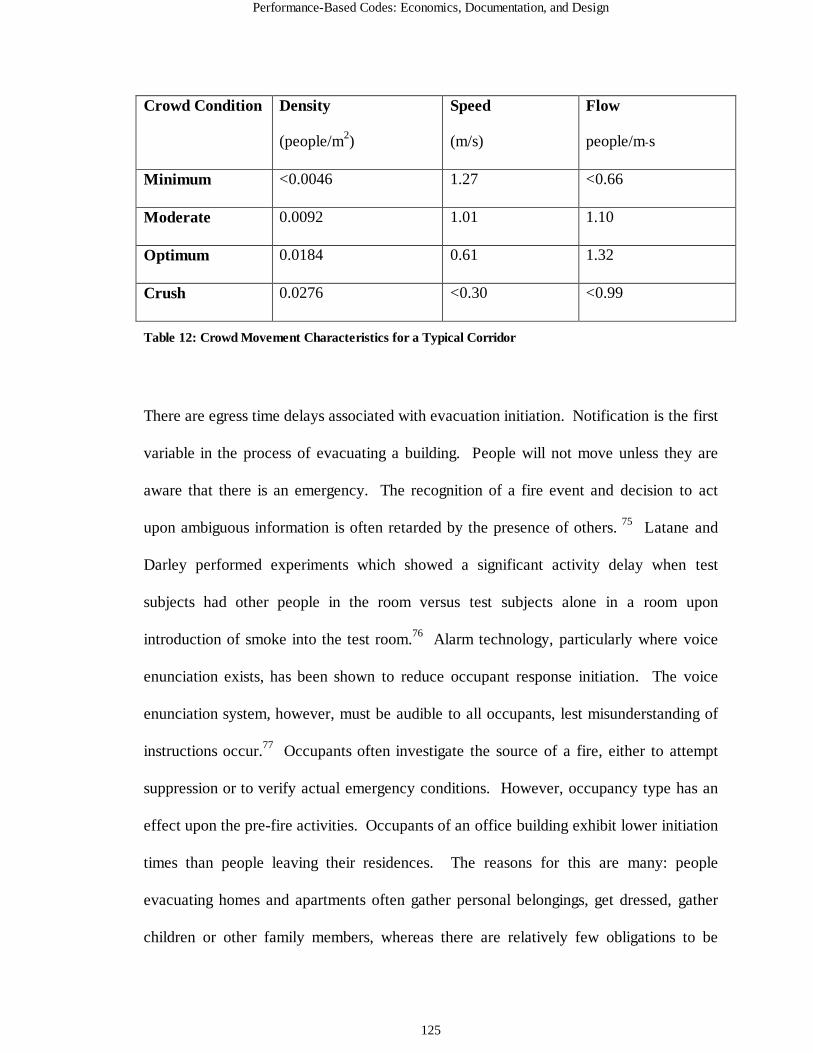
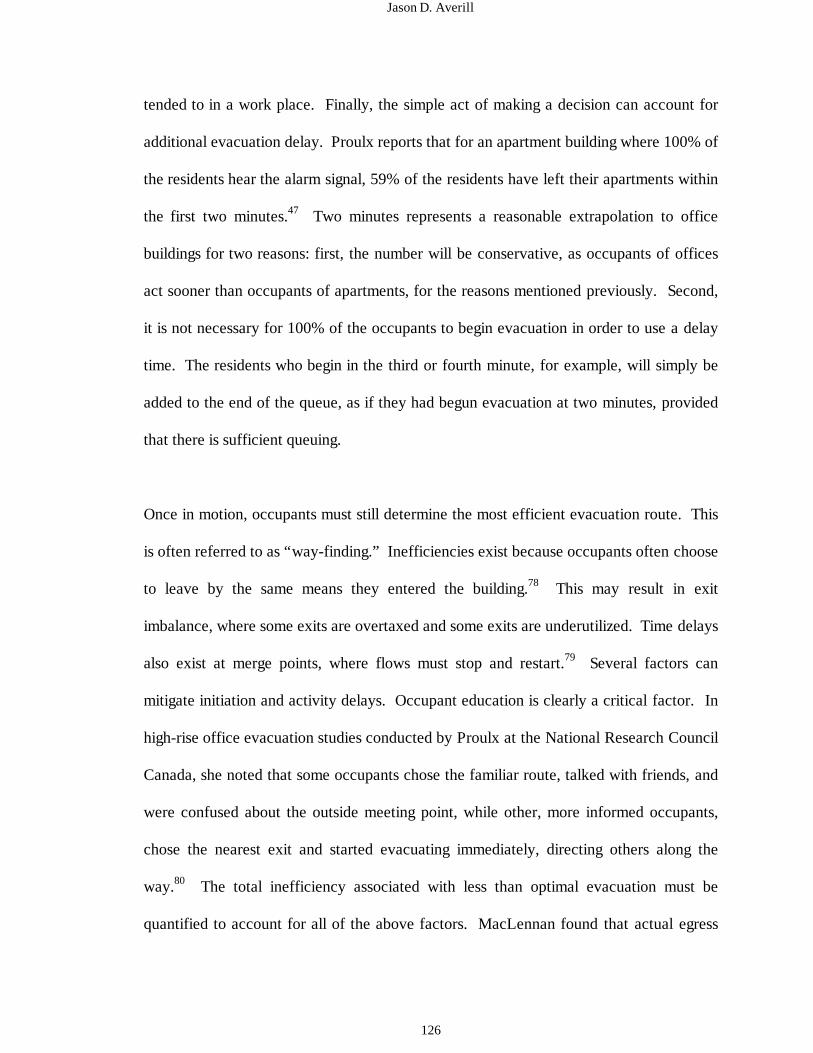


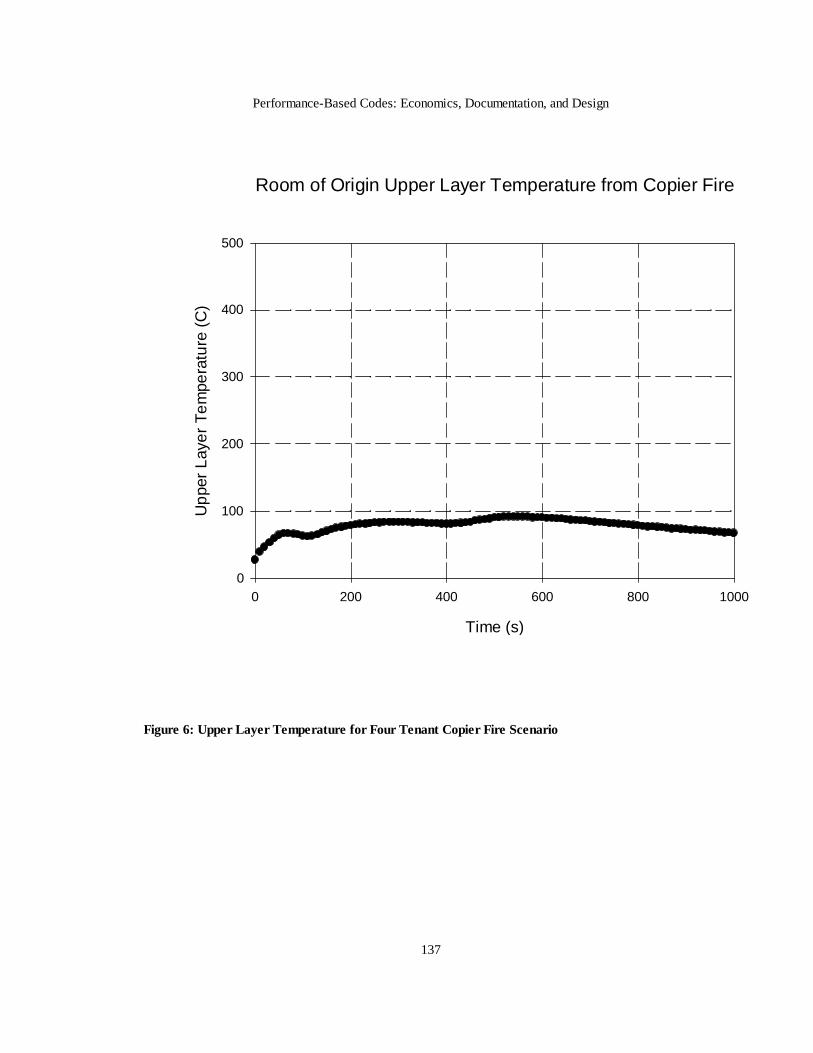


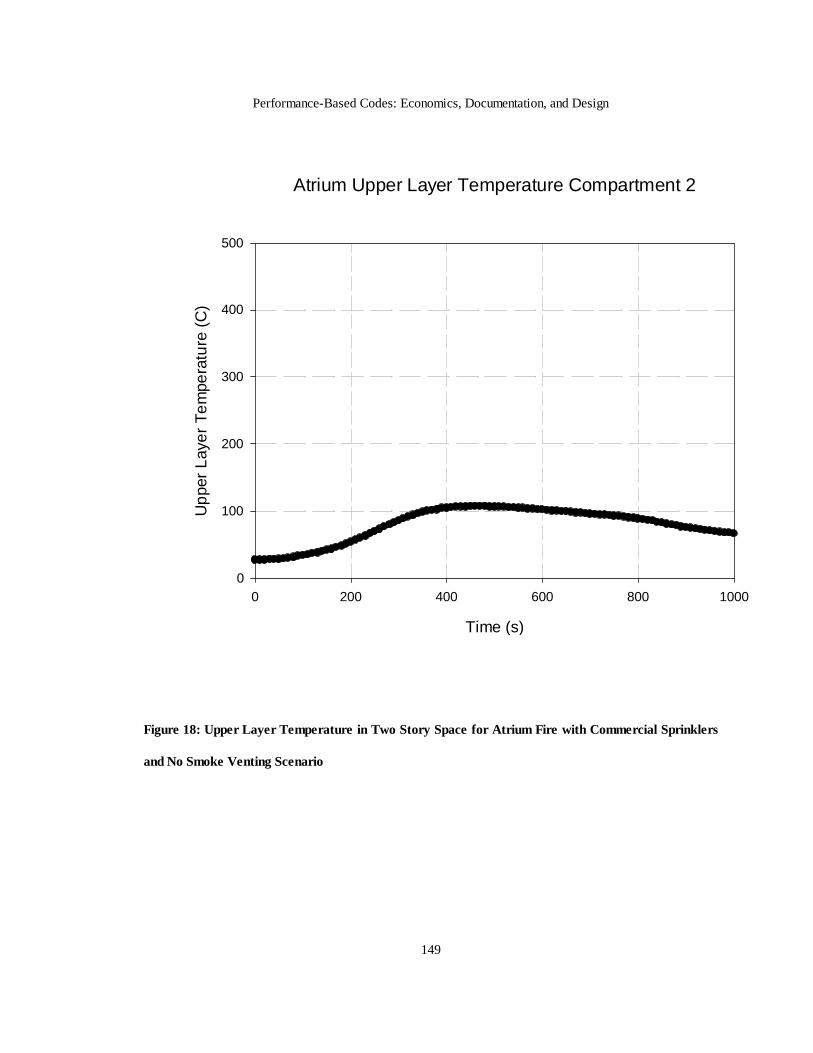


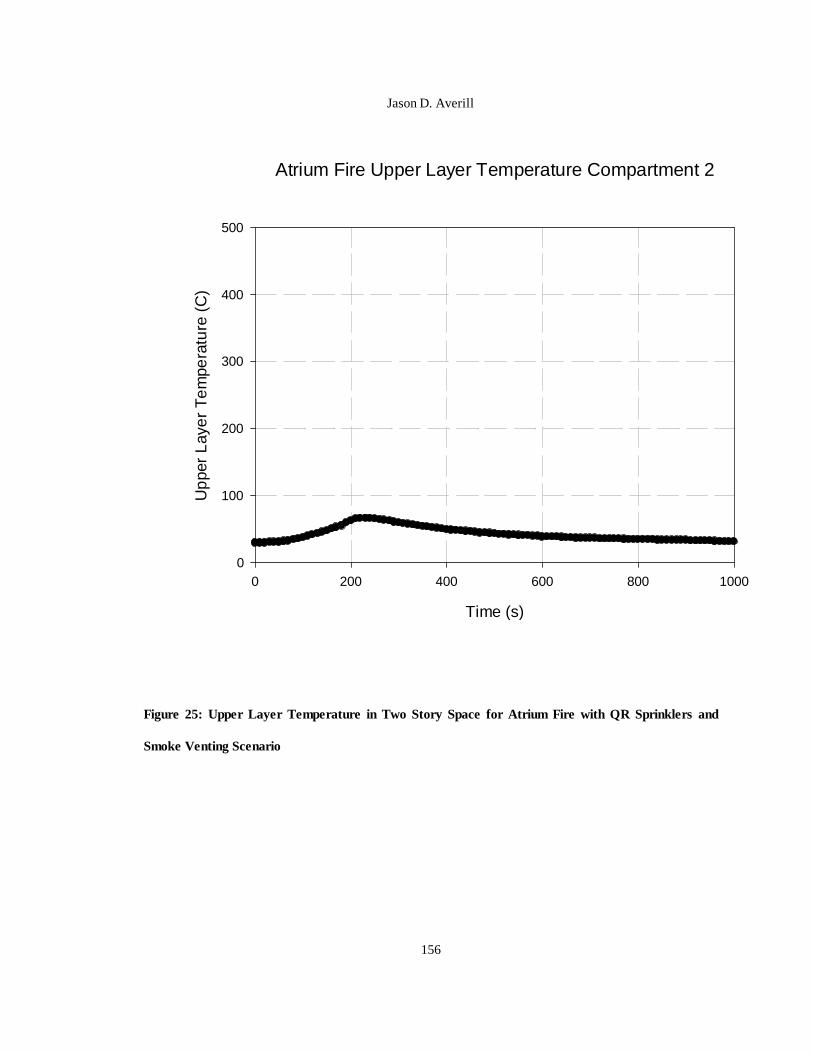


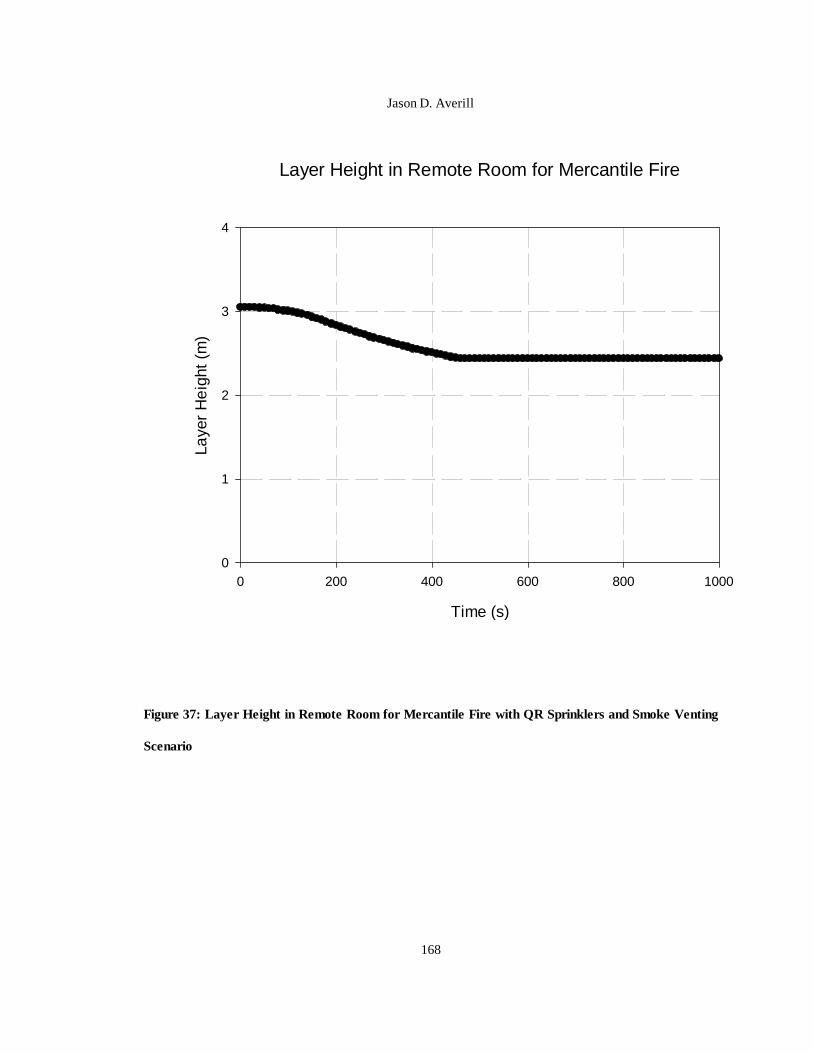


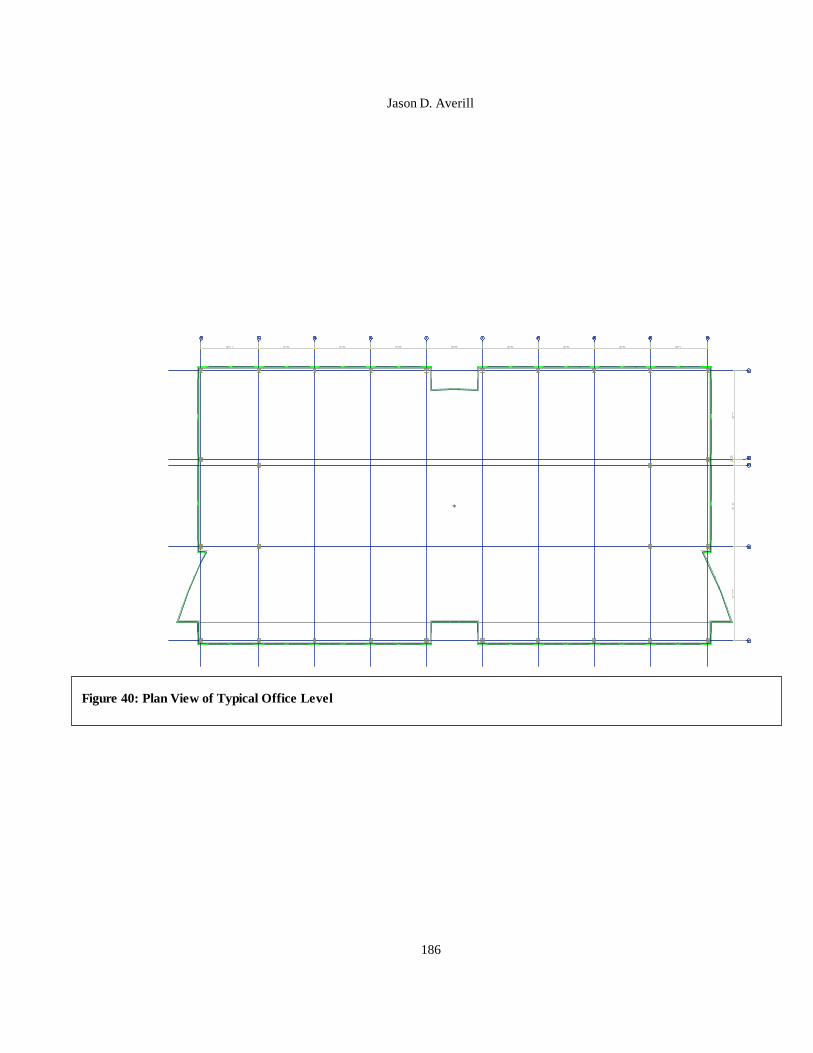


![Web view[MS-ERREF]: Windows Error Codes. Intellectual Property Rights Notice for Open Specifications Documentation. Technical Documentation. Microsoft publishes](https://static.documents.pub/doc/80x56/5a7888a07f8b9a8c428cdf70/web-viewms-erref-windows-error-codes-intellectual-property-rights-notice-for.jpg)


![winprotocoldoc.blob.core.windows.net... · Web view[MS-FSCC]: File System Control Codes. Intellectual Property Rights Notice for Open Specifications Documentation. Technical Documentation.](https://static.documents.pub/doc/80x56/5ed15f36756627081c256f19/-web-view-ms-fscc-file-system-control-codes-intellectual-property-rights.jpg)


