Performance Comparison of Thermal Insulated Packaging Boxes, Bags and Refrigerants for Single-parcel Shipments S. P. Singh School of Packaging, Michigan State University, East Lansing, Michigan, USA Gary Burgess School of Packaging, Michigan State University, East Lansing, Michigan, USA Jay Singh College of Business, Cal Poly State University, San Luis Obispo, California, USA ABSTRACT A range of packaging solutions exists for products that must be kept within a specific temperature range throughout the supply-and-distribution chain. This report summarizes the results of studies conducted over a span of 2 years by the Consortium for Distribution Packaging at Michigan State University. Thermal insulation packaging materials such as expanded polystyrene, polyurethane, corrugated fibreboard, ThermalCor® and other composite packaging such as thermal insulating bags were studied. Phase change materials such as gel packs were also evaluated. Properties such as R-value, melting point and heat absorption were examined and are reported. KEY WORDS: temperature; insulation; packaging; gel packs; parcel; shipping; phase change materials I INTRODUCTION Thermal abuse is a primary concern during the distribution of temperature-sensitive goods such as pharmaceutical, food, electronic and horticulture products. Insulated packaging can maintain product
Transcript
Performance Comparison of Thermal Insulated Packaging Boxes, Bags and Refrigerants for Single-parcel Shipments S. P. Singh
School of Packaging, Michigan State University, East Lansing, Michigan, USA
Gary Burgess
School of Packaging, Michigan State University, East Lansing, Michigan, USA
Jay Singh
College of Business, Cal Poly State University, San Luis Obispo, California, USA
ABSTRACT
A range of packaging solutions exists for products that must be kept within a specific temperature range
throughout the supply-and-distribution chain. This report summarizes the results of studies conducted
over a span of 2 years by the Consortium for Distribution Packaging at Michigan State University.
Thermal insulation packaging materials such as expanded polystyrene, polyurethane, corrugated
fibreboard, ThermalCor® and other composite packaging such as thermal insulating bags were studied.
Phase change materials such as gel packs were also evaluated. Properties such as R-value, melting point
and heat absorption were examined and are reported.
Thermal abuse is a primary concern during the distribution of temperature-sensitive goods such as
pharmaceutical, food, electronic and horticulture products. Insulated packaging can maintain product
lib-dc
Typewritten Text
This is the pre-peer reviewed version of the following article: Singh, S. P., Burgess, G. and Singh, J. (2008), Performance comparison of thermal insulated packaging boxes, bags and refrigerants for single-parcel shipments. Packaging Technology and Science, 21: 25–35. doi: 10.1002/pts.773, which has been published in final form at http://onlinelibrary.wiley.com/doi/10.1002/pts.773/abstract
temperatures within acceptable ranges and slow down the deterioration of the product in the
distribution environment until it reaches the consumer. In addition to high resistance to the transfer of
heat, a good insulating material must have various characteristics, depending upon the application. For
packaging applications, low cost, low moisture susceptibility, ease of fabrication and transportation,
consumer appeal, and mechanical strength are the most relevant characteristics.
Distribution and marketing of temperature-sensitive goods can be achieved by three different modes,
namely carrier-controlled thermal chain, one-way systems and two-way systems. Carrier controlled
thermal chains provide refrigerated trailers for the transportation of goods over longer distances. They
attempt to keep products within the required temperature range and allow the use of ground freight
instead of air. The disadvantages of this method include the higher cost of shipping smaller lots and the
restricted number of destinations and temperature ranges available. One-way systems offer advantages
of rapid package design and validation using various insulated shipping containers and phase change
materials (PCMs). Two-way systems are the third category of solutions available for the distribution of
temperature-sensitive products. Reusable shipping containers, which fall in this category, typically have
an impact-resistant exterior and offer improved temperature control. But it is difficult to monitor the
costs and it requires high inventories.
The choice of distribution system is governed by payloads, transit time, temperature sensitivity of the
product, customer acceptance and cost. One-way systems have emerged as the most popular because
of their ease of application. Insulated containers provide insulation using different material combination
choices and refrigerants in order to maintain the desired temperatures and preserve product quality.
I.I Heat transfer
Heat flows by means of three mechanisms: conduction, convection and radiation.1 Conduction is the
molecule-to-molecule transfer of kinetic energy. One molecule becomes energized and, in turn,
energizes adjacent molecules. A cast-iron skillet handle heats up because of conduction through the
metal. Convection is the transfer of heat by physically moving heat from one place to another. Forced-
air heating systems work by moving hot air from one place to another. Radiation is the transfer of heat
through space by electromagnetic waves (radiant energy). A campfire emits enough radiant heat to
warm objects at a distance.
In packaging applications, one or more of the above-mentioned modes of transmission usually plays a
role. The wall thickness of shipping containers (conduction), the number of surfaces (convection) and
the number of reflective surfaces such as aluminum foil (radiation) determines the insulating ability of a
container.2 Any material that offers a high resistance to the transfer of heat by conduction, convection
or radiation serves as a form of insulation. Most insulating materials utilize low thermal conductivity as a
means of restricting the transfer of heat, although radiation and convection are also significant.
Radiation can be restricted using a material with high reflectivity such as aluminum foil.
The most common insulating material used for packaging applications is plastic foam, which consists of
small air spaces surrounded by solid walls. The low thermal conductivity of foam is attributed to the low
thermal conductivity of the air enclosed within the cells and the relatively small amount of solid material
through which heat may be conducted. Some cellular plastics depend on the low thermal conductivity of
gases such as chlorofluorocarbons, hydrofluorocarbons or hydrochlorofluorocarbons (blowing agents)
inside their cells to maintain lower thermal conductivity.3 Although heat transfer in cellular plastics
occurs by all three mechanisms, conduction of heat through trapped gases in foam is the primary
mechanism of heat transfer in comparison with convection or radiation, since gases occupy 90–98% by
volume.3
Other factors that affect thermal conductivity of cellular plastics are temperature and moisture. Thermal
conductivity of most materials decreases with temperature. Absorbed moisture, depending on the
temperature on either side of the insulation, is known to reduce the thermal resistance of cellular
plastics because it replaces the gas in the cellular structure. It can also result in latent heat transfer
through evaporation and condensation.3
The four principal materials employed by the packaging industry today include fibres, foams, reflectors
and loose-fills. Most fibrous insulation has very low density and relies on trapped air to slow the heat
transfer. The fibres are held together by means of organic binders that give it structural strength. Foams
are either open- or closed-cell structures. Closed-cell foam entraps gases to reduce the conduction
portion of heat transfer. Open-cell foam uses similar air pockets, and retards heat transfer by means of
creating a tortuous path. Conduction in foams is less than that for fibrous insulation due to the nature of
the cell structure. Reflective surfaces have low emittance and block a large portion of radiant heat flow.
When used in vacuum systems, foil reflectors are often layered between thin fibrous materials. Systems
designed for use with air are less energy efficient, and can cost much more than other insulative means.
Loose-fill insulation generally consists of a mass of unstructured fibres composed of rock slag, glass or
alumina-silica, which are packed into cavities. Powders, such as perlite, silica aerogel and adiatomaceous
earth, can also be used.4
I.2 PCMs
Changing the physical state of the material from solid to liquid requires the addition of heat. When
energy is supplied to a solid at its melting point, the energy causes the solid to melt without changing its
temperature. During a phase change, the energy supplied goes into breaking the molecular bonds that
make it a solid. Latent heat is the term used to describe the heat energy that accompanies a change of
state without a corresponding change in temperature.
PCMs take advantage of latent heat. PCMs can be designed to melt within a narrow temperature range.
This temperature range is determined by the hydrocarbon molecule length of the PCM.5 When a PCM is
Foam panels line the top. bottom andfouf sides of a full overlap corrugatedbox
Foam panels line the top. bottom andfour sides of a full overlap corrugatedbox
Full overlap corrugated box
Foam sandwiched betweenpaperboard faces
Foam sandwiched in paperboard withunglued ThermalCor® tube
Foam sandwiched in foil-laminatedpaperboard
Foam sandwiched in foil-laminatedpaperboard and a 4.8mm flexible foilbag
38mm thick32-mm-thick walls with 50 mm
flexible foam for top and bottomBoth inside and outside boxes are
ThermaICor®, with a 13 mm gap inbetween the boxes
13 mm gap in between the boxes
50.8 X 50.8
53.3 X 52.1
27.9 X 27.9 X 29.5
27.9 X 27.9 x 29.5
27.9 X 27.9 X 29.5
27.9 X 27.9 X 29.5
27.9 X 27.9 X 29.5
27.9 X 27.9 X 30.531.1 X 26.7 X 33.0
27.9 X 27.9 X 29.5
27.9 X 27.9 X 29.5
27.9 X 27.9 X 29.5,22.9 X 22.9 X 24.5
27.9 X 27.9 X 29.5,22.9 X 22.9 X 24.527.9 X 27.9 X 29.5,22.9 X 22.9 X 24.527.9 X 27.9 X 29.5,22.9 X 22.9 X 24.5
Foil ThermalCor® box with4.8 mm foil jacket insert
C-Flute corrugatedfibreboard* box with 19mm-thick EPS foam panels
C-Flute corrugatedfibreboard* box with 13mm-thick EP5 foam panels
C-Flute corrugatedfibreboard box, 4 mm thick
Oyster ThermalCor\IDt box
EPS container with lidPolyurethane foam moulded
containerThermalCor® box in a
ThermalCor® box
ThermalCor® box withThermalCor® tube
Foil ThermalCor® box
Foil-laminated ThermalCor®box in a ThermalCor® box
ThermalCor® box in a foillaminated ThermalCor® box
Foil-laminated ThermalCor®box in a foil-laminatedThermalCor® box
Keep Cool®! insulating bag
Therm-A-5nap®! insulating bag
la
12
14
13
II
Ib
10
2
9
4
3
5
6
78
Metallized printed film, 0.095 mm PEfilm thick, snap-in type closure
PE printed film, metallized film0.180 mm thick, snap-in type closure
*The 'flute' describes the structure of the wave-shaped fibreboard material that makes up a board's corrugation. C-Flute has 128 flutesper metre.t ThermalCor@ is an insulated box made of extruded polystyrene from recycled resin and virgin linerboard.*Keep Cool<!l and Therm-A-SnapfJ insulated thermal bags are made of triple-walled polyethylene film.
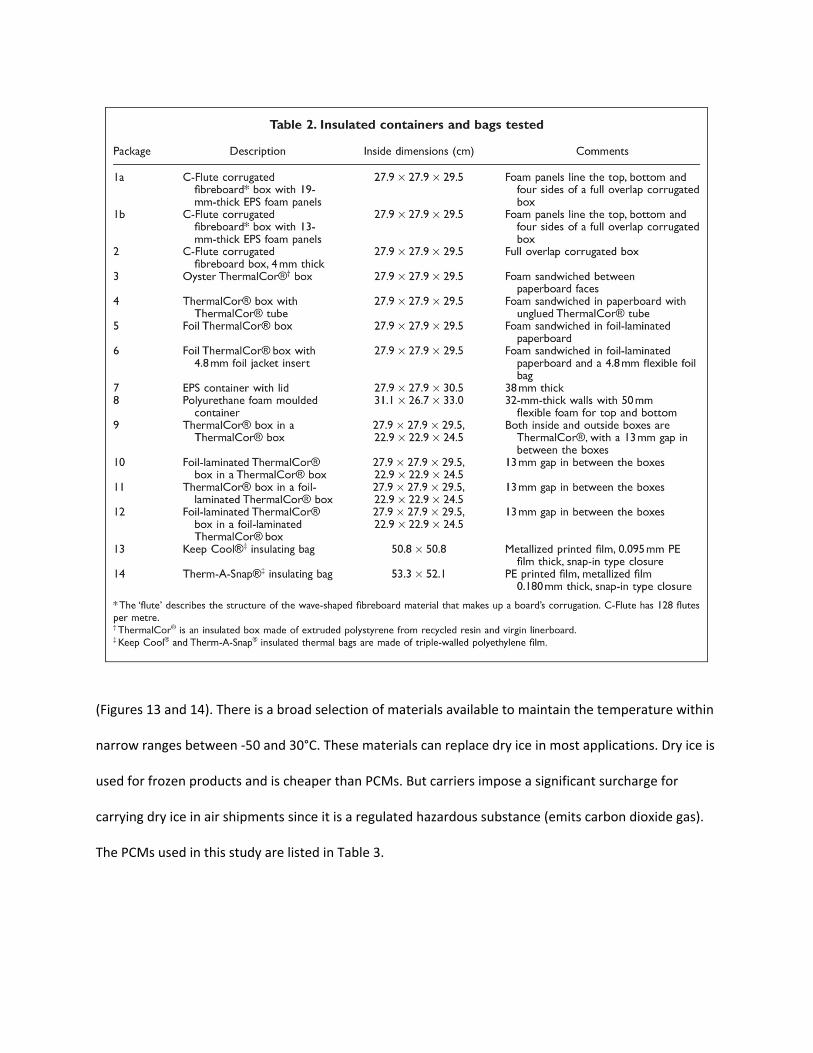
(Figures 13 and 14). There is a broad selection of materials available to maintain the temperature within
narrow ranges between -50 and 30°C. These materials can replace dry ice in most applications. Dry ice is
used for frozen products and is cheaper than PCMs. But carriers impose a significant surcharge for
carrying dry ice in air shipments since it is a regulated hazardous substance (emits carbon dioxide gas).
The PCMs used in this study are listed in Table 3.
\fIt..r;IFigure 1. Corrugated box with EPS foam panels. Figure 4.ThermalCor® box with ThermalCor® tube.
Figure 7. Expanded polystyrene (EPS cooler). Figure 10. Foil-laminated ThermalCor® box in a ThermalCor® box.
Figure 8. Moulded container box with polyurethane foam. Figure 11.ThermalCor® box in a foil laminated ThermalCor® box
Figure 9.ThermalCor® box in a ThermalCor® box Figure 12.Foil-laminated ThermalCor® box in a foil-laminated ThermalCor® box.
Figure 13.Keep Cool® thermal insulating bag.
Figure 14.Therm-A-Snap® thermal insulating bag.
3 INSTRUMENTATION ANDTEST PROCEDURES
3.1 Temperature monitors
Temp Tale Model 3 temperature monitors from Sensitech Inc. (Beverly, MA, USA) were used to monitor
the temperature inside the insulating containers and bags tested. The temperature monitors had
stainless steel probes that could be inserted into the package to record the temperature. The devices
were factory calibrated, with the accuracy tested to National Institute of Standards and Technology
(NIST) traceable standards. The Sensitech Temp Tale 3 temperature monitors had a resolution of 0.1°C
and measured in the −30 to 85°C range. The sensor accuracies are provided below:
sensor accuracy:
Table 3. Properties of gel packs (GP) and PCMs
Size Melting point Latent heatProduct name Type Weight (g) L xW X D (cm) ('C) (kJ/kg)
Polar Pack GP 680 22.2 x 14.6 x 3.8 -1.1 314Utek #597 PCM 454 16.5 x 16.5 x 2.2 -4.5 395Ice Brix GP 680 20.3 x 15.2 x 3.2 0.6 349Johnny Plastic XC48Y PCM 1190 27.3 x 15.2 x 4.4 -5.6 418Kool-It Bricks GP 680 12.7 x 12.7 x 4.4 0 356Cold-Ice GP 454 17.8 x 15.2 x 2.5 1.7 349P-5 Hot-Cold GP 680 21.6 x 21.6 x 2.5 -2.2 344Guardian PCM4C PCM 454 22.9 x 7.6 x 2.5 3.3 353Re-Freez-R-Brix GP 908 22.9 x 10.2 x 3.8 -0.6 339Vaxi-5afe PCM PCM 454 22.9 x 8.3 x 2.5 3.9 314Cryopak GP 680 41.9 x 30.5 x 1.9 0 337Teap TH7-PCM PCM 340 15.2 x 10.2 x 3.8 7.2 383
±2°C, from −30 to −17.78°C
±1°C, from −17.78 to +50°C
±2°C, from +50 to +85°C
3.2 R-value measurement
The resistance to the flow of heat through an insulating package designated as the system R-value is
calculated using ice-melt tests.3The test is based on the principal that 1 kg of regular ice must absorb
335kJ of heat to melt. By placing a known quantity of ice inside the container, the rate of heat transfer
into the container can be calculated from the quantity of ice melted at the end of test.
To conduct the ice-melt test, the ice was first preconditioned for the actual test. A sufficient quantity of
regular ice (approximately 2.5kg) was placed in a non-metallic bucket and allowed to melt. After an
interval of time (approximately 2h) the water from the bucket was drained. This ensured that the ice
was at its melting temperature of 0°C uniformly and not at the freezer temperature where it was stored.
The bucket was then placed at the centre of the container, which was then closed tightly with tape, or
in insulating bags, which were closed per the manufacturer’s instructions. Corrugated boxes, plain
was then sealed. The lowest temperature reached by water was recorded. The latent heat was
calculated from the heat balance:
Heat lost by water = Heat gained by gel pack
To validate this procedure, frozen water bags were used as gel packs and the procedure mentioned
above was used to determine the latent heat of water as follows:
• water + bucket weight = 5.5kg
• gel pack (water bag) weight = 0.9kg
• freezer temperature = −18°C (±2°C)
• starting water temperature = 20.94°C (Figure 16)
• lowest water temperature = 4.89°C (Figure 16)
• calculated latent heat for water = 345kJ/kg
• known value for pure water = 335kJ/kg
4 RESULTS
4.1 System R-value results
System R-values of 12 different insulated container systems were measured using three replicates each
for 24h. Containers 2 and 3 were tested for 12h because of high melt rates of ice. Two different
insulated bags were also tested. The bag tests were only conducted for 2h since the ice melted much
faster. The weight of water collected at the end of tests was converted into melt rates, which in turn
gave system R-values using the equation in section 3.2. The results are summarized in Tables 4 and 5.
4.2 Melting point and latent heat results
Melting points and latent heats were measured using three replicates with the method specified in 3.3.
The results are summarized in Table 3 below.
5 USE OF RESULTS
The system R-value and the thermal properties of gel packs can be used to estimate the amount of gel
packs needed to keep a product cool during distribution. The following example illustrates the
calculations.
Package
laIb23456789
10II12
*Tested for 12 h.
Table 4. System R-values for containers
Insulated container systems
C-Flute corrugated fibreboard box with 19 mm EP5 foam panelsC-Flute corrugated fibreboard box with 13 mm EP5 foam panelsC-Flute corrugated fibreboard boxOyster ThermalCor® boxThermalCor® box with ThermalCor® tubeFoil ThermalCor® boxFoil ThermalCor® box with 4.8 mm inch foil bag insertEP5 container with lidPolyurethane foam moulded containerThermalCor® box in a ThermalCor® boxFoil-laminated ThermalCor® box in a ThermalCor® boxThermalCor® box in a foil-laminated ThermalCor® boxFoil-laminated ThermalCor® box in a foil-laminated ThermalCor® box