PERFORMANCE EVALUATION OF THE SKT-MGS TANGENT END TERMINAL – UPDATE TO NCHRP 350 TEST NO. 3-34 (2214TT-1) Submitted by Karla A. Polivka, M.S.M.E., E.I.T. Research Associate Engineer Ronald K. Faller, Ph.D., P.E. Research Assistant Professor Dean L. Sicking, Ph.D., P.E. Professor and MwRSF Director John R. Rohde, Ph.D., P.E. Associate Professor Bob W. Bielenberg, M.S.M.E., E.I.T. Research Associate Engineer John D. Reid, Ph.D. Associate Professor Brian A. Coon, Ph.D., P.E. Research Associate Engineer MIDWEST ROADSIDE SAFETY FACILITY University of Nebraska-Lincoln 527 Nebraska Hall Lincoln, Nebraska 68588-0529 (402) 472-6864 Submitted to NATIONAL COOPERATIVE HIGHWAY RESEARCH PROGRAM Transportation Research Board National Research Council 2101 Constitution Avenue, N.W. Washington, D.C. 20418 MwRSF Research Report No. TRP-03-176-06 October 12, 2006
Transcript
PERFORMANCE EVALUATION OF THE
SKT-MGS TANGENT END TERMINAL – UPDATE
TO NCHRP 350 TEST NO. 3-34 (2214TT-1)
Submitted by
Karla A. Polivka, M.S.M.E., E.I.T.Research Associate Engineer
Ronald K. Faller, Ph.D., P.E.Research Assistant Professor
Dean L. Sicking, Ph.D., P.E.Professor and MwRSF Director
John R. Rohde, Ph.D., P.E.Associate Professor
Bob W. Bielenberg, M.S.M.E., E.I.T.Research Associate Engineer
John D. Reid, Ph.D.Associate Professor
Brian A. Coon, Ph.D., P.E.Research Associate Engineer
MIDWEST ROADSIDE SAFETY FACILITYUniversity of Nebraska-Lincoln
527 Nebraska HallLincoln, Nebraska 68588-0529
(402) 472-6864
Submitted to
NATIONAL COOPERATIVE HIGHWAY RESEARCH PROGRAMTransportation Research Board
National Research Council2101 Constitution Avenue, N.W.
NCHRP 22-14(2)12. Sponsoring Organization Name and Address 13. Type of Report and Period Covered
National Cooperative Highway Research ProgramTransportation Research BoardNational Research Council2101 Constitution Avenue, N.W.Washington, D.C. 20418
Final Report 2004-2006
14. Sponsoring Agency Code
15. Supplementary Notes
Prepared in cooperation with U.S. Department of Transportation, Federal Highway Administration16. Abstract (Limit: 200 words)
Based on the proposed changes to the National Cooperative Highway Research Program (NCHRP)Report No. 350 guidelines, NCHRP Project 22-14(2) researchers deemed it appropriate to evaluate an endterminal for a strong-post, W-beam guardrail systems prior to finalizing the new crash testing procedures andguidelines. For this effort, the SKT-MGS Tangent End Terminal was selected for evaluation. One full-scalevehicle crash test was performed on the longitudinal barrier system in accordance with the Test Level 3(TL-3) requirements presented in the Update to NCHRP Report No. 350. For the terminal testing program,an 1100C small car vehicle was used.
The end terminal system, mounted at the metric top rail height of 813 mm (32 in.), provided anacceptable safety performance when impacted by the small car, thus meeting the proposed TL-3 requirementspresented in the Update to NCHRP Report No. 350.
In the late 1990s, roadside safety experts, State DOT representatives, Federal government
officials, and industry personnel began discussions and preparations for updating the National
Cooperative Highway Research Program (NCHRP) Report No. 350 safety performance guidelines
(1). The new guidelines would improve upon existing test procedures, consider changes in the
vehicle fleet, provide criteria for new roadside hardware categories and re-evaluate the
appropriateness of the impact conditions.
In 1997, NCHRP Project 22-14, entitled Improvement of the Procedures for the Safety
Performance Evaluation of Roadside Features, was initiated with the intent to: (1) evaluate the
relevance and efficacy of the crash testing procedures, (2) assess the needs for updating NCHRP
Report No. 350, and (3) provide recommended strategies for their implementation. Following the
completion of this NCHRP study at the Texas Transportation Institute (TTI) in 2001, a follow-on
research study was begun in 2002. NCHRP Project 22-14(2), entitled Improved Procedures for
Safety Performance Evaluation of Roadside Features, was undertaken by Midwest Roadside Safety
Facility (MwRSF) researchers with the objectives to: (1) prepare the revised crash testing guidelines,
(2) assess the effects of any proposed guidelines, and (3) identify research needs for future
improvements to the procedures.
Consequently, it was anticipated that a number of revisions would be incorporated into the
Update of NCHRP Report No. 350 guidelines (2). For example, changes in the vehicle fleet have
resulted in the need to reassess the small car and pickup truck test vehicles. Accordingly, new,
heavier test vehicles have been selected for both the small car and light truck classes of vehicles.
2
Additionally, during the second study, researchers determined that the 100 km/h (62.1 mph) impact
speed and 25 degree impact angle would remain the same as used in NCHRP Report No. 350 for the
large passenger vehicle class impacting longitudinal barriers. However, the impact angle for the
small car impact condition would increase from 20 to 25 degrees for evaluating longitudinal barriers
and the length-of-need for guardrail terminals. The effects of any changes to vehicle specifications
or impact conditions must be understood before the safety performance evaluation guidelines are
finalized. Therefore, a series of full-scale crash tests on NCHRP Report No. 350 approved systems
were to be conducted with the new test vehicles and impact conditions.
1.2 Objective
The objective of the research project was to evaluate the safety performance of the SKT-
MGS Tangent End Terminal when full-scale vehicle crash tested according to the test designation
no. 3-34 criteria presented in the Update of NCHRP Report No. 350 guidelines (2).
1.3 Scope
The research objective was achieved through the completion of several tasks. First, a full-
scale vehicle crash test was performed on the SKT-MGS tangent end terminal system. The crash test
utilized a small car, weighing approximately 1,100 kg (2,425 lbs). The target impact conditions for
the test were an impact speed of 100.0 km/h (62.1 mph) and an impact angle of 15 degrees at the
Critical Impact Point (CIP) of the terminal. Next, the test results were analyzed, evaluated, and
documented. Finally, conclusions and recommendations were made that pertain to the safety
performance of the SKT-MGS tangent end terminal system relative to the test performed.
3
2 TEST REQUIREMENTS AND EVALUATION CRITERIA
2.1 Test Requirements
Historically, guardrail end terminal systems have been required to satisfy impact safety
standards in order to be accepted by the Federal Highway Administration (FHWA) for use on
National Highway System (NHS) construction projects or as a replacement for existing designs not
meeting current safety standards. In recent years, these safety standards have consisted of the
guidelines and procedures published in NCHRP Report No. 350 (1). However, NCHRP Project
22-14(2) generated revised testing procedures and guidelines for use in the evaluation of roadside
safety appurtenances and were presented in the draft report entitled, NCHRP Report 350 Update (2).
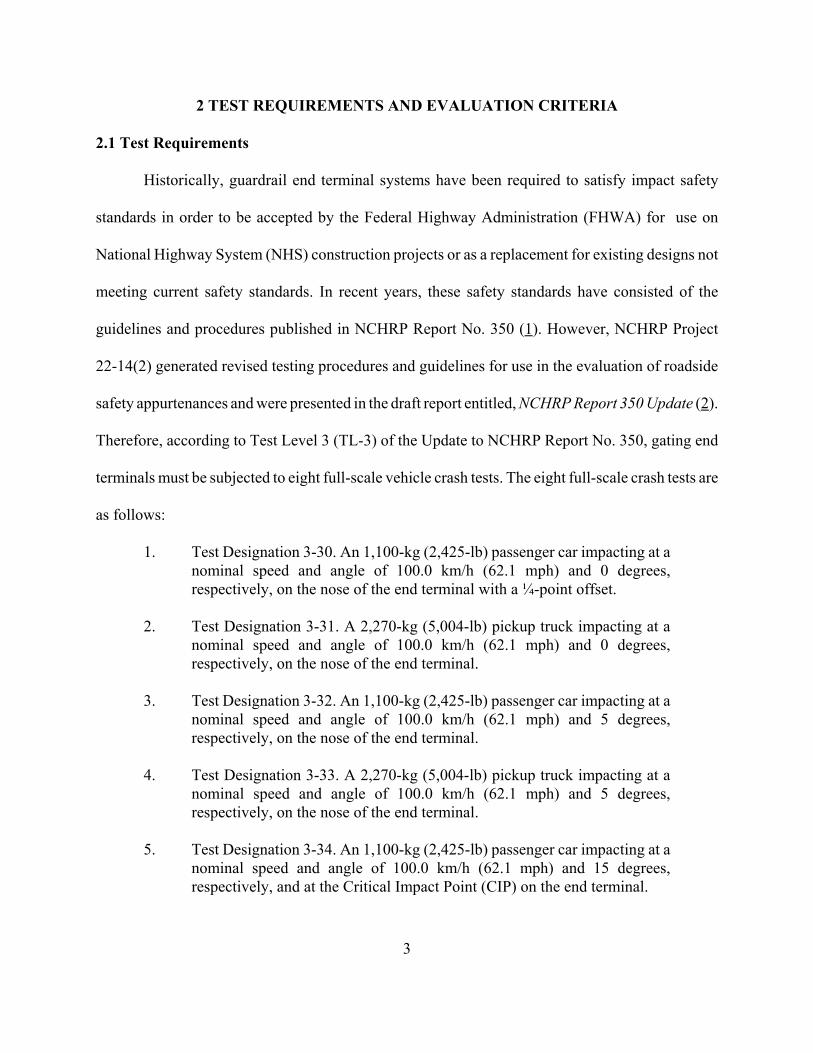
Therefore, according to Test Level 3 (TL-3) of the Update to NCHRP Report No. 350, gating end
terminals must be subjected to eight full-scale vehicle crash tests. The eight full-scale crash tests are
as follows:
1. Test Designation 3-30. An 1,100-kg (2,425-lb) passenger car impacting at anominal speed and angle of 100.0 km/h (62.1 mph) and 0 degrees,respectively, on the nose of the end terminal with a ¼-point offset.
2. Test Designation 3-31. A 2,270-kg (5,004-lb) pickup truck impacting at anominal speed and angle of 100.0 km/h (62.1 mph) and 0 degrees,respectively, on the nose of the end terminal.
3. Test Designation 3-32. An 1,100-kg (2,425-lb) passenger car impacting at anominal speed and angle of 100.0 km/h (62.1 mph) and 5 degrees,respectively, on the nose of the end terminal.
4. Test Designation 3-33. A 2,270-kg (5,004-lb) pickup truck impacting at anominal speed and angle of 100.0 km/h (62.1 mph) and 5 degrees,respectively, on the nose of the end terminal.
5. Test Designation 3-34. An 1,100-kg (2,425-lb) passenger car impacting at anominal speed and angle of 100.0 km/h (62.1 mph) and 15 degrees,respectively, and at the Critical Impact Point (CIP) on the end terminal.
4
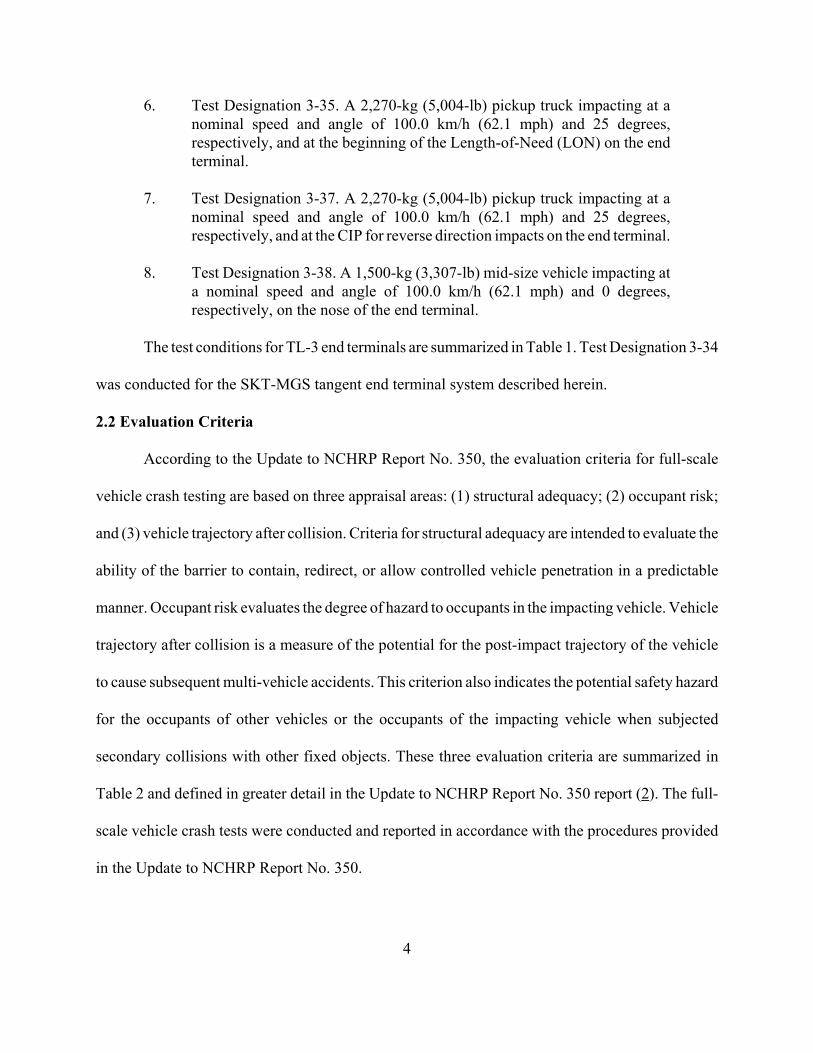
6. Test Designation 3-35. A 2,270-kg (5,004-lb) pickup truck impacting at anominal speed and angle of 100.0 km/h (62.1 mph) and 25 degrees,respectively, and at the beginning of the Length-of-Need (LON) on the endterminal.
7. Test Designation 3-37. A 2,270-kg (5,004-lb) pickup truck impacting at anominal speed and angle of 100.0 km/h (62.1 mph) and 25 degrees,respectively, and at the CIP for reverse direction impacts on the end terminal.
8. Test Designation 3-38. A 1,500-kg (3,307-lb) mid-size vehicle impacting ata nominal speed and angle of 100.0 km/h (62.1 mph) and 0 degrees,respectively, on the nose of the end terminal.
The test conditions for TL-3 end terminals are summarized in Table 1. Test Designation 3-34
was conducted for the SKT-MGS tangent end terminal system described herein.
2.2 Evaluation Criteria
According to the Update to NCHRP Report No. 350, the evaluation criteria for full-scale
vehicle crash testing are based on three appraisal areas: (1) structural adequacy; (2) occupant risk;
and (3) vehicle trajectory after collision. Criteria for structural adequacy are intended to evaluate the
ability of the barrier to contain, redirect, or allow controlled vehicle penetration in a predictable
manner. Occupant risk evaluates the degree of hazard to occupants in the impacting vehicle. Vehicle
trajectory after collision is a measure of the potential for the post-impact trajectory of the vehicle
to cause subsequent multi-vehicle accidents. This criterion also indicates the potential safety hazard
for the occupants of other vehicles or the occupants of the impacting vehicle when subjected
secondary collisions with other fixed objects. These three evaluation criteria are summarized in
Table 2 and defined in greater detail in the Update to NCHRP Report No. 350 report (2). The full-
scale vehicle crash tests were conducted and reported in accordance with the procedures provided
in the Update to NCHRP Report No. 350.
5
Table 1. Update to NCHRP Report No. 350 Test Level 3 Crash Test Conditions
TestArticle
TestDesignation
TestVehicle
Impact ConditionsEvaluationCriteria 1Speed Angle
(degrees)(km/h) (mph)
Terminals
3-30 1100C 100 62.1 0 A,C,D,F,H,I,N,O
3-31 2270P 100 62.1 0 A,C,D,F,H,I,N,O
3-32 1100C 100 62.1 5 A,C,D,F,H,I,N,O
3-33 2270P 100 62.1 5 A,C,D,F,H,I,N,O
3-34 1100C 100 62.1 15 A,C,D,F,H,I,N
3-35 2270P 100 62.1 25 A,D,F,H,I,M
3-37 2270P 100 62.1 25 A,C,D,F,H,I,M
3-38 1500A 100 62.1 0 A,C,D,F,H,I,N,O
1 Evaluation criteria explained in Table 2.
6
Table 2. Update to NCHRP Report No. 350 Evaluation Criteria for Crash Tests
StructuralAdequacy
A. Test article should contain and redirect the vehicle or bring the vehicle toa controlled stop; the vehicle should not penetrate, underride, or overridethe installation although controlled lateral deflection of the test article isacceptable.
C. Acceptable test article performance may be by redirection, controlledpenetration, or controlled stopping of the vehicle.
OccupantRisk
D. Detached elements, fragments or other debris from the test article shouldnot penetrate or show potential for penetrating the occupant compartment,or present an undue hazard to other traffic, pedestrians, or personnel in awork zone. Deformations of, or intrusions into, the occupant compartmentshould not exceed limits set forth in Section 5.3 and Appendix E of theUpdate to NCHRP Report No. 350.
F. The vehicle should remain upright during and after collision.
H. Longitudinal and lateral occupant impact velocities should fall below thepreferred value of 9.0 m/s (29.5 ft/s), or at least below the maximumallowable value of 12.0 m/s (39.4 ft/s).
I. Longitudinal and lateral occupant ridedown accelerations should fallbelow the preferred value of 15 Gs, or at least below the maximumallowable value of 20.0 Gs.
VehicleTrajectory
M. After impact, the vehicle shall exit the barrier within the exit box.
N. Vehicle trajectory behind the test article is acceptable.
O. The front of the vehicle shall not rebound more than 6 m (19.7 ft) beyondthe original point of impact with the test article.
7
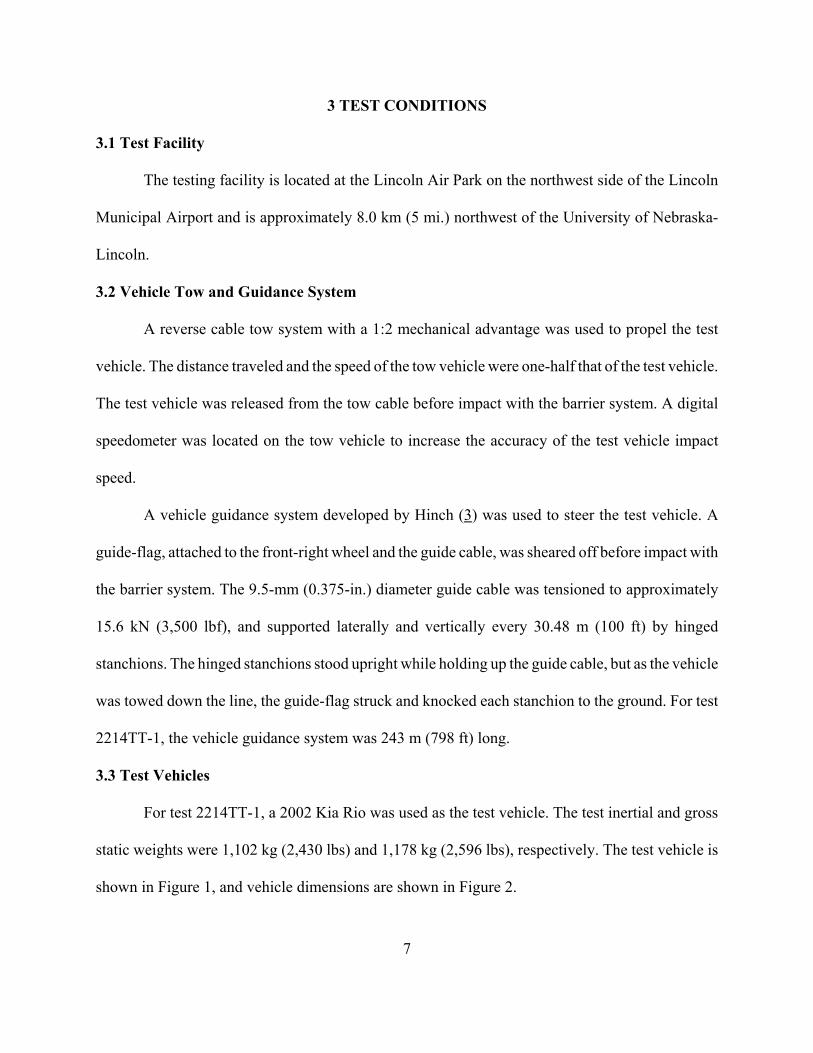
3 TEST CONDITIONS
3.1 Test Facility
The testing facility is located at the Lincoln Air Park on the northwest side of the Lincoln
Municipal Airport and is approximately 8.0 km (5 mi.) northwest of the University of Nebraska-
Lincoln.
3.2 Vehicle Tow and Guidance System
A reverse cable tow system with a 1:2 mechanical advantage was used to propel the test
vehicle. The distance traveled and the speed of the tow vehicle were one-half that of the test vehicle.
The test vehicle was released from the tow cable before impact with the barrier system. A digital
speedometer was located on the tow vehicle to increase the accuracy of the test vehicle impact
speed.
A vehicle guidance system developed by Hinch (3) was used to steer the test vehicle. A
guide-flag, attached to the front-right wheel and the guide cable, was sheared off before impact with
the barrier system. The 9.5-mm (0.375-in.) diameter guide cable was tensioned to approximately
15.6 kN (3,500 lbf), and supported laterally and vertically every 30.48 m (100 ft) by hinged
stanchions. The hinged stanchions stood upright while holding up the guide cable, but as the vehicle
was towed down the line, the guide-flag struck and knocked each stanchion to the ground. For test
2214TT-1, the vehicle guidance system was 243 m (798 ft) long.
3.3 Test Vehicles
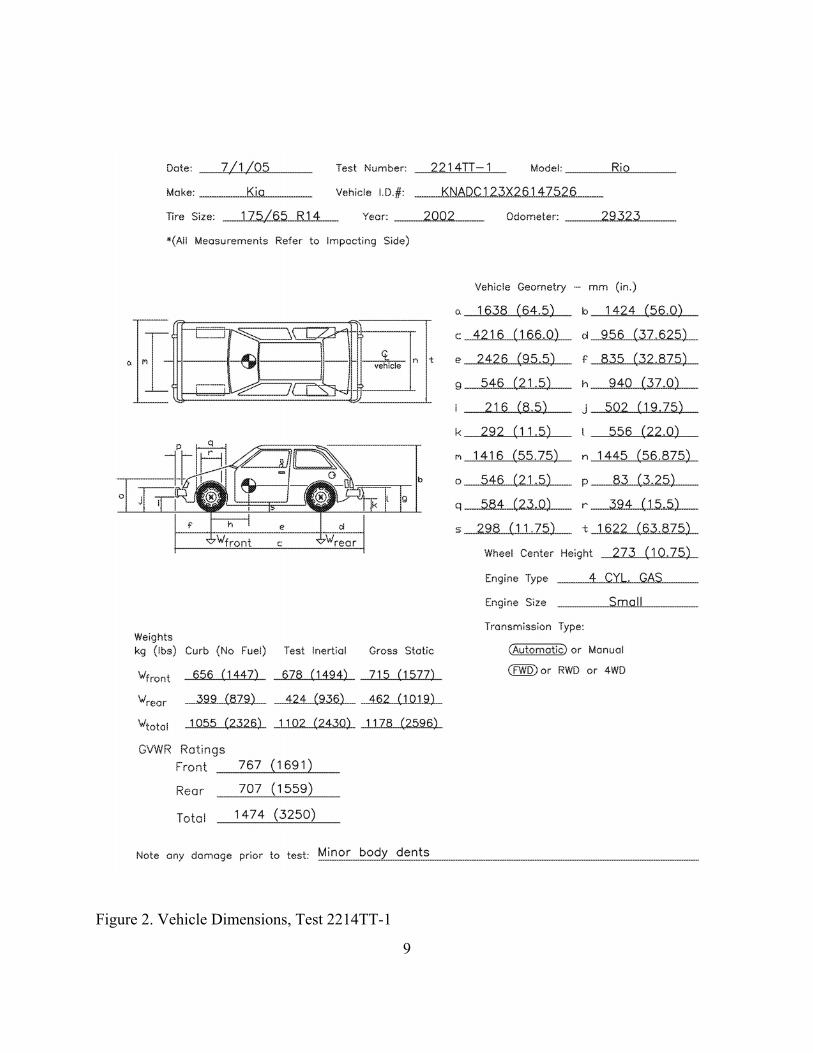
For test 2214TT-1, a 2002 Kia Rio was used as the test vehicle. The test inertial and gross
static weights were 1,102 kg (2,430 lbs) and 1,178 kg (2,596 lbs), respectively. The test vehicle is
shown in Figure 1, and vehicle dimensions are shown in Figure 2.
8
Figure 1. Test Vehicle, Test 2214TT-1
9
Figure 2. Vehicle Dimensions, Test 2214TT-1
10
The longitudinal component of the center of gravity was determined using the measured axle
weights. The location of the final center of gravity is shown in Figures 1 and 2.
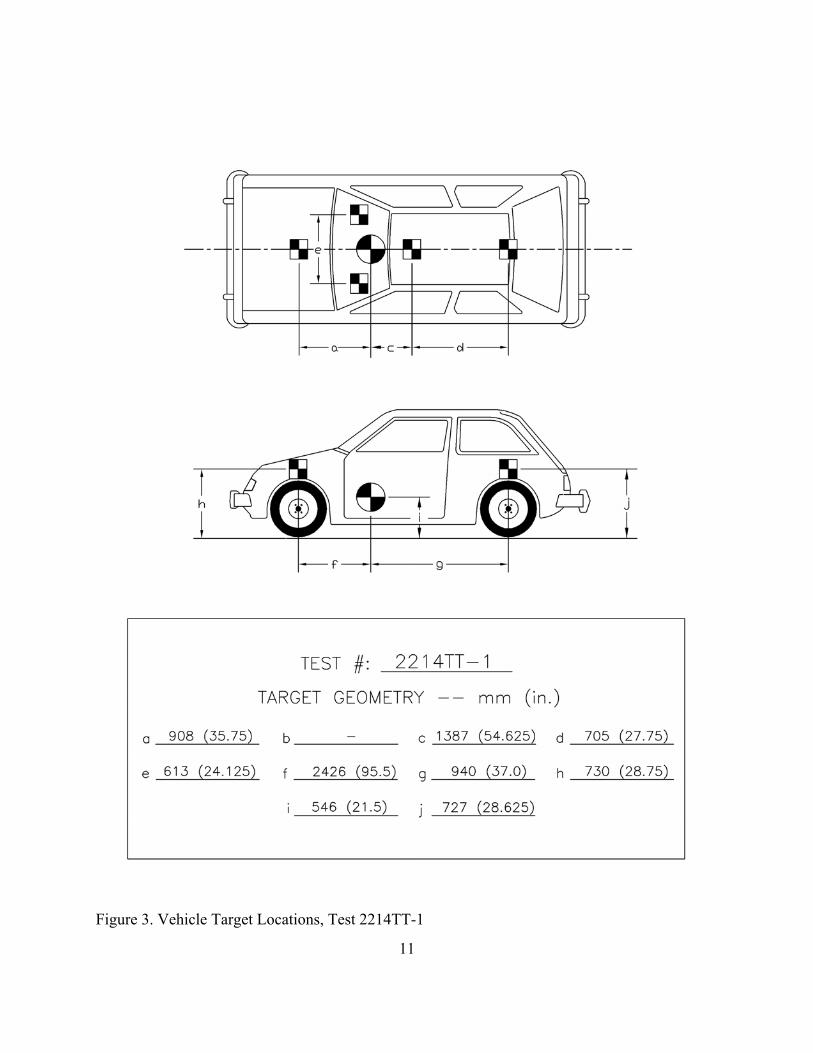
Square black and white-checkered targets were placed on the vehicle to aid in the analysis
of the high-speed film and E/cam and Photron video, as shown in Figure 3. Checkered targets were
placed on the center of gravity, on the driver’s side door, on the passenger’s side door, and on the
roof of the vehicle. The remaining targets were located for reference so that they could be viewed
from the high-speed cameras for film analysis.
The front wheels of the test vehicle were aligned for camber, caster, and toe-in values of zero
so that the vehicle would track properly along the guide cable. Two 5B flash bulbs were mounted
on both the hood and roof of the vehicle to pinpoint the time of impact with the barrier on the high-
speed Photron and AOS videos. The flash bulbs were fired by a pressure tape switch mounted on
the front face of the bumper. A remote-controlled brake system was installed in the test vehicle so
the vehicle could be brought safely to a stop after the test.
3.4 Data Acquisition Systems
3.4.1 Accelerometers
One triaxial piezoresistive accelerometer system with a range of ±200 Gs was used to
measure the acceleration in the longitudinal, lateral, and vertical directions at a sample rate of 10,000
Hz. The environmental shock and vibration sensor/recorder system, Model EDR-4M6, was
developed by Instrumented Sensor Technology (IST) of Okemos, Michigan and includes three
differential channels as well as three single-ended channels. The EDR-4 was configured with 6 MB
of RAM memory and a 1,500 Hz lowpass filter. Computer software, “DynaMax 1 (DM-1)” and
“DADiSP”, was used to analyze and plot the accelerometer data.
11
Figure 3. Vehicle Target Locations, Test 2214TT-1
12
Another triaxial piezoresistive accelerometer system with a range of ±200 Gs was also used
to measure the acceleration in the longitudinal, lateral, and vertical directions at a sample rate of
3,200 Hz. The environmental shock and vibration sensor/recorder system, Model EDR-3, was
developed by Instrumental Sensor Technology (IST) of Okemos, Michigan. The EDR-3 was
configured with 256 kB of RAM memory and a 1,120 Hz lowpass filter. Computer software,
“DynaMax 1 (DM-1)” and “DADiSP”, was used to analyze and plot the accelerometer data.
3.4.2 Rate Transducers
An Analog Systems 3-axis rate transducer with a range of 1,200 degrees/sec in each of the
three directions (pitch, roll, and yaw) was used to measure the rates of motion of the test vehicle.
The rate transducer was mounted inside the body of the EDR-4M6 and recorded data at 10,000 Hz
to a second data acquisition board inside the EDR-4M6 housing. The raw data measurements were
then downloaded, converted to the appropriate Euler angles for analysis, and plotted. Computer
software, “DynaMax 1 (DM-1)” and “DADiSP”, was used to analyze and plot the rate transducer
data.
3.4.3 High-Speed Photography
For test 2214TT-1, one high-speed Photron video camera, three high-speed AOS VITcam
video cameras, and one high-speed Red Lake Ranger video camera, all with operating speeds of 500
frames/sec, were used to film the crash test. Six Canon digital video cameras, with a standard
operating speed of 29.97 frames/sec, were also used to film the crash test. Camera details and a
schematic of all eleven camera locations for test 2214TT-1 is shown in Figure 4. The Photron, AOS,
and Ranger videos and E/cam videos were analyzed using the ImageExpress MotionPlus software
and Redlake Motion Scope software, respectively. Actual camera speed and camera divergence
13
factors were considered in the analysis of the high-speed film.
3.4.4 Pressure Tape Switches
For test 2214TT-1, five pressure-activated tape switches, spaced at 2-m (6.56-ft) intervals,
were used to determine the speed of the vehicle before impact. Each tape switch fired a strobe light
which sent an electronic timing signal to the data acquisition system as the right-front tire of the test
vehicle passed over it. Test vehicle speed was determined from electronic timing mark data recorded
using TestPoint software. Strobe lights and high-speed film analysis are used only as a backup in
the event that vehicle speed cannot be determined from the electronic data.
14
Figu
re 4
. Loc
atio
n of
Hig
h-Sp
eed
Cam
eras
, Tes
t 221
4TT-
1
15
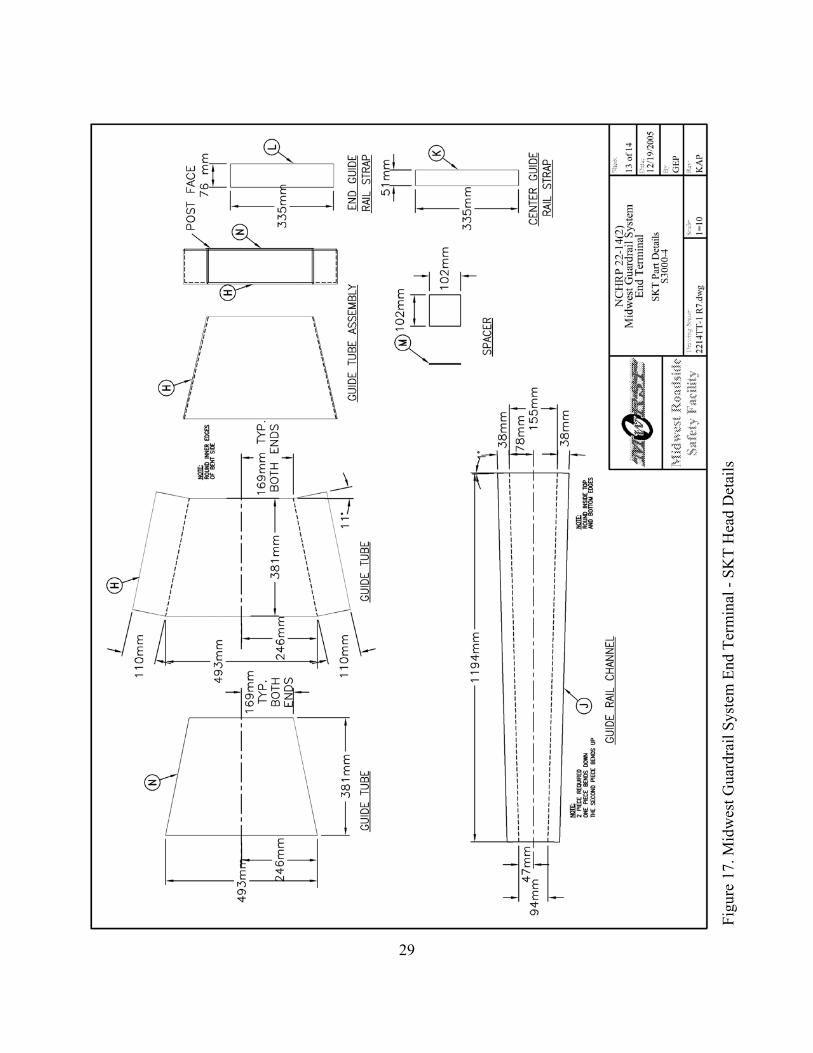
4 DESIGN DETAILS
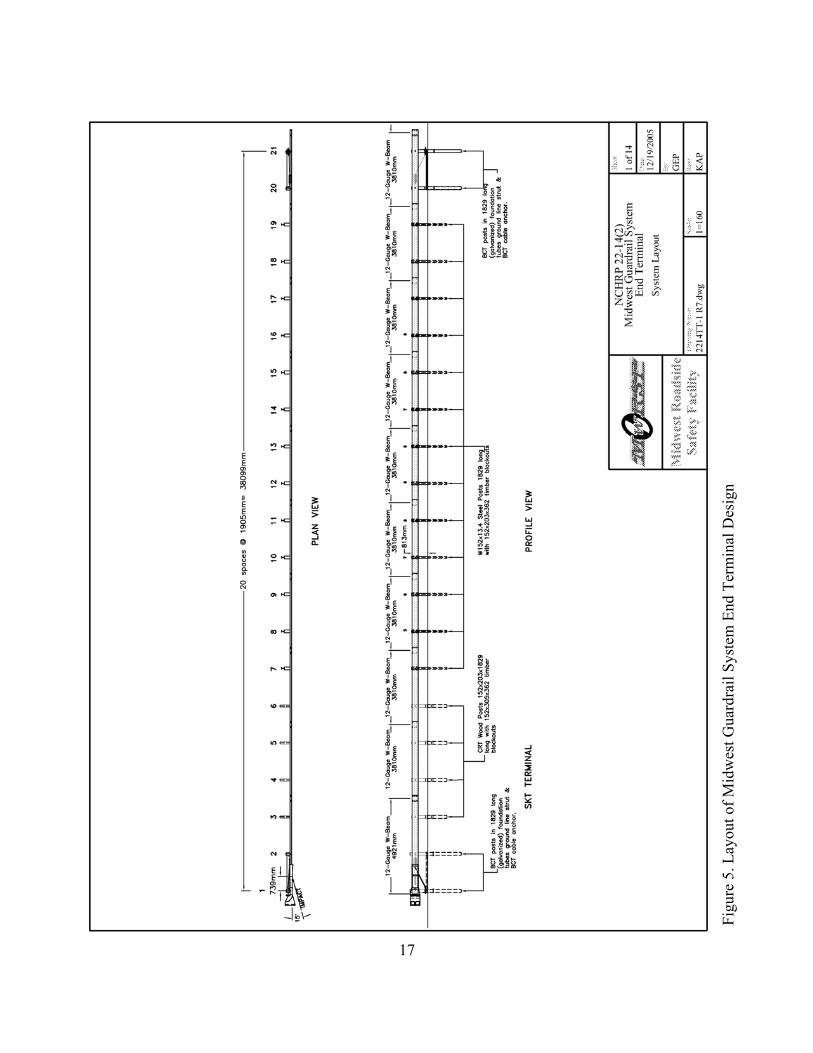
The test installation consisted of 38.10 m (125 ft) of standard 2.66-mm (12-gauge) thick
W-beam guardrail supported by wood posts in the end terminal section and steel posts in the
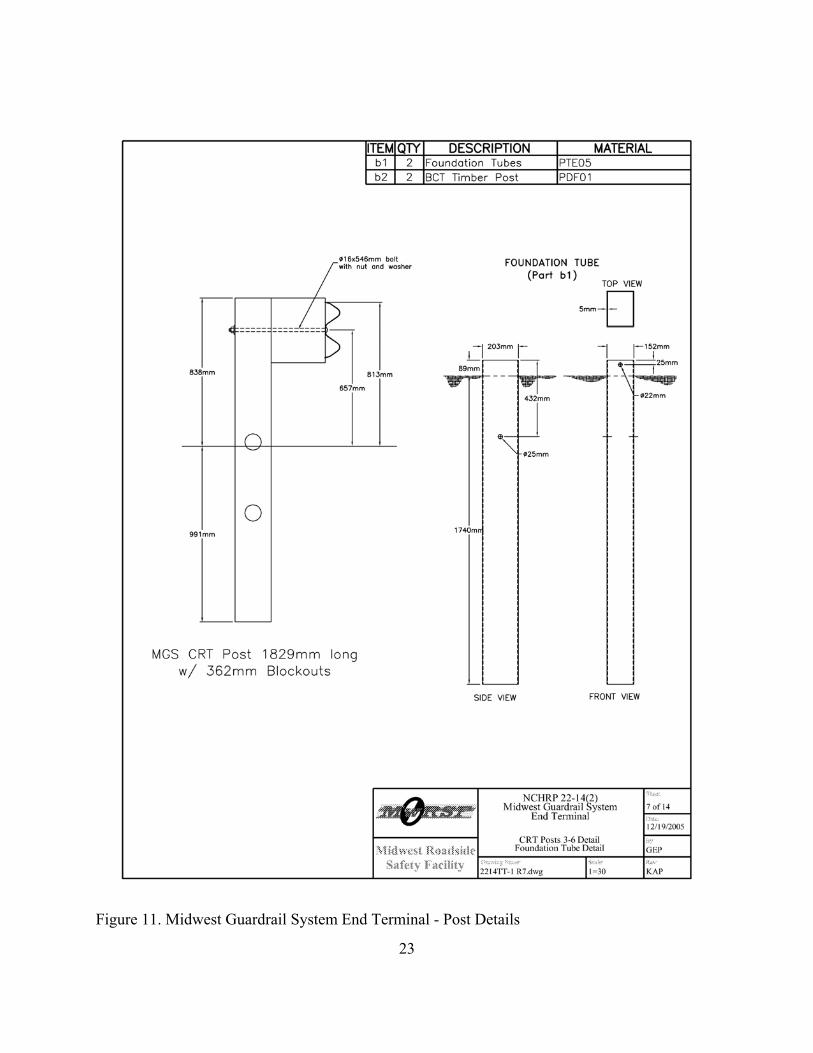
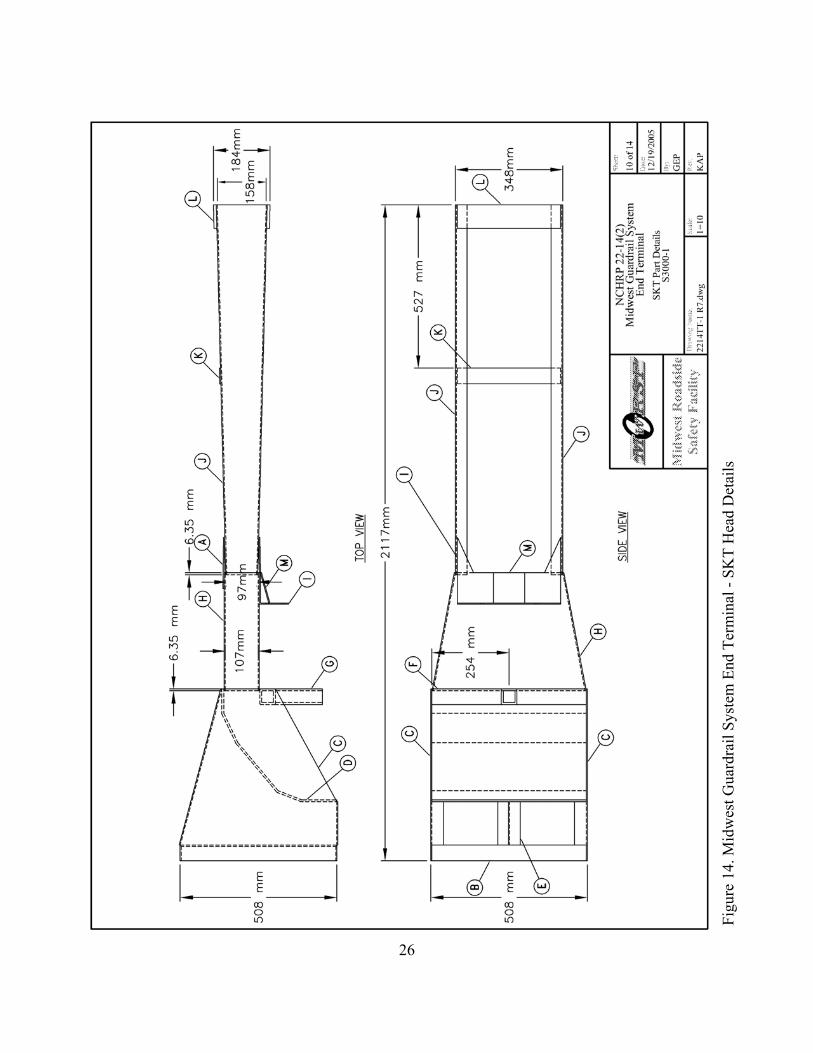
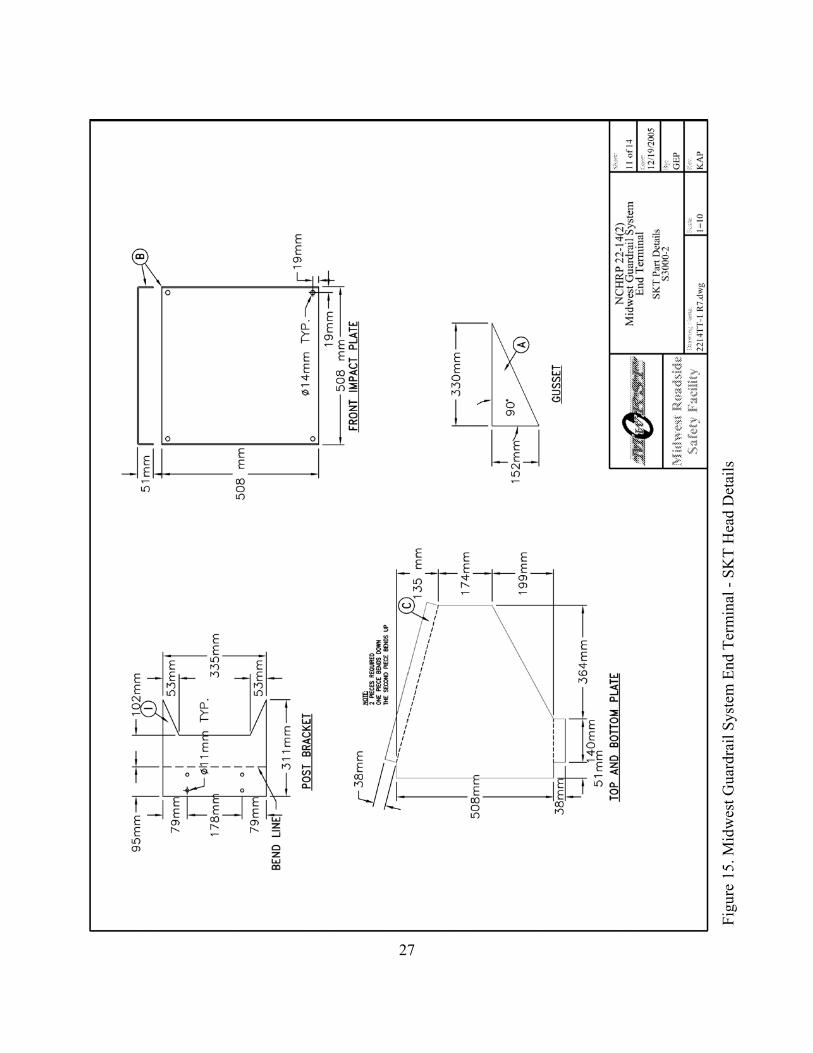
longitudinal barrier portion, as shown in Figure 5. The length of the end terminal was 11.43 m (37.5
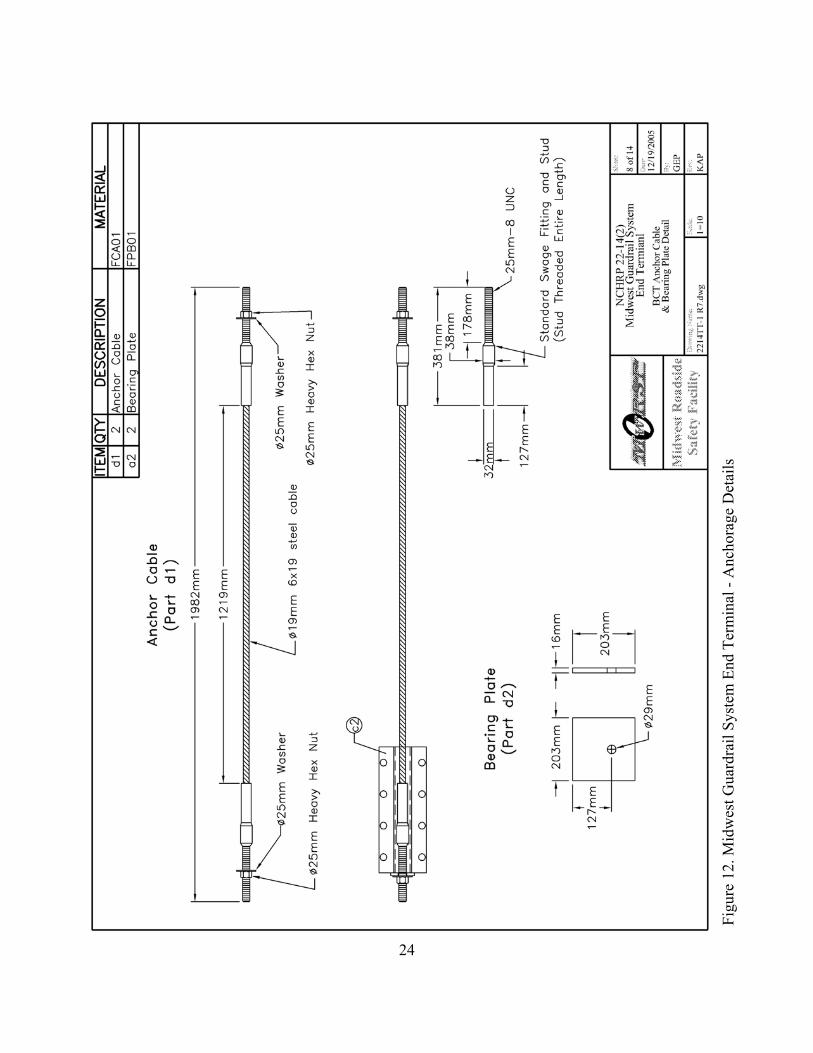
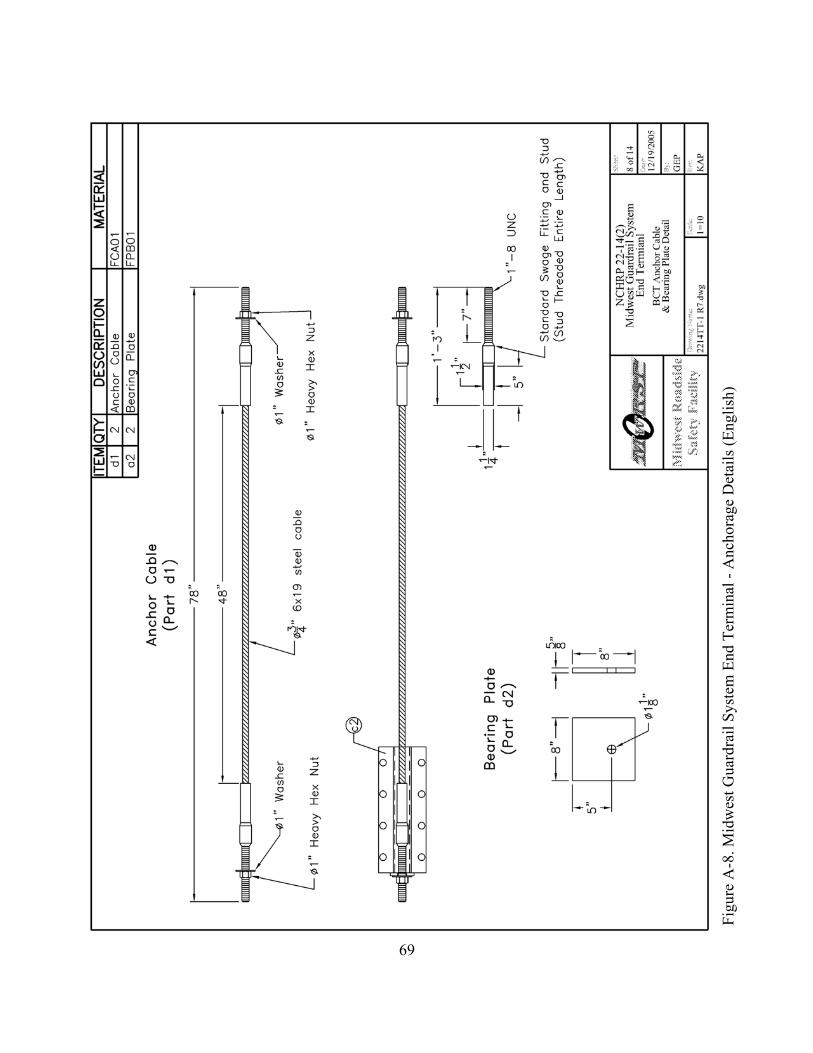
ft) and featured an SKT impact head. Anchorage systems similar to those used on tangent guardrail
terminals were utilized on the downstream end of the guardrail system. Design details are shown in
Figures 5 through 18. The corresponding English-unit drawings are shown in Appendix A.
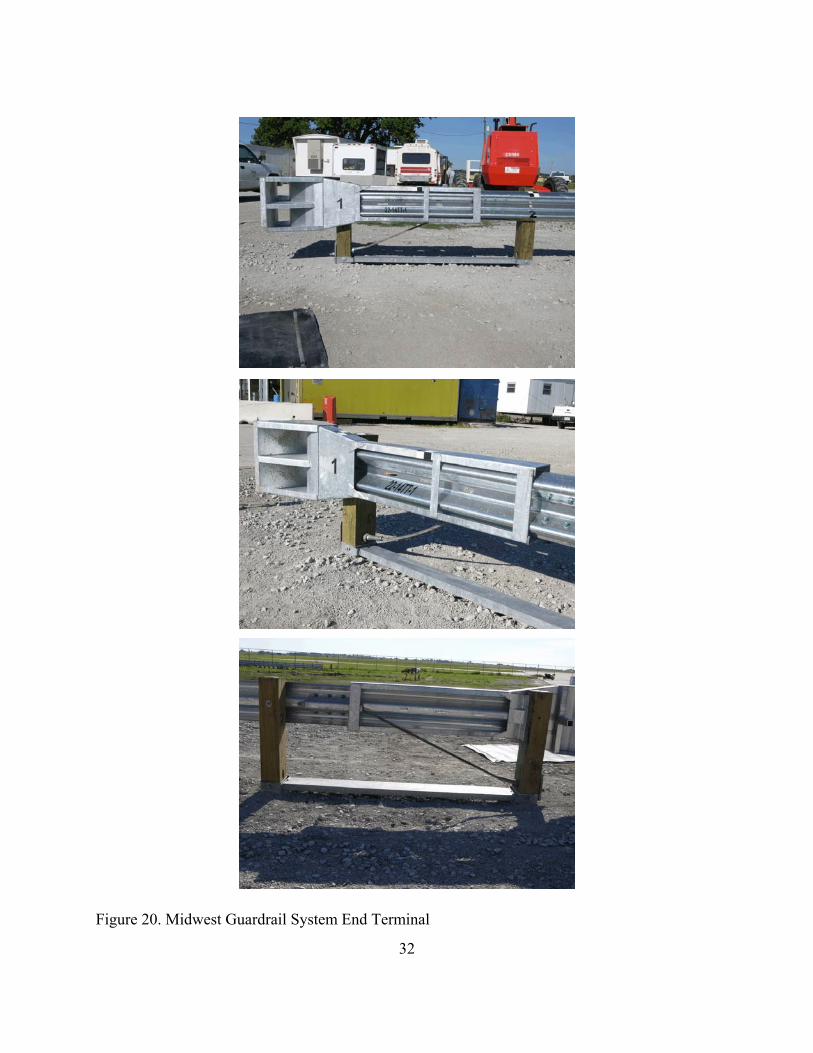
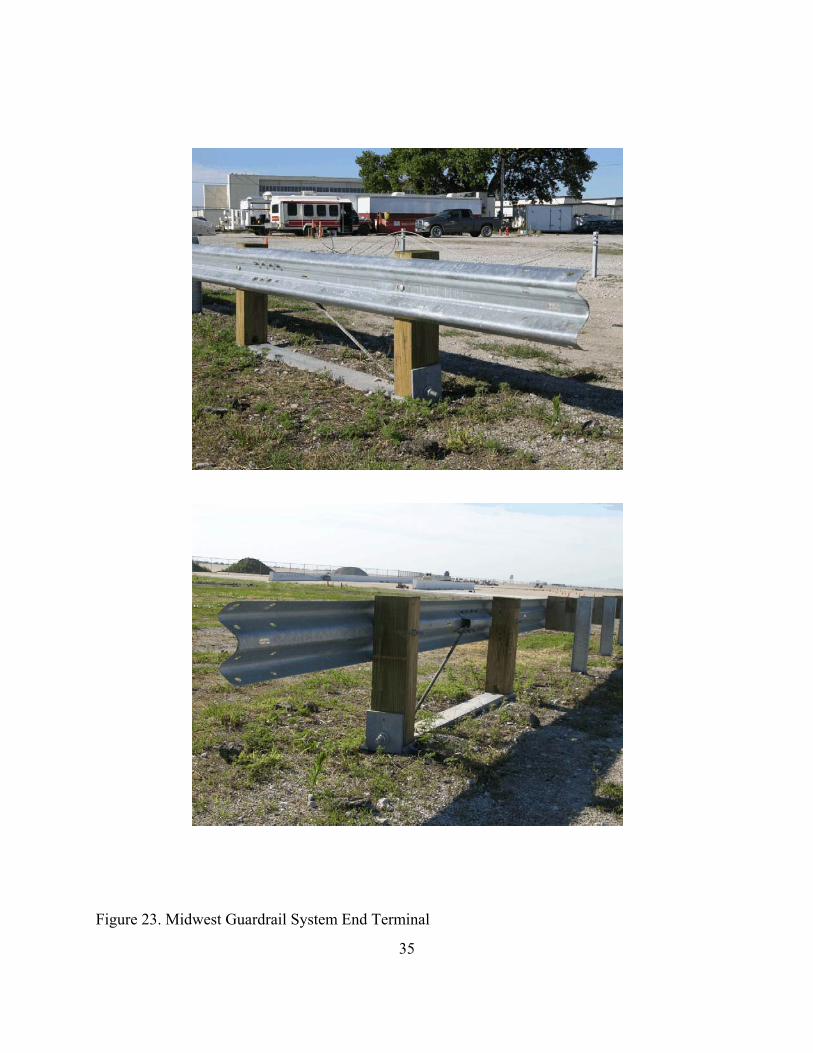
Photographs of the test installation are shown in Figures 19 through 23.
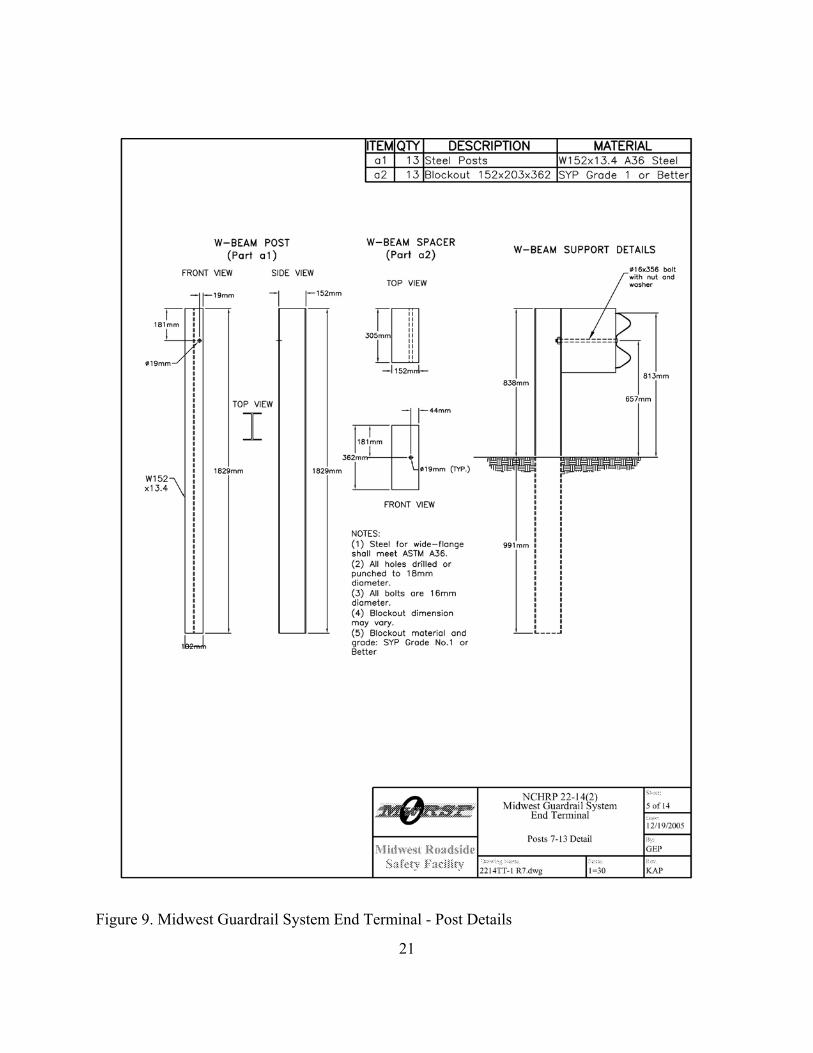
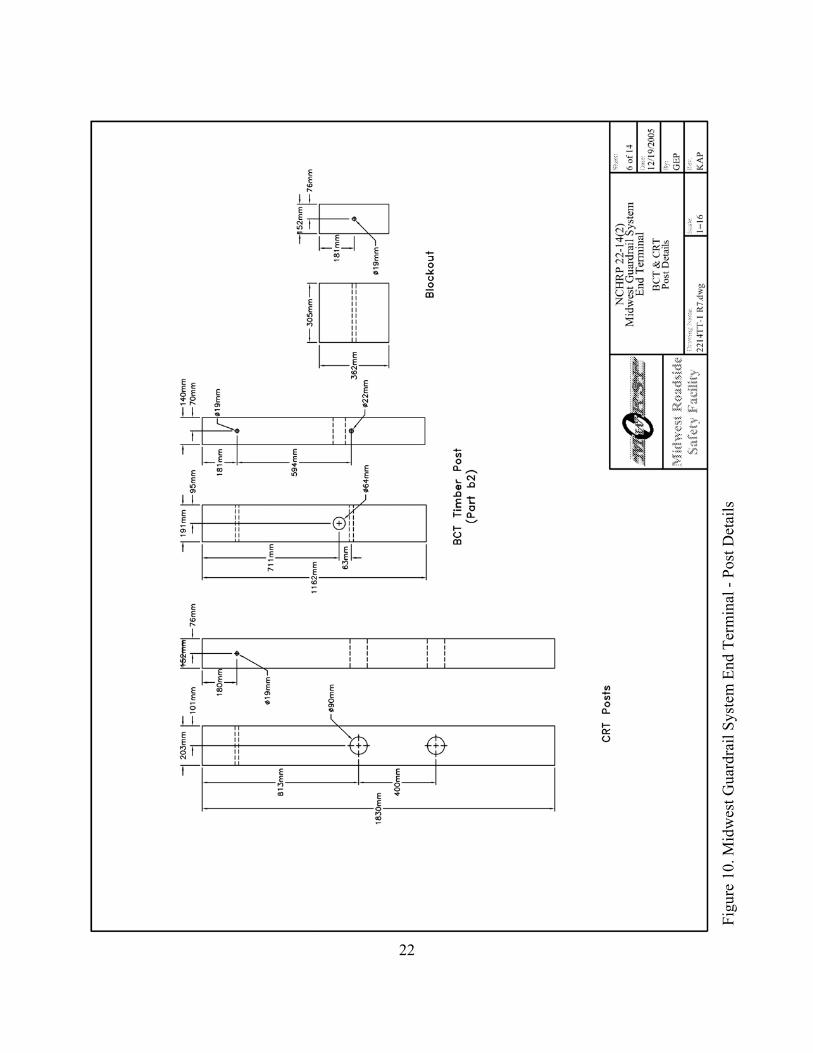
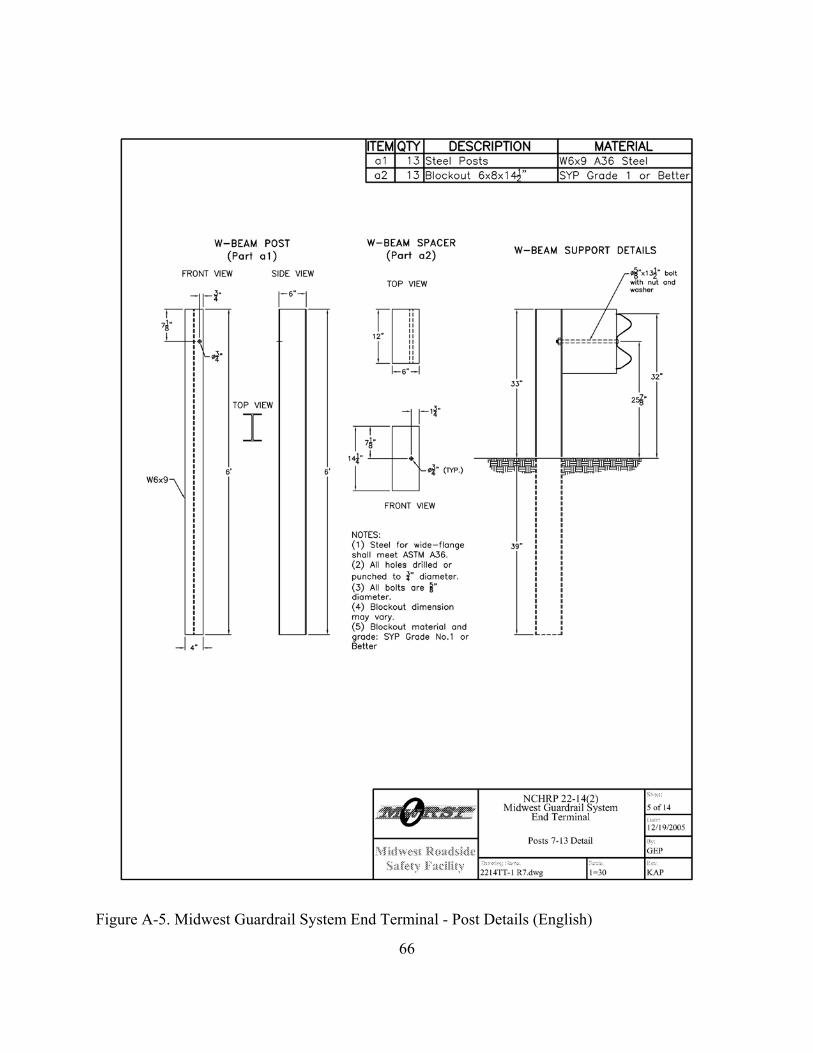
The entire system was constructed with twenty-one guardrail posts. Post nos. 3 through 6
were CRT timber posts measuring 152 mm wide x 203 mm deep x 1,829 mm long (6 in. x 8 in. x
72 in.). Post nos. 7 through 19 were galvanized ASTM A36 steel W152x13.4 (W6x9) sections
measuring 1,829-mm (6-ft) long. Post nos. 1, 2, 20, and 21 were timber posts measuring 140 mm
wide x 190 mm deep x 1,162 mm long (5.5 in. x 7.5 in. x 45.75 in.) and were placed in 1,829-mm
(6-ft) long steel foundation tubes. The downstream timber posts and foundation tubes were part of
an anchor system designed to replicate the capacity of a tangent guardrail terminal.
Post nos. 1 through 21 were spaced 1,905 mm (75 in.) on center with a soil embedment depth
of 991 mm (39 in.), as shown in Figures 5 and 9. The posts were placed in a compacted coarse,
crushed limestone material that met Grading B of AASHTO M147-65 (1990) as found in NCHRP
Report No. 350. For post nos. 3 through 19, 152-mm wide x 305-mm deep x 362-mm long (6-in. x
12-in. x 14.25-in.) wood spacer blockouts were used to block the rail away from the front face of
the posts.
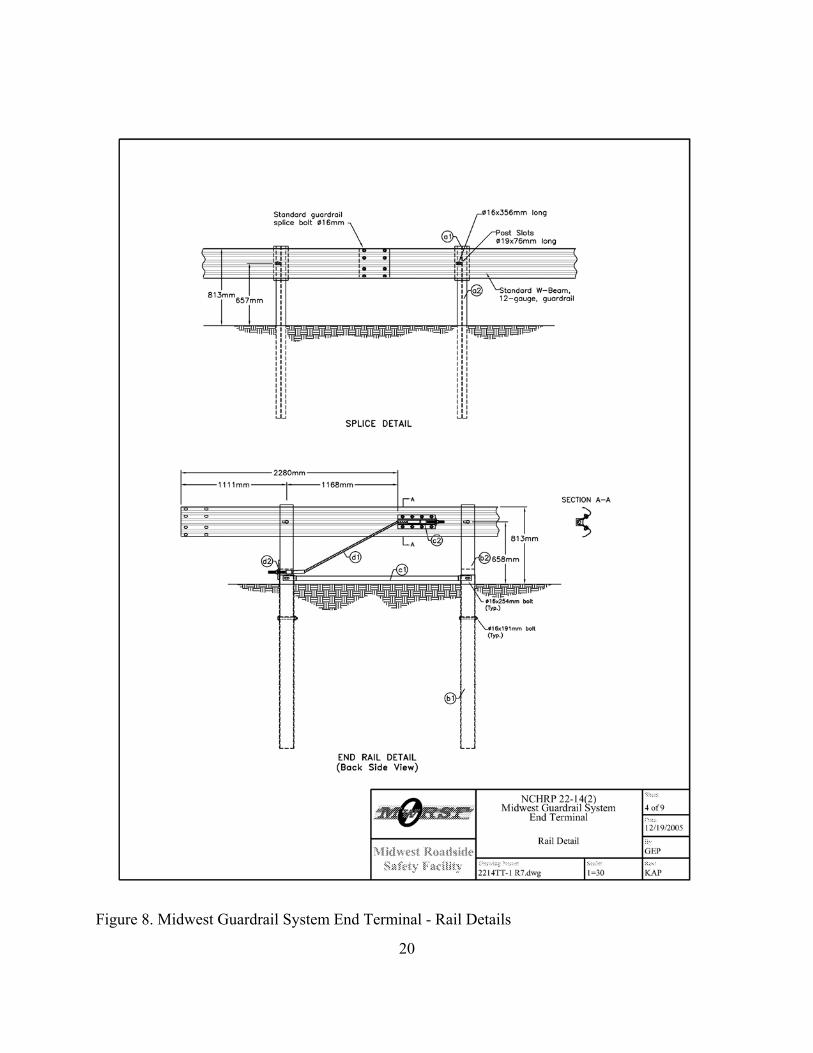
Standard 2.66-mm (12-gauge) thick by 3.81-m (12.5-ft) long W-beam rail elements rails with
16
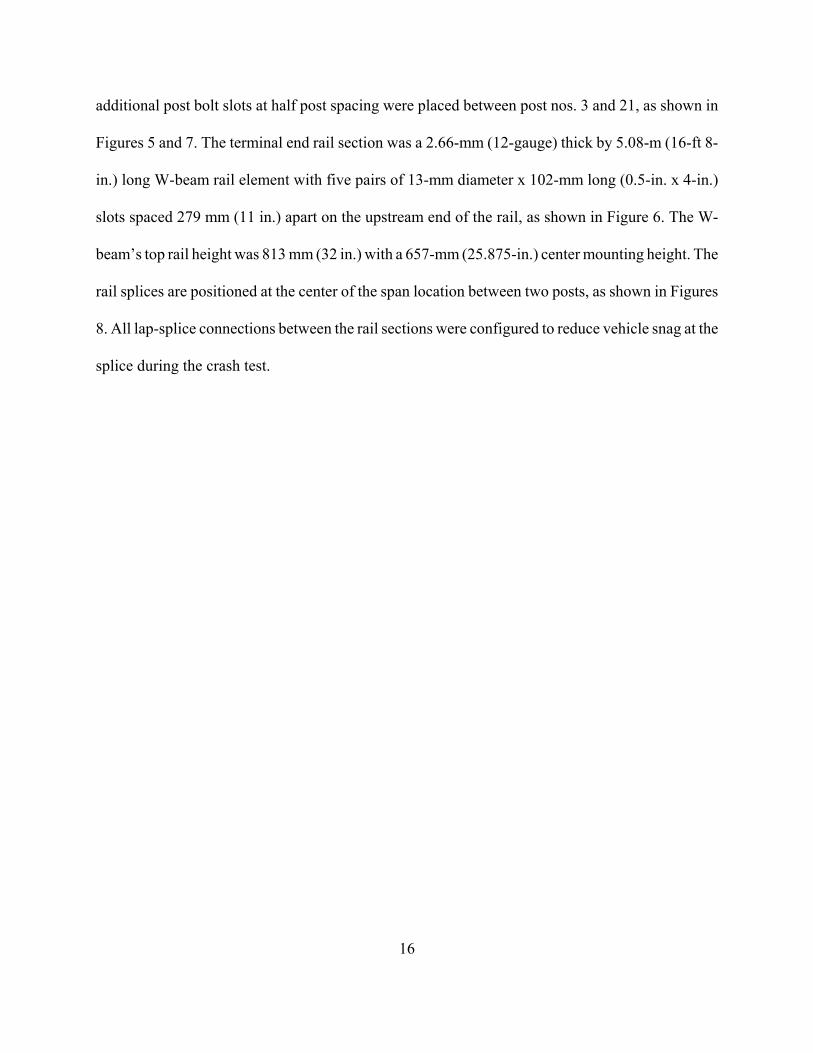
additional post bolt slots at half post spacing were placed between post nos. 3 and 21, as shown in
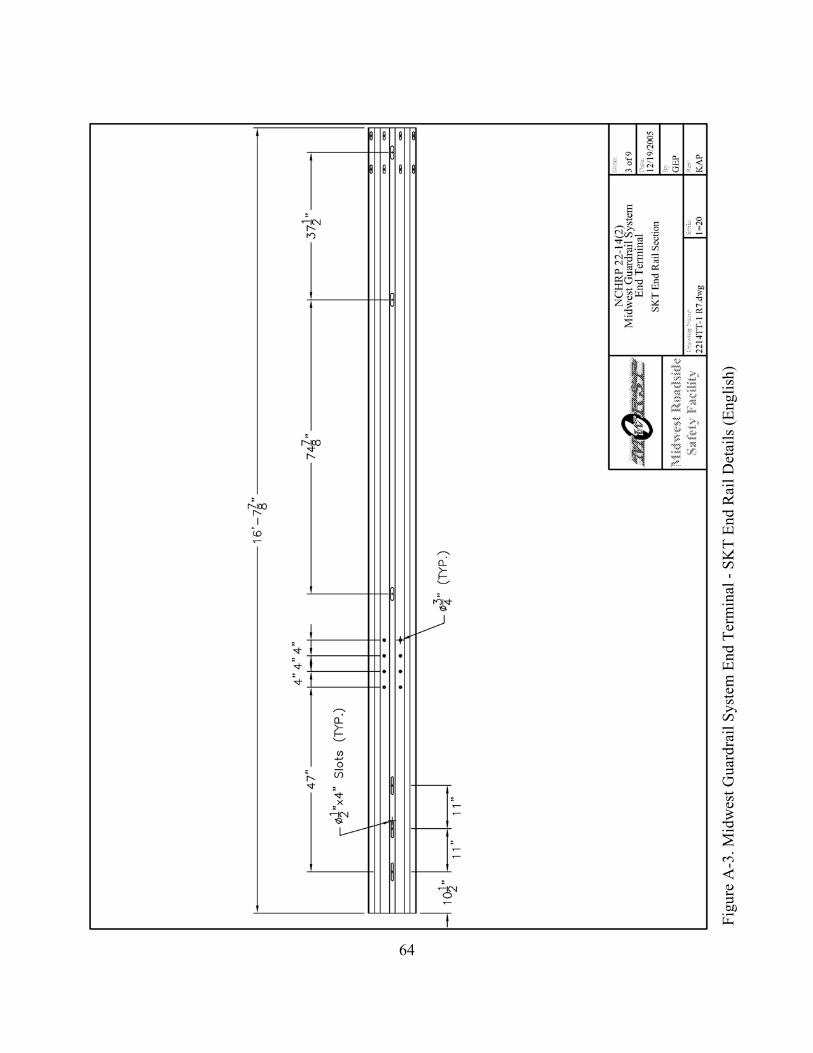
Figures 5 and 7. The terminal end rail section was a 2.66-mm (12-gauge) thick by 5.08-m (16-ft 8-
in.) long W-beam rail element with five pairs of 13-mm diameter x 102-mm long (0.5-in. x 4-in.)
slots spaced 279 mm (11 in.) apart on the upstream end of the rail, as shown in Figure 6. The W-
beam’s top rail height was 813 mm (32 in.) with a 657-mm (25.875-in.) center mounting height. The
rail splices are positioned at the center of the span location between two posts, as shown in Figures
8. All lap-splice connections between the rail sections were configured to reduce vehicle snag at the
splice during the crash test.
17
Figu
re 5
. Lay
out o
f Mid
wes
t Gua
rdra
il Sy
stem
End
Ter
min
al D
esig
n
18
Figu
re 6
. Mid
wes
t Gua
rdra
il Sy
stem
End
Ter
min
al -
SKT
Det
ails
19
Figu
re 7
. Mid
wes
t Gua
rdra
il Sy
stem
End
Ter
min
al -
End
Rai
l Det
ails
20
Figure 8. Midwest Guardrail System End Terminal - Rail Details
21
Figure 9. Midwest Guardrail System End Terminal - Post Details
22
Figu
re 1
0. M
idw
est G
uard
rail
Syst
em E
nd T
erm
inal
- Po
st D
etai
ls
23
Figure 11. Midwest Guardrail System End Terminal - Post Details
24
Figu
re 1
2. M
idw
est G
uard
rail
Syst
em E
nd T
erm
inal
- A
ncho
rage
Det
ails
25
Figu
re 1
3. M
idw
est G
uard
rail
Syst
em E
nd T
erm
inal
- A
ncho
rage
Det
ails
26
Figu
re 1
4. M
idw
est G
uard
rail
Syst
em E
nd T
erm
inal
- SK
T H
ead
Det
ails
27
Figu
re 1
5. M
idw
est G
uard
rail
Syst
em E
nd T
erm
inal
- SK
T H
ead
Det
ails
28
Figu
re 1
6. M
idw
est G
uard
rail
Syst
em E
nd T
erm
inal
- SK
T H
ead
Det
ails
29
Figu
re 1
7. M
idw
est G
uard
rail
Syst
em E
nd T
erm
inal
- SK
T H
ead
Det
ails
30
Figu
re 1
8. M
idw
est G
uard
rail
Syst
em E
nd T
erm
inal
- SK
T H
ead
Det
ails
31
Figure 19. Midwest Guardrail System End Terminal
32
Figure 20. Midwest Guardrail System End Terminal
33
Figure 21. Midwest Guardrail System End Terminal
34
Figure 22. Midwest Guardrail System End Terminal
35
Figure 23. Midwest Guardrail System End Terminal
36
5 CRASH TEST
5.1 Test 2214TT-1
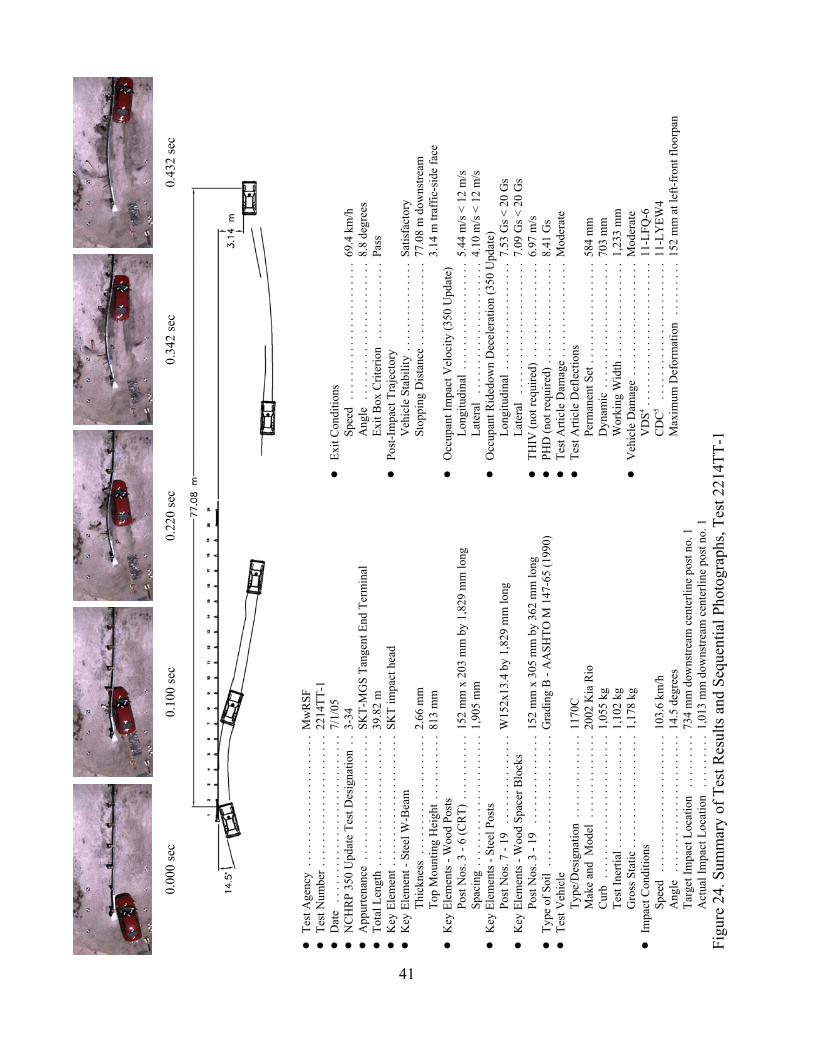
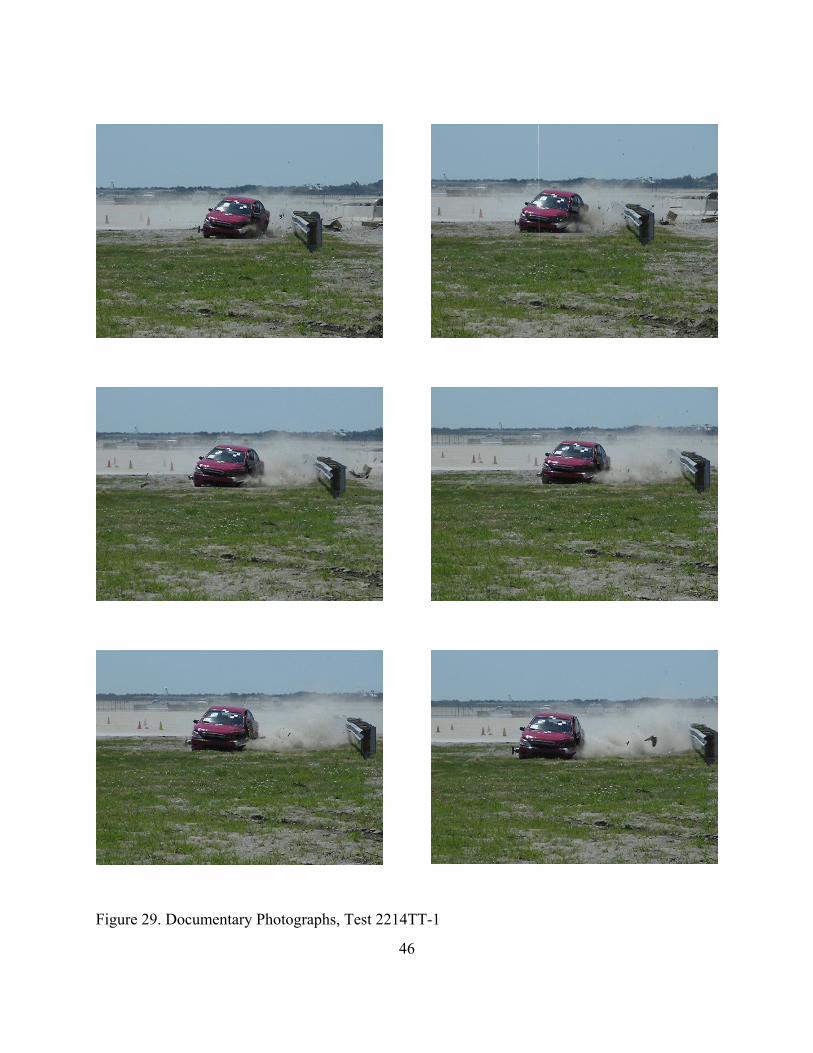
The 1,178-kg (2,596-lb) small car impacted the tangent end terminal system at a speed of
103.6 km/h (64.4 mph) and at an angle of 14.5 degrees. A summary of the test results and sequential
photographs are shown in Figure 24. The summary of the test results and sequential photographs in
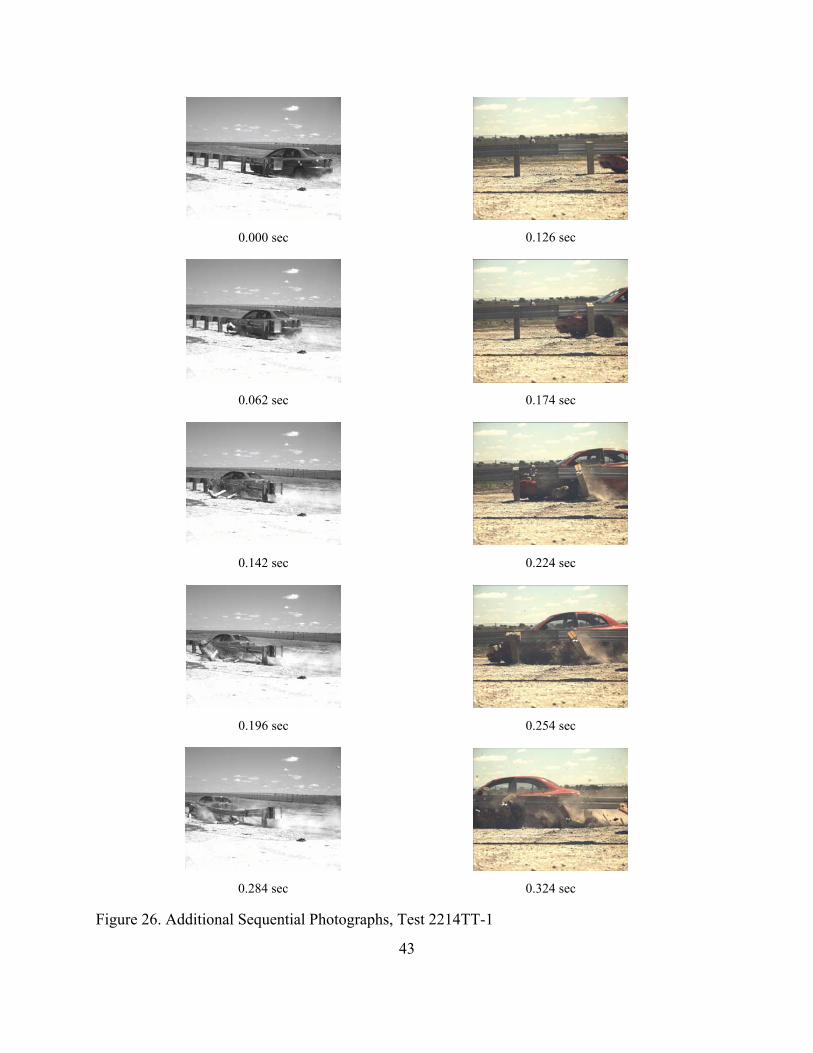
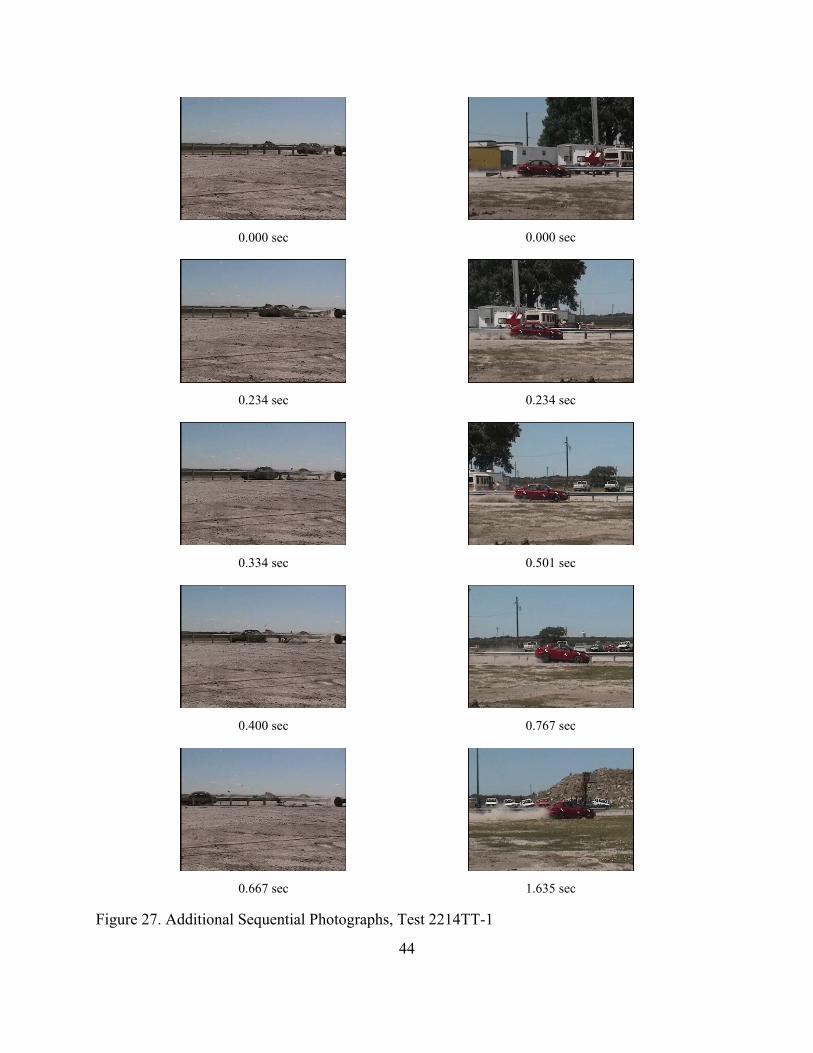
English units are shown in Appendix B. Additional sequential photographs are shown in Figures 25
through 27. Documentary photographs of the crash test are shown in Figures 28 and 29.
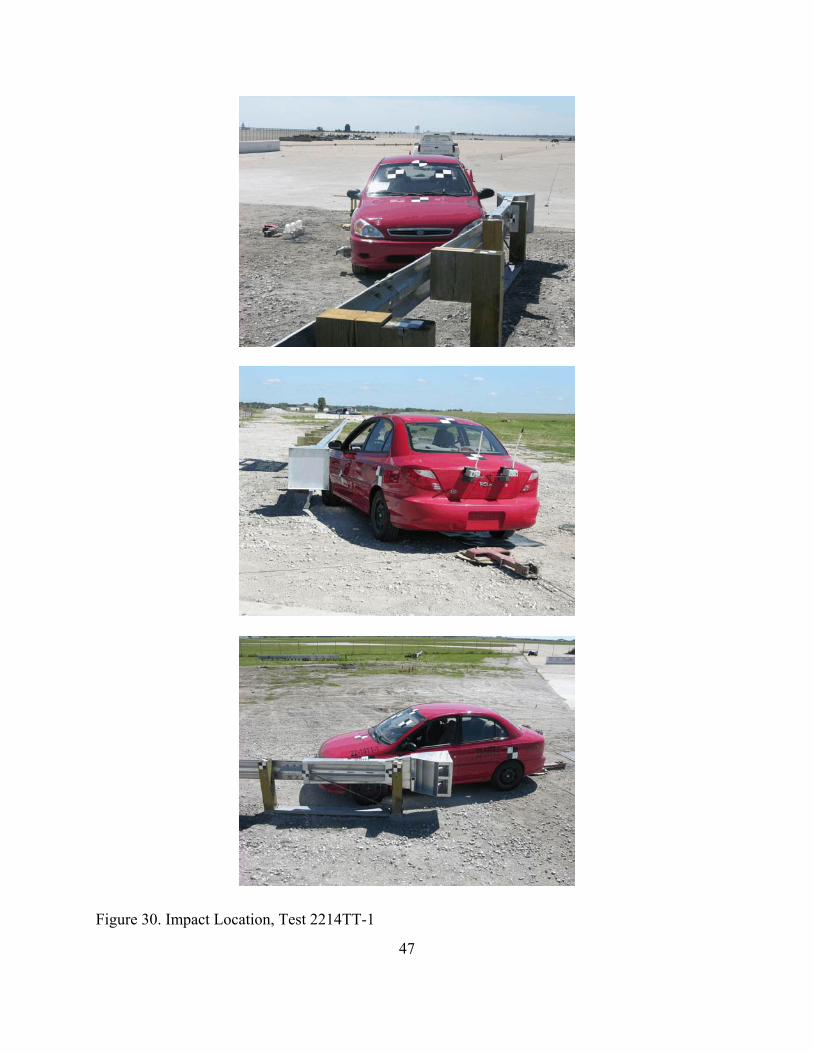
5.2 Test Description
Initial vehicle impact was to occur between post nos. 1 and 2, or 734 mm (28.9 in.)
downstream from the centerline of post no. 1, as shown in Figure 30. Actual vehicle impact occurred
1,013 mm (39.9 in.) downstream from the centerline of post no. 1. At 0.008 sec after impact, the left-
front corner of the vehicle crushed inward toward the engine compartment. At 0.032 sec, the left-
front corner of the vehicle was located at post no. 2 as the rail began to deflect. At 0.052 sec, the left-
front tire contacted post no. 2. At 0.070 sec, post no. 2 fractured, and the left-front corner of the
vehicle was located at the midspan between post nos. 2 and 3. At this same time, post no. 3 deflected
backward, and the rail appeared to be on top of the hood. At 0.100 sec, the left-front corner of the
vehicle was located at post no. 3 which continued to deflected backwards. At 0.120 sec, post no. 3
fractured. At 0.138 sec, the left-front tire contacted post no. 4. At the same time, the bottom of the
left-side mirror was riding along the top of the rail while the left-front corner of the hood protruded
under the rail. At 0.174 sec, the vehicle’s left-front tire protruded under the rail. At 0.190 sec, post
no. 4 fractured while the vehicle redirected. At 0.202 sec, the left-front tire disengaged from the
vehicle. At 0.224 sec, the top of the left-side door was ajar. At 0.258 sec, the left-front corner of the
37
vehicle contacted post no. 5 which twisted downstream. At this same time, the vehicle continued to
yaw away from the system as the front bumper encountered significant deformations. At 0.322 sec
after impact, the vehicle became parallel to the system with a resultant velocity of 71.2 km/h (44.3
mph). At 0.432 sec, the vehicle exited the system at an angle of 8.8 degrees and a resultant velocity
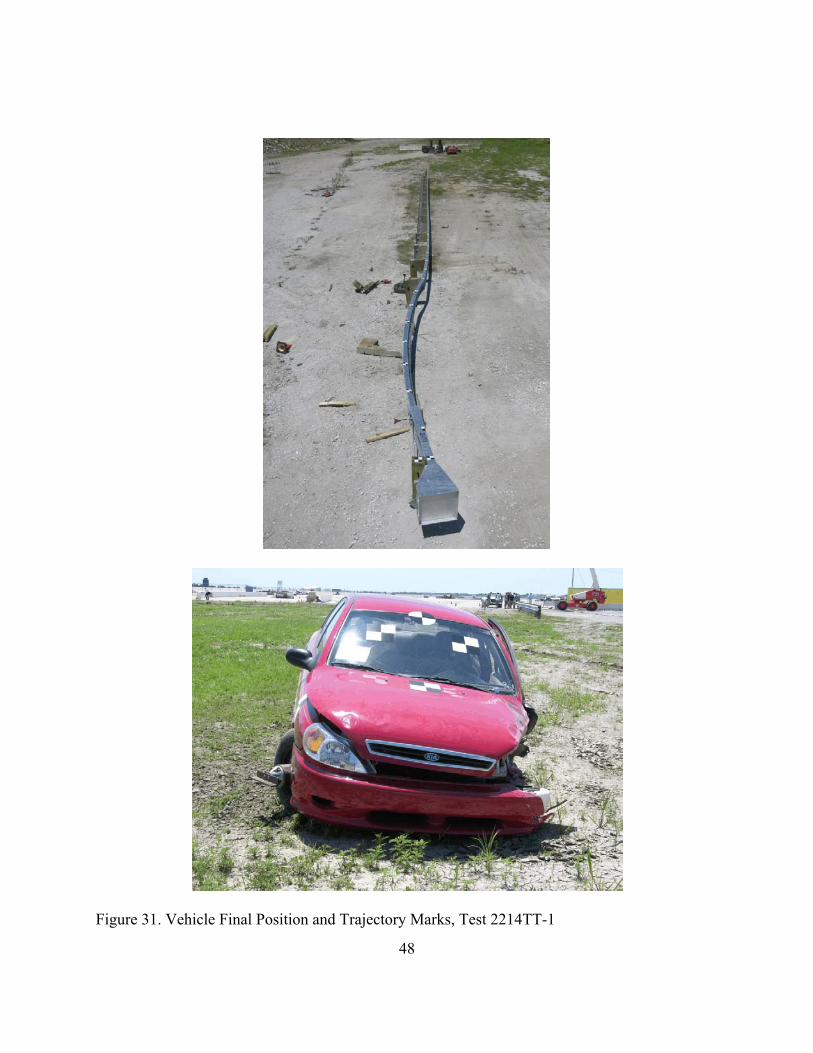
of 69.4 km/h (43.1 mph). The vehicle came to rest 77.08 m (252 ft - 11 in.) downstream from impact
and 3.14 m (10 ft - 4 in.) laterally away from the traffic-side face of the guardrail system. The
trajectory and final position of the small car are shown in Figures 24 and 31.
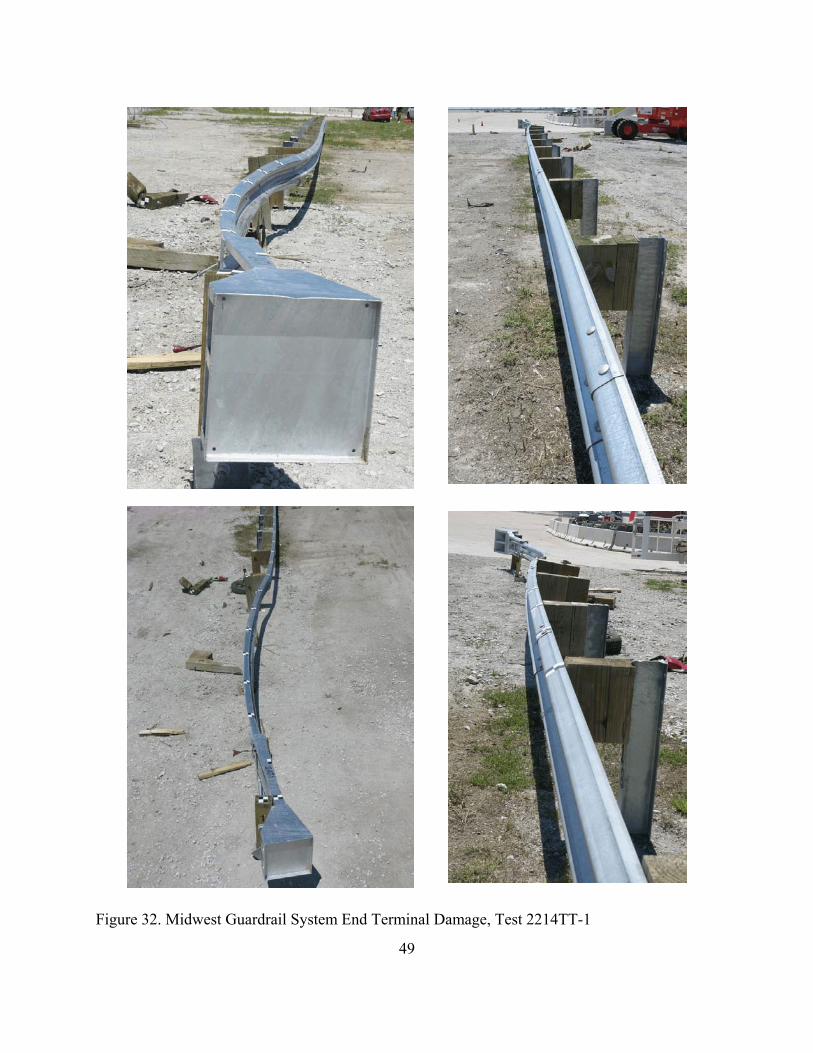
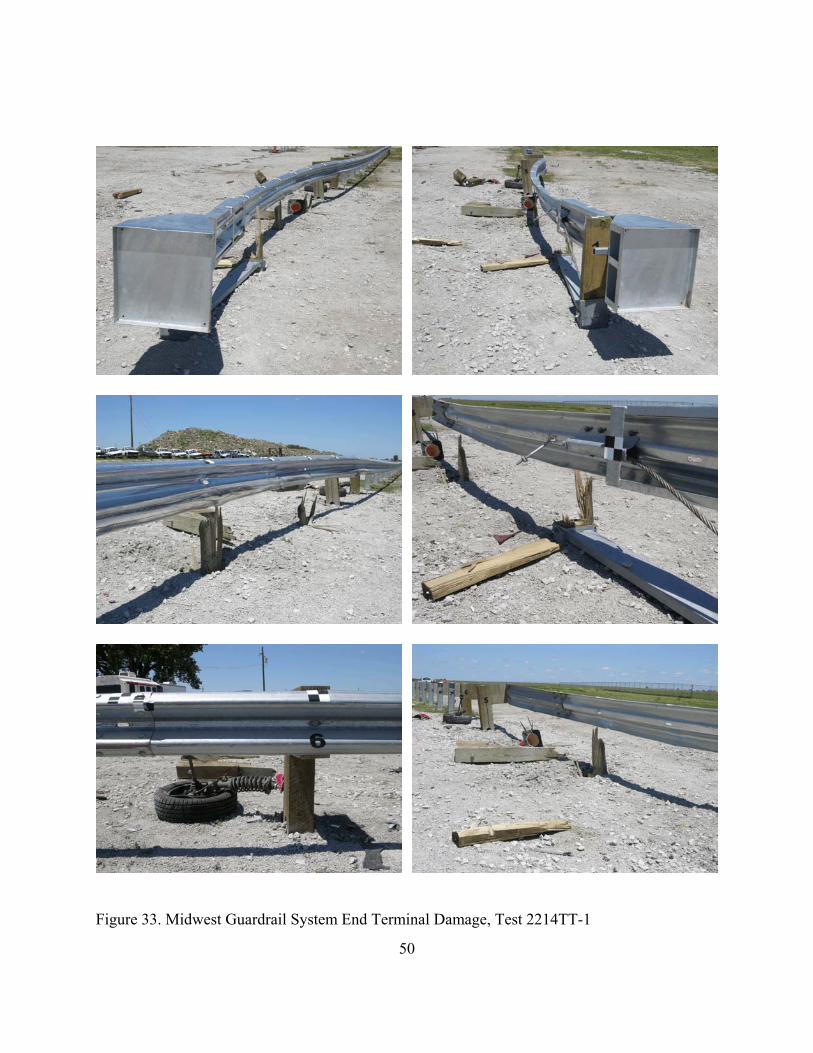
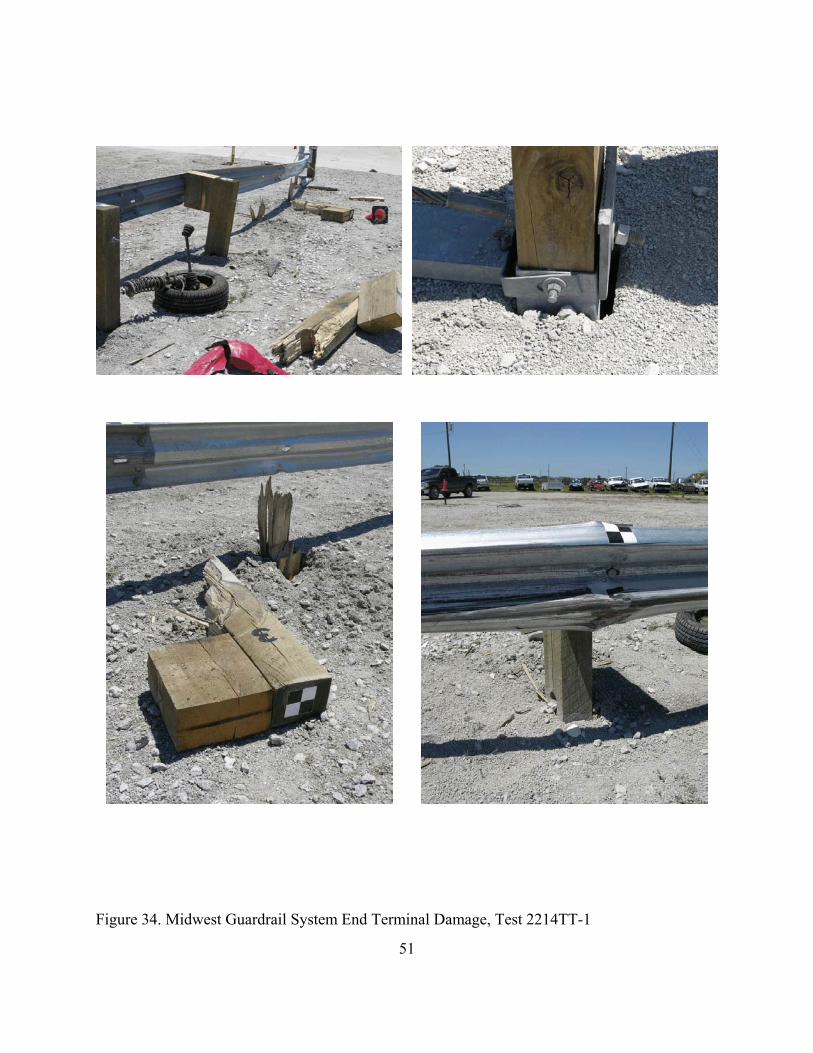
5.3 Barrier Damage
Damage to the barrier was moderate, as shown in Figures 32 through 35. Barrier damage
consisted of deformed W-beam, fractured and deformed guardrail posts, and contact marks on a
guardrail section. The length of vehicle contact along the W-beam guardrail system was
approximately 8.4 m (27.5 ft), which spanned from 1,013 mm (39.9 in.) downstream from the
centerline of post no. 1 through 1,651 mm (65 in.) downstream from the centerline of post no. 5.
Moderate deformation and flattening of the impacted section of W-beam rail occurred
between post nos. 1 and 6. The guardrail buckled significantly at post no. 5 while minor buckling
was found between post nos. 6 and 7. Contact marks were found on the guardrail between post nos.
1 and 6. The W-beam was pulled off of post nos. 2 through 4. The W-beam rail sustained yielding
around the post bolt slots at post nos. 3 and 4. Wood post nos. 2 through 4 fractured with their
blockouts remaining attached to the posts. Wood post nos. 5 and 6 rotated backward slightly but
otherwise remained undamaged. Steel post no. 7 encountered slight CCW twist. The downstream
end of the impact head was turned backward slightly but post no. 1 remained undamaged.
The permanent set of the barrier system is shown in Figure 32. The maximum lateral
38
permanent set rail deflection was 584 mm (23 in.) at the centerline of post no. 3, as measured in the
field. The maximum lateral dynamic rail deflection was 703 mm (27.7 in.) at the midspan between
post nos. 3 and 4, as determined from high-speed digital video analysis. The working width of the
system was found to be 1,233 mm (48.5 in.).
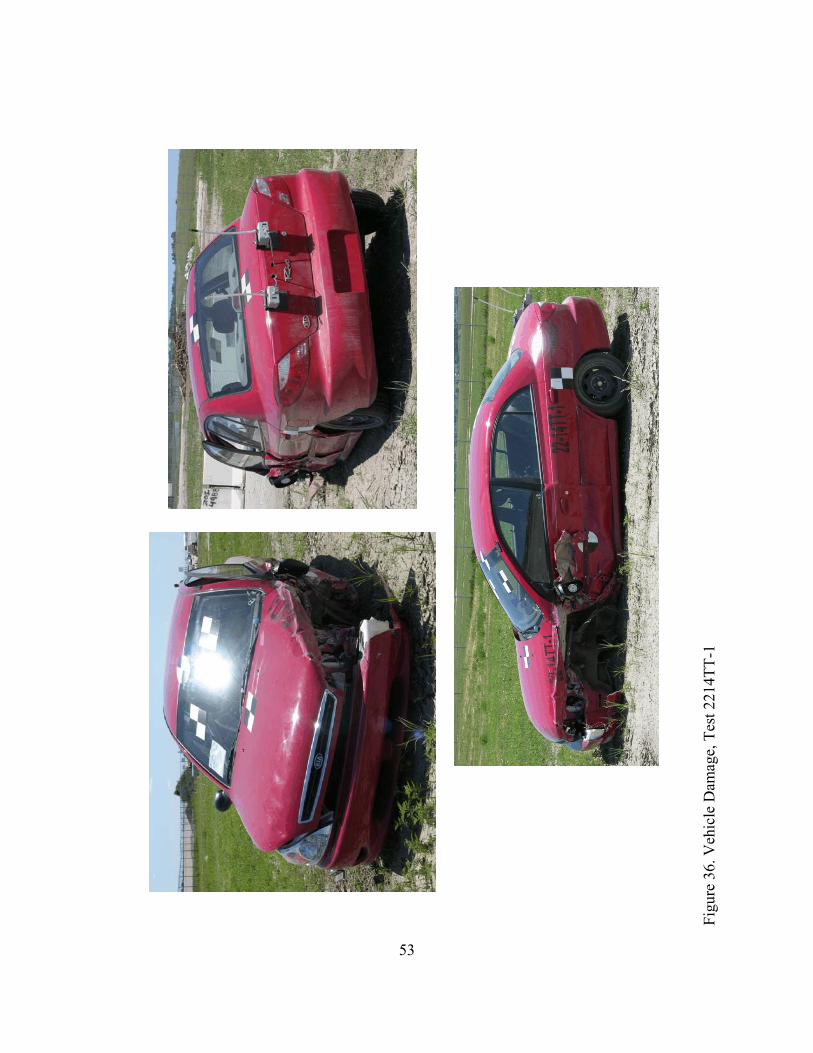
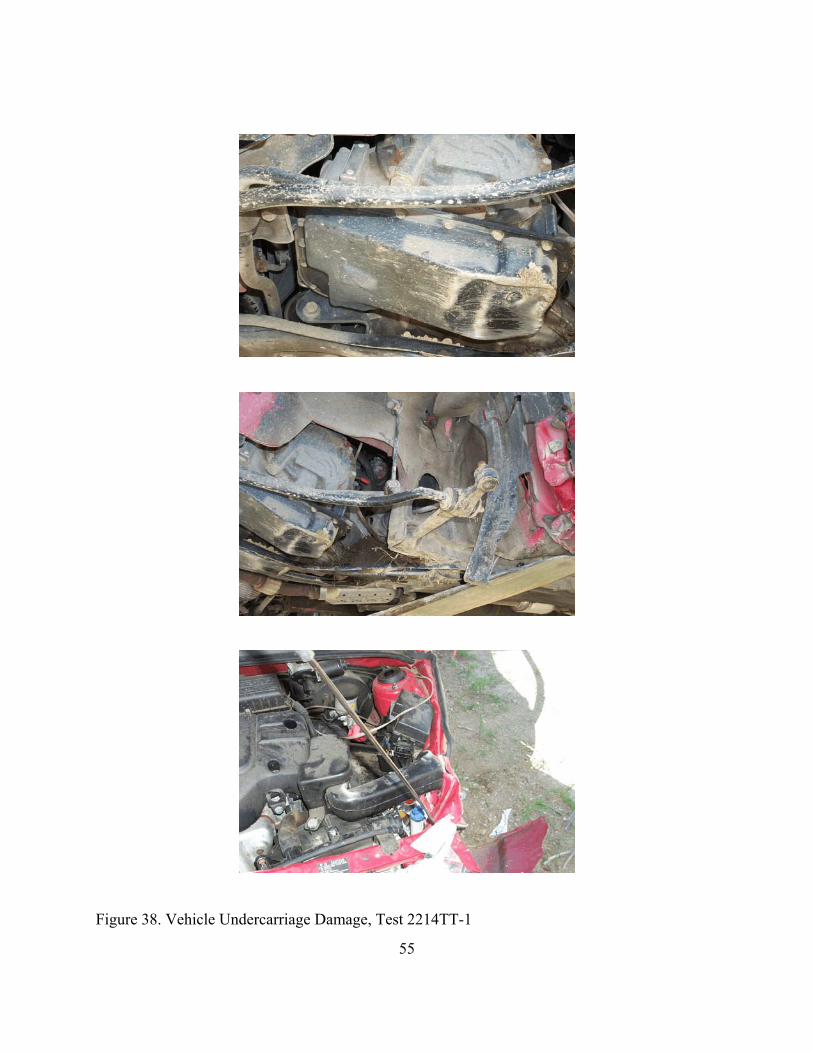
5.4 Vehicle Damage
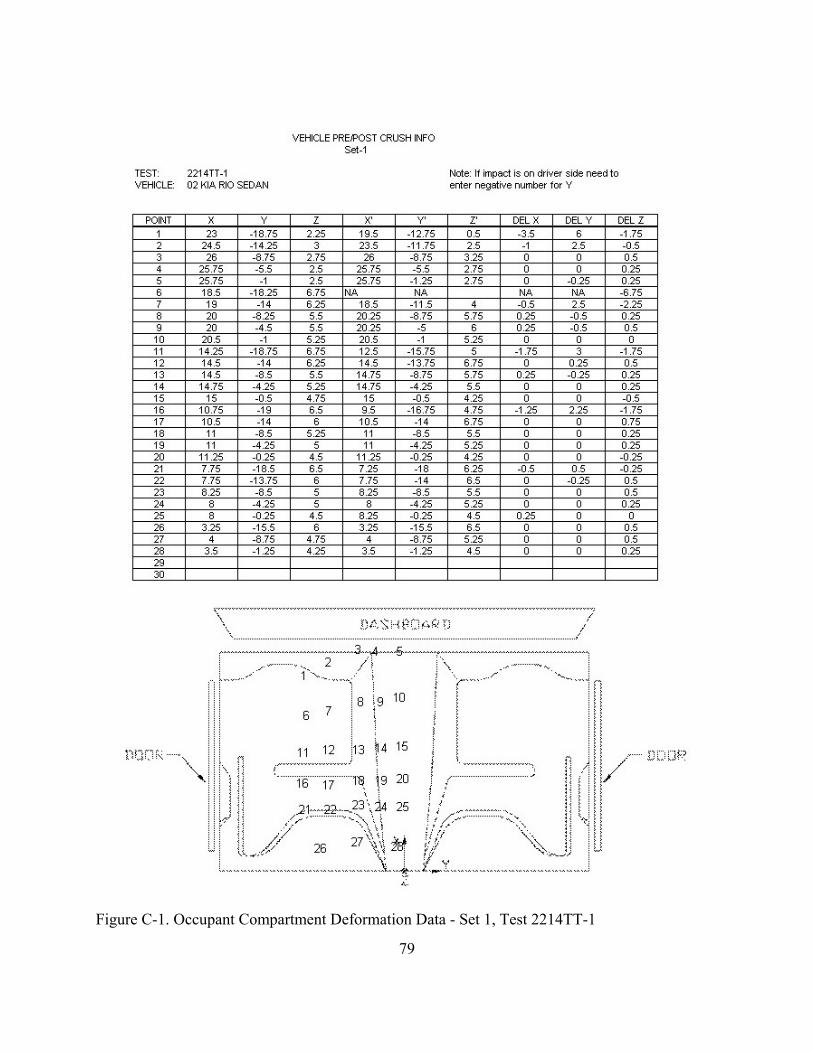
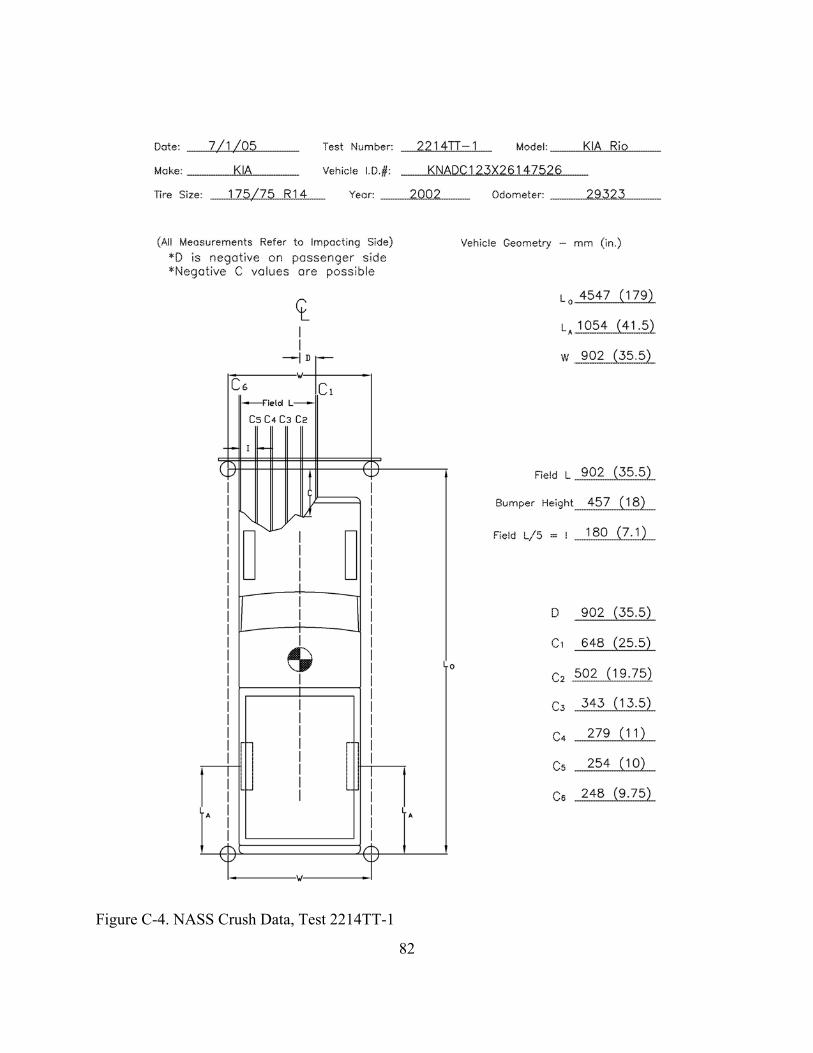
Exterior vehicle damage was moderate, as shown in Figures 36 through 39. Occupant
compartment deformations to the left side of the floorboard were judged insufficient to cause serious
injury to the vehicle occupants, as shown in Figure 39. Maximum longitudinal deflections of 89 mm
(3.5 in.) were located near the left-front corner of the left-side floorboard. Maximum lateral
deflections of 152 mm (6 in.) were located near the left-front corner of the left-side floorboard.
Maximum vertical deflections of 57 mm (2.25 in.) were located near the left center of the left-side
floorboard. Complete occupant compartment deformations and the corresponding locations are
provided in Appendix C.
Damage was concentrated on the left-front corner of the vehicle. The left side of the front
bumper was fractured. The front bumper was pushed back toward the engine compartment. The
radiator was pushed back into the engine compartment and buckled at its midpoint. The left-front
corner and rear corners of the hood encountered dents and scratches. The left-front quarter panel
sheet metal was deformed, torn, and peeled back into the left-front door. The right-front quarter
panel encountered minor dents and deformations behind the front tire. The left-front door
encountered deformations and sheet metal tears, while the left-rear door was dented and scratched.
The entire left side was dented and deformed. The left-side headlight was fractured and detached
and the light assembly was shifted toward the right. The left-side door mirror was broken off, but
39
remained attached by the mechanism wires. The left side of the roof between the front and back
doors was dented. The left-front wheel assembly deformed and crushed inward toward the engine
compartment. The left-side tire bearing and ball joints were fractured. The left-side steering knuckle
and left-front tire disengaged from the rest of the wheel assembly. The rear suspension was
damaged. The gear box and numerous underside components were scratched and dented. The
windshield encountered minor cracking at the lower-left side of the windshield. All other window
glass remained undamaged.
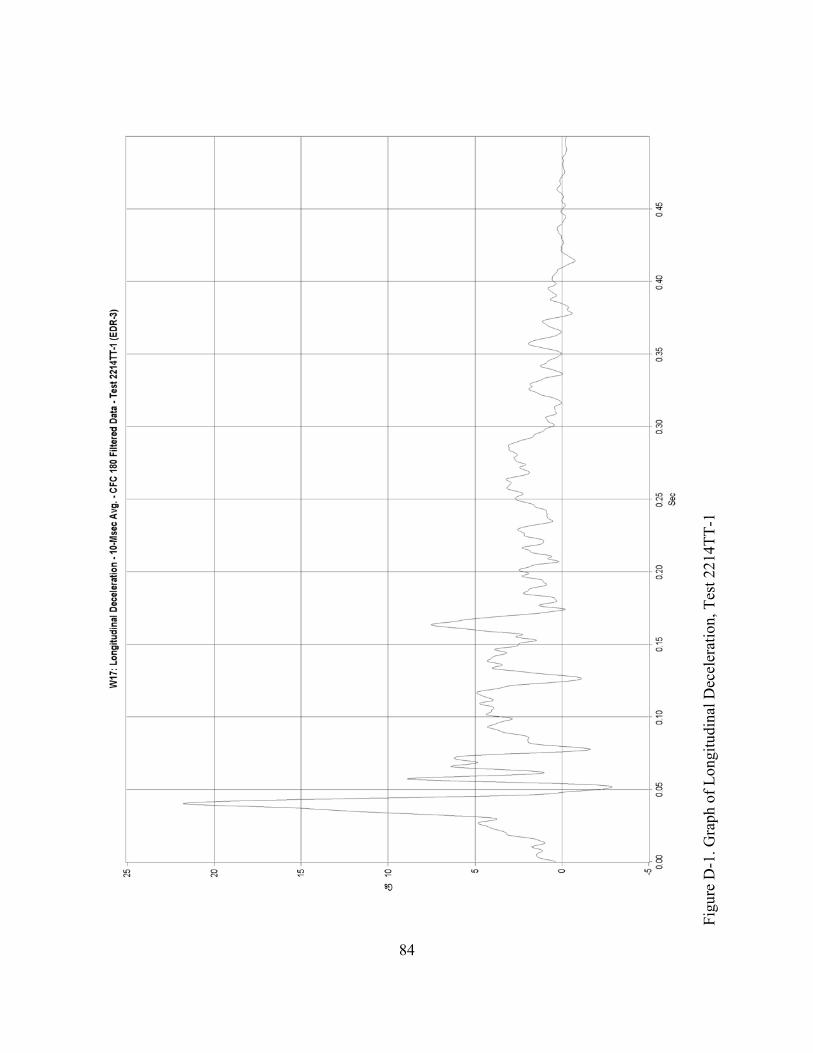
5.5 Occupant Risk Values
The longitudinal and lateral occupant impact velocities were determined to be 5.44 m/s
(17.85 ft/s) and 4.10 m/s (13.45 ft/s), respectively. The maximum 0.010-sec average occupant
ridedown decelerations in the longitudinal and lateral directions were 7.53 Gs and 7.09 Gs,
respectively. It is noted that the occupant impact velocities (OIVs) and occupant ridedown
decelerations (ORDs) were within the suggested limits provided in NCHRP Report No. 350. The
THIV and PHD values were determined to be 6.97 m/s (22.87 ft/s) and 8.41 Gs, respectively. The
results of the occupant risk, as determined from the accelerometer data, are summarized in Figure
24. Results are shown graphically in Appendix D. The results from the rate transducer are shown
graphically in Appendix D.
5.6 Discussion
The analysis of the test results for test no. 2214TT-1 showed that the SKT-MGS tangent end
terminal system, impacted with the 1100C vehicle of the Update to NCHRP Report No. 350,
adequately contained and redirected the vehicle with controlled lateral displacements of the barrier
system. There were no detached elements nor fragments which showed potential for penetrating the
40
occupant compartment nor presented undue hazard to other traffic. Deformations of, or intrusion
into, the occupant compartment that could have caused serious injury did not occur. The test vehicle
did not penetrate nor ride over the barrier system and remained upright during and after the collision.
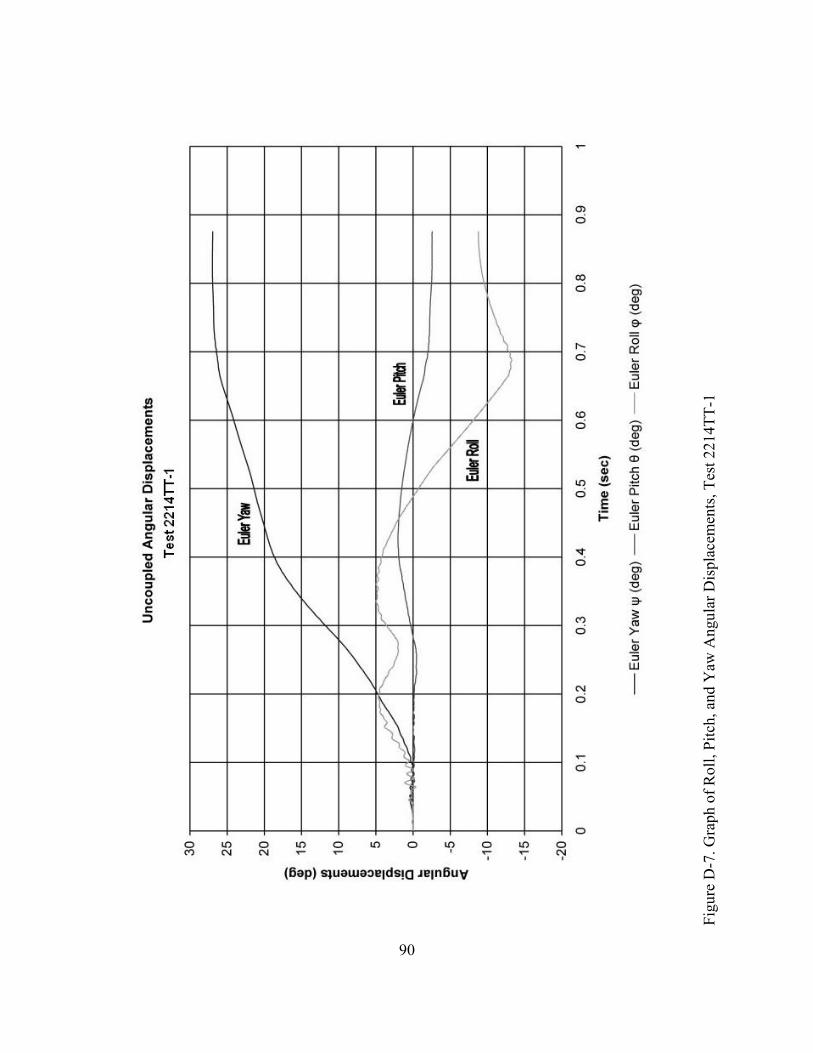
Vehicle roll, pitch, and yaw angular displacements were noted, but they were deemed acceptable
because they did not adversely influence occupant risk safety criteria nor cause rollover. After
collision, the vehicle’s trajectory revealed minimum intrusion into adjacent traffic lanes. Therefore,
test no. 2214TT-1 conducted on the SKT-MGS tangent end terminal with CRT posts was determined
to be acceptable according to the TL-3 safety performance criteria found in the Update to NCHRP
Report No. 350.
41
0.10
0 se
c0.
220
sec
0.34
2 se
c0.
432
sec
0.00
0 se
c
!Te
st A
genc
y..
....
....
....
....
....
Mw
RSF
!Te
st N
umbe
r..
....
....
....
....
....
2214
TT-1
!D
ate
....
....
....
....
....
....
....
7/1/
05!
NC
HR
P 35
0 U
pdat
e Te
st D
esig
natio
n..
3-34
!A
ppur
tena
nce
....
....
....
....
....
.SK
T-M
GS
Tang
ent E
nd T
erm
inal
!To
tal L
engt
h..
....
....
....
....
....
39.8
2 m
!K
ey E
lem
ent.
....
....
....
....
....
.SK
T im
pact
hea
d!
Key
Ele
men
t - S
teel
W-B
eam
Thic
knes
s..
....
....
....
....
..2.
66 m
mTo
p M
ount
ing
Hei
ght
....
....
...
813
mm
!K
ey E
lem
ents
- W
ood
Post
sPo
st N
os. 3
- 6
(CR
T)..
....
....
.15
2 m
m x
203
mm
by
1,82
9 m
m lo
ngSp
acin
g..
....
....
....
....
....
1,90
5 m
m!
Key
Ele
men
ts -
Stee
l Pos
tsPo
st N
os. 7
- 19
....
....
....
...
W15
2x13
.4 b
y 1,
829
mm
long
!K
ey E
lem
ents
- W
ood
Spac
er B
lock
sPo
st N
os. 3
- 19
....
....
....
...
152
mm
x 3
05 m
m b
y 36
2 m
m lo
ng!
Type
of S
oil
....
....
....
....
....
..G
radi
ng B
- A
ASH
TO M
147
-65
(199
0)!
Test
Veh
icle
Type
/Des
igna
tion
....
....
....
..11
70C
Mak
e an
d M
odel
....
....
....
..20
02 K
ia R
ioC
urb
....
....
....
....
....
....
1,05
5 kg
Test
Iner
tial.
....
....
....
....
..1,
102
kgG
ross
Sta
tic..
....
....
....
....
.1,
178
kg!
Impa
ct C
ondi
tions
Spee
d..
....
....
....
....
....
.10
3.6
km/h
Ang
le..
....
....
....
....
....
.14
.5 d
egre
esTa
rget
Impa
ct L
ocat
ion
....
....
.73
4 m
m d
owns
tream
cen
terli
ne p
ost n
o. 1
Act
ual I
mpa
ct L
ocat
ion
....
....
.1,
013
mm
dow
nstre
am c
ente
rline
pos
t no.
1
!Ex
it C
ondi
tions
Spee
d..
....
....
....
....
....
.69
.4 k
m/h
Ang
le..
....
....
....
....
....
.8.
8 de
gree
sEx
it B
ox C
riter
ion
....
....
....
.Pa
ss!
Post
-Im
pact
Tra
ject
ory
Veh
icle
Sta
bilit
y..
....
....
....
.Sa
tisfa
ctor
ySt
oppi
ng D
ista
nce
....
....
....
..77
.08
m d
owns
tream
3.14
m tr
affic
-sid
e fa
ce!
Occ
upan
t Im
pact
Vel
ocity
(350
Upd
ate)
Long
itudi
nal
....
....
....
....
..5.
44 m
/s <
12
m/s
Late
ral
....
....
....
....
....
..4.
10 m
/s <
12
m/s
!O
ccup
ant R
ided
own
Dec
eler
atio
n (3
50 U
pdat
e)Lo
ngitu
dina
l..
....
....
....
....
7.53
Gs <
20
Gs
Late
ral
....
....
....
....
....
..7.
09 G
s < 2
0 G
s!
THIV
(not
requ
ired)
....
....
....
....
6.97
m/s
!PH
D (n
ot re
quire
d)..
....
....
....
...
8.41
Gs
!Te
st A
rticl
e D
amag
e..
....
....
....
..M
oder
ate
!Te
st A
rticl
e D
efle
ctio
nsPe
rman
ent S
et..
....
....
....
...
584
mm
Dyn
amic
....
....
....
....
....
.70
3 m
mW
orki
ng W
idth
....
....
....
....
1,23
3 m
m!
Veh
icle
Dam
age
....
....
....
....
...
Mod
erat
eV
DS4
....
....
....
....
....
....
11-L
FQ-6
CD
C5
....
....
....
....
....
...
11-L
YEW
4M
axim
um D
efor
mat
ion
....
....
.15
2 m
m a
t lef
t-fro
nt fl
oorp
an
Figu
re 2
4. S
umm
ary
of T
est R
esul
ts a
nd S
eque
ntia
l Pho
togr
aphs
, Tes
t 221
4TT-
1
42
0.134 sec
0.000 sec
0.218 sec
0.138 sec
0.432 sec
0.216 sec
0.408 sec
0.758 sec
0.000 sec
0.644 sec
Figure 25. Additional Sequential Photographs, Test 2214TT-1
43
0.062 sec
0.126 sec
0.142 sec
0.174 sec
0.196 sec
0.224 sec
0.254 sec
0.284 sec
0.000 sec
0.324 sec
Figure 26. Additional Sequential Photographs, Test 2214TT-1
44
0.234 sec
0.000 sec
0.334 sec
0.234 sec
0.400 sec
0.501 sec
0.667 sec
0.767 sec
0.000 sec
1.635 sec
Figure 27. Additional Sequential Photographs, Test 2214TT-1
45
Figure 28. Documentary Photographs, Test 2214TT-1
46
Figure 29. Documentary Photographs, Test 2214TT-1
47
Figure 30. Impact Location, Test 2214TT-1
48
Figure 31. Vehicle Final Position and Trajectory Marks, Test 2214TT-1
49
Figure 32. Midwest Guardrail System End Terminal Damage, Test 2214TT-1
50
Figure 33. Midwest Guardrail System End Terminal Damage, Test 2214TT-1
51
Figure 34. Midwest Guardrail System End Terminal Damage, Test 2214TT-1
52
Figu
re 3
5. M
idw
est G
uard
rail
Syst
em E
nd T
erm
inal
Dam
age,
Tes
t 221
4TT-
1
53
Figu
re 3
6. V
ehic
le D
amag
e, T
est 2
214T
T-1
54
Figu
re 3
7. V
ehic
le D
amag
e, T
est 2
214T
T-1
55
Figure 38. Vehicle Undercarriage Damage, Test 2214TT-1
56
Figure 39. Occupant Compartment Damage, Test 2214TT-1
57
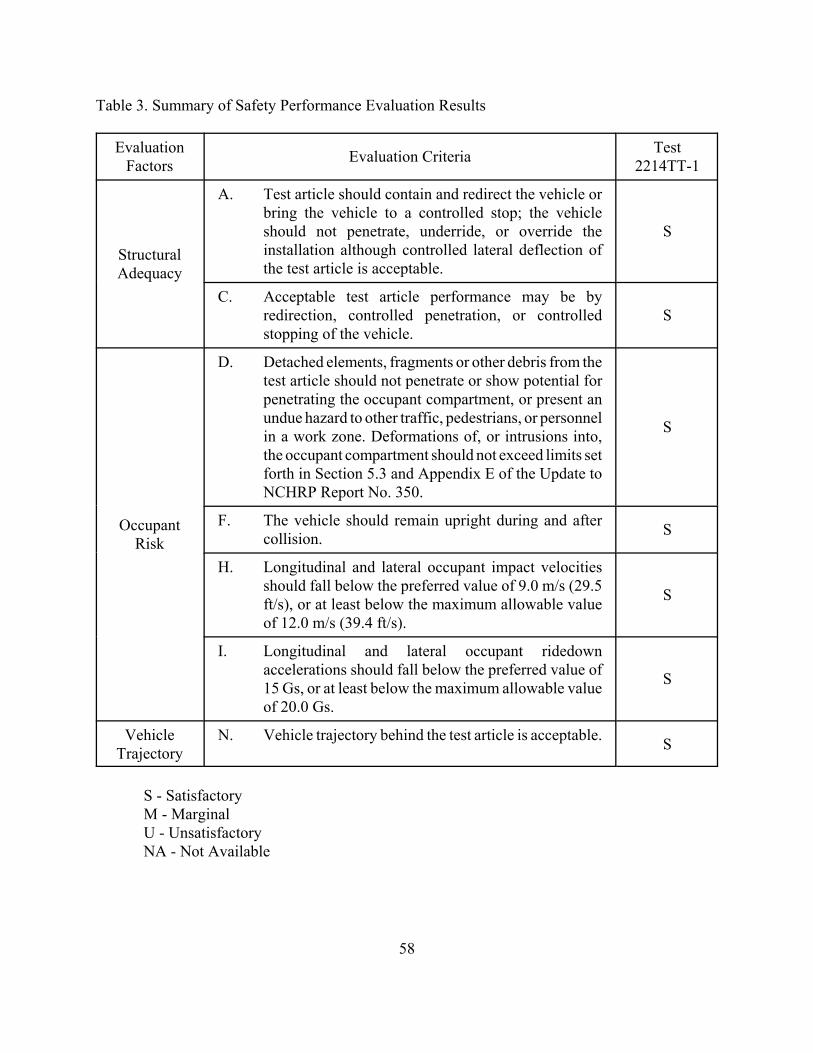
6 SUMMARY AND CONCLUSIONS
The SKT-MGS tangent end terminal with CRT posts was constructed at the maximum height
tolerance and full-scale vehicle crash tested. One full-scale vehicle crash test, using a small car
vehicle, was performed on the end terminal system and was determined to be acceptable according
to the TL-3 safety performance criteria for test designation 3-34 presented in the Update to NCHRP
Report No. 350. A summary of the safety performance evaluation is provided in Table 3.
58
Table 3. Summary of Safety Performance Evaluation Results
EvaluationFactors Evaluation Criteria Test
2214TT-1
StructuralAdequacy
A. Test article should contain and redirect the vehicle orbring the vehicle to a controlled stop; the vehicleshould not penetrate, underride, or override theinstallation although controlled lateral deflection ofthe test article is acceptable.
S
C. Acceptable test article performance may be byredirection, controlled penetration, or controlledstopping of the vehicle.
S
OccupantRisk
D. Detached elements, fragments or other debris from thetest article should not penetrate or show potential forpenetrating the occupant compartment, or present anundue hazard to other traffic, pedestrians, or personnelin a work zone. Deformations of, or intrusions into,the occupant compartment should not exceed limits setforth in Section 5.3 and Appendix E of the Update toNCHRP Report No. 350.
S
F. The vehicle should remain upright during and aftercollision. S
H. Longitudinal and lateral occupant impact velocitiesshould fall below the preferred value of 9.0 m/s (29.5ft/s), or at least below the maximum allowable valueof 12.0 m/s (39.4 ft/s).
S
I. Longitudinal and lateral occupant ridedownaccelerations should fall below the preferred value of15 Gs, or at least below the maximum allowable valueof 20.0 Gs.
S
VehicleTrajectory
N. Vehicle trajectory behind the test article is acceptable. S
S - SatisfactoryM - MarginalU - UnsatisfactoryNA - Not Available
59
7 REFERENCES
1. Ross, H.E., Sicking, D.L., Zimmer, R.A., and Michie, J.D., Recommended Procedures forthe Safety Performance Evaluation of Highway Features, National Cooperative ResearchProgram (NCHRP) Report No. 350, Transportation Research Board, Washington, D.C.,1993.
2. Sicking, D.L., Mak, K.K., and Rohde, J.R. Rohde, NCHRP Report No. 350 Update -Chapters 1 through 7, Draft Report, Presented to the Transportation Research Board,Prepared by the Midwest Roadside Safety Facility, University of Nebraska-Lincoln, July2005 [Privileged Document].
3. Hinch, J., Yang, T.L., and Owings, R., Guidance Systems for Vehicle Testing, ENSCO, Inc.,Springfield, VA, 1986.
4. Vehicle Damage Scale for Traffic Investigators, Second Edition, Technical Bulletin No. 1,Traffic Accident Data (TAD) Project, National Safety Council, Chicago, Illinois, 1971.
5. Collision Deformation Classification - Recommended Practice J224 March 1980, HandbookVolume 4, Society of Automotive Engineers (SAE), Warrendale, Pennsylvania, 1985.
60
8 APPENDICES
61
APPENDIX A
English-Unit System Drawings
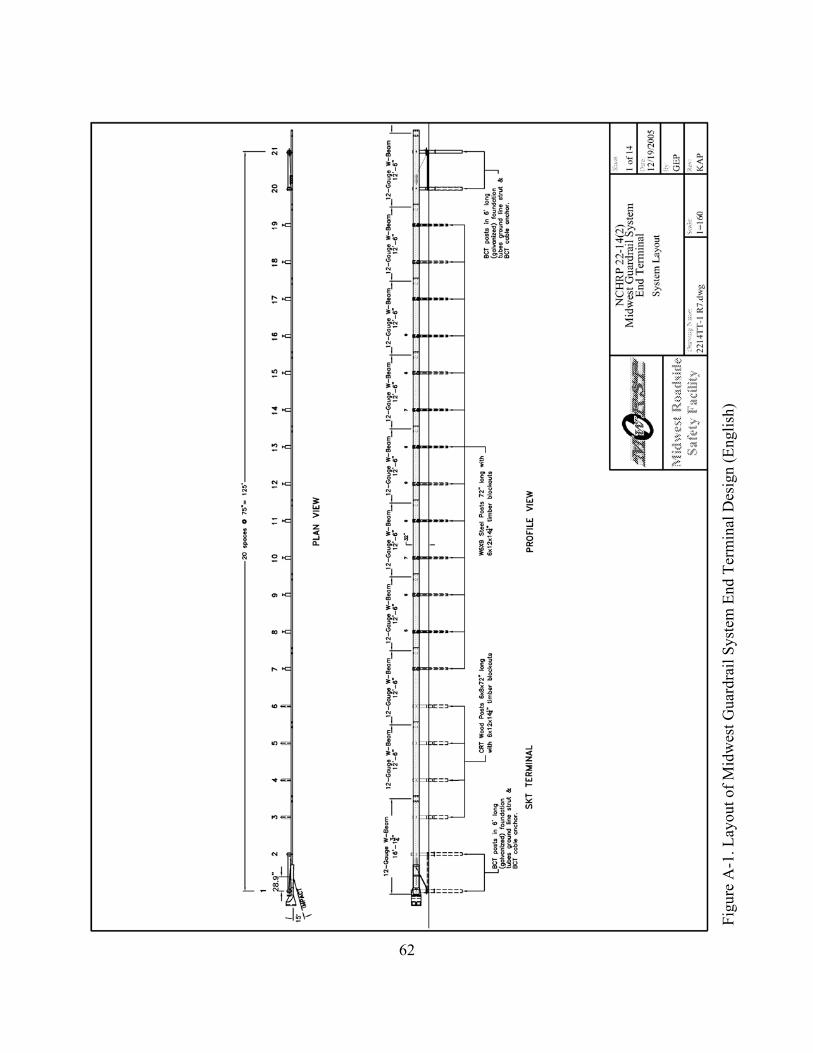
Figure A-1. Layout of Midwest Guardrail System End Terminal Design (English)
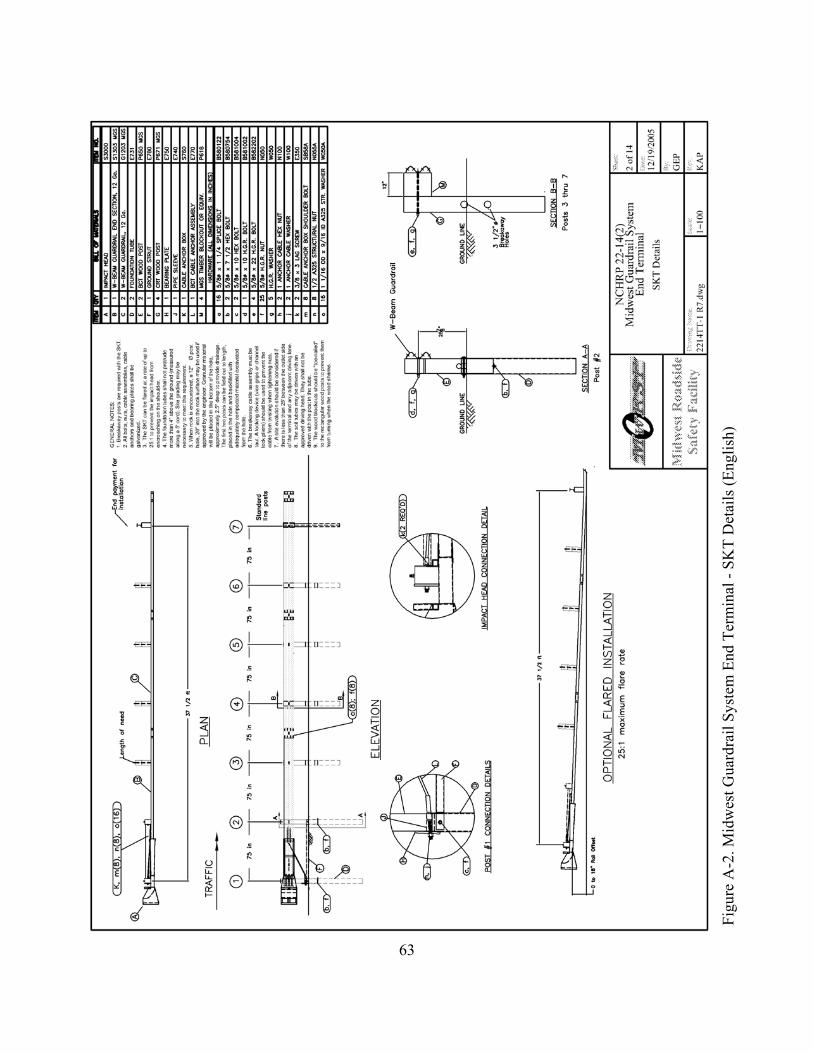
Figure A-2. Midwest Guardrail System End Terminal - SKT Details (English)
Figure A-3. Midwest Guardrail System End Terminal - End Rail Details (English)
Figure A-4. Midwest Guardrail System End Terminal - Rail Details (English)
Figure A-5. Midwest Guardrail System End Terminal - Post Details (English)
Figure A-6. Midwest Guardrail System End Terminal - Post Details (English)
Figure A-7. Midwest Guardrail System End Terminal - Post Details (English)
Figure A-8. Midwest Guardrail System End Terminal - Anchorage Details (English)
Figure A-9. Midwest Guardrail System End Terminal - Anchorage Details (English)
Figure A-10. Midwest Guardrail System End Terminal - SKT Head Details (English)
Figure A-11. Midwest Guardrail System End Terminal - SKT Head Details (English)
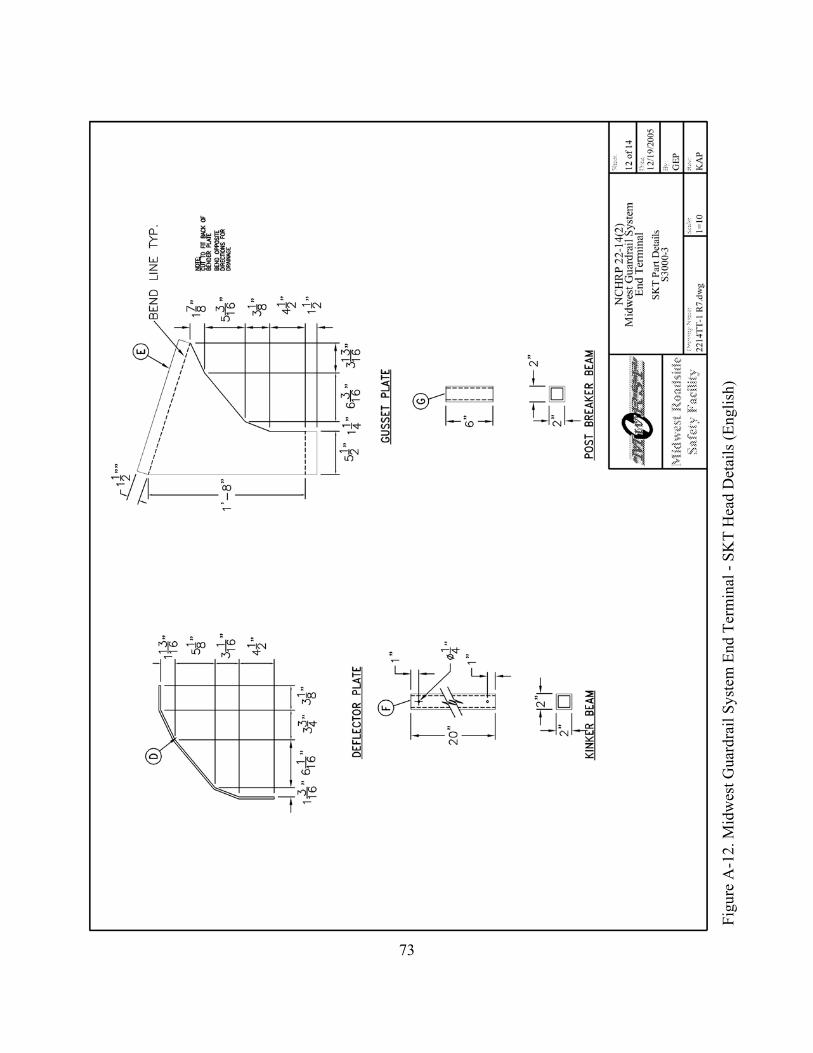
Figure A-12. Midwest Guardrail System End Terminal - SKT Head Details (English)
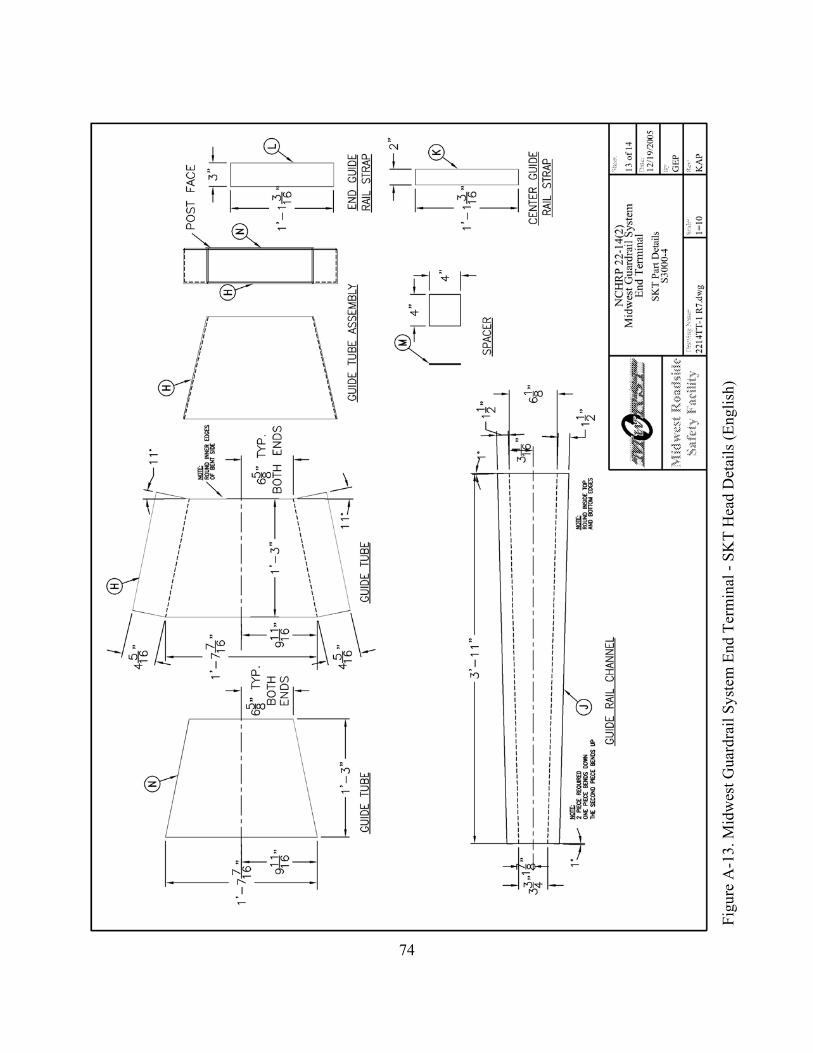
Figure A-13. Midwest Guardrail System End Terminal - SKT Head Details (English)
Figure A-14. Midwest Guardrail System End Terminal - SKT Head Details (English)
62
Figu
re A
-1. L
ayou
t of M
idw
est G
uard
rail
Syst
em E
nd T
erm
inal
Des
ign
(Eng
lish)
63
Figu
re A
-2. M
idw
est G
uard
rail
Syst
em E
nd T
erm
inal
- SK
T D
etai
ls (E
nglis
h)
64
Figu
re A
-3. M
idw
est G
uard
rail
Syst
em E
nd T
erm
inal
- SK
T En
d R
ail D
etai
ls (E
nglis
h)
65
Figure A-4. Midwest Guardrail System End Terminal - Rail Details (English)
66
Figure A-5. Midwest Guardrail System End Terminal - Post Details (English)
67
Figu
re A
-6. M
idw
est G
uard
rail
Syst
em E
nd T
erm
inal
- Po
st D
etai
ls (E
nglis
h)
68
Figure A-7. Midwest Guardrail System End Terminal - Post Details (English)
69
Figu
re A
-8. M
idw
est G
uard
rail
Syst
em E
nd T
erm
inal
- A
ncho
rage
Det
ails
(Eng
lish)
70
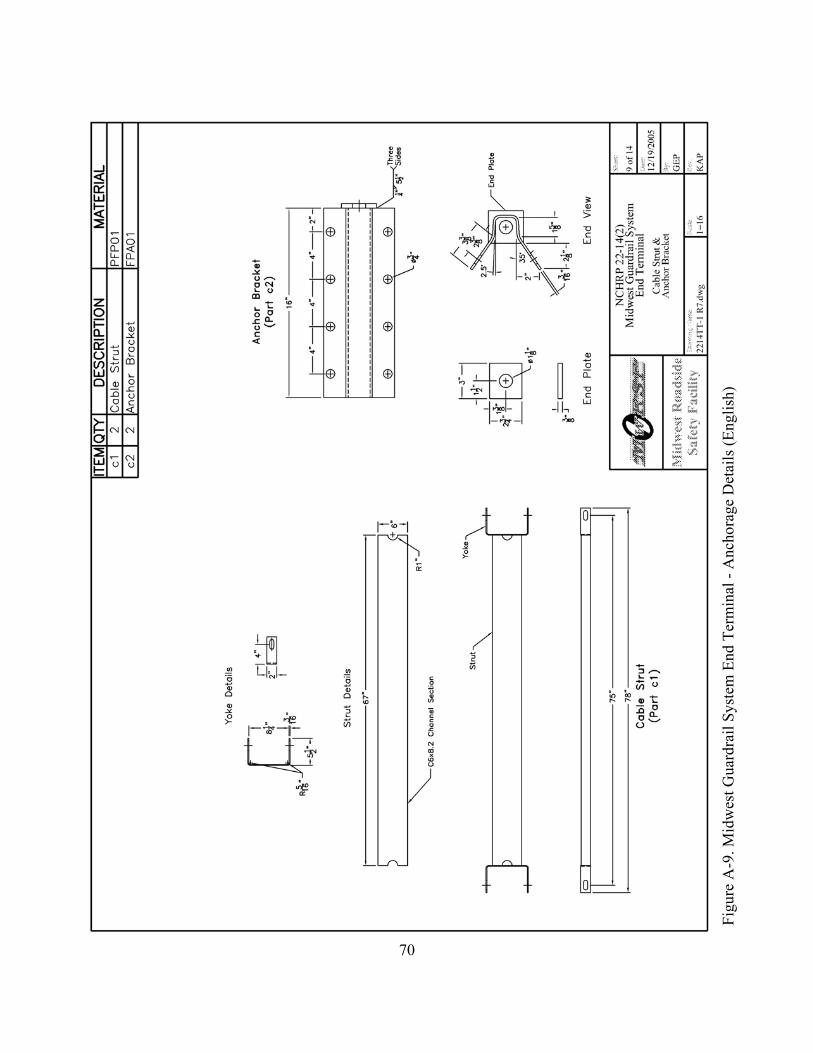
Figu
re A
-9. M
idw
est G
uard
rail
Syst
em E
nd T
erm
inal
- A
ncho
rage
Det
ails
(Eng
lish)
71
Figu
re A
-10.
Mid
wes
t Gua
rdra
il Sy
stem
End
Ter
min
al -
SKT
Hea
d D
etai
ls (E
nglis
h)
72
Figu
re A
-11.
Mid
wes
t Gua
rdra
il Sy
stem
End
Ter
min
al -
SKT
Hea
d D
etai
ls (E
nglis
h)
73
Figu
re A
-12.
Mid
wes
t Gua
rdra
il Sy
stem
End
Ter
min
al -
SKT
Hea
d D
etai
ls (E
nglis
h)
74
Figu
re A
-13.
Mid
wes
t Gua
rdra
il Sy
stem
End
Ter
min
al -
SKT
Hea
d D
etai
ls (E
nglis
h)
75
Figu
re A
-14.
Mid
wes
t Gua
rdra
il Sy
stem
End
Ter
min
al -
SKT
Hea
d D
etai
ls (E
nglis
h)
76
APPENDIX B
Test Summary Sheet in English Units
Figure B-1. Summary of Test Results and Sequential Photographs (English), Test 2214TT-1
77
0.10
0 se
c0.
220
sec
0.34
2 se
c0.
432
sec
0.00
0 se
c
!Te
st A
genc
y..
....
....
....
....
....
Mw
RSF
!Te
st N
umbe
r..
....
....
....
....
....
2214
TT-1
!D
ate
....
....
....
....
....
....
....
7/1/
05!
NC
HR
P 35
0 U
pdat
e Te
st D
esig
natio
n..
3-34
!A
ppur
tena
nce
....
....
....
....
....
.SK
T-M
GS
Tang
ent E
nd T
erm
inal
!To
tal L
engt
h..
....
....
....
....
....
130.
64 ft
!K
ey E
lem
ent.
....
....
....
....
....
.SK
T im
pact
hea
d!
Key
Ele
men
t - S
teel
W-B
eam
Thic
knes
s..
....
....
....
....
..12
gau
geTo
p M
ount
ing
Hei
ght
....
....
...
32 in
.!
Key
Ele
men
ts -
Woo
d Po
sts
Post
Nos
. 3 -
6 (C
RT)
....
....
...
6 in
. x 8
in. b
y 6
ft lo
ngSp
acin
g..
....
....
....
....
....
75 in
.!
Key
Ele
men
ts -
Stee
l Pos
tsPo
st N
os. 7
- 19
....
....
....
...
W6x
9 by
6 ft
long
!K
ey E
lem
ents
- W
ood
Spac
er B
lock
sPo
st N
os. 3
- 19
....
....
....
...
6 in
. x 1
2 in
. by
14.2
5 in
. lon
g!
Type
of S
oil
....
....
....
....
....
..G
radi
ng B
- A
ASH
TO M
147
-65
(199
0)!
Test
Veh
icle
Type
/Des
igna
tion
....
....
....
..11
70C
Mak
e an
d M
odel
....
....
....
..20
02 K
ia R
ioC
urb
....
....
....
....
....
....
2,32
6 lb
sTe
st In
ertia
l...
....
....
....
....
2,43
0 lb
sG
ross
Sta
tic..
....
....
....
....
.2,
596
lbs
!Im
pact
Con
ditio
nsSp
eed
....
....
....
....
....
...
64.6
mph
Ang
le..
....
....
....
....
....
.14
.5 d
egre
esTa
rget
Impa
ct L
ocat
ion
....
....
.28
.9 in
. dow
nstre
am c
ente
rline
pos
t no.
1A
ctua
l Im
pact
Loc
atio
n..
....
...
39.9
in. d
owns
tream
cen
terli
ne p
ost n
o. 1
!Ex
it C
ondi
tions
Spee
d..
....
....
....
....
....
.43
.1 m
phA
ngle
....
....
....
....
....
...
8.8
degr
ees
Exit
Box
Crit
erio
n..
....
....
...
Pass
!Po
st-I
mpa
ct T
raje
ctor
yV
ehic
le S
tabi
lity
....
....
....
...
Satis
fact
ory
Stop
ping
Dis
tanc
e..
....
....
....
252
ft - 1
1 in
. dow
nstre
am10
ft -
4 in
. tra
ffic
-sid
e fa
ce!
Occ
upan
t Im
pact
Vel
ocity
(350
Upd
ate)
Long
itudi
nal
....
....
....
....
..17
.85
ft/s <
39.
4 ft/
sLa
tera
l..
....
....
....
....
....
13.4
5 ft/
s < 3
9.4
ft/s
!O
ccup
ant R
ided
own
Dec
eler
atio
n (3
50 U
pdat
e)Lo
ngitu
dina
l..
....
....
....
....
7.53
Gs <
20
Gs
Late
ral
....
....
....
....
....
..7.
09 G
s < 2
0 G
s!
THIV
(not
requ
ired)
....
....
....
....
22.8
7 ft/
s!
PHD
(not
requ
ired)
....
....
....
....
.8.
41 G
s!
Test
Arti
cle
Dam
age
....
....
....
....
Mod
erat
e!
Test
Arti
cle
Def
lect
ions
Perm
anen
t Set
....
....
....
....
.23
in.
Dyn
amic
....
....
....
....
....
.27
.7 in
.W
orki
ng W
idth
....
....
....
....
48.5
in.
!V
ehic
le D
amag
e..
....
....
....
....
.M
oder
ate
VD
S4..
....
....
....
....
....
..11
-LFQ
-6C
DC
5..
....
....
....
....
....
.11
-LY
EW4
Max
imum
Def
orm
atio
n..
....
...
6 in
. at l
eft-f
ront
floo
rpan
Figu
re B
-1. S
umm
ary
of T
est R
esul
ts a
nd S
eque
ntia
l Pho
togr
aphs
(Eng
lish)
, Tes
t 221
4TT-
1
78
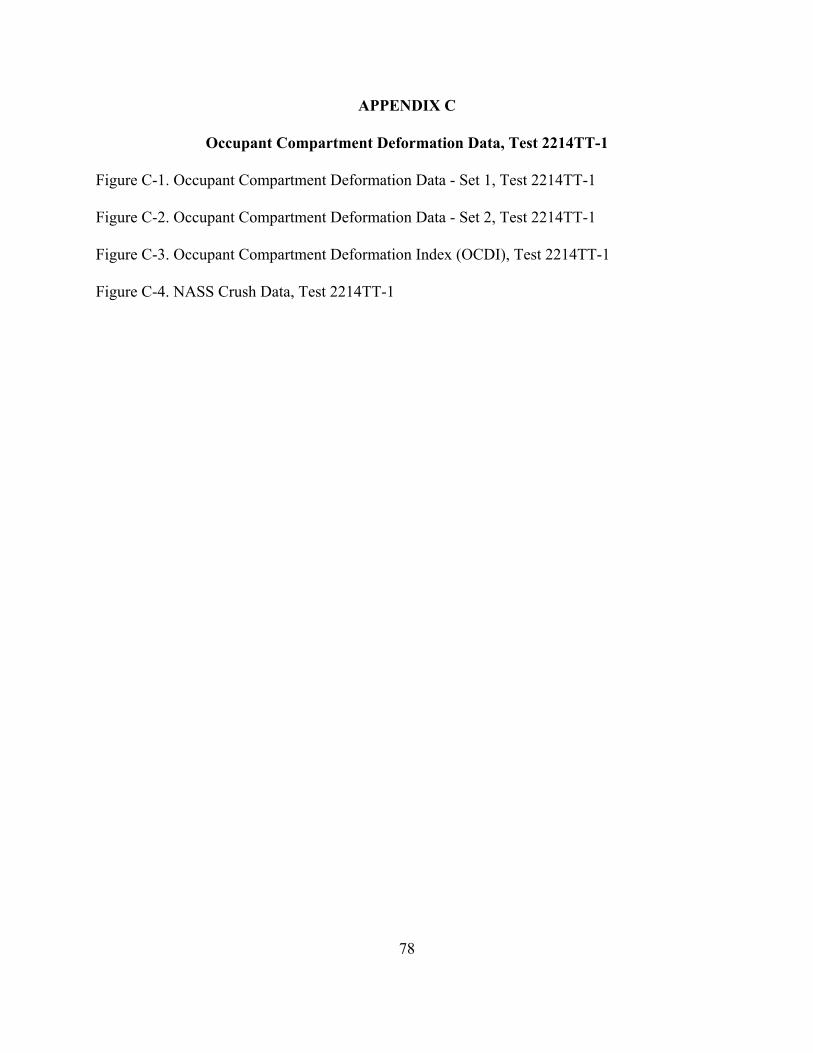
APPENDIX C
Occupant Compartment Deformation Data, Test 2214TT-1
Figure C-1. Occupant Compartment Deformation Data - Set 1, Test 2214TT-1
Figure C-2. Occupant Compartment Deformation Data - Set 2, Test 2214TT-1
Figure C-3. Occupant Compartment Deformation Index (OCDI), Test 2214TT-1
Figure C-4. NASS Crush Data, Test 2214TT-1
79
Figure C-1. Occupant Compartment Deformation Data - Set 1, Test 2214TT-1
80
Figure C-2. Occupant Compartment Deformation Data - Set 2, Test 2214TT-1
81
Figure C-3. Occupant Compartment Deformation Index (OCDI), Test 2214TT-1
82
Figure C-4. NASS Crush Data, Test 2214TT-1
83
APPENDIX D
Accelerometer and Rate Transducer Data Analysis, Test 2214TT-1
Figure D-1. Graph of Longitudinal Deceleration, Test 2214TT-1
Figure D-2. Graph of Longitudinal Occupant Impact Velocity, Test 2214TT-1
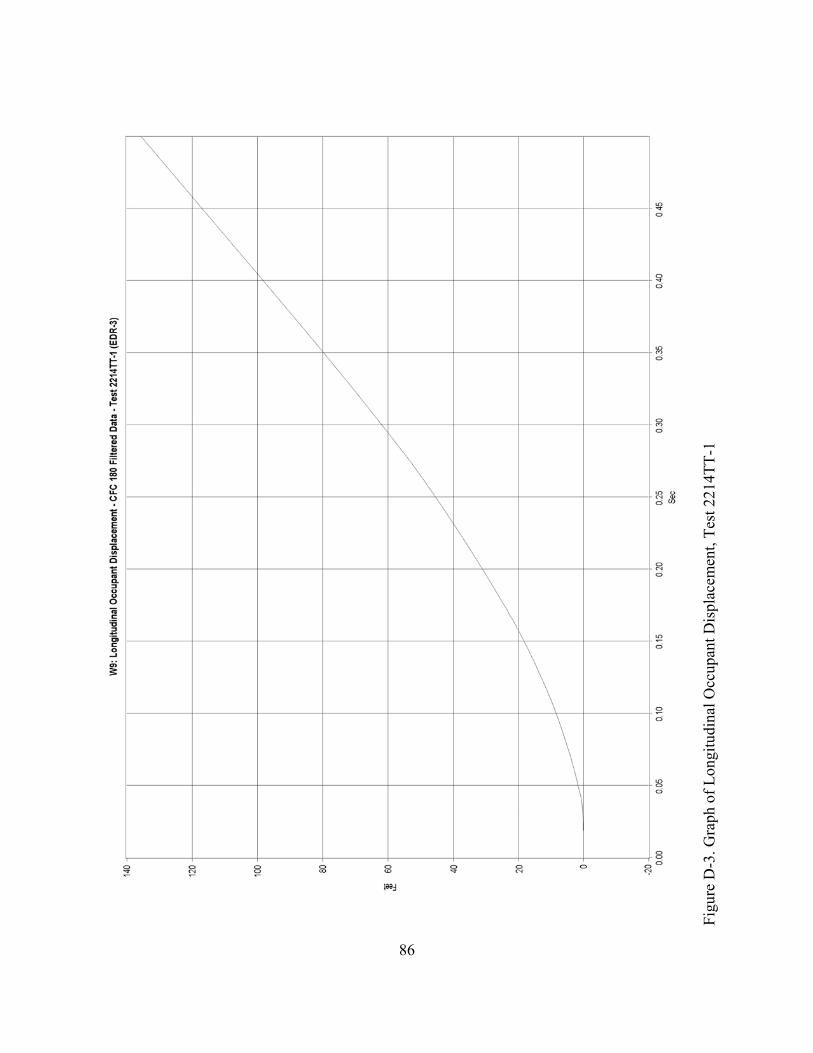
Figure D-3. Graph of Longitudinal Occupant Displacement, Test 2214TT-1
Figure D-4. Graph of Lateral Deceleration, Test 2214TT-1
Figure D-5. Graph of Lateral Occupant Impact Velocity, Test 2214TT-1
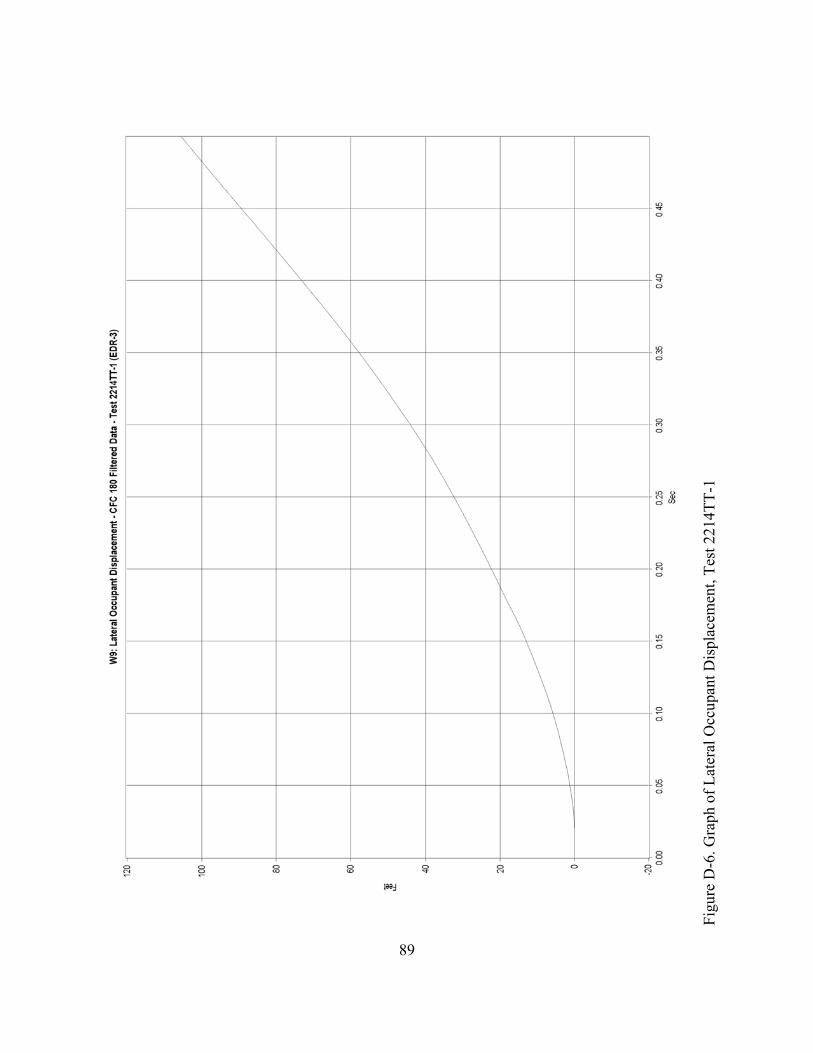
Figure D-6. Graph of Lateral Occupant Displacement, Test 2214TT-1
Figure D-7. Graph of Roll, Pitch, and Yaw Angular Displacements, Test 2214TT-1