. INTRODUCTIONynchrotron radiation (SR) has been widely applied as aowerful tool for research in the vacuum ultravioletVUV) and x-ray spectral regions. More recently it wasemonstrated that synchrotrons are bright and desirableources in the infrared (IR) spectral region as well.1 Thisas motivated the construction of several IR beamlinesor Fourier transform infrared spectroscopy and mi-rospectroscopy, the number of which has increased veryast in the last decade in parallel with the development ofhird-generation low-emittance light sources.2–4 The fourain advantages of IRSR, namely, broadband emission,
igh collimation, polarization, and pulsed structure, havellowed a new class of experiments with significant mul-idisciplinary impact. In fact, synchrotrons do not provideore total flux than the best laboratory IR sources, but
he highly collimated nature of the IRSR allows effectivellumination of very small areas. The significantly im-roved signal-to-noise ratio and/or reduced acquisitionime makes IRSR advantageous for diffraction-limited IRmaging and for absorption and reflectivity studies of mi-roscopic samples.
The pulsed structure of IRSR has opened the door toerforming pump-probe experiments, e.g., exploring thevolution of systems driven out of equilibrium or under-oing phase or configuration transitions. The applicationsf IRSR already had a strong impact in biology, chemistry,hysics, and many domains of material science. For chem-stry and biology, IR images with unprecedented resolu-ion have been obtained using the mid-IR �3–20 �m�ange. This spectral region spans most of the vibrationalrequencies representing the chemical “fingerprints” ofolecules, and has proven extremely valuable for deter-
ining the chemical composition of new materials andiological systems.5
In physics, IRSR spectroscopy and microspectroscopyave been successfully used to probe the low-energy exci-ations of solids such as phonons, superconducting gaps,nd polarons thanks to the superiority of IRSR in thear-IR range.2 Application of IRSR has also been shown toe of great interest to earth sciences for the study of theehavior of materials at very high pressures.6 Other ap-lications involve archaeometry,7 the history of art, indus-ry, forensics, etc.8
In the present paper we report pilot results with testamples demonstrating the performance of the firstranch of the IR beamline SISSI (Source for Imaging andpectroscopic Studies in the Infrared) completed and com-issioned at the end of 2005 at the synchrotron labora-
ory ELETTRA in Trieste, Italy. The results are a usefulasis for comparison with the performance of operatingeamlines at third-generation storage rings around theorld and provide the necessary information about thexpected advantages of carrying out experiments using IRadiation produced by the synchrotron source.
. DESCRIPTION OF THE BEAMLINEhe layout of the optical design of the SISSI infraredeamline at ELETTRA, described in detail in Ref. 9, ischematically shown in Fig. 1. The radiation extractedrom a bending magnet enters the first vacuum chamber,hich hosts the plane extraction mirror M1 and the ellip-
oidal mirror M2. M1 is placed at a distance of 3500 mmrom the source and collects the radiation from 65 mradn the horizontal and 25 mrad in the vertical plane. M2 is
007 Optical Society of America
prh1ptsMttdlbFowitmsas
tmbvvt1bwnccrc
3MTcbmqrat
bstc�vtu�s�c
cl
Ftf
960 J. Opt. Soc. Am. B/Vol. 24, No. 4 /April 2007 Lupi et al.
laced at a distance of 100 cm from M1 and focuses theadiation beyond the shielding wall of the synchrotronall to the intermediate focal point F1 at a distance of150 cm from the source. The second vacuum chamber,laced at a distance of 1450 cm from the source, hosts thehird M3 (plane) and fourth M4 (ellipsoidal) mirrors in aymmetric optical configuration with respect to M1 and2. This optical design minimizes the aberrations in the
ransfer optics due to the wide emission angle. M4 focuseshe IRSR on the chemical-vapor-deposited diamond win-ow (point F2 at 1550 cm from the source), which is theast ultrahigh-vacuum (UHV) component of the firstranch. The experimental station of the first branch (seeig. 1) consists of a Bruker IFS-66v Michelson interfer-meter coupled to a Hyperion-2000 infrared microscope,hich can work in the spectral region from far-IR to vis-
ble in both reflection and transmission modes. The sta-ion is equipped with a He cryostat and bolometer, whichakes the first branch very adequate for fundamental
tudies in the fields of solid-state physics and chemistrynd investigations of solid materials under high pres-ures.
A second branch was designed and built at a later stageo satisfy the demand for an experimental station opti-ized and fully dedicated to bioanalytical, biomedical,
iological, and environmental sciences. In order to pro-ide light for the second branch, we modified the lastacuum section of the beamline and installed an addi-ional retractable plane mirror (M5) after mirror M4 at500 cm from the source. This mirror deviates the IRSReam by 90° and focuses it on a wedged 20 mm diamondindow. UHV stops here, and IR radiation enters a dry-itrogen-purged Bruker VERTEX 70 interferometeroupled to a Hyperion-3000 infrared microscope. The mi-roscope is equipped with a 64�64 pixel focal-plane ar-ay. This branch line is still under commission, and itsharacteristics will be described elsewhere.
. SISSI AS A MID-IR SOURCE FORICROSPECTROSCOPY
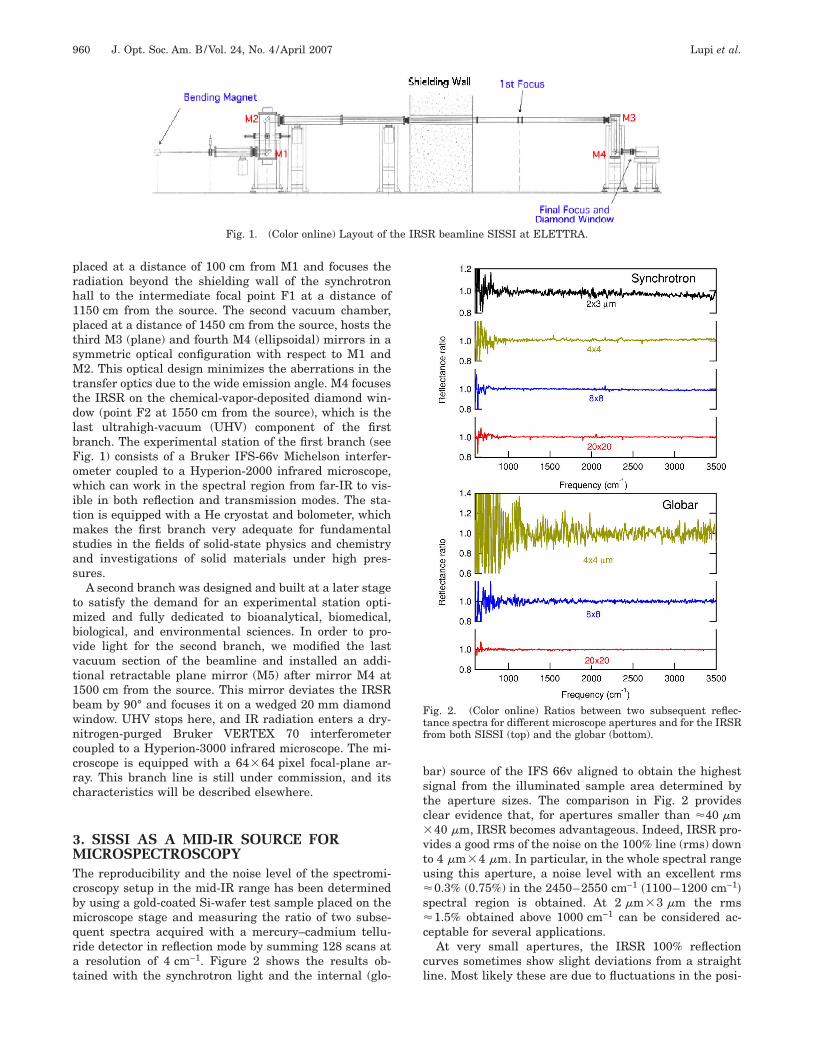
he reproducibility and the noise level of the spectromi-roscopy setup in the mid-IR range has been determinedy using a gold-coated Si-wafer test sample placed on theicroscope stage and measuring the ratio of two subse-
uent spectra acquired with a mercury–cadmium tellu-ide detector in reflection mode by summing 128 scans at
resolution of 4 cm−1. Figure 2 shows the results ob-ained with the synchrotron light and the internal (glo-
Fig. 1. (Color online) Layout of t
ar) source of the IFS 66v aligned to obtain the highestignal from the illuminated sample area determined byhe aperture sizes. The comparison in Fig. 2 provideslear evidence that, for apertures smaller than �40 �m40 �m, IRSR becomes advantageous. Indeed, IRSR pro-
ides a good rms of the noise on the 100% line (rms) downo 4 �m�4 �m. In particular, in the whole spectral rangesing this aperture, a noise level with an excellent rms0.3% (0.75%) in the 2450–2550 cm−1 �1100–1200 cm−1�
pectral region is obtained. At 2 �m�3 �m the rms1.5% obtained above 1000 cm−1 can be considered ac-
eptable for several applications.At very small apertures, the IRSR 100% reflection
urves sometimes show slight deviations from a straightine. Most likely these are due to fluctuations in the posi-
ig. 2. (Color online) Ratios between two subsequent reflec-ance spectra for different microscope apertures and for the IRSRrom both SISSI (top) and the globar (bottom).
R beamline SISSI at ELETTRA.
he IRS
teitm(potomitsst
cs1qsiaaaTt2pt
bdwtyg
iifi
4STbhsTcm(ses(tetggb
suteioTc
p3spr
Ff2ta
Ft1fma
Lupi et al. Vol. 24, No. 4 /April 2007 /J. Opt. Soc. Am. B 961
ion of the IRSR beam at the entrance of the interferom-ter, which may originate from (i) mechanical vibrations10
ntroduced by the pumping and the water-cooling sys-ems, (ii) drift in the beam position induced by the ther-al load of the magnetic and optical components,11 and
iii) intrinsic electron beam motion coming from the cou-ling between transverse and longitudinal synchrotronscillations.12,13 Our tests excluded vibrations induced byhe water cooling system of the first mirror M1. On thether hand, thermal loading of the magnetic ring ele-ents at ELETTRA is mainly determined by the electron
njection at low energy �0.9 GeV�, followed by ramping tohe working energy of 2 �2.4� GeV. The global feedbackystem, which will be operating in 2007, is expected totabilize the electron beam and may therefore reducehese problems.
In order to quantify the advantage of IRSR for micros-opy, we use a figure of merit I / rms, defined as the inten-ity collected by the detector divided by the RMS of the00% line of Fig. 2, between 1100 and 1200 cm−1. Thisuantity allows us to compare the brightness of the twoources weighted by their noise level, stability, etc. I / rmss plotted in Fig. 3 for each source and aperture settingfter being normalized to the value for the globar sourcet the smallest aperture. The advantage of the IRSR forpertures smaller than 10 �m is �4 orders of magnitude.he intensity continuously increases for increasing aper-ure, up to 50 �m�50 �m for the globar and up to0 �m�20 �m for the IRSR. These numbers are sup-osed to correspond to the beam size in the focal point ofhe microscope for both sources.
To confirm this assumption we analyzed the IRSReam profile using the microscope with a 15� beam con-enser and a 36� Cassegrain objective. A 10 �m pinholeas placed in the sample stage, and the transmitted in-
ensity was measured by scanning the pinhole in the x ordirection with 5 �m steps. The map obtained by inte-
rating the spectra between 600 and 8000 cm−1 is shown
ig. 3. (Color online) Ratio between the detected intensity I andhe root mean square rms of the 100% line in Fig. 2 (between100 and 1200 cm−1) for both the IRSR and the globar source andor different microscope apertures. The reported values are nor-
alized to the I / rms of the globar radiation through the smallestperture. The curves are just guides to the eye.
n Fig. 4. The whole intensity of the synchrotron beam isncluded in a circle about 20 �m in diameter, as expectedrom the results of Fig. 3. Note that the profile shape isnfluenced by the Gaussian optics of the microscope.
. SISSI AS A SOURCE FOR FAR-INFRAREDPECTROSCOPYhe properties of IRSR in the far-IR spectral range (i.e.,etween 100 and 600 cm−1) were investigated by using aelium-cooled silicon bolometer and a multilayer beamplitter. The IRSR emission from 100 cm−1 down to theHz and sub-THz range and its comparison with the mer-ury source will be discussed in a forthcoming paper. A re-otely controlled x-y stage with pinholes of different size
0.1, 0.3, 0.6, 1, 2 mm in diameter) was placed in theample compartment of the Bruker IFS-66v interferom-ter, kept at a pressure of 3 mbar. This allowed us to mea-ure the I / rms figure of merit for IRSR and the globarFig. 5), and to evaluate the effective size of the synchro-ron beam at each frequency. The rms of the 100% line isvaluated for both sources between 100 and 350 cm−1. Athe smallest aperture (i.e., 300 �m diameter) the IRSRain is more than two orders of magnitude with respect tolobar. By increasing the pinhole size the gain decreases,ut is still about 10 at 1 mm.In a first approximation, one may consider the inten-
ity of the globar in the proximity of the focus as spatiallyniform up to a cutoff radius that determines the size ofhe beam. Therefore the intensity is expected to scale lin-arly with the pinhole area, as demonstrated by the insetn Fig. 5. In the same figure it is shown that the intensityf IRSR also increases, but with a sublinear behavior.his stems from an intensity profile concentrated at theenter of the beam axis.
Spectral analysis of the IRSR emission was made in thelane perpendicular to the optical axis of the beamline. A00 �m pinhole was mounted on a motorized holder andcanned in steps of 150 �m. We show in Fig. 6 the far-IRrofile of the synchrotron beam measured along the x di-ection, corresponding to the horizontal plane of the emis-
ig. 4. (Color online) Beam profile at the microscope focal pointor synchrotron radiation at a beam current of 170 mA andGeV. The measurement was performed in transmission mode
hrough a 10 �m pinhole. Spectra were integrated between 600nd 8000 cm−1.
sat2
t5eg1ttmo
aw
5TtieSlassesapcm
Ftsdtfle
FatT4t
Fs7cu4lfTotr
962 J. Opt. Soc. Am. B/Vol. 24, No. 4 /April 2007 Lupi et al.
ion. At 450 cm−1 the beam size (shaded area) is �500 �mnd increases with decreasing frequency (as expected forhe increasing divergence of IRSR) to reach �1 mm at00 cm−1.The reduced dimensions of the beam imply that the in-
ensity through the 2 mm pinhole is higher by a factor ofthan in the case of the thermal source. For smaller ap-
rtures, this factor increases to about 10. However, suchain in brightness is calculated for a globar aperture of2 mm. If one reduces the aperture down to 1 or 2 mm, inhe case of the thermal source the intensity passinghrough the pinhole drops by a factor of 2 or 3. Thiseans that by making use of the collimated IRSR, not
nly is more intensity concentrated in a small area, but
ig. 6. (Color online) Spectrum of the IRSR emission as a func-ion of the distance from the beam center along the direction xhown in the inset. To perform the map, a 300 �m pinhole wasisplaced through the beam in steps of 150 �m. Both the dip inhe intensity at about 400 cm−1 and the peak around 200 cm−1 re-ect the transfer function of the experimental setup (interferom-ter, bolometer, and beam splitter).
ig. 5. (Color online) The ratio between the detected intensity Ind the rms of the 100% line (between 100 and 350 cm−1) for bothhe IRSR beam and the globar source and for different apertures.he inset shows the intensity I integrated between 100 and00 cm−1 for both radiations. The dotted curves are only guides tohe eye.
lso the stray light, which usually affects the experimentsith conventional sources, is reduced.
. TEST SAMPLEShe results reported in this section were obtained using
est samples selected to provide realistic and quantitativenformation about the potential of the SISSI beamline forxperiments in different fields. The first sample was ai3N4 wafer covered with gold film deposited through a
ithographic mask that left Au-free Si circles 7 �m in di-meter (see the top panel of Fig. 7). Series of spectra (64cans, resolution 8 cm−1) were recorded with the micro-cope along the line x marked in the figure using an ap-rture of 4 �m�4 �m and scan steps of 1 �m. The inten-ity of the dominating gold-covered regions I0 was used asreference to determine the reflectance IR /I0 at each x
osition. Since the reflectivity of the bare Si substrateircles is much lower than that of gold, a regular series ofinima and maxima in IR /I0 as a function of x is observed
ig. 7. (Color online) Mid-IR reflectance spectra of the gold filmhown in the figure (top panel), which includes areas (circles�m in diameter) of the bare Si3N4 substrate. The spectra were
ollected with a 1 �m step along the line marked in the top panelsing the motorized sample stage. The microscope aperture was�m�4 �m, the resolution 8 cm−1, and 64 scans were accumu-
ated using both the globar and the IRSR. Scans at three selectedrequencies for the globar (red) and the IRSR (blue) are shown.he minima in the reflectivity correspond to the circles. With thisptical setup, which has a numerical aperture of 0.5, the diffrac-ion limit is 2.7, 6.7, and 13 �m at the wavelengths in a, b, and c,espectively.
uFt(ttcftl
iq
scsiitl
acsbtt
aTsbs2sgba
ctcgwIcgstttpeahthton
Fct3aas
Ft
Lupi et al. Vol. 24, No. 4 /April 2007 /J. Opt. Soc. Am. B 963
sing IRSR at a wavelength of 4500 cm−1, as shown inig. 7a. The lower signal-to-noise ratio of the globar athis wavelength accounts for the much worse contrastblue curve). For increasing wavelengths (Figs. 7b and 7c)he performance of IRSR is still significantly better evenhough—because of diffraction effects—only the largeentral area of the sample can be distinguished. In fact,or the optical setup used with a numerical aperture 0.5,he diffraction limit is 2.7, 6.7, and 13 �m for the wave-engths in Figs. 7a, 7b, and 7c, respectively.
The lateral resolution of the SISSI setup in chemicalmaging was further tested with a piece of syntheticuartz containing an inclusion Fig. 8(a) that simulates a
ig. 8. (Color online) (a) Visible image of the inclusion as re-orded by the microscope camera. (b) Infrared map of liquid wa-er obtained by integrating the absorbance between 3000 and600 cm−1. (c) Infrared map of CO2 obtained by integrating the
−1
ituation often encountered in geological samples. Thehemical identification of such inclusions in rocks is of ba-ic importance for understanding their formation and alson the quest for mineral resources. Infrared spectroscopys the most rapid and efficient tool for such analysis, buthe spatial resolution required is often well beyond theimits of devices using conventional sources.
In Fig. 8(a) the inclusion has a triangular shape withn elongated tail on its left side. Within the triangle onean distinguish a round-shaped structure where the ab-orbance is dominated by a doublet at �2300 cm−1. Thisand is the fingerprint of gaseous CO2. Outside this struc-ure the 2300 cm−1 peak is replaced by a broad band be-ween 3000 and 3600 cm−1, a signature of liquid water.
We mapped the absorbance of a 40 �m�32 �m samplerea with a 2 �m step and an aperture of 3 �m�3 �m.he spectral resolution was 16 cm−1 and we acquired fourcans at each position. The lateral variations in the absor-ance integrated between 3000 and 3600 cm−1 corre-ponding to liquid water, and between 2250 and500 cm−1, corresponding to the trapped gaseous CO2, arehown in Figs. 8(b) and 8(c). One can clearly identify re-ions as small as 3 �m�3 �m, which reveal that theubble is formed of CO2, while water is present around itnd in the tail.We also tested the feasibility of high-resolution biologi-
al imaging by mapping subcellular structures in an in-act cell. Figure 9 shows IR images of a formalin fixed cellonstructed by raster scanning in reflection mode to-ether with the corresponding visible light image. Cellsere supported by an IR-reflecting slide. Contrast in the
R images is generated by mapping the absorption bandsharacteristic of amide (A) and methyl/methylene (B)roups throughout the sample. The visible image of theame cell (C) in reflection is also shown for comparison:he nucleus is clearly visible in the lower right of the cell,ogether with some other organelles. The distribution ofhe amide band corresponds to higher concentrations ofroteins in the cell, mostly within the cytoplasm and thendoplasmic reticulum. Some contribution from nucleiccids also occurs in this spectral region, giving rise toigher absorption in the region of the nucleolus. The dis-ribution of methylene groups corresponds to locations ofigh lipid concentrations. The latter are higher at posi-ions where the cytoplasmic membrane folds at the edgef the cell and lower within the nucleus, except where theucleolus is located.
bsorbance between 2250 and 2500 cm . The maps in b and c
re made up of 20�16 pixels obtained by mapping with a 2 �mtep.
ig. 9. (Color online) Images of a formalin fixed cell. (a) Distribution of amide band absorption between 1500 and 1700 cm−1. (b) Dis-ribution of methyl/methylene band absorption between 2800 and 3000 cm−1. (c) Visible light image.
6TbitTnpdwstmbnr
AWMsmaDCKnaEfigTBt
R
1
1
1
1
964 J. Opt. Soc. Am. B/Vol. 24, No. 4 /April 2007 Lupi et al.
. CONCLUSIONhe results reported here show the capabilities of the IReamline SISSI at ELETTRA to be successfully exploitedn microspectroscopy by achieving diffraction-limited spa-ial resolution in both the far-IR and the mid-IR region.he beamline is open to the international user commu-ity based on competitive proposals and offers two inde-endent measurement stations, optimized on the basis ofiverse multidisciplinary applications. The first branchill be dedicated to solid-state physics, high-pressure
tudies, chemistry, and geology. The second branch is in-ended to be fully equipped for IR spectromicroscopy,apping, and imaging studies with an emphasis on
ioanalytical, biological, and biomedical research. In theear future the necessary instrumentation for time-esolved and two-color experiments will be implemented.
CKNOWLEDGMENTSe thank Paul Dumas, Augusto Marcelli, Yves-Laurentathis, and Ulrich Schade for valuable suggestions and
timulating discussions during the construction and com-issioning of the beamline. The excellent engineering
nd technical support of the staff of ELETTRA, in particular. Bacescu, F. Barbo, E. Benfatto, F. Bille, V. Chenda, D.occo, A. Gambitta, B. Kaulich, G. Loda, D. Lonza, E.arantzoulis, F. Mazzolini, M. Pasqualetto, and M. Turci-ovich, is acknowledged. We are grateful to O. Burronend M. Campagna of the International Center for Geneticngineering and Biotechnology for providing formalinxed cells. We also thank F. Romanato for providing litho-raphically patterned test samples and R. Petrini and F.ecce for geological samples. Finally, we thank theRUKER-OPTICS staff and, in particular, D. Soli, for
echnical support.
EFERENCES1. M. D. Duncan and G. P. Williams, “Infrared synchrotron
radiation from electron storage rings,” Appl. Opt. 22,2914–2923 (1983).
2. See, for example, Infrared Synchrotron Radiation, P.Calvani and P. Roy, eds. (Compositori, 1998), andreferences therein.
3. Accelerator-Based Sources of Infrared and SpectroscopicApplications, Proc. SPIE 3775 (1999).
4. P. Dumas and M. Tobin, “A bright source for infraredmicrospectroscopy: synchrotron radiation,” SpectroscopyEurope 15, 17–23 (2003).
5. L. Miller and P. Dumas, “The use of synchrotron infraredmicrospectroscopy in biological and biomedicalinvestigations,” Vib. Spectrosc. 32, 3–21 (2003).
6. A. E. Goncharov, F. Gregoryanz, H. K. Mao, Z. X. Liu, andR. J. Hemley, “Optical evidence for a nonmolecular phase ofnitrogen above 150 GPa,” Phys. Rev. Lett. 85, 1262–1265(2000).
7. N. Salvado, S. But, M. J. Tobin, E. Pantos, A. J. N. W. Prag,and T. Pradell, “Advantages of the use of SR–FT–IRmicrospectroscopy; applications to cultural heritage,” Anal.Chem. 77, 3444–3457 (2005).
8. A. Grant, T. J. Wilkinson, D. R. Holman, M. C. Martin,“Identification of recently handled materials by analysis oflatent human fingerprints using infrared spectroscopy,”Appl. Spectrosc. 59, 1182–1187 (2005).
9. A. Nucara, S. Lupi, and P. Calvani, “The infraredsynchrotron radiation beamline at the third-generationlight source ELETTRA,” Rev. Sci. Instrum. 74, 3934–3942(2003).
0. J. M. Byrd, M. C. Martin, and W. R. McKinney, in“Observing beam motion using infrared interferometry,”Proceedings of Particle Accelerator Conference, A. Luccioand W. MacKay, eds. (IEEE, 1999), pp. 495–497.
1. E. Karantzoulis, Sincrotrone Trieste, 34102 Trieste, Italy,(personal communication, 2006).
2. J. M. Byrd, “Effects of phase noise in heavily beam loadedstorage rings,” in Proceedings of Particle AcceleratorConference, A. Luccio and W. MacKay, eds. (IEEE, 1999),pp. 1806–1809.
3. J. M. Byrd, M. Chin, M. C. Martin, W. R. McKinney, and R.Miller, Proc. SPIE 3775, 58–64 (1999).