AUSTRALIAN AGENCY FOR INTERNATIONAL DEVELOPMENT Project Completion Report September 2010 GHD PTY LTD PERSISTENT ORGANIC POLLUTANTS (POPs) IN PACIFIC ISLAND COUNTRIES PHASE II In association with HATLAR ENVIRONMENTAL PTY LTD HK SHIPPING INTERNATIONAL PTY LIMITED BCD TECHNOLOGIES PTY LTD PM016
Transcript
AUSTRALIAN AGENCY FOR INTERNATIONAL DEVELOPMENT
Project Completion Report
September 2010
GHD PTY LTD
PERSISTENT ORGANIC POLLUTANTS (POPs) IN PACIFIC ISLAND COUNTRIES PHASE II
In association withHATLAR ENVIRONMENTAL PTY LTD
HK SHIPPING INTERNATIONAL PTY LIMITEDBCD TECHNOLOGIES PTY LTD
PM016
PERSISTENT ORGANIC POLLUTANTS (POPs) IN PACIFIC ISLAND COUNTRIES (PICs) PHASE II PROJECT1
SCHEDULED POPs AND INTRACTABLE PESTICIDES DISPOSAL
DOCUMENT CONTROL – HISTORY AND STATUS
Client: Australian Agency for International Development
Project No.: 7010348
Document Title: Completion Report
Document Reference No.: PM 016
Document Version: Rev 1
Project Manager: Alison Baker
Document Issue to: AusAID (1) Electronically
Amendment Record Sheet
Amendment Record Sheet (AS/NZS ISO 9001 4.5)
Page/para/ line
Revision No.
Description of Revision Approved by
Issue date
0 Draft issued to AusAID Alison Baker 13 October 2008
All 1 Final issued to AusAID Alison Baker 27 September 2010
1 Implementation of Components 2, 3 and 4 of POPs in PICs Project Phase II only.
POPs in PICs Phase II Project Project Completion Report
TABLE OF CONTENTS
GENERAL INFORMATION ______________________________________________ III
CERTIFICATION ______________________________________________________ IV
BASIC ACTIVITY DATA__________________________________________________ V
EXECUTIVE SUMMARY ________________________________________________ IX
POPs in PICs Phase II Project Project Completion Report
G:\70\10348\WP\Reports\Proj Mgmt Reports (PM)\PM016\Project Completion Report_final.doc 28/09/2010 iii
GENERAL INFORMATION
Acronyms and Abbreviations
AMC Australian Managing Contractor
AQIS Australian Quarantine Inspection Service (a division of DAFF)
AusAID Australian Agency for International Development
DAFF Department of Agriculture, Fisheries and Forestry
DDT Dichloro Diphenyl Trichloroethane
DEWHA Department of the Environment, Water, Heritage and the Arts (formerly the Department of the Environment and Water Resources)
EPBC Act Environment Protection and Biodiversity Conservation Act 1999
FoA Form of Aid
FSM Federated States of Micronesia
GEF Global Environment Facility
GEF PAS Global Environment Facility - Pacific Alliance for Sustainability
GoA Government of Australia
MoU Memoranda of Understanding
NGO Non Government Organisation
NIP National Implementation Plan
OH&S Occupational Health and Safety
PCBs Polychlorinated biphenyls
PCC Project Coordination Committee
PDD Project Design Document
PICs Pacific Island Countries
PM Project Manager
PNG Papua New Guinea
POPs Persistent Organic Pollutants
ppm parts per million
QEPA Queensland Environmental Protection Agency
RMP Risk Management Plan
SAICM Strategic Approach to International Chemicals Management
SIDs Small Island Development States
SPREP Secretariat of the Pacific Regional Environment Programme (PROE – Programme Régional Océanien de l'Environnement)
UNEP United Nations Environment Programme
UNDP United Nations Development Programme
POPs in PICs Phase II Project Project Completion Report
G:\70\10348\WP\Reports\Proj Mgmt Reports (PM)\PM016\Project Completion Report_final.doc 28/09/2010 iv
Glossary
Basel Convention
The Basel Convention on the Control of Transboundary Movements of Hazardous Waste and their Disposal, 1989, is a global treaty with an objective to minimise, with the aim of eliminating, the generation and transboundary movement of hazardous waste.
CabWater CabWater is a division of the Caboolture Shire Council (now Moreton Bay Regional Council), responsible for managing trade waste from Narangba Industrial Estate, Queensland.
Dioxin and Furans
Dioxins and furans are common terms to denote polychlorinated dibenzodioxins (PCDDs) and polychlorinated dibenzofurans (PCDFs). Dioxins and furans occur together as by-products from incineration at temperatures below 1200°C of chlorine containing products. They can also occur as by-products in the manufacture of organochlorides, in the bleaching of paper, and from natural sources such as volcanoes and forest fires. Both dioxins and furans are highly toxic and are scheduled under the Stockholm Convention.
DEWHA Federal Australian government department responsible for environment and heritage management, including Australia’s responsibilities under the Basel and Waigani Convention and administration and regulation of the EPBC Act.
Intractable pesticides
For the purposes of this Project, intractable pesticides are “pesticides that cannot be safely disposed of in the Pacific” (AusAID, 2002). Note, only stockpiled intractable pesticides that met the acceptance requirements of the nominated destruction facility (BCD) in Australia were included in the Project.
Persistent Organic Pollutants (POPs)
POPs are synthetic organic chemicals, which are toxic, persistent and bio-accumulative, with potential to cause adverse effects to human health and the environment. Exposure to POPs can lead to serious health effects including cancers, birth defects, dysfunctional immune and reproductive systems and greater susceptibility to disease.
Scheduled POPs
Scheduled POPs are the 12 POPs annexed in the Stockholm Convention. They include: aldrin, chlordane, DDT, dieldrin, endrin, heptachlor, mirex , toxaphene, HCBs, PCBs, dioxins and furans.
Stockholm Convention
The Stockholm Convention on POPs is an international legally binding agreement, which entered into force in May 2004. It’s objective is to protect human health and the environment from POPs. 172 countries, including Australia, were party to the Convention as of August 2010.
Waigani Convention
The Waigani Convention to Ban the Importation into Forum Countries of Hazardous and Radioactive Wastes and to Control the Transboundary Movements and Management of Hazardous Wastes within the South Pacific Region, 1995, is an international legally binding agreement that aims to stop the import of hazardous and radioactive waste into the South Pacific region, minimise production within the region and ensure the environmentally sound management and disposal of already existing waste.
CERTIFICATION
This Completion Report has been completed in accordance with relevant guidelines, in this case, AusGuideline 5.1, Preparing Completion Reports for AusAID – Interim Guidelines, as amended 2008.
POPs in PICs Phase II Project Project Completion Report
G:\70\10348\WP\Reports\Proj Mgmt Reports (PM)\PM016\Project Completion Report_final.doc 28/09/2010 v
BASIC ACTIVITY DATA
Activity Name
The activity name is the Persistent Organic Pollutants (POPs) in Pacific Island Countries (PICs), Phase II – Scheduled POPs and Intractable Pesticide Disposal Project (herein referred to as the Project).
The Project was supported by the Persistent Organic Pollutants Project Phase II Communication Strategy Implementation (herein referred to as the Communication Strategy).
Activity Location
The Project was undertaken in the Pacific Region and included 13 Pacific Island Countries (PICs): Cook Islands, Federated States of Micronesia, Fiji, Kiribati, Marshall Islands, Nauru, Niue, Palau2, Samoa, Solomon Islands, Tonga, Tuvalu and Vanuatu (see Figure 1).
With the exception of Papua New Guinea, these 13 PICs represent all the independent island states that are members to the Secretariat of the Pacific Regional Environment Programme (SPREP).
Implementation Arrangements
The Project implementation was divided into four components:
Component 1 – In-country identification and confirmation of POPs for removal, in-country facilitation and overall quality assurance;
Component 2 – POPs reconnaissance, collection, packaging and shipping to disposal facility;
Component 3 – POPs destruction; and
Component 4 – Project and contract management.
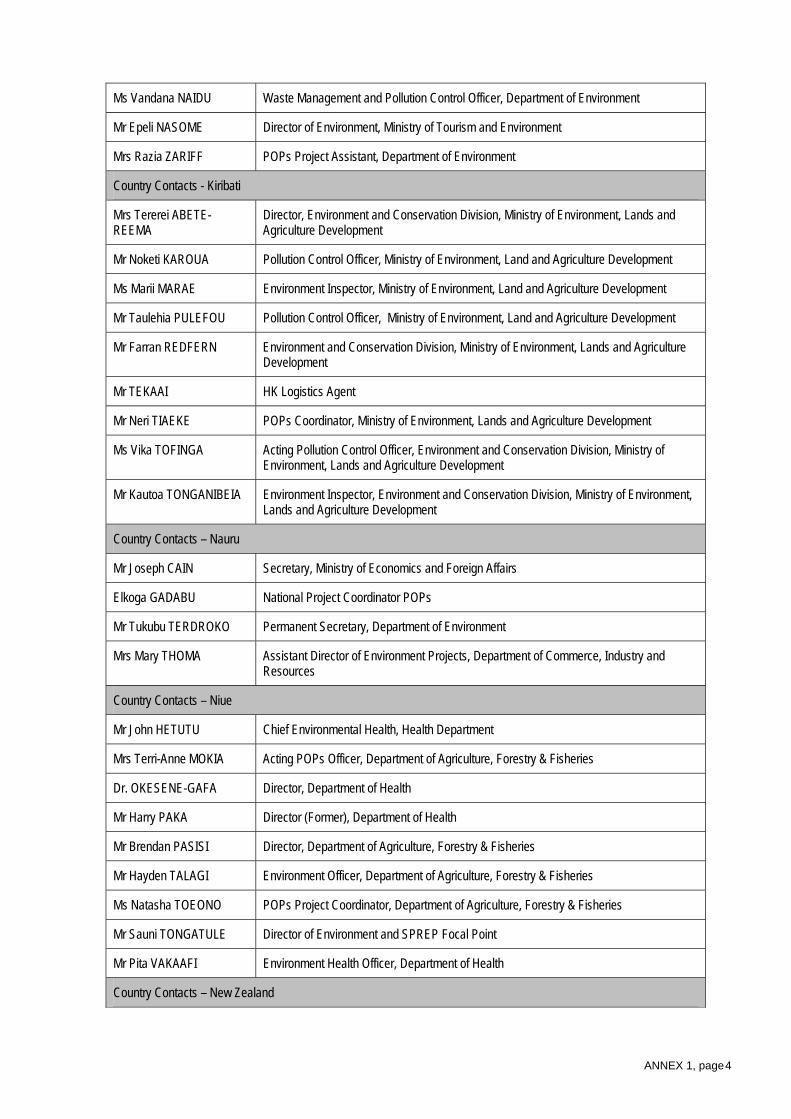
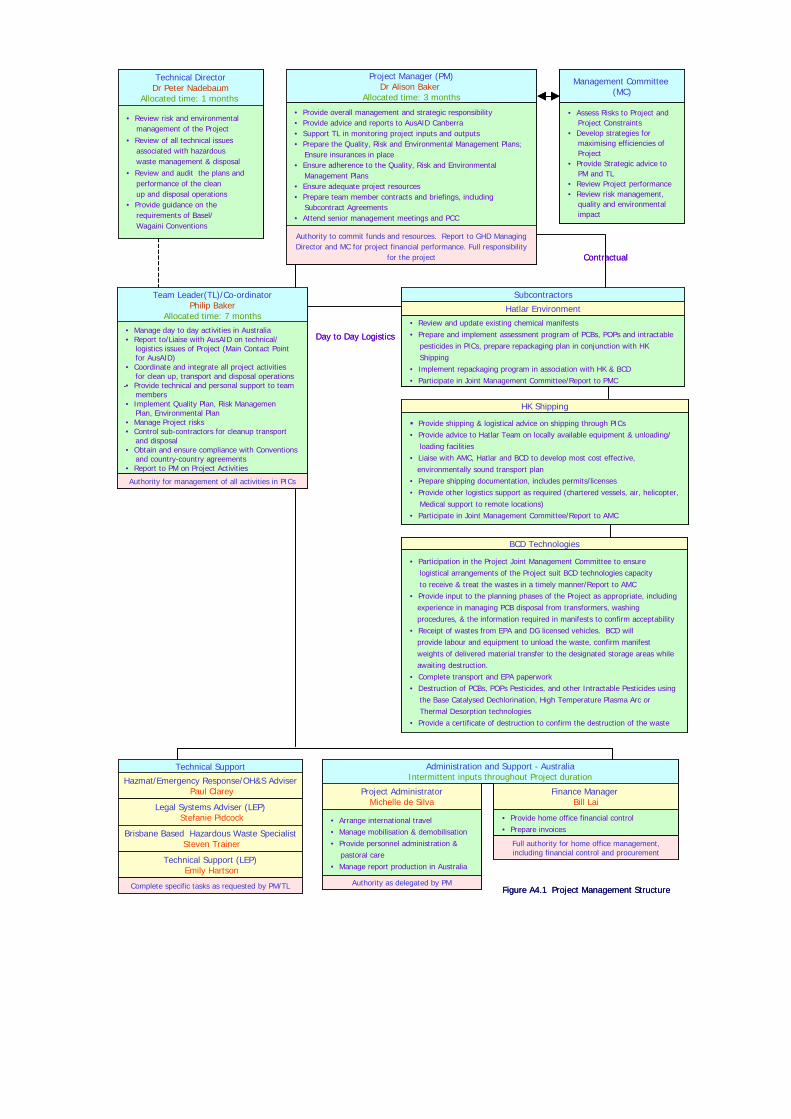
SPREP was responsible for implementation of Component 1. GHD Pty Ltd (GHD) as the Australian Managing Contractor (AMC) was responsible for the implementation of Components 2, 3 and 4. A list of roles, responsibilities and contacts for key AMC personnel is provided in Annex 1. GHD partnered with the Hatlar Group who provided POPs cleanup specialists; HK Logistics Pty Ltd who provided logistical support and BCD Technologies, operator of the POPs destruction facility.
A Joint Management Committee (JMC) comprising GHD and the aforementioned partner companies provided overall guidance throughout the Project delivery. A Project Coordinating Committee (PCC) included representatives from GHD, SPREP, AusAID, at least two PIC government agencies (rotating position between member PICs), and the Australian Department of Environment, Water, Heritage and Arts (DEWHA). See Section 3.2.5 for further information on the JMC and PCC.
2 At the time of the Project, Palau had not ratified Waigani or Basel conventions, and consequently was omitted from the Phase II scope due to barriers to international shipping approval for hazardous waste without the mechanisms of these Conventions. This report therefore refers to 12 PICs herein.
POPs in PICs Phase II Project Project Completion Report
Figure 1 Map of Activity Area
G:\70\10348\WP\Reports\Proj Mgmt Reports (PM)\PM016\Project Completion Report_final.doc 28/09/2010 vi
POPs in PICs Phase II Project Project Completion Report
Key Dates
The Project was undertaken between April 2003 and June 2009 over a period of 75 months. The Project key activities are listed in Table 1. A detailed Project chronology is presented in Annex 2. Table 1 Key Project Activities
Date Activity
April 2003 Project awarded to GHD and contracts finalised
August 2003 Project Procedures Manual, including Emergency Response Plan, Risk Management Plan and Field Operating Procedures submitted to AusAID
August 2003 Team mobilised to Samoa, Fiji, Vanuatu and Cook Islands to complete reconnaissance visits
September 2003 Team mobilised to Marshall Islands, Palau, FSM to complete reconnaissance visits
October 2003 Team mobilised to Kiribati, Nauru, Niue, Tonga, Tuvalu and Fiji to complete reconnaissance visits
February 2004 First PCC meeting held in Port Vila, Vanuatu
June 2004 to March 2006
Cleanup and repackaging of POPs and intractable waste - refer to Annex 2 for specific cleanup and repackaging dates
December 2004 to February 2009
Transhipment of POPs from PICs to Australia and transport to BCD Destruction Facility - refer to Annex 2 for specific shipment dates
March 2005 Second PCC meeting held in Wellington, New Zealand
June 2005 to May 2009
Destruction of all POPs shipped to Australia under the Project – refer to Annex 2 for specific destruction dates
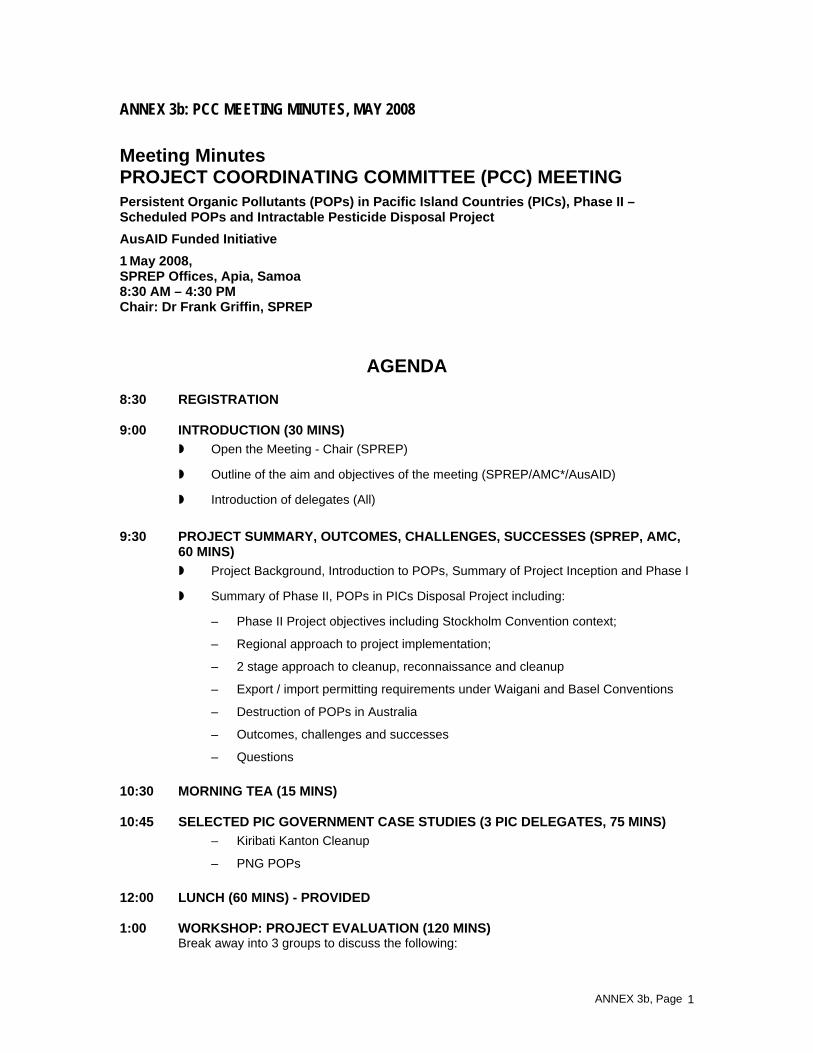
May 2008 Final PCC meeting held in Apia, Samoa
Approved and Actual Cost of the Project
A summary of actual costs of the Project in Australian Dollars (AUD) is provided in Table 2, outlining expenditure by year and type. Project costs are discussed in Section 4.
TOTAL 103,307 921,184 1,475,793 1,748,554 1,147,414 485,665 686,614 6,568,530
Note: Some additional shipping, clean up and destruction costs were incurred as part of the Management and Milestone expenditure item.
G:\70\10348\WP\Reports\Proj Mgmt Reports (PM)\PM016\Project Completion Report_final.doc 28/09/2010 vii
POPs in PICs Phase II Project Project Completion Report
G:\70\10348\WP\Reports\Proj Mgmt Reports (PM)\PM016\Project Completion Report_final.doc 28/09/2010 viii
Form of Aid
The Project was delivered under the aid modality of project support. The assistance was aligned with regional priorities for the management of hazardous waste. It also complemented the international policy framework of the Stockholm Convention, which entered into force during the life of the Project.
The Project was delivered under a commercial contract by Australian Managing Contractor, GHD, in partnership with SPREP, a regional intergovernmental organisation. GHD had primary responsibility and accountability for managing the delivery of Australian Government resources.
The financing arrangement involved a monthly management fee paid to GHD, as well as milestone payments through the course of the Project. Funds were provided directly by AusAID to SPREP, for reimbursement of travel expenses. No financial commitment was required from or provided to participating PICs. MoUs were agreed between GoA and each PIC as part of the Project.
POPs in PICs Phase II Project Project Completion Report
EXECUTIVE SUMMARY
The Persistent Organic Pollutants in Pacific Island Countries (POPs in PICs), Phase II – Scheduled POPs and Intractable Pesticide Disposal Project was a seven-year project to reduce the threat posed by POPs and related chemicals toward the environment and human health in Pacific Island Countries. The Project was undertaken in the Pacific Region and included 12 PICs. The Project commenced in April 2003 and was completed in June 2009, at a total cost of AUD 6.57 Mil, funded by AusAID. The Project was delivered under the aid modality of ‘project support’, by Australian Managing Contractor, GHD, in partnership with the Secretariat of the Pacific Regional Environment Programme (SPREP).
The Project goal addressed country, regional and international priority issues, and is in alignment with the highest priority waste management issues in the Pacific as identified by SPREP member countries in the Waste Management Action Plan 1997-2000, and the objective of the Stockholm Convention. The mechanisms of the Basel or Waigani Convention were utilised for approvals to import the repackaged waste POPs into Australia for destruction.
A total of 124 tonnes of POPs and related chemicals were collected from 11 PICs, this included all reported POPs and related chemicals accessible to the team. All collected POPs were destroyed in an environmentally sound manner, providing a highly effective reduction of the threat of these toxic chemicals to human health and the environment.
The Project has been acknowledged for contributing towards PIC government capacity to manage hazardous chemicals, develop chemical manifests (required for completion of National Implementation Plans), and manage obligations and transhipment approvals under the Basel or Waigani Conventions, along with contributing towards raising the awareness in the community of the harmful effects of POPs and related chemicals, through conducting press conferences and media interviews with PIC environment staff. Secondary impacts included poverty reduction and economic growth through contributions to improved environmental quality and human health and promoting partnerships through the implementing provisions of Multilateral Environmental Agreements.
With a total Project cost of AUD 6.57 Mil and 124 tonnes of POPs destroyed, the approximate unit cost following final POPs destruction was AUD 53 per kilogram. Considering the challenges associated with the Project, this unit cost is considered cost-efficient, and includes management, collection, repackaging, approval, shipping and destruction of POPs from all participating PICs. Cost efficiencies were achieved through a regional approach to implementation, effective planning and communication, practical cleanup solutions, clearly defined scope and alignment with complementing programmes and initiatives. Areas for efficiency improvements include reducing the project duration and reducing container demurrage costs.
Lessons learned from the Project included: flexibility in the schedule was an integral component of the management of project risks; the initial reconnaissance was essential for cleanup planning (recognizing that relationships and increased awareness established during the reconnaissance contributed significantly to the success of the Project); the volume of stockpiled POPs and intractable waste increased over the duration of the Project as awareness of the collection activities was communicated via local media and through government channels; and effective communication with stakeholders provided significant project efficiencies.
The Project made a significant contribution to ridding the participating PICs of scheduled POPs and intractable pesticides, improving the environment through the reduction of the source of POPs contamination.
G:\70\10348\WP\Reports\Proj Mgmt Reports (PM)\PM016\Project Completion Report_final.doc 28/09/2010 Page ix
POPs in PICs Phase II Project Project Completion Report
This Completion Report aims to review the Project preparation, delivery and achievements in regard to effectiveness, efficiency, impact and sustainability, relevance and lessons learned. This Report has been prepared by GHD with contribution from AusAID, SPREP and representatives from PIC governments who participated in the Project.
1.1 REQUEST
The Project was developed as an AusAID initiative aimed at improving chemicals management in the Pacific region, initiated in cooperation with SPREP in 1997 (SPREP, 2000). Recognising the increasing significance of waste management throughout the region, AusAID undertook a pre-feasibility study of potential waste management projects in the region identifying thirteen areas within which assistance was needed (AusAID, 1997). The management of waste chemicals was identified as the highest priority waste management issue. This priority was mirrored in SPREP’s Action Plan 1997-2000 (SPREP, 1997) and in the Solid Waste Management Strategy (SPREP, 1996), as a priority issue for member PICs.
Based on this identified need, AusAID developed the POPs in PICs initiative, targeted at waste chemicals. Particular attention was given to POPs, which could not be managed effectively by the PICs, due to the absence of appropriate disposal or treatment facilities in the region.
The initiative was implemented in two phases. Phase I was implemented by SPREP between 1997 and 2000 and included development of an inventory of ‘all hazardous or potentially hazardous chemicals3 in the thirteen PICs and a discussion of chemicals management options (Burns et al, 2000). Phase II (the subject of this report) was developed from the findings of Phase I, with a specific focus on scheduled POPs and intractable pesticides.
1.2 PROGRAMME CONTEXT AND RATIONALE
Historically, POPs were imported to the Pacific region as part of development assistance packages, to eradicate pests and increase agricultural productivity. DDT was used to eradicate vector-born disease and to protect human health by preventing malaria. PCB-contaminated oils entered PICs through electrical transformers and capacitors, used to support light industries and power generation. Many imported POP pesticides, were never used, and the use of others was phased out, as the health and environmental impacts of these pesticides was understood. This led to significant stores of waste POPs and intractable pesticides throughout the Pacific, and in several cases burial or burning of pesticides stocks.
POPs are toxic organic compounds that resist biodegradation. As POPs are persistent and insoluble in water, but soluble in fatty tissue, they travel long distances and bioaccumulate in the food chain. They accumulate in the body fat of humans and animals and can be passed down to younger generations through breast-feeding and during pregnancy. POPs are endocrine disruptors and exposure to POPs can result in nervous system damage with impacts on learning and intelligence, liver damage and some cancers (Ritter et al, 1995).
All PICs in the Project are Small Island Developing States (SIDS), lacking the specialised resources (technology, power requirements, finance, etc.) needed for treatment and disposal of persistent and toxic chemicals. A further constraint is the low-lying and highly porous geology of many Pacific Islands atolls and as a consequence there is limited potential for establishment of safe underground waste 3 During Phase I the term POPs was interpreted broadly and considered more than those chemicals internationally defined as POPs. Consequently, the scope of Phase I included pesticides, PCBs, industrial chemicals, medical wastes, laboratory chemicals, oil, bitumen, timber treatment chemicals and fertilisers.
POPs in PICs Phase II Project Project Completion Report
disposal facilities. Lack of awareness of the hazardous nature of some chemicals has exacerbated the problem of unsafe and unsecured storage. Further compounding these issues is that the SIDS rely heavily on traditional food sources and therefore on the quality of their environment for survival. Local industries such as fishing, agriculture, pearl industries and tourism depend on an unpolluted environment. In this context, the removal of POPs is important to the livelihoods and health of people in the Pacific Islands.
A particular strength of the PICs is that there is strong recognition of the importance of a healthy environment. The PICs customarily recognise the link between the health of their environment and the wellbeing of their communities. Therefore the PICs responded very positively towards the implementation of this Project.
Internationally and regionally, the Project is part of broad efforts to appropriately manage hazardous waste. Legally-binding international instruments such as the Stockholm, Waigani, Basel and Rotterdam Conventions have mobilised countries to adopt appropriate waste management measures. In 2004, the Stockholm Convention came into force. To meet their requirements under this Convention, PICs began developing National Implementation Plans (NIPs). Further, since 2006, PICs also began addressing chemicals more broadly through the adoption of the Strategic Approach to International Chemicals Management (SAICM). The Project was complementary to these activities. Regionally SPREP provides hazardous waste management assistance to its member countries through the Pacific Futures programme and specifically the Waste Management and Pollution Control focus area. SPREP worked in partnership with the AMC in the implementation of the Project. The Regional Solid Waste Action Plan is the strategy tool under which all waste (including hazardous) is prioritised and managed by SPREP.
1.2.1 Project Design Document
Development of the Project Design Document (PDD) was the primary Project preparation arrangement. It was developed by AusAID based on the findings and recommendations from Phase I and in consultation with SPREP, and consideration for alignment and harmonisation with other regional programmes. AusAID also consulted Australian stakeholders, as outlined in Section 2.
1.2.2 Alternatives Considered
AusAID considered several alternative options in the Project design process, including high-temperature incineration POPs destruction options. However incineration was rejected as a disposal method as POPs incineration can produce hazardous by-products, including dioxins and furans through incomplete combustion. Constructing a mobile BCD treatment system or facility within the Pacific was also considered. This was concluded to be unfeasible due to prohibitive capital cost, and unsafe in the absence of necessary reliable high-voltage power sources and infrastructure in the Pacific. AusAID concluded that BCD Technologies was the only facility in the Pacific region that could destroy POPs in an environmentally sound manner, using environmental best practice.
1.2.3 Environment Protection and Biodiversity Conservation Act Referral
The Environment Protection and Biodiversity Conservation (EPBC) Act, 1999, is the Australian Government’s central piece of environmental legislation. It provides a legal framework to protect and manage nationally and internationally important flora, fauna, ecological communities and heritage places; defined in the Act as matters of national environmental significance.
The Project was determined under the EPBC Act as a matter of national environmental significance4. This was the first time an AusAID Project had triggered the requirements of the Act. As part of the
4 Under Australian Commonwealth legislation, any AusAID project which AusAID or the Minister for Environment considers environmentally significant must meet the requirements of Subdivision A, Division 4, Part 11, Chapter 4 of the EPBC Act.
POPs in PICs Phase II Project Project Completion Report
process for approvals the PDD was released for public comment on 30 November 2002. Twenty-two public submissions were received and addressed.
A Project Environmental Assessment (AusAID, 2003) was undertaken as part of the approvals process, assessing the potential for adverse environmental impacts. The report concluded:
“While the project does potentially carry the risk of significant environmental damage in a worst case scenario, the risks are well understood and can be minimised through standard internationally recognised procedures, and emergency response plans can be developed to minimise impacts from any accidents. This low level of potential environmental risk needs to be balanced against the certain damage to the environment that is currently occurring through the way this material is presently stored.”
The report recommended that AusAID proceed to undertake the project as documented in the PDD with additional precautions listed in the report. These precautions were incorporated into the PDD.
1.2.4 Memoranda of Understanding
Memoranda of Understanding (MoU) between the Government of Australia (GoA) and PIC governments were agreed during the initial stages of the Project. The MoU outlined the responsibilities and contributions of each Government under the Project, defined PIC executing authorities, and provided the legal basis of cooperation between the PICs and the GoA. Delays in the signing of some of the MoU resulted in revision and amendment to the cleanup and repackaging planning and coordination (GHD, 2005a).
2. PROJECT DESCRIPTION
The Project design centred on an outcomes-driven approach, with the outcomes being: collection, shipping and destruction of the stockpiled POPs and intractable pesticides identified in Phase I of the initiative, in order to improve the health and environment of the PIC communities. The overall goal of the Project was to:
“reduce the threat posed by Persistent Organic Pollutants and related chemicals toward the environment and human health in PICs”.
The purpose of the Project was to:
“dispose of Polychlorinated biphenyls (PCBs), and PCB-contaminated wash-liquid from transformers, small quantities of PCB-contaminated soil, stockpiled organochlorine pesticides including scheduled POPs and other intractable pesticides (mainly organochlorines and organophosphates), and small amounts of unidentified pesticides considered likely to fall into those categories in participating PICs”.
Key components of the Project included:
Stakeholder Consultation: Importing hazardous waste from overseas was identified early in the Project preparation as a potentially contentious activity. A Communication Strategy was developed and implemented as part of the preparation and implementation arrangements. The Communication Strategy focused on early identification and resolution of concerns and potential issues, transparent and regular dissemination of information, attendance of Project personal at community meetings, and open dialogue with key stakeholders.
The Communication Strategy facilitated support for the Project from a broad range of stakeholders, some of whom were initially adverse to the Project. Several high profile environmental activists, including representatives of the International POPs Elimination Network (IPEN) became supporters of the Project and have continued to promote the Project in international forums. Endorsement was received from the Narangba Community Action Group, the Maritime Union of Australia (MUA), and from conservation non-governmental organisations (NGOs) with an interest in chemicals
management. At the request of Australian stakeholders, the nominated POPs destruction facility agreed to an independent emissions monitoring program during the destruction of Project wastes.
The positive and cooperative foundations laid with all stakeholders through the Communication Strategy were maintained throughout the Project and played a significant role in effective Project implementation.
Scope of POPs and Intractable Pesticides Collected: The Project scope was clearly defined to include: 1) the 12 scheduled POPs defined under the Stockholm Convention: aldrin, chlordane, dieldrin, endrin, heptachlor, hexachlorobenzene, mirex, toxaphene, PCBs, DDT, dioxins and furans; and 2) intractable pesticides defined by AusAID to include a wide family of chemicals used in pest, weed and insect control. All intractable pesticides were required to be compliant with BCD Technologies destruction operation licence specification. The scope did not include buried chemicals or residual contamination. The primary reason for focusing on these wastes was that other types of waste require different disposal methods, likely to involve incineration, in different locations, and approvals for an extended scope were likely to significantly delay the Project’s implementation.
Compliance with governing laws and guidelines: The need to understand and adhere to international, Australian (Federal), and State (Queensland) laws was fundamental to the Project. The Project maintained compliance with conventions, legislation, subordinate regulations, guidelines and codes across multiple jurisdictions.
Management of Risk: The Project included features to minimise risk, including: 1) obtaining approvals in advance; 2) developing detailed procedures and specifications for cleanup, shipping, and destruction; and 3) maintaining transparency with all project stakeholders, and strong communication between the Project partners (discussed further in Section 3.2).
Reconnaissance: Initial reconnaissance trips to each PIC were a critical aspect of the Project. During the reconnaissance trips the following tasks were undertaken: 1) POPs storage sites were inspected, contents and volumes of all chemicals confirmed and field testing or sampling was undertaken as required5; 2) logistical requirements such as shipping container and other equipment requirements and the adequacy of the port facilities were assessed to allow for successful clean up missions; 3) meetings were held with country officials to discuss requirements relating to the repackaging and shipment of wastes under the Waigani and/or Basel Conventions and related approvals processes; and 4) extensive discussions with relevant PIC authorities and NGOs relating to chemicals management and the hazardous waste transport approvals processes were undertaken.
Cleanup: The approach to cleanup was based on ‘low-tech’ principles, appropriate in the Pacific context. Cleanup and repackaging of POPs was undertaken manually, by hazardous waste specialists in suitable personal protective equipment. Chemicals were repackaged into 205L United Nations certified drums with plastic liners. PCB-contaminated oils from electrical transformers were repackaged into certified drums, and the drained transformer casings were packaged for transportation. All drums and transformer casings were labelled for shipping and documented on a detailed manifest.
Additional Chemicals: In some PICs, additional chemicals were identified (not previously identified in Phase I), as public awareness about POPs increased and additional stockpile sites were reported. An assessment of newly identified chemicals was completed to the extent practicable in each case and the additional POPs were included or excluded based on this assessment and AusAID’s approval.
5 If the composition of chemicals was unclear, samples were collected and sent to Australia for analysis. It was not possible to move hazardous wastes under the Basel or Waigani Conventions unless the chemical composition was known.
POPs in PICs Phase II Project Project Completion Report
Import Approval: Once POPs were securely repackaged in each PIC, import permits were sought from DEWHA under the Waigani or Basel Convention process. Permits were also sought from Australia’s Federal Department of Agriculture, Fisheries and Forestry (DAFF), the Australian Customs Service (ACS) and the Australian Quarantine Inspection Service (AQIS).
Shipping: All repackaged POPs were shipped, generally via one or more transit ports due to the complex shipping routes in the Pacific, to the Port of Brisbane, Australia. Upon arrival in Brisbane the POPs containers were cleared by Australian Customs and inspected by AQIS6 and QEPA. Once cleared, the containers were transported (with appropriate Waste Transport Certificate paperwork) to the BCD Technologies destruction facility. Shipping logistics were a major challenge on the Project, managed through maintaining flexible scheduling and frequent communication with project partners and other stakeholders.
Destruction: All POPs shipped under the Project were destroyed at BCD Technologies. BCD Technologies utilises Base Catalysed Dechlorination and High Temperature Plasma Arc PLASCON® technologies to treat both pure PCB and oils contaminated with PCB. Patented, PLASCON®, high temperature plasma technology is used to destroy liquid and solid pesticides. Third party emissions monitoring was conducted on the air emissions and liquid discharge to independently review the destruction facility’s compliance to licence and trade waste permit conditions.
3. EFFECTIVENESS
The effectiveness of the Project is considered against its overall goal of reducing the threat of POPs and related chemicals posed to the environment and human health in participating PICs and specifically against the indicators outlined in the PDD.
3.1 ACHIEVEMENTS OF THE PROJECT
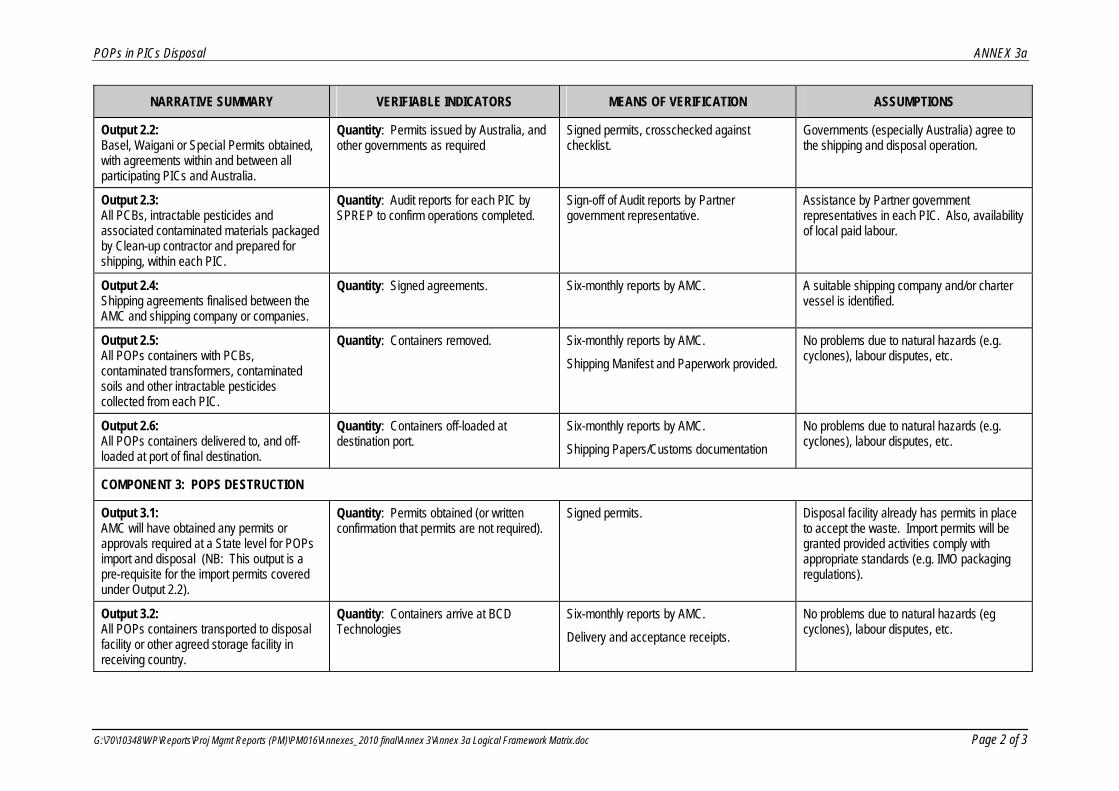
The achievements of the Project are assessed in Table 3 and tabulated against Logframe outputs and indicators defined in the PDD (original Project Logical Framework provided in Annex 3). Positive and negative deviations from the planned outputs are detailed in footnotes to the table. Several Project Reports are referred to in Table 3 and a list of all Project Reports is provided in Annex 4.
6 In some instances, containers were fumigated prior to being released from the Port of Brisbane, depending on the risk analysis conducted by AQIS and the Brisbane Port Authority.
POPs in PICs Phase II Project Project Completion Report
DESCRIPTION INDICATORS ACHIEVEMENTS (Performance Against Indicators)
COMPONENT 2: GOAL AND OBJECTIVE
To reduce the threat posed by Persistent Organic Pollutants (POPs) and related chemicals toward the environment and human health in PICs.
The Project reduced the threat posed by POPs and related chemicals toward the environment and human health via:
Removal and destruction of 124 tonnes of POPs and related chemicals from PICs;
Contributing towards PIC government capacity to manage hazardous chemicals, develop chemical manifests (required for completion of NIPs), and manage obligations and transhipment approvals under the Basel or Waigani Conventions; and
Contributing towards raising the awareness in the community of the harmful effects of POPs and related chemicals, through conducting press conferences and media interviews with PIC environment staff.
To dispose of Polychlorinated biphenyls (PCBs), and PCB-contaminated solvent from transformers, small quantities of PCB-contaminated soil, stockpiled organochlorinate pesticides including scheduled POPs and other intractable pesticides (mainly organochlorines and organophosphates), and unidentified pesticides considered likely to fall into those categories in participating PICs.
PIC Monitoring Reports, audit report on destruction operation, and project Technical Report.
Detailed description of government roles and extent of participation given in project technical report.
Project Cleanup Reports (see Annex 4) concluded that cleanup works successfully repackaged all POPs identified within the Country Cleanup Plans, with the exception of Naurub.
SPREP representative Dr Frank Griffin attended the following cleanups in a monitoring / auditor capacity: Cook Islands, Federated States of Micronesia, Fiji, Kiribati, Marshall Islands, Nauru, Niue, Samoa, Solomon Islands, Tonga, Tuvalu and Vanuatu. Dr Griffin’s reports were provided directly to AusAID and not to the AMC.
The total of 124 tonnes of POPs and related chemicals destroyed included unidentified chemicals, which through laboratory analysis were deemed to be within the destruction acceptance criteria.
Third-party emissions monitoring was conducted during destruction of waste at the facility (as detailed for Output 3.3).
A detailed description of PIC government roles was agreed in MoU between GoA and each PIC.
COMPONENT 2: POPS COLLECTION, PACKAGING AND SHIPPING TO DISPOSAL FACILITY
Output 2.1: The AMC will have made contact with Environment Australia7 to initiate the permitting processes required under the Basel and Waigani Conventions, and will have also facilitated the completion of country-to-country agreements that may be required for in-transit activities.
Checklist prepared by AMC of all required agreements. Letters of agreement or permit applications submitted by each PIC to Australia and other governments as required.
In the initial phase of the Project the following were completed outlining a plan to ensure that permitting and other required agreements were in place prior to shipping:
Preparation and acceptance by AusAID of Project Reports defining required permitting and agreements for in-transit activities including: Project Procedures Manual (GHD, 2004b), Chemical Assessment Plan and Manifest (GHD, 2004c), Transport and Logistics Plan (GHD, 2004d);
Completion with DEWHA approval of the Permit Schedule Report (GHD, 2003b), outlining all international and national permitting requirements, including Basel and Waigani movement and notification form templates;
A Basel / Waigani Convention workshop was held in Fiji (May 2003) for PICs representative Competent Authorities to outline their obligations and provide instruction on how to complete the paperwork; and
7 DEWHA (formerly Environment Australia)
POPs in PICs Phase II Project Project Completion Report
DESCRIPTION INDICATORS ACHIEVEMENTS (Performance Against Indicators) AusAID facilitated agreement of 12 MoU between GoA and participating PICs governments.
Output 2.2: Basel, Waigani or Special Permits obtained, with agreements within and between all participating PICs and Australia.
Permits issued by Australia, and other governments as required.
Basel or Waigani Notification and Movement Forms were completed and signed by all PICs. Special Import Permits were issued by DEWHA for all PICs, and all other relevant government agency approval was granted for all shipments. Note that the required permits were sought only once the POPs and related chemicals were repackaged.
Output 2.3: All PCBs, intractable pesticides and associated contaminated materials packaged by Clean-up contractor and prepared for shipping, within each PIC.
Audit reports for each PIC by SPREP to confirm operations completed.
Country Cleanup Plans (GHD, 2004e) outlining POPs inventory, cleanup approach and schedule were prepared for each PIC based on the results of reconnaissance visits.
Cleanup works were carried out in all PICs. Cleanup works successfully repackaged all POPs identified within the Country Cleanup Plans, with the exception of Nauru b.
Additional POPs and related chemicals not previously identified in Phase I, were identified during the course of the Project. An assessment of newly identified chemicals was completed in each case and the additional POPs were included or excluded based on this assessment and AusAID’s approval. Additional chemicals equated to an increase of approximately 10% on the total volume outlined in the Country Cleanup Plans.
SPREP representative Dr Frank Griffin attended 12 cleanups in a monitoring / auditor capacity. Dr Griffin’s reports were provided directly to AusAID and not to the AMC.
Output 2.4: Shipping agreements finalised between the AMC and shipping company or companies.
Signed agreements. Shipping agreements were sought with commercial shipping lines where possible for cost efficiency. Charter shipping companies were required in Solomon Islands, FSM, and Kiribati.
Shipping undertaken in each period was reported in the Project exception and annual reports. All shipping routes and other transport logistics are detailed in the Transport and Logistics Report (GHD, 2009a).
Output 2.5: All POPs containers with PCBs, contaminated transformers, contaminated soils and other intractable pesticides collected from each PIC.
Containers removed. All repackaged POPs and related chemicals were collected from the PICs. Container collection dates from each PIC are reported in the Transport and Logistics Report (GHD, 2009a). The first shipment of POPs exported under the Project occurred on 14 December 2004 from Samoa, and the last was exported on 5 August 2008 from Vanuatu.
Output 2.6: All POPs containers delivered to, and off-loaded at port of final destination.
Containers off-loaded at destination port.
All collected POPs were delivered and off-loaded at the port of final destination, including customs clearance and QEPA inspection and approval.
COMPONENT 3: POPS DESTRUCTION
Output 3.1: AMC will have obtained any permits or approvals required at a State level for POPs import and disposal (NB: This output is a pre-requisite for the import permits covered under Output 2.2).
Permits obtained (or written confirmation that permits are not required).
Permits were not required from QEPA for the importation of POPs. However, a representative from QEPA inspected each shipment upon arrival in Australia and provided written confirmation of the integrity of the cargo prior to transportation to the destruction facility.
QEPA Waste Transport Certificates were completed for all overland transport of POPs from the Port of Brisbane to the destruction facility.
POPs in PICs Phase II Project Project Completion Report
DESCRIPTION INDICATORS ACHIEVEMENTS (Performance Against Indicators)
Output 3.2: All POPs containers transported to disposal facility or other agreed storage facility in receiving country.
Delivery and acceptance receipts
All collected POPs and related chemicals were delivered to BCD Technologies destruction facility. The delivery and acceptance receipts are contained in the POPs Disposal of Shipped Chemicals Report (GHD, 2009b).
Output 3.3: All POPs and associated contaminated materials successfully disposed.
Treatment processes carried out in accordance with agreed protocols.
All POPs collected were destroyed. This included a total of 124 tonnes comprising:
4 tonnes scheduled POPs (excluding PCBs);
54 tonnes other intractable pesticides;
49 tonnes PCB contaminated equipment;
11 tonnes PCB contaminated oils; and
5 tonnes PCB contaminated soils.
Details of all POPs destroyed are presented in Annex 3.
Third party monitoring was undertaken during the destruction process to monitor compliance with agreed protocols and trade waste permits. One breach of the facility’s permit requirements was identified and corrective action was applied. Two subsequent third party monitoring events confirmed the facility was operating within its permit requirements. Destruction certificates were issued for all POPs destroyed which confirmed the final destruction all POPs and related chemicals. The achievements for this output are detailed clearly in the POPs Disposal of Shipped Chemicals Report (GHD, 2009b).
COMPONENT 4: PROJECT AND CONTRACT MANAGEMENT
Output 4.1: Effective project management will have operated throughout all of the Component 2 and 3 activities, including regular project reporting (six-monthly and exception reports and Annual Plan to AusAID), facilitation of PCC.
Effective and ongoing seamless project process.
Effective project management was maintained throughout the duration of the Project, including regular reporting, updated annual plans and facilitation of PCC meetings. A list of all Project Reports is provided in Annex 4.
The Project schedule was extended from 26 months (initial contract) to 75 months (final contract) due to several factors outside of AMC control d, e. These extensions were communicated and agreed with AusAID as the Project progressed.
Output 4.2: Effective contract management, and liaison with stakeholders including participating governments, AusAID, Environment Australia.
Contract and other agreements in accordance with project work programme and timeframes.
Regular six monthly reporting was completed over the course of the Project, in accordance with AusGuide and other quality standards. Reporting requirements were reduced with agreement from AusAID to annual reports in the final stages of the project.
Exception reports were maintained over the course of the Project. A total of 21 exception reports were completed for the Project.
Reporting to stakeholders was maintained via regular (3 monthly) stakeholder update letters and meetings.
Output 4.3: Management of public and civil liability issues.
Responsibilities clearly spelt out in all
A Risk Management Plan (GHD, 2003c) was developed and adhered to throughout project.
Roles and responsibilities for each team member, key project stakeholder and PIC governments were clearly defined
POPs in PICs Phase II Project Project Completion Report
DESCRIPTION INDICATORS ACHIEVEMENTS (Performance Against Indicators) contract documents, along with documented evidence of adequate liability cover.
in the Project Procedures Manual (GHD, 2004b) and PIC-GoA MoU. Contracts in place with AMC team contractors further defined roles and responsibilities.
Project specific insurances including Pollution Liability Insurance and Professional Indemnity Insurance were maintained throughout the project and extended at each project extension. Insurance certificates were required to be provided to DEWHA as part of the Waigani and Basel application to import processes.
Output 4.4: Project completion report prepared, including coordination of technical inputs from SPREP.
Project completion report.
The Completion Report was prepared by the AMC with contribution from AusAID, SPREP and representatives from PIC governments who participated in the Project. The Completion Report was finalised in accordance with AusGuideline 5.1, Preparing Completion Reports for AusAID – Interim Guidelines, as amended 2008.
Notes for Table 3:
a. Palau non-ratification of Conventions: Due to Palau’s failure to ratify the Basel or Waigani no agreements were made with Palau and POPs were not able to be shipped. The reconnaissance mission visited Palau and when the decision was taken not to ship chemicals from Palau, advice was provided on the safe storage of transformers.
b. Nauru PCBs: The reconnaissance mission identified one transformer in Nauru containing PCB contaminated oil, which was to be included under the Project. On return to Nauru for the cleanup visit, the transformer had been removed from storage and was not able to be located. Anecdotal evidence identified that the transformer had been collected by scrap metal recyclers. A detailed report on the Nauru cleanup visit is detailed in the June 2005 Exception Report.
c. Trade waste breach by BCD: Third party monitoring at BCD Technologies (BCD) trade waste breach for Polychlorinated Biphenyls (PCBs) in aqueous effluent from the facility on 25 May 2007. GHD initiated the following actions in response to the breach: 1) GHD notified the facility of the laboratory results. BCD agreed to notify QEPA and CabWater and to discontinue treatment of Project wastes until the breach was understood and rectified; 2) the monitoring results were verified. BCD confirmed that Airlabs Environmental had collected the monitoring samples from the correct point and that BCD had been in breach of its trade waste permit conditions; 4) BCD prepared a Trade Waste Breach Report (BCD, 2005); 5) GHD communicated the Trade Waste Breach report to stakeholders and prepared an Incident Report (GHD, 2007). The GHD Report included a procedure for preventing reoccurrence and for the destruction resuming operations; 6) QEPA undertook an assessment of the potential environmental impact of the breach. The review concluded that there were no detectable concentrations of PCBs in the receiving environment; and 8) BCD carried out operational corrections and, subsequent to approval by QEPA, CabWater, AusAID and GHD, destruction of Project POPs and related chemicals was resumed.
d. Project schedule extension: The original work plan was 27 months. The following extensions were agreed with AusAID: 1) Project extended by 12 months due to complications finalising intergovernmental MoU; 2) Project extended by 18 months due to Vanuatu’s delay in ratifying the Waigani Convention; 3) Project extended by further six months due to additional QEPA and AQIS requirements for importation and treatment of PCB contaminated soil from Vanuatu; 4) Project extended a further 12 months due to additional delays in transport and logistics for Vanuatu POPs and technical difficulties being experienced by BCD Technologies. The final duration of the Project was 75 months.
e. Additional POPs and intractable waste included in the Project: In addition to POPs and intractable waste identified in Phase I and confirmed under the reconnaissance, significant volumes were identified during cleanup, and where possible, included in the Project: approximately one tonne of DDT and other intractable waste from Solomon Islands, approximately one tonne of pesticides from Kiribati and five tonnes of PCB contaminated soil from Vanuatu. Minor additional volumes were also collected from most PICs. However, the scope was strict in its definition of the type of waste that could be included and the destruction facility.
POPs in PICs Phase II Project Project Completion Report
3.2 QUALITATIVE ASSESSMENT
This section provides a qualitative evaluation of Project management including management of risk, procurement, provision of technical assistance, monitoring, supervision, coordination and partner government fulfilment of responsibilities, and how management influenced the outcomes.
3.2.1 Risk Management
Project risks, mitigation and management options were defined and communicated early in the Project planning stages. The overall Project risk management structure was divided broadly into:
Management Risk requiring management actions to mitigate their potential impact to the Project, addressed in the Risk Management Plan (GHD, 2003c); and
Operational Risk requiring specific field procedures and emergency response guidelines to manage and mitigate risks, addressed in the Project Field Operation Procedures (GHD, 2003d) and Emergency Response Guidelines (GHD, 2003a).
Key risks, management actions and the effectiveness of the outcomes are summarised in Table 4. As a result of these actions, the Project risks were effectively mitigated and managed.
Table 4: Effectiveness of Risk Management Actions
Risk Actions Effectiveness
Lack of PIC Government support
Association with SPREP
Signing of inter-government MoU between Australia and each PIC
Association with SPREP afforded the AMC with a central contact point for information dissemination and interaction with PICs, which aided effective initiation and on-going PIC Government support for the Project. SPREP provided the AMC with contextual understanding of the regional initiatives and challenges facing PICs.
While SPREP provided an effective link with departmental level staff, the signing of inter-government MoU between GoA and each PIC confirmed, defined and formalised support for the Project at the diplomatic level.
Australian public opposition
Implementation of Communication Strategy
Management of Australian public approval and support of the Project was achieved with an effective communications strategy. As part of this strategy, the Project was communicated and discussed with key stakeholders prior to commencement, allowing stakeholder comments to be considered in the Project development stage. The stakeholders were kept informed and involved with all relevant project details. When invited to contribute to this report, one stakeholder offered the following contribution:
“The POPs in PICs project is proof that communities can be properly consulted. The communication strategy has not only benefited the Narangba community; it has benefited the government, businesses and the environment. We are very happy to be able to support the aim of reducing the risk of POPs on our Pacific neighbours and at the same time have transparent processes to make sure the project was not to the detriment of Australian communities ” (Jell, 2008).
POPs cannot be collected due to challenges associated with in-country operational environments, such as security issues (civil unrest), bad weather (cyclonic type) or other
Monitoring weather conditions and potential natural hazards, monitoring the security situation in each PIC including DFAT travel advisories, consultation with SPREP and local authorities,
The response to high risk operational environments in PICs included:
Rescheduling of the POPs cleanup in the Solomon Islands due to ethnic tension (2004-2005);
extraneous influences (earthquake, volcanic eruptions, tsunami, labour disputes).
regular review of entry Visa requirements.
Cyclone Ivy (February 2004); and
Monitoring weather conditions closely during the Pacific cyclone season (November – April).
Security of repackaged POPs between reconnaissance and cleanup.
The importance of maintaining the POPs in a secure storage location was communicated to local authorities in all PICs.
At the stage of the reconnaissance, chemicals were inventorised. The Team explained to environment and health staff the importance of keeping chemicals and transformers secure until the clean up phase. This was an effective means of securing inventorised POPs between the reconnaissance and cleanup with the exceptions:
In Nauru, one transformer was removed prior to collection (refer notes to Table 3 for details), indicating more needed to be done to protect wastes with potential economic value, as anecdotal evidence indicates the transformer was sold for scrap.
In Fiji, as a result of an assessment of very high risk to the repackaged POPs, a security guard was employed to ensure security of repackaged POPs.
Additional POPs and intractable pesticides identified.
A process of assessment was implemented, including clear identification of the chemicals, review against the Project scope and BCD acceptance requirements; assessment of barriers to collection and shipment, and seeking of AusAID approval for additional project expenditure (where the cost was significant).
The need for this process was noted after the Fiji, Tonga and Cook Islands, FSM and Marshall Islands cleanups and was implemented from the Niue cleanups onwards. The process was effective in defining chemicals that could be included and those that could not.
An additional 9.4 tonnes of POPs was included in the Project (not previously identified in Phase 1), further contributing to the Project goal.
POPs cannot be accepted by disposal facility. The risk that the destruction facility refused acceptance of POPs imported to Australia.
Managed through the development of detailed POPs manifest and approval by the destruction facility, and QEPA, prior to shipping the POPs from the Pacific. Where chemicals were unknown (i.e. not labelled), 50 mL samples were collected and analysed for a broad screen of contaminants prior to inclusion in the Project.
BCD accepted all POPs imported under the Project.
Note, as a result of this process some pesticides had to be excluded from collection under the Project. A small number of pesticides identified contained metal concentrations in excess of BCD acceptance criteria, and therefore could not be included in the Project.
Disposal facility does not operate satisfactorily.
The risk of the destruction facility operating outside permit requirements was monitored by a third party emissions monitoring contractor. Over the course of the Project, four monitoring events were undertaken at the destruction facility, during the destruction of POPs from the Pacific.
One trade waste breach was identified at BCD during the destruction process (refer notes to Table 3 for details). Following this breach, the destruction process was halted and the incident was investigated, reported and the causes of the breach rectified before destruction was allowed to re-commence.
All subsequent third party emissions monitoring were within BCD’s accepted licence parameters.
POPs in PICs Phase II Project Project Completion Report
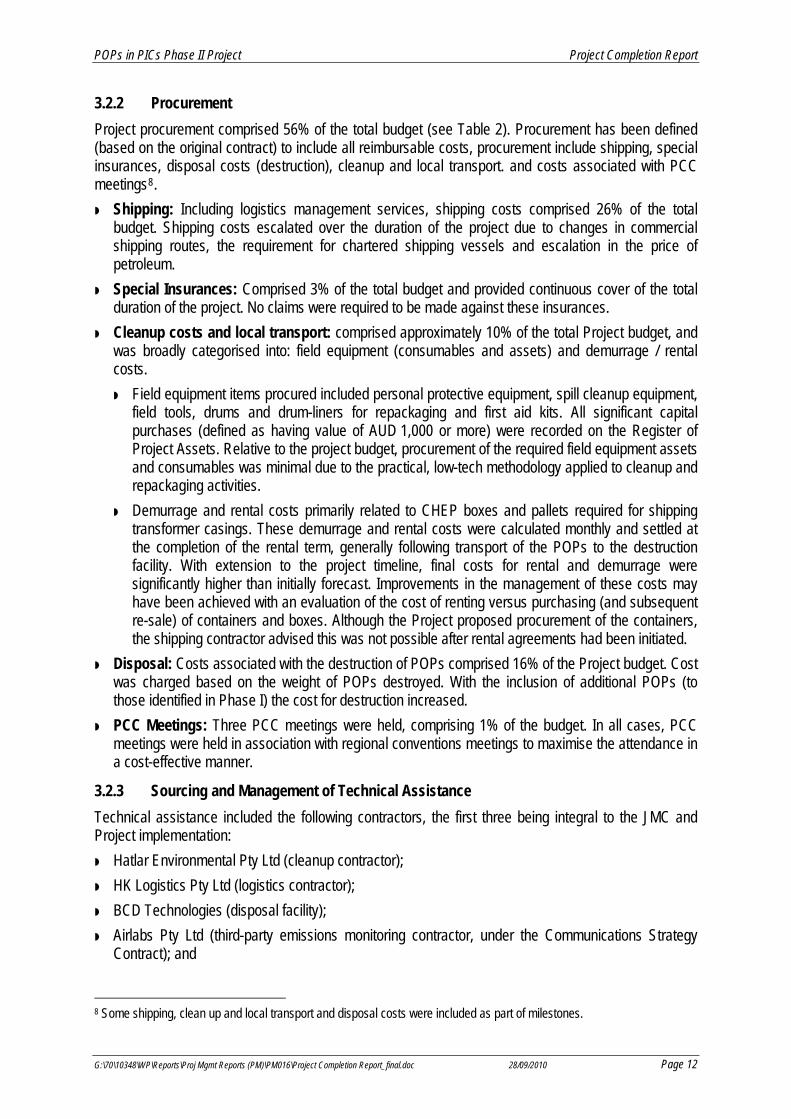
Project procurement comprised 56% of the total budget (see Table 2). Procurement has been defined (based on the original contract) to include all reimbursable costs, procurement include shipping, special insurances, disposal costs (destruction), cleanup and local transport. and costs associated with PCC meetings8.
Shipping: Including logistics management services, shipping costs comprised 26% of the total budget. Shipping costs escalated over the duration of the project due to changes in commercial shipping routes, the requirement for chartered shipping vessels and escalation in the price of petroleum.
Special Insurances: Comprised 3% of the total budget and provided continuous cover of the total duration of the project. No claims were required to be made against these insurances.
Cleanup costs and local transport: comprised approximately 10% of the total Project budget, and was broadly categorised into: field equipment (consumables and assets) and demurrage / rental costs.
Field equipment items procured included personal protective equipment, spill cleanup equipment, field tools, drums and drum-liners for repackaging and first aid kits. All significant capital purchases (defined as having value of AUD 1,000 or more) were recorded on the Register of Project Assets. Relative to the project budget, procurement of the required field equipment assets and consumables was minimal due to the practical, low-tech methodology applied to cleanup and repackaging activities.
Demurrage and rental costs primarily related to CHEP boxes and pallets required for shipping transformer casings. These demurrage and rental costs were calculated monthly and settled at the completion of the rental term, generally following transport of the POPs to the destruction facility. With extension to the project timeline, final costs for rental and demurrage were significantly higher than initially forecast. Improvements in the management of these costs may have been achieved with an evaluation of the cost of renting versus purchasing (and subsequent re-sale) of containers and boxes. Although the Project proposed procurement of the containers, the shipping contractor advised this was not possible after rental agreements had been initiated.
Disposal: Costs associated with the destruction of POPs comprised 16% of the Project budget. Cost was charged based on the weight of POPs destroyed. With the inclusion of additional POPs (to those identified in Phase I) the cost for destruction increased.
PCC Meetings: Three PCC meetings were held, comprising 1% of the budget. In all cases, PCC meetings were held in association with regional conventions meetings to maximise the attendance in a cost-effective manner.
3.2.3 Sourcing and Management of Technical Assistance
Technical assistance included the following contractors, the first three being integral to the JMC and Project implementation:
Airlabs Pty Ltd (third-party emissions monitoring contractor, under the Communications Strategy Contract); and
8 Some shipping, clean up and local transport and disposal costs were included as part of milestones.
POPs in PICs Phase II Project Project Completion Report
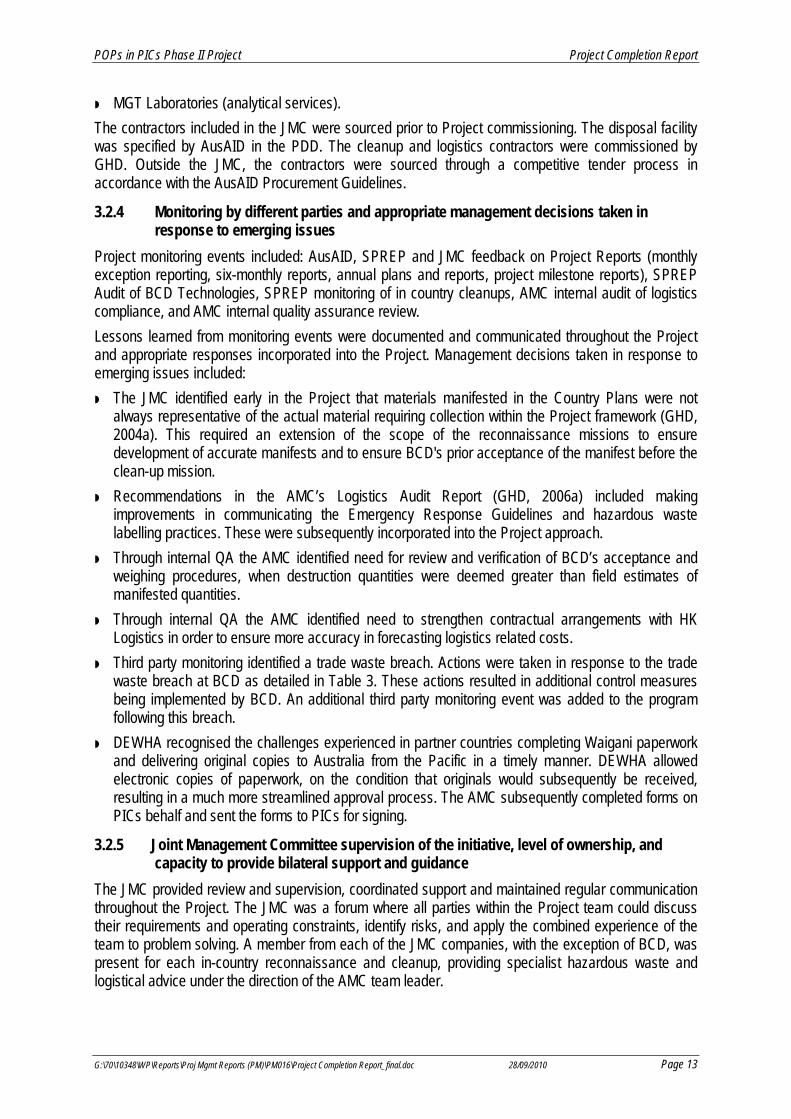
MGT Laboratories (analytical services).
The contractors included in the JMC were sourced prior to Project commissioning. The disposal facility was specified by AusAID in the PDD. The cleanup and logistics contractors were commissioned by GHD. Outside the JMC, the contractors were sourced through a competitive tender process in accordance with the AusAID Procurement Guidelines.
3.2.4 Monitoring by different parties and appropriate management decisions taken in response to emerging issues
Project monitoring events included: AusAID, SPREP and JMC feedback on Project Reports (monthly exception reporting, six-monthly reports, annual plans and reports, project milestone reports), SPREP Audit of BCD Technologies, SPREP monitoring of in country cleanups, AMC internal audit of logistics compliance, and AMC internal quality assurance review.
Lessons learned from monitoring events were documented and communicated throughout the Project and appropriate responses incorporated into the Project. Management decisions taken in response to emerging issues included:
The JMC identified early in the Project that materials manifested in the Country Plans were not always representative of the actual material requiring collection within the Project framework (GHD, 2004a). This required an extension of the scope of the reconnaissance missions to ensure development of accurate manifests and to ensure BCD's prior acceptance of the manifest before the clean-up mission.
Recommendations in the AMC’s Logistics Audit Report (GHD, 2006a) included making improvements in communicating the Emergency Response Guidelines and hazardous waste labelling practices. These were subsequently incorporated into the Project approach.
Through internal QA the AMC identified need for review and verification of BCD’s acceptance and weighing procedures, when destruction quantities were deemed greater than field estimates of manifested quantities.
Through internal QA the AMC identified need to strengthen contractual arrangements with HK Logistics in order to ensure more accuracy in forecasting logistics related costs.
Third party monitoring identified a trade waste breach. Actions were taken in response to the trade waste breach at BCD as detailed in Table 3. These actions resulted in additional control measures being implemented by BCD. An additional third party monitoring event was added to the program following this breach.
DEWHA recognised the challenges experienced in partner countries completing Waigani paperwork and delivering original copies to Australia from the Pacific in a timely manner. DEWHA allowed electronic copies of paperwork, on the condition that originals would subsequently be received, resulting in a much more streamlined approval process. The AMC subsequently completed forms on PICs behalf and sent the forms to PICs for signing.
3.2.5 Joint Management Committee supervision of the initiative, level of ownership, and capacity to provide bilateral support and guidance
The JMC provided review and supervision, coordinated support and maintained regular communication throughout the Project. The JMC was a forum where all parties within the Project team could discuss their requirements and operating constraints, identify risks, and apply the combined experience of the team to problem solving. A member from each of the JMC companies, with the exception of BCD, was present for each in-country reconnaissance and cleanup, providing specialist hazardous waste and logistical advice under the direction of the AMC team leader.
POPs in PICs Phase II Project Project Completion Report
The AMC acted as a communication focal point for the Project, providing bilateral support and guidance to PIC governments as requested, as well as regular liaison with SPREP, and contractors, via in-country meetings and regular electronic communication.
The AMC maintained clear ownership of the Project on behalf of AusAID, including advocating the Project outcomes to the PIC governments and community via press conferences, to the Australian and international community through AusAID facilitated media releases, and presentations at national and international conferences and conventions.
3.2.6 Coordination with other activities by the partner government or other donors
For many countries the Project manifest formed the basis of inventory development under the Stockholm Convention National Implementation Plan (NIP), GEF-funded enabling activities. NIP development led to the development of action plans for other POPs-management related issues including customs legislation, enforcement, on-going use, residual stockpiles, and unintentionally produced POPs.
The Project was implemented in coordination with Waigani and Basel Secretariat mandates, and provided PICs with experience in undertaking the approval process for transhipment of hazardous waste.
The outcomes of the Project will be shared with partner governments and donors. Several donors have expressed interest in identifying the next steps following the completion of the Project. The GEF-PAS has proposed a POPs monitoring and integrated hazardous waste including POPs initiatives for 2009 (Faulalo, 2008) and the Agence Française de Développement (AFD) is undertaking a feasibility study including assessing subregional activities on hazardous waste management.
3.2.7 Partner government fulfilment of responsibilities in the MoU including staffing and other resources, support from officials
The primary responsibilities of partner governments included facilitation of site access and approvals, customs clearance of equipment, availability of counterpart staff for training, technology transfer activities and to provide a communication focal point. In general, the partner governments fulfilled these requirements and provided a valuable contribution to the Project implementation, through providing the team with local on the ground knowledge.
One of the initial assumptions in the Project was that PIC counterparts would provide vehicle transport to sites. However, PIC government departments were often over-stretched and under-resourced. As a result vehicles were not made available and the Project hired in-country transport.
4. EFFICIENCY
4.1 COST-BENEFIT ANALYSIS
A cost-benefit analysis was not undertaken ex ante in the design process and therefore a cost-benefit analysis cannot be completed ex post due to the lack of baseline and ongoing cost-benefit data. A qualitative consideration of cost-effectiveness is a more appropriate methodology. Such an approach requires monetising only the Project’s cost and an analysis of whether the costs of an intervention can be justified by the magnitude of net outcomes.
The total cost of the Project and the Communication Strategy was AUD 6.57 Mil. The direct tangible benefit was the removal and destruction of 124 tonnes of scheduled POPs and intractable pesticides.
Less tangible benefits included the reduction in the negative impacts of waste. The negative economic impact (costs) of poor waste management in selected PICs was analysed under the International Waters Project (IWP, 2006a, 2006b, 2006c, 2006d). The IWP highlight the significant costs (up to 1%
POPs in PICs Phase II Project Project Completion Report
PIC country GDP) of poor waste management practices in terms of reduced revenue from fishing and tourism, costs to Government, the health sector and environmental costs. Poorly managed stockpiles of POPs and intractable waste can impact directly and indirectly on economic development through:
negative effects on human health and the environment (eco-toxicological effects), resulting in healthcare costs and loss of work days due to sickness; and
contamination of food supplies (primarily fisheries sector for PICs), which can have negative impacts on subsistence economies, local markets and export revenues.
Further benefits were achieved through the increased capacity of PIC government staff (see Section 5.3), dissemination of information regarding practical application of the Basel, Waigani and Stockholm Conventions, and encouragement of inter-governmental and inter-departmental co-operation (see Section 3.2.6).
4.2 VALUE FOR MONEY
With a total Project cost of AUD 6.57 Mil and 124 tonnes of POPs destroyed, the approximately cost following final POPs destruction was AUD 53 per kilogram. Considering the challenges associated with the Project, this unit cost is considered efficient as it includes management, collection, repackaging, approval, shipping and destruction of POPs from twelve Pacific countries.
The following efficiencies in the Project approach are considered key contributors to the low unit cost:
Regional approach: The regional approach to the Project (rather than a country-by-country basis), represented a least-cost solution due to the reduced transaction costs and administrative burden significantly alleviating replication of contracts, approvals paperwork and communication. Cost efficiencies in travel were also achieved, through visiting several countries per visit.
Effective planning and communication: Planning and communication during the initial stages of the Project (see Section 2) was successful in gaining approval and support from key stakeholders who could have created delays if not given an opportunity to have their concerns addressed early in the Project’s design. This communication and planning laid the foundations for efficient Project implementation. Additionally, efficiencies were borne out through close communications between AMC and DEWHA, DAFF, QEPA and other government agencies.
Practical cleanup solutions: Practical techniques were applied to in-country POPs cleanup and repackaging works (see Section 2), which were cost efficient, adaptable and allowed a high degree of mobility.
Clearly defined scope: The scope clearly defined the intractable wastes to be included in the Project (see Section 2). The enforcement of the clearly defined scope provided focus to the Project, which could have deviated to several other toxic chemical and hazardous waste related issues in the Pacific. This targeted focus allowed for highly efficient project implementation.
Alignment with complementing programmes and initiatives: Other programmes and initiatives complemented the Project implementation, most significantly the GEF Operational Programme on POPs, which provided funding to PICs party to the Stockholm Convention for the development of NIPs. These programme funds aided the awareness raising and capacity building activities of the POPs in PICs Project.
4.2.1 Contract Variations
AusAID approved four cost variations over the term of the Project as detailed in Table 5, primarily as a result of:
POPs in PICs Phase II Project Project Completion Report
Changes to commercial shipping routes and requirement for charter vessels to complete the Project. Charter vessels were required in Solomon Islands and FSM for the collection of repackaged POPs. This requirement arose due to cancellations of previously existing commercial shipping lines.
Inclusion of stockpiled POPs and intractable waste in addition to that identified in Phase 1. As detailed in Table 3, an addition of approximately 10% by weight of POPs was included by the completion of cleanup works, requiring additional cleanup and destruction budget; and
Project schedule extension due to delayed MoU agreement and delays in Vanuatu ratification of the Waigani Convention. Schedule extensions resulted in additional costs for project management, storage and demurrage. Project demurrage costs proved to be an expensive component, and as such, future projects might consider: 1) purchasing containers, rather than leasing, where project timelines are likely to be extended removing demurrage costs; or 2) defining lay times in contracts of affreightment to reduce demurrage costs.
While these variations provided additional benefits to the Project through the inclusion of additional POPs, they also in part represent areas for improvement in Project management, which could increase the Project cost-benefit efficiencies. Table 5: Project budget with approved cost variations
GoA Expenditure Item Original Contract
Variation 1 Variation 2 Variation 3 Variation 4 Actual Expenditure at Completion
TOTAL 4,359,467 5,746,154 6,541,432 6,541,432 6,741,432 6,568,530
5. IMPACT AND SUSTAINABILITY
The projected long term changes (impacts) resulting from the Project are discussed in the following section with reference to evidence-based indicators, where possible, and likely consequences.
5.1 ACCELERATING ECONOMIC GROWTH AND REDUCING POVERTY
Poverty in the Pacific is induced by vulnerability caused by detrimental circumstances, often environmental and economic, which impact negatively on lives and on the ability to meet basic needs (EC, 2003). Consequently, improvement in the quality of PIC environments has a direct effect on poverty reduction and economic growth. Australia recognises these strong linkages between poverty and the environment (AusAID, 2001).
The likely consequences of these positive environmental impacts of the Project (see Section 5.2.2) are increased public health, reduced health care costs, improved health of the workforce, reduced threat to
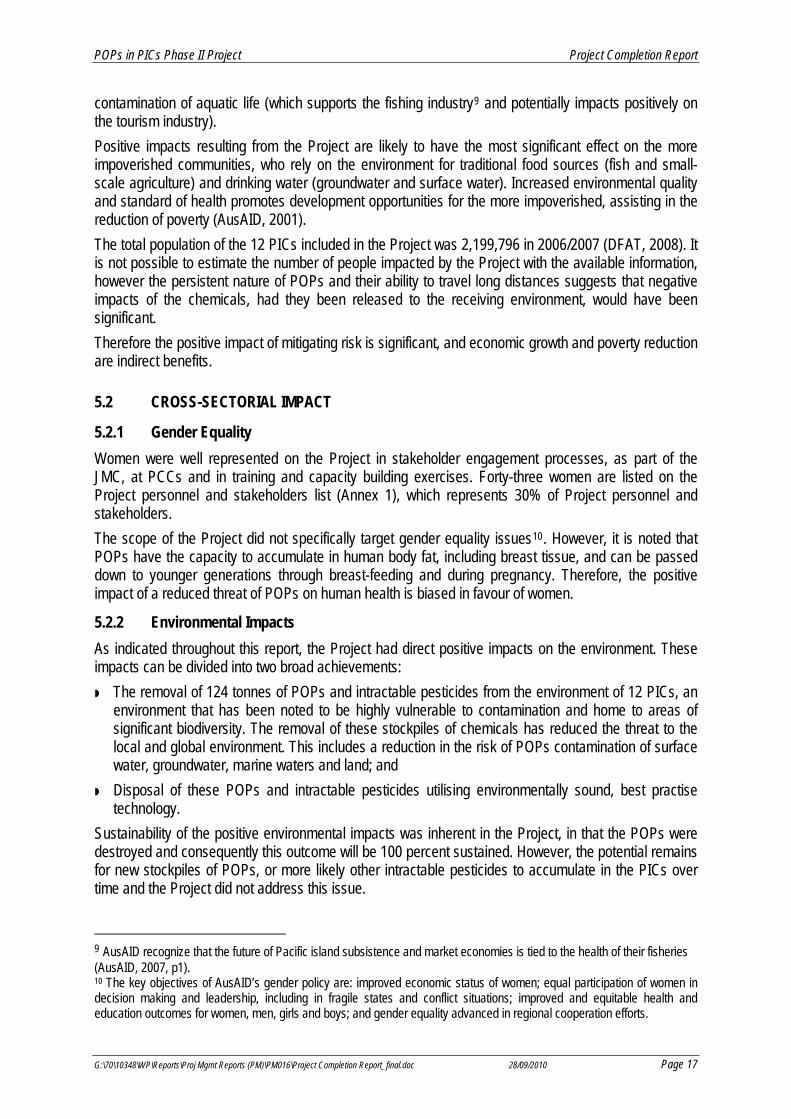
contamination of aquatic life (which supports the fishing industry9 and potentially impacts positively on the tourism industry).
Positive impacts resulting from the Project are likely to have the most significant effect on the more impoverished communities, who rely on the environment for traditional food sources (fish and small-scale agriculture) and drinking water (groundwater and surface water). Increased environmental quality and standard of health promotes development opportunities for the more impoverished, assisting in the reduction of poverty (AusAID, 2001).
The total population of the 12 PICs included in the Project was 2,199,796 in 2006/2007 (DFAT, 2008). It is not possible to estimate the number of people impacted by the Project with the available information, however the persistent nature of POPs and their ability to travel long distances suggests that negative impacts of the chemicals, had they been released to the receiving environment, would have been significant.
Therefore the positive impact of mitigating risk is significant, and economic growth and poverty reduction are indirect benefits.
5.2 CROSS-SECTORIAL IMPACT
5.2.1 Gender Equality
Women were well represented on the Project in stakeholder engagement processes, as part of the JMC, at PCCs and in training and capacity building exercises. Forty-three women are listed on the Project personnel and stakeholders list (Annex 1), which represents 30% of Project personnel and stakeholders.
The scope of the Project did not specifically target gender equality issues10. However, it is noted that POPs have the capacity to accumulate in human body fat, including breast tissue, and can be passed down to younger generations through breast-feeding and during pregnancy. Therefore, the positive impact of a reduced threat of POPs on human health is biased in favour of women.
5.2.2 Environmental Impacts
As indicated throughout this report, the Project had direct positive impacts on the environment. These impacts can be divided into two broad achievements:
The removal of 124 tonnes of POPs and intractable pesticides from the environment of 12 PICs, an environment that has been noted to be highly vulnerable to contamination and home to areas of significant biodiversity. The removal of these stockpiles of chemicals has reduced the threat to the local and global environment. This includes a reduction in the risk of POPs contamination of surface water, groundwater, marine waters and land; and
Disposal of these POPs and intractable pesticides utilising environmentally sound, best practise technology.
Sustainability of the positive environmental impacts was inherent in the Project, in that the POPs were destroyed and consequently this outcome will be 100 percent sustained. However, the potential remains for new stockpiles of POPs, or more likely other intractable pesticides to accumulate in the PICs over time and the Project did not address this issue.
9 AusAID recognize that the future of Pacific island subsistence and market economies is tied to the health of their fisheries (AusAID, 2007, p1). 10 The key objectives of AusAID’s gender policy are: improved economic status of women; equal participation of women in decision making and leadership, including in fragile states and conflict situations; improved and equitable health and education outcomes for women, men, girls and boys; and gender equality advanced in regional cooperation efforts.
POPs in PICs Phase II Project Project Completion Report
Anecdotal evidence from in-country discussions with PIC government personnel indicates accumulation of chemicals occurs due to donations of pesticides through aid programs and over-ordering of pesticides by departments. To avoid the accumulation of new POPs, appropriate customs controls must be developed and implemented. Further ratification and implementation of relevant international conventions including the Rotterdam Convention on Prior Informed Consent will assist PICs with developing procedures and receiving information on imports of hazardous chemicals. NIPs should in theory identify any gaps in legislative and enforcement capabilities in this regard, however funding to implement strategies in the NIPs is limited.
Potential negative environmental impacts of the Project relate to the greenhouse gas emissions generated throughout Project duration including air and land travel, shipping and destruction activities. A calculation of these emissions was undertaken (see Annex 3), resulting in an estimate of 339 tonnes of CO2 equivalent emissions resulting from the Project implementation.
5.2.3 Cross-Cutting Governance Issues
Management of POPs and intractable waste issues in the PICs has required inter-governmental and some intra-governmental cooperation between Ministries and Departments of Environment, Agriculture, Public Works and Health. The Project has required communication and cooperation between competent authorities under the Basel or Waigani conventions of all PICs. The Project has also required close cooperation between AusAID and DEWHA. Corruption and human rights issues were not encountered.
5.2.4 Partnership and Promotion of Regional Stability and cooperation
During the PCC meeting in May 2008, country representatives identified that understanding the practical application of provisions under multilateral environmental agreements (MEAs) of the Basel and Waigani Conventions was invaluable. Many also suggested the Project jump-started their implementation of provisions under the Stockholm Convention. The Project also encouraged countries to ratify Basel or Waigani. At the commencement of the Project, six PICs were not party to either and at completion all but Palau had ratified one of these conventions. The promotion of ratification of MEAs contributes to regional and international partnerships.
5.3 LONG TERM CAPACITY DEVELOPMENT
The Project’s contribution to capacity development included:
Contribution to knowledge building in obligations, mechanisms and processes under the Waigani, Basel and Stockholm conventions. Specifically, the following contributed directly to capacity building:
1) a workshop with PIC competent authorities on Basel and Waigani Convention requirements associated with the Project (Nadi, Fiji, 26-30 May 2003 attended by 10 PIC representatives);
2) distribution of transhipment proforma and approval process information for the Basel and Waigani Convention; and
3) meetings held in each PIC with competent authorities and relevant government staff to reiterate the transhipment approval process.
Contribution to increasing knowledge and awareness of appropriate hazardous chemicals management and storage, including:
1) on-the-job training of government staff during cleanup works; and
2) media releases and press conferences to publicise the Project and promote safe management of hazardous chemicals.
The successful capacity building contribution of the Project was highlighted by PIC delegates who attended the 2008 PCC meeting (Annex 3), noting that the Project had:
Improved partner government understanding and intergovernmental communication;
Encouraged partner government departments to work closer together in order to remove waste; and
Helped countries become aware of obligations under international conventions.
However, PIC representatives also highlighted their preference for an additional training component as an area for improvement to the project-approach delivery.
6. RELEVANCE
6.1 THE INITIATIVE OBJECTIVES
The Project objectives addressed regional and international priority issues, evident from the alignment of the Project goal with one of the highest priority waste management issues in the Pacific as identified in SPREP’s Waste Management Action Plan 1997-2000, and in the Stockholm Convention.
The objectives of the Project were clear, allowing for the distinct separation of what could and couldn’t be included in the cleanup, which contributed to Project success.
The Project was developed in accordance with AusAID’s Pacific Regional Aid Strategy 2004-2009, including making positive steps towards improvement of drinking water quality, protection of marine resources, and promoting stabilisation of the region. In addition, the Project contributed towards Australia’s commitments under Article 12 of the Stockholm Convention on provision of Technical Assistance.
6.2 FORM OF AID
In regard to relevance, the choice of FoA (project support-approach) has proven to be an appropriate response to the threat of POPs and intractable waste on human health and the environment11. The clear nature of the problem, the threat of POPs, was well suited to an outcome-driven AMC-managed project-approach. Strengths of the project-approach included efficiencies in POPs collection, packaging and shipping, effective management of destruction contracts and effective management of Australian, Basel and Waigani approval requirements.
Furthermore, association with SPREP as a regional partner provided several benefits including maintaining alignment with country and regional strategies.
With regard to sustainability, the FoA complemented the GEF Operational Programme on POPs including the development of country NIPs. Association with SPREP is likely to have increased sustainability and local ownership of project achievements through on-going SPREP programs, coordination and communication. Association with SPREP has also been valuable to SPREP’s profile in the Pacific.
6.3 MANAGEMENT AND INSTITUTIONAL ARRANGEMENTS
The strengths of the contract include a clear scope of services with a clear definition of “scheduled POPs and intractable pesticides” for disposal, clearly defined roles and responsibilities, components and objectives.
11 AusAID’s activity design guidelines (AusAID, 2005) outlines that the aid modality of project support is appropriate when: a) “Externally sourced short-term technical expertise is the key input to address what are primarily technical issues/problems”; and b) “A regional response is required – such as on environmental, health or security issues (i.e. it is a trans-boundary issue which requires coordination and management outside/in addition to any one country’s established systems and institutions).”
POPs in PICs Phase II Project Project Completion Report
The MoUs were appropriate for Project delivery and a suitable level of support and involvement was received during implementation from PICs partner government staff.
7. LESSONS LEARNED
The following summarises the overarching lessons learned.
The Project schedule needs to be flexible: Flexibility in the Project schedule was an integral component of the management of project risks including security issues, changes in shipping routes, variable approvals completion timing, countries ratification of relevant Conventions. Flexibility was built into the Project through regular communication (on-going regular stakeholder updates throughout the project) and a practical low-tech approach to collection and packaging, as well as through the flexibility of AusAID to increase the cost and the implementation time of the Project.
Initial reconnaissance is essential for cleanup planning: The initial reconnaissance visit conducted in each PIC to inspect, confirm and test POPs, also served to allow meetings with officials in each participating PIC to discuss in detail the international legal requirements relating to the repackaging and shipment of wastes; and extensive discussions with authorities and NGOs relating to chemicals management and hazardous waste transport approvals processes. It was recognized by project stakeholders that the benefits of the reconnaissance stage exceeded expectations. Relationships and increased awareness established during the reconnaissance have contributed significantly to the success of the project (Boomer, 2006).
POPs volumes increase with growing awareness: The volume of stockpiled POPs and intractable waste increased over the duration of the Project as awareness of the collection activities was communicated via local media and through government channels.
The complexities of export import process take time to negotiate: The Waigani and Basel approvals process required significant upfront planning, capacity building of the PIC’s government agencies and on-going communication with PICs and DEWHA, all of which required more time than expected. This was true also of the other import permit processes for DAFF, Customs and AQIS, which were dependent on the DEWHA approvals.
Independent disposal facility emission monitoring is important to ensure compliance and demonstrate transparency to all project stakeholders: Even the best available technologies should be subject to third party monitoring, as learned from the detected trade waste breach at BCD. Despite regular local government monitoring, third party monitoring was required to make the results available to stakeholders. Following the detection of this breach, improved processes were put in place at the facility to reduce the risk of any further breach.
Effective communication with stakeholders provides significant project efficiencies: The positive cooperative foundations developed with all stakeholders as a result of the Communication Strategy were maintained throughout the Project, and played a significant role in implementation success.
8. OVERALL CONCLUSIONS
Effectiveness
The Project made a significant contribution to ridding the participating PICs of scheduled POPs and intractable pesticides. All reported scheduled POPs and intractable pesticides accessible to the team were removed from the PICs and destroyed in an environmentally sound manner, providing a highly effective reduction of the threat of these toxic chemicals to human health and the environment.
POPs in PICs Phase II Project Project Completion Report
Efficiency
With a total Project cost of AUD 6.57 Mil and 124 tonnes of POPs destroyed, the approximate unit cost following final POPs destruction was AUD 53 per kilogram. Considering the challenges associated with the Project, this unit cost is considered efficient as it includes the management, collection, repackaging, approval, shipping and destruction of POPs from 12 independent countries. Cost efficiencies were achieved through a regional approach to implementation, effective planning and communication, practical cleanup solutions, clearly defined scope, and alignment with complementing programmes and initiatives. Areas for efficiency improvements include reducing the project duration and reducing container demurrage costs.
Impact and Sustainability
A positive and sustainable impact was made by improving the environment through the reduction of the source of POPs contamination. Secondary impacts included poverty reduction and economic growth through contributions to improved environmental quality and human health, promoting partnerships through the implementing provisions of MEAs, and long-term capacity development through information sharing and informal training.
Relevance
The Project goal addressed country, regional and international priority issues, and was in alignment with the highest priority waste management issues in the Pacific as identified by SPREP member countries in the Waste Management Action Plan 1997-2000, and the objective of the Stockholm Convention.
Future Actions
Suggested future actions include:
Undertake collection and safe disposal of other hazardous waste identified in Phase I and during the course of Phase II that could not be collected under the Phase II scope. It is noted that the Phase II Project addressed about 30% of the hazardous waste identified in Phase I. Remaining hazardous wastes include timber treatment chemicals (copper-chrome-arsenate), school chemicals, disused pharmaceuticals, medical waste, asbestos, bitumen, contaminated sites, and buried POPs and intractable waste. This should be undertaken in line with PIC NIPs and SPREP Solid Waste Management Strategy for the Pacific Region (SPREP, 2005). The AMC also prepared an “additional chemicals list” listing chemicals identified, but unable to be collected under the Project. Further work on chemicals on this list is recommended.
Testing of online transformers. Online transformers were not tested under the POPs in PICs Project. Transformers commissioned earlier than 1980 are likely to contain, or have contained PCB-contaminated oil. In most PICs, old transformers are still in operation in some areas. Whilst these are unlikely to contain high concentrations of PCBs, due to top-up of oil contamination, residual contamination is likely.
Undertake a review of the region’s National Implementation Plans and design further regional projects to address common issues.
Undertake training and capacity building to formalise and develop skills gained by the participating PIC government agencies during the Project in the documentation, management, safe storage and disposal of hazardous waste.
Support to develop appropriate legislation and management systems to identify any remaining sources, track importation and export, sale, use, and disposal of hazardous materials and chemicals, including appropriate labelling.
The project design document (AusAID, 2002 p26) noted “PNG was not included in Phase II, though it is expected that a future project could use the same methodology to work with PNG to remove POPs”. PNG has expressed a request for support for such a project.
POPs in PICs Phase II Project Project Completion Report
Further work should also be considered in the control of unintentionally produced POPs, primarily dioxins and furans, which were highlighted as a priority issue by UNEP in 2002 (UNEP, 2002). Major sources of dioxins and furans in the Pacific come from vehicle emissions and informal incineration practices, such as domestic waste burning. An initiative to address dioxins and furans may involve education and awareness, although much work has already been completed in this area.
POPs in PICs Phase II Project Project Completion Report
REFERENCES
AusAID, 2001, Reducing Poverty: The central integrating factor of Australia’s aid program, AusAID, Commonwealth of Australia, Canberra, April 2001.
AusAID, 2002; Project Design Document, Persistent Organic Pollutants (POPs) in Pacific Island Countries, Phase II – scheduled POPs and intractable pesticides disposal, AusAID, Commonwealth of Australia, Canberra, October 2002.
AusAID, 2005, AusGuideline, Activity Design 3.2: Selecting forms of aid, Commonwealth of Australia, Canberra, October 2005.
AusAID, 2007a, Gender Equality in Australia’s aid program – why and how, AusAID, Commonwealth of Australian, Canberra, March 2007
Boomer, 2006, Persistent Organic Pollutants in Pacific Island Countries (POPs in PICs) – Harnessing Communication for Development Success, Paper in preparation for Presentation at the World Congress on Communication For Suitable Development 2006, Rome, Italy.
AusAID, 2007b, Valuing Pacific Fish, AusAID, Commonwealth of Australian, Canberra, November 2007
DFAT, 2008, www.dfat.gov.au, country information pages [accessed June 2008]
Faulalo, K., 2008, Member of the GEF Pacific Inter Agency Group, UNEP, Pers. Comm., May 2008.
GHD 2003a, PM002: Emergency Response Guidelines, July 2003.
GHD 2003b, PR001: Permitting Schedule Report, October 2003.
GHD 2003c, PM003: Risk Management Plan, July 2003.
GHD 2003d, PM004: Field Operations Procedures, July 2003.
GHD 2004a, PR002: Six Monthly Report, January 2004.
GHD 2004b, PM005: Project Procedures Manual, March 2004.
GHD 2004c, PR004: Chemical Assessment Plan and Manifest, March 2004.
GHD 2004d, PR005: Transport/Logistics Plan, March 2004.
GHD 2004e, PR006: Clean Up Plan, June 2004.
GHD 2005a, PM007: Six Monthly Report – Period March 2004 to November 2004, January 2005.
GHD 2006a Risk Management Audit and Review, Fiji Report, October 2006
GHD 2006b, PM010: Import Permits for First Six PICs, September 2006.
GHD 2007a, PM011: Cleanup Report for the First Six PICs, January 2007.
GHD 2007b, PM012: Cleanup Report for Remaining Six PICs, March 2007.
GHD 2008, PM013: Import Permits for Final PICs, August 2008.
GHD 2009a, PM014: Transport and Logistics Report, March 2009.
GHD 2009b, PM015: Disposal of Shipped Chemicals Report, July 2009.
HK Shipping International Pty Ltd, 2004, Reconnaissance Trip Report (PR003), January 2004.
International Waters Project of the Pacific Islands, 2006a, Technical Report no. 18: An economic evaluation of watershed pollution in Rarotonga, the Cook Islands, SPREP, 2006.
International Waters Project of the Pacific Islands, 2006b, Technical Report no. 28: Economic cost of scenarios for solid waste-related pollution in Palau, SPREP, 2006.
International Waters Project of the Pacific Islands, 2006c, Technical Report no. 33: Economic cost of waste in Tonga, SPREP, 2006.
POPs in PICs Phase II Project Project Completion Report
International Waters Project of the Pacific Islands, 2006d, Technical Report no. 36: Economics of liquid waste management in Funafuti, Tuvalu, SPREP, 2006.
Jell, F., 2008, Narangba Community Action Group, Pers. Comm., September 2008.
Secretariat for Pacific Regional Environment Programme, 2008, Meeting Minutes: Project Coordinating Committee (PCC) meeting, Apia, Samoa, May 2008.
Secretariat for Pacific Regional Environment Programme, 1997, Action Plan for Managing the Environment of the South Pacific Region, 1997-2000, SPREP, Apia, Samoa, April 1997.
Secretariat for Pacific Regional Environment Programme, 1996, Waste Management Action Plan 1997-2000, SPREP, Apia, Samoa, 1996.
Secretariat for Pacific Regional Environment Programme, 2006, Solid Waste Management Strategy for the Pacific Region, SPREP, Apia, Samoa, 2006.
Ritter, L., Solomon, K. R., Forget, J., Stemeroff, M., O’leary, C., 1995, Persistent Organic Pollutants, An Assessment Report on: DDT-Aldrin-Dieldrin-Endrane-Chlordane, Heptachlor- Hexachlorobenze, Metrix-Toxaphene, Polychlorinate Biphenyls, Dioxins and Furans, International Program on Chemical Safety, Inter-Organization Programme for Sound Management of Chemicals, Canada.
United Nations Environment Programme, 2004, Stockholm Convention on Persistent Organic Pollutants; Stockholm Convention website; http://chm.pops.int/Portals/0/Repository/conf/UNEP-POPS-CONF-4-AppendixII.5206ab9e-ca67-42a7-afee-9d90720553c8.pdf
Dr Greg RIPPON Director (Former), Hazardous Waste Section, Department of Environment, Water, Heritage and the Arts
Mr Karl RISSMANN Quarantine Approved Premises, South Queensland, Australian Quarantine Inspection Service
Dr. Daniel ROTHENFLUH Assistant Director, Hazardous Waste Section, Department of Environment, Water, Heritage and the Arts
Mr Ben SALE Manager, Sunshine Coast, Brisbane North Region, Environmental Services, Queensland Environmental Protection Agency
Dr Angelo VALOIS Manager, Technical and International Policy, Technical and International Policy, Department of Agriculture, Fisheries and Forestry
Country Contacts – Cook Islands
Mr. Tauraki RAEA Senior Environment/ODS Officer, Cook Islands National Environment Service
Mr Nga NARANGI Agricultural Officer, Mangaia Island Administration
Ms Antoine NIA Environment Officer, Cook Islands Environment Service
Ms Vavia TANGATATAIA Manager, Compliance & Enforcement Division, Cook Islands National Environment Service
Ms Tania TEMATA Cook Islands Environment Service
Mrs Tuiane TUARA Secretary, Mangaia Island Administration
Mr. Vaitoti TUPA Director, Cook Islands National Environment Service
Country Contacts – Federated States of Micronesia
Dr. Jefferson BENJAMIN Secretary, Department of Health, Education and Social Services
Ms Cynthia EHMES Program Manager, Environment and Sustainable Development Division, Office of Environment and Emergency Management
Ms. Jane GALLEN National Project Coordinator, Department of Health, Education and Social Affairs
Mr. Moses PRETRICK Environmental Health Coordinator, Environmental & Community Health Section, Division of Health Services, Dept. of Health, Education and Social Affairs
Country Contacts – Fiji
ANNEX 1, page 3
Ms Vandana NAIDU Waste Management and Pollution Control Officer, Department of Environment
Mr Epeli NASOME Director of Environment, Ministry of Tourism and Environment
Mrs Razia ZARIFF POPs Project Assistant, Department of Environment
Country Contacts - Kiribati
Mrs Tererei ABETE-REEMA
Director, Environment and Conservation Division, Ministry of Environment, Lands and Agriculture Development
Mr Noketi KAROUA Pollution Control Officer, Ministry of Environment, Land and Agriculture Development
Ms Marii MARAE Environment Inspector, Ministry of Environment, Land and Agriculture Development
Mr Taulehia PULEFOU Pollution Control Officer, Ministry of Environment, Land and Agriculture Development
Mr Farran REDFERN Environment and Conservation Division, Ministry of Environment, Lands and Agriculture Development
Mr TEKAAI HK Logistics Agent
Mr Neri TIAEKE POPs Coordinator, Ministry of Environment, Lands and Agriculture Development
Ms Vika TOFINGA Acting Pollution Control Officer, Environment and Conservation Division, Ministry of Environment, Lands and Agriculture Development
Mr Kautoa TONGANIBEIA Environment Inspector, Environment and Conservation Division, Ministry of Environment, Lands and Agriculture Development
Country Contacts – Nauru
Mr Joseph CAIN Secretary, Ministry of Economics and Foreign Affairs
Elkoga GADABU National Project Coordinator POPs
Mr Tukubu TERDROKO Permanent Secretary, Department of Environment
Mrs Mary THOMA Assistant Director of Environment Projects, Department of Commerce, Industry and Resources
Country Contacts – Niue
Mr John HETUTU Chief Environmental Health, Health Department
Mrs Terri-Anne MOKIA Acting POPs Officer, Department of Agriculture, Forestry & Fisheries
Dr. OKESENE-GAFA Director, Department of Health
Mr Harry PAKA Director (Former), Department of Health
Mr Brendan PASISI Director, Department of Agriculture, Forestry & Fisheries
Mr Hayden TALAGI Environment Officer, Department of Agriculture, Forestry & Fisheries
Ms Natasha TOEONO POPs Project Coordinator, Department of Agriculture, Forestry & Fisheries
Mr Sauni TONGATULE Director of Environment and SPREP Focal Point
Mr Pita VAKAAFI Environment Health Officer, Department of Health
Country Contacts – New Zealand
ANNEX 1, page 4
Mr Howard ELLIS Senior Adviser, Ministry for the Environment
Mr Cedric HORNER Energy and Environment Group, Ministry of Economic Development
Mr John BUNGITAK General Manager, Environment Protection Authority
Mr Stephen LEPTON POPs Coordinator, RMIEPA
Country Contacts – Palau
Mr Donald DENGOKL Assistant Executive Officer, Environmental Quality Protection Board
Country Contacts – Papua New Guinea
Ms Katrina SOLIEN Acting Manager – EIA, Department of Environment and Conservation
Country Contacts – Samoa
Mr Bill CABLE Project Coordinator POPs
Mr. Taulealeausumai LAAVASA MALUA
Assistant Chief Executive Officer, Planning and Urban Management Division, Ministry of Natural Resources and Environment
Ms. Fuatino MATATUMUA Principal POPs/PIC Officer, Ministry of Natural Resources and Environment
Mr. Aiono MOSE POUVI SUA
Chief Executive Officer, Ministry of Foreign Affairs and Trade
Ms. Katenia RASCH Waste Management Officer, Ministry of Natural Resources and Environment
Dr. Ieti TAULEALO Chief Executive Officer, Ministry of Natural Resources and Environment
Country Contacts – Solomon Islands
Mr Moses BILIKI Director, Environment and Conservation Division, Ministry for Forests, Environment and Conservation
Mr Mike HEMMER HK Logistics Agent
Mr Joe HOROKOU Director (Ag), Environment and Conservation Division, Ministry for Forests, Environment and Conservation
Mr Tia MASOLO POPs Coordinator, Ministry of Environment, Conservation and Meteorology
Mr Fred PATISON Chief Environment Officer, Environment and Conservation Division, Ministry of Environment, Conservation and Meteorology
Country Contacts – Tonga
Mr Asipeli PALAKI Head, Department of Environment
Mr Uilou SAMANI Director, Department of Environment
Mrs Suliana N.M. VI N.P.C. Department of Environment
Country Contacts – Tuvalu
Mr Melton TAUETIA Coordinator POPs Environment, Ministry of Natural Resources, Energy and Environment
ANNEX 1, page 5
Mr Mataio TEKINENE Ministry of Natural Resources, Energy and Environment
Ms Susan TUPULAGA Waste Coordinator, Government of Tuvalu
Country Contacts – Vanuatu
Mr Ruben MARKWARD Executive and Planning Officer, Ministry of Agriculture Quarantine Forestry and Fisheries
Mr Kaltuk KALMOR Senior Laboratory Technician, Quarantine and Inspection Services
Mr John SMITH HK Logistics Agent
Mr Benuel TARILONGI Director, Department of Quarantine and Inspection Services
Mr Albert TOA Department of Quarantine and Inspection Services
Mr Timothy TUMUKON Principal Plant Protection Officer, Department of Quarantine and Inspection Services
Mr Michael VARI POPs Coordinator
Mr Jeffrey WILFRED Director General, Ministry of Quarantine, Agriculture, Fisheries and Forestry
Multi-lateral Contacts
Mr Keneti FAULALO GEF PAS coordinator, United Nations Environment Programme
Mr Andrew HUDSON United Nations Development Programme
Mr Frank MOSER Associate Programme Officer, UNEP Chemicals
Mr David OGDEN Executive Coordinator, Secretariat of the Stockholm Convention on POPs, United Nations Environment Programme
Dr. David PIPER Task Manager (POPs enabling activities), Division of GEF Coordination, United Nations Environment Programme
Ms Elena SOBAKINA UNEP Chemicals
Mr Anil SOOKDEO Programme Specialist - Montreal Protocol Unit, UNDP Regional Centre in Bangkok
Mr Patrick TUIMALEALI'IFAN
United Nations Development Programme
Australian Communication Strategy Stakeholders
Ms Lyn ALLEN Queensland Premier’s Department
Dr Peter BROTHERTON Australian Conservation Foundation
Mr Jason COLLINS Greenpeace
Ms Mary DONLEVY Senior Project Manager and Environmental Health Adviser, Environmental Health Unit, Queensland Department of Health
Mr Drew HUTTON Australian Greens
Mrs Fran JELL Narangba Community Action Group
Mr Brad KITCHEN Brisbane Port Authority
Dr Mariann LLOYD-SMITH National Toxics Network
Ms Jude MUNROE Brisbane City Council
ANNEX 1, page 6
ANNEX 1, page 7
Mr Rob NOBLE Caboolture Shire Council
Mr Dave PERRY Maritime Union of Australia
Mr James PURTILL Queensland Environmental Protection Agency
Mr Andrew ROUSE World Wide Fund for Nature
Mr Cam WALKER Friends of the Earth
Ms Felicity WISHART Queensland Conservation Council
Figure A4.1 Project Management Structure
• Review risk and environmentalmanagement of the Project
• Review of all technical issuesassociated with hazardous waste management & disposal
• Review and audit the plans andperformance of the cleanup and disposal operations
• Provide guidance on therequirements of Basel/Wagaini Conventions
Technical DirectorDr Peter Nadebaum
Allocated time: 1 months
Project Manager (PM)Dr Alison Baker
Allocated time: 3 months
• Provide overall management and strategic responsibility• Provide advice and reports to AusAID Canberra• Support TL in monitoring project inputs and outputs• Prepare the Quality, Risk and Environmental Management Plans;
Ensure insurances in place• Ensure adherence to the Quality, Risk and Environmental
Management Plans• Ensure adequate project resources• Prepare team member contracts and briefings, including
Subcontract Agreements• Attend senior management meetings and PCC
Authority to commit funds and resources. Report to GHD ManagingDirector and MC for project financial performance. Full responsibility
Authority for management of all activities in PICs
Team Leader(TL)/Co-ordinatorPhilip Baker
Allocated time: 7 months
• Manage day to day activities in Australia• Report to/Liaise with AusAID on technical/
logistics issues of Project (Main Contact Point for AusAID)
• Coordinate and integrate all project activities for clean up, transport and disposal operations
• Provide technical and personal support to team members
• Implement Quality Plan, Risk ManagemenPlan, Environmental Plan
• Manage Project risks• Control sub-contractors for cleanup transport
and disposal• Obtain and ensure compliance with Conventions
and country-country agreements• Report to PM on Project Activities
Contractual
Day to Day Logistics
Subcontractors
Hatlar Environment
• Review and update existing chemical manifests• Prepare and implement assessment program of PCBs, POPs and intractable
pesticides in PICs, prepare repackaging plan in conjunction with HKShipping
• Implement repackaging program in association with HK & BCD• Participate in Joint Management Committee/Report to PMC
HK Shipping
Provide shipping & logistical advice on shipping through PICs• Provide advice to Hatlar Team on locally available equipment & unloading/
loading facilities• Liaise with AMC, Hatlar and BCD to develop most cost effective,
environmentally sound transport plan• Prepare shipping documentation, includes permits/licenses• Provide other logistics support as required (chartered vessels, air, helicopter,
Medical support to remote locations)• Participate in Joint Management Committee/Report to AMC
BCD Technologies
• Participation in the Project Joint Management Committee to ensurelogistical arrangements of the Project suit BCD technologies capacityto receive & treat the wastes in a timely manner/Report to AMC
• Provide input to the planning phases of the Project as appropriate, including experience in managing PCB disposal from transformers, washing procedures, & the information required in manifests to confirm acceptability
• Receipt of wastes from EPA and DG licensed vehicles. BCD willprovide labour and equipment to unload the waste, confirm manifest weights of delivered material transfer to the designated storage areas while awaiting destruction.
• Complete transport and EPA paperwork• Destruction of PCBs, POPs Pesticides, and other Intractable Pesticides using
the Base Catalysed Dechlorination, High Temperature Plasma Arc or Thermal Desorption technologies
• Provide a certificate of destruction to confirm the destruction of the waste
Administration and Support - AustraliaIntermittent inputs throughout Project duration
Project AdministratorMichelle de Silva
• Arrange international travel• Manage mobilisation & demobilisation• Provide personnel administration &
pastoral care• Manage report production in Australia
Authority as delegated by PM
Finance ManagerBill Lai
• Provide home office financial control• Prepare invoices
Full authority for home office management,including financial control and procurement
Technical Support
Hazmat/Emergency Response/OH&S AdviserPaul Clarey
Legal Systems Adviser (LEP)Stefanie Pidcock
Brisbane Based Hazardous Waste SpecialistSteven Trainer
Technical Support (LEP)Emily Hartson
Complete specific tasks as requested by PM/TL Figure A4.1 Project Management Structure
• Review risk and environmentalmanagement of the Project
• Review of all technical issuesassociated with hazardous waste management & disposal
• Review and audit the plans andperformance of the cleanup and disposal operations
• Provide guidance on therequirements of Basel/Wagaini Conventions
Technical DirectorDr Peter Nadebaum
Allocated time: 1 months
Project Manager (PM)Dr Alison Baker
Allocated time: 3 months
• Provide overall management and strategic responsibility• Provide advice and reports to AusAID Canberra• Support TL in monitoring project inputs and outputs• Prepare the Quality, Risk and Environmental Management Plans;
Ensure insurances in place• Ensure adherence to the Quality, Risk and Environmental
Management Plans• Ensure adequate project resources• Prepare team member contracts and briefings, including
Subcontract Agreements• Attend senior management meetings and PCC
Authority to commit funds and resources. Report to GHD ManagingDirector and MC for project financial performance. Full responsibility
for the project
Project Manager (PM)Dr Alison Baker
Allocated time: 3 months
Management Committee (MC)
• Provide overall management and strategic responsibility• Provide advice and reports to AusAID Canberra• Support TL in monitoring project inputs and outputs• Prepare the Quality, Risk and Environmental Management Plans;
Ensure insurances in place• Ensure adherence to the Quality, Risk and Environmental
Management Plans• Ensure adequate project resources• Prepare team member contracts and briefings, including
Subcontract Agreements• Attend senior management meetings and PCC
Authority to commit funds and resources. Report to GHD ManagingDirector and MC for project financial performance. Full responsibility
Authority for management of all activities in PICs
Team Leader(TL)/Co-ordinatorPhilip Baker
Allocated time: 7 months
• Manage day to day activities in Australia• Report to/Liaise with AusAID on technical/
logistics issues of Project (Main Contact Point for AusAID)
• Coordinate and integrate all project activities for clean up, transport and disposal operations
• Provide technical and personal support to team members
• Implement Quality Plan, Risk ManagemenPlan, Environmental Plan
• Manage Project risks• Control sub-contractors for cleanup transport
and disposal• Obtain and ensure compliance with Conventions
and country-country agreements• Report to PM on Project Activities
Contractual
Day to Day Logistics
Subcontractors
Hatlar Environment
• Review and update existing chemical manifests• Prepare and implement assessment program of PCBs, POPs and intractable
pesticides in PICs, prepare repackaging plan in conjunction with HKShipping
• Implement repackaging program in association with HK & BCD• Participate in Joint Management Committee/Report to PMC
HK Shipping
Provide shipping & logistical advice on shipping through PICs• Provide advice to Hatlar Team on locally available equipment & unloading/
loading facilities• Liaise with AMC, Hatlar and BCD to develop most cost effective,
environmentally sound transport plan• Prepare shipping documentation, includes permits/licenses• Provide other logistics support as required (chartered vessels, air, helicopter,
Medical support to remote locations)• Participate in Joint Management Committee/Report to AMC
BCD Technologies
• Participation in the Project Joint Management Committee to ensurelogistical arrangements of the Project suit BCD technologies capacityto receive & treat the wastes in a timely manner/Report to AMC
• Provide input to the planning phases of the Project as appropriate, including experience in managing PCB disposal from transformers, washing procedures, & the information required in manifests to confirm acceptability
• Receipt of wastes from EPA and DG licensed vehicles. BCD willprovide labour and equipment to unload the waste, confirm manifest weights of delivered material transfer to the designated storage areas while awaiting destruction.
• Complete transport and EPA paperwork• Destruction of PCBs, POPs Pesticides, and other Intractable Pesticides using
the Base Catalysed Dechlorination, High Temperature Plasma Arc or Thermal Desorption technologies
• Provide a certificate of destruction to confirm the destruction of the waste
Administration and Support - AustraliaIntermittent inputs throughout Project duration
Project AdministratorMichelle de Silva
• Arrange international travel• Manage mobilisation & demobilisation• Provide personnel administration &
pastoral care• Manage report production in Australia
Authority as delegated by PM
Finance ManagerBill Lai
• Provide home office financial control• Prepare invoices
Full authority for home office management,including financial control and procurement
Technical Support
Hazmat/Emergency Response/OH&S AdviserPaul Clarey
Legal Systems Adviser (LEP)Stefanie Pidcock
Brisbane Based Hazardous Waste SpecialistSteven Trainer
Technical Support (LEP)Emily Hartson
Complete specific tasks as requested by PM/TL
Administration and Support - AustraliaIntermittent inputs throughout Project duration
Project AdministratorMichelle de Silva
• Arrange international travel• Manage mobilisation & demobilisation• Provide personnel administration &
pastoral care• Manage report production in Australia
Authority as delegated by PM
Finance ManagerBill Lai
• Provide home office financial control• Prepare invoices
Full authority for home office management,including financial control and procurement
Finance ManagerBill Lai
• Provide home office financial control• Prepare invoices
Full authority for home office management,including financial control and procurement
Technical Support
Hazmat/Emergency Response/OH&S AdviserPaul Clarey
Legal Systems Adviser (LEP)Stefanie Pidcock
Brisbane Based Hazardous Waste SpecialistSteven Trainer
Technical Support (LEP)Emily Hartson
Complete specific tasks as requested by PM/TL
PIC Governm entsPIC Agencies
PIC GovernmentsPIC Agencies
GOA
AusAID
GOA
AusAID
Com munications Team
Comm unications Team
Australian Comm unities/Stakeholders
Australian Communities/Stakeholders
QueenslandEPA
QueenslandEPA
Australian Managing ContractorAustralian M anaging Contractor
Project ManagerProject Manager
Team Leader/CoordinatorTeam Leader/Coordinator
Technical ReviewTechnical Review
Technical SupportTechnical Support
Hatlar Environmental
Hatlar Environm ental
Clean Up/Repackaging
Contractor
C lean Up/Repackaging
Contractor
HK Shipping InternationalHK Shipping International
Transport Logistics
Contractor
Transport Logistics
Contractor
BCDTechnologies
BCDTechnologies
Disposal Contractor
Disposal Contractor
SUBCONTRACTORS
FIGURE A1.1: PROJECT STRUCTURE
Environment Australia
Pacific Island Com munities
Pacific Island Comm unities
Joint M anagem ent Com mitteeJoint Managem ent Comm ittee
AMCAMC HatlarHatlar HKSHKS BCDBCD
AgriqualLaboratories (NZ)
AgriqualLaboratories (NZ)
Laboratory
Support
Laboratory
Support
PCC
SPREP
PIC Governm entsPIC Agencies
PIC GovernmentsPIC Agencies
GOA
AusAID
GOA
AusAID
Com munications Team
Comm unications Team
Australian Comm unities/Stakeholders
Australian Communities/Stakeholders
QueenslandEPA
QueenslandEPA
Australian Managing ContractorAustralian M anaging Contractor
Project ManagerProject Manager
Team Leader/CoordinatorTeam Leader/Coordinator
Technical ReviewTechnical Review
Technical SupportTechnical Support
Australian Managing ContractorAustralian M anaging Contractor
Project ManagerProject Manager
Team Leader/CoordinatorTeam Leader/Coordinator
Technical ReviewTechnical Review
Technical SupportTechnical Support
Hatlar Environmental
Hatlar Environm ental
Clean Up/Repackaging
Contractor
C lean Up/Repackaging
Contractor
Hatlar Environmental
Hatlar Environm ental
Clean Up/Repackaging
Contractor
C lean Up/Repackaging
Contractor
HK Shipping InternationalHK Shipping International
Transport Logistics
Contractor
Transport Logistics
Contractor
HK Shipping InternationalHK Shipping International
Transport Logistics
Contractor
Transport Logistics
Contractor
BCDTechnologies
BCDTechnologies
Disposal Contractor
Disposal Contractor
SUBCONTRACTORS
FIGURE A1.1: PROJECT STRUCTURE
Environment Australia
Pacific Island Com munities
Pacific Island Comm unities
Joint M anagem ent Com mitteeJoint Managem ent Comm ittee
AMCAMC HatlarHatlar HKSHKS BCDBCD
Joint M anagem ent Com mitteeJoint Managem ent Comm ittee
AMCAMC HatlarHatlar HKSHKS BCDBCD
AgriqualLaboratories (NZ)
AgriqualLaboratories (NZ)
Laboratory
Support
Laboratory
Support
PCCPCC
SPREPSPREP
ANNEX 2: PROJECT CHRONOLOGY KEY DATES
Date Event Milestone / Output
2002
18 Nov Contract 11454 (for POPs in PICs Communication Strategy Implementation) between AusAID and GHD signed and project commencement
2003
18 Feb Report submitted to Environment Australia outlining the results of the Public Consultation
11 Apr Contract 11533 (for POPs in PICs Phase II Scheduled POPs and Intractable Pesticide Disposal) between AusAID and GHD signed and project commencement
09 Aug Team mobilised to Samoa, Fiji, Vanuatu and Cook Islands to complete reconnaissance visits
22 Aug Project Procedures Manual, including Emergency Response Plan, Risk Management Plan and Field Operating Procedures submitted to AusAID
MS 1
14 Sep Team mobilised to Marshal Islands, Palau, FSM to complete reconnaissance visits
11 Oct Team mobilised to Kiribati, Nauru, Niue, Tonga, Tuvalu and Fiji to complete reconnaissance visits
17 Oct Permitting Schedule Report submitted to AusAID MS 2
31 Oct Reconnaissance visits to all PICs completed (with exception of Solomon Islands)
2004
11 Feb Project Coordinating Committee (PCC) meeting held in Port Vila, Vanuatu
16 Mar Transport / Logistics Plan submitted to AusAID MS 5
16 Mar Chemical Assessment Plan and Manifest submitted to AusAID MS 3
12 May Annual Plan 2004-2005 submitted to AusAID
17 Jun Clean Up Plan submitted to AusAID MS 4
25 Jun Team mobilised to Samoa for clean up and repackaging
05 Jul Samoa clean up and repackaging completed
22 Aug Team mobilised to Fiji for clean up and repackaging
04 Sep Fiji clean up and repackaging completed
03 Oct Team mobilised to Tonga for clean up and repackaging
08 Oct Tonga clean up and repackaging completed
08 Oct Team mobilised to Cook Islands for clean up and repackaging
16 Oct Cook Islands clean up and repackaging completed
01 Nov Team mobilised to FSM for clean up and repackaging
09 Nov Team mobilised to Marshall Islands for clean up and repackaging
11 Nov Marshall Islands clean up and repackaging completed
17 Nov Samoa special import permits issued
ANNEX 2, page 1
Date Event Milestone / Output
22 Nov FSM clean up and repackaging completed
14 Dec POPs shipment exported from Samoa
2005
04 Jan Samoa POPs shipment arrived at BCD facility
10 Jan Six Monthly Report Period March to September 2004 submitted
09 Mar Fiji special import permits issued
09 Mar Cook Islands special import permits issued
11 Mar Tonga special import permits issued
02 Mar Second PCC meeting held in Wellington, New Zealand
10 Apr Niue clean up and repackaging completed
30 Apr Tuvalu clean up and repackaging completed
09 Jun Nauru clean up and repackaging completed
17 Jun Final destruction certificate issued for Samoa POPs
12 Jul POPs shipment exported from Fiji
29 Sep Fiji shipment arrived at BCD facility
05 Oct Third party emissions monitoring undertaken at BCD during destruction of POPs
10 Oct POPs shipment exported from Cook Islands
07 Nov POPs shipment exported from Tonga
21 Nov Tonga POPs shipment arrived at BCD facility
19 Dec Vanuatu clean up and repackaging completed
21 Dec Cook Islands POPs shipment arrived at BCD facility
2006
06 Feb Marshall Islands special import permits issued
01 Mar Tuvalu special import permits issued
10 Mar POPs shipment exported from Tuvalu
24 Mar POPs shipment exported from Marshall Islands
29 Mar Cleanup Report for remaining 6 PICs submitted to AusAID MS 7b
10 Apr Tuvalu POPs shipment arrived at BCD facility
11 Apr Marshall Islands POPs shipment arrived at BCD facility
01 May POPs shipment exported from FSM
04 May FSM special import permits issued
22 Jul Solomon Islands clean up and repackaging completed
13 Jun Final destruction certificate issued for Fiji POPs
01 Aug FSM POPs shipment arrived at BCD facility
14 Aug Niue special import permits issued
23 Aug Final destruction certificate issued for Cook Island POPs
ANNEX 2, page 2
Date Event Milestone / Output
23 Aug Final destruction certificate issued for Tonga POPs
19 Sep Cleanup Report for the first 6 PICs submitted to AusAID MS 7a
21 Sep POPs shipment exported from Niue
22 Sep Import Permit for First 6 PICs Report submitted to AusAID MS 6a
19 Oct Final destruction certificate issued for Marshall Islands POPs
19 Oct Final destruction certificate issued for Tuvalu POPs
25 Oct Niue POPs shipment arrived at BCD facility
26 Nov Final destruction certificate issued for FSM POPs
08 Dec Kiribati special import permits issued
26 Dec POPs shipment exported from Kiribati
2007
19 Jan Kiribati POPs shipment arrived at BCD facility
13 Feb Solomon Islands special import permits issued
17 Feb POPs shipment exported from Solomon Islands
17 Apr Solomon Islands POPs shipment arrived at BCD facility
25 May Second third party emissions monitoring undertaken at BCD
28 May Final destruction certificate issued for Kiribati POPs
09 Jul Third party emissions monitoring for BCD indicated a breach of trade waste permit conditions. Destruction of remaining POPs in PICs materials halted for six months until all parties were satisfied the issue would not reoccur.
23 Jul Final destruction certificate issued for Niue POPs
14 Dec Cabwater provides letter stating they are satisfied with BCD’s operational procedures
2008
09 Jan QEPA (Sunshine Branch) provides letter stating they are satisfied with BCD’s operational procedures
18 Jan Vanuatu deposits its Instrument of Ratification for the Waigani Convention
22 Jan QEPA (Brisbane Branch) provides letter stating they are satisfied with BCD’s operational procedures
16 Feb Resumption of treatment of POPs in PICs wastes at BCD
14 Apr Third party emissions monitoring undertaken at BCD
24 Apr Final destruction certificate issued for Solomon Islands POPs
22 May Vanuatu special import permits issued
01 May Final PCC meeting held in Apia, Samoa
05 Aug POPs shipment exported from Vanuatu
21 Aug Import Permit for Final 6 PICs Report submitted to AusAID MS 6b
28 Aug Vanuatu POPs shipment arrived at Brisbane Port after delays
19 Sep Vanuatu PCB contaminated soil container arrives at Steritech for treatment
ANNEX 2, page 3
ANNEX 2, page 4
Date Event Milestone / Output
22 Sep First Vanuatu POPs container arrived at BCD facility
2009
06 Jan Fourth third party emissions monitoring undertaken at BCD
09 Feb Fifth and final Vanuatu POPs container arrived at BCD Technologies
06 Mar Transport and Logistics Completion Report submitted to AusAID MS 8
22 May Final destruction certificate issued for Vanuatu POPs
14 Aug Disposal of Shipped Chemicals Report submitted to AusAID MS 9
2010
Sept Project Completion Report Submitted to AusAID
ANNEX 3: PROJECT COMPLETION WORKING PAPERS
3a Logical Framework Matrix
3b PCC Meeting Minutes, May 2008
3c POPs Destruction Summary
3d Project Greenhouse Emissions Estimate
POPs in PICs Disposal ANNEX 3a
ANNEX 3a: LOGICAL FRAMEWORK MATRIX
NARRATIVE SUMMARY VERIFIABLE INDICATORS MEANS OF VERIFICATION ASSUMPTIONS
GOAL
To reduce the threat posed by Persistent Organic Pollutants (POPs) and related chemicals toward the environment and human health in PICs.
PURPOSE
To dispose of Polychlorinated biphenyls (PCBs), and PCB-contaminated solvent from transformers, small quantities of PCB-contaminated soil, stockpiled organochlorine pesticides including scheduled POPs and other intractable pesticides (mainly organochlorins and organophosphates), and unidentified pesticides considered likely to fall into those categories in participating PICs.
Quantity: PIC monitoring reports, audit report on destruction operation, and project technical report.
Quality: Detailed description of government roles and extent of participation given in project technical report.
Time: Project Duration.
Acceptance of clean-up plans by partner government representative and acceptance of project reports by AusAID.
Cooperation and formal agreements obtained from all participating governments.
COMPONENT 1: IN-COUNTRY IDENTIFICATION AND CONFIRMATION OF POPS FOR REMOVAL (SPREP)*
COMPONENT 2: POPS COLLECTION, PACKAGING AND SHIPPING TO DISPOSAL FACILITY
Output 2.1 The AMC will have made contact with Department of Environment and Heritage to initiate the permitting processes required under the Basel and Waigani Conventions, and will have also facilitated the completion of country-to-country agreements that may be required for in-transit activities.
Quantity: Checklist prepared by AMC of all required agreements. Letters of agreement or permit applications submitted by each PIC to Australia, and other governments as required.
Completeness of checklist confirmed by AusAID, in consultation with Department of Environment and Heritage.
All required agreements, as per checklist.
Assistance by Partner government representatives in each PIC.
* Component I of the Project was undertaken by SPREP and has largely been completed. Remaining activities for SPREP involve liaison with PICs and monitoring of AMC activities.
NARRATIVE SUMMARY VERIFIABLE INDICATORS MEANS OF VERIFICATION ASSUMPTIONS
Output 2.2: Basel, Waigani or Special Permits obtained, with agreements within and between all participating PICs and Australia.
Quantity: Permits issued by Australia, and other governments as required
Signed permits, crosschecked against checklist.
Governments (especially Australia) agree to the shipping and disposal operation.
Output 2.3: All PCBs, intractable pesticides and associated contaminated materials packaged by Clean-up contractor and prepared for shipping, within each PIC.
Quantity: Audit reports for each PIC by SPREP to confirm operations completed.
Sign-off of Audit reports by Partner government representative.
Assistance by Partner government representatives in each PIC. Also, availability of local paid labour.
Output 2.4: Shipping agreements finalised between the AMC and shipping company or companies.
Quantity: Signed agreements. Six-monthly reports by AMC. A suitable shipping company and/or charter vessel is identified.
Output 2.5: All POPs containers with PCBs, contaminated transformers, contaminated soils and other intractable pesticides collected from each PIC.
Quantity: Containers removed. Six-monthly reports by AMC.
Shipping Manifest and Paperwork provided.
No problems due to natural hazards (e.g. cyclones), labour disputes, etc.
Output 2.6: All POPs containers delivered to, and off-loaded at port of final destination.
Quantity: Containers off-loaded at destination port.
Six-monthly reports by AMC.
Shipping Papers/Customs documentation
No problems due to natural hazards (e.g. cyclones), labour disputes, etc.
COMPONENT 3: POPS DESTRUCTION
Output 3.1: AMC will have obtained any permits or approvals required at a State level for POPs import and disposal (NB: This output is a pre-requisite for the import permits covered under Output 2.2).
Quantity: Permits obtained (or written confirmation that permits are not required).
Signed permits. Disposal facility already has permits in place to accept the waste. Import permits will be granted provided activities comply with appropriate standards (e.g. IMO packaging regulations).
Output 3.2: All POPs containers transported to disposal facility or other agreed storage facility in receiving country.
Quantity: Containers arrive at BCD Technologies
Six-monthly reports by AMC.
Delivery and acceptance receipts.
No problems due to natural hazards (eg cyclones), labour disputes, etc.
NARRATIVE SUMMARY VERIFIABLE INDICATORS MEANS OF VERIFICATION ASSUMPTIONS
Output 3.3: All POPs and associated contaminated materials successfully disposed.
Quantity: Treatment processes carried out in accordance with agreed protocols.
Six-monthly and exception reports by AMC and SPREP.
Treatment records provided.
Plant operates satisfactorily.
COMPONENT 4: PROJECT AND CONTRACT MANAGEMENT
Output 4.1: Effective project management will have operated throughout all of the Component 2 and 3 activities, including regular project reporting (six-monthly and exception reports and Annual Plan to AusAID), facilitation of PCC.
AMC remains under contract to AusAID throughout the project.
Output 4.2: Effective contract management, and liaison with stakeholders including participating governments, AusAID, Department of Environment and Heritage.
Quantity: Contract and other agreements in accordance with project work programme and timeframes.
Quality: Six-monthly reports to be prepared in accordance with AusGuide and other quality standards.
Time: Six-monthly.
Six-monthly and exception reports.
Output 4.3: Management of public and civil liability issues.
Quantity: Responsibilities clearly spelt out in all contract documents, along with documented evidence of adequate liability cover.
Emergency Response Plan.
Evidence of contractor liability cover. Insurance cover available for this type of operation.
Output 4.4: Project completion report prepared, including coordination of technical inputs from SPREP.
Quantity: Project completion report.
Quality: Report to be prepared in accordance with AusGuide and other quality standards.
Time: Prepared and submitted within two months of project completion.
Acceptance of PCR by AusAID All operations completed successfully
ANNEX 3b: PCC MEETING MINUTES, MAY 2008
Meeting Minutes PROJECT COORDINATING COMMITTEE (PCC) MEETING Persistent Organic Pollutants (POPs) in Pacific Island Countries (PICs), Phase II – Scheduled POPs and Intractable Pesticide Disposal Project
AusAID Funded Initiative
1 May 2008, SPREP Offices, Apia, Samoa 8:30 AM – 4:30 PM Chair: Dr Frank Griffin, SPREP
95. Opportunity to certify & train staff in country to handle, manage, clean up
chemicals
96. Issue of POPs being identified now that project nearing completion (but this is not
the end of the commitment)
97. Identified pesticides have been put in garbage and found in landfill (related to
building good storage facilities in countries)
98. Some buried POPs collected but there are still some left
SESSION FOUR
Fitting POPs in PICs into the Broader Chemical Agenda
99. The Secretariat presented the revised 2009-2010 work program for the Waigani
Convention to show the participants areas of possible linkages in light of the STAC
2 and PRC Meeting outcome results.
FLOOR DISCUSSIONS
100. Query: GHD queried whether Activity 1 (development of frameworks and
legislations) was going to be handled on a regional or nation-by-nation level and of
the hazardous problems identified, which one was the highest priority in country.
Members responded that all on the list were identified as priorities, including:
Non-POPs such as school lab chemicals, industrial
chemicals, and organics with metal content that could not
be included in the Project
ULABs
Lead acid batteries
e-waste
Medical waste, such as infectious waste
ANNEX 3b, Page 18
Pharmaceuticals
Solid waste management issues, such as landfills and waste
collection
The question was posed on what assistance was required –
101. Query: Would the POPs in PICs approach be best suited to solve these problems?
AusAID had asked what other issues could be tackled under POPs in PICs bearing
in mind the best use of resources.
102. Answer: For ULABS, some countries were already doing something about it
through the country by country approach (e.g.: Cook Islands is working on shipping
to NZ, Vanuatu is in the process of shipping to Australia, RMI is also processing
their material through to Australia) but e-waste can be looked at using the POPs in
PICs model/approach.
103. PNG: There is a huge pharmaceuticals problem in PNG but the health dept were
burning them.
104. Hatlar: stated that all incinerators seen on island were not suitable for burning
pharmaceuticals. Hatlar also mentioned that they were very worried about
thermometers being destroyed in these incinerators as the mercury contained within
them was highly dangerous. These and other chemicals (school chemicals) could
best be treated using the regional (i.e.: POPs in PICs) approach.
105. GHD: Suggested community awareness and school awareness as some of the issues
that came up discussions.
106. KBR : Countries should look at the threat - which was biggest in terms of volume
or health risk.
107. Samoa stated that they were looking at conducting inventories of unknown or
obsolete chemicals and were looking at including NGOs, and other relevant
stakeholders to try and gather as much information as possible. They were also
trying to build capacity of environmental personnel in order for them to train
ANNEX 3b, Page 19
108. She also said there were also unknown hot spots as well as the ones identified in the
previous POPs in PICs and inventory of unknown sites and the need for
rehabilitation were other issues of priority. Another issue for Samoa was the need
to set up a centralized database to collect the data.
109. Secretariat pointed to the SAICM meeting, which identified priorities on legislation,
capacity building, development of infrastructure and gathering of data as an avenue
for which Samoa’s concerns could be addressed.
110. Secretariat (Mark Ricketts) stated that the POPs in PICs project was very focused
on the high risk issues and focused on the “go in & get it out” approach. In this
respect the project was very successful. Unfortunately most of the other
suggestions as listed on the list of priority issues were going to be much harder
(e.g.: data, legislation, institutional strengthening) and in terms of AusAID using the
POPs in PICs model, we also have to look at how they see it as a success. He said
that what POPs in PICs lacked was the ongoing system of management and that the
glaring next phase would be for people to be trained (especially Agricultural
Department personnel on what to buy and what not to). While the POPs and PICs
was a good model for POPs chemicals, he didn’t see the model could be easily
applied to other chemicals which are less well defined - but rather to build on the
model with an ‘ongoing funding and management’ if applied to other chemicals or
wastes. He suggested looking at building in of taxes as a way of getting income to
perhaps fund some on the ongoing in-country activities.
111. Secretariat stated that the need for legislation and frameworks were already outlined
in NIPs but there were no legislations to back up implementation. He said there
could be so many problems happening in country but there is also no commitment
in country to keep the sustainability of the project.
112. GHD: Suggested that Customs Department needed to be strengthened to stop more
POPs coming in. Secretariat stated that because of the lack of legislations, customs
has limited power.
ANNEX 3b, Page 20
113. UNEP (Keneti): Asked that if the issue of legislation and frameworks cut across
environment areas, then what’s stopping countries implementing change right now
without any outside intervention, i.e. putting legislations in place? What are the
issues that are stopping countries from putting legislations in place?
114. PNG: PNG has 19 provinces and the law gives a lot of power in provinces. To
develop legislations they have to collect information and consultations must be
wide spread to cover ALL stakeholders (NGOs, industries, pubic etc.), which would
be a very costly exercise.
115. Samoa: Various Government ministries have their own legislations and whatever is
put forward for enforcement on the environmental side, other ministries come up
with their own issues. For example, Health says they had their own legislation to
deal with their own waste and Environment has no say in it. For example, the
medical waste incinerator is under the health legislation so Environment cannot say
anything about it.
116. Solomons: Similar to PNG in terms of conducting national consultations. However,
a unique issue to SI is that whilst government realizes waste is an important issue,
when the crunch comes (i.e.: to actually put money into activities/projects) –
government chooses other issues as priority for funding, not waste. This is where
outside intervention is needed.
117. PNG: There were also other sectors/agencies that manage other chemical so to
develop a comprehensive legislation they would also have to review or check other
sectors legislation to ensure all chemicals were covered under the one legislation.
118. GHD: Mentioned Vanuatu’s case where legislation was not strong enough to issue a
fine and they contacted the Australian government and asked for assistance to
develop Vanuatu framework.
119. Australia: All government legislations were available freely off the website and
anecdotally countries such as Singapore, Malaysia have copied their regulations and
modified it slightly for their own jurisdictions. They’ve found industries that have
mentioned that regulations utilized by these countries were exactly the same as
ANNEX 3b, Page 21
120. PNG: There are also political issues. People below them have to be informed
enough to convince the politicians and this is all related to the consultative process
which again PNG has mentioned as a very costly and time consuming exercise.
121. Secretariat: Unless you have a package that includes community consultations etc,
legislation by itself is just another piece of paper.
122. Australia: Supported the point by Secretariat and stressed the importance of having
legislations that deal with hazardous waste that can link in with a Customs Act.
123. Kiribati: Legislations have impacts on the traditional way of living. People are not
used to practicing what is in the legislations. When environment department asks
them to stop rubbishing, people ask the environment department to come and get
the rubbish off them because they were not used to not rubbishing. It’s an exercise
of changing attitudes and having the proper legislations to back it up.
124. Secretariat said that if they were piloting a project for medical waste, e-waste,
asbestos, etc. the same approach as the POPs in PICs Project could be applied,
however to ensure sustainability of the outcomes, the issues identified by countries
in regard to legislative short-falls have to be addressed too. It will take time but
flexibility must be allowed in order for island people to become used to the issues
identified.
125. Australia: Pointed to the discussions over the past 3 days– if there is a priority that
was a common issue, then that could be tackled as a regional issue in a new project
but saw the ‘rolling over activities’ approach as perhaps not so practical. He stated
that during the meetings, he did not hear the delegates as a whole clearly highlight
any particular issues, for example that batteries were a major priority in the region
and needed to be removed. It also seemed like different countries have different
needs and different timelines for them to be implemented.
ANNEX 3b, Page 22
126. GHD : GHD would like to see sustainability of the project outcomes, and in terms
of POPs sustainability, what we are hearing is that 1) legislations need to come in 2)
capacity building of countries to manage and understand POPs in the future is
required.
127. Vanuatu: Indicated that one components to be considered under sustaining the
outcomes of the project should be to ensure any further POPs identified subsequent
to the POPs in PICs Project can be included in a future project. Vanuatu stated that
as clearly shown in the GHD presentation, given ample time, more POPs are likely
to be found. It is likely that there are still things worth removing out there. Vanuatu
also noted that they were unclear on what to do about the site that had been cleared,
but still remain contaminated / uninhabitable.
128. UNEP: Stated that they are seeing the need for a more coordinated overall program
on the management of waste as a way of ensuring a longer-term approach. As a way
forward, we have to look across the board in building capacity in handling all
wastes under different conventions. He talked about the GEF PAS, including 3
programs relating to POPs and hazardous waste including: 1) Monitoring program
that builds capacity of labs to monitor chemicals (to be done by USP); 2) DDT
alternatives (Micronesian countries only); and 3) Integrated Management of Solid
Waste, Hazardous Waste and POPs. He also mentioned that countries had to
identify priorities in the development of the program and hoped that the POPs in
PICs team would be involved in the process.
129. GEF PAS identified only 8 countries in the Integrated Management of Solid and
Hazardous Wastes and POPs. $3.5 Mil would be available for this component of the
GEF PAS. He also pointed to the AFD and that UNEP were already meeting EU in
Paris on linkages between all these different programs. He acknowledged the group
exercise and the resulting text (see Group Presentation session) as the best way to
address the gaps in the way forward.
130. Secretariat : These projects required co-financing and instead of it putting countries
off that they look at using AusAID commitment to the region for the co-financing
ANNEX 3b, Page 23
131. Tonga stated that they had already submitted a paper for the GEF PAS and
wondered if that had been approved. UNEP confirmed the approval of GEF PAS
and only 4 PIFs were acknowledged to have gone under the GEF PAS. All other
PIFs were still under development. $3.5 Mil was capped in relation to the number
of countries and they were currently seeking co-financing to cover other countries.
132. Secretariat asked for clarification in developing PIFs, was there to be one PIF that
covered everything or each country was required to do a PIF. UNEP indicated that
multiple countries would be under one PIF, but the worry was that national issues
would be lost if there’s going to be a regional PIF.
133. UNEP: This goes back to the discussion on what is regional and what is national
priority and countries in designing programs should be very wary of that. National
priorities should not be lost and UNEP has taken this on board, therefore hidden in
the title is “implementing the NIPs”.
134. UNEP: Projects are still counted and activities are dependent on what countries say
are priorities. Project activities will be implemented on the ground even though the
PIF may appear regional.
135. UNEP: In the POPs monitoring program, there are national priorities and activities
but they also have to acknowledge that equipment and capacity are not in existence
in country. This is where regional expertise will be required so national priorities
are not diluted but effectiveness of using resources will be through the use of
synergistic approaches.
136. GHD asked UNEP if the countries present that were not on the GEF PAS list could
be included under the UNEP program. UNEP stated that when this was developed,
these were the only countries that highlighted waste as a priority and therefore
countries who were not listed, did not bring up waste as a priority. POPs is not
subject to the RAF – so it is not an allocation specifically per country. Secretariat
responded that the work program had been drawn up by an outside team.
ANNEX 3b, Page 24
137. Samoa asked under POP monitoring activities how the $517,000 would be
allocated.
138. UNEP: Indicative figure of 1 million was put up last year and countries had to come
up with priorities that fit into that. Countries came up with 120 million worth of
priorities. So there has been a collective effort of different donors to meet this
amount (e.g.: UNEP GEF PAS, PAC). He also clarified that NIP implementation
for Cook Islands was not $517,000, that the amount would be dispersed amongst
the 6 countries listed for activities relating to POPs monitoring. Between now and
October they have to work on the PIFs with other relevant stakeholders and SPREP
technical officers are available to countries to develop country proposals to ensure
priorities are addressed. Meanwhile for the longer term, countries should start
thinking about GEF 5 given that GEF 4, is all accounted for.
139. UNEP addressed PNG query reminding that there are other programs that UNEP
wanted to work with to ensure there was integrated approach to solid waste.
Solomons: What does AusAID want in terms of what happens after POPs in PICS?
Solomons indicated that the countries need to focus on the non-POPs chemicals and
health care and components on capacity building and legislative frameworks. He stated
that countries had clearly indicated the need for another project (similar to POPs in PICs)
to focus on these particular issues, as there was still existing stockpiles in countries.
GHD: POPs in PICs has been a successful project in its practical approach. From what
we are hearing, any future project model may need to be accompanied with legislative
reform and a larger capacity building component. With a practical goal in mind, which
must be put forward by the PICs, we can work together to tackle all these issues
identified.
Secretariat stressed the importance of capacity building (e.g.: in the case of incinerator)
as a huge issue in country. So operation, maintenance and ongoing funding is a factor that
needs to be included in any future project.
140. Australia stressed that outside of the GEF & AusAID process, that through other
MEAs there are opportunities for countries to access other resources.
ANNEX 3b, Page 25
ANNEX 3b, Page 26
CLOSING SESSION
141. GHD thanked the participants for their inputs and discussion and handed over to Dr
Griffin for closing.
142. Secretariat thanked all the participants, AusAID the Australian Government and
the POPs Team for a successful project. It was indicated that the presentations and
additional information from the session would be included on a CD and distributed
to all on the participant list.
143. The Secretariat announced SAICM for Samoa (USD250,000) had been approved
and they only have to show co-financing before the project kicks off. He also
suggested that for those countries who don’t have SAICM focal point to identify
focal points and contact SPREP to assist in putting up countries proposals and
sending to SAICM QSP for assistance.
ANNEX 3c: POPS DESTRUCTION SUMMARY
Final Manifests with Additional POPs Identified
0
5,000
10,000
15,000
20,000
25,000
30,000
Samoa Fiji
Cook
Islan
dsM
arsh
all Is
land
s
FSM
Nauru
Niue
Palau
Tonga
Tuval
u
Kiribat
i
Solom
on Is
land
sVan
uatu
Country
Wei
gh
t (k
g) Additional Pesticides
Additional PCB Oils and transformers
Pesticides
PCB Oils and transformers
ANNEX 3c, page 1
Final Quantity of POPs Collected by Country
0
5,000
10,000
15,000
20,000
25,000
30,000
Samoa Fiji
Cook I
sland
sM
arsh
all Is
lands
FSM
Nauru
Niue
Palau
Tonga
Tuvalu
Kiribat
iSolo
mon
Islan
ds
Vanua
tu
Country
Wei
gh
t (k
g)
Pesticides
PCB Oils and transformers
ANNEX 3c, page 2
POPs Quantity by Country and Project Stage
0
5,000
10,000
15,000
20,000
25,000
30,000
35,000
40,000
45,000
50,000
55,000
60,000In
itial
PO
Ps
Rev
ised
PO
Ps
Fin
al P
OP
sIn
itial
PO
Ps
Rev
ised
PO
Ps
Fin
al P
OP
sIn
itial
PO
Ps
Rev
ised
PO
Ps
Fin
al P
OP
sIn
itial
PO
Ps
Rev
ised
PO
Ps
Fin
al P
OP
sIn
itial
PO
Ps
Rev
ised
PO
Ps
Fin
al P
OP
sIn
itial
PO
Ps
Rev
ised
PO
Ps
Fin
al P
OP
sIn
itial
PO
Ps
Rev
ised
PO
Ps
Fin
al P
OP
sIn
itial
PO
Ps
Rev
ised
PO
Ps
Fin
al P
OP
sIn
itial
PO
Ps
Rev
ised
PO
Ps
Fin
al P
OP
sIn
itial
PO
Ps
Rev
ised
PO
Ps
Fin
al P
OP
sIn
itial
PO
Ps
Rev
ised
PO
Ps
Fin
al P
OP
sIn
itial
PO
Ps
Rev
ised
PO
Ps
Fin
al P
OP
sIn
itial
PO
Ps
Rev
ised
PO
Ps
Fin
al P
OP
s
Samoa Fiji CookIslands
MarshallIslands
FSM Nauru Niue Palau Tonga Tuvalu Kiribati SolomonIslands
Vanuatu
Country and Project Stage
Wei
gh
t (k
g)
Pesticides
PCB Oils and transformers
ANNEX 3c, page 3
POPs in PICs Greenhouse Gas Inventory Project Life Cycle Inventory Purpose
Purpose This spreadsheet is an inventory of the greenhouse gas emissions generated by the POPs in PICs project throughout its duration. The spreadsheet was developed to provide an understanding of the life-cycle emissions of greenhouse gasesassociated with the POPs in PICs project to provide AusAid with an indication of the cost to offset emissions over its life cycle.
Format The spreadsheet contains:
1. A visual outline of the inventory boundary, showing what is included in and excluded from the inventory; 2. A tab showing the activity data and greenhouse gas emissions for each activity associated with the project (air travel, shipping, road transport, office emissions, waste treatment), and3. The summary of the greenhouse gas emissions for each activity and an indicative cost associated with offsetting emissions.
Page 1
GHD
POPs in PICs Greenhouse Gas InventoryProject Life Cycle Inventory Boundary
Incoming resources Aviation Fuel AEROPLANE TRAVELinternational and domestic
Incoming resources not included in Inventory
Transport Fuel - Diesel ROAD TRANSPORTPOPs in PICs operational control boundary
site inspections, waste collection and local travel
Included in Inventory Transport Fuel - PetrolINSPECTIONS
Not included in Inventory site visits, sample collectionTransport Fuel - Biofuel
Outgoing resourcesSHIPPING
samples and equipmentWater Industrial and commercial waste
Notes:1. Travel includes both local (within Australia) and international flights. These also include both chartered and commercial flights.2. Emissions factor used was the weighted average of emissions per flight kilometre using the Qantas emissions calculator found at http://www.qantas.com.au/travelcontent/dyn/carbonCalculator3. Travel distances determined through the Climate Friendly emissions calculator, found in https://climatefriendly.com/flight4. Flight information for the reconnaissance and clean-up activities obtained from Travel Diaries and Monthly Reports for the project.5. Flight information for "Other Flights" based on an estimate that 4 flights to Brisbane and 6 to Canberra were undertaken for each year of the project.6. Majority of the air travel occurred during the reconnaissance and clean-up activities, thus aeroplane travel accounted for in this inventory were those occurring from 2003-2006.
Date Depart from Country Arrive in Country Distance (km) Total team no.s Total person-kms
Stage 19-Aug-03 Melbourne Australia Auckland New Zealand 2643 3 7,929
Suva Fiji Labasa Fiji 194 5 97018-Aug-03 Labasa Fiji Suva Fiji 194 5 97021-Aug-03 Nadi Fiji Port Villa Vanuatu 967 5 4,83523-Aug-03 Port Villa Vanuatu Tanna Vanuatu 224 5 1,120
Tanna Vanuatu Port Villa Vanuatu 224 5 1,12024-Aug-03 Port Villa Vanuatu Luganville Vanuatu 270 5 1,35026-Aug-03 Luganville Vanuatu Port Villa Vanuatu 270 5 1,35028-Aug-03 Port Villa Vanuatu Nadi Fiji 967 5 4,83529-Aug-03 Nadi Fiji Auckland New Zealand 2158 5 10,790
Agana Guam Cairns Australia 3378 5 16,8903-Oct-03 Cairns Australia Brisbane Australia 1393 5 6,965
Brisbane Australia Melbourne Australia 1379 5 6,895Stage 35-Oct-03 Cairns Australia Brisbane Australia 1393 5 6,9656-Oct-03 Brisbane Australia Nauru Nauru 3332 5 16,660
Nauru Nauru Tarawa Kiribati 723 5 3,6157-Oct-03 Tarawa Kiribati Nauru Nauru 723 5 3,6159-Oct-03 Nauru Nauru Nadi Fiji 2232 5 11,16011-Oct-03 Nadi Fiji Auckland New Zealand 4316 5 21,580
Auckland New Zealand Hanan Niue 2482 5 12,41013-Oct-03 Hanan Niue Sydney Australia 4176 5 20,88015-Oct-03 Sydney Australia Nuku Alofa Tonga 3587 5 17,93517-Oct-03 Nuku Alofa Tonga Suva Fiji 748 5 3,74020-Oct-03 Suva/Nausori Fiji Funafuti Tuvalu 1054 5 5,27023-Oct-03 Funafuti Tuvalu Suva/Nausori Fiji 1054 5 5,27024-Oct-03 Suva/Nausori Fiji Nadi Fiji 122 5 61025-Oct-03 Nadi Fiji Sydney Australia 3167 5 15,835
Sydney Australia Melbourne Australia 705 5 3,525Stage 4
19-Jun-04 Melbourne Australia Auckland New Zealand 2643 4 10,572Auckland NZ Apia Samoa 2882 4 11,528
28-Jun-04 Apia Samoa Sydney Australia 4326 4 17,30429-Jun-04 Sydney Australia Melbourne Australia 705 4 2,8207-Aug-04 Melbourne Australia Nadi Fiji 3867 4 15,4688-Aug-04 Nadi Fiji Suva Fiji 122 4 488
Suva Fiji Labasa Fiji 194 4 776
Page 3
GHD
Date Depart from Country Arrive in Country Distance (km) Total team no.s Total person-kms
Brisbane Australia Port Vila Vanuatu 3796 4 15,18412-Sep-04 PortVila Vanuatu Sydney Australia 2483 4 9,93219-Sep-04 Melbourne Australia Nauru Nauru 4707 4 18,82821-Sep-04 Nauru Nauru Brisbane Australia 3332 4 13,32823-Sep-04 Brisbane Australia Cairns Australia 1393 4 5,57224-Sep-04 Cairns Australia Guam Guam 5285 4 21,140
Guam Guam Brisbane Australia 4635 4 18,54025-Oct-04 Melbourne Aust Auckland NZ 2643 4 10,572
Auckland NZ Rarotonga Cook Is 3013 4 12,0524-Nov-04 Rarotonga Cook Islands Auckland New Zealand 3013 4 12,0525-Nov-04 Auckland New Zealand Niue Niue 2488 4 9,952
12-Nov-04 Niue Niue Apia Samoa 626 4 2,50413-Nov-04 Apia Samoa Auckland New Zealand 2882 4 11,52815-Nov-04 Auckland New Zealand Melbourne Australia 2643 4 10,572
Stage 518-Jan-05 Melbourne Australia Suva Fiji 3934 4 15,73622-Jan-05 Suva Fiji Melbourne Australia 3934 4 15,736
Pohnpei, FSM Wellington New Zealand 5632 2 11,2642-Mar-05 Suva Fiji Wellington New Zealand 2615 2 5,230
Tarawa Kiribati Wellington New Zealand 4571 2 9,142Majuro Marshall Islands Wellington New Zealand 5394 2 10,788Nuie Nuie Wellington New Zealand 2866 2 5,732Port Moresby Papua New Guinea Wellington New Zealand 4459 2 8,918Apia, Samoa Wellington New Zealand 3316 6 19,896Naku'Alofa Tonga Wellington New Zealand 2425 6 14,550Funafuti Tuvalu Wellington New Zealand 3673 2 7,346Port Vila Vanuatu Wellington New Zealand 2700 2 5,400Auckland New Zealand Wellington New Zealand 480 2 960
7-Mar-05 Melb Aust Port Vila Vanuatu 1898 4 7,5928-Mar-05 Port Vila Vanuatu Espirito Santo Vanuatu 269 2 538
11-Mar-05 Santo Vanuatu Tanna Vanuatu 200 2 40012-Mar-05 Tanna Vanuatu Port Vila Vanuatu 224 2 44817-Mar-05 Port Vila Aust Melb Aust 3187 1 3,18719-Mar-05 Port Vila Vanuatu Brisbane Vanuatu / Aust 3796 3 11,3882-Apr-05 Melbourne Australia Auckland New Zealand 2643 3 7,929
Auckland New Zealand Niue Niue 2482 3 7,4467-Apr-05 Niue Niue Auckland New Zealand 2482 3 7,446
Auckland New Zealand Melbourne Australia 2643 3 7,92910-Apr-05 Melb Aust Nadi Fiji 3867 2 7,734
Nadi Fiji Melbourne Aust 3867 2 7,73417-Apr-05 Brisbane Aust Nauru Nauru 3332 2 6,66420-Apr-05 Nauru Nauru Tarawa Kiribati 723 2 1,44620-Apr-05 Brisbane Aust Nauru Nauru 3332 1 3,332
Nauru Nauru Tarawa Kiribati 723 1 72323-Apr-05 Tarawa Kiribati Nauru Nauru 723 3 2,169
Nauru Nauru Brisbane Aust 3332 3 9,996Other Flights (Domestic)
2002 Melbourne Australia Brisbane Australia 1379 4 5,516Brisbane Australia Melbourne Australia 1379 4 5,516Melbourne Australia Canberra Australia 469 6 2,814Canberra Australia Melbourne Australia 469 6 2,814
2003 Melbourne Australia Brisbane Australia 1379 4 5,516Brisbane Australia Melbourne Australia 1379 4 5,516Melbourne Australia Canberra Australia 469 6 2,814Canberra Australia Melbourne Australia 469 6 2,814
2004 Melbourne Australia Brisbane Australia 1379 4 5,516Brisbane Australia Melbourne Australia 1379 4 5,516Melbourne Australia Canberra Australia 469 6 2,814
Page 4
GHD
Date Depart from Country Arrive in Country Distance (km) Total team no.s Total person-kms
Canberra Australia Melbourne Australia 469 6 2,8142005 Melbourne Australia Brisbane Australia 1379 4 5,516
Brisbane Australia Melbourne Australia 1379 4 5,516Melbourne Australia Canberra Australia 469 6 2,814Canberra Australia Melbourne Australia 469 6 2,814
2006 Melbourne Australia Brisbane Australia 1379 4 5,516Brisbane Australia Melbourne Australia 1379 4 5,516Melbourne Australia Canberra Australia 469 6 2,814Canberra Australia Melbourne Australia 469 6 2,814
Total Distance 1,017,586
Departure Arrival Flight DistanceEmissions per flight (Qantas) EF per kilometre
Melbourne Sydney 705 0.1 0.000141844Melbourne Brisbane 1379 0.149 0.000108049Melbourne Auckland 2643 0.231 8.74007E-05Melbourne Cairns 2303 0.235 0.000102041Melbourne Nadi 3867 0.588 0.000152056Melbourne Nauru 4707Melbourne Port Vila 3187Melbourne Canberra 469 0.093 0.000198294Sydney Apia 4323Sydney Nadi 3167 0.484 0.000152826Sydney Hanan (Niue) 4176Sydney Naku Alofa, Tonga 3587Cairns Agana, Guam 3378Cairns Brisbane 1393 0.13 9.33238E-05Brisbane Nadi 2716 0.416 0.000153166Brisbane Port Vila 1898 0.294 0.0001549Brisbane Honiara 2115Brisbane Noumea 1450 0.303 0.000208966Brisbane Tarawa (Kiribati) 3833Brisbane Agana, Guam 4635Brisbane Nauru 3332Auckland Hanan (Niue) 2482Auckland Apia 2882Auckland Rarotonga 3013Auckland Sydney 2160 0.182 8.42593E-05Auckland Naku Alofa, Tonga 2004Nadi, Fiji Apia 1210Nadi, Fiji Suva 122 0.031 0.000254098Nadi, Fiji Port Vila 967 0.156 0.000161324Nadi, Fiji Auckland 2158 0.437 0.000202502Nadi, Fiji Nauru 1341Suva, Fiji Labasa, Fiji 194Suva, Fiji Naku Alofa, Tonga 748Suva, Fiji Funafuti, Tuvalu 1054Agana, Guam Majuro, MI 2979Agana, Guam Koror, Palau 1311Agana, Guam Chuuk, FSM 1019Agana, Guam Yap, FSM 856Agana, Guam Pohnpei, FSM 1636Port Vila, Vanuatu Tanna 224Port Vila, Vanuatu Santo (luganville) 269 0.036 0.000133829Port Vila, Vanuatu Sydney 2483 0.382 0.000153846Rarotonga, CI Aitutaki, CI 261Rarotonga, CI Mangaia, CI 209Rarotonga, CI Atiu, CI 219Koror, Palau Yap, FSM 454Chuuk, FSM Pohnpei, FSM 706Inu (Nauru) Tarawa (Kiribati) 723Inu (Nauru) Nadi 2232Apia Asau 144
Average (All) 0.000150Average (Australia) 0.000129Average (Pacific) 0.000158
2. Emissions factor used was based on the average of emissions per tonne-km across 1991 through 2005 as presented in Table 15 of the Australian Government document Analysis of Recent Trends and Greenhouse Indicators 1990 to 2005 , prepared by the Department of the Environment and Water Resources and published in 2007
3. Shipping distance is usually measured in nautical miles, which is equivalent to approximately 1.852 km. The quantity was therefore determined by accounting for the distance travelled in km and the total tonnage shipped for the duration of the project.
4. Weight of shipping container was accounted for in the inventory. It was assumed that 20' containers were used having a tare mass (mass when empty) of 2.4 tonnes. For every shipment, the weight of the container was added.
Page 9
GHD
POPs in PICsRoad Transport
Activity Sub-category User Quantity Units Quantity UnitsFuel Consumption Rates (L/km)
Transport Fuel - Petrol Cars 94 inspection days 50 km 0.115 2.380 0.181 1 0 1
Total 4 0 4
Notes:1. For trucking, it was assumed that travel distance from Port of Brisbane to Narangba Industrial is 50km. It was further assumed that B-Double trucks were used which carried two containers per trip and no2. For in country vehicular travel, it was assumed that 50km was covered for each day of inspection on site. Note that this is an estimate and is not based on any actual data. In country vehicular travel only 3. Fuel consumption rates were obtained from the Report: Survey of Motor Vehicle Use, Australian Bureau of Statistics (2008), Summary Table 1 in L/km4. Emissions factors were obtained from the National Greenhouse Accounts Factors, Department of Climate Change (June 2009). NGA data was converted to tonCO2-e/kL by multiplying the Total Emission
Page 10
GHD
POPs in PICsPreliminary Estimate of Greenhouse Gas EmissionsOffice-Related Emissions
Hours spent on project less time In Country
Quantity (years)Emission Factor (t CO2-e/unit)
Total Emissions (t CO2-e)
Percentage
Total hours GHD staff input to the main project 3.9 3.3 13 82%
Communications Strategy time input 0.8 3.3 3 18%Total 16 100%
Notes:GHD Emissions obtained from GHD's Feasibility Study Report for the Greenhouse Friendly Program dated 2005.
GHD Emissions - Melbourne
Activity No Of Staff (FTE)Per Capita Emissions
(tCO2-e/person/yr)Metered Electricity Use 390 2.5Business Travel in Personal Vehicles 390 0.6Business Travel in GHG Vehicles 390 0.2
Total Emissions for Site 752Total Waste Treated per Year 770Operational Emission Factor per tonne waste destroyed (tCO2-e/t waste) 0.98
Assumptions:PCB concentration: 1500 mg PCB/kg transformer oilPCB to CO2 equivalent: 1 mol PCB --> 12 mol CO2Average molecular weight (MW) of PCB: 375.7 g/mol (based on Aroclor 1260, a common PCB congener, found in www.epa.gov/ttn/atw/hlthef/polychlo.html)MW of CO2: 44 g/molHydrocarbon concentration: 998.5 g hydrocarbon/kg transformer oilRatio of CO2 to hydrocarbon: 3.14286 g CO2/ g hydrocarbonPCB to CO2 Emissions Factor (EF PCB)
Amount CO2 produced = tonnes of transformer oil X PCB concentration / molecular weight of PCB X mols of CO2 produced per mol of PCB destroyed X molecular weight of CO2E.g. t CO2 -e/t TO = [(1000kg TO)*(1.5g PCB/kg TO)*(1/375.7g/mol PCB)*(12 mol CO2/mol PCB)*(44g/molCO2)]/1000000
t CO2 -e/t TO = 0.002108Hydrocarbon to CO2 Emissions Factor (EF HC)
Energy use at BCD Technologies
Amount CO2 produced = tonnes of transformer oil X hydrocarbon concentration / molecular weight of hydrocarbon X mols of CO2 produced per mol of hydrocarbon destroyed X molecular weight of CO2
Page 12
E.g. t CO2 -e/t TO = [(1000kg TO)*(998.5g C16H32/kg TO)*(1/224 g/mol C16H32)*(16 mol CO2/mol C16H32)*(44g/molCO2)]/1000000 = [(1000kg TO)*(998.5g C16H32/kg TO)*(3.14286)]/1000000
t CO2 -e/t TO = 3.138143EF for waste treated through Plascon
Emission Factor = EF PCB (PCB to CO2 EF) + EF HC (Hydrocarbon to CO2 EF)Emission Factor = 0.002108+3.138143 = 3.140251
Notes:1. Electricity, natural gas, and waste values obtained from Krissy Sanders of BCD Technologies through e-mail correspondence dated 26 August 2008, as found in the document BCD Technologies Greenhouse Gas Emissions.2. Total amount of waste treated at BCD Technologies per annum estimated at 770 tonnes, also provided by Krissy Sanders of BCD Technologies through e-mail correspondence dated 26 August 2008, as found in the document BCD Technologies Greenhouse Gas Emissions..
5. It was assumed that the transformer oil was only composed of primarily napthenic hydrocarbons, whilst the rest is polychlorinated biphenyl (PCB). It was further assumed that the PCB concentration in the transformer oil is 1500mg/kg, as this is the threshold that qualifies the transformer oil for treatment by the Plascon plant.
4. The emissions factor for CO2 production through the destruction of transformer oil containing PCB through the Plascon plant was estimated by determining the stoichiometric balance between the amount of transformer oil (containing naphthenic mineral oil and a small fraction of PCB) destroyed and the amount of CO2 produced in the Plascon process.
Destruction in the Plascon plant being an oxidative process, all the C atoms in the waste being destroyed is thereby converted into CO2. PCB contains 12 C atoms in its structure, producing 12 mols of CO2 during oxidation. Transformer oil is composed primarily of naphthenic mineral oil, which is a cycloalkane, containing C and H atoms.The ratio of the amount of CO2 produced in relation to the molecular weight of the cycloalkane is 3.1428. That is, if the hydrocarbon in the transformer oil is C16H32, the mols of CO2 produced (16) multiplied by its molecular weight (44 g/mol), divided by the molecular weight of C16H32 is 3.1428.
3. The emissions factor for plant operations was determined by dividing the estimated total annual operational emissions of BCD by the total estimated amount of waste treated per annum.
Transport Fuel - Aviation fuel and Ground Operations 1,017,586 passenger-km 152 45% 7,671
Waste TreatmentEnergy use at BCD Technologies 123.6442 tonne 121 36% 6,083
Waste TreatmentCO2 production from Plascon plant 11.344 tonne 36 11% 1,795
Shipping Transport Fuel 904,616 tonne-km 11 3% 564Office Emissions Energy and Fuel Use 5 years 16 5% 783Road Transport - Trucking Transport Fuel - Diesel 1,600 tonne-km 3 1% 131Road Transport - Vehicular travel Transport Fuel - Petrol 4,700 km 1 0% 70Total 339 100% 17,097
Page 14
GHD
POPs in PICsPreliminary Estimate of Greenhouse Gas Emissions
Waste TreatmentEnergy use at BCD Technologies 123.6442 tonne 1.0 121 36%
Waste TreatmentCO2 production from Plascon plant 11.344 tonne 3.1 36 11%
Shipping Transport Fuel 904,616 tonne-km 0.0 11 3%
Office Emissions Energy and Fuel Use 5 years 3.3 16 5%
Road Transport - Trucking Transport Fuel - Diesel 1,600 tonne-km 0.542 3.0 3 1%
Road Transport - Vehicular travel Transport Fuel - Petrol 4,700 km 0.107 2.8 1 0%Total 339 100%
Notes:1. This inventory is expected to provide an estimate of the likely emissions produced by the various activities associated with the project to date.2. Greenhouse gas emissions associated with the following activities were not included in the inventory due to lack of information:
Embodied emissions in materials and/or consumables used.Emissions associated with on-site inspection activities.Laboratory testing emissions.Emissions associated with meetings and other office activities relating to POPs in PICs activities, including fuel combustion emissions from local vehicular travel during these meetings.Emissions associated with accommodations.
3. Offset cost estimate based on an average of the projected 2008 and 2009 prices of Renewable Energy Certificates as modelled by the Clean Energy Council in the Sustainable Energy Update of January 2008The offset costs will be strongly affected by the final design of the Carbon Pollution Reduction Scheme, with the White Paper due to be released by the end of 2008.
In context:One Australian home for one year: 14 tCO2e 24 homesOne Australian car for one year: 4.5 tCO2e 75 carsOne Australian for one year: 24 tCO2e 14 Australians(these figs taken from Bendigo Bank Generation Green website, stated source Vic & fed govt)
Page 15
ANNEX 4: PROJECT MANAGEMENT REPORTS
Project Management Reports
PM002: Emergency Response Guidelines July 2003
PM003: Risk Management Plan July 2003
PM004: Field Operations Procedures July 2003
PM005: Project Procedures Manual March 2004
PM006: 2004-2005 Annual Plan May 2004
PM007: Six Monthly Report – Period March 2004 to November 2004 January 2005
PM008: Six Monthly Report – Period December 2004 to June 2005 August 2005
PM009: 2005-2006 Annual Report December 2006
PM010: Import Permits for First Six PICs September 2006
PM011: Cleanup Report for the First Six PICs January 2007
PM012: Cleanup Report for Remaining Six PICs March 2007
PM013: Import Permits for Final PICs August 2008
PM014: Transport and Logistics Report March 2009
PM015: Disposal of Shipped Chemicals Report August 2009
PM016 Project Completion Report September 2010
PM017 2006-2007 Annual Report December 2007
PM018 2007-2008 Annual Report July 2009
Project Reports
PR001: Permitting Schedule Report October 2003
PR002: Six Monthly Report January 2004
PR004: Chemical Assessment Plan and Manifest March 2004
PR005: Transport/Logistics Plan March 2004
PR006: Clean Up Plan June 2004
PR007: BCD Technologies Trade Waste Non Compliance Incident Notification and Investigation Procedure
July 2007
PR008: BCD Technologies Trade Waste Non Compliance Report November 2008
Project Exception Reports
2005 January, February, March, April, May, June, July, August, September, October, November and December
2006 January, February, March, April, May, June and July
2007 1st Quarter (Jan, Feb, Mar) 2nd Quarter (Apr, May, Jun) and July