36
Perspectives 2015: Defined contribution retirement plan benchmarks Retirement Services
Perspectives 2015:Defined contribution retirement plan benchmarks
Retirement Services

Perspectives 2015:Defined contribution retirement plan benchmarksAn employer-sponsored retirement plan is often the savings centerpiece for most employees today. In fact, employer-sponsored retirement plans cover more than 88 million Americans and now have assets in excess of $5.5 trillion. For this reason alone, your plan is a critically important benefit to your employees. Employers and employees alike reaped the benefits of an improving economy. Nonetheless, social, geographic and political pressures still present constant challenges.

BMO Retirement Services was named Best-in-Class provider for the 8th year in a row in PLANSPONSOR® magazine’s 2014 401(k) DC Survey. Visit bmoretirementservices.com/success for more information.
Table of contentsExecutive summary . . . . . . . . . . . . . . . . . . . . . . . . . . . . . . . . . . . . . . . . . Executive summary . . . . . . . . . . . . . . . . . . . . . . . . . . . . . . . . . . . . . . . . . Executive summary 2Eligibility and participation . . . . . . . . . . . . . . . . . . . . . . . . . . . . . . . . . . . 3Automatic enrollment . . . . . . . . . . . . . . . . . . . . . . . . . . . . . . . . . . . . . . . 7Other plan design elements . . . . . . . . . . . . . . . . . . . . . . . . . . . . . . . . . . 9Employer contributions . . . . . . . . . . . . . . . . . . . . . . . . . . . . . . . . . . . . . 12Total company contributions . . . . . . . . . . . . . . . . . . . . . . . . . . . . . . . . . 16
Employee contributions . . . . . . . . . . . . . . . . . . . . . . . . . . . . . . . . . . . . . 18Participant account balances . . . . . . . . . . . . . . . . . . . . . . . . . . . . . . . . . 21Investments . . . . . . . . . . . . . . . . . . . . . . . . . . . . . . . . . . . . . . . . . . . . . . 23Plan expenses . . . . . . . . . . . . . . . . . . . . . . . . . . . . . . . . . . . . . . . . . . . . 28Other benefits . . . . . . . . . . . . . . . . . . . . . . . . . . . . . . . . . . . . . . . . . . . . 31References . . . . . . . . . . . . . . . . . . . . . . . . . . . . . . . . . . . . . . . . . . . . . . . 32
OverviewA well-designed benefit package must keep costs in check, but entice current and prospective employees alike to save now, ensuring an income stream upon retirement. Comparing your plan to industry benchmarks is one way to examine the big picture, determine how your plan compares to peers and see how it can prepare your employees for retirement.
The retirement plan market will undergo changes as plan sponsors, participants and providers react to regulatory changes and employee demographics. Does your retirement program fit your company and employees? Will your employees achieve retirement security through participation in your plan? To ensure that your participants are ready, you are encouraged to:
Identify goalsAnalyze what corporate goals you have established for your retirement and overall benefits program. Determine how your plan addresses or meets your goals.
Know your employeesReview your employee demographics to understand employee activity, participation and usage of your retirement plan.
Review your communication programIncorporate tools that provide a clear, concise message. Communicate frequently with participants about the program, its benefits and its features to maximize usage. Incorporate tailored communication pieces when possible to address specific goals, such as increasing participation, increasing deferral rates, minimizing loan usage and, perhaps most importantly, encouraging participants to complete a retirement readiness calculation.
Understand your plan costsAscertain if the fees paid are appropriate for your plan size, features and investments. Also, be comfortable that the fees paid are reasonable for the services received. Disclose fees that will be paid by participants to minimize participant confusion and concern.
Fully appreciate your fiduciary responsibilitiesTake an active role in reviewing the plan design, investments, and the effect legislative and regulatory changes may have on your plan provisions and administration. Ensure that the plan offers an appropriate mixture of investment vehicles, that the investment committee or plan administrator properly selects and monitors those investments and document that review in writing. Ensure, too, that employees adequately understand investments and that participants are not violating fund investment policies.
2007–2014
BEST IN CLASS
The value of Perspectives 2015
In this publication, we’ve compiled a summary of statistics and trends related to common features of retirement plans. The information and benchmarks included in Perspectives 2015 provide a useful comparison for evaluating the current 2015 provide a useful comparison for evaluating the current 2015status of your retirement plan program and may help you identify potential changes to consider, including automatic features that make saving easy for employees.

Perspectives 2015:Defined contribution retirement plan benchmarks
2
Executive summaryThe American economy is improving, which has positive effects on employer-sponsored retirement plans and participants alike. However, employers continue to face the challenge of offering reward strategies aimed at benefitting employees. While the improved economy alleviates some of the stress employees feel toward retirement saving, the fact remains that the population is aging, which heightens the importance of adequate savings. If income from Social Security and private sources, such as personal savings and retirement accounts, is not sufficient to maintain a standard of living, many retirees will face difficult and perhaps unexpected choices. Some may be forced to reduce or eliminate post-retirement expenditures, while others may become more dependent on their adult children for financial support.
Pressures and concerns aside, participant and deferral rates have changed only slightly over the years reported in this booklet. Employees are still facing rising health care costs, reducing personal debt and recovering from high unemployment levels.
In today’s changing environment, plan sponsors and participants alike must play an active role in producing better retirement outcomes through the implementation of “automatic” features, such as enrollment and deferral rate step-up features, optimized plan design, investment monitoring and plan benchmarking. The surveys summarized in this book review current and historical trends in employee benefits. A few highlights of the data compiled include:
• The average participation rate sits at 80% at the end of 2013. But, in most cases, even being above average will not set your employees on a course for retirement security.
• Employee deferral rates hover at 7% for the fourth year in a row, despite campaigns stressing the need to save more.
• The percentage of participants deferring below 4% is nearly unchanged, in fact rising 1% to 30%; surveys reflect that 48% of participants deferred between 4% and 10% in 2013. The percentage deferring above 15% remains unchanged at 22%.
• An automatic enrollment feature is utilized in 50% of plans, a 3% increase in one year. Studies also reflect that the average default deferral rate is moving up, with 40% of plans now auto enrolling at rates higher than 3%, an increase of 4% in each of the last two years.
• Total company contributions, as a percentage of total net profit, were 14% in 2013, a drop of 2% from the 2012 average.
• “All-in” fees, the bottom line way of comparing total plan expenses, dropped 10 basis points between 2011 and 2013.
Retirement plans remain in the cross-hairs of Congress. Will that attention bring surprises or dramatic changes? The outcome remains to be seen. In the meantime, our relationship management team is ready and willing to discuss how your plan can better help your employees achieve retirement readiness.

3
Eligibility and participationChanges to age and service requirements seem to have reached a stall point. In fact, the percentage of plans without a minimum age requirement dropped only 1% during 2013, with just over one-third of respondents requiring a minimum age as a participation eligibility requirement.
Figure 1: Minimum age requirement by plan size
In Figure 1, the high variability among plan size as it relates to a minimum age requirement is evident. Most notable is that 50% of plans between 1,000 and 4,999 participants do not impose a minimum age requirement for participation at the end of 2013, a 6% increase since 2012. A similar change is reported in plans with 200 – 999 participants, with 34% of plans no longer requiring a minimum age, a 5% increase since 2012.
None
18
21
Other
■ 1 – 49■ 50 – 199■ 200 – 999■ 1,000 – 4,999■ 5,000+■ All plans
Plan Size 25%
15%
58%
2%
23%
30%
46%
1%
34%
28%
35%
3%
50%
34%
16%
0%
56%
24%
19%
1%
39%
26%
34%
1%
Source: PSCA
Figure 2: Minimum months of service required
Figure 2 shows the percentage of plan sponsors incorporating a minimum service requirement, as reported in the PSCA Survey. Minimum service requirements continue the trend toward shorter time periods, with a 2% increase noted in the number of survey respondents reporting no service requirement to make salary deferrals. While plan sponsors are permitting employee deferrals immediately upon hire in almost two-thirds of retirement plans, 54% of plan sponsors require a minimum service period, generally one year of service, in order to receive matching contributions; this percentage has not changed since 2011.
64%
23%
10%
3%
46%
23%
30%
1%
26%
23%
51%
1%
None
1 – 12 months
12 months
Other
■ Employee■ Match■ Pro�t Sharing
Source: PSCA
Figure 3: Plan entry dates
To maximize the probability of encouraging new employees to begin participating in the company-sponsored plan, employers have opened the enrollment entry window. As shown in Figure 3, data for the 2013 plan year reflects the majority of employers allow employees to enter the plan at any time, providing maximum opportunity for employees to engage in active saving. While not reflected in the chart, the greatest gain, a 3% increase, is among plans providing entry on the first day of each month.
■ Anytime
■ 1st of month
■ 1st of quarter
■ Semi-annually
■ Annually74%
8%
11%6% 1%
Source: PSCA

Perspectives 2015:Defined contribution retirement plan benchmarks
4
Figure 4: Participation rate by number of participants
Data from the PSCA Survey in Figure 4 indicates that participation rates vary among plans of different sizes. However, the spread is not significant. Despite a brighter economic picture, participation rates hold at 80%, after rebounding from the 77% low point reported in 2010.
82%
78%
73%
73%
77%
86% 84%
83%
82%
78%
75%
80%
77%
81% 82%
78%
77%
76%
81%
82%
76%
80%
76% 80%
77%
80%
1 – 49
50 – 199
200 – 999
1,000 – 4,999
5,000+
All plans■ 2013
■ 2012
■ 2011
■ 2010
■ 2009
■ 2008
82% 83%
81% 78%
86%
91% 91%
87%
83% 86%
Source: PSCA
Figure 5: Dispersion of participation rates
Figure 5 highlights the dispersion in the rate of participation among retirement plans. According to the Vanguard Survey, 54% of plans had a participation rate of at least 80% at the end of 2013, a non-statistical decrease of 1% over 2012. Only 28% of plans reported a participation rate below 70%, similar to previous years.
■ < 50%
■ 50% – 59%
■ 60% – 69%
■ 70% – 79%
■ 80% – 89%
■ 90% – 100%12%
7%
9%
18%29%
25%
Source: Vanguard
Figures 6 through 8
Participation rates can be significantly impacted by plan design, as shown by the data reported in Figures 6 through 8. It is very clear that an automatic enrollment feature positively impacts participant behavior, especially among those under age 25, with a 39% higher participation rate using an automatic enrollment feature, as shown in Figure 6. Even at ages above 25, a marked increase in participation is evident when an automatic enrollment provision is incorporated in plan design.
Figure 6: Participation rate by age and plan design
The impact of age on retirement plan participation is shown in Figure 6. As shown in the Vanguard Survey data, participation generally rises with advancement towards retirement.
39%
61%
68%
72%
74%
68%
29%
56%
65%
71%
73%
68%
68%
83%
84%
85%
85%
77%
< 25
25 – 34
35 – 44
45 – 54
55 – 64
65+
■ All plans
■ Voluntaryenrollment
■ Automaticenrollment
Source: Vanguard
5
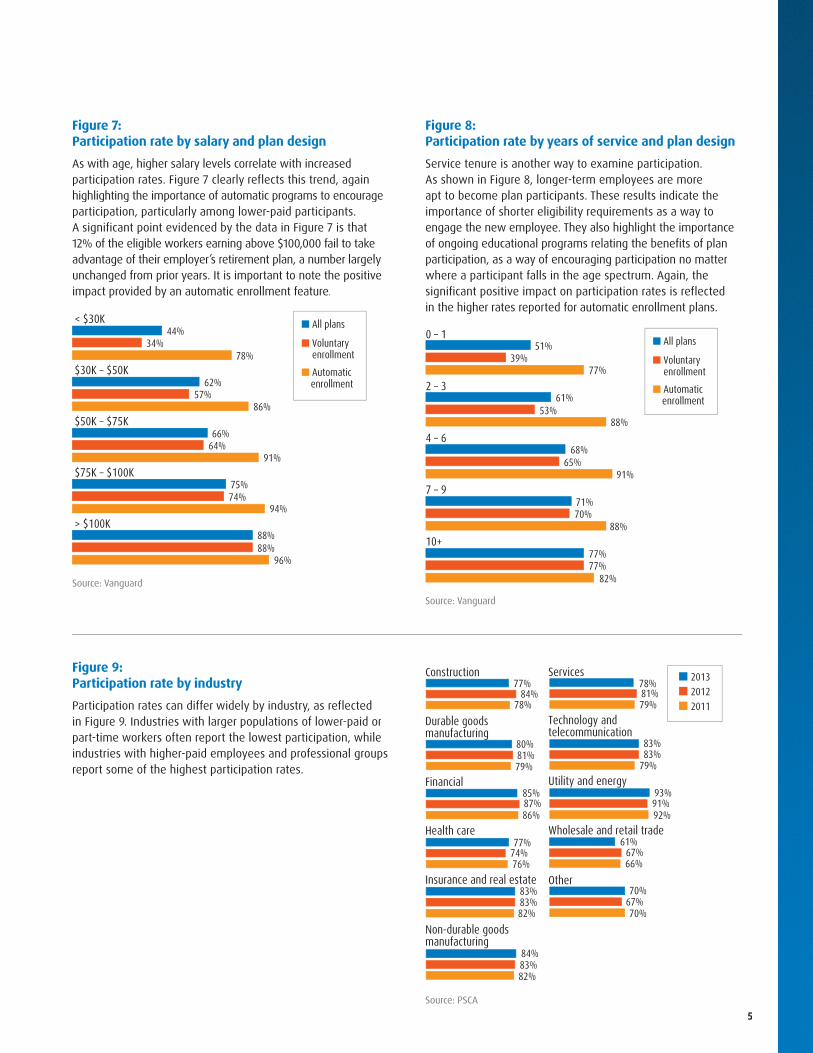
Figure 7: Participation rate by salary and plan design
As with age, higher salary levels correlate with increased participation rates. Figure 7 clearly reflects this trend, again highlighting the importance of automatic programs to encourage participation, particularly among lower-paid participants. A significant point evidenced by the data in Figure 7 is that 12% of the eligible workers earning above $100,000 fail to take advantage of their employer’s retirement plan, a number largely unchanged from prior years. It is important to note the positive impact provided by an automatic enrollment feature.
44%
62%
66%
75%
88%
34%
57%
64%
74%
88%
78%
86%
91%
94%
96%
< $30K
$30K – $50K
$50K – $75K
$75K – $100K
> $100K
■ All plans
■ Voluntaryenrollment
■ Automaticenrollment
Source: Vanguard
Figure 8: Participation rate by years of service and plan design
Service tenure is another way to examine participation. As shown in Figure 8, longer-term employees are more apt to become plan participants. These results indicate the importance of shorter eligibility requirements as a way to engage the new employee. They also highlight the importance of ongoing educational programs relating the benefits of plan participation, as a way of encouraging participation no matter where a participant falls in the age spectrum. Again, the significant positive impact on participation rates is reflected in the higher rates reported for automatic enrollment plans.
51%
61%
68%
71%
77%
39%
53%
65%
70%
77%
77%
88%
91%
88%
82%
0 – 1
2 – 3
4 – 6
7 – 9
10+
■ All plans
■ Voluntaryenrollment
■ Automaticenrollment
Source: Vanguard
Figure 9: Participation rate by industry
Participation rates can differ widely by industry, as reflected in Figure 9. Industries with larger populations of lower-paid or part-time workers often report the lowest participation, while industries with higher-paid employees and professional groups report some of the highest participation rates.
84%
81%
87%
74%
83%
83%
81%
83%
91%
67%
67%
78%
79%
86%
76%
82%
82%
79%
79%
92%
66%
70%
Construction
Durable goods manufacturing
Financial
Health care
Insurance and real estate
Non-durable goods manufacturing
Services
Technology and telecommunication
Utility and energy
Wholesale and retail trade
Other 70%
61%
93%
83%
78%
84%
83%
77%
85%
80%
77% ■ 2013■ 2012■ 2011
Source: PSCA
Perspectives 2015:Defined contribution retirement plan benchmarks
6
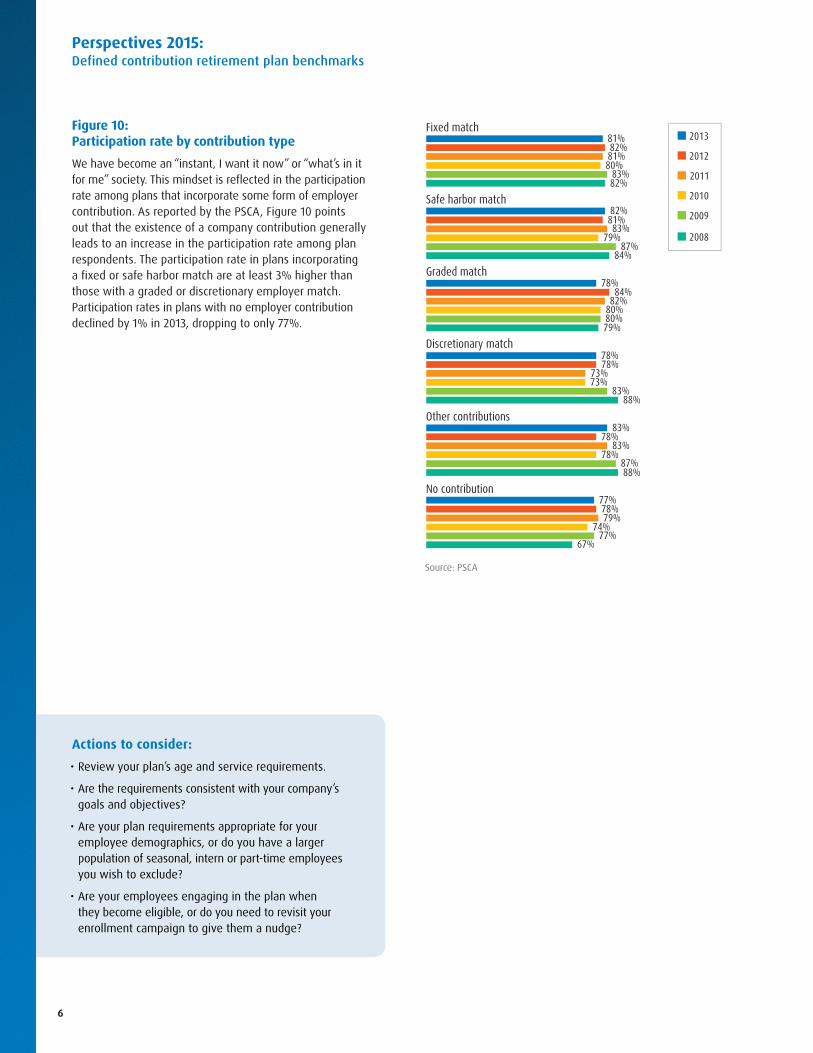
Figure 10: Participation rate by contribution type
We have become an “instant, I want it now” or “what’s in it for me” society. This mindset is reflected in the participation rate among plans that incorporate some form of employer contribution. As reported by the PSCA, Figure 10 points out that the existence of a company contribution generally leads to an increase in the participation rate among plan respondents. The participation rate in plans incorporating a fixed or safe harbor match are at least 3% higher than those with a graded or discretionary employer match. Participation rates in plans with no employer contribution declined by 1% in 2013, dropping to only 77%.
81%
83%
82%
73%
78%
79%
80%
79%
80%
73% 83%
88%
87%
74%
83% 82%
87% 84%
80% 79%
83%
88%
77% 67%
Fixed match
Safe harbor match
Graded match
Discretionary match
Other contributions
No contribution
78%
83%
78%
82%
81%
84%
77%
78%
78%
81%
82%
78%
■ 2013
■ 2012
■ 2011
■ 2010
■ 2009
■ 2008
Source: PSCA
Actions to consider:
• Review your plan’s age and service requirements.
• Are the requirements consistent with your company’s goals and objectives?
• Are your plan requirements appropriate for your employee demographics, or do you have a larger population of seasonal, intern or part-time employees you wish to exclude?
• Are your employees engaging in the plan when they become eligible, or do you need to revisit your enrollment campaign to give them a nudge?

7
Automatic enrollmentAutomatic enrollment, putting employees on an auto-pilot retirement program, continues to grow in popularity. Embraced as a way to engage plan participants who lack planning skills, inertia or procrastination when faced with complex decisions, the Deloitte Survey reports that, among plans utilizing auto-enrollment, 67% of sponsors implement automatic enrollment for new enrollees only and 32% auto enroll all eligible participants. Reasons to not incorporate an automatic enrollment feature include cost, corporate philosophy, added administrative work or satisfaction with current plan participation rates.
Figure 11: Percentage of plans with automatic enrollment by number of employees
Figure 11 depicts the percentage of plans included in the PSCA Survey, by participant count, incorporating an automatic enrollment feature. The survey shows that 50% of all plans now reframe the savings decisions for employees through an automatic enrollment feature. This number is up 3% since 2012 alone and double since 2005, the year automatic enrollment usage was first reported. The chart further shows gains in almost every plan size and larger companies are more likely to incorporate automatic enrollment.
12
37
46
63
59
46
12
33
49
59
54
42
11
22
44
55
54
38
16
22
44
54
56
40
11
25
40
48
53
36
7
10
31
31
41
24
8
10
30
31
44
25
■ 2008
■ 2007
■ 2006
■ 2005
■ 2013
■ 2012
■ 2011
■ 2010
■ 2009
14 19
50 54
37 45
65 64
62 67
47 50
All plans
5,000+
1,000 – 4,999
200 – 999
50 – 199
1 – 49
Source: PSCA
Figure 12: Percentage of automatic enrollment plans by industry
Figure 12 provides insight into the adoption rate of an automatic enrollment feature within various industrial groups. While 50% of all plans incorporate such a provision, there is a wide variance, with the highest usage rates reported among manufacturing sectors, which is consistent with prior years. It is interesting to note that the construction and engineering sector reported the most significant one-year gain, increasing 17 percentage points between 2012 and 2013 in the number of sponsors adopting an automatic enrollment feature.
47
67
33
40
60
72
39
39
37
41
37
Construction and engineering
Durable goods manufacturing
Financial
Health care
Insurance and real estate
Non‐durable goods manufacturing
Services
Technology and telecommunication
Utility and energy
Wholesale and retail trade
Other
41
69
39
54
52
70 73
62
63
43
67
58 45
36
46
43
34
40
41
44
44
36
■ 2013
■ 2012
■ 2011
Source: PSCA

Perspectives 2015:Defined contribution retirement plan benchmarks
8
Figure 13: Default deferral percentage of pay
Figure 13 shows the spectrum of default employee salary deferral rates among plans since 2006, the first year default rates were reported. Although a shift towards higher rates is evident, 3% of pay remains the most common default rate, according to the PSCA Survey. At the end of 2013, 40% of plans reported a default rate above 3%, a 4% increase over 2012; this is significantly higher than the 24% of plans that reported defaulting above the 3% level in 2006.
52 54
62 58 57
53 59
47
13 11 10
8 11
9 9
13
11 10 9 9
7 10
6
12
12 11
8 9 9 8 9
15
<3%
3%
4%
5%
>5% ■ 2008
■ 2007
■ 2006
■ 2013
■ 2012
■ 2011
■ 2010
■ 2009
13 14 13 16 16
20 16
13
Source: PSCA
Figure 14: Opt-out rates
The Deloitte Survey reports that a target date fund is the default option in 72% of plans, followed by a balanced fund in 8% of plans. The survey also reflects that opt-out rates can vary. Figure 14 reflects the opt-out rates reported in the Deloitte Survey.
Opt-out rate % of Plans Reporting
< 6% 63%
6% – 10% 17%
10% – 25% 15%
> 25% 5%Source: Deloitte
According to the Deloitte Survey, 97% of plan sponsors are generally satisfied with automatic enrollment. The survey reports increased participation in 79% of respondents, higher average deferral rates for 56% of respondents, improved nondiscrimination testing results for 39% of respondents and 57% of respondents report increased participant awareness of the retirement plan benefit.
While increased participation rates are welcome news to any plan sponsor, it is important to realize that automatic enrollment plans may have a negative effect on deferral rates and testing results. Sponsors may experience dramatic improvement upon automatic enrollment implementation, but if a significant population of employees stays at a low default rate, it can pull down the plan’s average deferral rate and negatively impact testing results. Our experience indicates that starting employees at a higher rate or combining automatic enrollment with auto-escalation can easily navigate a poor outcome. To that end, 46% of plan sponsors responding to the Deloitte Survey incorporate an automatic deferral step-up feature where a participant’s deferral rate is increased automatically each plan year; another 12% of sponsors are considering adding such a feature. The step-up is in 1% increments in 62% of plans and 2% in 36% of plans, according to the Deloitte Survey, most often set to occur on a specific date once per year.
Actions to consider:
• Is automatic enrollment right for your company?
• Would your plan benefit from a re-enrollment campaign designed to capture current employees who haven’t engaged in saving?
• Should you utilize an auto-escalation feature as a tool to drive savings rates higher?

9
Other plan design elementsIn an effort to create a retirement program that meets the needs of a diverse employee population, there are many additional plan elements that should be considered. The material presented in this section highlights the design elements that can have the most impact on employee participation and long-term savings.
Roth deferrals and in-plan conversionsThe number of plans permitting Roth contributions continues an upward trend, reaching 58% after eight years of availability and a few congressional tweaks, as reflected in Figure 15. Consistent with prior years, Roth is more common among smaller plans. An In-Plan Conversion feature is only available in 16% of respondents, according to the Deloitte Survey, which cites lack of interest as the main reason for not adopting the conversion option.
Among plans offering Roth in 2013, only 19% of participants made a Roth contribution. As reflected in Figure 16, highest use of the Roth feature is reported in the business, professional and nonprofit sector. Figure 17 highlights the less than 25 age group as the highest users of Roth, perhaps due to the interest in tax-free earnings growth.
Figure 15: Plans permitting Roth by number of employees
49%
61%
53%
47%
44%
46%
46%
58%
52%
33%
44%
42%
41%
57%
47%
33%
37%
35%
37%
52%
40%
32%
32%
29%
30%
44%
36%
24%
17%
25%
All plans
1 – 49
50 – 199
200 – 999
1,000 – 4,999
5,000+
54% 58%
68% 71%
53% 57%
46% 51%
53% 56%
51% 54%
■ 2008
■ 2007
■ 2013
■ 2012
■ 2011
■ 2010
■ 2009
Source: PSCA
Figure 16: Roth participation by industry
■ Business, professional and nonpro�t■ Agriculture, mining and construction ■ Media, entertainment and leisure■ Education and health care■ Transportation, utilities and communication■ Finance, insurance and real estate■ Manufacturing■ Wholesale and retail trade
9%
16%
8%
12%13%
16%
17% 16%
Source: Vanguard
Figure 17: Roth participation by age
24%
20%13%
11%
8%5%
■ < 25
■ 25 – 34
■ 35 – 44
■ 45 – 54
■ 55 – 64
■ 65+
Source: Vanguard
Safe harbor The PSCA Survey reported no change in the percentage of plans incorporating some sort of safe harbor contribution. As of 2013, approximately 21% of plans used a safe harbor contribution design, down from the 31% high mark of plans reported in 2011.
A traditional safe harbor contribution formula is used by 58% of respondents, 17% use an automatic enrollment matching contribution formula and 25% use an enhanced safe harbor contribution formula.

Perspectives 2015:Defined contribution retirement plan benchmarks
10
Catch-up contributions Catch-up contributions are permitted in 97% of plans responding to the PSCA Survey, a number relatively unchanged from prior years. These catch-up contributions are eligible for matching contributions in 46% of plans, an increase of 3% since 2012 reporting data.
Overall, 25% of eligible participants make a catch-up contribution, similar to rates reported in prior years. Actual usage rates vary by plan size, ranging from 47% of participants in smaller plans to just 14% in plans with more than 5,000 participants.
Contribution in Employer StockThe Deloitte Survey reports that the matching contribution is made in the form of employer stock in 16% of plans. Employees can diversify the contribution immediately in 76% of those same plans. The survey also reports that only 8% of plans fund the profit sharing contribution in the form of employer stock.
Participant loansParticipant loans are a popular plan feature, since they tend to ease apprehension among employees who are hesitant to participate without some sort of “escape hatch.” According to the PSCA Survey, 86% of plans responding offer such a loan program at the end of 2013, a 2% decline since 2012. A few additional highlights of loan programs reported in the PSCA Survey follow:
• 52% of plans permit only one loan
• When multiple loans are available, 45% permit a maximum of two or three
• 82% of plans set the loan minimum range between $500 and $1,000
• 88% of plans charge a loan origination fee, generally averaging $75
• 27% of plans charge an annual loan servicing fee, typically averaging $35
• 26% of participants have outstanding loans, up from 24% in 2012
• The average loan balance is $10,385 in 2013, an increase over prior years
• Loans average 1.8% of plan assets in 2013, down from 2.2% in 2012
The following charts reflect loan usage as reported in the Vanguard Survey:
Figure 18: Participant loan activity by income
< $30,000 24%
$30,000 – $49,999 24%
$50,000 – $74,999 22%
$75,000 – $99,999 17%
>$100,000 12%Source: Vanguard
Figure 19: Participant loan activity by age
< 25 4%
25 – 34 14%
35 – 44 22%
45 – 54 22%
55 – 64 16%
> 65 5%Source: Vanguard
Figure 20: Percentage of participants with loans by industry
Transportation, utilities and communications 24%
Agriculture, mining and construction 20%
Finance, insurance and real estate 20%
Manufacturing 20%
Wholesale and retail trade 16%
Education and health 15%
Media, entertainment and leisure 13%
Business, professional and nonprofit 11%Source: Vanguard

11
In-service and hardship withdrawalsDistribution and withdrawal provisions are also important plan design elements, providing employees with additional access to plan balances prior to separation from service. According to the PSCA Survey, 86% of all plans permit hardship withdrawals. Generally, hardships are made available under the IRS safe harbor reasons; only 1% of plans permit distributions for “other” reasons. Approximately 2% of participants requested a hardship distribution during 2013, unchanged from prior years.
In-service distributions, other than hardships, are available in 77% of plans responding to the PSCA Survey in 2013, a 6% decrease over 2012 rates, most often only after a participant reaches age 59½.
Figure 21:Vesting schedules
Vesting Figure 21 provides PSCA Survey data on the most common vesting schedules in use for company contributions. Given the operational difficulties of incorporating multiple vesting schedules, plan sponsors typically apply a single schedule across multiple contribution sources within a plan.
Vesting of profit sharing contributions, as reported in the PSCA Survey, is largely unchanged, however more plan sponsors report immediate vesting for both matching and non-matching (profit sharing) sources.
38%
5%
11%
4%
3%
17%
15%
5%
29%
5%
14%
3%
1%
16%
27%
2%
Immediate
2 – yr cliff
3 – yr cliff
3 – yr graded
4 – yr graded
5 – yr graded
6 – yr graded
Other
■ Match
■ Pro�t Sharing
Source: PSCA
Rollovers Rollovers from other retirement plans into a sponsor’s plan are accepted in 98% of plans. Rollovers are generally accepted from other profit sharing or 401(k) plans, IRAs, 403(b) plans, 457 plans and pension plans. According to the PSCA Survey, 58% of respondents require the participant to meet eligibility requirements before accepting the rollover contribution, a decline of 4% since 2012. The remaining 42% of respondents accept rollovers at any time prior to eligibility, as a means of preventing leakage of retirement plan assets.
ForfeituresAccording to the Deloitte Survey, 75% of plans use match forfeitures to reduce future company contributions. Forfeitures are allocated as additional contributions in 9% of plans, while 32% of plans apply forfeitures to reduce plan expenses first.
Forfeitures arising from profit sharing contributions receive slightly different treatment. The Deloitte Survey reports they are used to reduce employer contributions in 69% of plans, reallocated in 24% of plans and offset fees in 40% of plans.
Distribution optionsThe PSCA Survey reports that, at pre-retirement, installment distributions are available in 32% of plans at the end of 2013, a decline of 16% from 2012. Annuities were only available in 12% of plans.
The PSCA Survey also reports 57% of plans force distributions to terminated participants if the vested balance is $5,000 or less at time of termination, an increase of 11% from 2012. The survey also reports that 34% of plans incorporate a $1,000 minimum force-out limit, a drop of 9% since 2012. Only 9% of plans do not force out small balances.
Actions to consider:
• Could highly compensated employees benefit from the tax planning options provided through a Roth deferral or transfer feature?
• Would a safe harbor plan design permit your highly compensated employees to defer at a higher level?
• Is your vesting schedule consistent with peer group standards?
• Are your plan’s distribution or loan provisions meeting the needs of your participants or consistent with corporate goals?
Perspectives 2015:Defined contribution retirement plan benchmarks
12
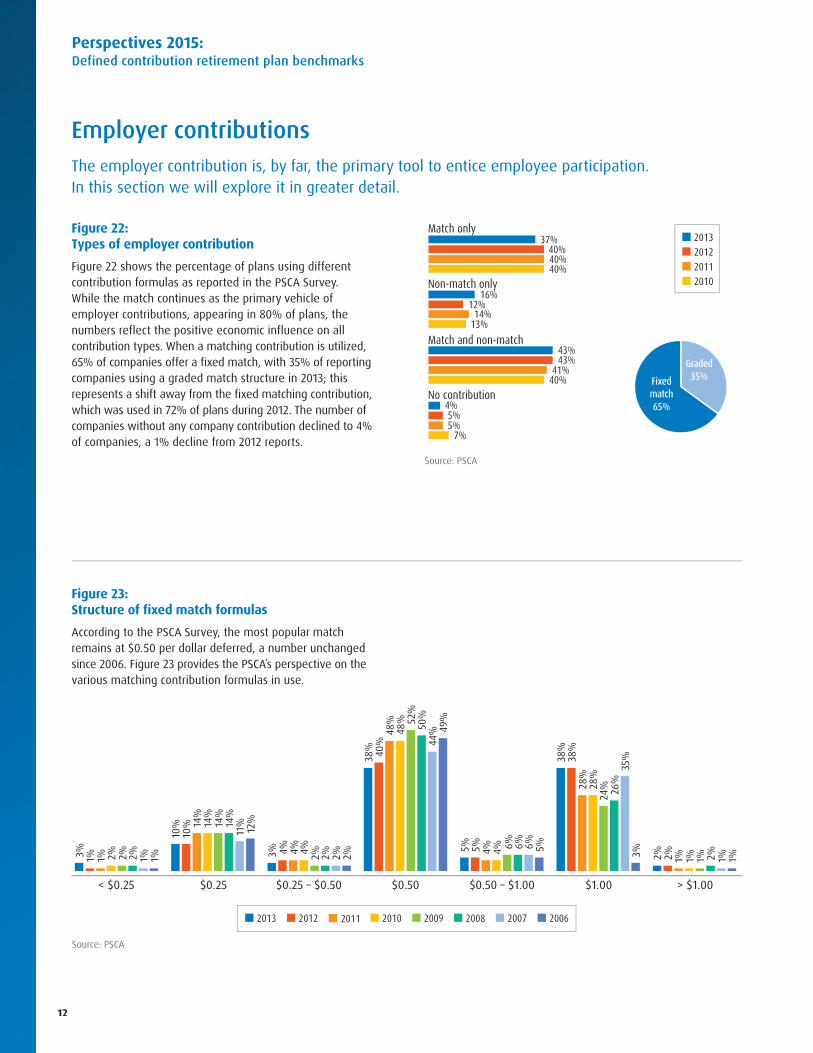
Employer contributionsThe employer contribution is, by far, the primary tool to entice employee participation. In this section we will explore it in greater detail.
Figure 22: Types of employer contribution
Figure 22 shows the percentage of plans using different contribution formulas as reported in the PSCA Survey. While the match continues as the primary vehicle of employer contributions, appearing in 80% of plans, the numbers reflect the positive economic influence on all contribution types. When a matching contribution is utilized, 65% of companies offer a fixed match, with 35% of reporting companies using a graded match structure in 2013; this represents a shift away from the fixed matching contribution, which was used in 72% of plans during 2012. The number of companies without any company contribution declined to 4% of companies, a 1% decline from 2012 reports.
40%
14%
41%
5%
40%
13%
40%
7%
Match only
Non-match only
Match and non-match
No contribution
5%
43% 43%
12%
40% 37%
16%
4%
■ 2013■ 2012■ 2011■ 2010
Source: PSCA
Figure 23: Structure of fixed match formulas
According to the PSCA Survey, the most popular match remains at $0.50 per dollar deferred, a number unchanged since 2006. Figure 23 provides the PSCA’s perspective on the various matching contribution formulas in use.
■ 2008 ■ 2007 ■ 2006■ 2013 ■ 2012 ■ 2011 ■ 2010 ■ 2009
2%
14%
4%
48%
4%
28%
1%
2%
14%
2%
52%
6%
24%
1%
2%
14%
2%
50%
6%
26%
2%
1%
11%
2%
44%
6%
35%
1%
1%
12%
2%
49%
5%
3%
1%
14%
4%
48%
4%
28%
1%
< $0.25 $0.25 $0.25 – $0.50 $0.50 $0.50 – $1.00 $1.00 > $1.00
1%
2%
2%
38%
38%
5%
5%
40%
38%
4%
3%
10%
10%
1% 3%
Source: PSCA
Fixedmatch65%
Graded35%

13
Figures 24 and 25
The frequency of employer contribution deposits to a retirement plan does positively influence participation. As shown in Figures 24 and 25, the PSCA Survey reports that matching contributions are most often funded each payroll period, with non-match contributions generally funded on an annual basis. The numbers reflect a 1% decline in respondents reporting annual funding, which is offset by a 1% increase in companies funding each payroll period.
Figure 24:Frequency of match deposit
72%
8% 1
8%
2%
71%
9% 1
9%
1%
Payrollperiod
Quarterlyor monthly
Annually Other
1%
1%
19%
18%
7%
7%
73%
74%
■ 2013 ■ 2012 ■ 2011 ■ 2010
Source: PSCA
Figure 25:Frequency of non-match deposit
18%
8%
73%
1%
19%
6%
74%
1%
Payrollperiod
Quarterlyor monthly
Annually Other
1% 4%
71%
70%
6%
4% 2
2% 2
2%
■ 2013 ■ 2012 ■ 2011 ■ 2010
Source: PSCA
Figure 26:Frequency of true-up contribution by plan size
To ensure that participants receive their maximum match as if deferrals were level throughout the plan year, 61% of plan sponsors incorporate a match true-up provision in their plan design, as shown in Figure 26, a 6% increase over 2012 figures. An increase is noted in all but the largest plan size.
57%
57%
55%
53%
61%
55%
55% 61%
72%
55%
69%
59%
52%
54%
53%
56%
56%
54%
All plans
1 – 49
50 – 199
200 – 999
1,000 – 4,999
5,000+
■ 2013
■ 2012
■ 2011
Source: PSCA

Perspectives 2015:Defined contribution retirement plan benchmarks
14
Figures 27 through 29
Figures 27 through 29 provide a glimpse into the average match amount and the maximum percentage of pay matched within industry sectors, with “All Plans” also including data for plan sponsors reporting outside of the sectors listed. Figure 27 shows that the percentage of companies matching at $0.50 per deferral dollar dropped again in 2013, setting a two-year trend. Figure 28 shows only three sectors, non-durable goods, wholesale and retail, and insurance matching at higher rates in 2013. Figure 29 reflects similar statistics.
Figure 27: Matching contribution by industry sector
8%
0% 4
%
1% 3
%
3%
20%
0%
14%
2% 5% 1
1%
0%
0%
0% 8
%
0% 9
%
44%
43%
27
% 36%
47% 5
1%
8%
0% 5
%
7%
8%
6%
20%
48%
50%
46%
37%
20%
0% 9
%
0%
0%
0%
0%
Durable goods Utility or energy Wholesale and retail Financial Insurance and real estate Services
■ $0.50 ■ $1.00■ < $0.25 ■ $0.25 – $0.50 ■ $0.50 – $1.00 ■ > $1.00■ $0.25
Source: PSCA
Figure 28: Match per dollar by industry sector
Durable goods Non-durable goods Wholesale and retail Financial Insurance and real estate Services All plans
■ 2008■ 2013 ■ 2012 ■ 2011 ■ 2010 ■ 2009 ■ 2007
$0.
59 $
0.57
$0.
56 $
0.59
$0.
60
$0.
67 $
0.57
$0.
59 $
0.59
$0.
68
$0.
57 $
0.55
$0.
51 $
0.44 $
0.60
$0.
69 $
0.65
$0.
65 $
0.69
$0.
72
$0.
61 $
0.67
$0.
62 $
0.65
$0.
73
$0.
57 $
0.59
$0.
58 $
0.63
$0.
62
$0.
63 $
0.61
$0.
60 $
0.61
$0.
66
$0.
71 $
0.69
$0.
55 $0.
68
$0.
73
$0.
68
$0.
78
$0.
54
$0.
65
$0.
67
$0.
75
$0.
66
$0.
65
$0.
55
Source: PSCA

15
Figure 29: Percent of pay matched by industry sector
4.9 5.3
5.2 5
.7
4.8
5.0
5.2
4.7 5
.7
5.1
5.3
4.6 5.0
5.1
4.5
5.4
5.0 5.4
5.1
5.3
5.0
4.9 5.3
5.3
5.1
4.7
5.0
5.1
5.1
4.
8
5.3
5.1
5.4
5.3
5.3
5.
0
5.2
5.
9
4.
5 5.
3
5.
5
5.
5
5.
3
6.1
5.3
5.2
5.4
5.4 5.8
Durable goods Non-durable goods Wholesale and retail Financial Insurance and real estate Services All plans
■ 2008■ 2013 ■ 2012 ■ 2011 ■ 2010 ■ 2009 ■ 2007
Source: PSCA
Actions to consider:
• Stretch your match dollars to encourage higher savings rates among your employees. Changing your match formula from 50% on the first 3% to 25% on the first 6% is revenue neutral, but may push some employees to higher deferral levels, resulting in an increased HCE deferral limit.
• Ensure employees understand how your company’s match or overall company contribution benchmarks against industry peers.
Perspectives 2015:Defined contribution retirement plan benchmarks
16
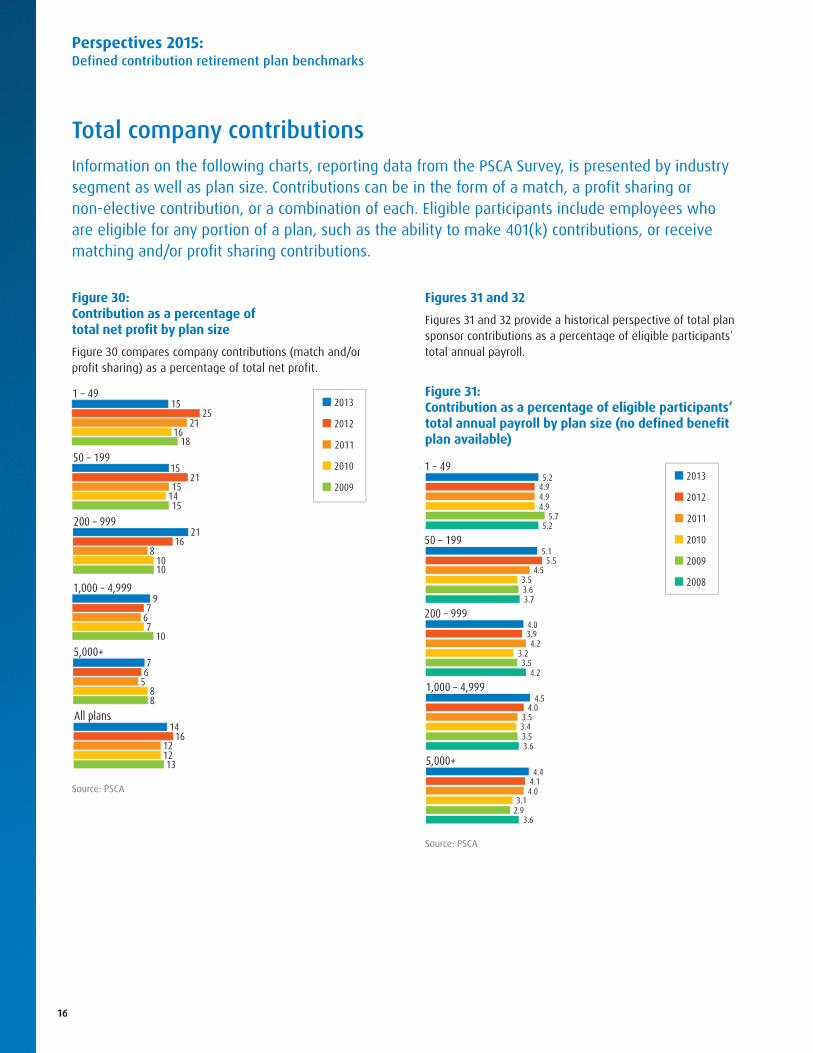
Total company contributionsInformation on the following charts, reporting data from the PSCA Survey, is presented by industry segment as well as plan size. Contributions can be in the form of a match, a profit sharing or non-elective contribution, or a combination of each. Eligible participants include employees who are eligible for any portion of a plan, such as the ability to make 401(k) contributions, or receive matching and/or profit sharing contributions.
Figure 30: Contribution as a percentage of total net profit by plan size
Figure 30 compares company contributions (match and/or profit sharing) as a percentage of total net profit.
■ 2013
■ 2012
■ 2011
■ 2010
■ 2009
21 16
18
1 – 49
15 14 15
50 – 199
8 10 10
200 – 999
6 7
10
1,000 – 4,999
5 8 8
5,000+
12 12 13
All plans
16
6
7
16
21
25
14
7
9
21
15
15
Source: PSCA
Figures 31 and 32
Figures 31 and 32 provide a historical perspective of total plan sponsor contributions as a percentage of eligible participants’ total annual payroll.
Figure 31: Contribution as a percentage of eligible participants’ total annual payroll by plan size (no defined benefit plan available)
■ 2013
■ 2012
■ 2011
■ 2010
■ 2009
■ 2008
4.9
4.5
4.2
3.5
4.0
4.9
3.5
3.2
3.4
3.1
5.7
3.6
3.5
3.5
2.9
5.2
3.7
4.2
3.6
3.6
1 – 49
50 – 199
200 – 999
1,000 – 4,999
5,000+
4.1
4.0
3.9
5.5
4.9
4.4
4.5
4.0
5.1
5.2
Source: PSCA

17
Figure 32: Contribution as a percentage of eligible participants’ total annual payroll by sector
■ 2013
■ 2012
■ 2011
■ 2010
■ 2009
4.1
4.8
3.6
4.1
3.7
4.0
3.1
6.2
3.7
3.1
3.7
4.6
3.5
3.1
3.1
4.0
2.3
3.5
3.7
4.9
4.6
4.2
3.7
3.6
3.4
3.3
3.2
2.6
Non-durable goods
Financial
Insurance and real estate
Durable goods
Construction
Services
Wholesale and retail
Utility
Health care
Other*
3.1
4.1 2.9
2.0
4.8
4.9
5.1
3.8
5.3
5.0
3.0
5.0
4.9
3.7
5.0
5.1
4.6
3.6
4.5
4.7
3.6
5.3
Source: PSCA
* Includes transportation category and, prior to 2011, engineering and construction
Actions to consider:
• Share your company’s contribution statistics and benchmark rankings with employees so they can fully appreciate the benefit you provide.
• Is your company contribution reflecting how you want to compare, relative to your peers?

Perspectives 2015:Defined contribution retirement plan benchmarks
18
Employee contributionsVanguard Survey data indicates that the average employee contribution rate is staying steady at 7% for actively contributing employees, regardless of plan size.
Figure 33: Dispersion of employee deferral rates by percent of compensation deferred
Figure 33 reflects the dispersion of employee deferral rates as a percentage of salary in the Vanguard Survey that shows a 1% gain in the percentage of rates between 0.1% and 3.9%, which may be a result of increased automatic enrollment usage.
■ 2013
■ 2012
■ 2011
■ 2010
■ 2009
■ 2008
28 30
34 31
23 25
21 22
27 24 24
25
15 14 14
15
7 7 7 7
0.1 – 3.9%
4.0 – 6.0%
6.1 – 9.9%
10.0 – 14.9%
15.0%+
29 30
22 22
27 26
15 15
7 7
Source: Vanguard
Figure 34: Deferral rate by industry sector
Figure 34 highlights the deferral rates of actively deferring employees by industry sector, which also reflect no statistical change from historical numbers.
■ 2013
■ 2012
■ 2011
■ 2010
7.8%
7.6%
8.1%
6.4%
6.7%
6.6%
5.9%
7.0%
7.1%
7.9%
7.7%
7.9%
7.0%
6.6%
6.6%
6.2%
6.2%
6.8%
7.8% 7.8%
7.7% 7.3%
8.2% 8.0%
6.4% 7.6%
6.5% 6.2%
6.6% 6.6%
7.1% 7.0%
7.0% 7.0%
5.8% 6.1%
Agriculture, mining and construction
Business, professional and nonpro�t
Education and health care
Media, entertainment and leisure
Finance, insurance and real estate
Manufacturing
Wholesale and retail trade
Transportation, utilities and communications
Overall
Source: Vanguard

19
Figures 35 through 38
Figures 35 through 38 provide a holistic overview of the deferral rates of actively deferring participants, segmented by demographical data, including job tenure, age, salary and account balance. The impact of stagnation in the overall deferral rate is evidenced by only minor changes in year-over-year rates. Although not reflected here, the Vanguard Survey does report that women tend to save at a rate higher in all categories.
Figure 35: Deferral rate by salary
4.8%
5.8%
7.1%
8.3%
8.2%
4.8%
5.8%
7.0%
8.3%
8.3%
4.7%
5.7%
7.0%
8.4%
8.3%
< $30K
$30K – $50K
$50K – $75K
$75K – $100K
$100K+
4.7%
5.7%
7.0%
8.2%
8.3%
4.7%
5.6%
6.9%
8.0%
8.4%
■ 2013
■ 2012
■ 2011
■ 2010
■ 2009
Source: Vanguard
Figure 36: Deferral rate by age
4.2%
5.6%
6.4%
7.4%
8.7%
10.1%
3.9%
5.4%
6.2%
7.2%
8.6%
10.1%
3.8%
5.3%
6.1%
7.2%
8.6%
9.9%
< 25
25 – 34
35 – 44
45 – 54
55 – 64
65+
4.3%
5.5%
6.4%
10.0%
7.4%
8.7%
4.5%
5.6%
6.4%
10.1%
7.4%
8.8%
■ 2013
■ 2012
■ 2011
■ 2010
■ 2009
Source: Vanguard
Actions to consider:
• Automatically enroll employees at rates above 3%, perhaps at your match level.
• Incorporate an auto-escalation campaign to combat employee inactivity.

Perspectives 2015:Defined contribution retirement plan benchmarks
20
Figure 37: Deferral rate by job tenure (years)
■ 2013
■ 2012
■ 2011
■ 2010
■ 2009
4.8%
6.5%
6.8%
7.2%
8.0%
4.4%
6.0%
6.5%
7.0%
7.7%
4.8%
5.8%
6.4%
6.8%
7.7%
< 2
2 – 3
4 – 6
7 – 9
10+
4.9%
6.2%
6.9%
7.2%
8.1%
4.9%
6.1%
7.0%
7.1%
8.1%
Source: Vanguard
Figure 38: Deferral rate by account balance
■ 2013
■ 2012
■ 2011
■ 2010
■ 2009
3.8%
5.9%
7.0%
8.3%
9.9%
10.5%
3.7%
5.7%
6.8%
8.2%
10.0%
10.7%
3.6%
5.8%
7.1%
8.4%
10.2%
10.7%
< $10K
$10K – $25K
$25K – $50K
$50K – $100K
$100K – $250K
> $250K
3.8%
5.9%
7.0%
8.1%
9.8%
10.6%
3.7%
5.9%
6.9%
7.9%
9.5%
10.5%
Source: Vanguard

21
Participant account balancesAverage participant balances are just one factor used to determine the health of a participant’s retirement savings. However, balances reflected in the survey data presented may not reflect the entire picture of a participant’s lifetime of saving toward retirement. It is possible that some employees rolled plan assets from a prior employer into an IRA, or they may have left a balance in a prior employer’s plan. According to the PSCA Survey, at year-end 2013, terminated participants constitute 23% of total retirement plan participants with an account balance, a 1% increase over 2012 year-end data. Actual rates vary among plan size, with terminated participants representing 18% of participants in plans with fewer than 50 participants and plans with 5,000 or more reporting 25% terminated participants with a plan balance.
Figures 39 through 42
In the following charts, median account balances represent the midpoint in reported data, with half of the participants covered by the survey above the median number and half below. Notably, “balances” reported in the Vanguard Survey represent retirement funds in the employer-sponsored accounts reported; balances in a participant’s prior plan or IRA are not included.
Figures 39 through 42 reflect data as reported in the Vanguard Survey, which is based on 2013 account balances. As reflected, account balances rise with age and job tenure and can vary greatly by industry, and may be affected by plan design, employee demographics and company culture.
The need to engage employees in saving for retirement is evidenced by the dispersion of account balances as reflected in Figure 39. As reported in the Vanguard Survey, 64% of participants have an average account balance below $60,000, a
two percent decrease from 2012 data. Despite efforts, only 26% of participants have an average balance greater than $100,000.
The Vanguard Survey also reports the average account balance of $101,650 and a median account balance of $31,396. Women are reported to have an average account balance of $78,007 and a median balance of $25,737. The average account balance for households with income between $50k and $75k is $87,211 versus a median of $35,165. Among households with income greater than $100k, the median account balance is $80,237 and the average is $182,313 reflecting the ability to save at higher rates as income rises.

Perspectives 2015:Defined contribution retirement plan benchmarks
22
Figure 39: Distribution of account balances
■ < $10K■ $10K – $20K■ $20K – $40K■ $40K – $60K■ $60K – $80K■ $80K – $100K■ > $100K
12%
14%
6%
8%
4%
26% 30%
Source: Vanguard
Figure 40: Account balance by age
$4,407
$25,259
$65,204
$122,566
$180,771
$202,800
$1,580
$10,272
$27,747
$52,236
$76,381
$72,957
< 25
25 – 34
35 – 44
45 – 54
55 – 64
65+
■ Average
■ Median
Source: Vanguard
Figure 41: Account balance by job tenure (years)
$11,104
$25,864
$52,900
$78,128
$188,684
$2,605
$11,263
$25,479
$40,003
$97,614
< 2
2 – 3
4 – 6
7 – 9
10+
■ Average
■ Median
Source: Vanguard
Figure 42: Account balance by industry sector
$94,679
$86,627
$69,012
$62,905
$40,365
$28,492
$18,278
$16,121
Media, leisure and entertainment
Transportation, utilities and communication
Education and health care
Wholesale and retail trade
■ Average
■ Median $228,842
$103,617
$99,760
$117,076
$68,919
$38,548
$36,507
$37,014
Agriculture, mining and construction
Manufacturing
Finance, insurance and real estate
Business, nonprot and professional
Source: Vanguard

23
Figure 44: Number of investments available for participant direction
While fiduciaries limit exposure by choosing a default fund appropriate for the participant population, the plate of Plan investments available for participant direction generally consist of mutual funds, stable value funds or collective funds. Separately managed accounts are typically found only in the largest plans, due to cost; the use of Exchange Traded Funds (ETFs) is not reported, as these are generally not available to daily-valued retirement plans. Figure 44 reflects the trend shown in the PSCA Survey regarding the number of funds offered for participant direction.
30%
31%
27%
3%8%1%
■ 1
■ 2 – 9
■ 10
■ 11 – 15
■ 16 – 20
■ 21+
Source: PSCA
InvestmentsThe array of investment options available to participants in a retirement plan continues to expand. The focus has resulted in closer scrutiny of the number and type of options provided for participant direction, as well as the associated expenses.
Figure 43: Default investment vehicle
To limit fiduciary liability, plan sponsors have enhanced their review process and embraced the use of a Qualified Default Investment Alternative as the default option for participants who make no affirmative investment election upon plan enrollment. Figure 43 identifies the default options offered
among automatic enrollment retirement plans, as reported in the PSCA Survey. A majority of plan sponsors use target lifecycle funds as the default, a finding that is consistent across surveys and reflects the trend towards greater diversification of participant accounts.
Stable value/MMrkt OtherLifecycle, target dateLifestyle, target riskBalanced
■ 2008■ 2013 ■ 2012 ■ 2011 ■ 2010 ■ 2009 ■ 2007
3% 1
3%
10%
70%
4%
5% 1
2%
27%
53%
3%
3%
14% 2
0%
57%
6%
4% 1
3% 18%
60%
6%
7% 9%
21%
49%
7%
2%
1%
13%
9%
72%
6% 1
1%
73%
5%
16%
Source: PSCA

Perspectives 2015:Defined contribution retirement plan benchmarks
24
Figure 45: Number of investments available by plan size (reflects a series of lifecycle or target age funds counted as one fund)
The average number of funds available for participant direction has not changed in recent years. When a series of lifecycle risk-based or target age funds are counted as one fund, the average number of funds is holding at 19; when counted individually, the average number available is 27. There is a slight difference, however, when viewed by plan size, as shown in Figure 45. Smaller plans, with tighter administrative control, tend to offer a higher number of funds.
22 19
22
22 23
21
18 17 17
18 20
18
17 16
15
1 – 49
50 – 199
200 – 999
1,000 – 4,999
5,000+
23 24
21 21
18 18
19 19
16 16
■ 2013
■ 2012
■ 2011
■ 2010
■ 2009
Source: PSCA
Figure 46: Core investment fund options offered
While no two plans are exactly alike due to company and participant demographics, the overall mixture of asset classes available is similar. Figure 46 identifies the most common asset classes offered as a percentage of plans reporting in the PSCA Survey.
60%
80%
43%
23%
27%
54%
22%
83%
90%
34%
87%
20%
69%
31%
20%
64%
14%
62%
78%
50%
12%
27%
51%
22%
82%
89%
41%
84%
22%
64%
28%
18%
62%
8%
76%
79%
54%
12%
20%
60%
22%
82%
87%
47%
86%
36%
62%
33%
24%
66%
15%
Balanced stock/bond
Bond, domestic managed
Bond, domestic index
Bond, international
Brokerage window
Cash equivalent
Company stock
Equity, domestic index
Equity, domestic managed
Equity, international index
Equity, international managed
Target risk
Target date
Real estate
Sector, other
Stable value
Other
55%
77%
41%
19%
23%
23%
48%
19%
58%
26%
14%
17%
64%
83%
36%
86%
80%
49%
84%
40%
19%
26%
22%
47%
13%
60%
30%
16%
16%
67%
84%
32%
89%
81%
■ 2013
■ 2012
■ 2011
■ 2010
■ 2009
Source: PSCA

25
Figure 47: Average number of funds offered by asset class
When establishing a Plan’s investment lineup, it is also important to consider the overall mix of options offered within each asset class. The data in Figure 47 reflects how a typical investment array may appear. Most generally, only one option per asset class is offered as a way to provide diversification but minimize participant confusion, which may arise when multiple funds are offered of similar investment style. The exception to this generalization is in the actively managed domestic equity category, which is comprised of a nine-array style box covering large,- mid- and small-company stocks as well as value, blend and growth investment styles.
Balanced Stock/Bond Fund 1
Bond, actively managed domestic 2
Bond, indexed domestic 1
Bond, international 0
Cash equivalent/money market 1
Equity, actively managed domestic 6
Equity, actively managed international 2
Equity, indexed domestic 2
Equity, indexed international 0
Sector (generally used by fewer than 20% of plans) 1
Real estate 0
Stable value 1
Source: PSCA
Figure 48: Average retirement plan asset allocation
Although the typical plan lineup includes a number of options representing different asset classes, usage of those options among participants can paint a substantially different picture, as evidenced by the data in Figure 48. There is strong correlation to the average retirement plan asset allocation, however, with a higher percentage of participants choosing to invest in equity funds, attributing to a greater percentage of plan assets directed to equity sectors.
Investment
% of plan
offering
% of participants
using
Stable value 58 23
Bond fund
Active 68 14
Index 88 19
Inflation protected 32 5
High-yield 18 6
International 7 12
Balanced fund
Traditional 75 23
Target risk 24 35
Target date 86 61
Domestic
Active 95 31
Index 98 35
Large-cap value 92 18
Large-cap growth 93 21
Large-cap blend 98 30
Mid-cap 88 20
Small-cap 87 17
International
Active 85 21
Index 59 16
Emerging market 27 8
Sector
REIT 28 8
Health care 12 9
Energy 8 7
Precious metals 5 3
Technology 2 8
Communications 1 5
Utilities 1 6
Company stock 10 55
Self-directed brokerage 13 1
Source: Vanguard

Perspectives 2015:Defined contribution retirement plan benchmarks
26
Figures 49 and 50
Figure 49 outlines the typical asset allocation of all plan assets reported in the PSCA Survey. The percentages reported are largely unchanged over the years, a reflection that most employees do not actively manage their plan account. Overall asset allocation does vary by industry group, as reported in Figure 50, reporting data from the Vanguard Survey.
Figure 49: Average asset allocation
Balanced stock/bond Equity, international index
6% 7%
5%
5% 6%
1% 2% 1%
2% 1%
Bond, domestic managed
Bond, domestic index
Bond, international
Brokerage window
Cash equivalent
Company stock
Equity, domestic index
Equity, domestic managed
Equity, international managed
Target risk
Target date
Real estate
Sector, other
Stable value
Other
■ 2011
■ 2010
■ 2009
■ 2013
■ 2012
8%
2%
1%
3%
4%
4%
9%
25%
8%
5%
12%
1%
1%
11%
1%
7%
2%
0%
3%
4%
4%
9%
25%
8%
5%
13%
1%
1%
10%
1%
11%
1%
0%
2%
4%
4%
8%
29%
10%
4%
10%
1%
1%
10%
1%
8%
2%
1%
4%
4%
4%
2%
10%
1%
1%
4%
13%
8%
24%
10%
7%
2%
0%
2%
4%
3%
1%
8%
1%
1%
4%
17%
7%
26%
10%
Source: PSCA
Figure 50: Average asset allocation by industry sector
■ Cash/Equivalent ■ Bond funds ■ Balanced funds
■ Target-date funds ■ Diversi�ed equity ■ Company stock
9% 6% 7% 39% 34% 5%
Agriculture, mining and construction
Business, professional and nonpro�t
Media, entertainment and leisure
Transportation, utilities and communications
Manufacturing
Education and health care
Wholesale and retail trade
Finance, insurance and real estate
11% 4% 4% 36% 23% 22%
10% 4% 9% 44% 22% 11%
0% 8% 5% 27% 34% 26%
12% 4% 7% 44% 27% 6%
10% 5% 6% 45% 28% 6%
10% 6% 10% 41% 32% 1%
11% 6% 4% 47% 30% 2%
Source: Vanguard

27
Plan sponsors should offer a diverse investment mix and follow an established discipline to minimize fiduciary exposure. It is interesting to note that 58% of respondents to the Deloitte Survey report having up to one quarter of plan assets invested in proprietary products, and another 18% report using up to 50% proprietary funds.
The Deloitte Survey reports that investment committees typically establish a formal operating framework and 86% of respondents have adopted a formal written investment policy. To demonstrate fiduciary responsibility, 65% of plan committees review investments against benchmarks on a quarterly basis. Another 18% review investments semi-annually and 15% review investments annually. The frequency is largely dependent on plan size and complexity.
When an investment change is warranted, 71% of sponsors replace the underperforming investment with another choice according to the Deloitte Survey. That survey also reports that 13% of respondents add a fund of the same style, with 15% of sponsors phasing out the fund over a period of time.
Policies implemented to curb frequent trading activity continue to apply, with 60% of respondents in the Deloitte Survey indicating that a fund trading restriction applies either at the plan or investment level. This number is up dramatically from the 2010 survey, in which only 55% of sponsors indicated some sort of restriction applied.
Actions to consider:
• Ensure your investment menu is meeting plan objectives.
• Tier investment menu for participant profiles that exist in your plan population.
• Provide investment education to participants on a routine basis.
• Provide investment fiduciary education to committee members.
• Implement, review and follow investment policies; take action as necessary to manage the investment lineup.

Perspectives 2015:Defined contribution retirement plan benchmarks
28
Plan expensesRetirement plan expenses are a major focus point in plan administration and to the Department of Labor, which feels more disclosure is necessary.
Plan expenses cover a broad range of services and may be best understood when examined by underlying components. Expenses can be grouped into administrative, recordkeeping, investment and consulting services:
• Administrative services generally include compliance, legal, audit, trustee, communication and education services.
• Recordkeeping expenses can cover plan systems, compliance and participant services.
• Investment fees typically include the fund expense ratio or other fund-level fees.
• Consulting fees typically include the expenses associated with an investment consultant or financial advisor.
Plan expenses can be charged directly to the plan sponsor or participant balances. More commonly, plan services are funded in whole or in part by a portion of the fund-level revenue (12b-1 or other shareholder servicing fees).
Perhaps the easiest way to understand and compare plan fees is on an “all-in” basis. This bottom line approach simplifies the analysis and permits an “apples-to-apples” comparison. Remember, however, that participant activity fees, such as distribution or loan fees, are not often covered by the “all-in” fee. These fees are generally passed through directly to the participants.
According to the Deloitte/ICI Fee Study, the average “all-in” fee is 0.73% of plan assets, and the median is 0.67%, or approximately $267 per participant. Fees are affected by both the average plan account balance and the number of participants. According to the same study, a small plan with less than $10 million can expect a fee of near 1.27% of assets, while a plan with $500 million can expect fees to approximate 0.37% of assets.
In addition to total plan assets and average account size, two of the largest factors influencing fees, plan costs can be affected by a number of other variables, including:
• Number of plan participants
• Plan sponsor industry
• Geographic location
• Number of locations/payrolls
• Contribution/distribution rates
• Number of investment options
• Proprietary/non-proprietary fund ratio
• Investment allocation
• Provider size/relationship/tenure
• Auto enrollment/auto increase feature
• Loan option
• Annual cash flow of the plan

29
Figures 51 through 54
Figures 51 through 54 reflect fees as a percentage of plan assets, as reported by respondents to the Deloitte/ICI Fee Study during 2013. Each chart highlights the “all-in” fee as stratified by plan size, participant count or average account. Economies of scale are evident as plan size and, generally, average account balance grows. Smaller plans tend to have the highest expenses primarily due to the fixed costs associated with servicing a plan. Investment fees, too, tend to decline as plan size grows through the increased availability and use of institutional share class mutual funds to those plans.
Figure 51: All-in fees by plan asset size
1.27%
0.89%
0.57%
0.37%
1.17%
0.82%
0.63%
0.41%
1.65%
1.28%
0.90%
0.67%
0.70%
0.59%
0.35%
0.24%
$1M – $10M
$10M – $100M
$100M – $500M
> $500M
■ Median
■ Average
■ 90th%
■ 10th%
Source: Deloitte/ICI
Figure 52: All-in fees by participant count
1.12%
1.21%
0.55%
0.39%
1.16%
1.09%
0.59%
0.46%
1.75%
1.30%
0.96%
0.35%
0.70%
0.61%
0.35%
0.24%
100 – 499
500 – 999
0.70% 0.74%
1.07% 0.44%
1,000 – 4,999
5,000 – 9,999
10,000+
■ Median
■ Average
■ 90th%
■ 10th%
Source: Deloitte/ICI
Figure 53:All-in fees by participant count and average account balance
0.96%
1.31%
1.27%
0.82% 0.64%
0.98%
0.58%
0.70%
0.50% 0.68%
0.35%
0.87%
0.93%
0.58%
0.60%
All plans
100 – 499
500 – 999 0.69%
0.29% 0.39%
10,000+
1,000 – 4,999
5,000 – 9,999
■ < $25K
■ $25K – $100K
■ > $100K
Source: Deloitte/ICI
Figure 54:Median all-in fees by average account balance and plan size
0.96%
1.29%
0.84%
0.70% 0.64%
1.03%
0.79%
0.55%
0.39% 0.43%
0.35%
0.96%
0.77%
0.59%
0.29%
All plans
$1M – $10M
$10M – $100M
$100M – $500M
> $500M
■ < $25K
■ $25K – $100K
■ > $100K
Source: Deloitte/ICI

Perspectives 2015:Defined contribution retirement plan benchmarks
30
Figure 55: Payment of plan expenses
While plan expenses can normally be paid by the plan sponsor or deducted from plan assets, certain fees deemed “settlor expenses,” those generally associated with establishing, designing or terminating a plan, cannot be charged against plan assets. Figure 55 reflects that plan sponsors pay the larger portion of most expenses, except for investment management costs.
37%
35%
24%
75%
37%
16%
61%
36%
58%
30%
59%
9%
52%
70%
15%
53%
5%
35%
17%
16%
11%
14%
24%
11%
Audit
Communication
Consultant
Investment management
Investment consulting
Legal
Recordkeeping
Trustee
■ Plan
■ Company
■ Shared
Source: PSCA
The majority of plan sponsors report that their plan’s fees are competitive and report that they have no difficulty obtaining the basis for fees charged from plan service providers. It remains to be seen if the increased scrutiny and regulatory guidance requiring additional disclosure that became effective in 2012 leads to a clearer understanding among plan sponsors and participants alike.
Actions to consider:
• Create a fee policy for your plan.
• Review and update your current policy, if necessary.
• Review 408(b)(2) Fee Disclosures received from your service providers.
• Understand your plan’s fee structure.
• Benchmark your plan fees against peers.

31
Other benefitsA defined contribution plan is only one component of an employer’s overall employee benefit package. Other programs offered may include a pension plan, an Employee Stock Ownership Plan, a nonqualified plan, a health savings account or a flexible benefit/cafeteria plan. We conclude our review of plan benchmarks with a brief look at a few alternative benefits.
Nonqualified supplemental plans Nonqualified retirement plans, including supplemental executive retirement plans (SERPs), do not meet the IRS or Employee Retirement Income Security Act (ERISA) requirements for favorable tax treatment and are often used to additionally compensate key employees. A common approach is to fund the plan with insurance benefits that will be paid at retirement age in the form of an annuity and taxed as ordinary income only when received by the employee. A survey of nonqualified plans by the PSCA and Boston Research Group received responses from 385 U.S. plan sponsors of varying sizes and industries.
Among the findings: Nonqualified plans continue to be more common among large companies with fewer than 10% of small companies (fewer than 500 employees) offering a nonqualified plan vs. 70% of companies with 25,000 or more employees. On average, 8% of all employees are eligible to participate in their company’s nonqualified plan and nearly two-thirds of eligible employees participate.
Other highlights include:
• The majority of plans are “account balance” plans similar to qualified defined contribution plans (83%), as opposed to “non-account balance” plans, which are similar to a defined benefit plan.
• About 40% of plans match an employee’s contribution in account balance plans and 45% provide a non-matching employer contribution.
• Only 28% of plan sponsors feel that their plan has completely met their overall objectives.
Employee stock ownership plans Employee Stock Ownership Plans (ESOPs) number nearly 7,000, covering roughly 13.5 million employees as of 2014, according to the National Center for Employee Ownership (NCEO). Since the beginning of the 21st century, there has been a decline in the number of plans but an increase in the number of participants. There also are about 2,000 profit sharing and stock bonus plans that are substantially invested in company stock and are like ESOPs in other ways. In addition, the NCEO estimates that roughly 9 million employees participate in plans that provide stock options or other individual equity to most or all employees. Up to 5 million participate in 401(k) plans that are primarily invested in employer stock. As many as 11 million
employees buy shares in their employer through employee stock purchase plans. Eliminating overlap, the NCEO estimates that approximately 28 million employees participate in an employee ownership plan. These numbers are estimates, but are probably conservative. Overall, employees now control about 8% of corporate equity.
Although other plans now have substantial assets, most of the estimated 4,000 majority employee-owned companies have ESOPs.
About two-thirds of ESOPs are used to provide a market for the shares of a departing owner of a profitable, closely held company. Most of the remainder is used either as a supplemental employee benefit plan or as a means to borrow money in a tax-favored manner. Fewer than 3% of plans are in public companies. In contrast, stock option or other equity compensation plans are used primarily in public firms as an employee benefit and in rapidly growing private companies.
Health savings accountsAccording to the 2013 Devenir HSA Research Report, HSA accounts rose to 10.7 million, holding assets totaling more than $19.3 billion, a year over year increase of 25% for HSA assets and 30% for accounts for the period of December 31, 2012 to December 31, 2013. The average funded HSA account balance at the end of 2013 was $2,356 compared to $2,283 at the end of 2012, a 3.2% increase.
In 2013 there were more than 2,200 banks and credit unions offering health savings accounts, reflecting a growing industry. HSA investment assets almost reached an estimated $2.3 billion in December, up 30% from the end of 2012. The average investment account holder has an $11,350 average total balance (deposit and investment account).
Perspectives 2015:Defined contribution retirement plan benchmarks
32
ReferencesSurvey data presented in this booklet, representing the most recent information available, is taken from the following surveys:
The Profit Sharing Council of America’s 57th Annual Survey (“PSCA Survey”)This survey reports on the 2013 plan year experience of 613 profit sharing and 401(k) plans covering 8 million participants and $832 billion in plan assets. The data is collected from plan sponsors invited to complete an online or hard-copy survey and represents a diverse array of plan sizes ranging from fewer than five participants to hundreds of thousands of participants. Company sizes, geographic locations, asset sizes and industries are quite diverse, as well.
The Deloitte 401(k) Benchmarking Survey, 2013-2014 Edition (“Deloitte Survey”)Information in this survey is compiled from the online responses of 265 employers. Respondents were evenly distributed geographically and included both publicly and privately held companies. The size of respondents varied, from plans with fewer than 100 to plans with more than 10,000 participants.
The Deloitte/Investment Company Institute Defined Contribution/401(k) Fee Study (“Deloitte/ICI Fee Study”)The Investment Company Institute engaged Deloitte to conduct this survey of defined contribution plan sponsors. The survey reviewed data from ICI, as well as a Web-based survey conducted by Deloitte during 2013. A total of 361 plan sponsors participated in the survey, providing detailed information regarding plan characteristics, design, demographics, products, services and associated fees. While the survey is not intended to be a statistical representation of the defined contribution/401(k) marketplace, Deloitte and ICI reported that the demographics of the plans participating in the survey appeared similar to the broader market.
Vanguard How America Saves 2014 (“Vanguard Survey”)The data in this survey is drawn from the universe of the Vanguard qualified plan clients consisting of more than 1,900 plans, 1,500 clients and more than three million participants. The data represents information reported as of December 31, 2013.

Contact usFor more information, contact your BMO representative or use one of these options:
1-866-418-9339
bmoretirementservices.com
Follow

BMO Retirement Services is a part of BMO Global Asset Management.BMO Retirement Services is a part of BMO Global Asset Management and a division of the BMO Harris Bank N.A., offering products and services through various affiliates of BMO Financial Group. BMO Global Asset Management is the brand name for various affiliated entities of BMO Financial Group that provide investment management, retirement, and trust and custody services. Certain of the products and services offered under the brand name BMO Global Asset Management are designed specifically for various categories of investors in a number of different countries and regions and may not be available to all investors. Those products and services are only offered to such investors in those countries and regions in accordance with applicable laws and regulations. BMO Financial Group is a service mark of Bank of Montreal (BMO). Investment products are: NOT FDIC INSURED — NO BANK GUARANTEE — MAY LOSE VALUE.© 2015 BMO Financial Corp. 310773 (3/15)


