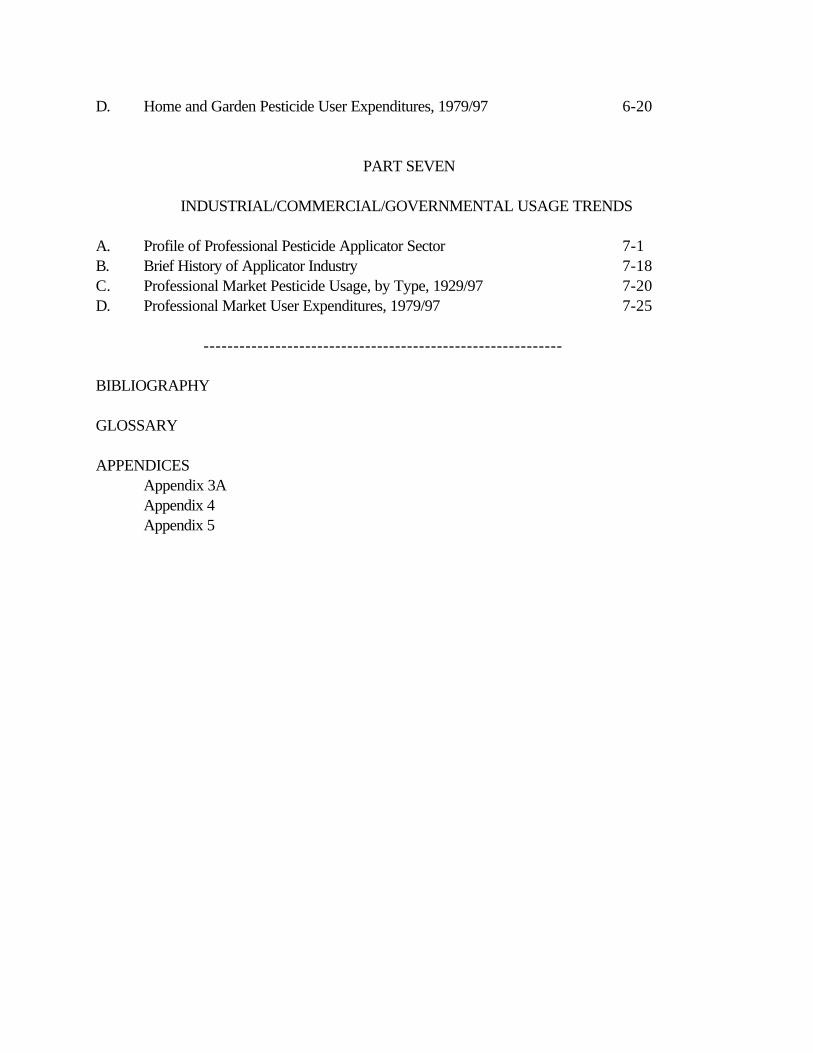
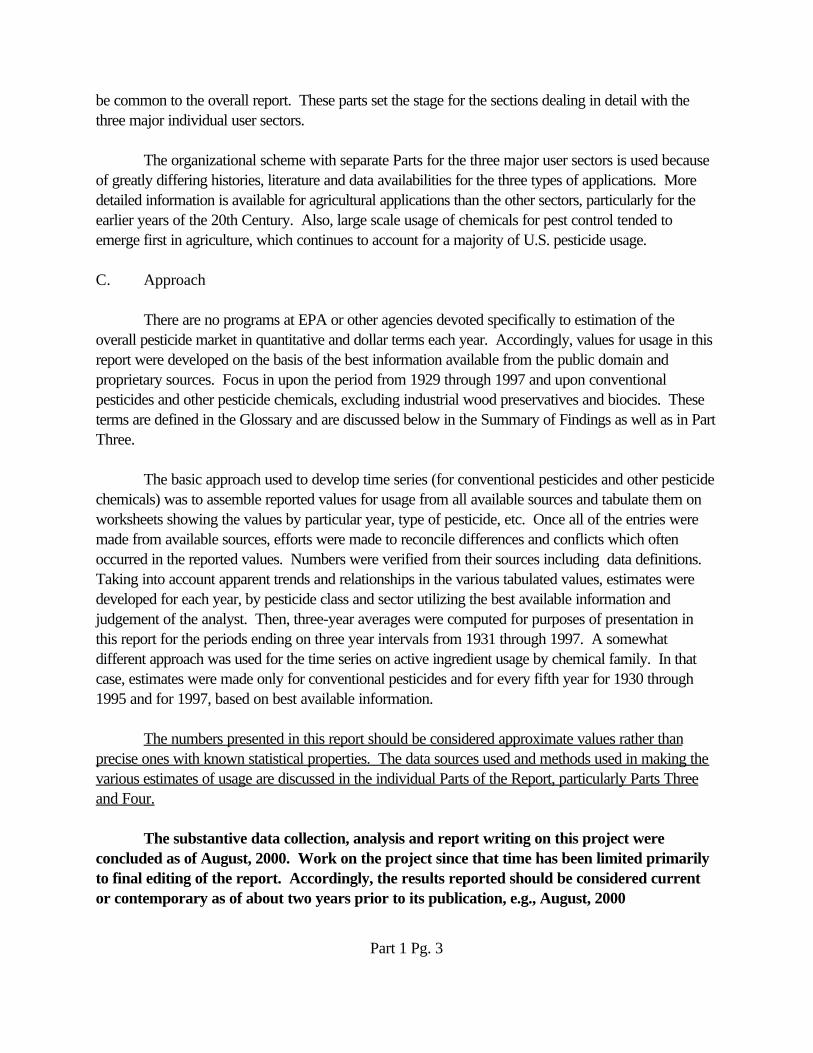
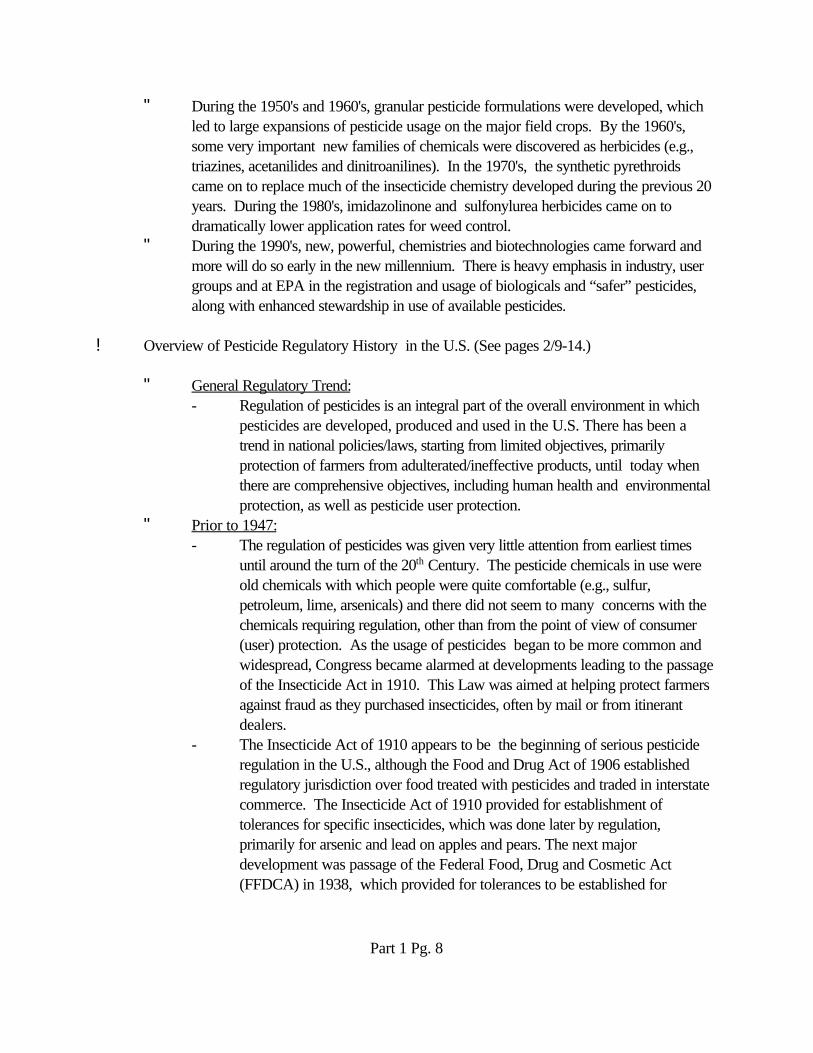
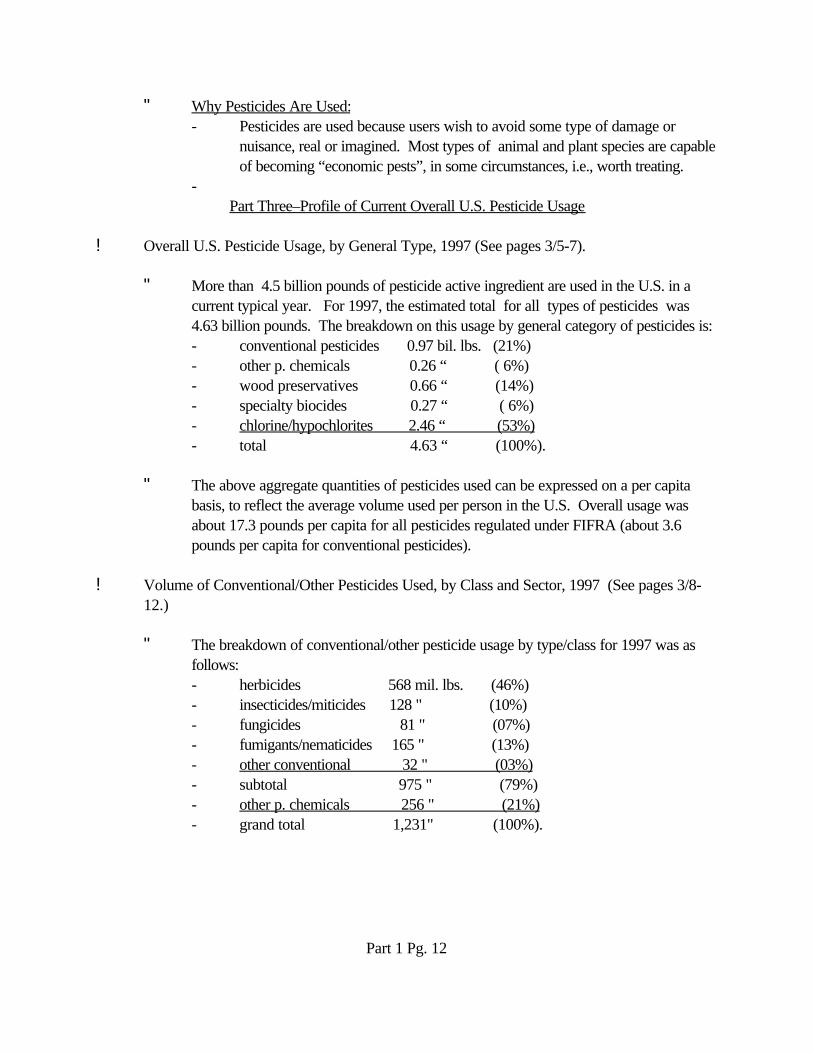
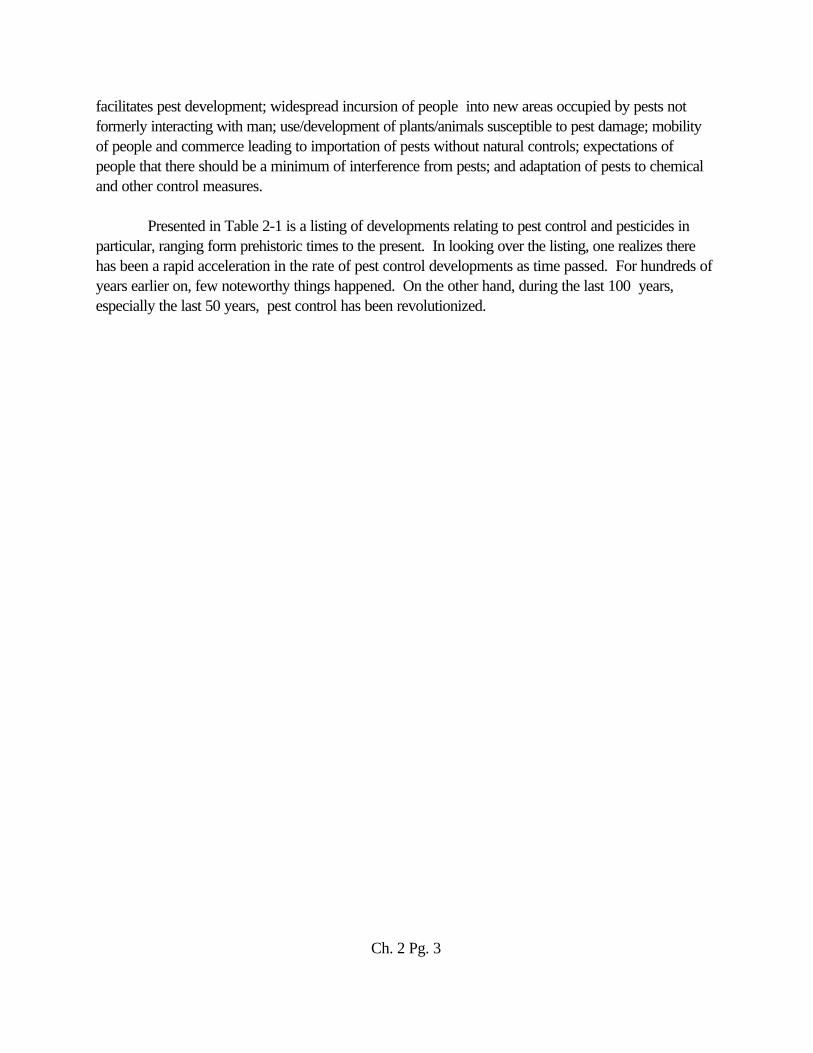
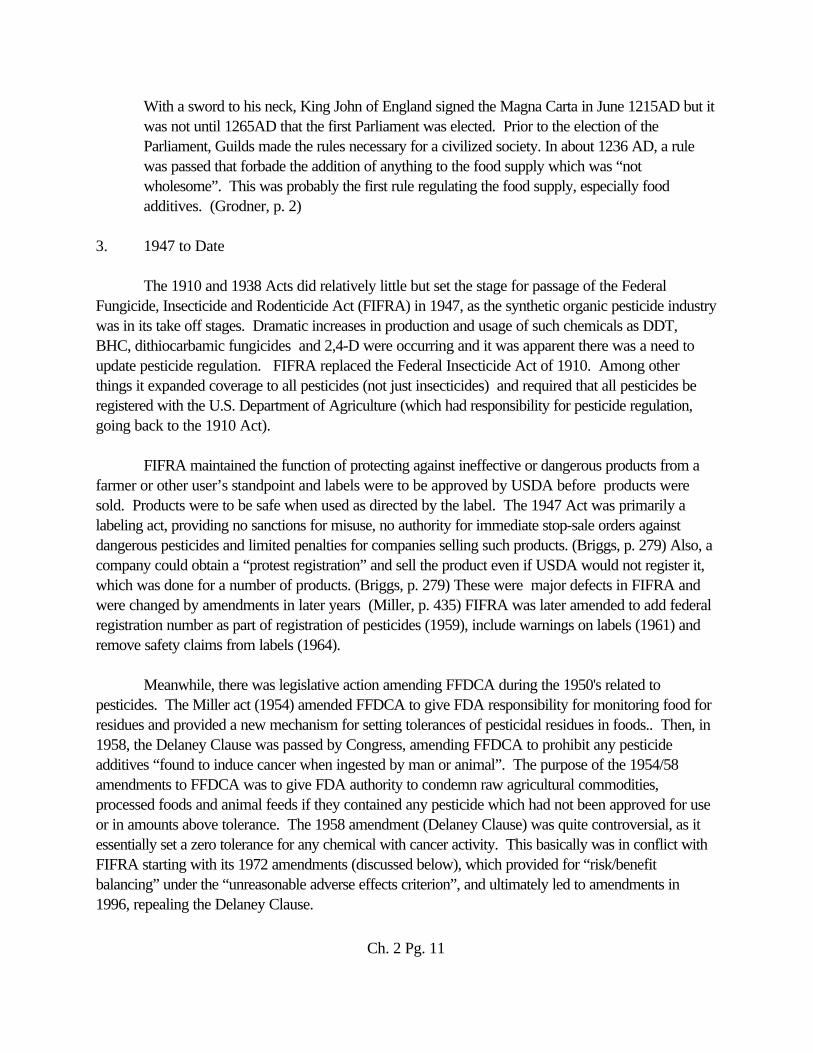
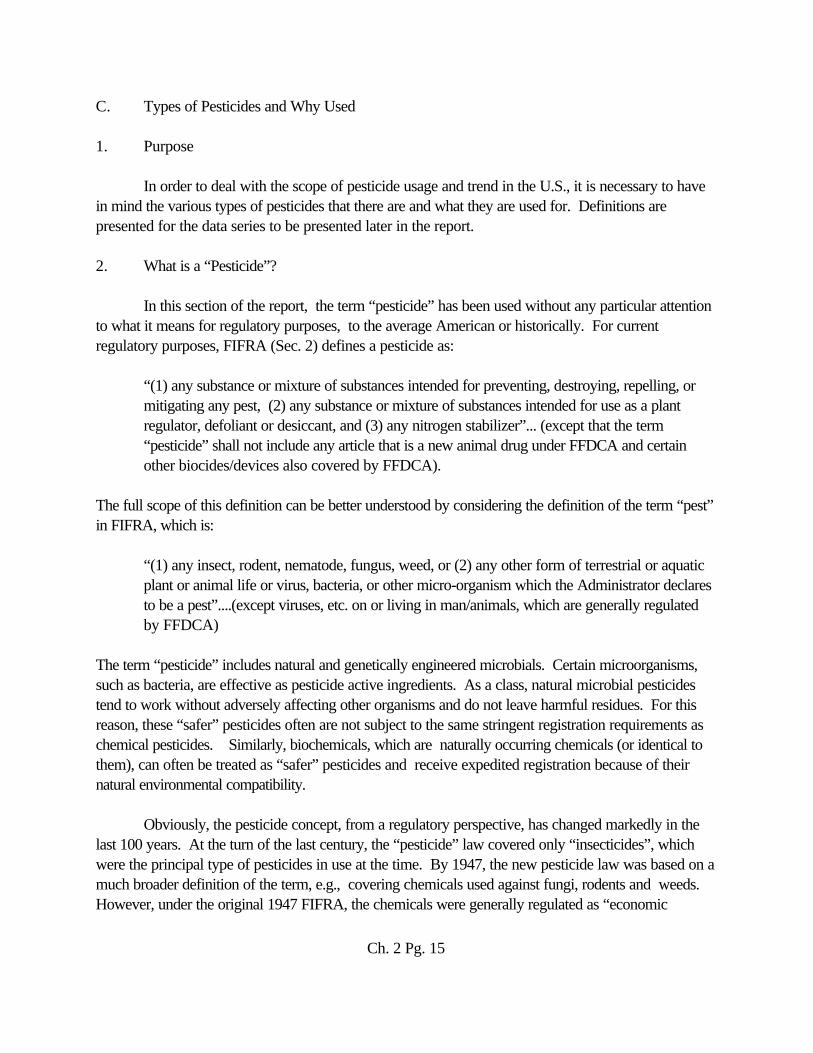
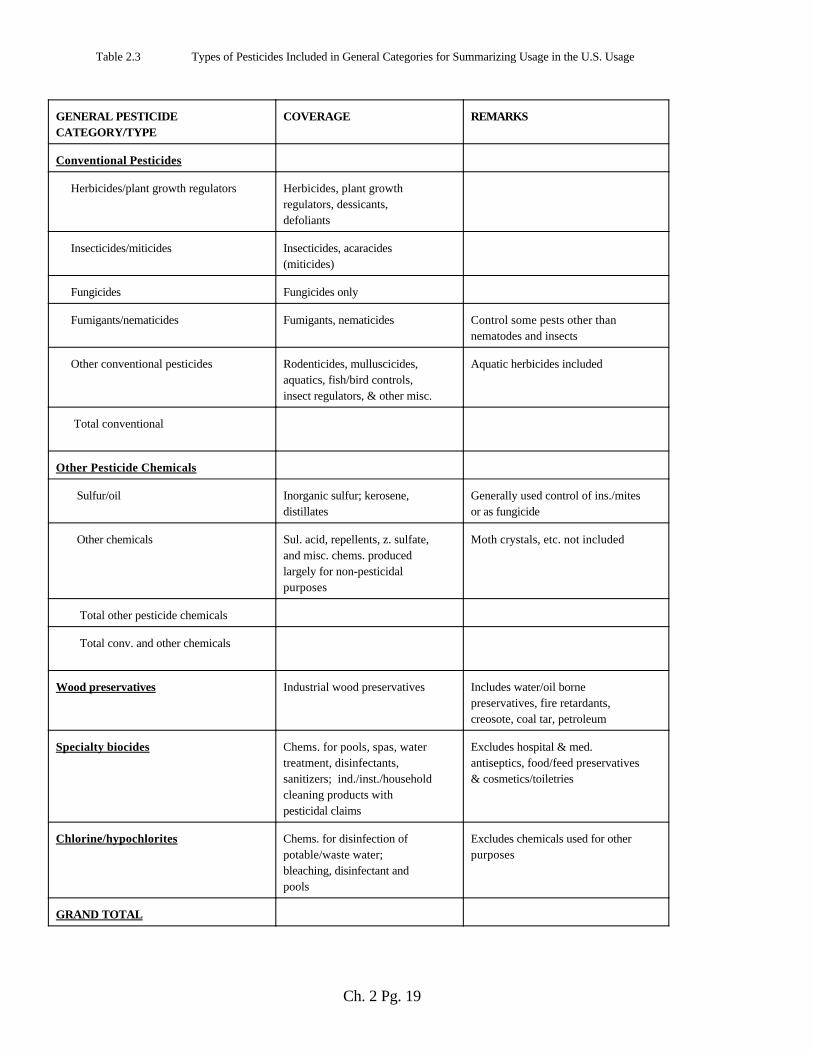
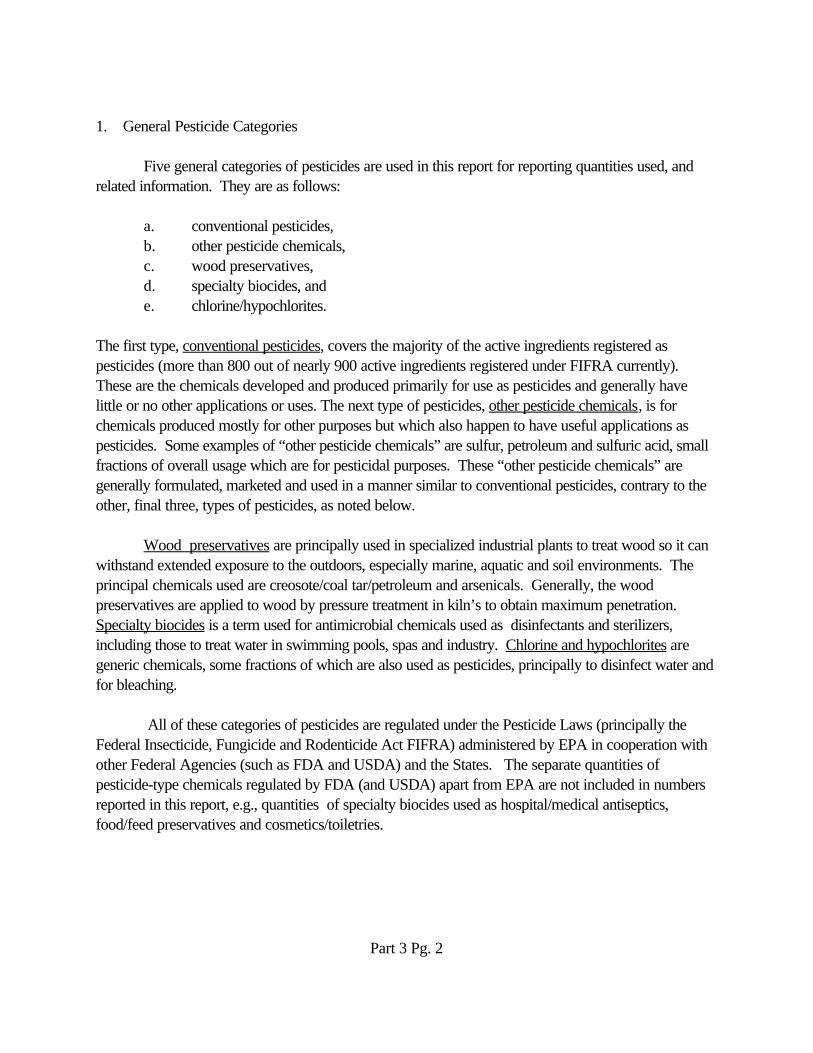
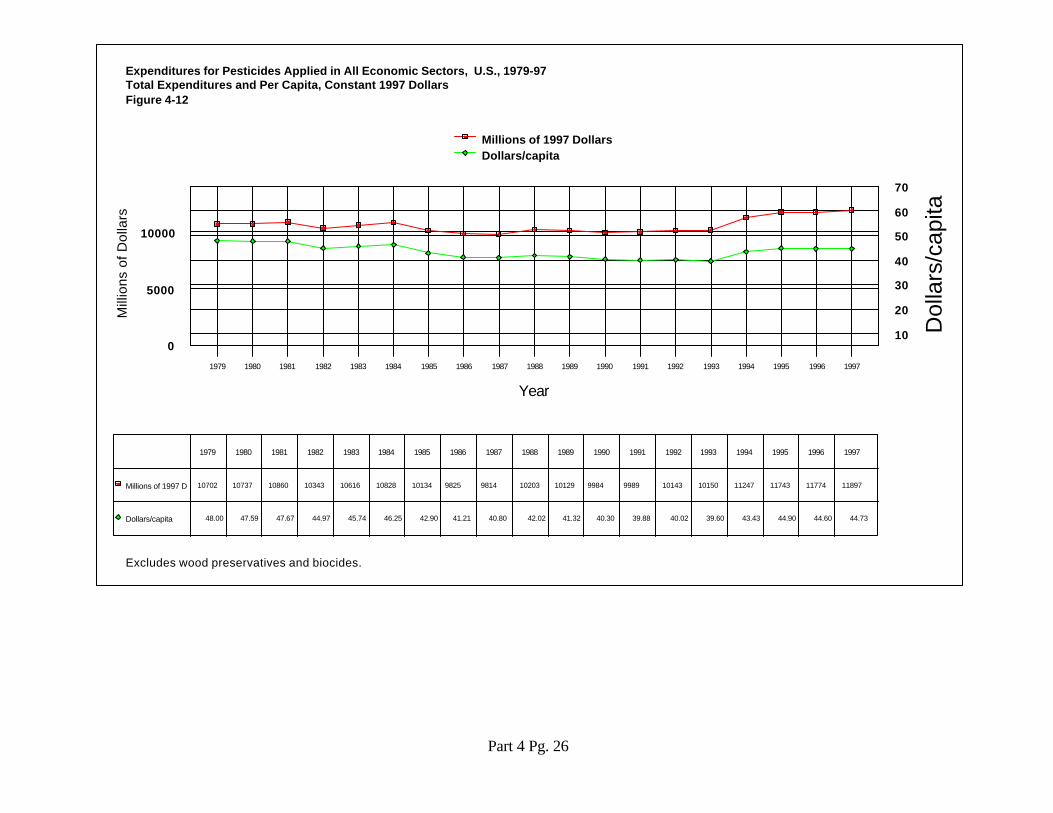
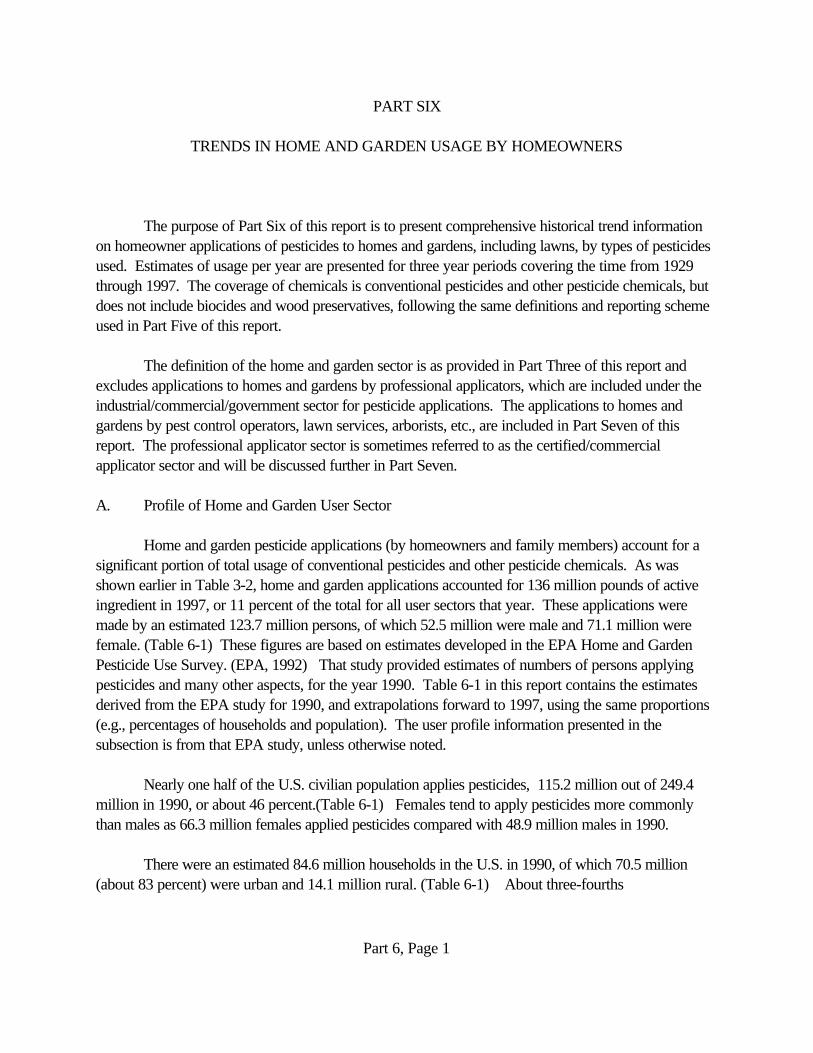
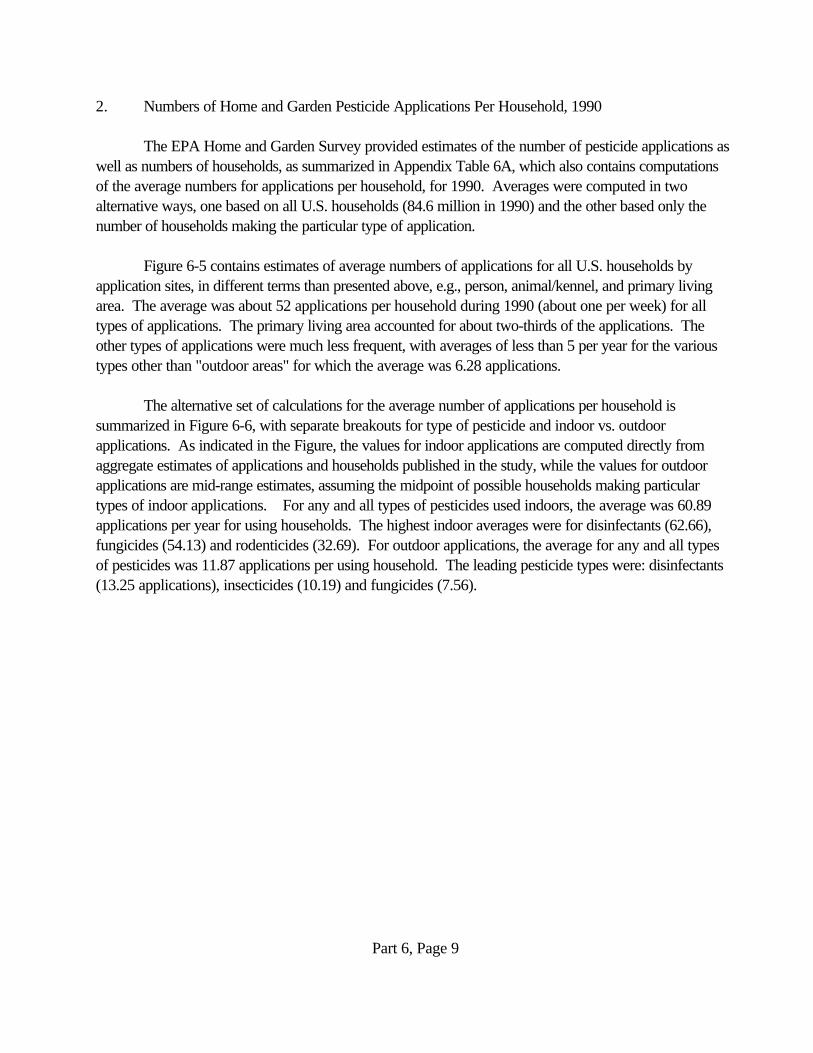
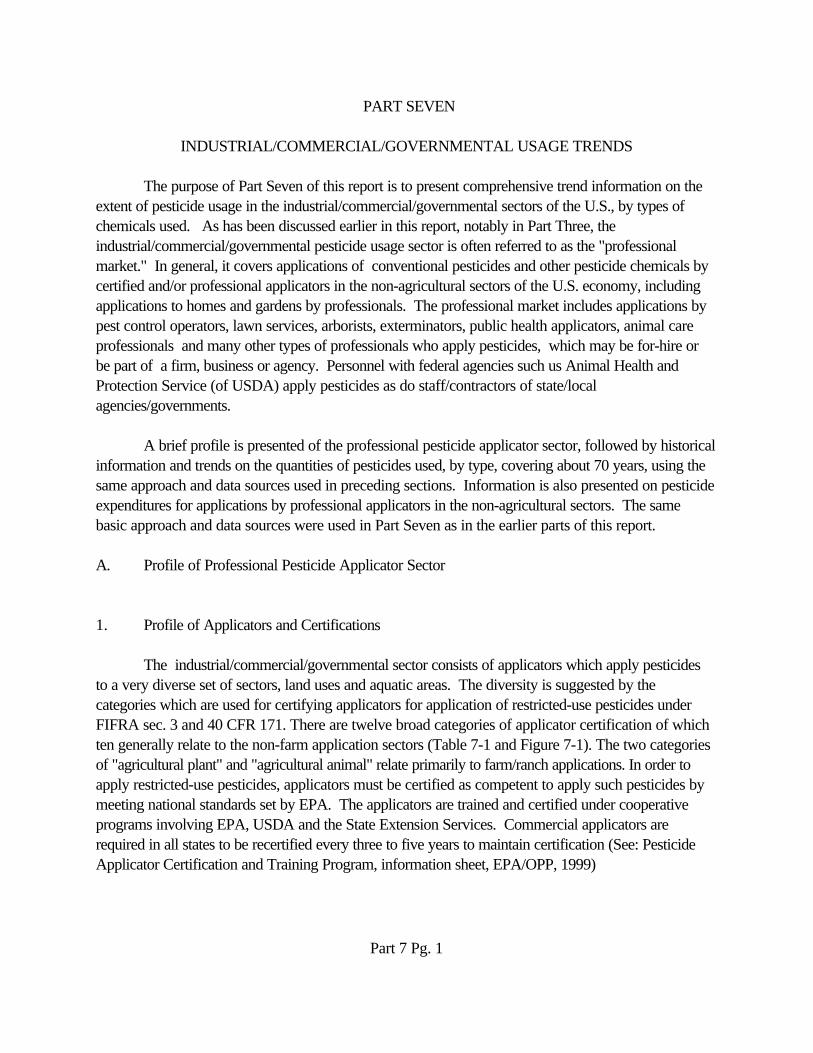
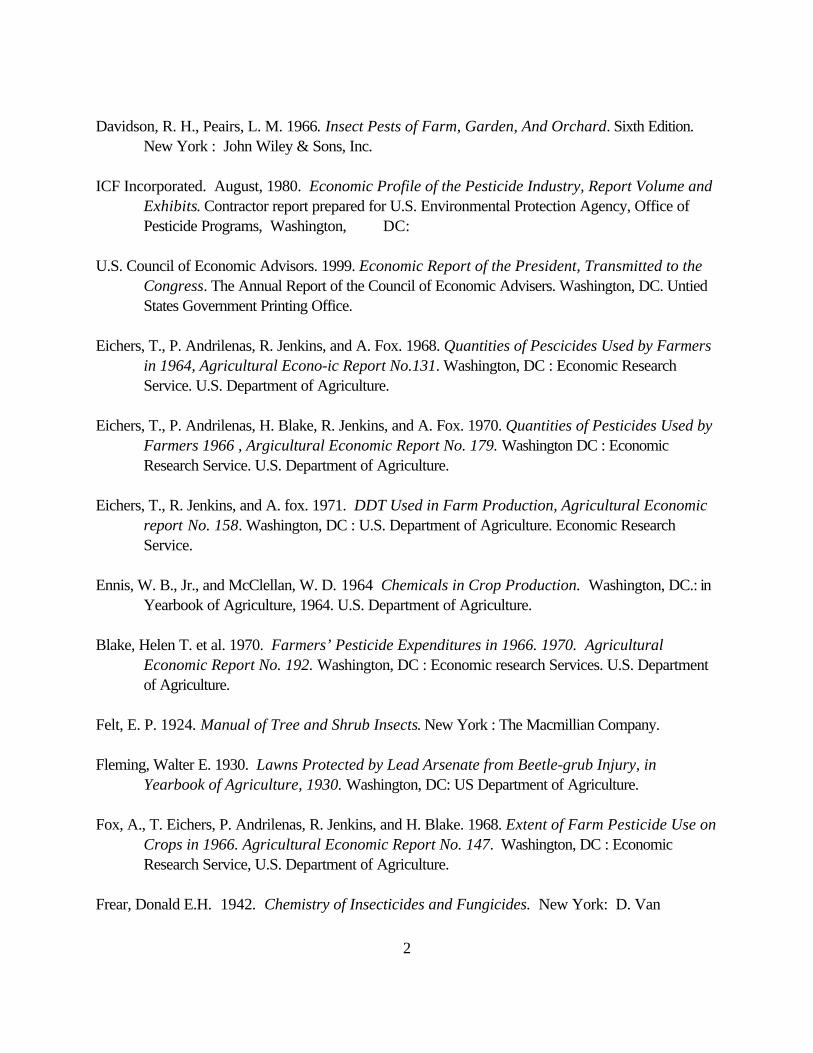
Center for Integrated Pest Management, North Carolina State University, Raleigh, N. C. ______________________________________________________________________________ CIPM Technical Bulletin 105 PESTICIDE USAGE IN THE UNITED STATES: Trends During the 20 th Century February 2003 1931 1937 1943 1949 1955 1961 1967 1973 1979 1985 1991 1997 Three Years Ending 0 500 1000 1500 2000 Millions of Pounds Home/Garden Ind./Comm./Gov. Agriculture Excludes wood preservatives and biocides Volume of Total Pesticide Active Ingredient Usage in U.S., by Economic Sector, Three Year Periods Ending 1931-97
Transcript
Center for Integrated Pest Management, North Carolina State University, Raleigh, N. C. ______________________________________________________________________________
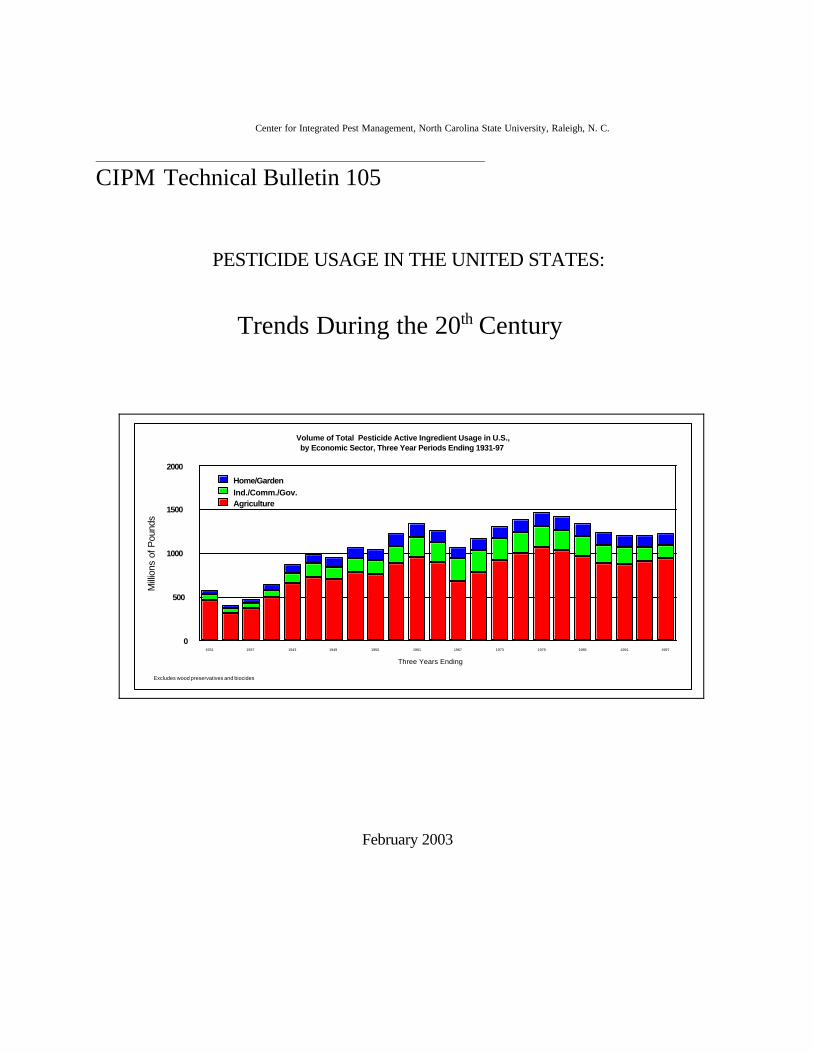
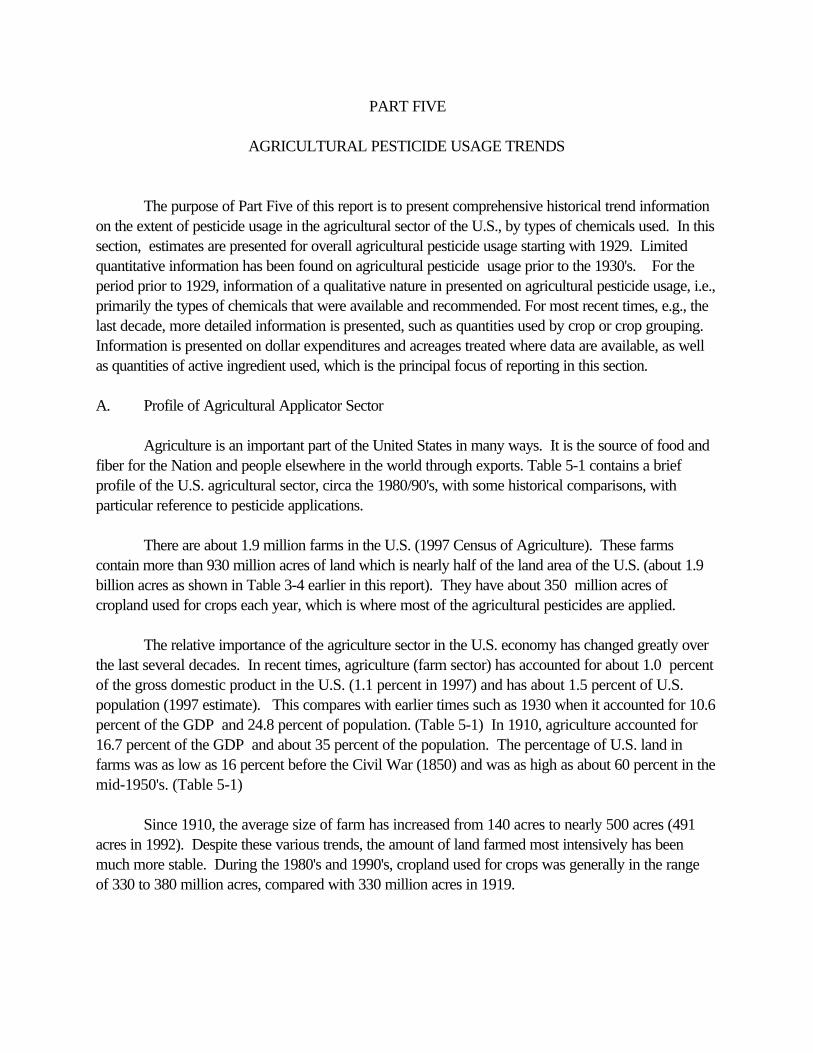
Volume of Total Pesticide Active Ingredient Usage in U.S.,by Economic Sector, Three Year Periods Ending 1931-97
PESTICIDE USAGE IN THE UNITED STATES:
Trends During the 20th Century
by
Arnold L. Aspelin, Ph. D., Economist
Retired August, 2000, from Biological and Economic Analysis Division
Office of Pesticide Programs, U.S. EPA, Washington, D.C.
CENTER FOR INTEGRATED PEST MANAGEMENTNORTH CAROLINA STATE UNIVERSITY
RALEIGH, NORTH CAROLINA 27606
FEBRUARY, 2003
Contents
PESTICIDE USAGE IN THE UNITED STATES:
Trends During the 20th Century
PART ONE
INTRODUCTION AND SUMMARY
PageA. Purpose and Scope 1-1B. Organization of Report 1-2C. Approach 1-3D. Executive Summary 1-4E. Summary of Findings 1-5
PART TWO
BACKGROUND ON HISTORY OF PESTICIDE USE AND REGULATION IN THE U.S.
A. Historical Emergence of Pesticide Technology 2-1B. Overview of Pesticide Regulatory History in U.S. 2-9C. Evolution of Types of Pesticides 2-15
PART THREE
PROFILE OF CURRENT OVERALL U.S. PESTICIDE USAGE
A. Background on Pesticide Types and Usage Sectors 3-1B. Sources of Information 3-3C. Current Overall Pesticide Usage, by Type 3-5D. Volume of Conventional/Other Pesticides Used by Sector, 1997 3-8E. Expenditures for Conventional/Other Pesticides by Type and Sector, 1997 3-13F. Overview of U.S. Land Area and Overall Pesticide Usage 3-18G. Current U.S. Pesticide Usage Compared to the World 3-24
PART FOUR
LONG TERM TRENDS IN OVERALL U.S. PESTICIDE USAGE
A. Approach and Data Sources 4-1B. Total Usage of Conventional/Other Pesticides, 1929/97 4-4C. Usage of Conventional/Other Pesticides by Sector, 1929/97 4-8D. Usage of Conventional/Other Pesticides by Type of Pesticide, 1929/97 4-14E. Trends in The Types of Chemistry Being Used as Pesticides, 1930/97 4-16F. User Expenditures for Conventional/Other Pesticides,
by Type of Pesticide and Sector, 1979/97 4-25
PART FIVE
AGRICULTURAL PESTICIDE USAGE TRENDS
A. Profile of Agricultural Applicator Sector 5-1B. Principal Chemicals Available to Farmers Before End of WWII 5-4C. Approach and Information Sources, Circa 1930 to Date 5-6D. Overall Conventional/Other Pesticide Usage and Crop Acreage, 1929/97 5-7E. Agricultural Pesticide Usage by Type, Conventional and
Other Chemicals, 1929/97 5-9F. Average Pesticide Usage Per Crop Acre, 1929/97 5-11G. Agricultural Pesticide Usage by Type (Class) of Pesticide, 1929/97 5-13H. Active Ingredient Usage, by Crop Grouping, 1988/97 5-15I. Expenditures for Agricultural Pesticides, 1929/97 5-23
PART SIX
TRENDS IN HOME AND GARDEN USAGE BY HOMEOWNERS
A.. Profile of Home and Garden User Sector 6-1B. Quantitative Characteristics of Home and Garden Usage, 1990 6-5C. Home and Garden Pesticide Usage, by Type, 1929/97 6-14
D. Home and Garden Pesticide User Expenditures, 1979/97 6-20
PART SEVEN
INDUSTRIAL/COMMERCIAL/GOVERNMENTAL USAGE TRENDS
A. Profile of Professional Pesticide Applicator Sector 7-1 B. Brief History of Applicator Industry 7-18C. Professional Market Pesticide Usage, by Type, 1929/97 7-20D. Professional Market User Expenditures, 1979/97 7-25
The author wishes to acknowledge the U.S. Environmental Protection Agency, Office ofPesticide Programs, Biological and Economic Analysis Division for its staff support of this project overseveral years resulting in the collection, analysis and dissemination of information on quantities ofpesticides used in the United States. The result has been a wide range of usage information beingassembled and made available for use by agency staff, other agencies, industry, user groups and thegeneral public. Most of the drafting of this report was done by the author while at EPA prior toretirement from the U.S. Civil Service in August, 2000. The author very much appreciates being giventime to work on this project, in an office busy with many competing priorities.
The author would like to acknowledge a number of persons who reviewed a draft version ofthis report. They include: Art Grube, Bob Torla, George Kiett and Roger Holtorf of EPA; MerrittPadgitt and Doug Kleweno of USDA: Mary Ward of US NCI; Steve Wanser of US ITC; Bob Taylor,Auburn Univ.; Leonard Gianessi, NCFAP; Mancur Cyr, Kline and Co.; Steve Maguire, McGill Univ.;Phil Calderoni, SRI Consulting; Phil Kearney, USDA, retired; John Wilkin, Doane Market Research;and Ed Johnson, Technical Services Group. Their efforts and input are very much appreciated. Numerous suggestions were forthcoming and were accommodated insofar as feasible.
Finally, I would like to thank Ron Stinner, Director, Center For Integrated Pest Managementfor enabling the publication of this report. CIPM is a very logical outlet for this document. Pesticideusage information is very much a matter of interest to those focusing on pest management issues andprograms. Thanks also go to Prof. Gerald Carlson, Agricultural Economics Department, N.C. State,for helping to make this project come to fruition. Arnold L. Aspelin, Ph.D. February, 2003
Part 1 Pg. 1
PESTICIDE USAGE IN THE UNITED STATES:
Trends During the 20th Century
PART ONE
INTRODUCTION AND SUMMARY
A. Purpose and Scope
This report presents estimates of overall pesticide usage in the U.S. covering both agriculturaland non-agricultural uses, including past trends and recent usage through 1997. Focus of the report ison quantitative measures of actual pesticide use (termed “usage” in this report) rather thansummarization of pesticides registered, recommended or merely available in the market for various pestcontrol applications. The principal measure of usage is “pounds of pesticide active ingredient” ratherthan total volume or weight of formulated products (which includes all the other various chemicals ormaterials they contain, i.e., inert ingredients, as they are termed). This report presents estimates ofpesticide usage per year covering roughly the most recent seven decades. It also presents historical,qualitative, background on the emergence of the use of chemical pesticides in our society going back toearliest times and their regulation in the U.S.
There is no existing previous report or source which contains a time series of comprehensiveestimates of historical annual pesticide usage along with a profile of current pesticide usage. Estimatesof overall annual U.S. pesticide usage, by pesticide type and economic sector, have been publishedgoing back to 1979 (Aspelin and Grube, EPA, November, 1999). That report also contains estimatesof total annual usage for 1964 through 1978 but without detailed breakouts by pesticide class andsector. A partial time series of estimates for U.S. agricultural crop pesticide usage has been publishedfor selected years covering the period from 1964 through 1995. (Barnard, C., et al., 1997) Estimateshave been developed by USDA staff for selected crops and years based on USDA survey datacovering the period from 1964 through 1982. (Osteen and Szmedra, September, 1989) A similarstudy by USDA has been published for major field crops (such as corn, soybeans, wheat, cotton andpotatoes) with periodic estimates of usage for the period of 1964 through 1992. (Biing-Hwan Lin, et
Part 1 Pg. 2
al., May, 1995) Similarly, estimates of agricultural crop usage have been published only for particularyears by Leonard Gianessi. (January, 1992) Basically, the project resulting in this report has beendevoted to filling the void in comprehensive time series estimates, covering all sectors, for the U.S. priorto 1979.
Although principal focus of this report is on quantities of active ingredient used, quantitativeinformation is also presented on other aspects of usage (e.g., numbers of acres, farms, homes,applicators, average application rates and user expenditures) where feasible. Breakouts of nationalusage estimates are provided by chemical family for each of the major pesticide types (i.e.,classes, suchas fungicides). However, the breakouts by chemicals family are not extended down to the economicsector level, i.e., only national estimates for all sectors combined.
B. Organization of Report
In addition to the Introduction and Summary (Part One), the report consists of six otherseparate parts as follows:• Part Two--background on history of pesticide usage and regulation; • Part Three--profile of current overall U.S. pesticide usage;• Part Four–long term trends in overall U.S. pesticide usage;• Part Five--agricultural pesticide usage trends; • Part Six--homeowner pesticide usage trends; • Part Seven--trends in professional market applications (to industrial, commercial and
government sectors, as well as to homes and gardens).• Bibliography;• Glossary; and• Appendices.
Part One contains an executive summary and a more detailed summary of findings for thevarious Parts of the report. There are no summaries contained in the individual Parts. The individualParts contain references to literature and other sources that are listed in the Bibliography presented atthe end of the report. The Summary of Findings contained in Part One below is designed to provide apopular bullet-styled listing of key points made in the individual report Parts themselves. The summary material under each major bullet in the summary is referenced back to the Part of the report on which itis based.
Part Two provides background on the historical emergence of pesticides and their regulation inthe U.S.
Parts Three and Four deal with the topics of definition (e.g., pesticide types/classes andeconomic/user sectors), data sources and approaches used in development of the report, which tend to
Part 1 Pg. 3
be common to the overall report. These parts set the stage for the sections dealing in detail with thethree major individual user sectors.
The organizational scheme with separate Parts for the three major user sectors is used becauseof greatly differing histories, literature and data availabilities for the three types of applications. Moredetailed information is available for agricultural applications than the other sectors, particularly for theearlier years of the 20th Century. Also, large scale usage of chemicals for pest control tended toemerge first in agriculture, which continues to account for a majority of U.S. pesticide usage.
C. Approach
There are no programs at EPA or other agencies devoted specifically to estimation of theoverall pesticide market in quantitative and dollar terms each year. Accordingly, values for usage in thisreport were developed on the basis of the best information available from the public domain andproprietary sources. Focus in upon the period from 1929 through 1997 and upon conventionalpesticides and other pesticide chemicals, excluding industrial wood preservatives and biocides. Theseterms are defined in the Glossary and are discussed below in the Summary of Findings as well as in PartThree.
The basic approach used to develop time series (for conventional pesticides and other pesticidechemicals) was to assemble reported values for usage from all available sources and tabulate them onworksheets showing the values by particular year, type of pesticide, etc. Once all of the entries weremade from available sources, efforts were made to reconcile differences and conflicts which oftenoccurred in the reported values. Numbers were verified from their sources including data definitions. Taking into account apparent trends and relationships in the various tabulated values, estimates weredeveloped for each year, by pesticide class and sector utilizing the best available information andjudgement of the analyst. Then, three-year averages were computed for purposes of presentation inthis report for the periods ending on three year intervals from 1931 through 1997. A somewhatdifferent approach was used for the time series on active ingredient usage by chemical family. In thatcase, estimates were made only for conventional pesticides and for every fifth year for 1930 through1995 and for 1997, based on best available information.
The numbers presented in this report should be considered approximate values rather thanprecise ones with known statistical properties. The data sources used and methods used in making thevarious estimates of usage are discussed in the individual Parts of the Report, particularly Parts Threeand Four.
The substantive data collection, analysis and report writing on this project wereconcluded as of August, 2000. Work on the project since that time has been limited primarilyto final editing of the report. Accordingly, the results reported should be considered currentor contemporary as of about two years prior to its publication, e.g., August, 2000
Part 1 Pg. 4
Part 1 Pg. 5
D. Executive Summary
Pests of one kind or another have been problems to man since earliest times. People havestruggled to control pests with a wide variety of measures, including chemicals we today call pesticides. Early history of the Orient and Biblical writings often record pest problems and efforts to deal withthem. It wasn't until the 18th Century that science began to be applied to pest biology and controlmeasures in very systematic or meaningful ways.
In the United States, chemicals (along with non-chemical controls) began to be widely acceptedas control measures for pests identified by farmers, homeowners and businesses during the late 1800'sand early in the 1900's. The principal quantitative indicator focused on in this report is pounds of activeingredient used per year. Figures for national quantities used began to emerge for usage of majorpesticide chemicals around 1900, often for use in agriculture, which historically has accounted for amajority of U.S. pesticide usage.
In this report, historical time series of estimated U.S. usage are presented for three-yearperiods covering 1929/97. Economic profile information is presented for U.S. pesticide user sectorsbased on data for recent years (e.g., 1990's) Where data permit, breakouts are provided in the seriesby type of pesticide, economic sector (agriculture, home owner applications and professional non-agricultural applications) and chemical family.
Annual usage of pesticides in the U.S. (excluding biocides and industrial wood preservatives)
was about one half billion pounds in the 1930's, increasing to nearly one billion pounds at the end ofWWII and then peaked out at nearly 1.5 billion pounds in the late 1970's. Since then, it has declinedby about 200 million pounds per year and has been quite steady in the range of 1.2 billion pounds peryear during the 1990's. Usage per capita was at its highest level at the end of WWII at 7.4 pounds, hasdeclined since, to less than 5.0 pounds during the 1990's.
• large amounts of pesticides containing arsenic, lead and other metals were also used forinsects and plant diseases through the 1950's;
For last seven decades, the following general observations can be made about pesticide usagein the U.S.:
• usage of sulfur, petroleum and similar generic chemicals predominated in activeingredient usage until the mid-1960's, when new chemicals developed primarily for useas pesticides took over the lead;
• pesticide chemistry changed dramatically with the advent of synthetic organicpesticides, starting with DDT toward the end of WWII;
• there was rapid growth of synthetic organic insecticide usage during the 1940's and1950's, followed by the dramatic adoption of herbicides in the 1960's and 1970's;
• new low-dose insecticides and herbicides introduced during the last two decades havecontributed to lower overall usage of active ingredient in the U.S., along with various
Part 1 Pg. 6
integrated pest management programs and related educational efforts by agencies andindustry.
Part 1 Pg. 7
E. Summary of Findings (references to text pages)
Part Two–Background and History of Pesticide Usage
! Historical Emergence of Pesticide Technology (See pages 2/1-8.)
" Pest controls can be classified broadly as: mechanical control, biological control,host/target resistance development, and chemical control. Generally speaking, thechemicals used for pest control are considered pesticides and are so regulated in theU.S. The principal focus of this report is on those chemicals which historically havebeen considered pesticides, which account for most pest control in the U.S. Pesticidesand other controls can be used as preventatives, curatives or both and are notconsidered as being used wastefully if being used in line with economic thresholds., i.e.,the value of pest damage avoided exceeds costs on control.
" An adequate supply of food is of fundamental importance to mankind going back toearliest times as man has struggled to obtain adequate supplies of food (and fiber)against all the elements, including pests of various sorts. Pests also cause damage byspreading disease and as nuisances by their mere presence where man does not wantthem.
" For hundreds of years earlier on, few noteworthy things happened in the developmentof pesticides. Then, during the last 100 years, especially the last 50 years, pestcontrol has been revolutionized. The rise of the scientific method and its application topest control helped to learn more about pests and existing chemicals as pesticides. From about 1860 until the advent of DDT in 1942, there was widespread identificationof inorganic and natural organic chemicals for control of insects and plant diseases(fungi). Little progress occurred in chemical control of weeds. The chemistry ofarsenicals was further exploited to control insects (Paris Green). Bordeaux mixture(copper sulfate and lime) was found to be very useful in the control of plant diseasesleading to widespread usage.
" The pressure sprayer (hand and power driven) was invented, making efficient largescale application of pesticides feasible and economical. Aerial application was alsoinvented (early 1920's) leading to expanded applications in agriculture.
" The availability of DDT, starting in 1945 for civilian/agricultural usage, opened a newera of pest control, leading to not only its extensive usage, but the development ofnumerous other synthetic organic insecticides, e.g., organophosphates (1946). Aboutthe same time (1944), selective synthetic organic herbicides were discovered, startingwith 2,4-D, which revolutionized weed control in agriculture and elsewhere. Also,synthetic organic fungicides (metal based) were developed as effective controls of plantdiseases (and for other applications).
Part 1 Pg. 8
" During the 1950's and 1960's, granular pesticide formulations were developed, whichled to large expansions of pesticide usage on the major field crops. By the 1960's,some very important new families of chemicals were discovered as herbicides (e.g.,triazines, acetanilides and dinitroanilines). In the 1970's, the synthetic pyrethroidscame on to replace much of the insecticide chemistry developed during the previous 20years. During the 1980's, imidazolinone and sulfonylurea herbicides came on todramatically lower application rates for weed control.
" During the 1990's, new, powerful, chemistries and biotechnologies came forward andmore will do so early in the new millennium. There is heavy emphasis in industry, usergroups and at EPA in the registration and usage of biologicals and “safer” pesticides,along with enhanced stewardship in use of available pesticides.
! Overview of Pesticide Regulatory History in the U.S. (See pages 2/9-14.)
" General Regulatory Trend: - Regulation of pesticides is an integral part of the overall environment in which
pesticides are developed, produced and used in the U.S. There has been atrend in national policies/laws, starting from limited objectives, primarilyprotection of farmers from adulterated/ineffective products, until today whenthere are comprehensive objectives, including human health and environmentalprotection, as well as pesticide user protection.
" Prior to 1947: - The regulation of pesticides was given very little attention from earliest times
until around the turn of the 20th Century. The pesticide chemicals in use wereold chemicals with which people were quite comfortable (e.g., sulfur,petroleum, lime, arsenicals) and there did not seem to many concerns with thechemicals requiring regulation, other than from the point of view of consumer(user) protection. As the usage of pesticides began to be more common andwidespread, Congress became alarmed at developments leading to the passageof the Insecticide Act in 1910. This Law was aimed at helping protect farmersagainst fraud as they purchased insecticides, often by mail or from itinerantdealers.
- The Insecticide Act of 1910 appears to be the beginning of serious pesticideregulation in the U.S., although the Food and Drug Act of 1906 establishedregulatory jurisdiction over food treated with pesticides and traded in interstatecommerce. The Insecticide Act of 1910 provided for establishment oftolerances for specific insecticides, which was done later by regulation,primarily for arsenic and lead on apples and pears. The next majordevelopment was passage of the Federal Food, Drug and Cosmetic Act(FFDCA) in 1938, which provided for tolerances to be established for
Part 1 Pg. 9
chemicals including pesticides, primarily arsenicals such as lead arsenate andParis green.
Part 1 Pg. 10
-" 1947 to 1995:
- The 1910 and 1938 Acts did relatively little but set the stage for passage of theFederal Fungicide, Insecticide and Rodenticide Act (FIFRA) in 1947, as thesynthetic organic pesticide industry was in its take off stages. FIFRA replacedthe Federal Insecticide Act of 1910. Among other things, it expandedcoverage to all pesticides (not just insecticides) and required that all pesticidesbe registered with the U.S. Department of Agriculture (which had responsibilityfor pesticide regulation, going back to the 1910 Act).
- The 1947 Act was primarily a labeling act, providing no sanctions for misuse,no authority for immediate stop-sale orders against dangerous pesticides andlimited penalties for companies selling such products. There was legislativeaction amending FFDCA during the 1950's related to pesticides.
- The Miller act (1954) amended FFDCA to give FDA responsibility formonitoring food for residues and provided a new mechanism for settingtolerances of pesticidal residues in foods.. Then, in 1958, the Delaney Clausewas passed by Congress, amending FFDCA to prohibit any pesticide additives“found to induce cancer when ingested by man or animal”.
- USDA lost a pesticide fraud case and was successful in persuading Congress in1964 to allow denial of registrations (or cancellation) for reasons of safety oreffectiveness, with the burden of proof switched to the registrant rather thanUSDA, as under the original FIFRA.
- Responsibility for administering FIFRA, along with relevant parts of FFDCA,was transferred to EPA which was created by Executive Order of PresidentNixon on December 2, 1970. Pesticides were an issue at the forefront of theenvironmental movement leading to the establishment of EPA. Congressresponded to heightened concerns about pesticides and amended FIFRA in1972, changing it to an environmental protection statute, addressing humanhealth and environmental protection aspects, as well as maintaining thetraditional role of protecting the user from unsafe/ineffective products, datingback to the 1910 Act.
- The 1972 amendments were a major rewriting of FIFRA. During the 1970'sand 1980's, the amended FIFRA was used to take a number of pesticides offthe market, starting most notably with the organochlorine insecticides, such asDDT, aldrin, dieldrin, chlordane, heptachlor and kepone. During the 1980's and1990's, EPA actively pursued special reviews of problem pesticides andstruggled with its mandate to reregister all old/existing pesticides.
Part 1 Pg. 11
" 1996 to Date: - As of 1996, reregistration could not be expected to be completed until far into
the next century. Largely as a result of this, Congress passed the Food QualityProtection Act of 1996, which was designed to expedite the reregistrationprocess, and at the same time, pay particular attention to protecting the safetyof food supplies for all identifiable groups (such as infants and children).
- Various new FQPA mandates are key features of the Pesticide Program for theforeseeable future. There also is an emphasis upon communication withaffected/interested parties in general and upon voluntary programs to reducerisks of pesticides (and unnecessary usage) under pesticide environmentalstewardship programs initiated in recent years. OPP is working closely withUSDA to implement FQPA with involvement of the Vice President.
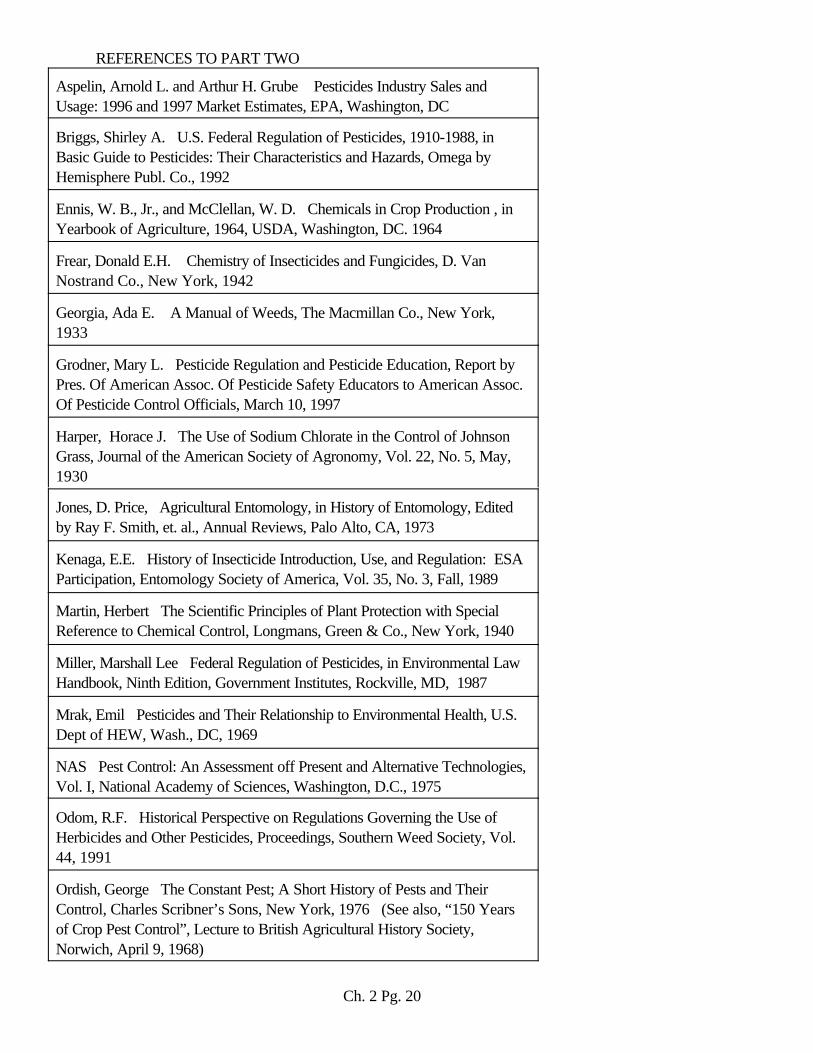
! Types of Pesticides Used and Why Used (See pages 2/15-20)
" What is a “Pesticide”? - FIFRA (Sec. 2) defines a pesticide as:“(1) any substance or mixture of
substances intended for preventing, destroying, repelling, or mitigating any pest, (2) any substance or mixture of substances intended for use as a plant regulator,defoliant or desiccant, and (3) any nitrogen stabilizer”... (except that the term“pesticide” shall not include any article that is a new animal drug under FFDCAand certain other biocides/devices also covered by FFDCA).
- The term “pesticide” includes natural and genetically engineered microbials.Thepesticide concept, from a regulatory perspective, has changed markedly in thelast 100 years. At the turn of the last century, the “pesticide” law covered only“insecticides”, which were the principal type of pesticides in use at the time.
" Classes of Pesticides:- Over the years, pesticide producers, regulators, researchers and users have
developed a set of terms for identifying pest control chemicals that tend tofollow the target pests for which they are to be used. They are commonlyreferred to as pesticide classes (or types in some contexts). For example,those pesticides used to target fungi are called fungicides.
- Some of the principal classes or types of pesticides are herbicides, insecticides,rodenticides, and fungicides. There is some overlap between classes ofpesticides identified because some pesticides control more than one type ofpest.
Part 1 Pg. 12
" Why Pesticides Are Used:- Pesticides are used because users wish to avoid some type of damage or
nuisance, real or imagined. Most types of animal and plant species are capableof becoming “economic pests”, in some circumstances, i.e., worth treating.
-Part Three–Profile of Current Overall U.S. Pesticide Usage
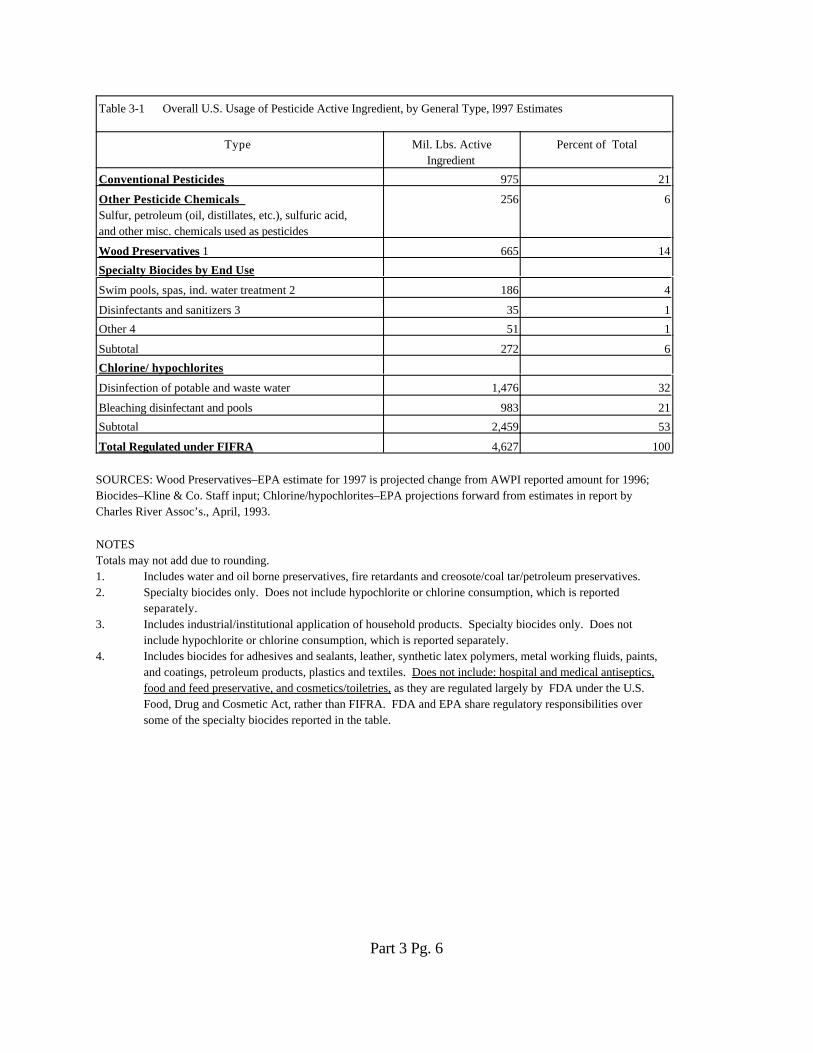
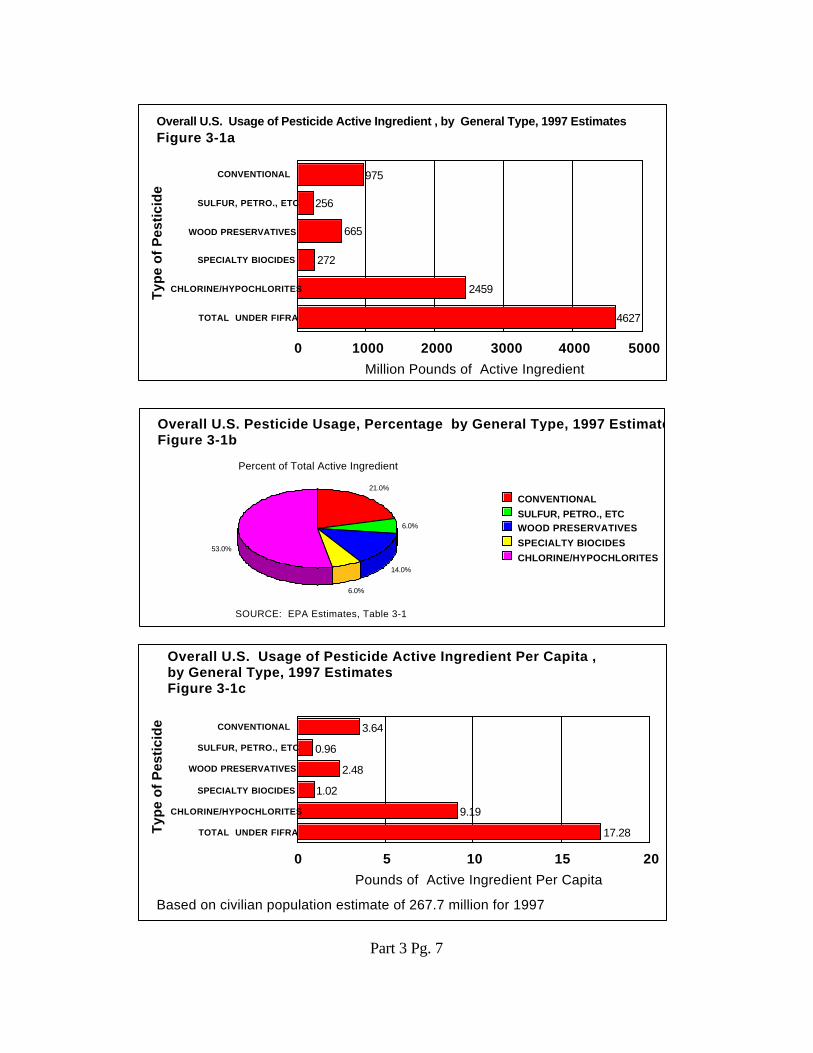
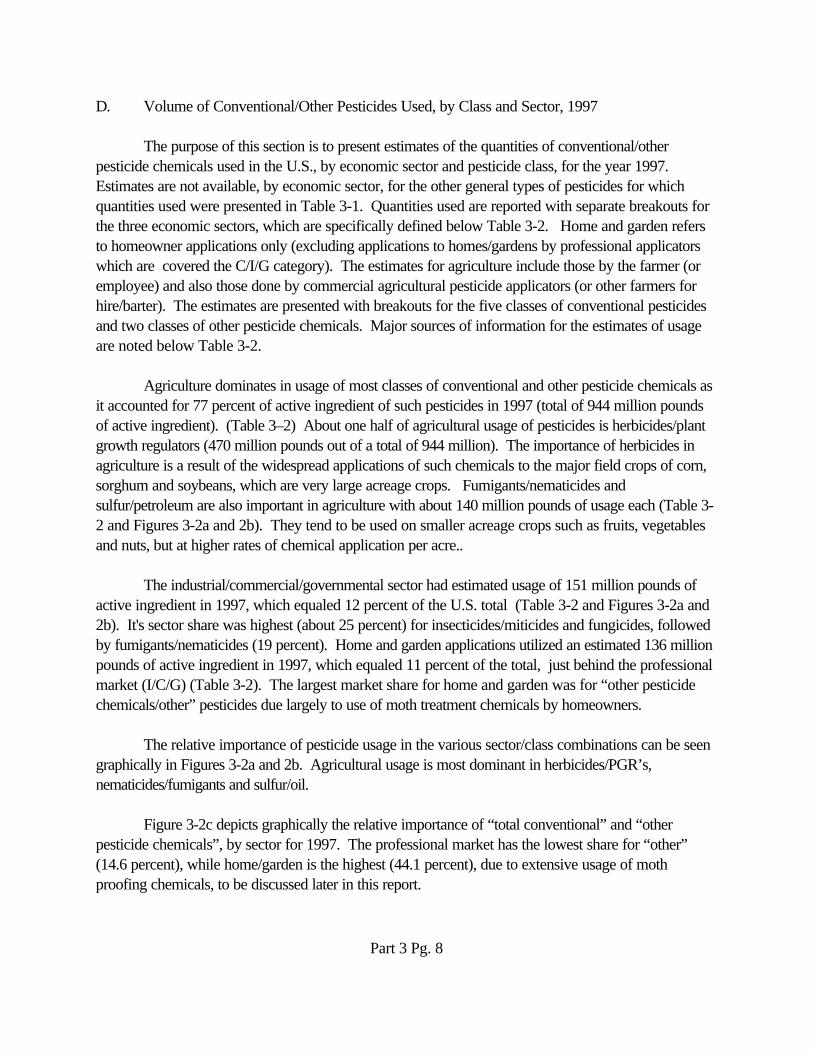
! Overall U.S. Pesticide Usage, by General Type, 1997 (See pages 3/5-7).
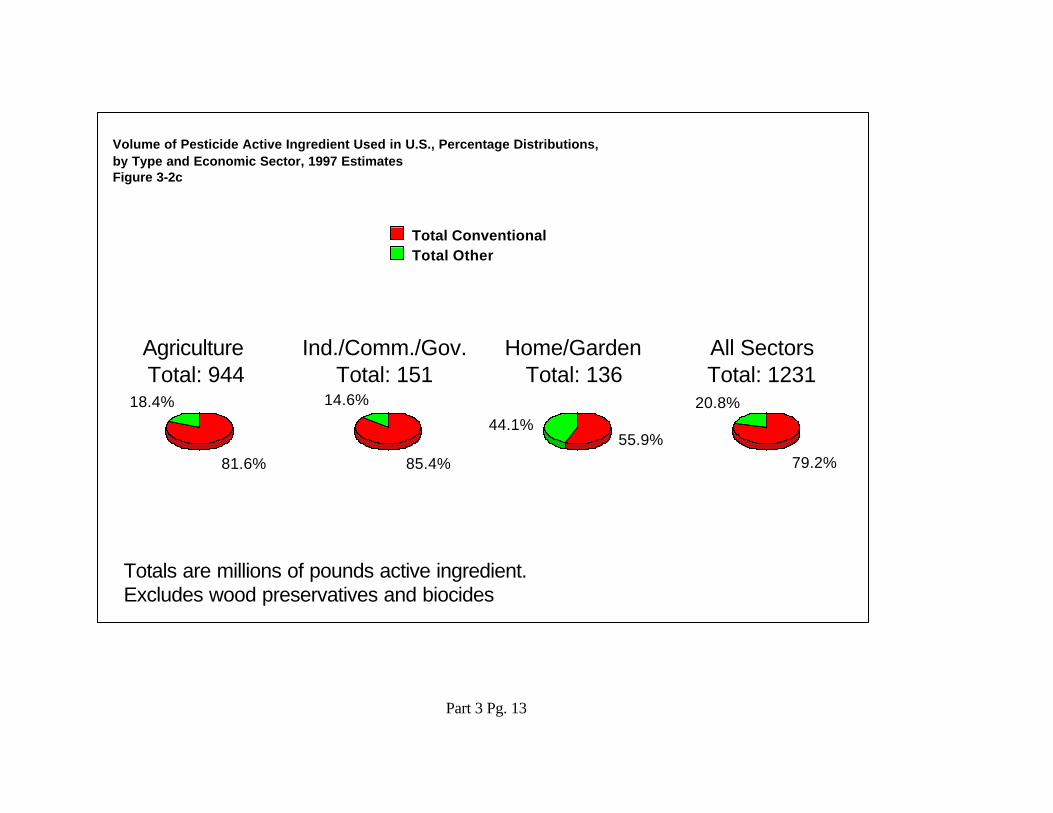
" More than 4.5 billion pounds of pesticide active ingredient are used in the U.S. in acurrent typical year. For 1997, the estimated total for all types of pesticides was4.63 billion pounds. The breakdown on this usage by general category of pesticides is:- conventional pesticides 0.97 bil. lbs. (21%)- other p. chemicals 0.26 “ ( 6%)- wood preservatives 0.66 “ (14%)- specialty biocides 0.27 “ ( 6%)- chlorine/hypochlorites 2.46 “ (53%)- total 4.63 “ (100%).
" The above aggregate quantities of pesticides used can be expressed on a per capitabasis, to reflect the average volume used per person in the U.S. Overall usage wasabout 17.3 pounds per capita for all pesticides regulated under FIFRA (about 3.6pounds per capita for conventional pesticides).
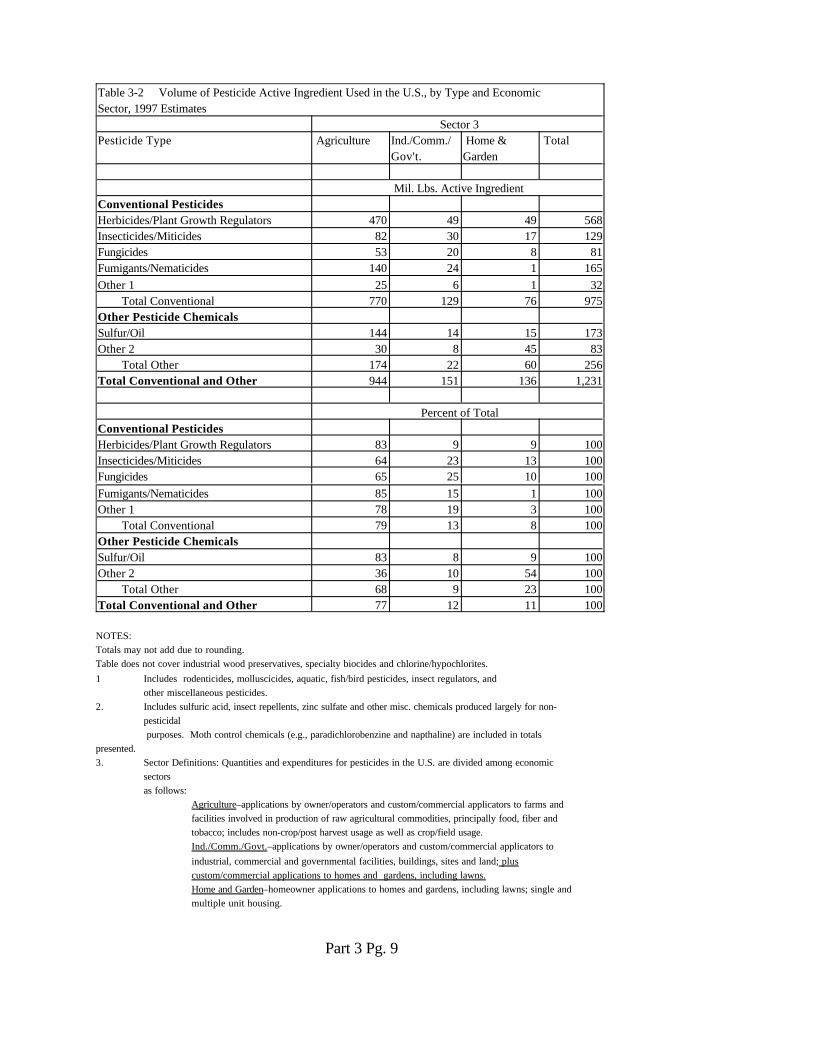
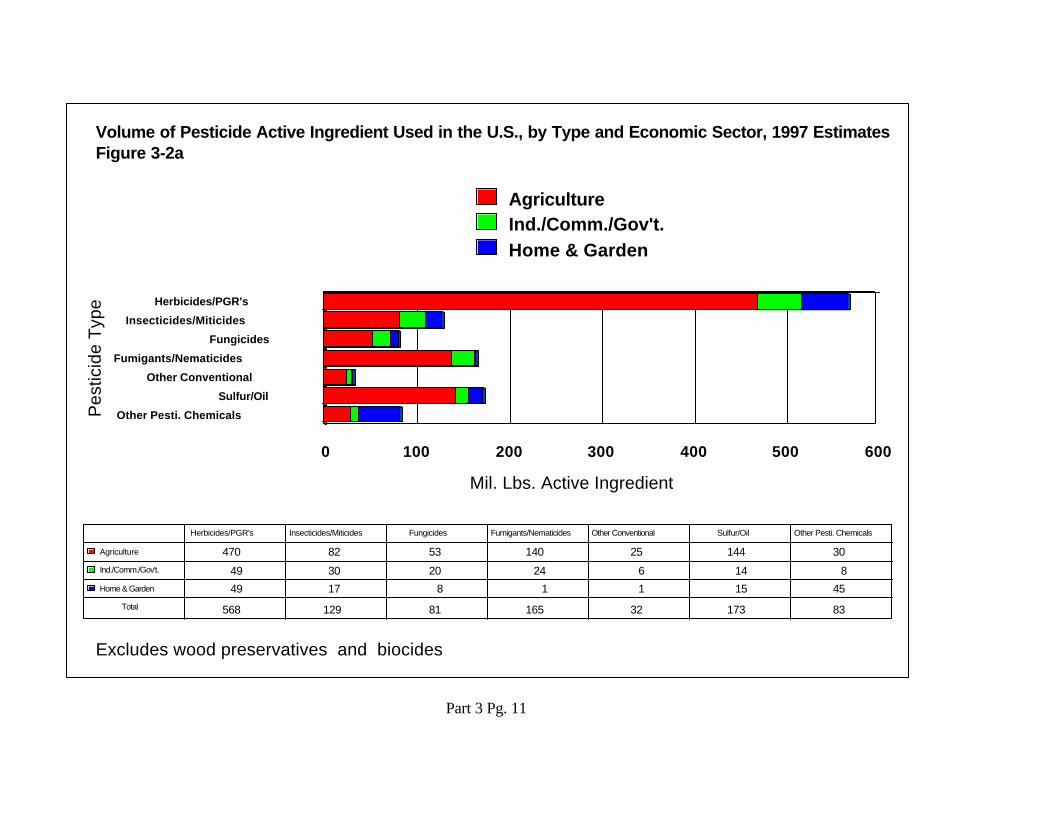
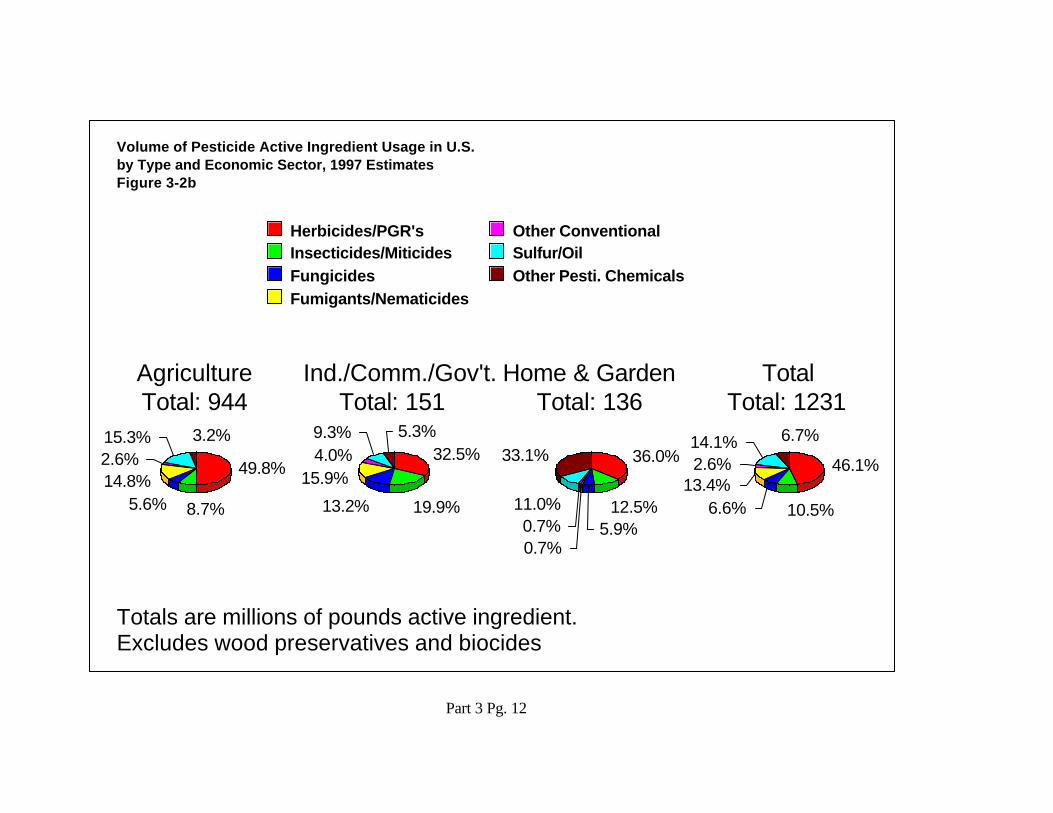
! Volume of Conventional/Other Pesticides Used, by Class and Sector, 1997 (See pages 3/8-12.)
" The breakdown of conventional/other pesticide usage by type/class for 1997 was asfollows:- herbicides 568 mil. lbs. (46%)- insecticides/miticides 128 " (10%)- fungicides 81 " (07%)- fumigants/nematicides 165 " (13%)- other conventional 32 " (03%)- subtotal 975 " (79%)- other p. chemicals 256 " (21%)- grand total 1,231" (100%).
Part 1 Pg. 13
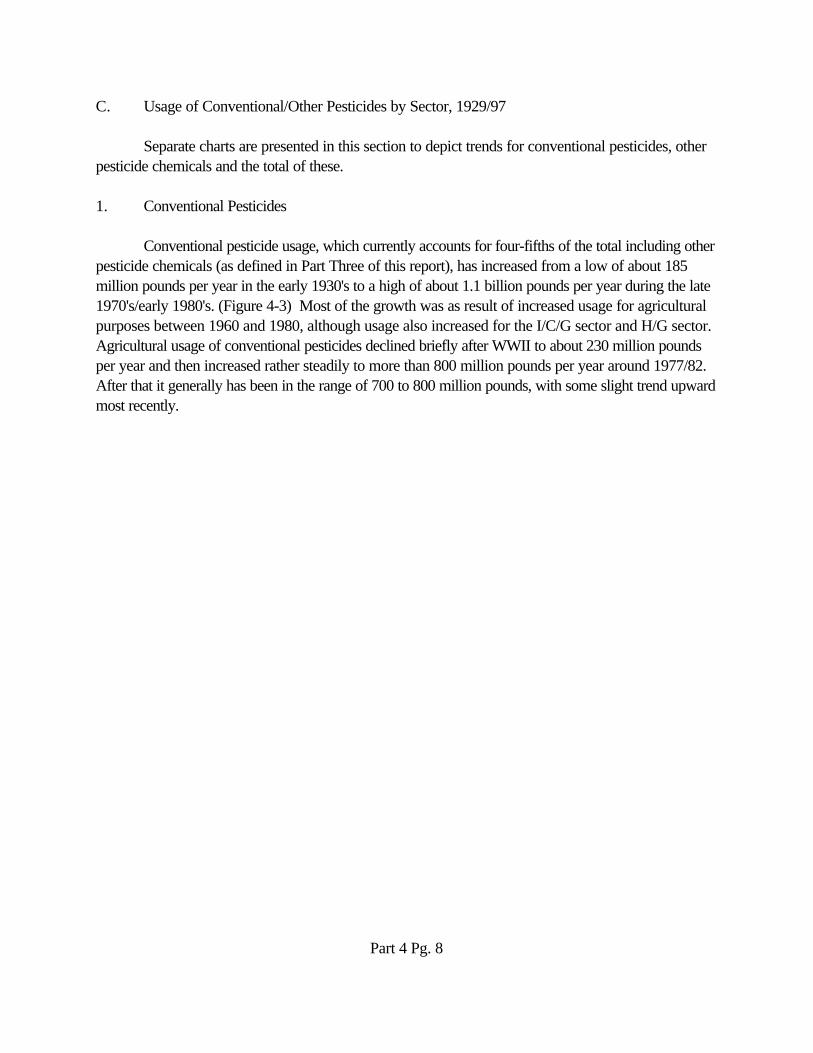
" Agriculture dominates in usage of conventional/other pesticide chemicals as it accountsfor about three-fourths of the active ingredient of such pesticides. For 1997, the sectortotals were:- agriculture 944 mil. lbs. (77%)- ind./comm./govt. 151 " (12%)- home/garden 136 " (11%)- total 1,231 " (100%).-
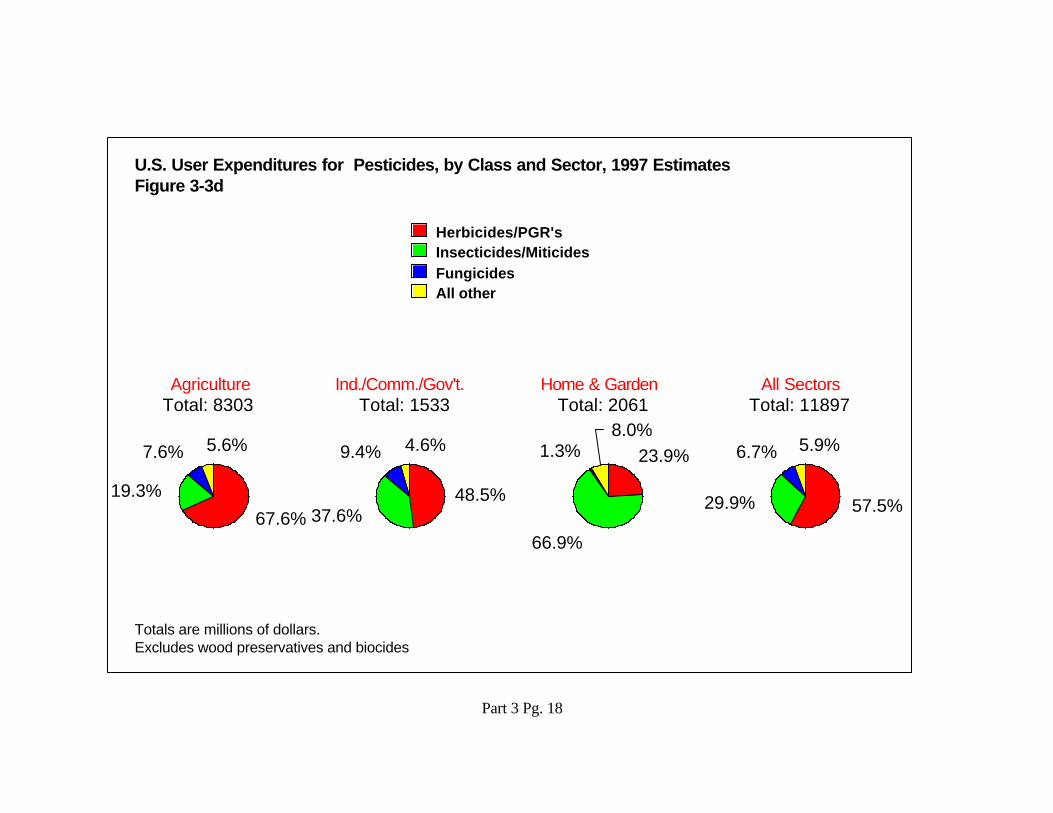
! Expenditures for Conventional/Other Pesticides by Type and Sector, 1997 (See pages 3/13-17.)
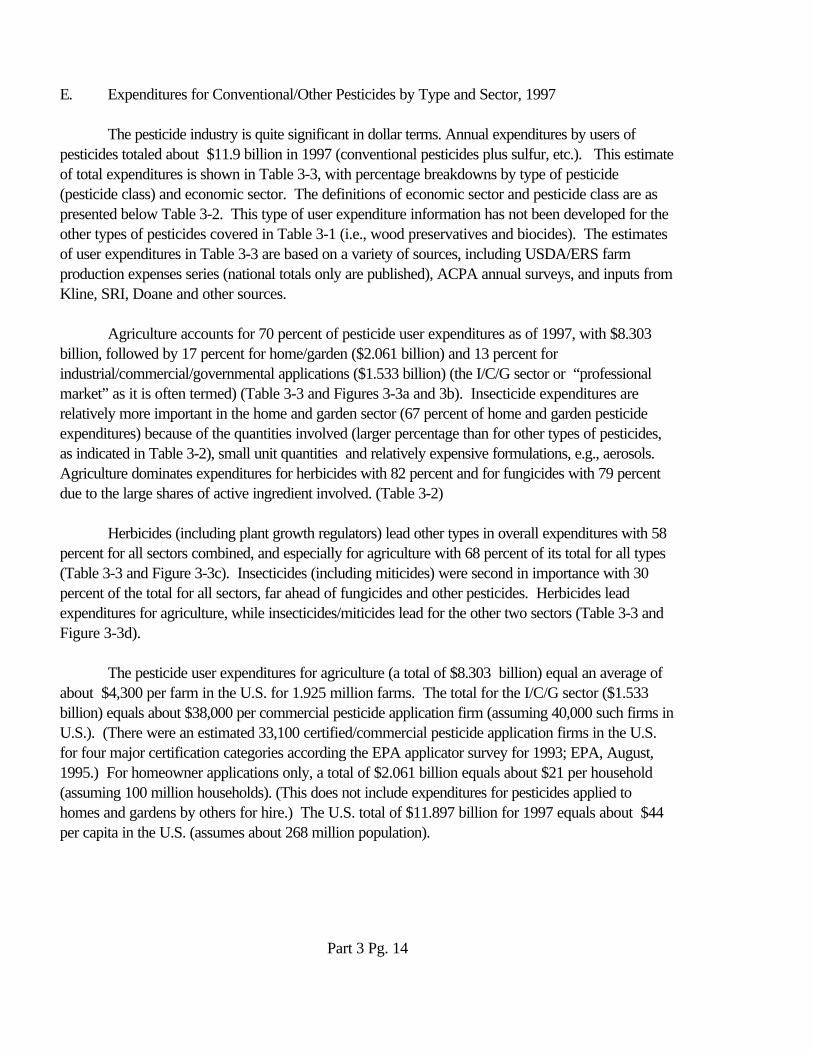
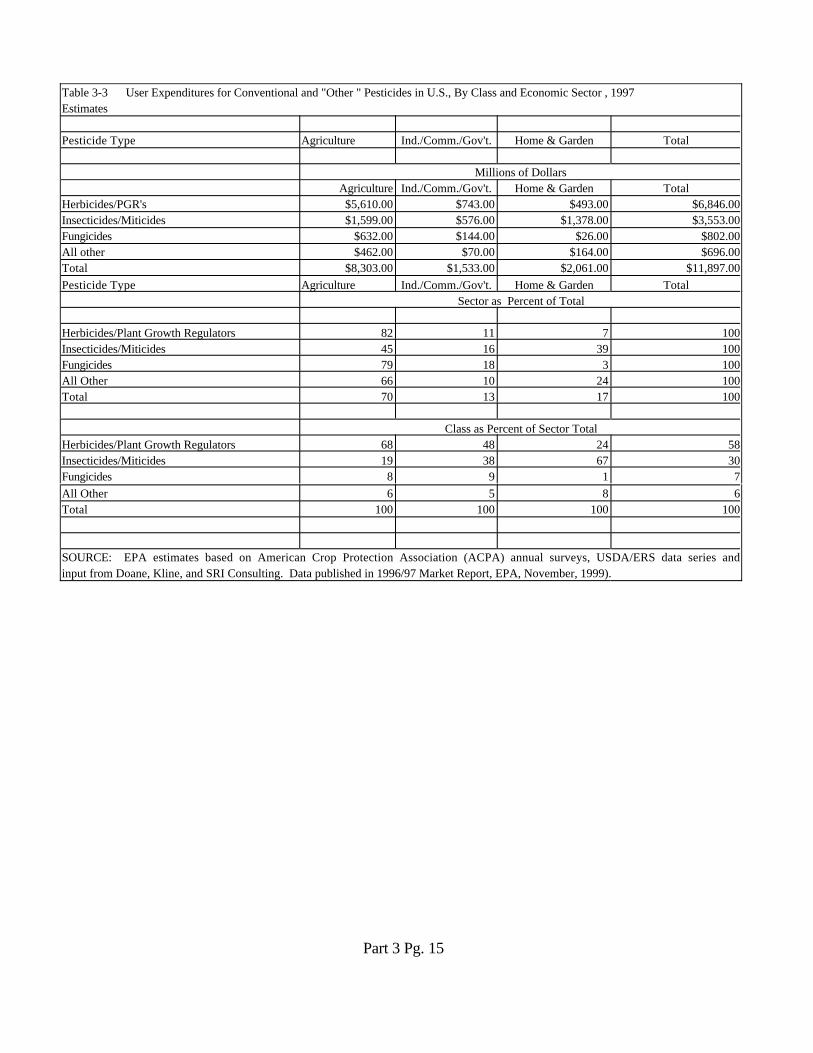
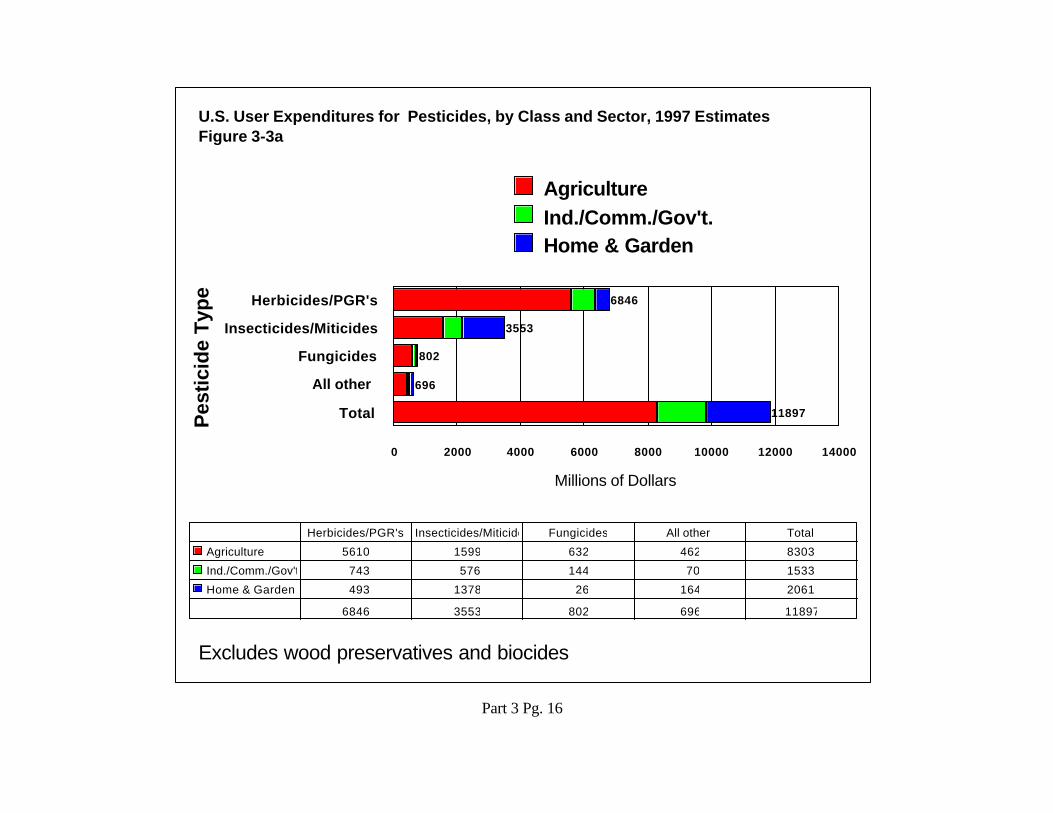
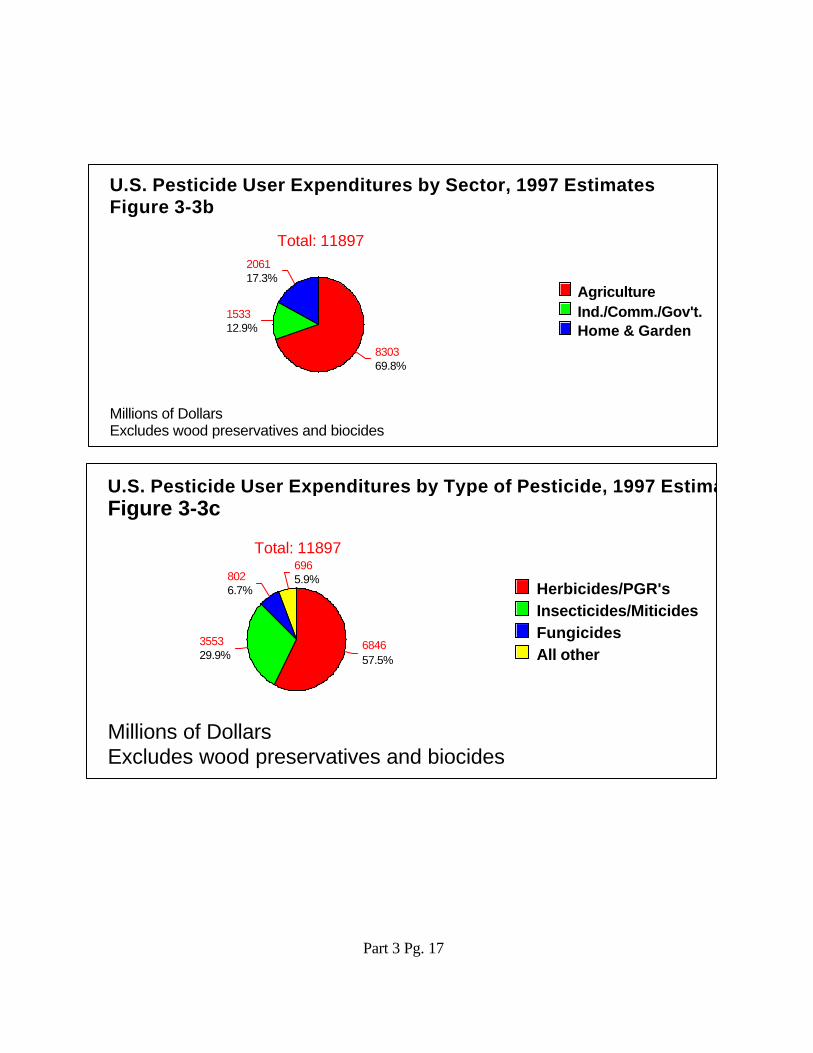
" The pesticide industry is quite significant in dollar terms. Annual expenditures by usersof pesticides totaled about $11.9 billion in 1997 (conventional pesticides plus sulfur,etc.).
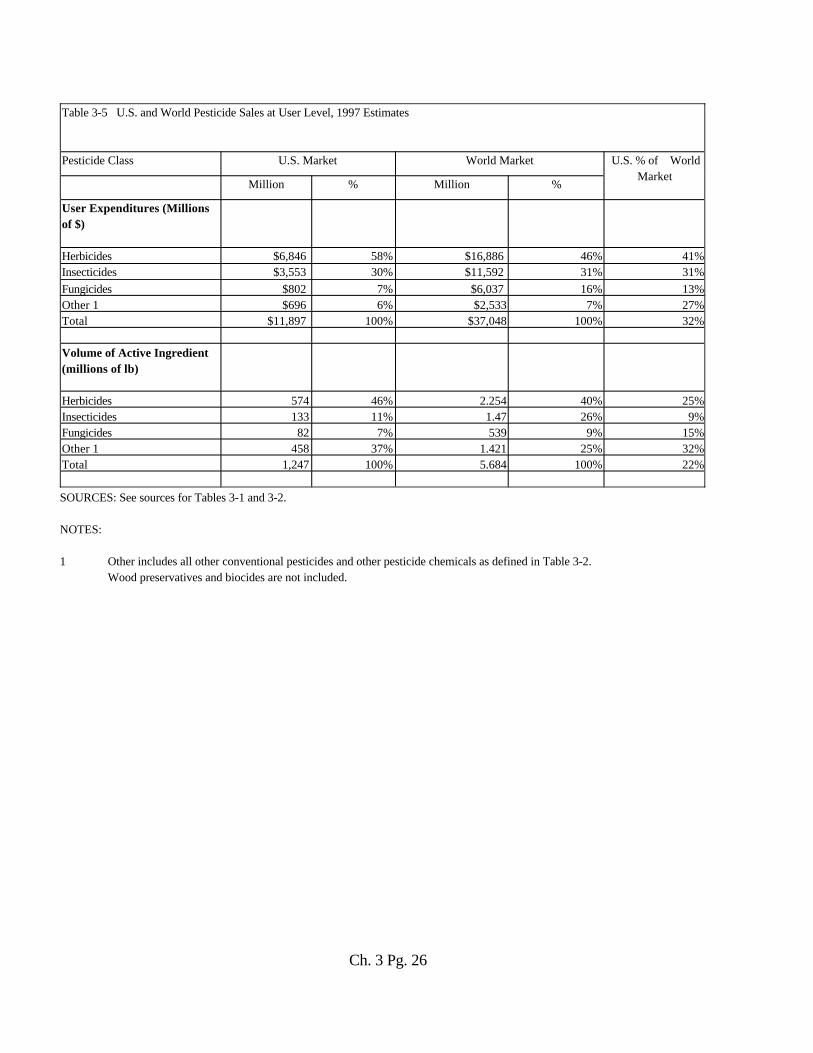
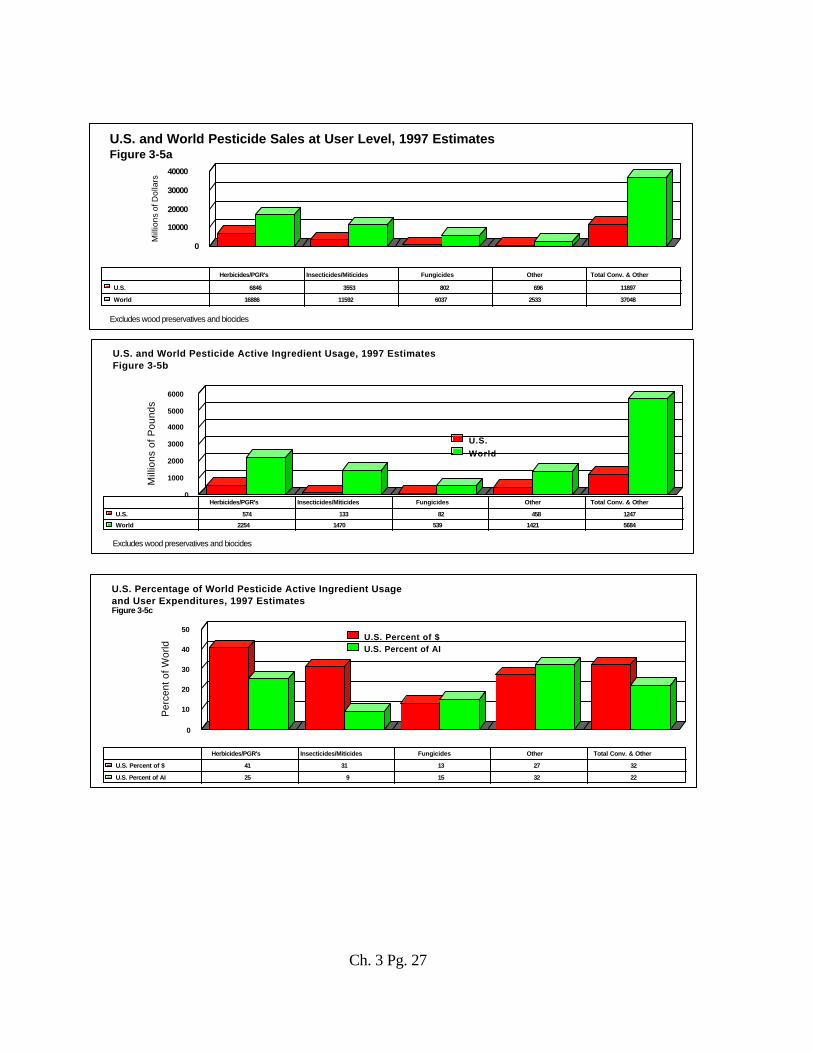
" These expenditures were distributed among pesticide types as follows:- herbicides $6,846 mil. (58%)- insecticides/miticides 3,553 (30%)- fungicides 802 (07%)- all other 696 (06%)- total 11,897 (100%).
" The U.S. total of $11.897 billion for 1997 equals about $44 per capita.
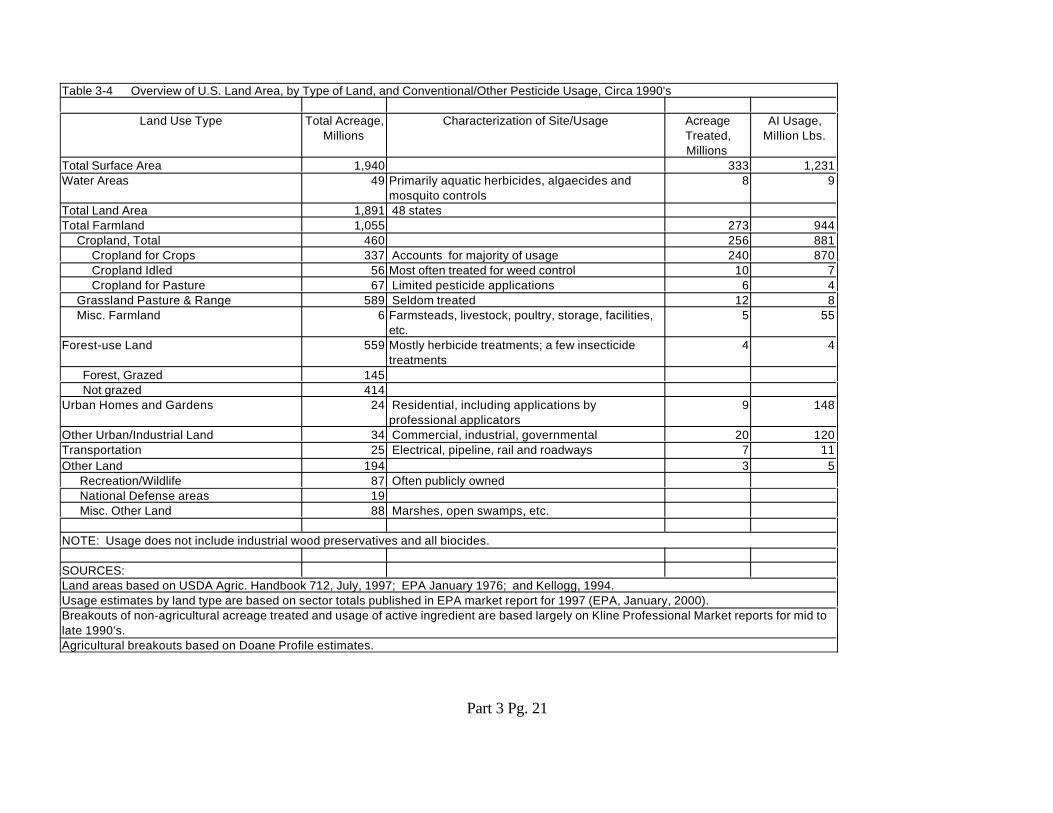
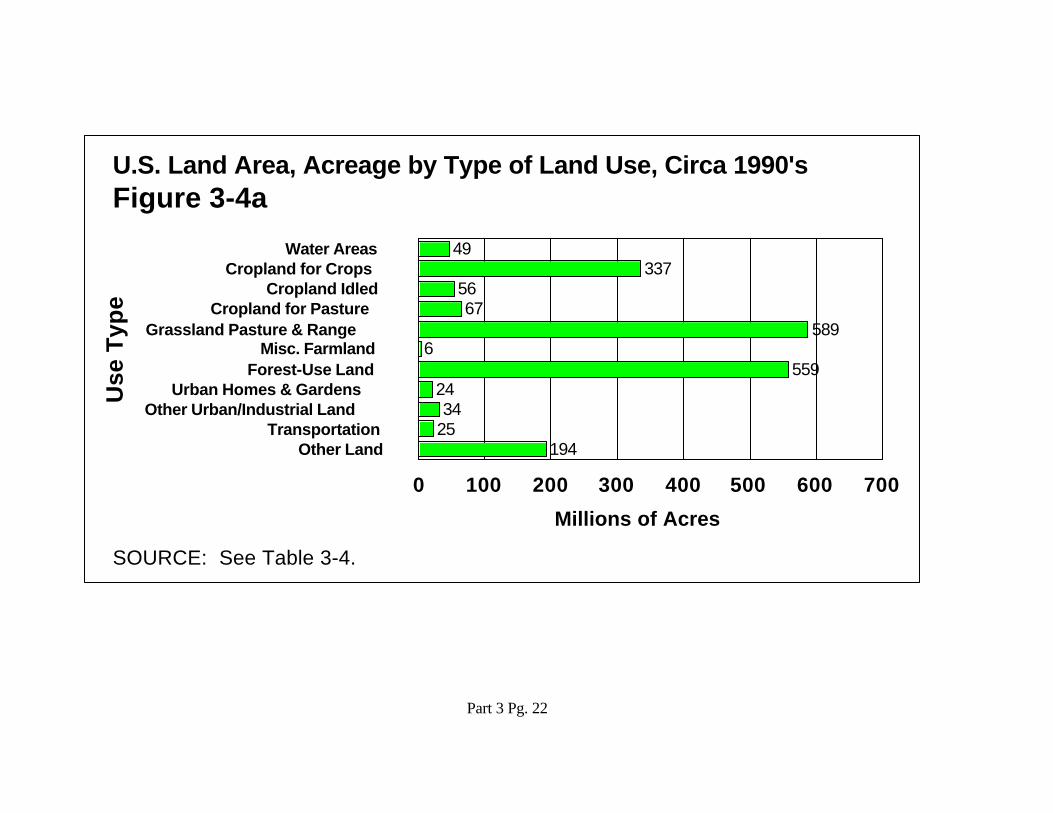
! Overview of U.S. Land Area and Pesticide Usage (See pages 3/18-23.)
" The total surface land area of the U.S. is 1,940 million acres, including 49 million acresof water areas (1992 estimates).
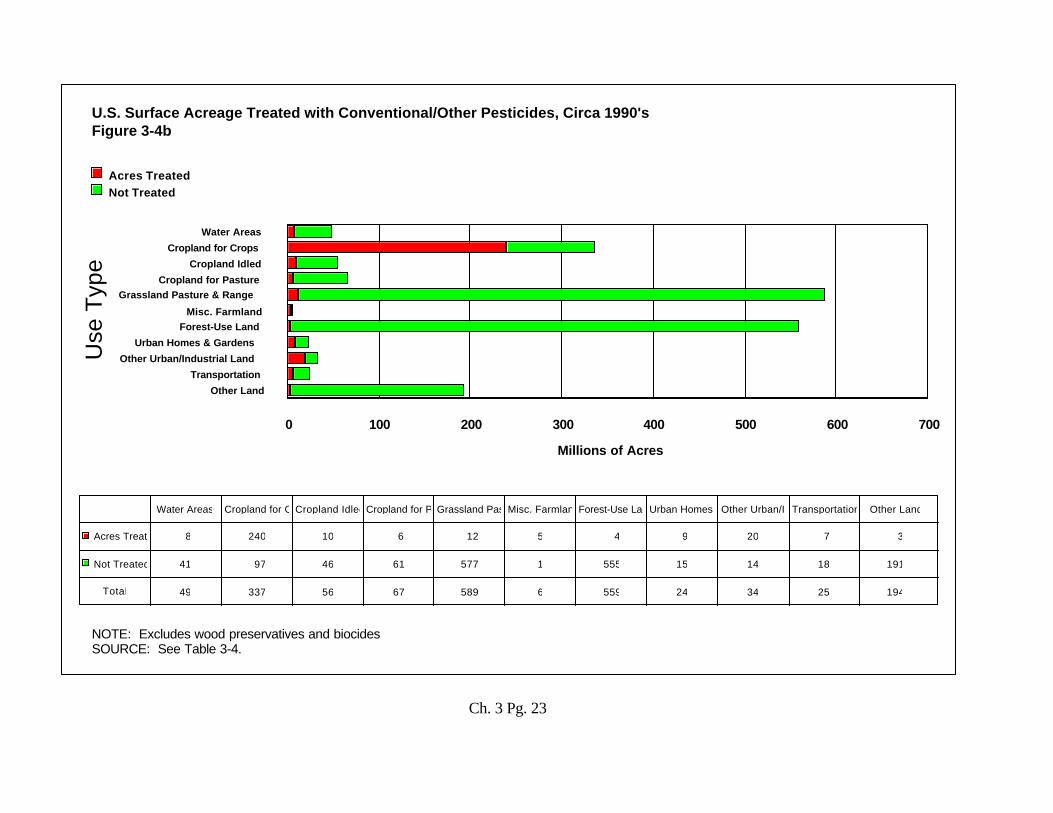
" Pesticides (conventional/other pesticide chemicals) are applied on an estimated 0.33billion acres per year, which is about 17 percent of the U.S. land area.
" More than half of U.S. land area is in farmland (1.055 billion acres) and accounts forabout three fourths of the use of pesticides (excluding wood preservatives andbiocides).
" Forest land (559 million acres) is the second ranking land use category and is notfrequently treated, e.g., less than one percent of acreage treated per year.
" Agricultural cropland for crops is quite commonly treated with pesticides. An estimated240 million acres are treated in a given year out of a total of 337 million acres ofcropland for crops.
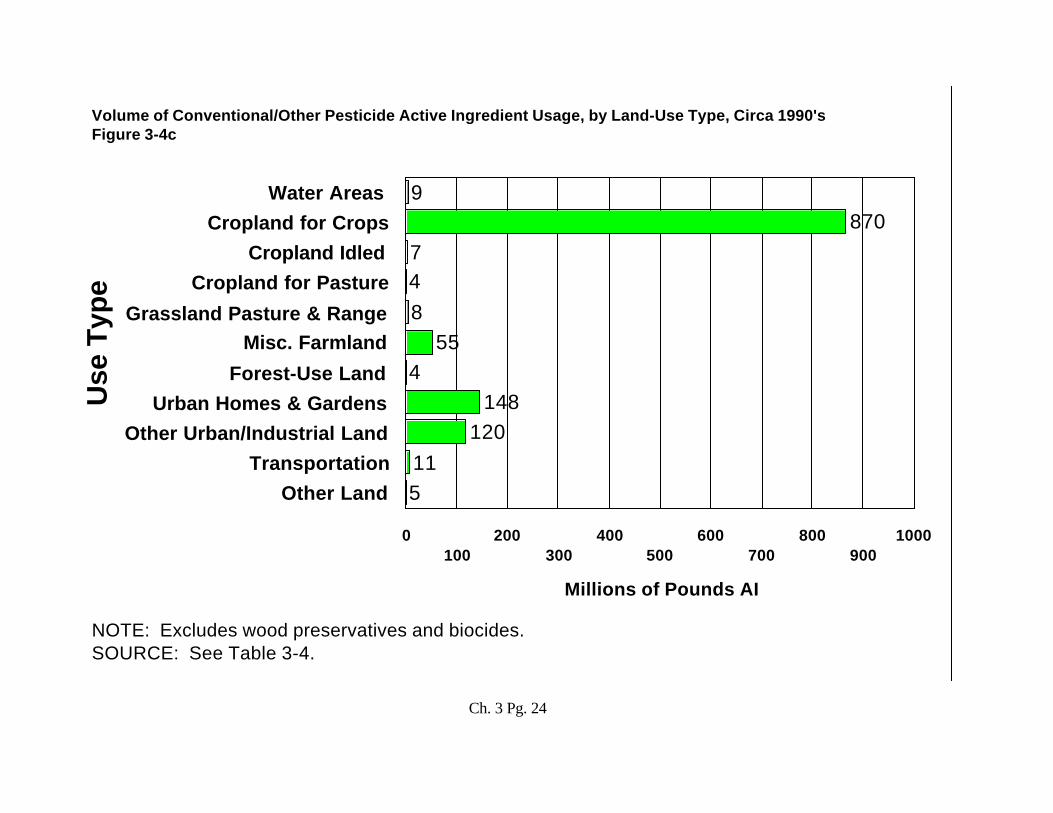
" In approximate values, urban homes and gardens account for about 1.2 percent of U.S.land area, 2.7 percent of acreage treated and about 12 percent of total usage of activeingredient for conventional/other pesticide chemicals. Other urban land has roughly 1.7percent of land area, 6 percent of acreage treated and 6.2 percent of active ingredientusage.
Part 1 Pg. 14
Part 1 Pg. 15
! Current U.S. Pesticide Usage Compared to the World (See pages 3/24-27.)
" The U.S. accounts for about one third of pesticide user expenditures world wide($11.987 billion out of $37.048 billion) in 1997 for conventional and other pesticidechemicals (excluding wood preservatives and biocides).
" In terms of active ingredient volume, the U.S. accounts for 22 percent of the world totalwith 1.231 billion pounds out of 5.684 billion pounds.
Part Four–Long Term Trends in Overall U.S. Pesticide Usage
! Total Usage of Conventional/Other Pesticides, 1929/1997 (See pages 4/4-7.)
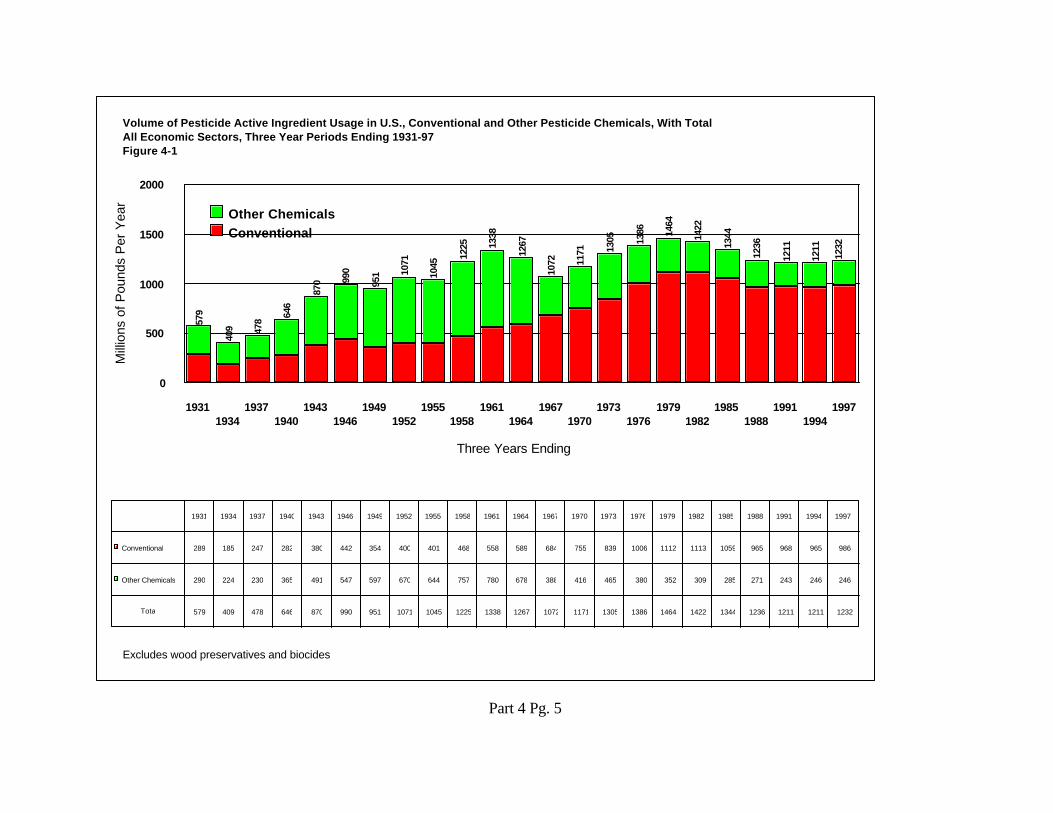
" Usage of conventional pesticides and other pesticide chemicals was well underway bythe beginning of the 1930's. By that time, there was widespread usage of calciumarsenate, lead arsenate, copper sulfate and mercury compounds for insecticides and/orfungicides, principally to protect agricultural crops.
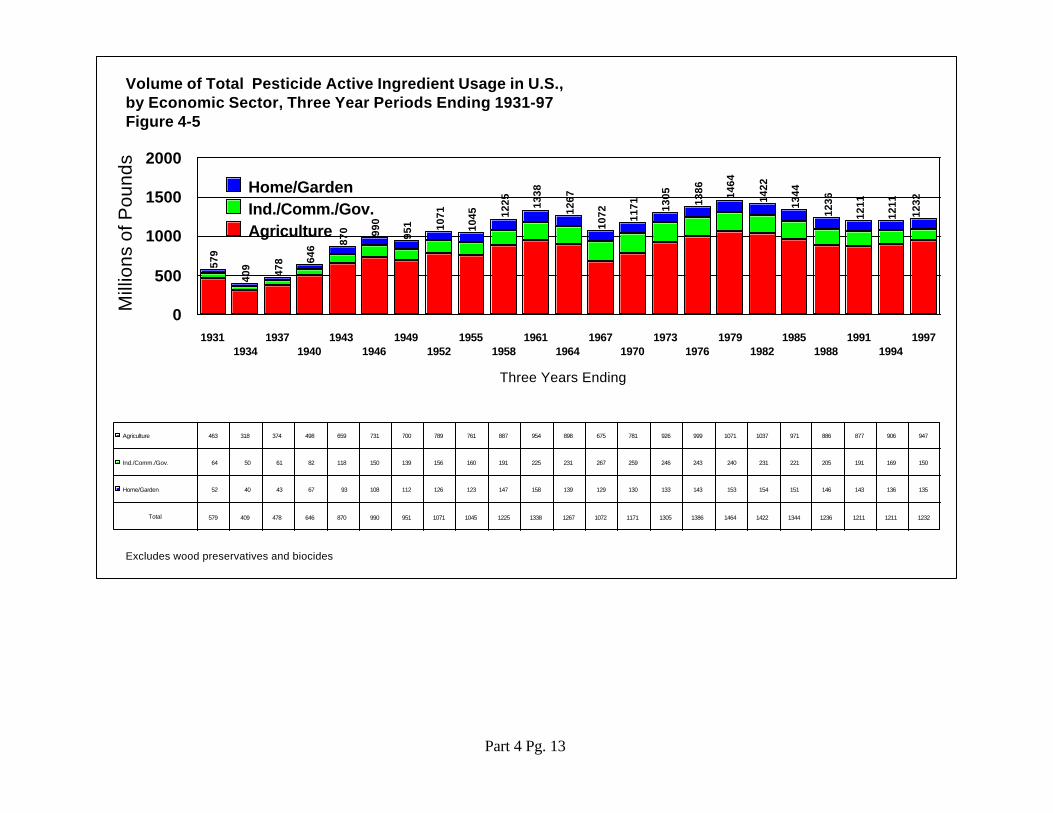
" There was a low point in usage in the early 1930's of about 400 million pounds peryear, after which usage more than doubled the low point, continuing through WWII (to nearly one billion pounds per year). After a brief pause in growth, usage increasedto a new high of about 1.3 billion pounds per year around 1960, followed by somedecline in the later 1960's. Then growth occurred again until usage peaked out atnearly 1.5 billion pounds per year around the late 1970's. Since that time, usage hasdeclined to some degree, holding about 1.2 billion pounds per year during the lastdecade.
" Conventional pesticide usage has exceeded other pesticide chemicals since the mid-1960's as new synthetic organic pesticides have replaced the other older chemicalssuch as sulfur and petroleum.
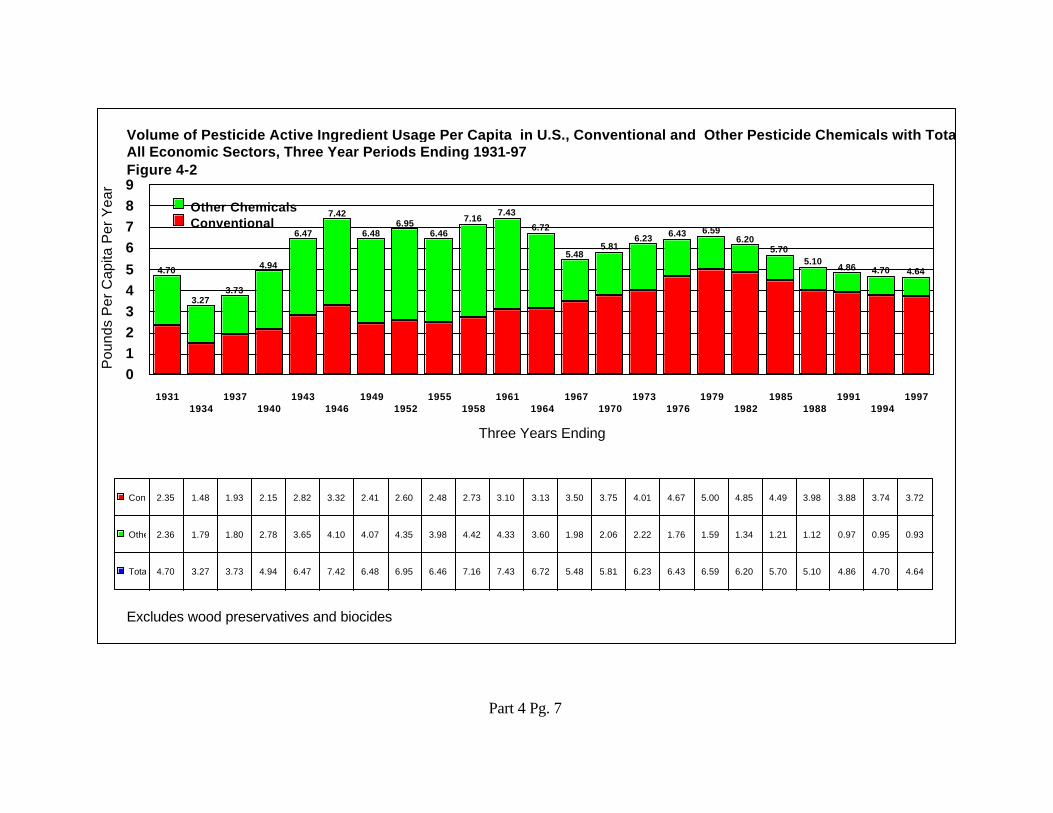
" On a per-capita basis, usage of conventional/other pesticide chemicals increasedsharply until the end of WWII when it was about 7.4 pounds. There was a decline inthe mid-1960's to about 5.5 pounds per capita (primarily as a result of reduced usesulfur) and a trend upward again to about 6.6 pounds per capita in 1977/79. Sincethen, there has been a rather consistent decline to a level of about 4.6 pounds percapita most recently.
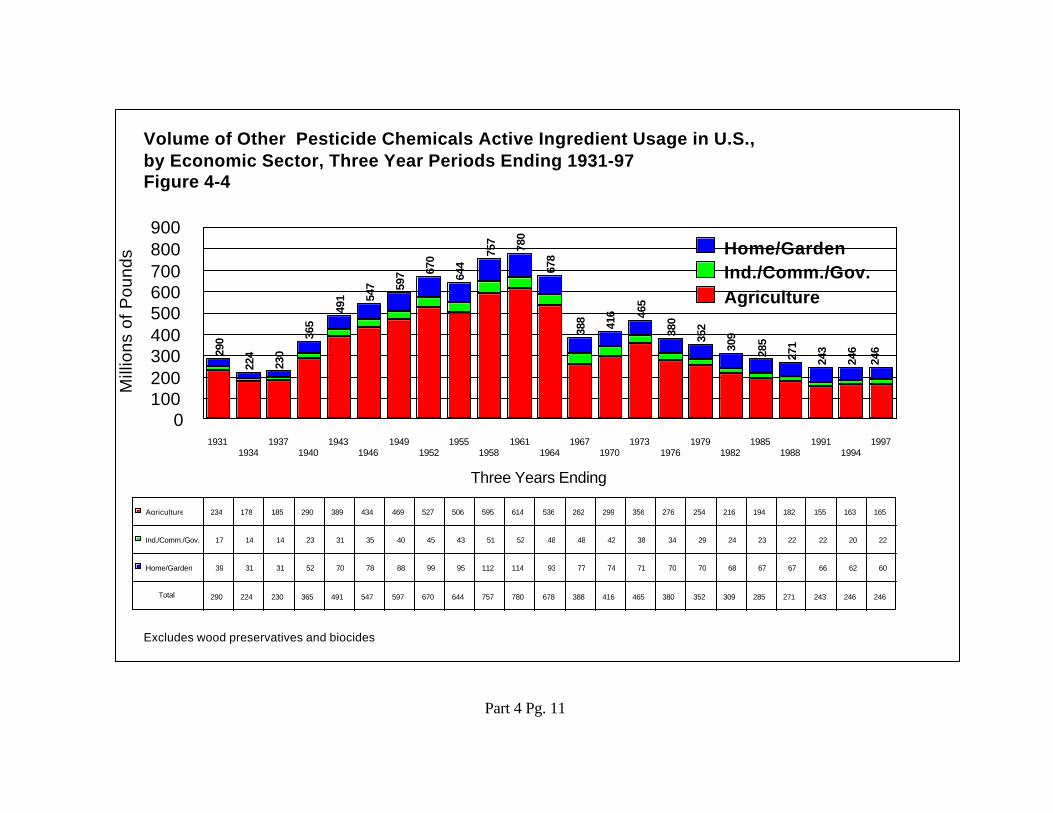
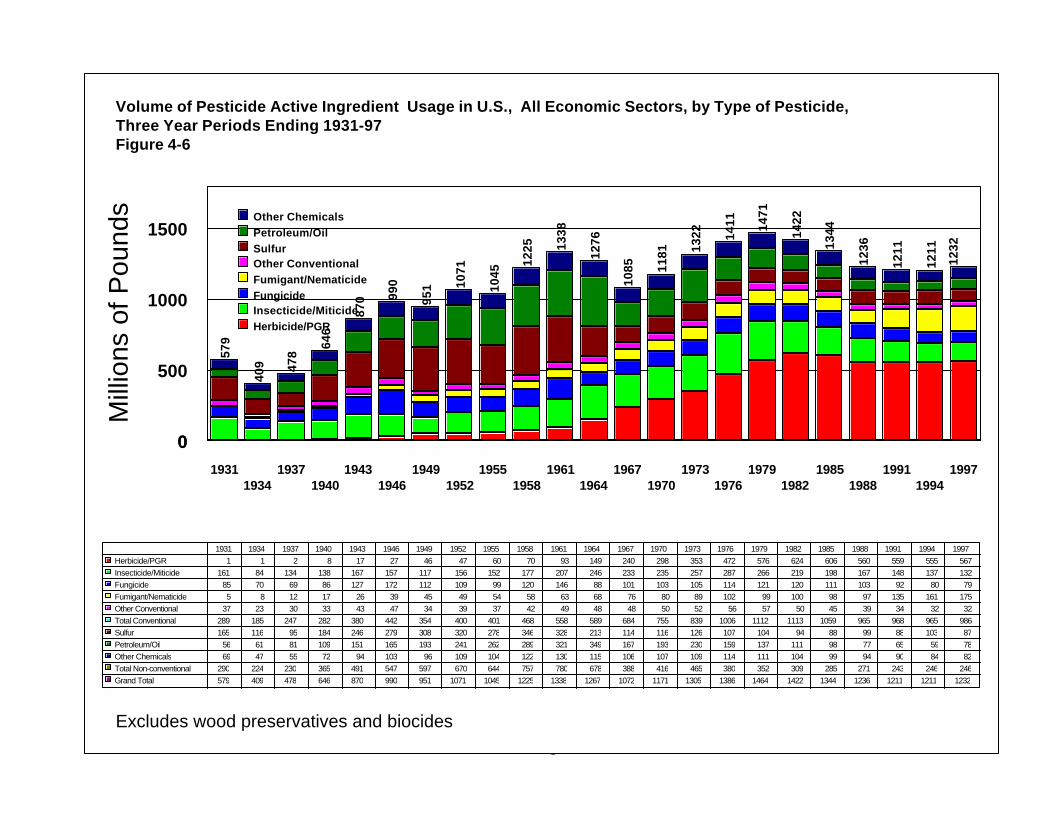
! Usage of Conventional/Other Pesticide Chemicals, by Type of Pesticide, 1929/97 (See pages4/14-15)
" Most of the growth in usage per year was due to the increased usage of herbicides (andPGR’s) starting with the advent of the synthetic organic pesticide industry as WWIIconcluded) (peak of about 625 million pounds per year in early 1980's).
" There was decreased usage of sulfur/oil since the early 1960's.
Part 1 Pg. 16
" There have been rather consistent increases in usage of fumigants/nematicides for thelast three decades, especially the last few three year periods.
" There has been declining usage insecticides/miticides active ingredient, as chemicalswith lower application rates have been adopted during the last 15 years.
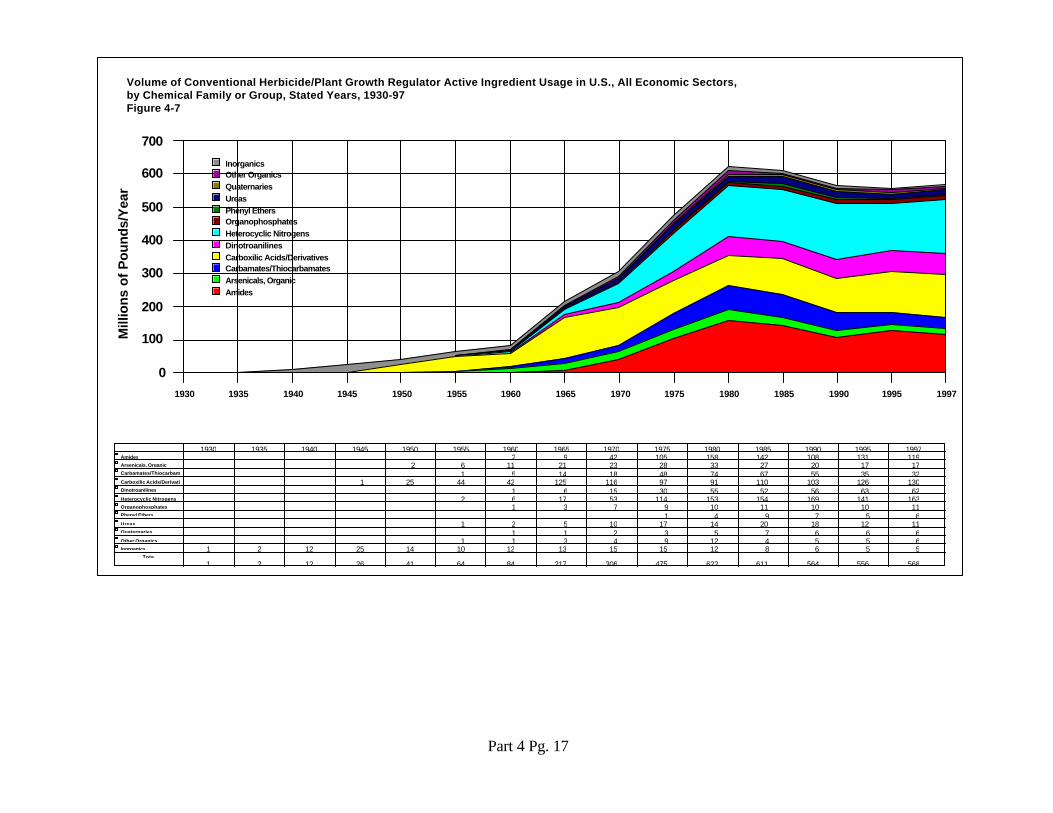
! Trends in The Types of Chemistry Being Used as Pesticides, 1930-97 (See pages 4/16-24.)" The types of chemicals used as active ingredients in pesticides have changed greatly
since the 1930's. In general, inorganic chemicals have declined in use and syntheticorganic chemicals have taken over increasingly since the mid-1940's.
" Herbicides/Plant Growth Regulators (H/PGR)- relatively small amounts of inorganics (e.g., sodium azide and sodium arsenite)
were in use prior to the rapid growth of herbicide usage after 1960 and someinorganics continue to be used;
- the carboxylic acids were the first major herbicide group to emerge (largely dueto the phenoxies, such as 2,4-D and 2,4,5-T) and continue to be important dueto the usage of glyphosate as well as 2,4-D and others;
- the heterocyclic nitrogens, most notably the triazines, which emerged in the1950's and 1960's, became the leading herbicide family based active ingredient,which they still are in the 1990's;
- the amides, between 1960 and 1980, became the leading herbicide family andcontinue to account for more than 100 million pounds of active ingredient peryear; (Acetochlor is replacing alachlor within the amides.) and;
- the ureas, starting about 1955, and the phenyl ethers (about 1975), areexamples of newer herbicides with small amounts of active ingredient usage, butlarge acreages treated due to low application rates.
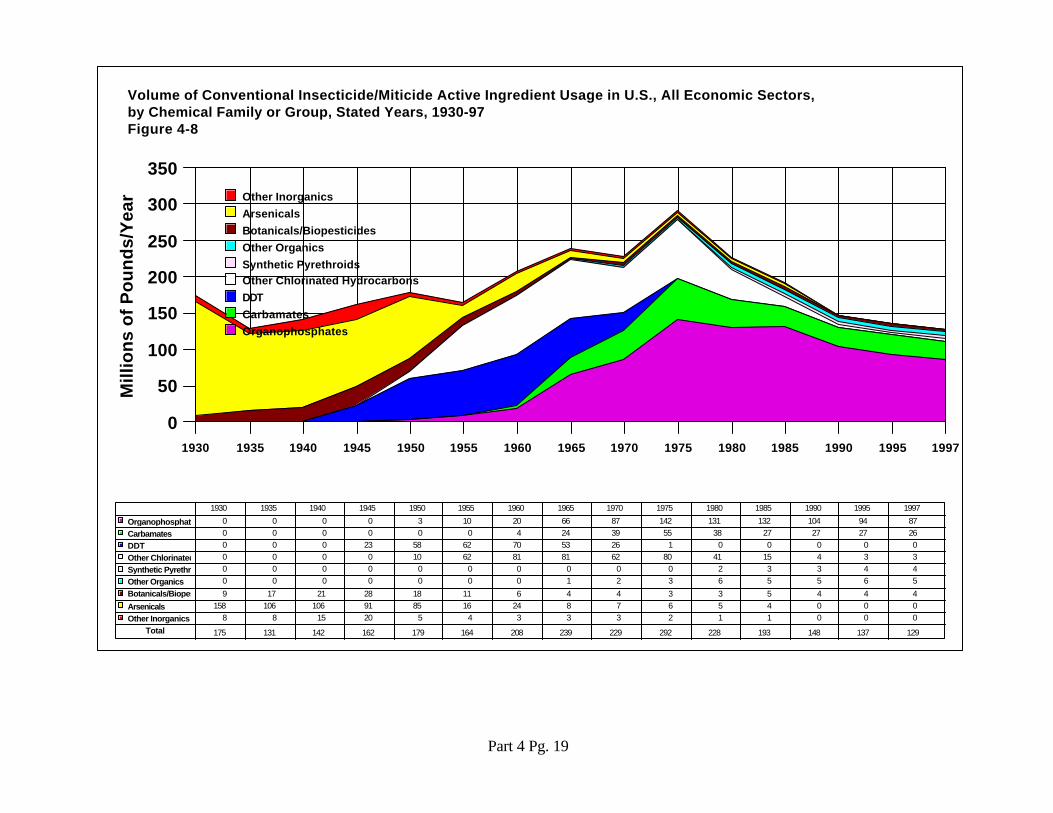
" Insecticides/Miticides (I/M)- The pattern in insecticide usage has been from dominance by inorganics until
about 1950, followed by the organochlorines (led by DDT) through the mid-1970's and then organophosphates became the leading insecticide family interms of active ingredient usage.
- arsenical insecticides (particularly calcium and lead arsenates) were already incommon use by 1930 with usage of more than 150 million pounds per year andwere the leading chemical family by far; their usage declined quite notably, byabout 90 percent, by 1955 as the organochlorines predominated;
- DDT came on stream by 1945 and reached its maximum usage around 1960; itwas essentially no longer in use by the mid-1970's; other organochlorines, suchas chlordane and toxaphene, increased in usage through the mid-1970's butdeclined to only a few million pounds per year by 1990;
- botanicals, such as pyrethrum, nicotine and rotenone, were importantinsecticides already by 1930; their use along with other botanicals andbiopesticides increased in usage to 28 million pounds in 1945, after which such
Part 1 Pg. 17
usage declined; botanicals/biopesticides of various types have been in usewithin the range of 3 to 5 million pounds per year since 1965. These figures donot reflect pesticide active ingredient generated by genetically modifiedorganisms regulated as pesticides (GMO's);
- the organophosphates were in use by 1955 and have been the leadinginsecticide chemical family since 1970; their peak usage occurred around 1975with 142 million pounds of active ingredient, after which usage has declined tosome degree; usage of organophosphates was an estimated 87 million poundsin 1997.
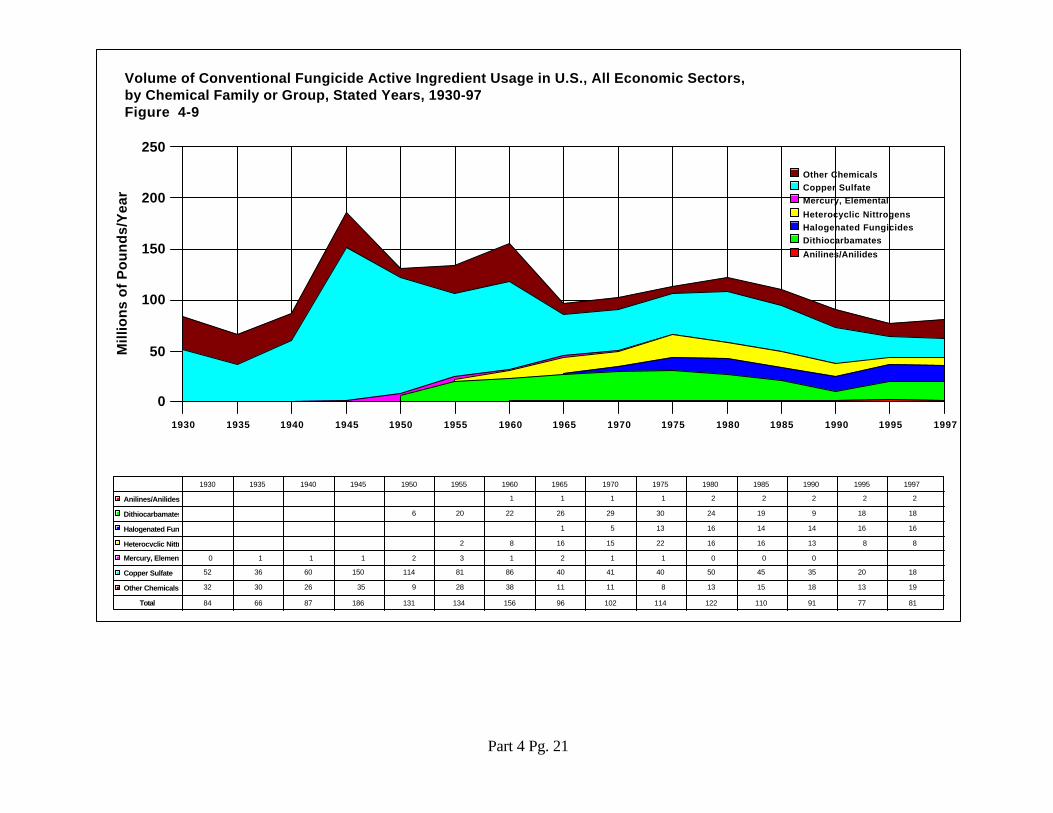
" Fungicides (F)- Copper sulfate has been the leading fungicide in terms of active ingredient usage
most of the 20th Century. It had peak usage of 150 million pounds in 1945 andis still in use today (18 million pounds in 1997).
- copper sulfate (used with lime, known as Bordeaux mixture) was introduced asa fungicide in the U.S. by 1887 and came into large-scale application by about1910, most often for potato and apple disease control;
- mercury based fungicides were in use from 1935 until about 1975; - the dithiocarbamates were in use by 1950 and most of the time since have been
the second ranking fungicide chemical family; and- heterocyclic nitrogens were in use by 1955 and reached largest usage around
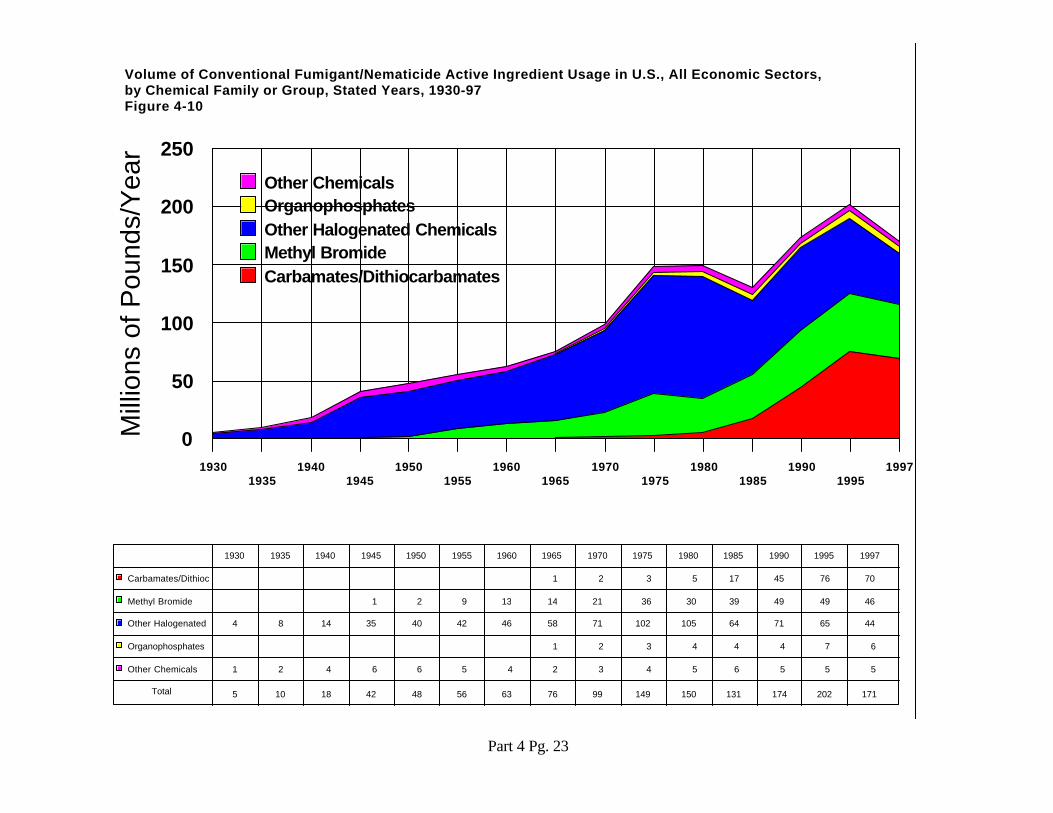
1975." Fumigants/Nematicides (F/N)
- Halogenated fungicide chemicals were in use by 1930 and since have been theleading chemical family for this class of pesticides.
- chloropicrin and carbon tetrachloride were among the first to be of importancein this class of pesticides;
- methyl bromide has been an important fumigant/nematicide since it began usearound 1945; and
- the carbamates/dithiocarbamates have had expanded usage since the late1980's to 66 million pounds in 1997.
! User Expenditures for Conventional/Other Pesticides, by Type of Pesticide and Sector,1979/97 (See pages 4/25-27.)
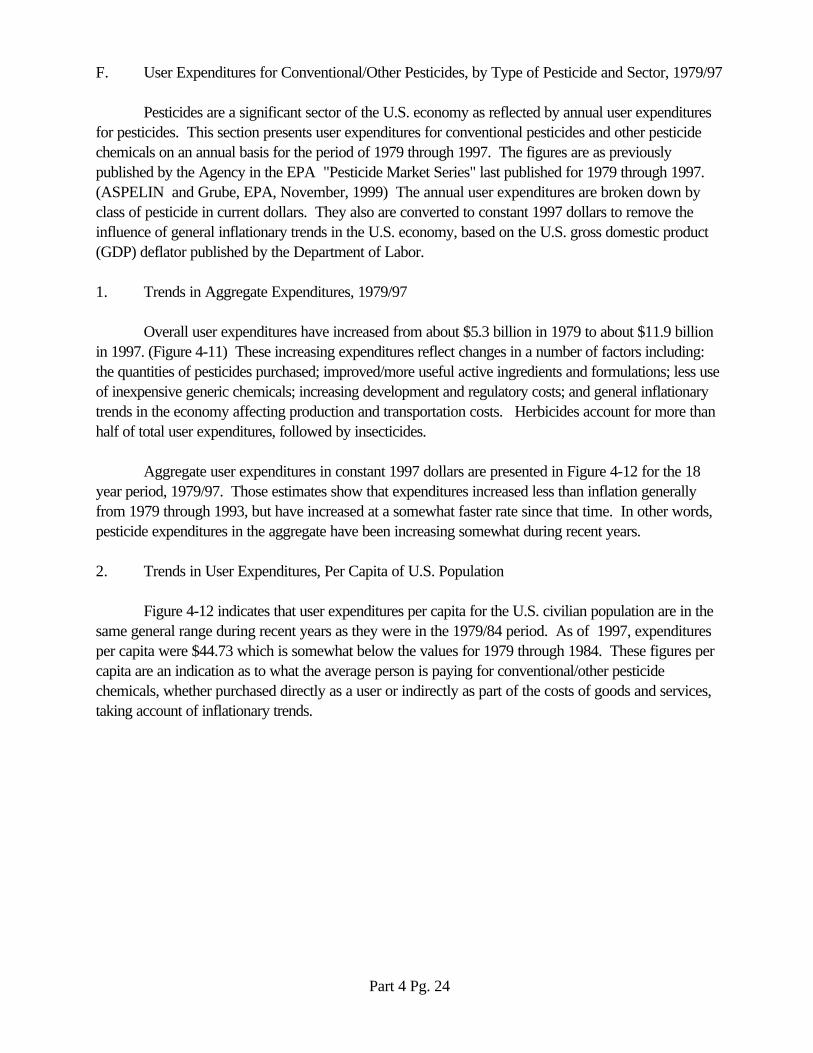
" Pesticides are a significant sector of the U.S. economy as reflected by annual userexpenditures for pesticides.
" Overall user expenditures have increased from about $5.3 billion in 1979 to about$11.9 billion in 1997. (nominal dollars)
" These increasing expenditures reflect changes in a number of factors including: thequantities of pesticides purchased; improved/more useful active ingredients andformulations; less use of inexpensive generic chemicals; increasing development and
Part 1 Pg. 18
regulatory costs; and general inflationary trends in the economy affecting productionand transportation costs. Herbicides account for more than half of total userexpenditures, followed by insecticides.
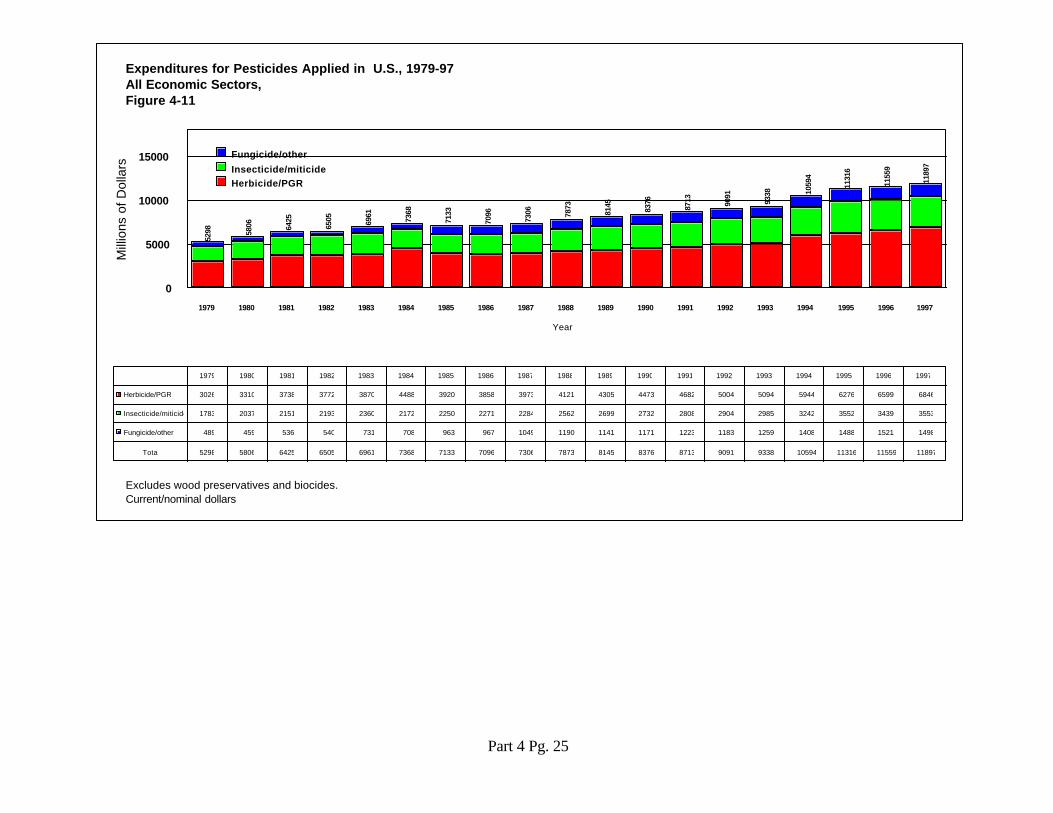
" Aggregate user expenditures in constant 1997 dollars increased less than inflationgenerally from 1979 through 1993, but have increased at a somewhat faster rate sincethat time. In other words, pesticide expenditures, in real terms, have been increasingsomewhat during recent years.
" User expenditures per capita for the U.S. civilian population in constant 1997 dollarsare in the same general range during recent years as they were in the 1979/84 period. As of 1997, expenditures per capita were $44.73 which is somewhat below the valuesfor 1979 through 1984. These figures per capita are an indication as to what theaverage person is paying for conventional/other pesticide chemicals, whether purchaseddirectly as a user or indirectly as part of the costs of goods and services, takingaccount of inflationary trends.
Part Five–Agricultural Pesticide Usage Trends
! Profile of Agricultural Applicator Sector (See pages5/1-3.)
" Agriculture is an important part of the United States in many ways. It is the source offood and fiber for the Nation and people elsewhere in the world through exports.
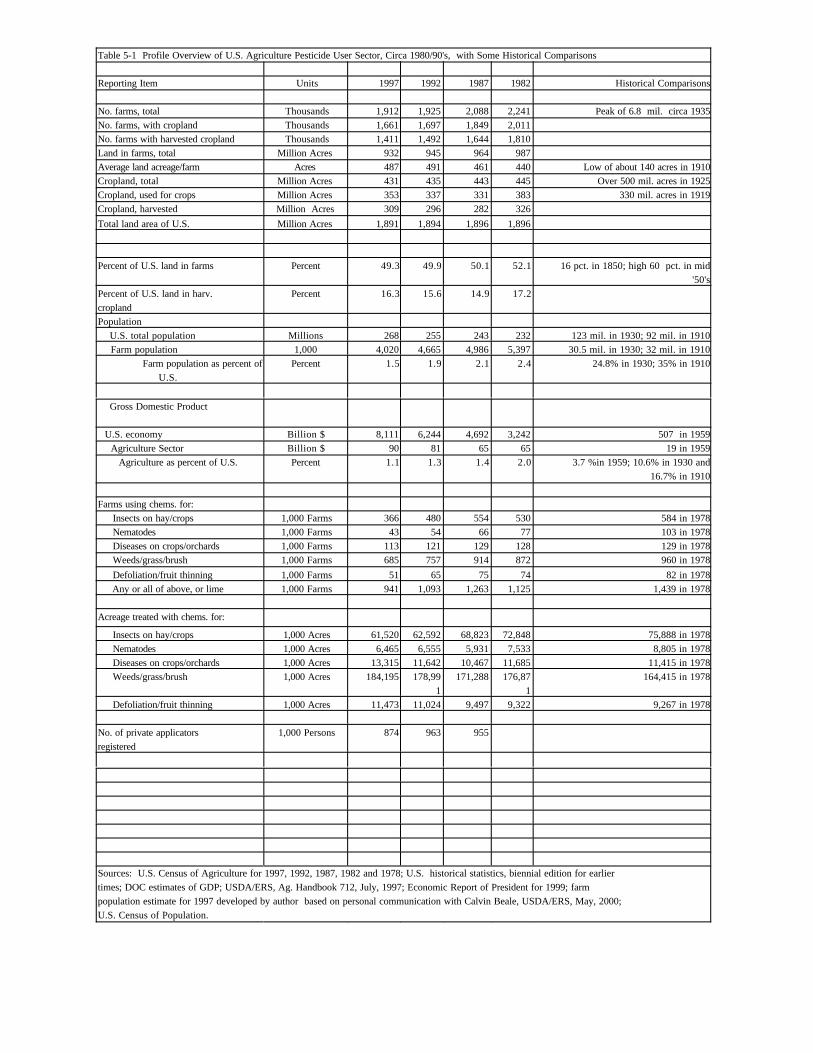
" There are about 1.9 million farms in the U.S. (1997 Census of Agriculture). Thesefarms contain more than 930 million acres of land which is nearly half of the land area ofthe U.S. (about 1.9 billion acres). They have about 350 million acres of cropland usedfor crops each year, which is where most of the agricultural pesticides are applied.
" Quite remarkably, U.S. agriculture have been able to produce food and fiber to meetmarket needs (and even produce surpluses from time to time), with about the sameamount of cropland it used many decades ago. This is due apparently to everimproving technology and efficiency in agriculture, including the use of more and moreuseful pesticides to control pests of various kinds.
" Pesticides of one type or another are applied on a majority of U.S. farms raising crops. In 1997, about 0.94 million of the 1.661 million farms with cropland used one or morepesticide types on at least some acres. Herbicide are used on the most farms (685,000farms in 1997) followed by insecticides (366,000).
" As of 1997, there were 874,000 persons who had been certified under FIFRAprovisions as private pesticide applicators. There is an average of nearly one certifiedprivate applicator per U.S. farm that applies pesticides in crop production (e.g,874,000 certifications compared with 941,000 farms using pesticides in cropproduction in 1997).
Part 1 Pg. 19
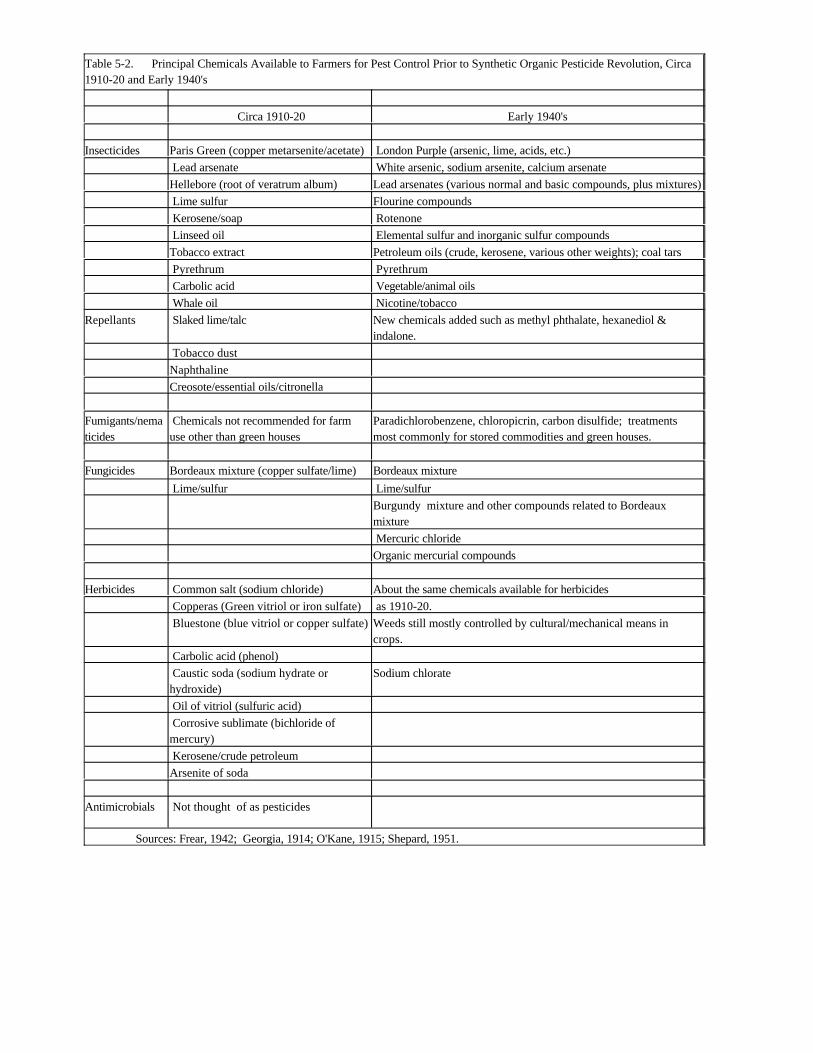
! Principal Chemicals Available to Farmers For Pest Control Before End of WWII (See pages5/4-5.)
" Two dramatic changes occurred starting with the latter stages of WWI, with respect tothe availability of chemicals for farmers to control pests. - The first was the discovery and commercial development of new chemical
compounds which were efficacious pest controls, principally synthetic organicpesticides such as DDT and 2,4-D.
- The second major change was the emergence of an industry to producepesticides for use by farmers. Until the new chemicals came along, basicallythere was no industry to efficiently produce pesticides and make them availableto farmers at prices that made them cost effective. Farmers generally had topurchase raw chemicals (often crude industrial chemicals) and mix/formulate thepesticide for use themselves.
" Principal chemicals available to farmers, circa 1910-20 and early 1940's:- For insect control, various arsenicals were important as early as 1910-20 (Paris
Green containing copper metarsenite and lead arsenate) and increasingly byWWII. Various arsenicals were recommended by WWII, such as whitearsenic, sodium arsenite, calcium arsenate and lead arsenate. Sulfur andpetroleum were used as insecticides as were several plant-based items,including rotenone, pyrethrum, vegetable oils and nicotine/tobacco.
- Very limited chemistry was available as fungicides in 1910-20, principallyBordeaux mixture (copper sulfate/lime) and lime/sulfur. The situation had notchanged much by WWII, as only mercurials were added as fungicides.
- The farmer did not have available highly useful chemicals for control of weedsuntil the end of WWII, starting with 2,4-D. Rather common chemicals such assodium chloride, iron sulfate, copper sulfate, carbolic acid, sulfuric acid andpetroleum were basically all that was available and they were neither very usefulnor without undesired effects from usage.
- Farmers basically did not commonly use fumigants/nematicides through WWIIand neither did they have available to them antimicrobials for dairy sanitation,and other purposes, as we think of such applications today.
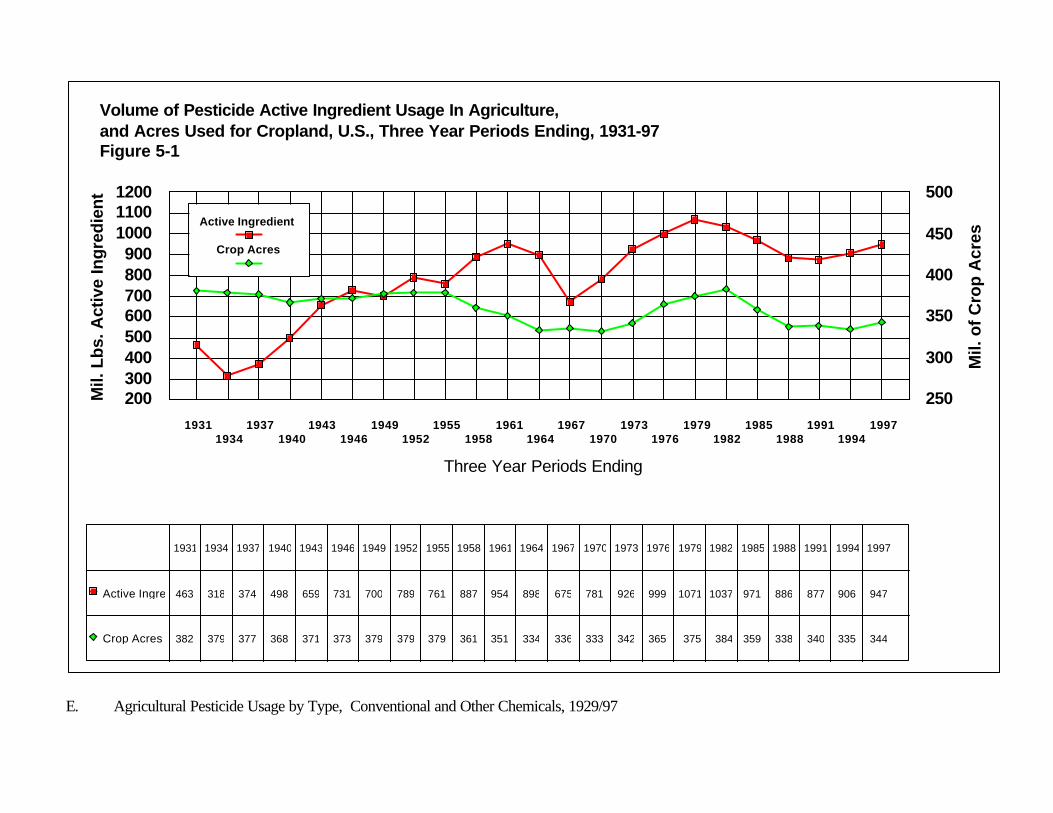
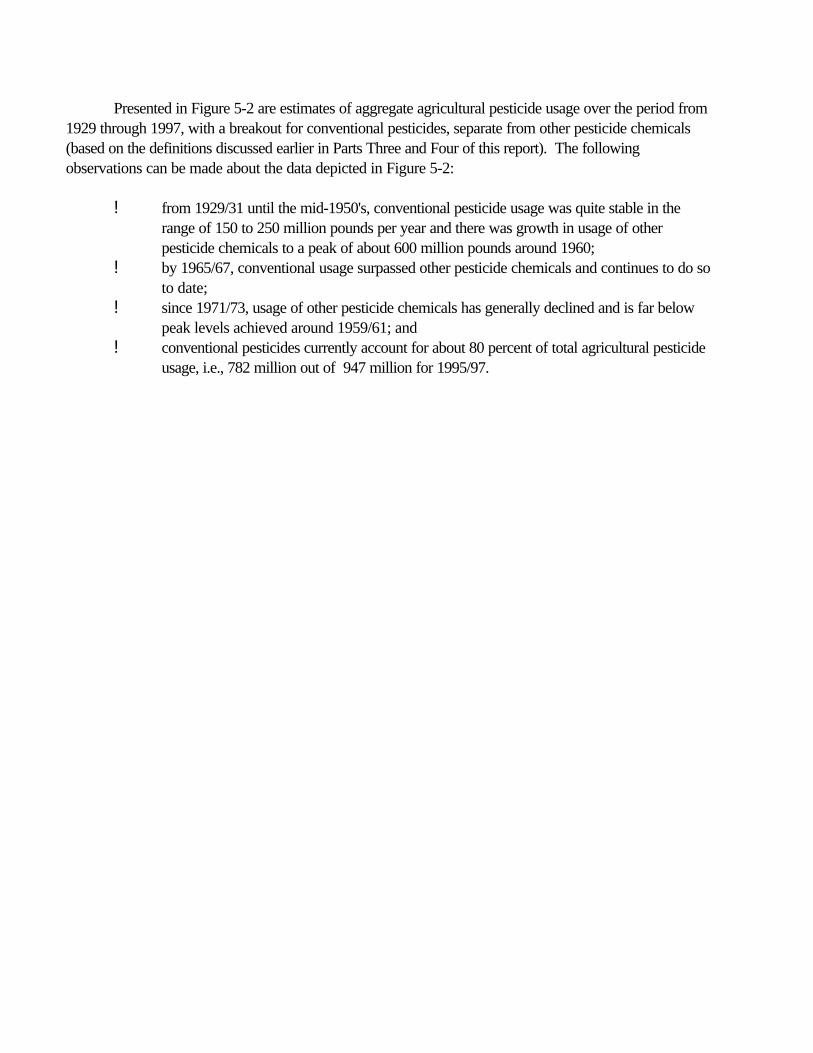
! Agricultural Pesticide Usage Trends, Circa 1930 to Date (See pages 5/7-12.)
" As of 1929/31, about 460 million pounds of active ingredient were used in agricultureon an annual basis. Usage declined sharply during the next three-year period (ending1934) and then increased quite consistently until after WWII (about 720 million poundsper year) when there was a slowing of growth. Then usage increased rather steadily toabout 950 million pounds per year around 1960. There was a cutback in usage duringthe last half of the 1960's and then usage increased to a peak for the seven decades in1977/79 at nearly 1.1 billion pounds of active ingredient per year. The above trendsreflect expanded use of insecticides starting with late WWII, the growth of herbicide
Part 1 Pg. 20
usage until the late 1980's, and a drop in usage of sulfur/oil, particularly in the mid-late1960's.
" The volume of pesticide active ingredient used in agriculture has been quite closelycorrelated with acres of cropland since about 1960. The association is particularlystriking since 1970. Variations in crop acreage did not appear to be a major factorshaping total agricultural pesticide usage from the 1930's until about 1960, asinsecticide and herbicide usage increased dramatically, regardless of crop acres.
" By 1965/67, conventional usage surpassed other pesticide chemicals and continues todo so to date.
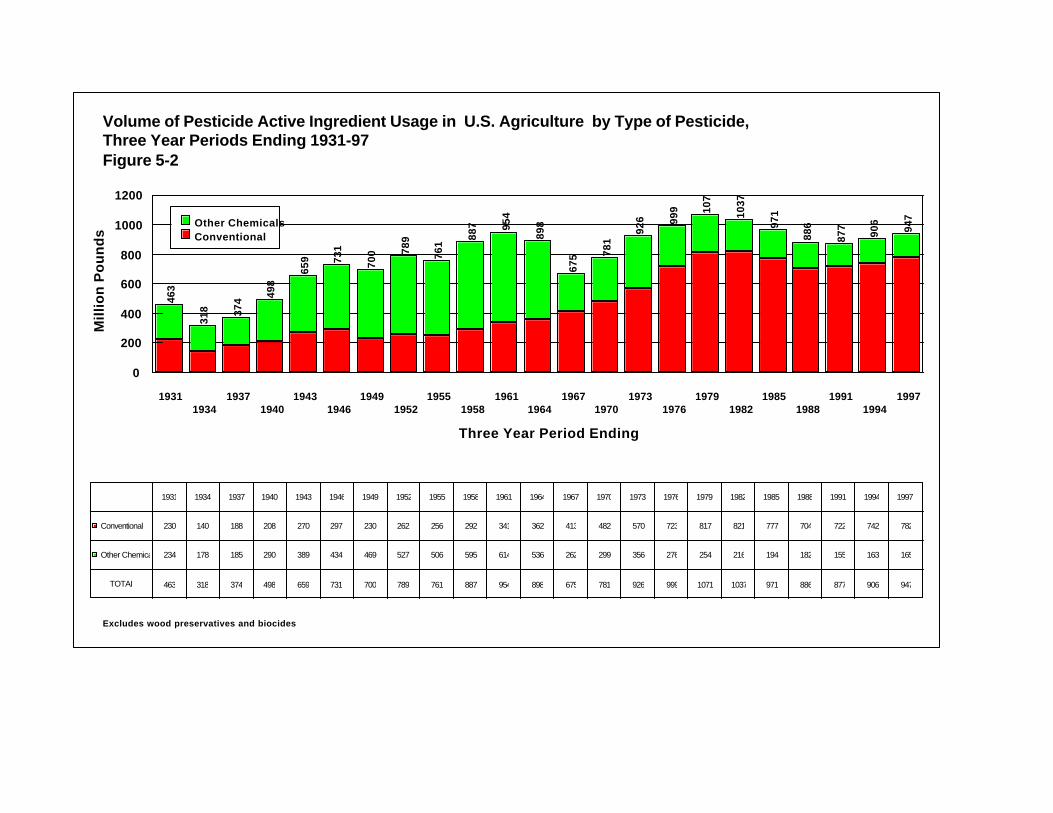
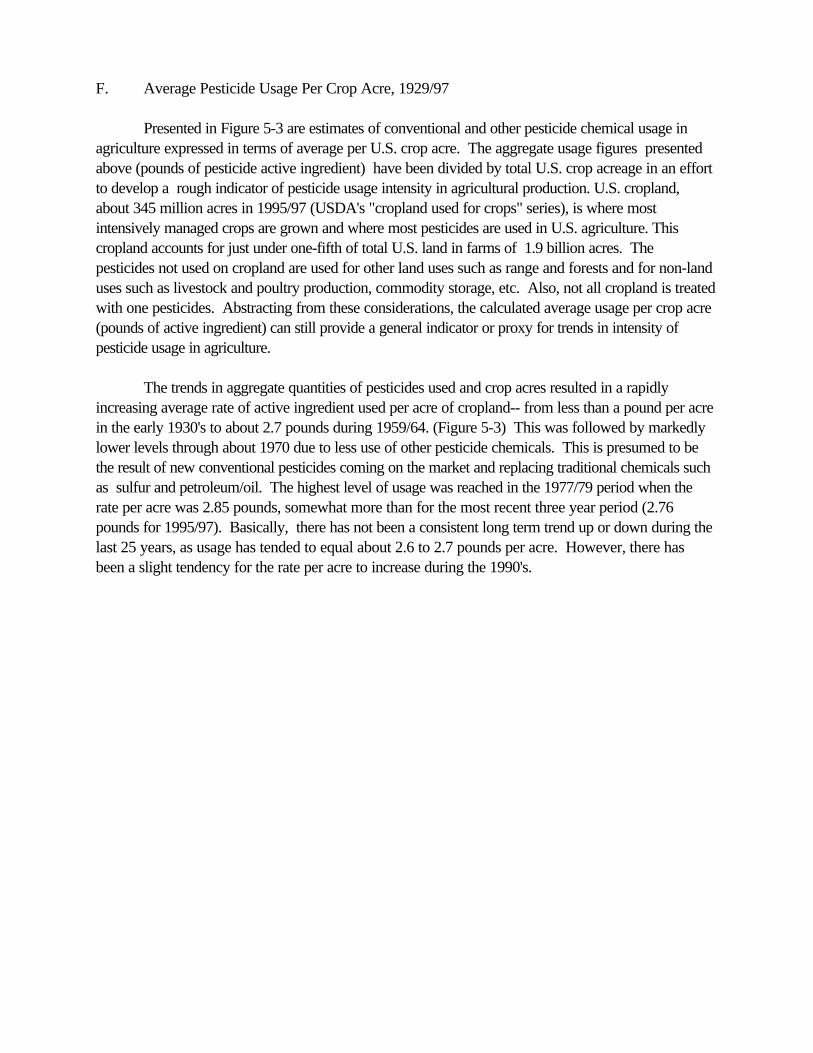
" Conventional and other pesticide chemical usage in agriculture expressed in terms ofaverage per U.S. crop acre can be used as a rough indicator of pesticide usageintensity in agricultural production. U.S. cropland, about 345 million acres in 1995/97(cropland used for crops series), is where most intensively managed crops are grownand where most pesticides are used in U.S. agriculture.
" The trends in aggregate quantities of pesticides used and crop acres resulted in a rapidlyincreasing average rate of active ingredient used per acre of cropland-- from less than apound per acre in the early 1930's to about 2.5 pounds during 1959/64. This wasfollowed by markedly lower levels through about 1970 due to less use of otherpesticide chemicals. This is presumed to be the result of new conventional pesticidescoming on the market and replacing traditional chemicals such as sulfur andpetroleum/oil.
" The highest level of usage was reached in the 1977/79 period when average usage peracre was 2.85 pounds, somewhat more than for the most recent three year period(2.76 pounds for 1995/97).
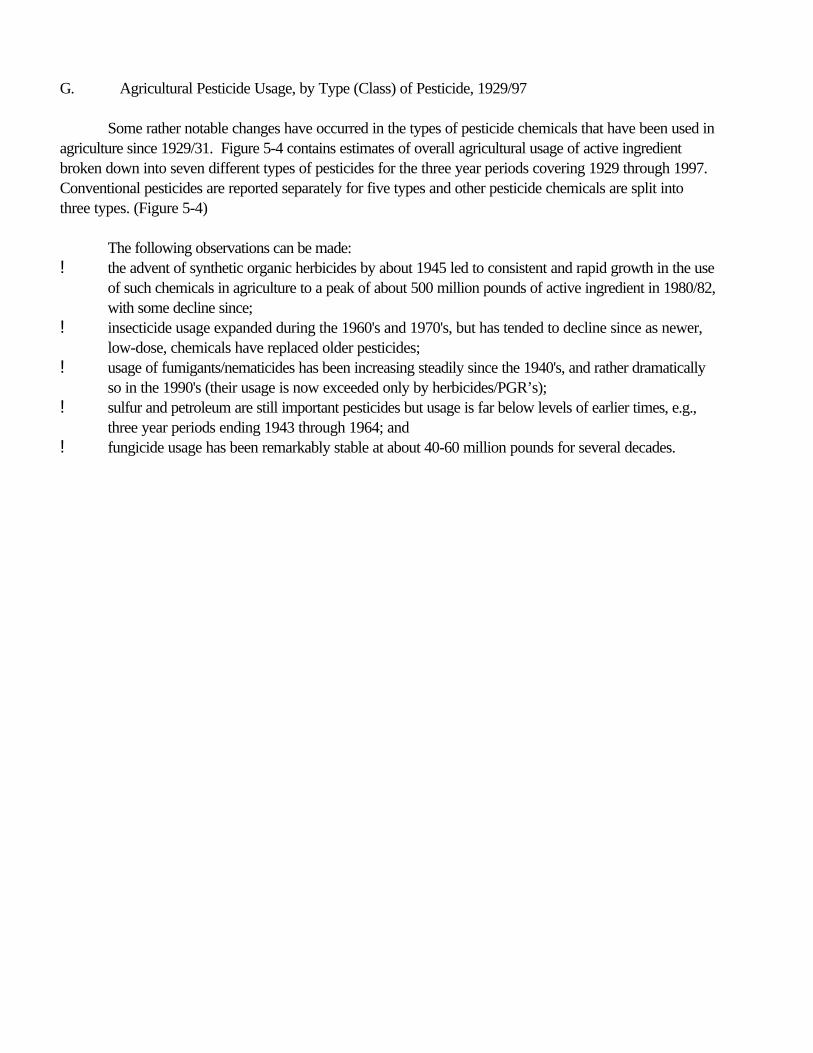
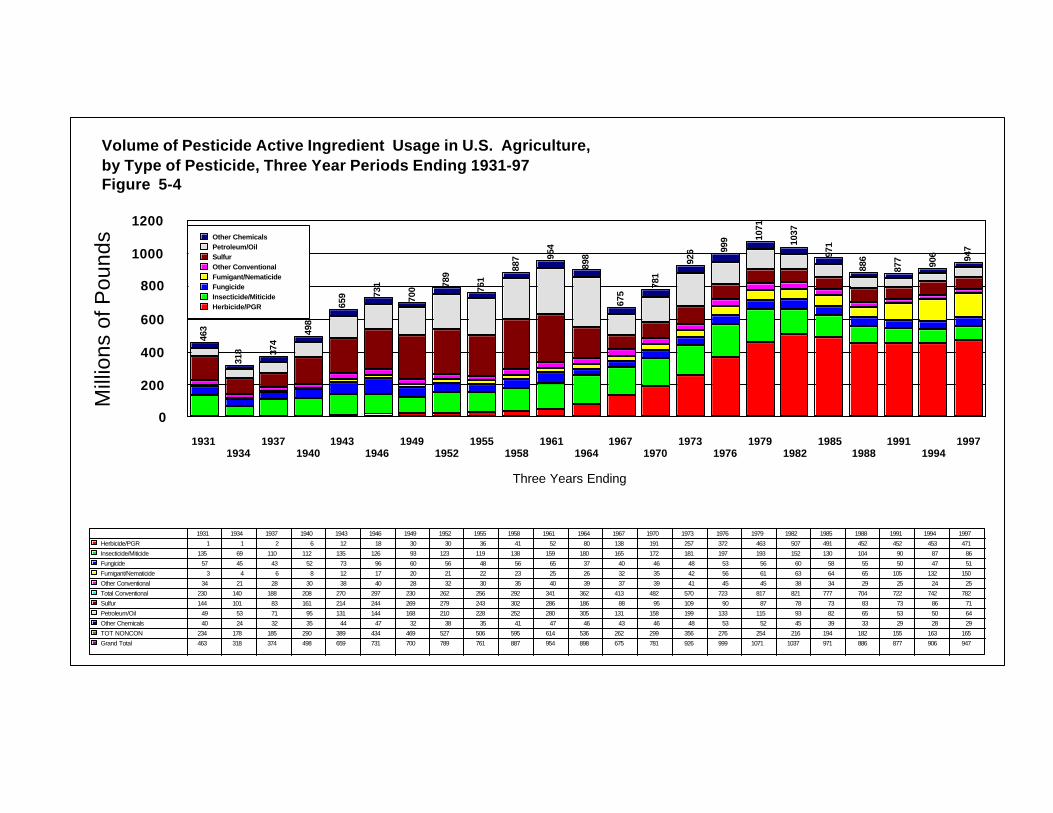
! Trends in Agricultural Pesticide Usage, by Type (Class) of Pesticide (See pages 5/13-14)
" The availability of synthetic organic herbicides toward the end of WWII led toconsistent and rapid growth in the use of such chemicals in agriculture to a peak ofabout 500 million pounds of active ingredient in 1980/82, with some decline since.
" Insecticide usage expanded during the 1960's and 1970's, but has tended to declinesince as newer, low-dose, chemicals have replaced older pesticides.
" Usage of fumigants/nematicides has been increasing steadily since the 1940's, andrather dramatically so in the 1990's (their usage is now exceeded only byherbicides/PGR’s).
" Sulfur and petroleum are still important pesticides but usage is far below levels of earliertimes, e.g., three year periods ending 1943 through 1964.
" Fungicide usage has been remarkably stable at about 40-60 million pounds for severaldecades.
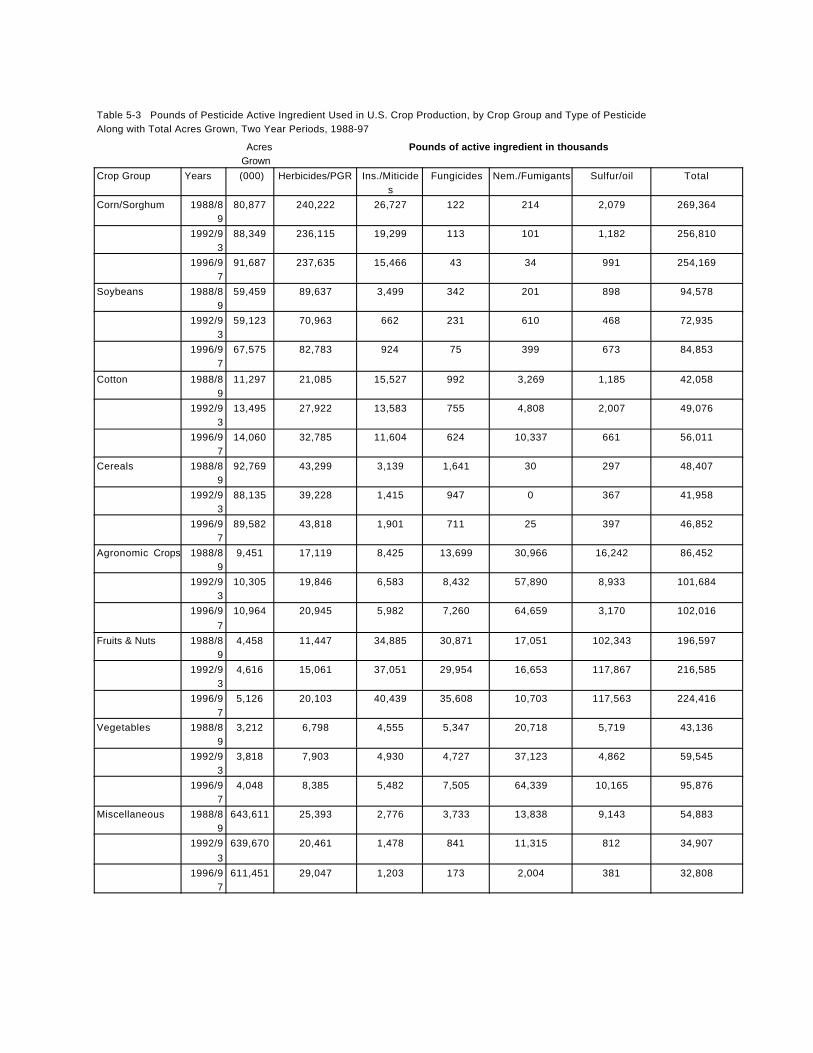
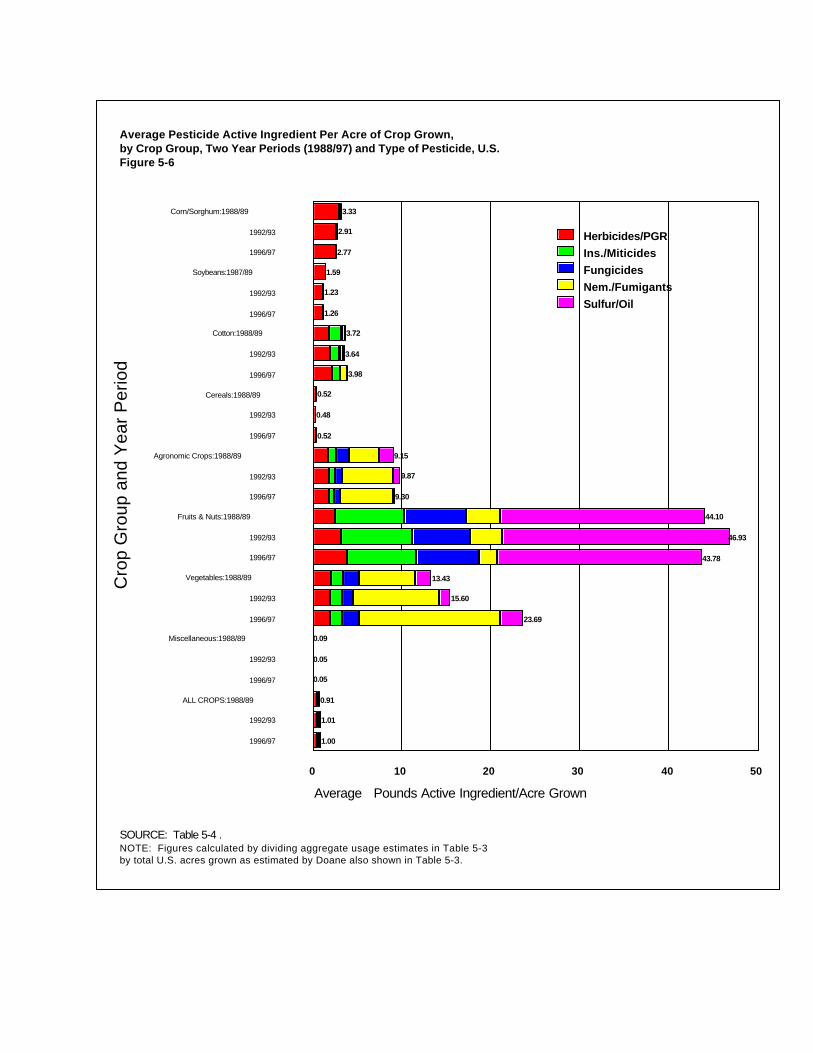
! Trends in Aggregate Active Ingredient Usage, by Crop Grouping, 1988-97 (See pages 5/15-22.)
Part 1 Pg. 21
" Trends over the 10 year period are evaluated based on three two-year periods asfollows: 1988/89, 1992/93 and 1996/97.
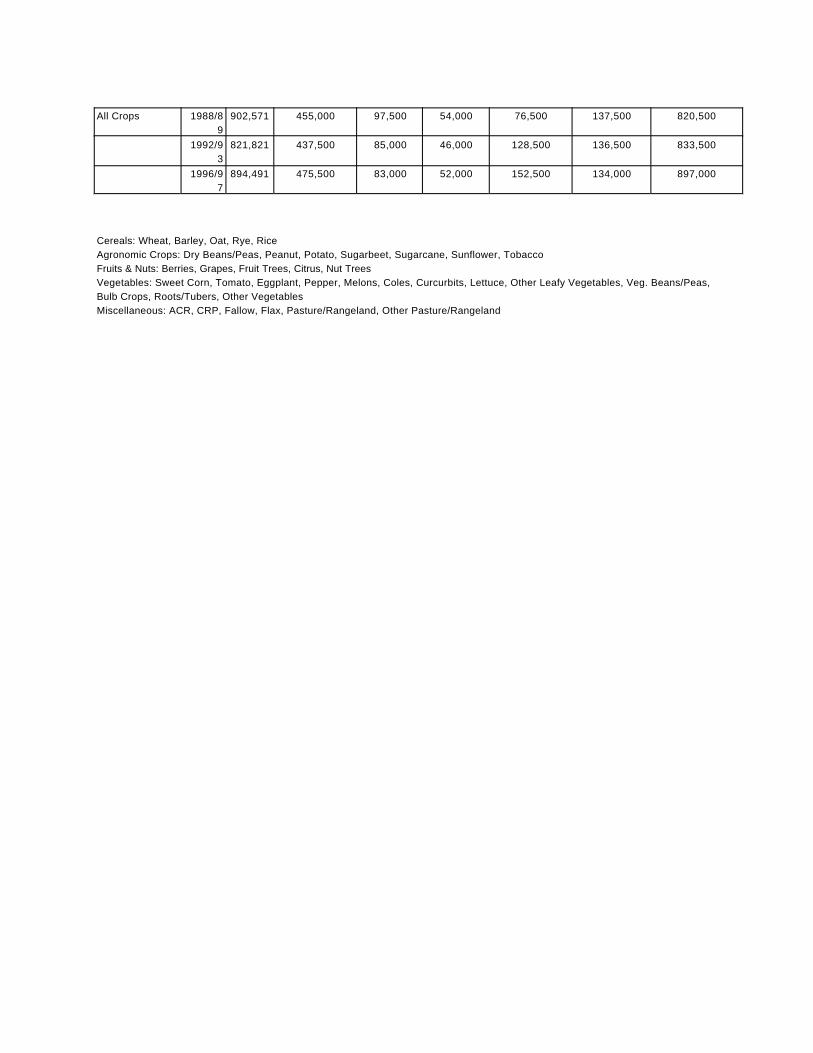
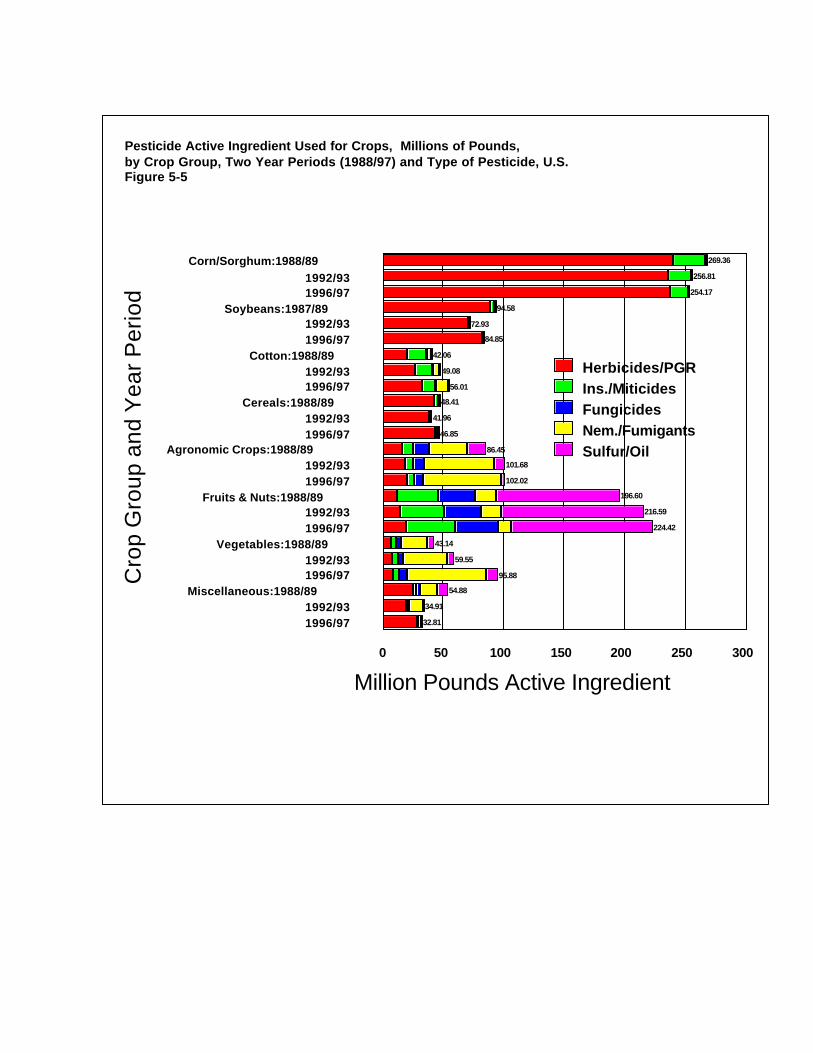
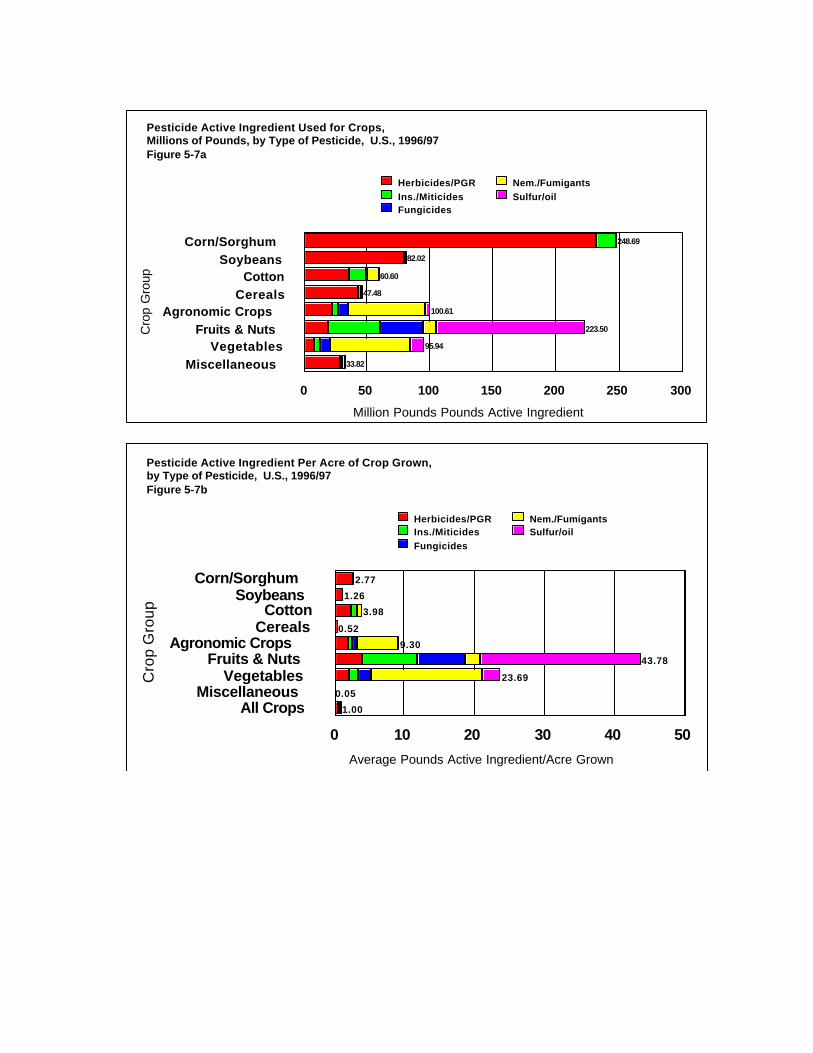
" Corn/sorghum and fruits/nuts are by far the leading crop groups in terms of overallusage of active ingredient; they are followed at a distance by agronomic crops (whichinclude potatoes), vegetables and soybeans.
" Herbicides are the leading pesticide type applied to major field crops such ascorn/sorghum, soybeans and cereals.
" Sulfur/petroleum is used most widely on fruits/nuts, accounting for about half of usageon those crops.
" Fumigant/nematicide usage increased noticeably over the 10 years for agronomiccrops, vegetables and cotton.
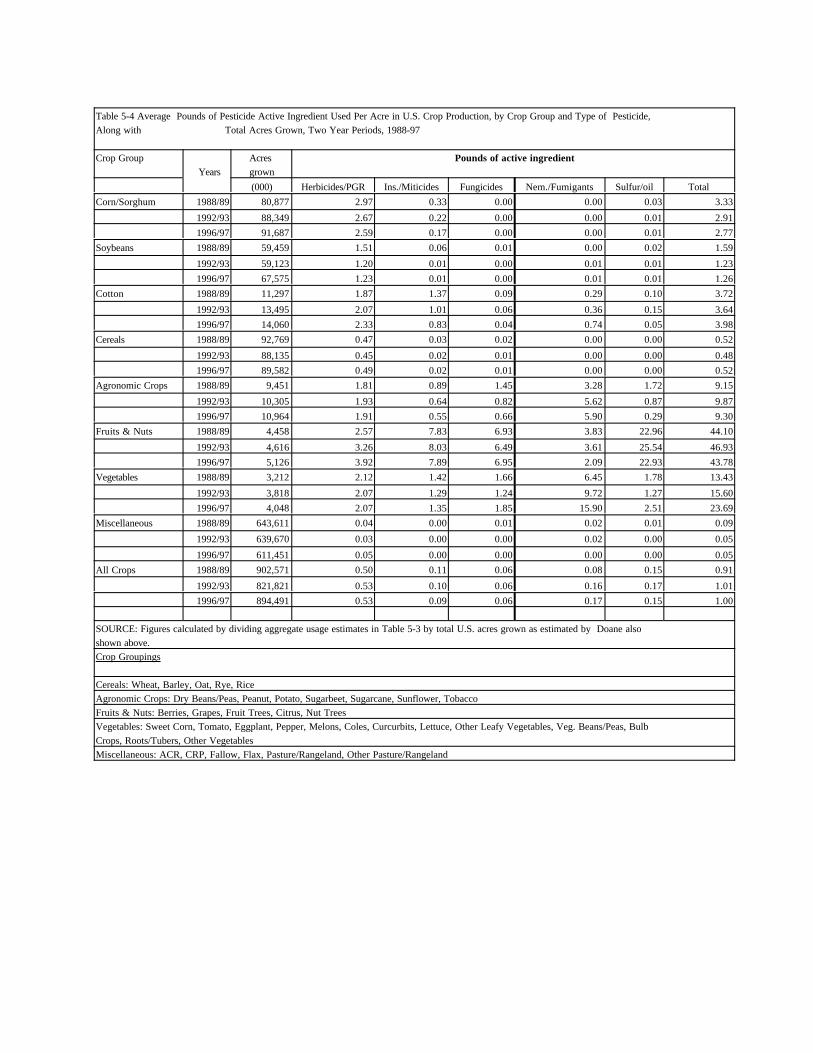
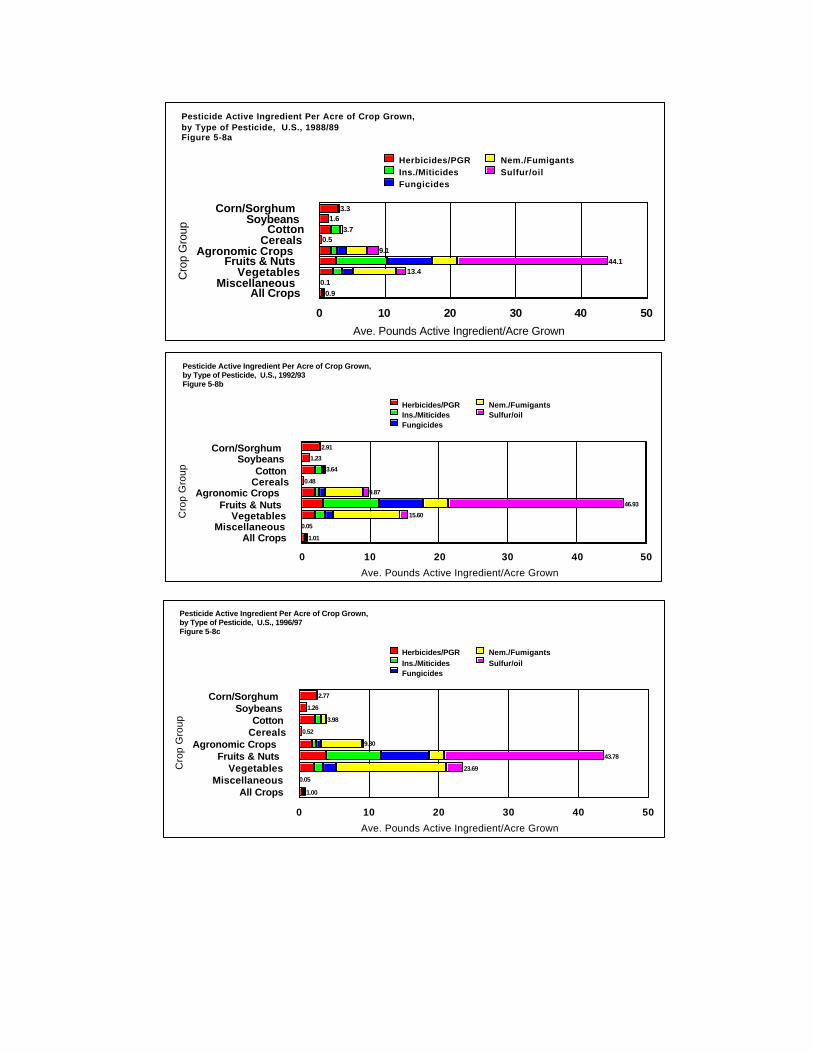
"! Trends in Average Active Ingredient Usage Per Acre of Crop Grown, by Crop Grouping,
1988/97
" Fruits/nuts currently lead all other crop groups by far with about 45 pounds of activeingredient used per acre grown, followed by vegetables at about half the rate currently(more than 23 pounds).
" The most noticeable increase in usage per acre was vegetables, where usage peraverage acre increased from 13.4 to 23.7 pounds per acre between 1988/89 and1996/97.
" Nematicide/fumigant usage increased sharply for vegetables and to a lesser degree foragronomic crops.
" Corn/sorghum is the only crop group for which usage per acre declined consistently peracre for the periods observed.
! Trends in Expenditures for Agricultural Pesticides, Circa 1930 to Date (See pages 5/23-27.)
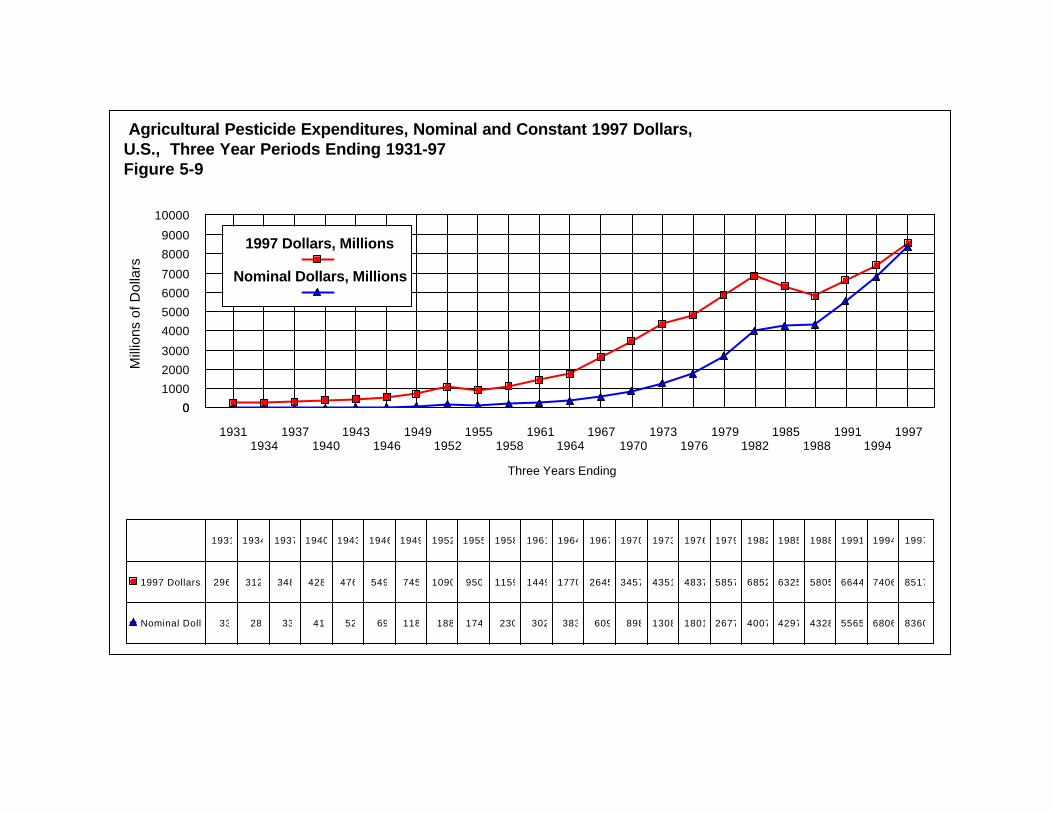
" Farm expenditures for pesticides have increased from $33 million in 1929/31 to about$8.4 billion in 1995/97 in nominal dollars. When placed in constant 1997 dollars, theincrease is from $296 million per year in 1929/31 to $8.5 billion in 1995/97.
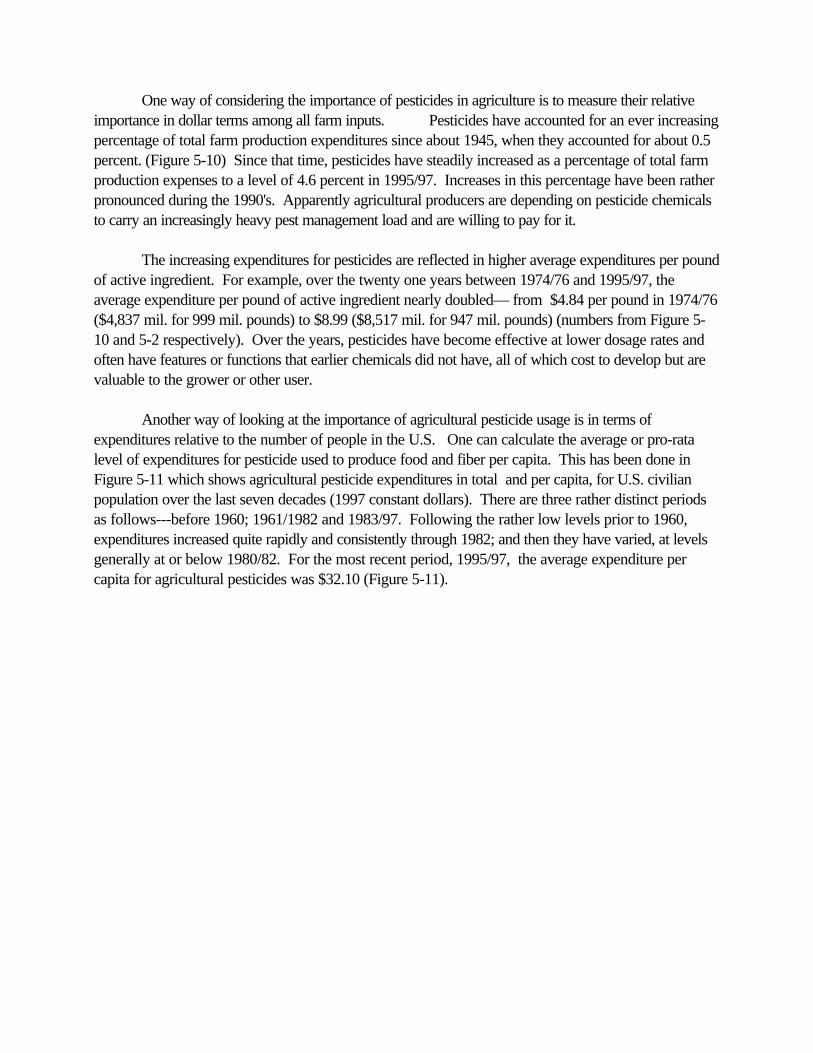
" Pesticides have accounted for an increasing percentage of total farm productionexpenditures since WWII, when they accounted for about 0.5 percent. Since thattime, pesticides have steadily increased as a percentage of total farm productionexpenses to a level of 4.6 percent in 1995/97.
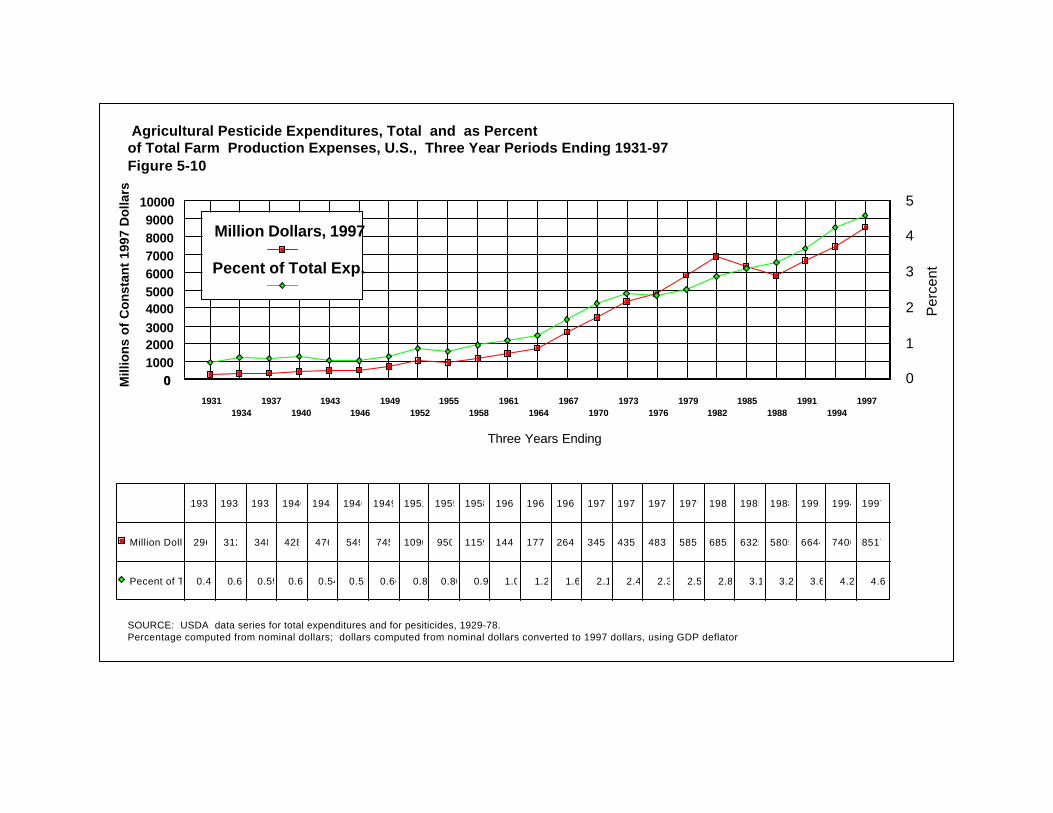
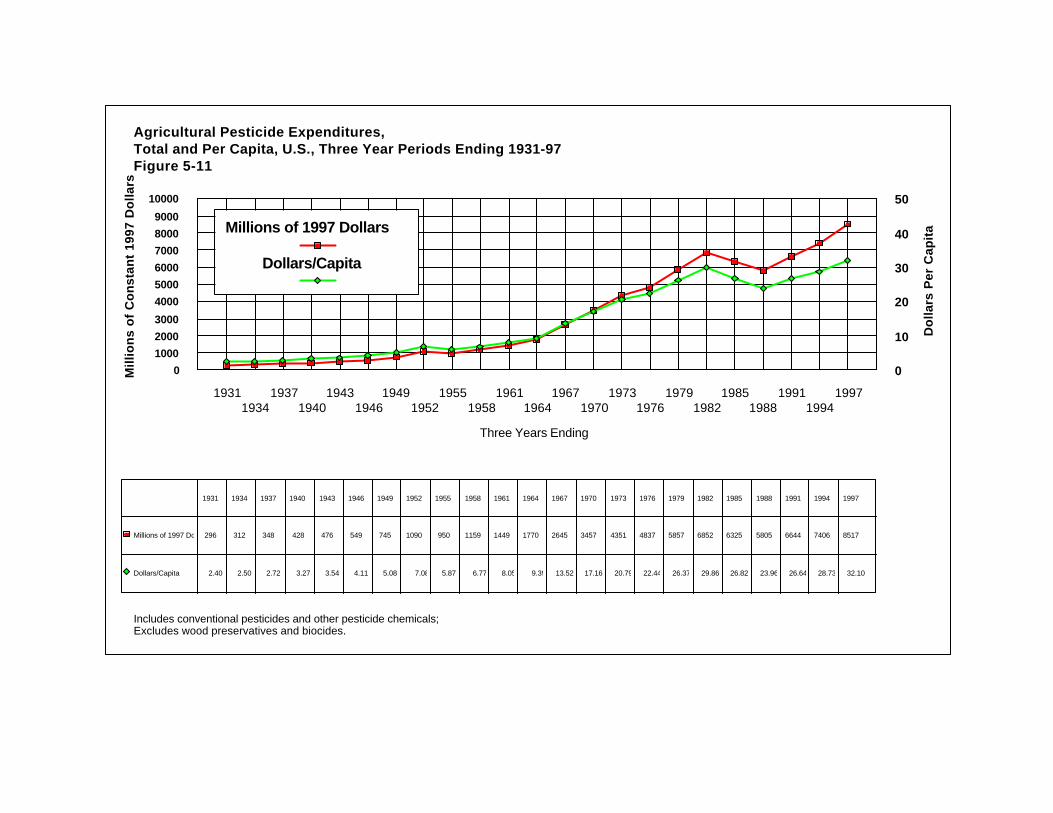
" Another way of looking at the importance of agricultural pesticide usage is in terms ofexpenditures relative to the number of people in the U.S. For 1995/97, the averageexpenditure per capita for agricultural pesticides was $32.10.
Part Six–Home and Garden Usage by Homeowners
! Profile of Home and Garden User Sector (See pages 6/1-4)
Part 1 Pg. 22
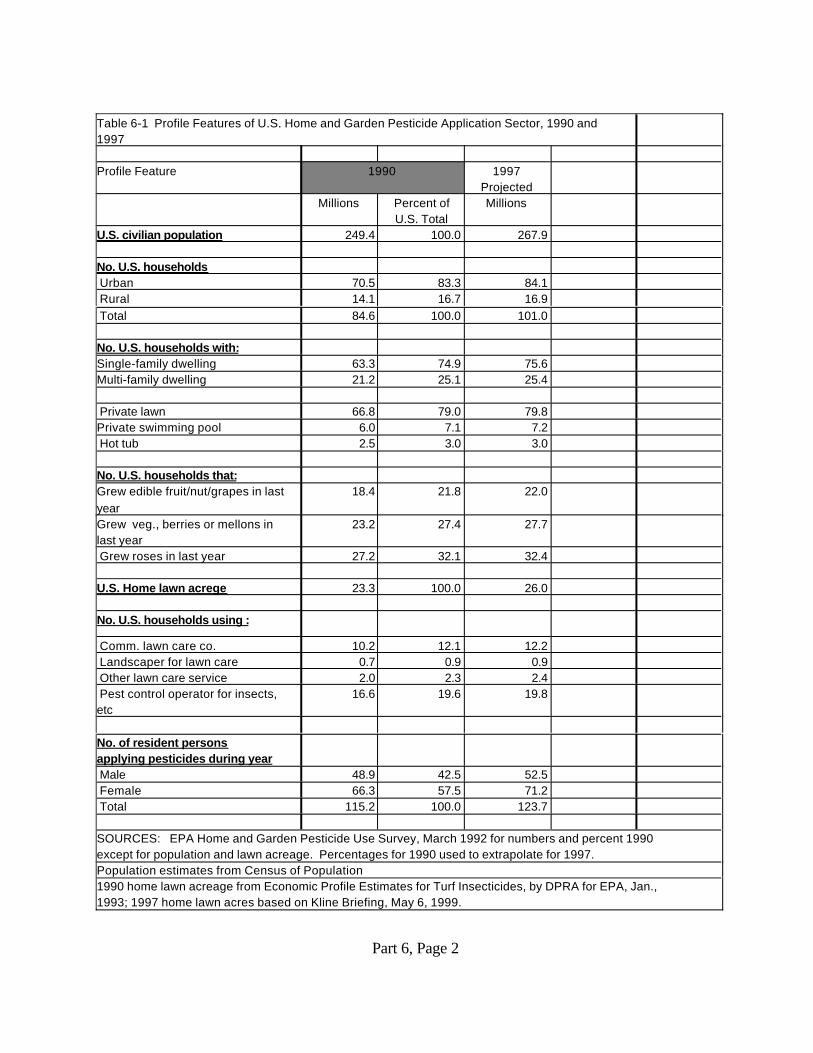
" Home and garden pesticide applications (by homeowners and family members) accountfor a significant portion of total usage of conventional pesticides and other pesticidechemicals (136 million pounds of active ingredient in 1997, or 11 percent of the totalfor all user sectors that year). These applications were made by an estimated 123.7million persons, of which 52.5 million were male and 71.1 million were female.
" Nearly one half of the U.S. civilian population applies pesticides, 123.7 million out of267 million in 1997, or about 46 percent.
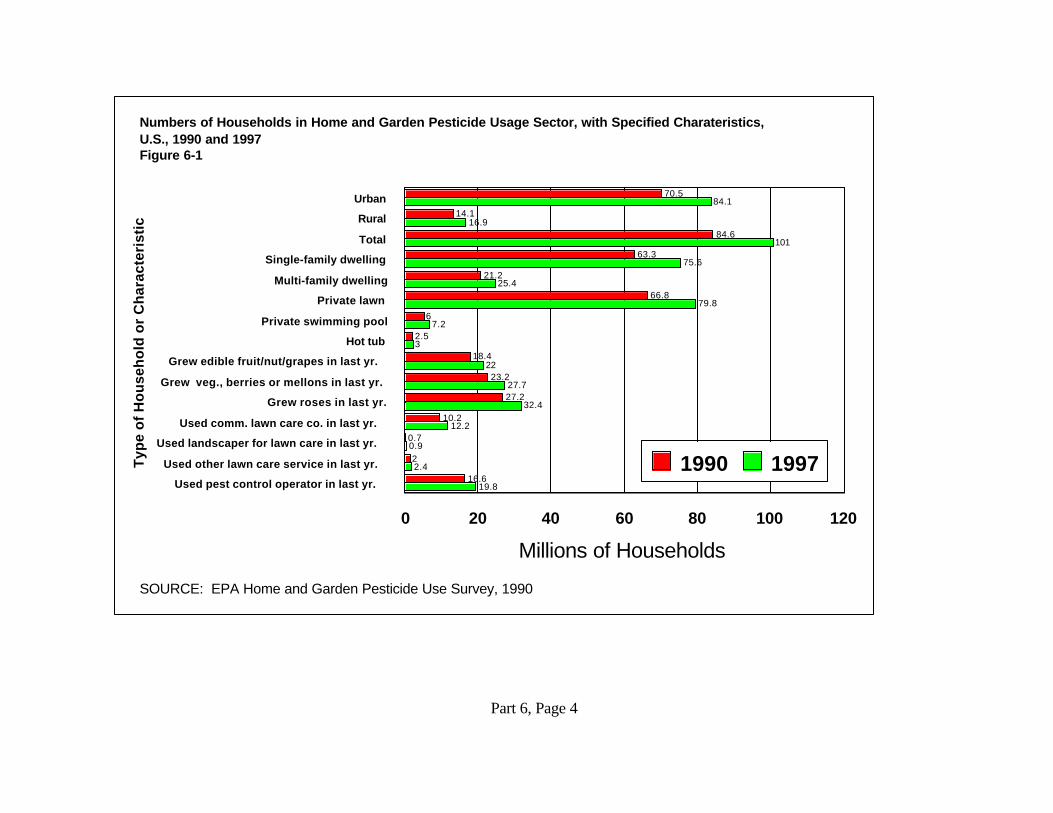
" There were an estimated 101 million households in the U.S. in 1997, of which 84.1million (about 83 percent) were urban and 16.9 million rural. More than three-fourthshave private lawns (80 million in 1997), but few have private swimming pools (7million) and hot tubs (3 million). Significant proportions of households growfruit/nut/grapes (22 million or 22 percent in 1997), grow vegetables/berries/melons (28million or 27 percent) and grow roses (32 million or 32 percent). In 1997, anestimated 20 million households used pest control operators, which equaled about one-fifth to total U.S. households.
" Commercial lawn care service is used by about one-eighth of households and some uselandscapers or other lawn care services.
! Numbers of Households Using Home and Garden Pesticides, 1990 (See page 6/5-8.)
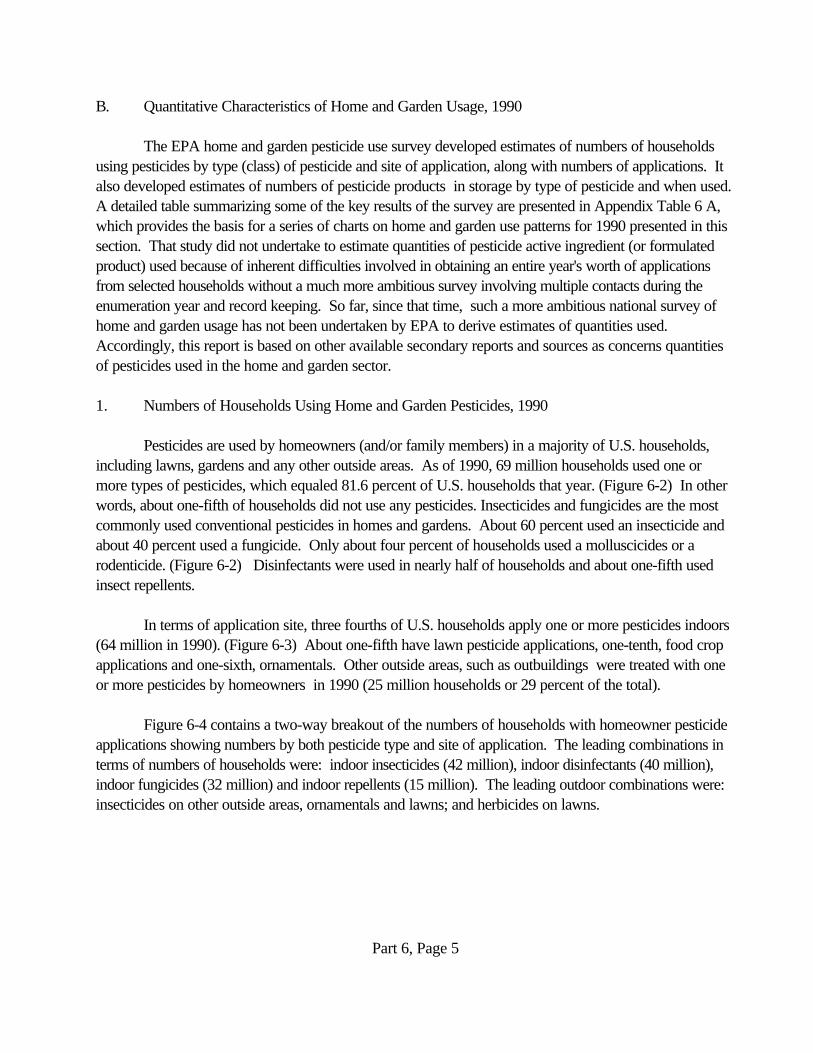
" Pesticides are used by homeowners (and/or family members) in a majority of U.S.households, including lawns, gardens and any other outside areas. As of 1990, 69million households used one or more types of pesticides, which equaled 81.6 percent ofU.S. households that year. Insecticides and fungicides are the most commonly usedconventional pesticides in homes and gardens. About 60 percent used an insecticideand about 40 percent used a fungicide. Only about four percent of households used amulluscicide or a rodenticide. Disinfectants were used in nearly half of households andabout one-fifth used insect repellents.
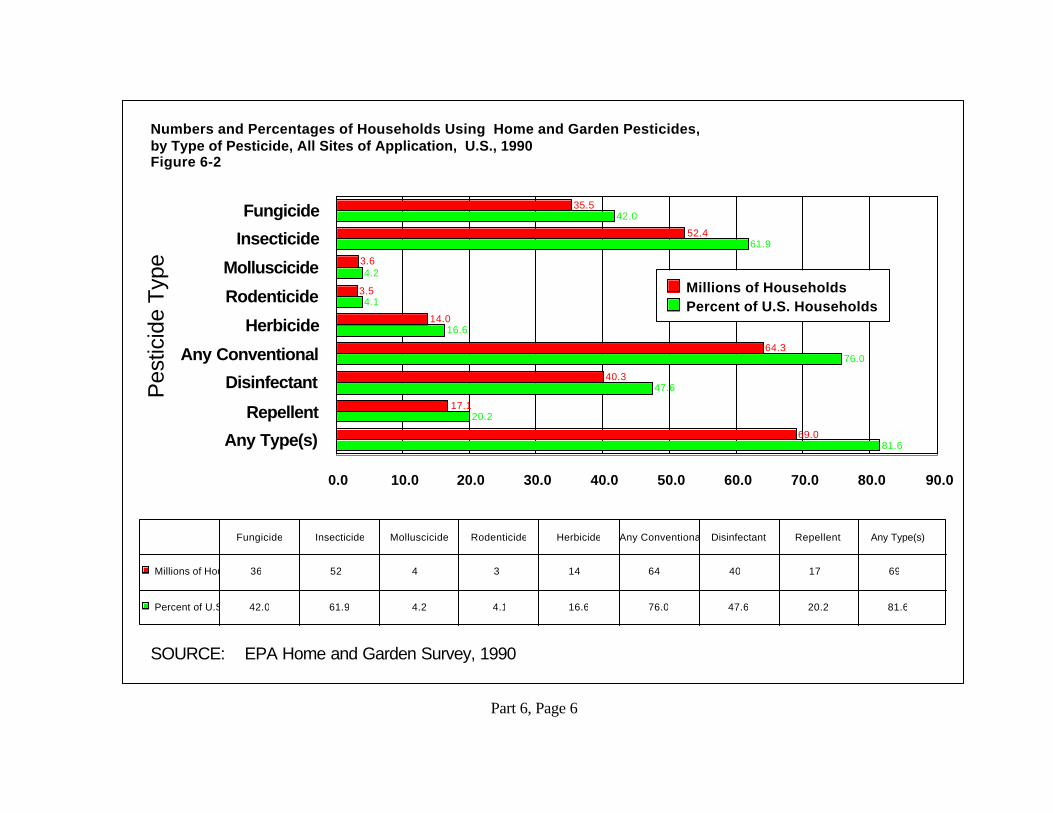
" In terms of application site, three fourths of U.S. households apply one or morepesticides indoors (64 million in 1990). About one-fifth have lawn pesticideapplications, one-tenth, food crop applications and one-sixth, ornamentals.
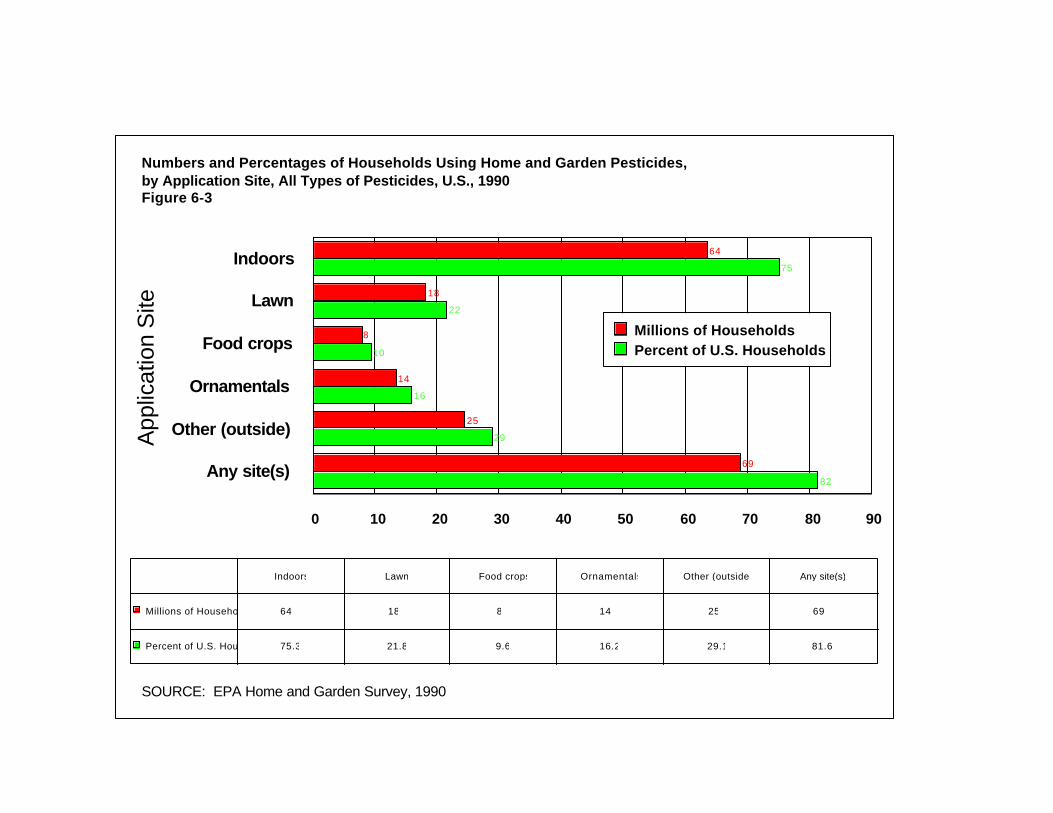
" A two-way breakout of the numbers of households with homeowner pesticideapplications was prepared showing numbers by both pesticide type and site ofapplication. The leading combinations in terms of numbers of households for 1990were: indoor insecticides (42 million), indoor disinfectants (40 million), indoorfungicides (32 million) and indoor repellents (15 million). The leading outdoorcombinations were: insecticides on other outside areas, ornamentals and lawns; andherbicides on lawns.
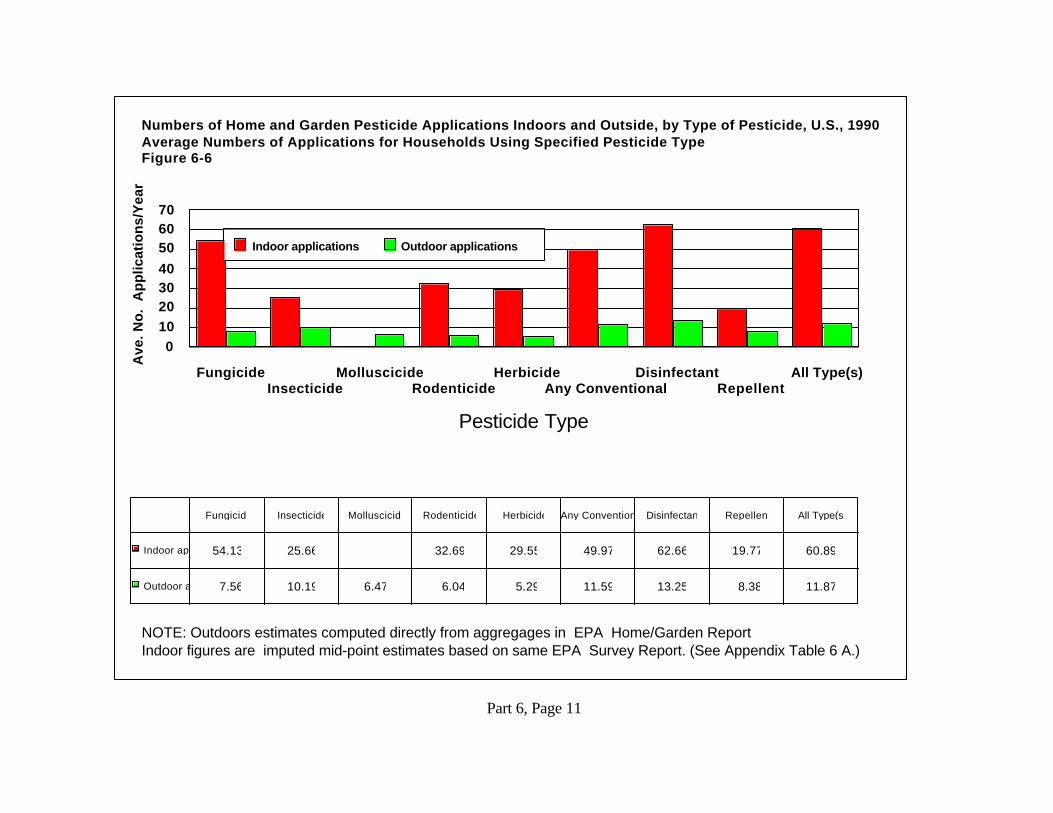
! Numbers of Home and Garden Pesticide Applications Per Household, 1990 (See pages 6/9-11.)
Part 1 Pg. 23
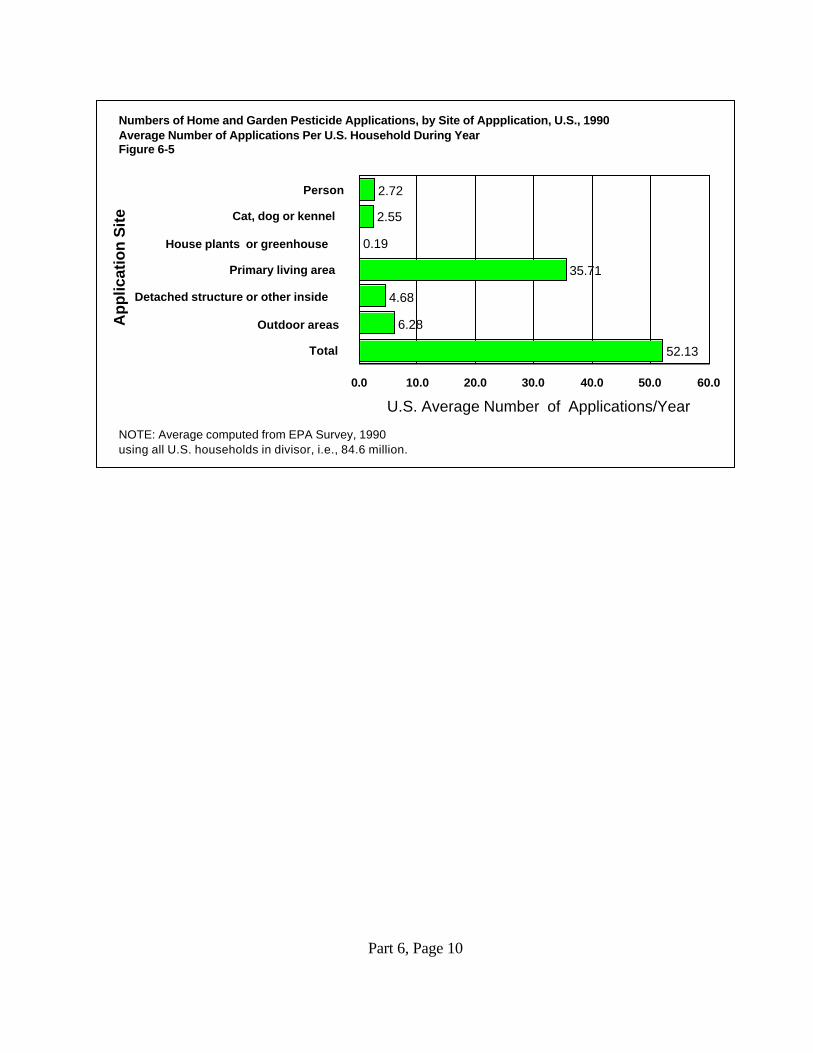
" The EPA Home and Garden Survey provided estimates of the number of pesticideapplications as well as numbers of households for 1990. Averages computed on basisof all U.S. households (84.6 million in 1990) were about 52 applications per householdduring 1990 (about one per week) for all types of applications.
" The primary living area accounted for about two-thirds of the applications. The othertypes of applications were much less frequent, with averages of less than 5 per year forthe various types other than "outdoor areas" for which the average was 6.28applications.
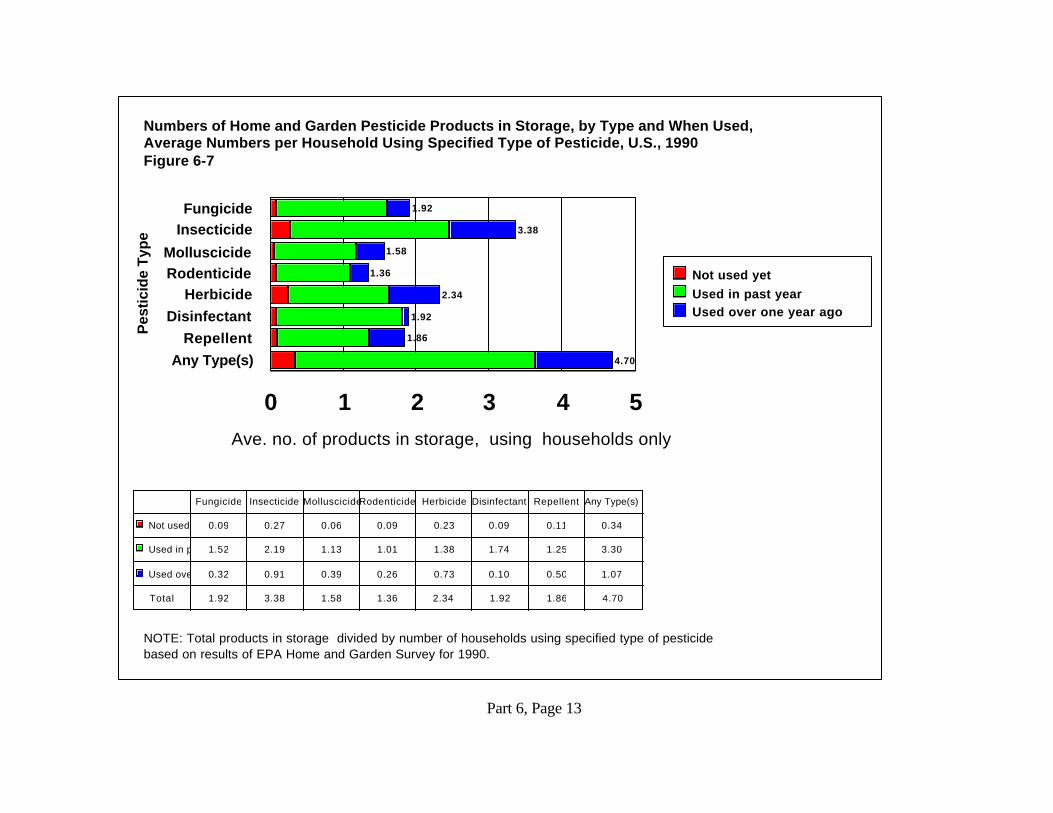
! Numbers of Home and Garden Pesticide Products in Storage, 1990 (See pages 6/12-13.)
" The EPA Home and Garden Survey found that rather large numbers of pesticideproducts were in storage at households. Estimates were made of the aggregatenumbers of products in storage by type (class) of pesticide and use status (not used yet,used past year or used over one year ago).
" On the average, using households had 4.7 pesticides in storage, of which 0.34 were notused yet and 1.07 were used more than one year ago. Insecticides were mostcommonly in storage (3.38 products), followed by herbicides (2.34), while the othercategories had values in the range of one and two products in storage on the average.
! Home and Garden Pesticide Usage, by Type, 1929/97 (See pages 6/14-19.)
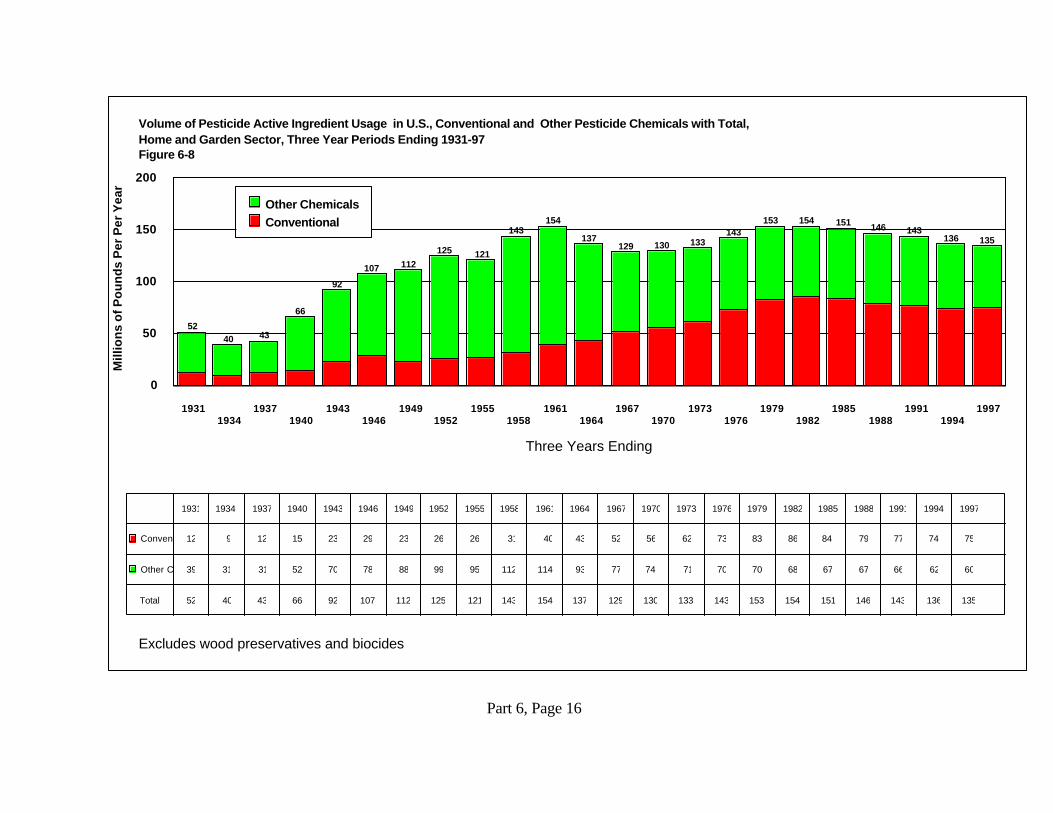
" Conventional and Other Pesticide Chemicals, Aggregate Usage- the usage of conventional pesticides increased quite steadily from about 10
million pounds per year in the mid-1930's to about 85 million pounds per yeararound 1980; since then it has declined about 10 million per year;
- other pesticide chemical usage increased from about 30 million pounds per yearin the mid-1930's to a peak of about 115 million per year around 1960; sincethen such usage has been generally in the range of 60 to 80 million pounds peryear;
- the total of conventional and other pesticide chemical usages was at a low 40million pounds per year in 1932/34 and increased to 154 million pounds peryear in 1959/61; usage was somewhat lower until around 1980 when usagereturned to 150 million plus range; during the last 10 years overall home andgarden usage has declined slightly, to 135 million pounds per year in 1995/97.
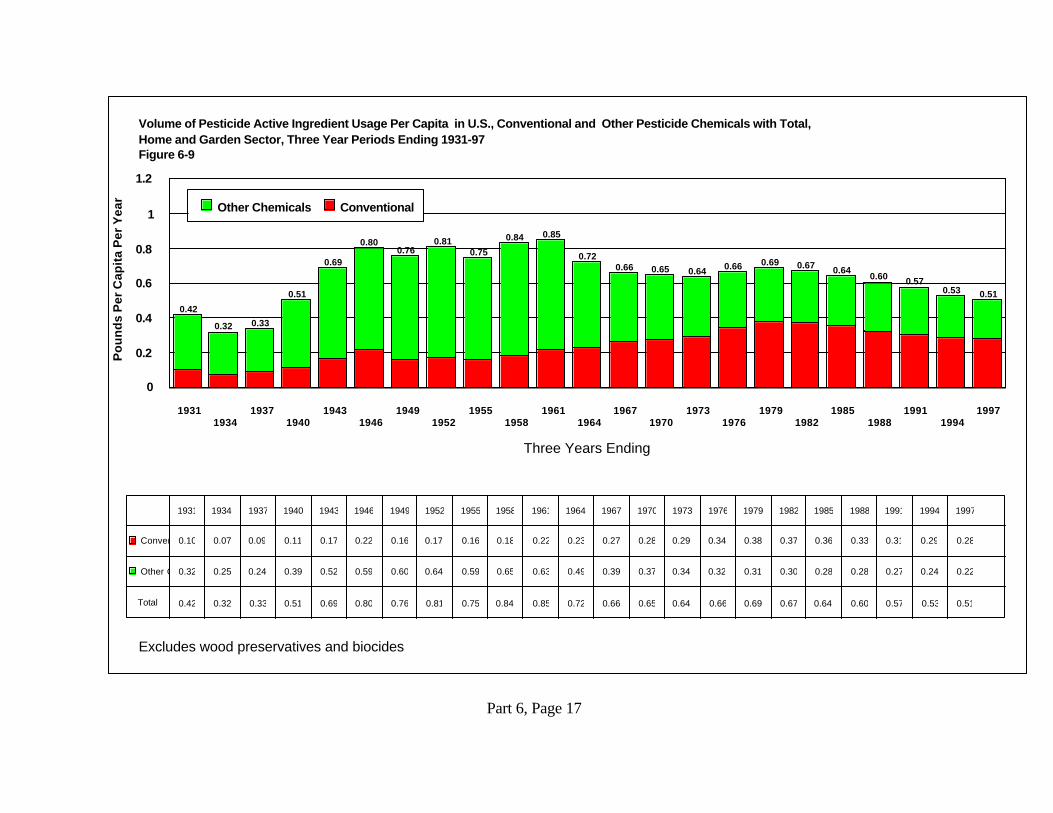
" Conventional and Other Pesticide Chemicals, Per Capita Usage- Aggregate usage figures divided by U.S. civilian population place usage by
homeowners on a per capita basis.- Since 1929/31, the pattern which emerges is generally increasing levels until
about 1956/61 when usage was 0.85 pounds per capita, followed by adeclining trend to about one half pound per capita most recently..
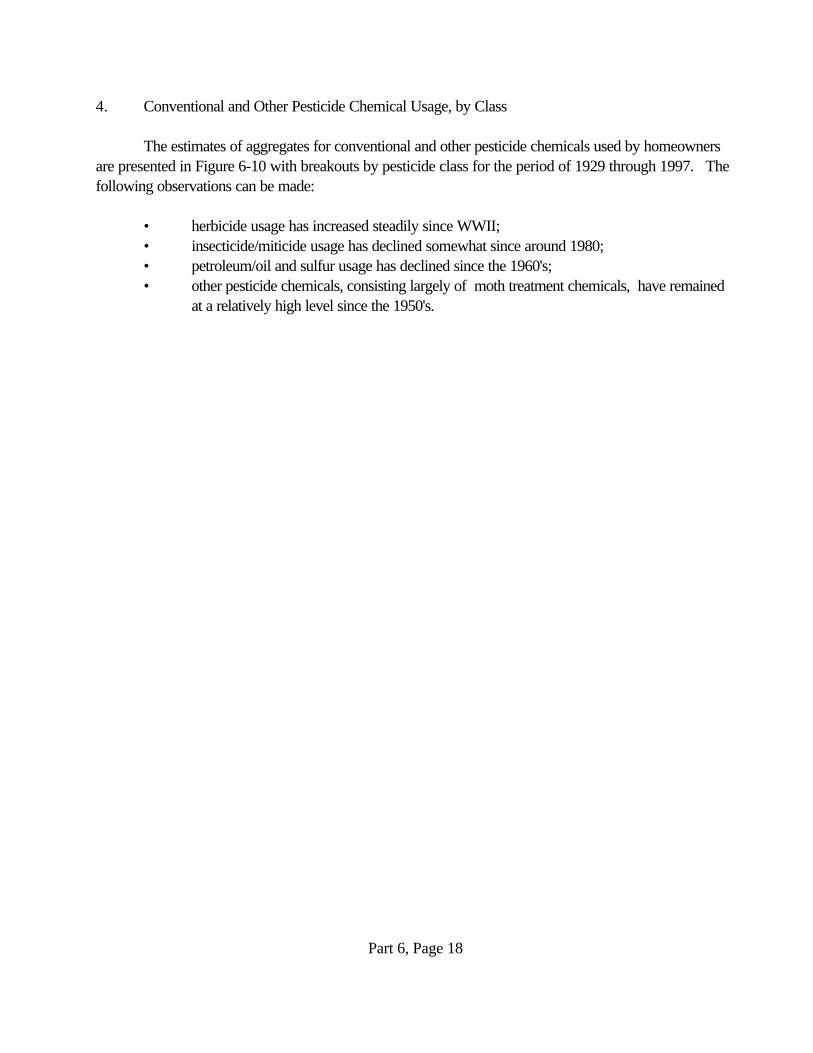
" Conventional and Other Pesticide Chemical Usage, by Class
Part 1 Pg. 24
- Estimates were made of aggregates for conventional and other pesticidechemicals used by homeowners with breakouts by pesticide class for the periodof 1929 through 1997.
- The following observations can be made:# herbicide usage has increased steadily since WWII;# insecticide/miticides usage has declined somewhat since around 1980;# petroleum/oil and sulfur usage has declined since the 1960's;# other pesticide chemicals, consisting largely of moth treatment
chemicals, have remained at a relatively high level since the 1950's.
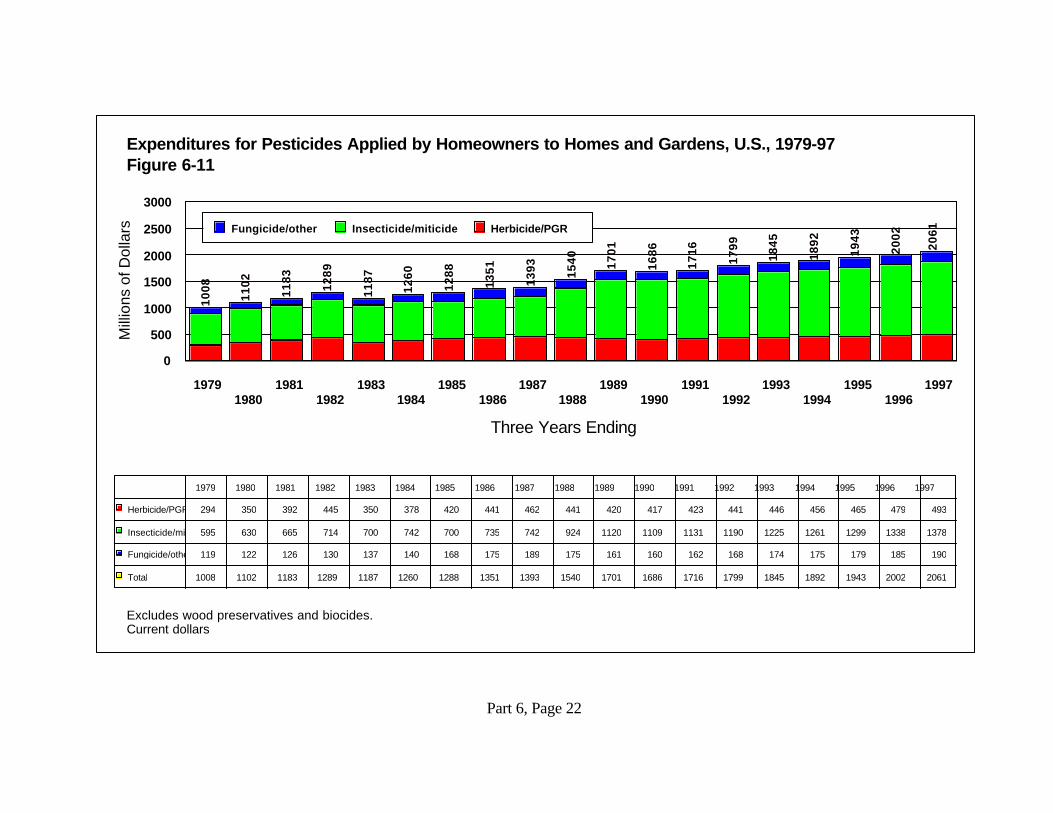
! Home and Garden Pesticide User Expenditures, 1979/1997 (See pages 6/20-22.)
" Aggregate user expenditures for the home and garden sector have about doubled fromabout $1.01 billion in 1979 to $2.01 billion in 1997. Most of the increase has occurreddue to increased expenditures for herbicides and plant growth regulators, aside frominflationary trends which are dealt with below.
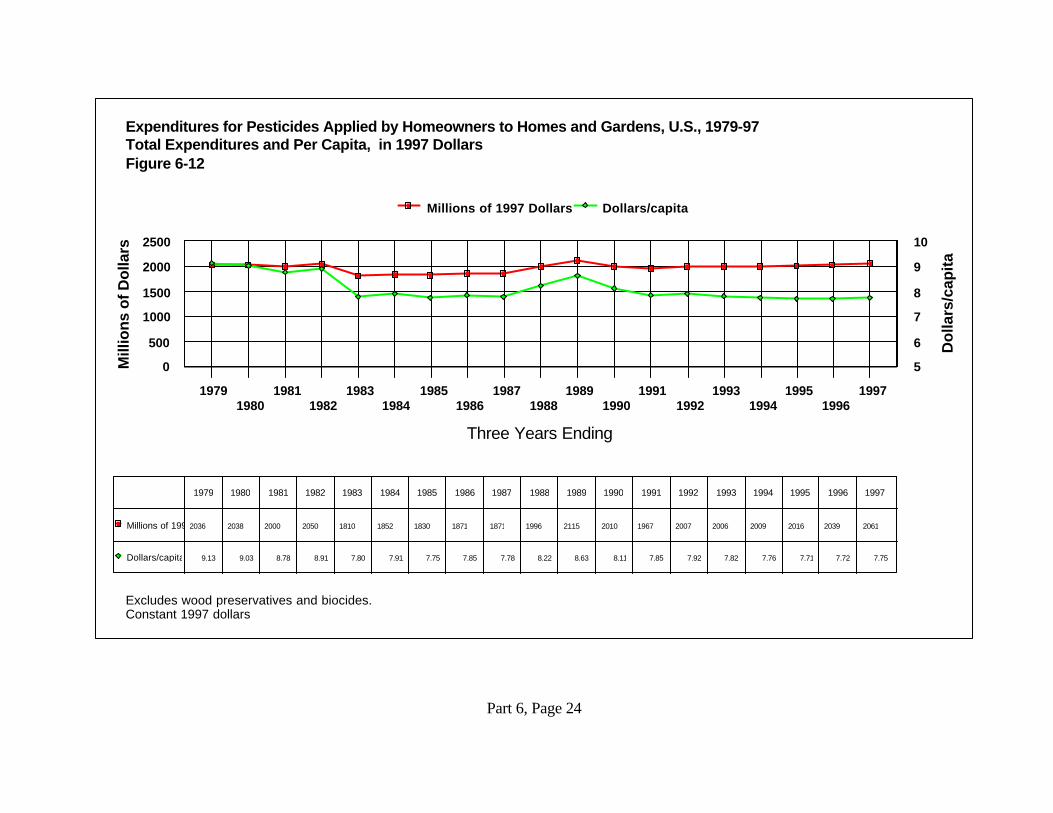
" When expenditures for 1979/97 are placed in constant 1997 dollars to take out theimpact of inflation, the result is that expenditures have remained about the same at about$2.0 billion per year since 1979.
" When placed on a per capita basis, expenditures have declined somewhat over theperiod, i.e., from about $9.10 to $7.70. Home and garden pesticides are a minor partof the average household budget, and have not been increasing in real terms during thelast two decades.
Part Seven–Industrial/Commercial/Governmental Usage Trends
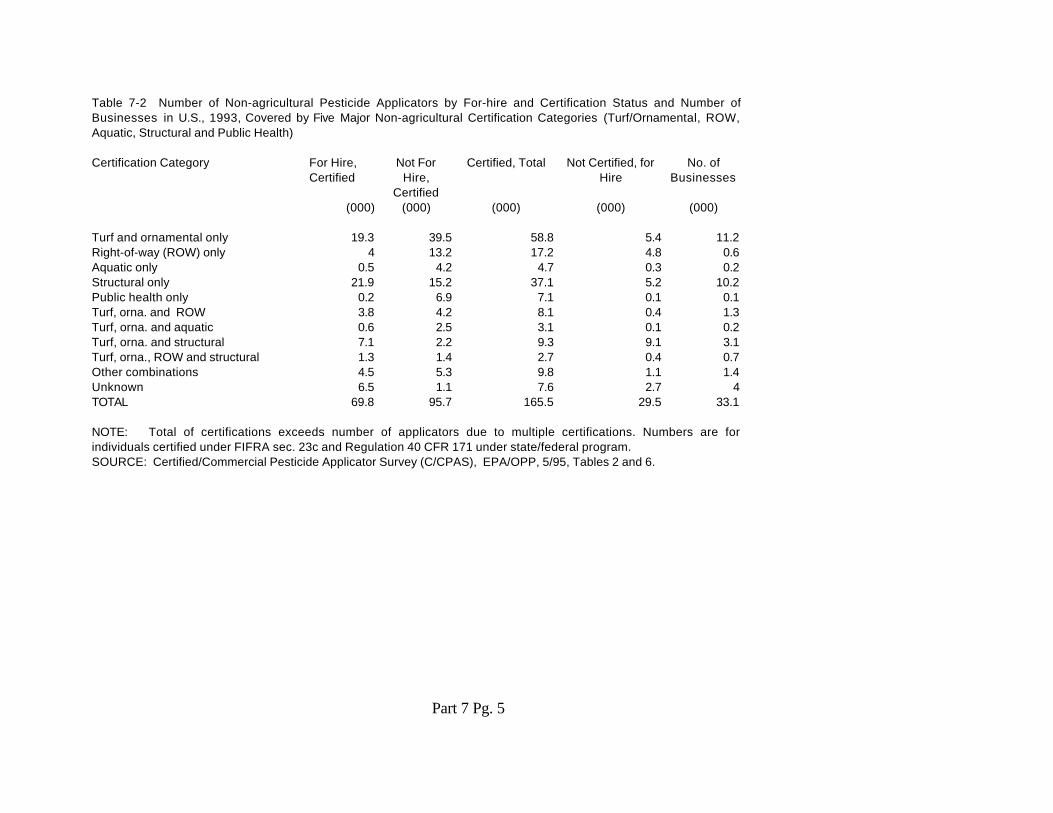
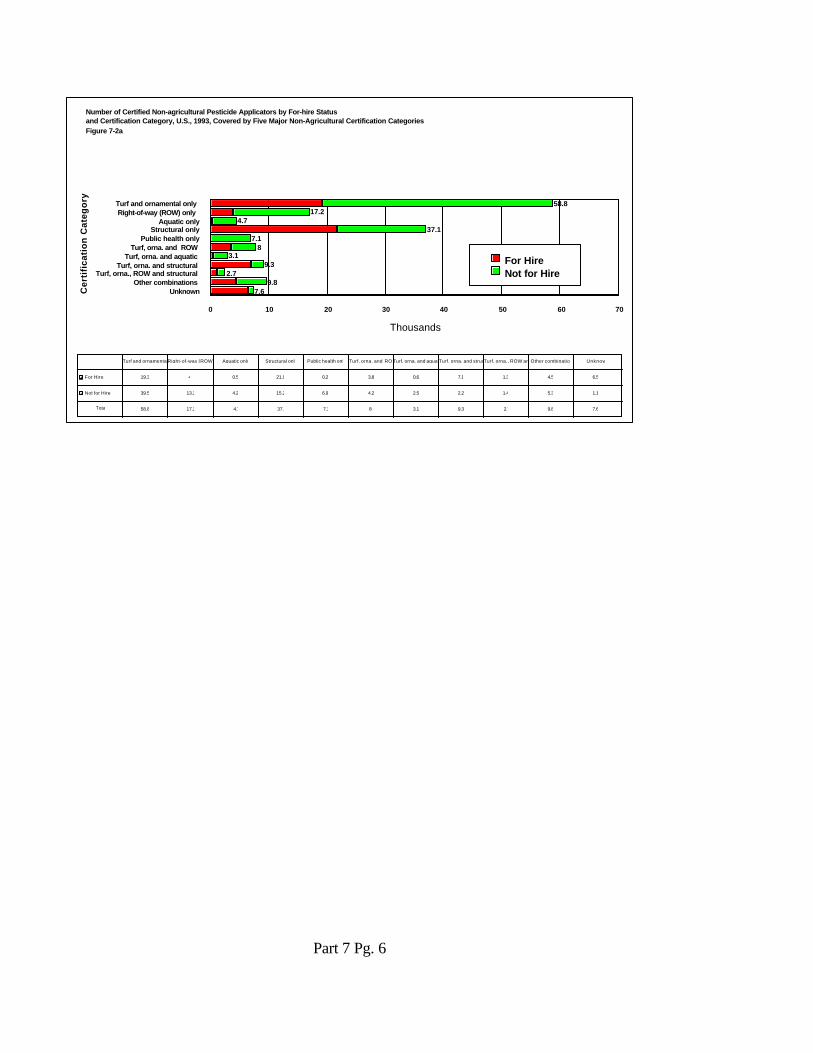
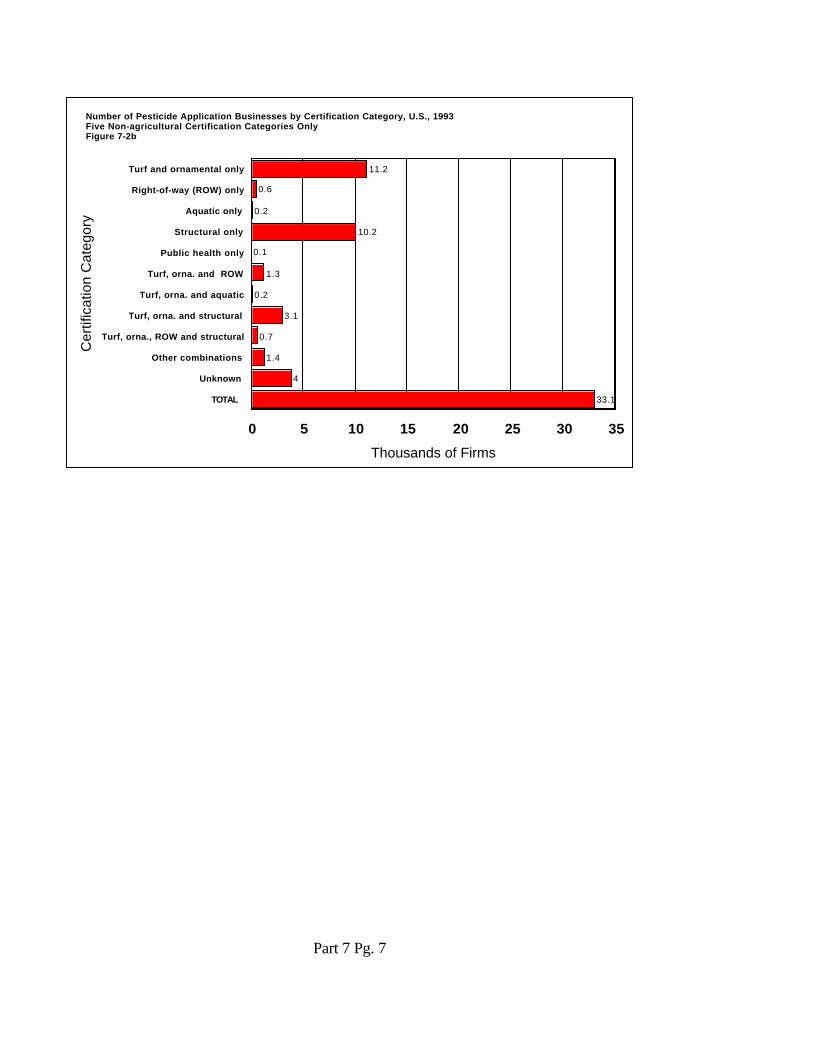
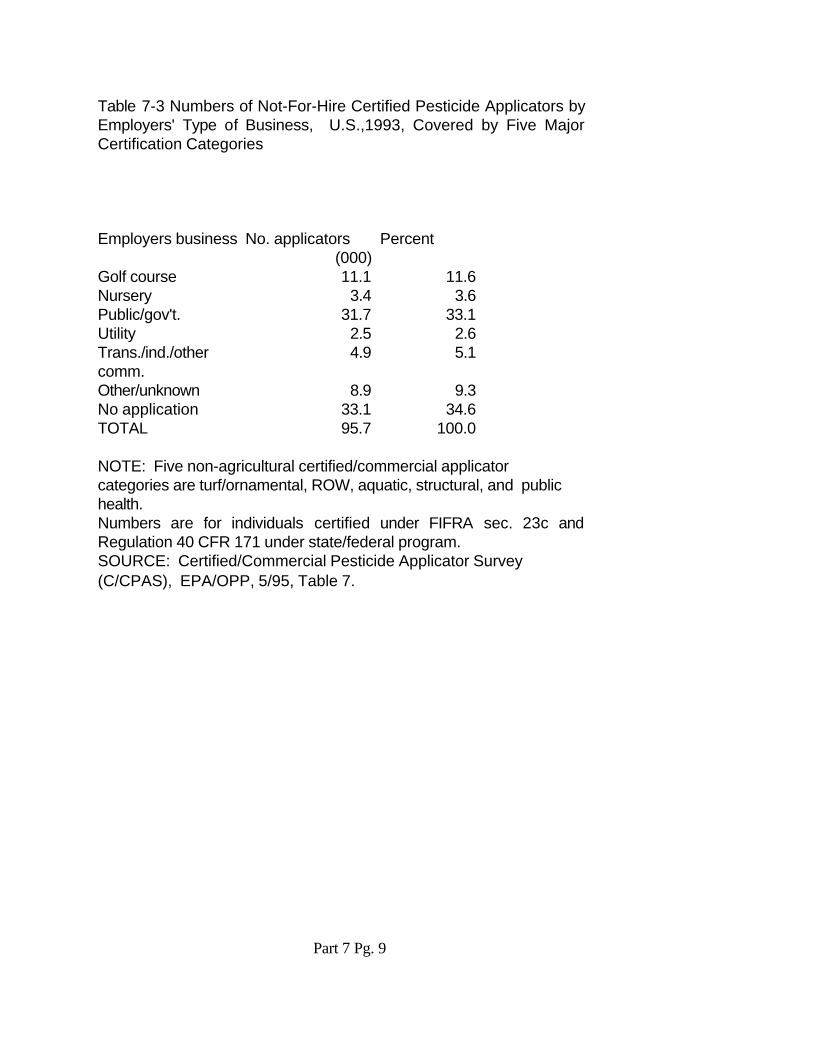
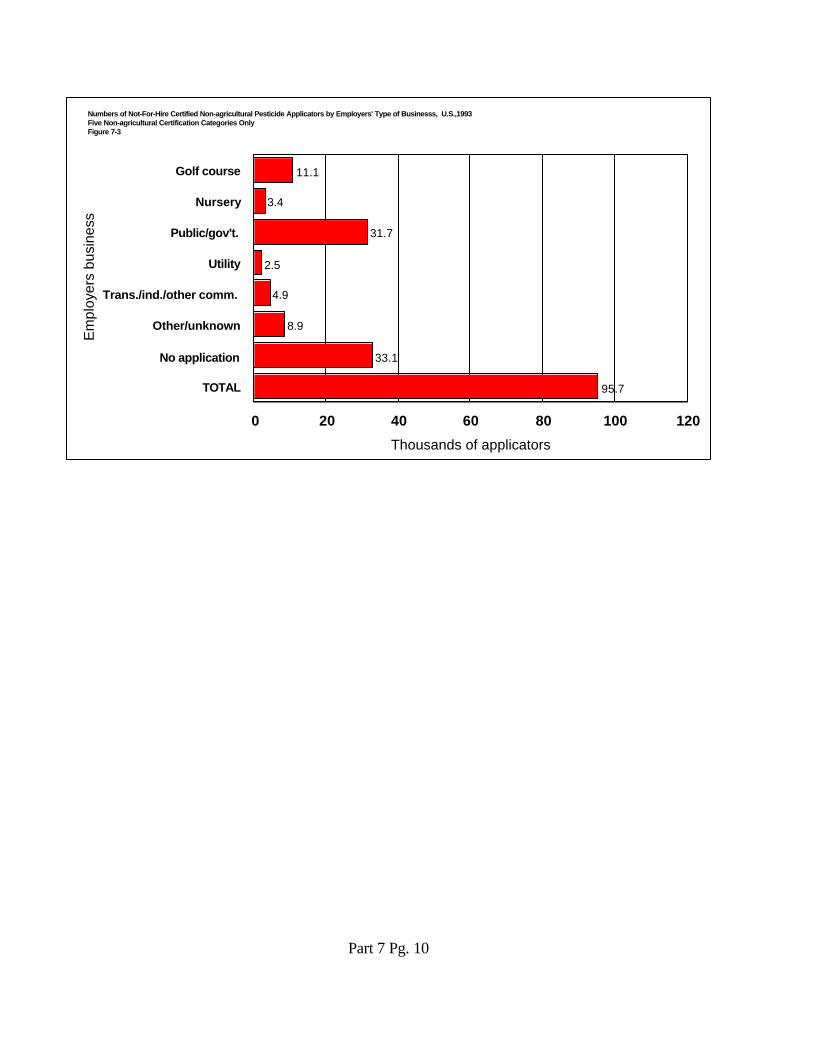
! Profile of Professional Pesticide Applicator Sector (See pages 7/1-17.) " Profile of Applicators and Certifications
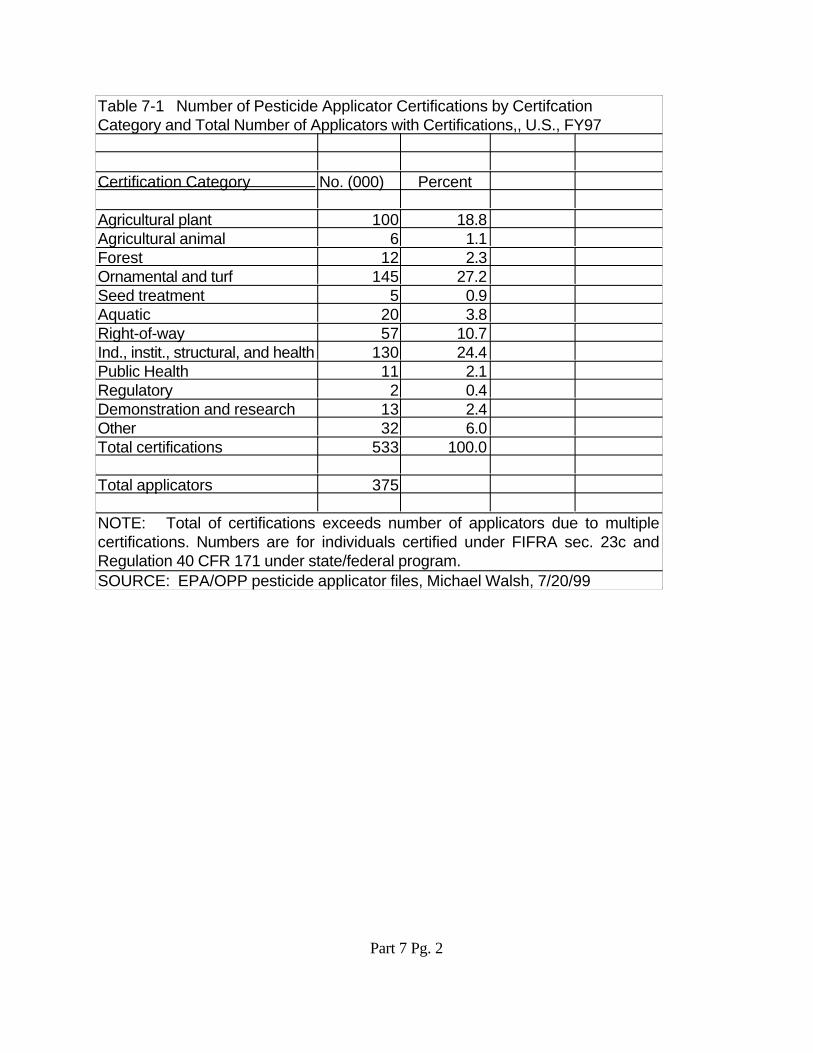
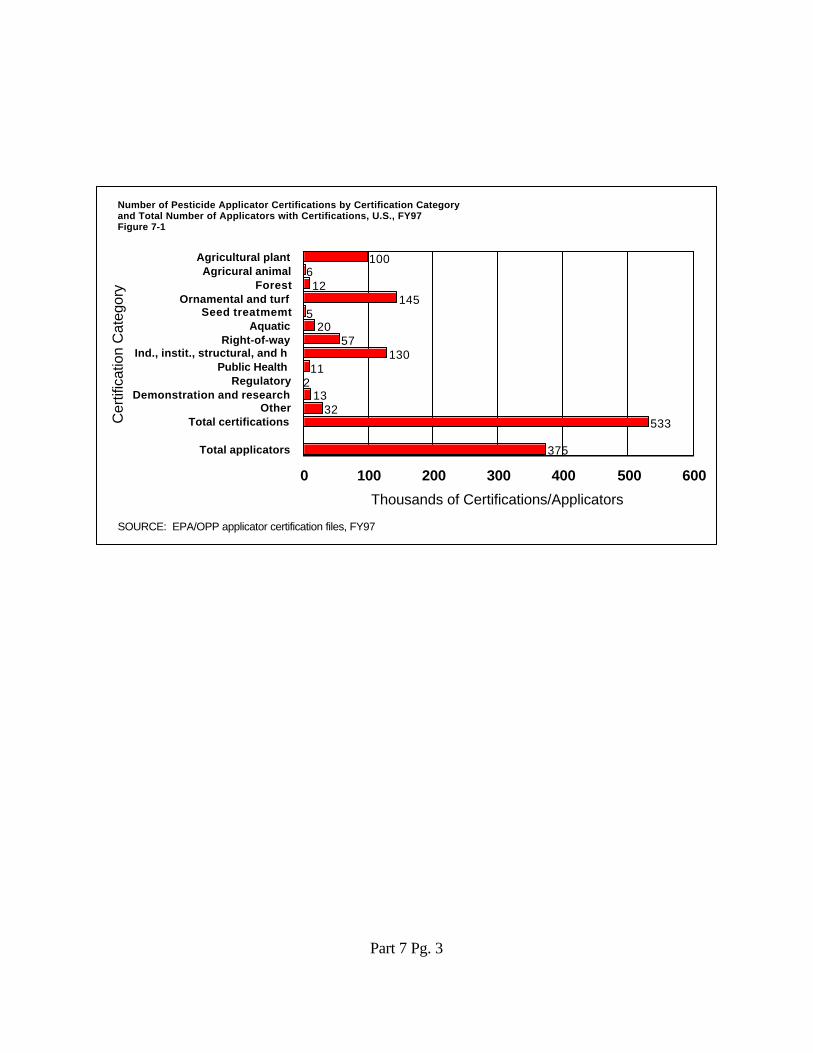
- The industrial/commercial/governmental sector consists of applicators whichapply pesticides to a very diverse set of sectors, land uses and aquatic areas.There are twelve broad categories of applicator certification of which tengenerally relate to the non-farm applications. The two categories of "agriculturalplant" and "agricultural animal" relate primarily to farm/ranch applications. Inorder to apply restricted-use pesticides, applicators must be certified ascompetent to apply such pesticides by meeting national standards set by EPA. The applicators are trained and certified under cooperative programs involvingEPA, USDA and the State Extension Services. All states require commercialapplicators to be recertified every three to five years to maintain certification.
- As of FY 1997, there were approximately 533,000 applicator certifications,involving 375,000 individual applicators. The number of certifications exceeds
Part 1 Pg. 25
the total number of applicators due to multiple certifications of manyapplicators.
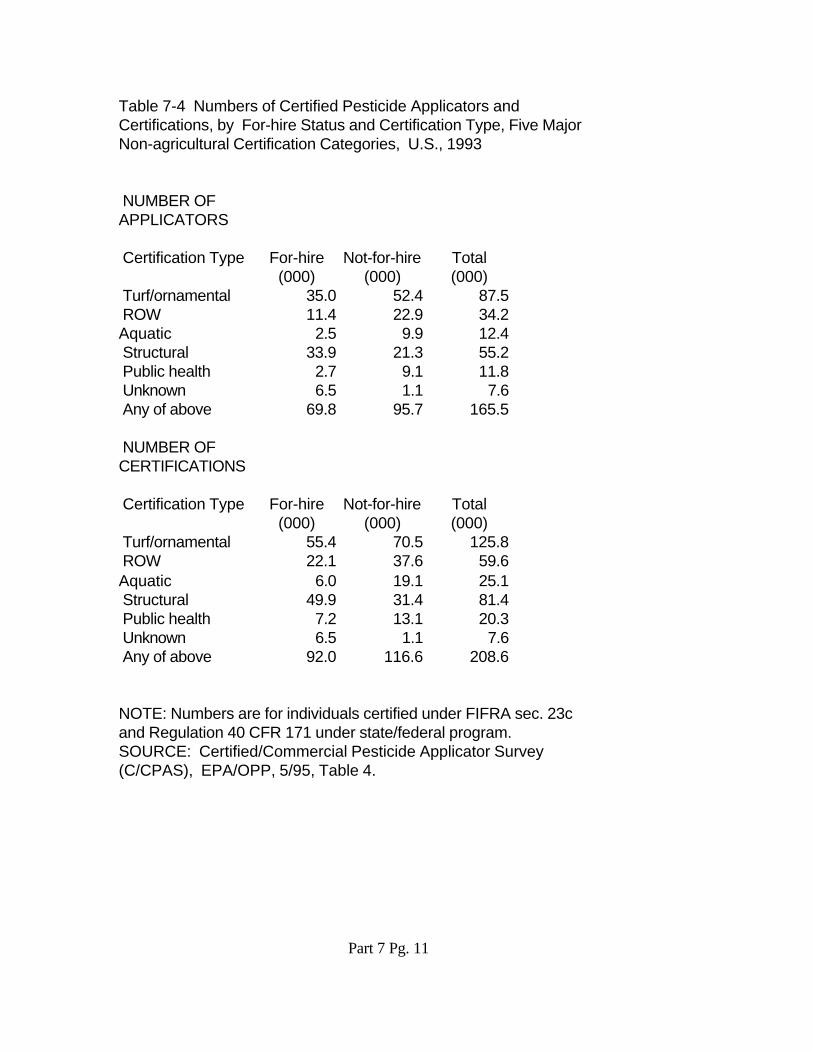
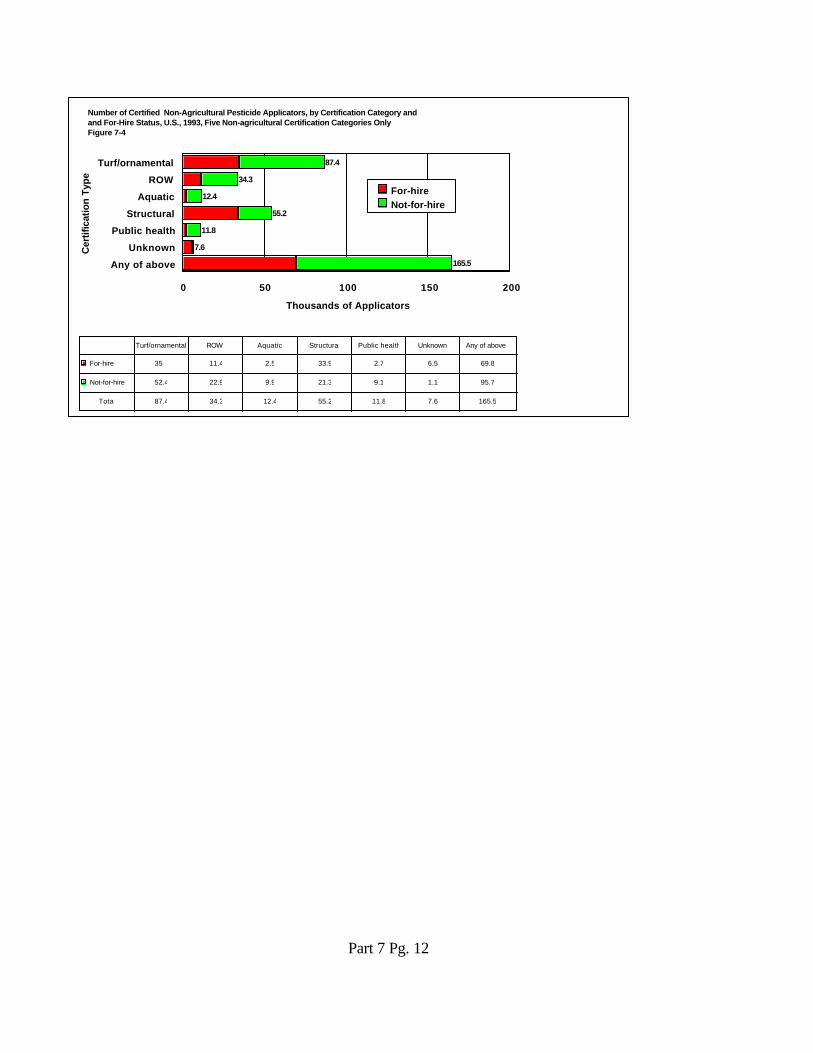
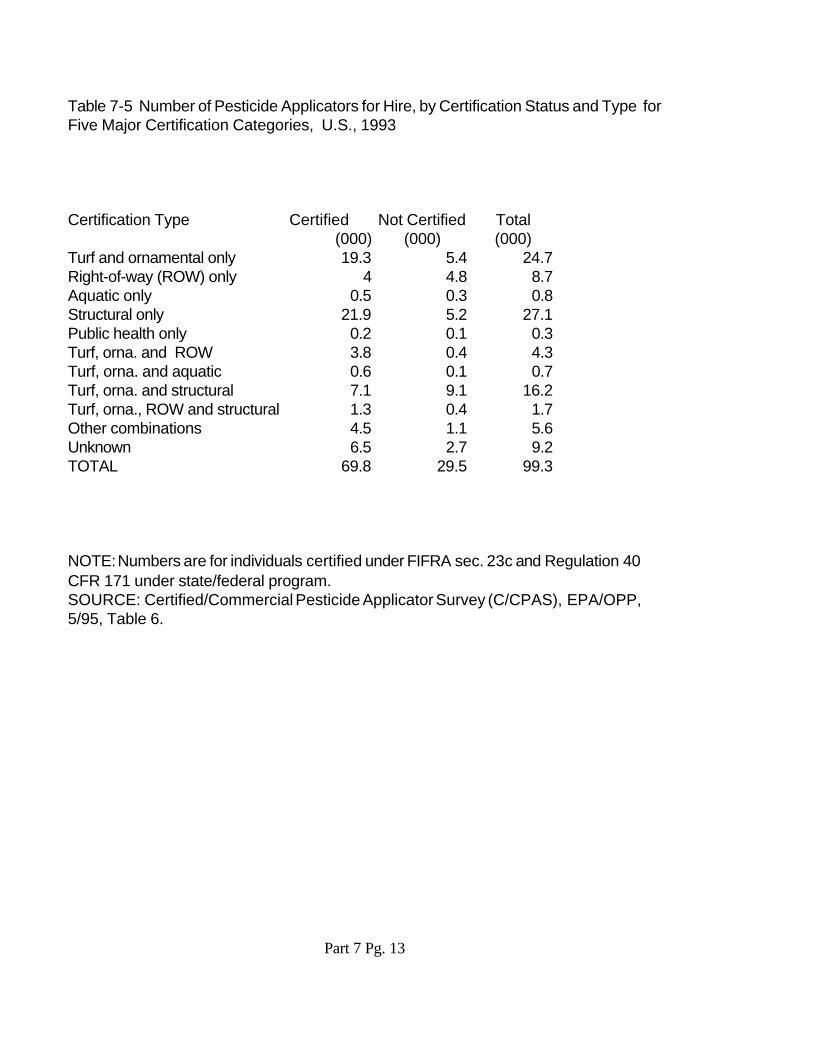
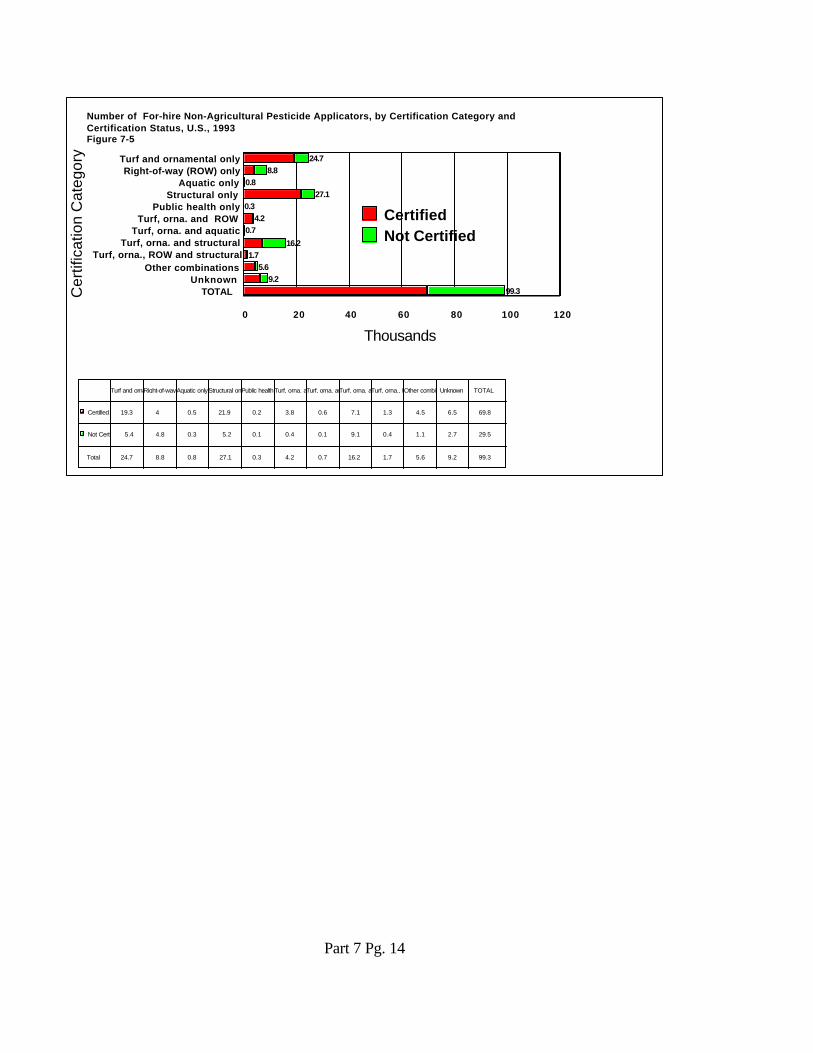
- By far the leading categories of non-agricultural certifications are ornamentaland turf (145,000) and industrial/institutional/structural and health (130,000),the latter category generally referred to as pest control operators (PCO's). Thethird ranking category of certifications is right-of-way (ROW) with 57,000certifications. About 65,000 commercial applicators are newly certified eachyear, along with 120,000 which are recertified annually.
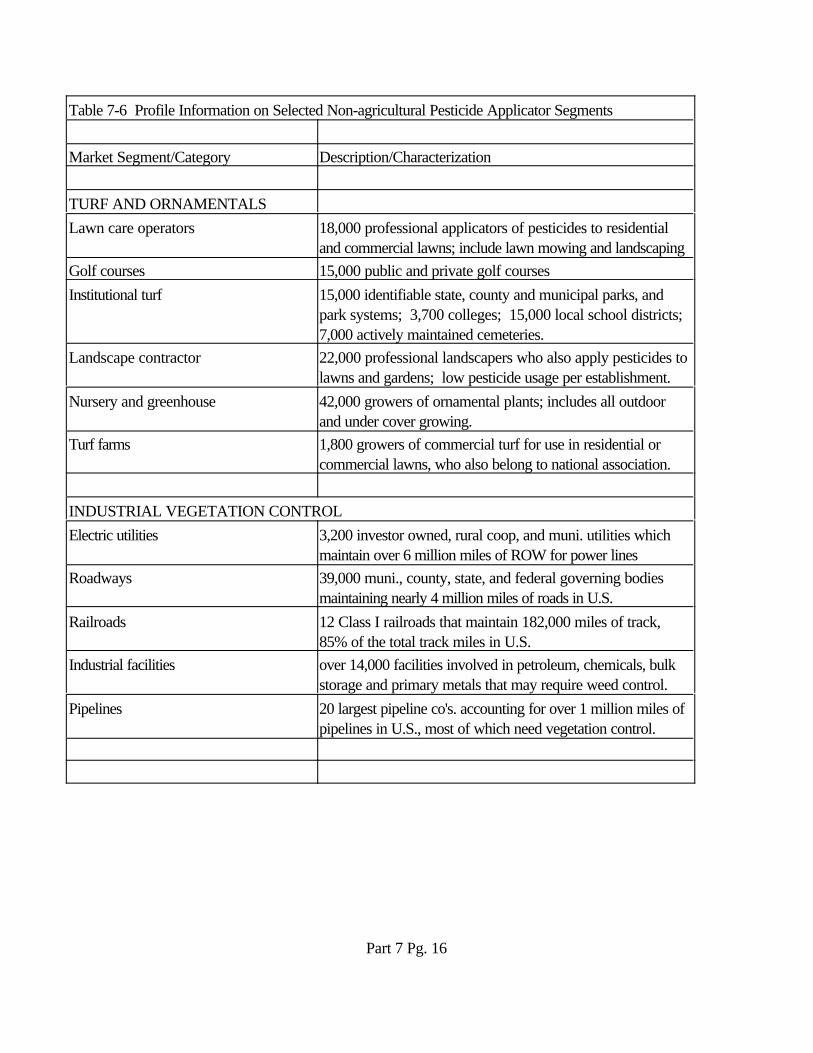
" Profile of Major Non-agricultural User Sectors- The professional applicators serve a diverse set of user sectors which can be
broken down into a number of categories or types which tend to follow suchthings as lines of business, professional disciplines, type of pesticide, economicsector and type of pest.
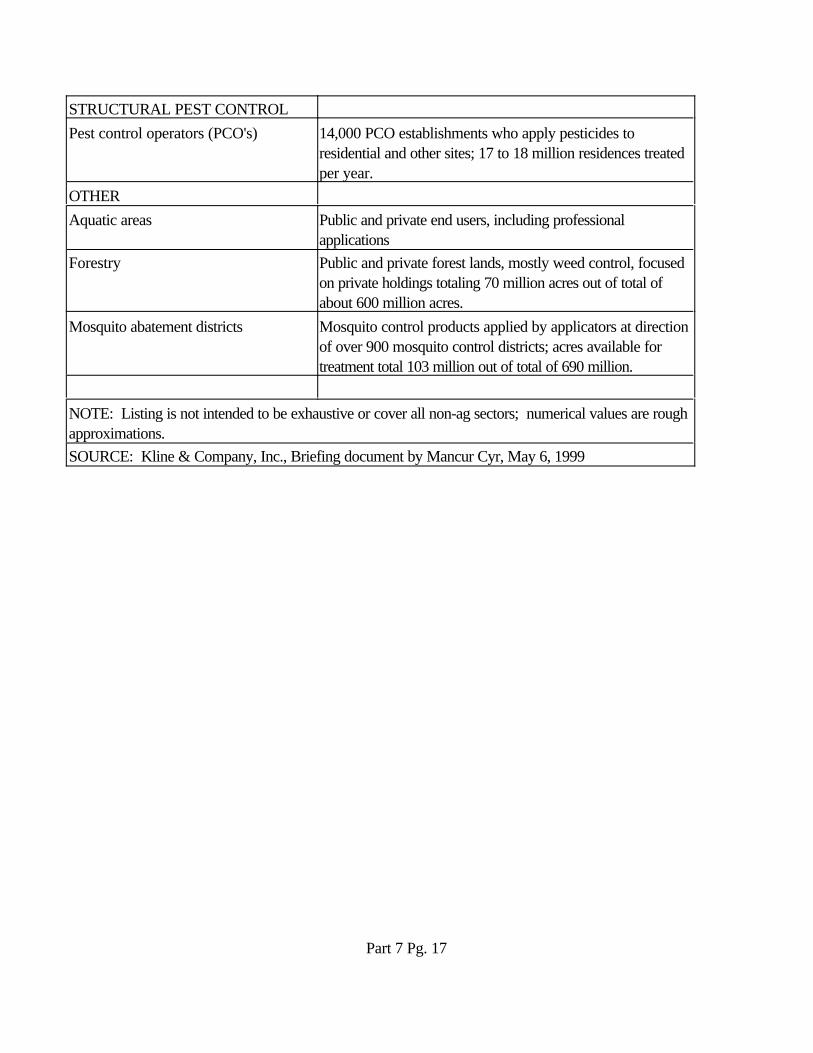
- Some examples of the major user segments are: turf/ornamentals (lawn careoperators with 18,000 applicators; 15,000 golf courses; 15,000 parks; 22,000landscape contractors; 42,000 nurseries and greenhouses), industrial vegetationcontrol ( 3,200 utilities with 6 million miles of right of way (ROW); 39,000government units with nearly 4 million miles of roadways; ), pest controloperators (14,000 pest control establishments with 17 to 18 million residencestreated per year), forestry (focus on 70 million acres) and mosquito abatementdistricts (900 districts treating 100 million acres per year).
! History of Pesticide Applicator Industry (See pages 7/18-19.)
" The professional pesticide applicator industry we have today can be traced back toearliest times as people have struggled with pests of various sorts in the home, inindustry, in commerce and in government. The history of applying pest controltechnology in the western world goes back to an early period of antiquity as early as 300 AD. In these early times, artisans or specialists were using various chemical andnon-chemical controls for pests. Examples include apothecaries, embalmers, shipbuilders, and chandlers.
" During the 12th Century in Europe, itinerant peddlers provided poisons and traps forrodent control. Alchemists and others discovered improved poisons by trial and errorfor vermin control. Ratcatching and vermin exterminating became a livelihood forsome persons as technology improved and trade expanded between Europe and therest of the world.
" By the 18th Century, the itinerant ratcatchers had begun to settle down and operate outof regular places of business, with ads, established accounts and competition with oneanother over claims of control effectiveness, trade secrets, etc. About the middle ofthe 19th Century, some of the European exterminators emigrated to the U.S. and usedavailable chemistry for pest control which remained quite primitive until around 1920.Arsenical and lead based chemicals became generally available for pest control,enabling growth of pest control operations.
Part 1 Pg. 26
" In the late 1920's, the more aware and ethical elements of the applicator industry beganto band together to share ideas. They organized to promote regulation that wouldimprove ethical standards and eliminate unscrupulous operators.
" The emergence of the synthetic organic pesticide industry in the 1940's manufacturingnew highly effective pesticides made possible the rapid growth and expansion of thepest control industry.
" The professional pesticide market of today consists of not only the applicators for hire,but those who are professionals in entities which are not pest control firms, but engagedprimarily in other activities or pursuits.
" Methods of application of pesticides in the professional market are very diverse suchas, hand sprayers (dusters), ground boom and blast sprayers/dusters, directedaerosols, fumigant aerosols/canisters, fixed wing and helicopter applications, injectionsand others.
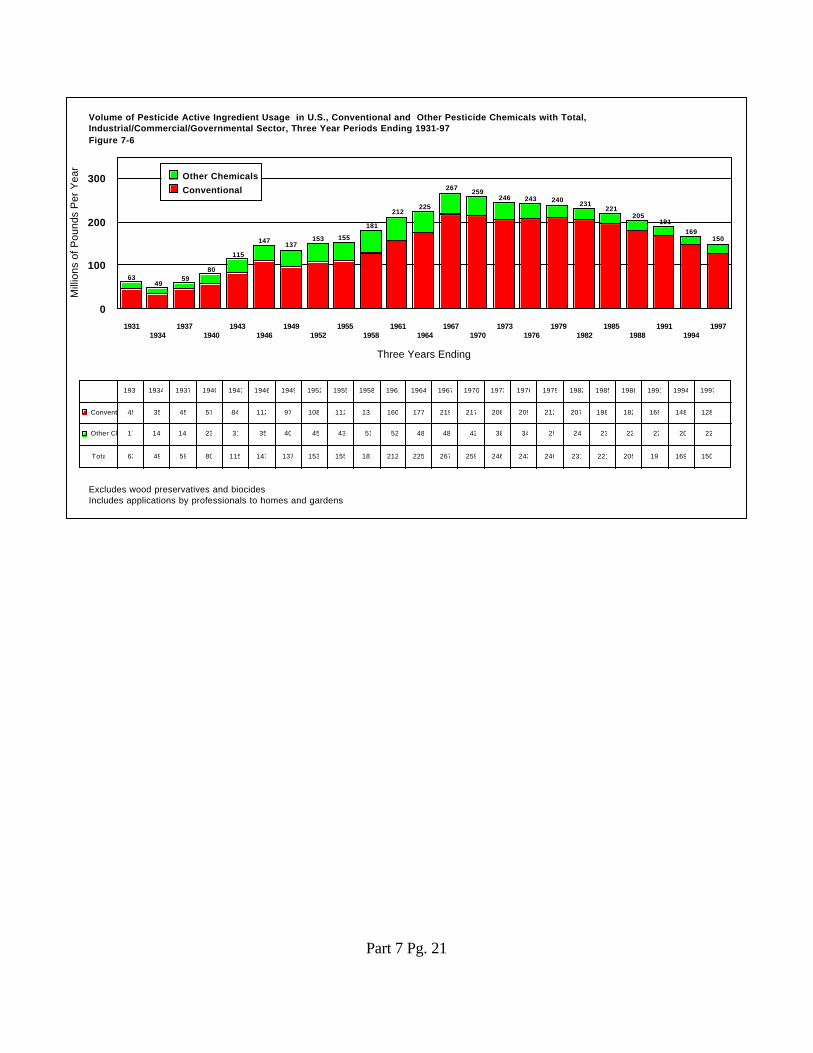
! Conventional and Other Pesticide Chemicals, Aggregate Usage, 1929/97 (See pages 20-24.)" Aerial applications of pesticides began with agricultural crops in 1921/22, but probably
began to be used on non-crop sites by WWII." The usage of conventional pesticides in the professional market increased quite steadily
from about 50 to 60 million pounds per year in the early to mid-1930's to about 210 to220 million pounds per year from the mid-1960's until around 1980; since then it hasdeclined to just under 130 million per year;
" Other pesticide chemical usage increased from about 15 million pounds per year in themid-1930's to a peak of about 50 million per year during 1956/1967; since then suchusage has tended to decline to a level of about 20 million pounds per year during mostrecent years;
" The total of conventional and other pesticide chemical usages was at a low of about 50million pounds per year in 1932/34 and increased to 267 million pounds per year in1965/67; since then, total usage has declined to 150 million per year in 1995/97.
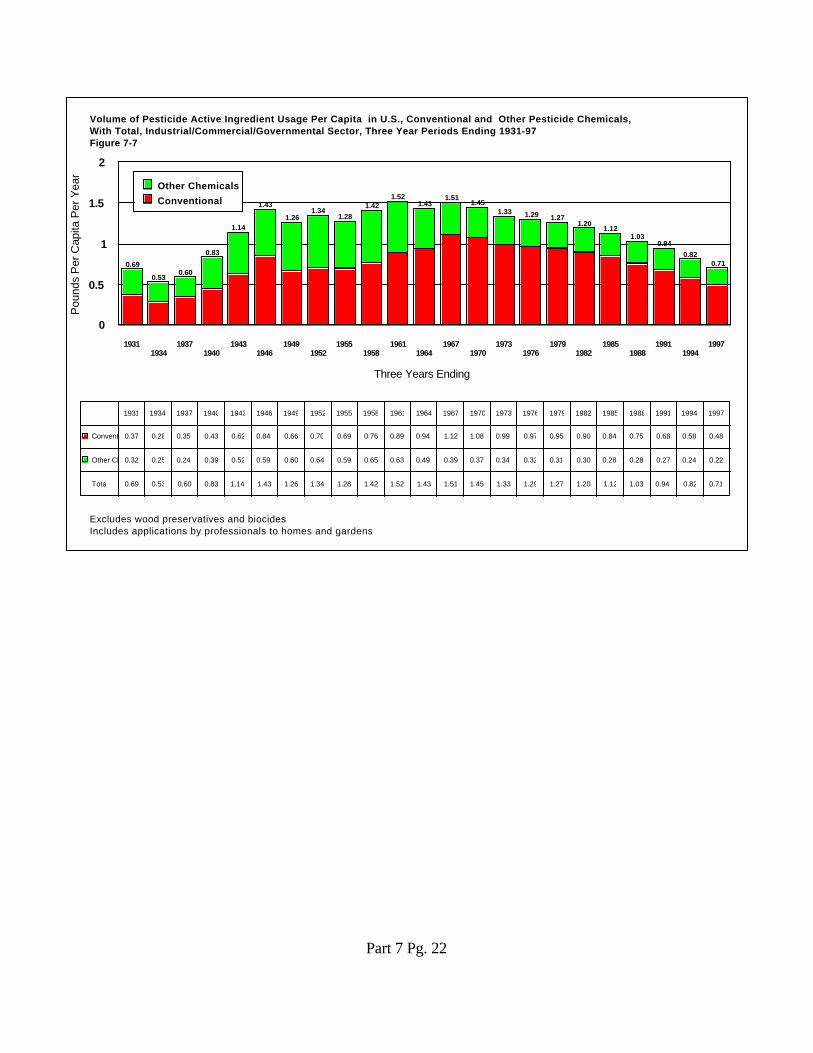
! Conventional and Other Pesticide Chemicals, Per Capita Usage, 1929/97
" A pattern which emerges is consistently lower levels of usage per capita since 1965/67when usage was about 1.5 pounds per capita. For 1995/97, usage was about 0.7pounds per capita.
" This compares with about 0.85 pounds per capita for the home and garden market and3.57 pounds per capita for agricultural usage (based on 947 million pounds of activeingredient and 265 million population for 1995/97)
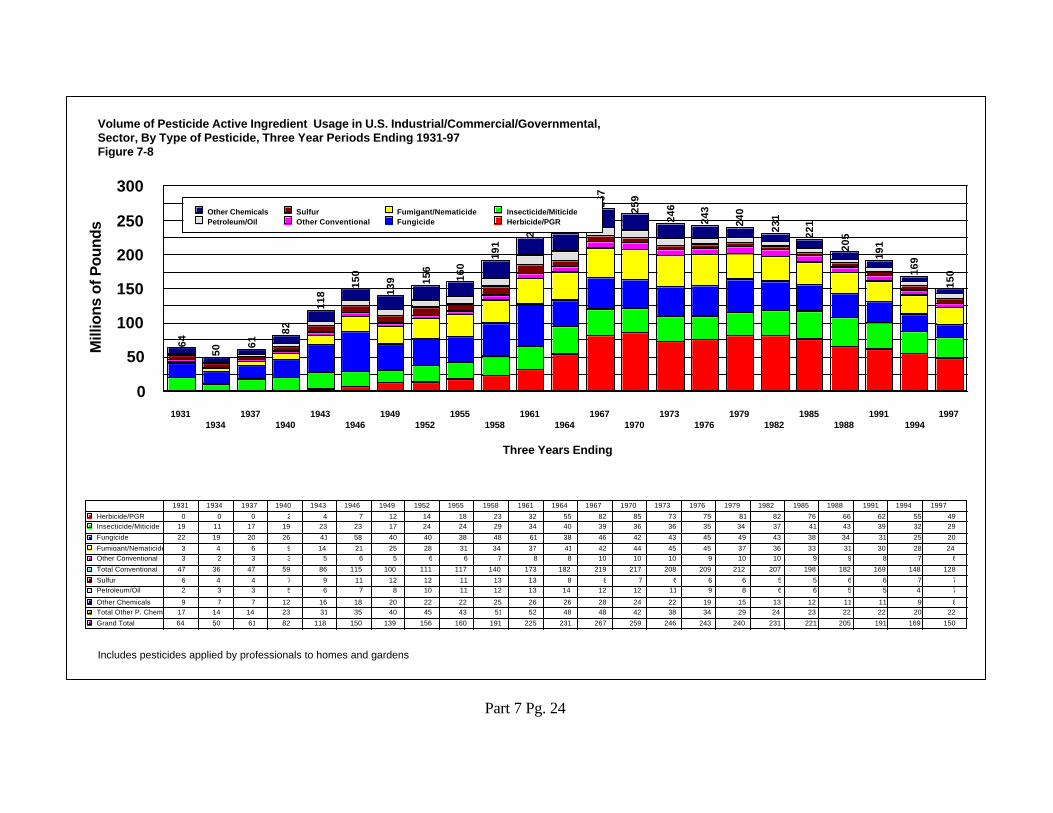
! Conventional and Other Pesticide Chemical Usage, by Class, 1929/97
" Herbicide usage emerged with significant quantities during WWII, held at about 75/85million pounds per year through 1983/85 and has declined since to about 50 millionpounds per year;
Part 1 Pg. 27
" Insecticide/miticide usage was already established by 1929/31, was in the general rangeof 35 to 45 million pounds per year for 1961/91 and has since declined somewhat;
" Fungicide usage expanded sharply during WWII and his remained at similar levelsmuch of the last 50 years, showing some declines in the last decade;
" Petroleum/oil and sulfur usage has remained much the same during the last 30 years;" Fumigant/nematicide usage expanded during WWII, leveled off during the 1960's and
1970's, and has declined to some degree during the last decade.
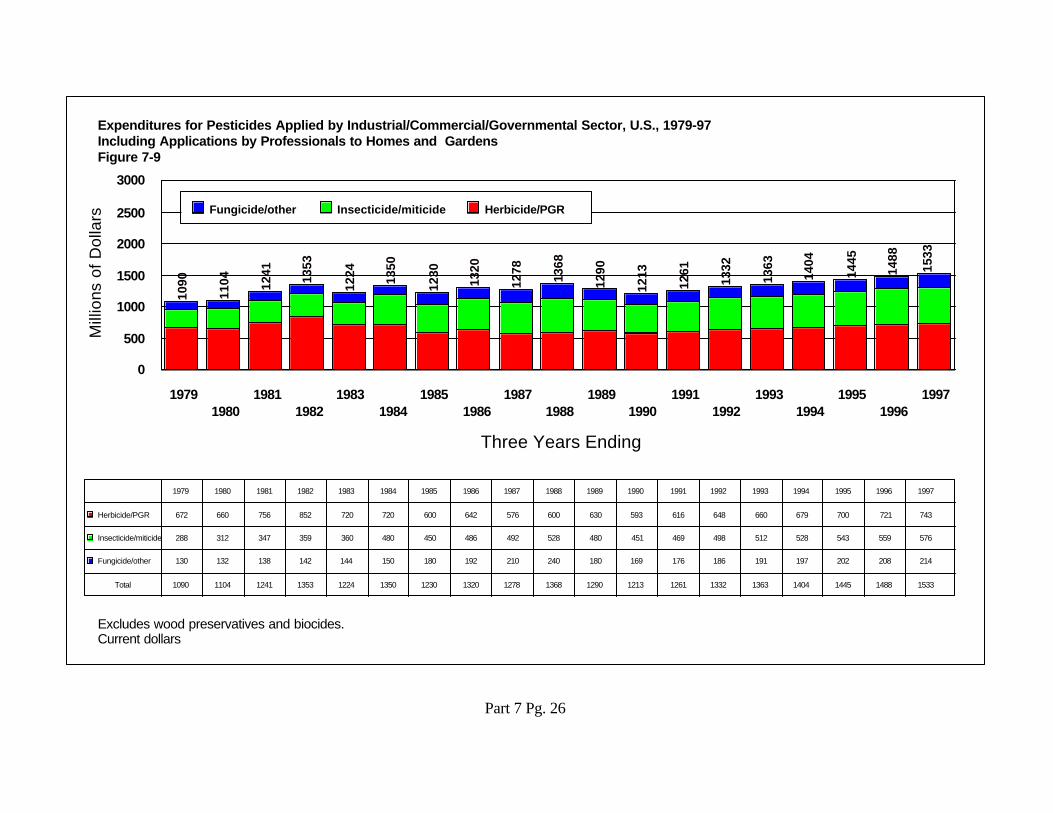
! Professional Market Pesticide User Expenditures, 1979/1997 (See pages 7/25-27.)
" Aggregate user expenditures have increased by about one-half from about $1.09 billionin 1979 to $1.53 billion in 1997. Much of the increase is in insecticides/miticides, forwhich expenditures more than doubled over the nearly 20 years. Increases forherbicides and other types of pesticides have been much more nominal.
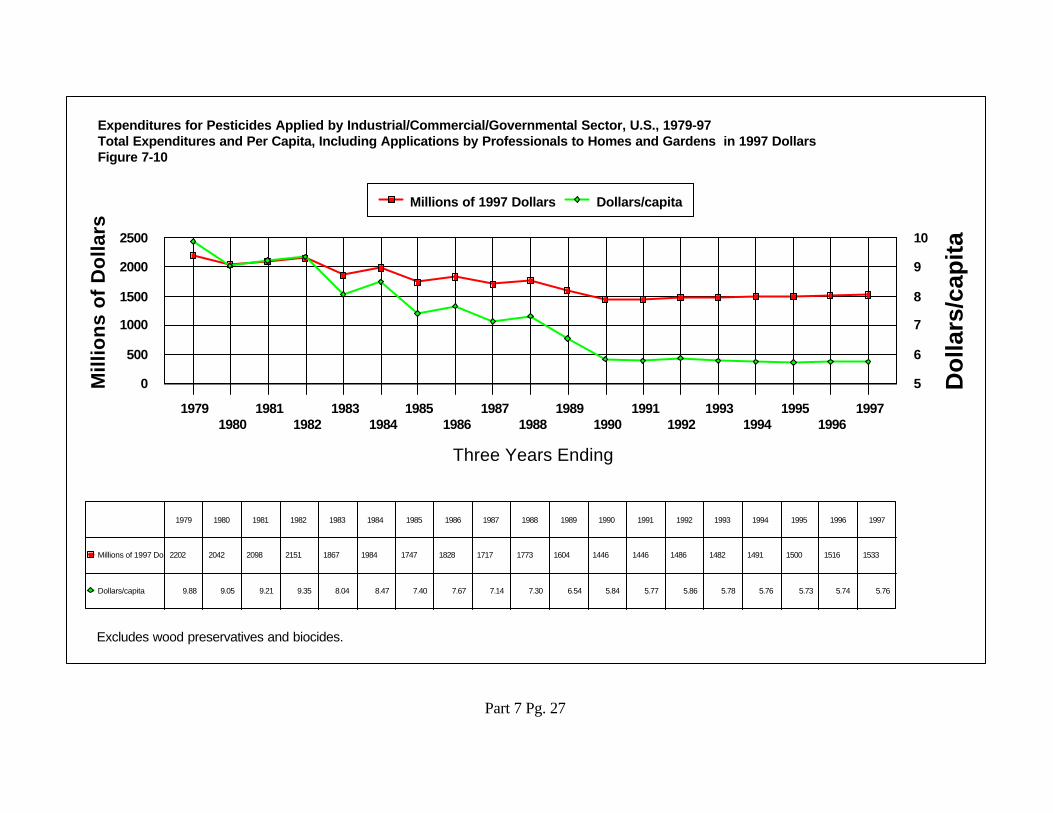
" Estimates were made of professional market user expenditures for 1979/97 in constant1997 dollars to take out the impact of inflation. The result was that expenditures in realterms declined from about $2.2 billion in 1979 to $1.5 billion in 1997.
" When placed on a per-capita basis, expenditures have declined rather significantly,reflecting the above aggregate trends and increasing population. On a per capita basis,expenditures declined from about $9.80 to $5.70 between 1979 and 1997. Expenditures for professional market pesticides are equal to a rather nominal amountper capita, and have been declining in real terms during roughly the last two decades.
Ch. 2 Pg. 1
PART TWO
BACKGROUND ON HISTORY OF PESTICIDE USE AND REGULATIONIN THE UNITED STATES
A. Historical Emergence of Pesticide Technology
1. Purpose
The purpose of this section is to trace the emergence of pest control technology, with specialreference to pesticides as they have been developed and come into use in our society. A table ispresented which traces a time line of some of the more important or landmark developments in pestcontrol technology, often in other nations, which led ultimately to new or changing usage of pesticides inthe U.S. This section is intended to be illustrative of trends in developments, not to be exhaustive of allemerging technology.
2. Types of Pest Control
It may be useful to briefly note the various types of pest control, so as to place control bypesticides in proper perspective. Although controls vary greatly among the various types of pests(insects, plants, fungi, vertebrates, etc.), one can identify some basic categories of pest control such asfollows:
a. Mechanical control--involving physically preventing the pest from causing the damageby removing/isolating the pest from the site of attack or by physically debilitating the pest. Includes legal control through quarantine.
b. Biological control--other organisms control pest or render harmless.
c. Host/target resistance--development of plant or animal resistance to attack by pest organism, including manipulation of genetics, etc. (can be considered a form of biologicalcontrol in some cases).
d. Chemical control--use of chemical pesticide to obtain desired effect on pest.
Generally speaking, the chemicals used for pest control are considered pesticides and are so
1FIFRA originally became law on June 25, 1947 and has been amended several times since. See:EPA report published March, 1997 (730L 97001) which contains FIFRA and applicable sectionsof FFDCA as amended by the Food Quality Protection Act of 1996 (FQPA).
Ch. 2 Pg. 2
regulated in the U.S.. However, the Federal Insecticide, Fungicide and Rodenticide Act (FIFRA) 1
causes certain “biologicals or organisms” to be regulated as pesticides. The principal focus of thisreport is on those chemicals which are considered pesticides, which account for most of the use ofchemicals for “chemical pest control” in the U.S.
Another way of looking at pest control is whether it is preventative or curative (Martin, p. 8). Preventative methods operate on or protect the host/target from anticipated or possible attack, whilecurative methods endeavor to stop or mitigate pest damage after there is an attack.
Pesticides can be used in either mode, such as prophylactically to prevent pest attack or afterthe pest is present and is expected to cause damage at economic threshold levels, i.e., where, insimplest terms, the value of the damage avoided by treatment exceeds pest control costs. Usage ofpesticides by either the preventative or curative approach (or both) can be prudent (in line witheconomic thresholds), i.e., not wasteful. In any case, there is some uncertainty as to whether usage isjustified. The uncertainty tends to be greater for preventative applications because of difficulty/costs inprojecting future pest infestation/damage levels in the absence of preventative treatment. For thisreason, curative treatments are often viewed as less likely to be wasteful, even though that may or maynot be the case in a given situation.
3. Historical Time Line for Pest Control
One author has begun a book by stating: “The history of man is the record of a hungry creaturein search of food.”(Stakman, E. C., p.3) This is obviously a gross oversimplification, but it cannot bedenied that an adequate supply of food is of fundamental importance and has been a preoccupation (ifnot occupation ) of mankind going back to earliest times. Man struggles to obtain adequate supplies offood (and fiber) against all the elements, including pests of various sorts which reduce the quantity andquality of output, by physical damage, disease, etc. Aside from pests interfering with production offood (also fiber, other goods and services), pests cause damage by spreading disease and asnuisances by their mere presence where man does not want them.
Through the ages, it seems, increasingly, that people find a need to minimize the existenceand/or damage of pests, with the use of pesticide chemicals and by other means noted above. Some ofthe factors that lead to increased need for pest control are: development of succulent crops attractive topests, e.g., high sugar content of fruits; large acreage/mass production of monoculture crops which
Ch. 2 Pg. 3
facilitates pest development; widespread incursion of people into new areas occupied by pests notformerly interacting with man; use/development of plants/animals susceptible to pest damage; mobilityof people and commerce leading to importation of pests without natural controls; expectations ofpeople that there should be a minimum of interference from pests; and adaptation of pests to chemicaland other control measures.
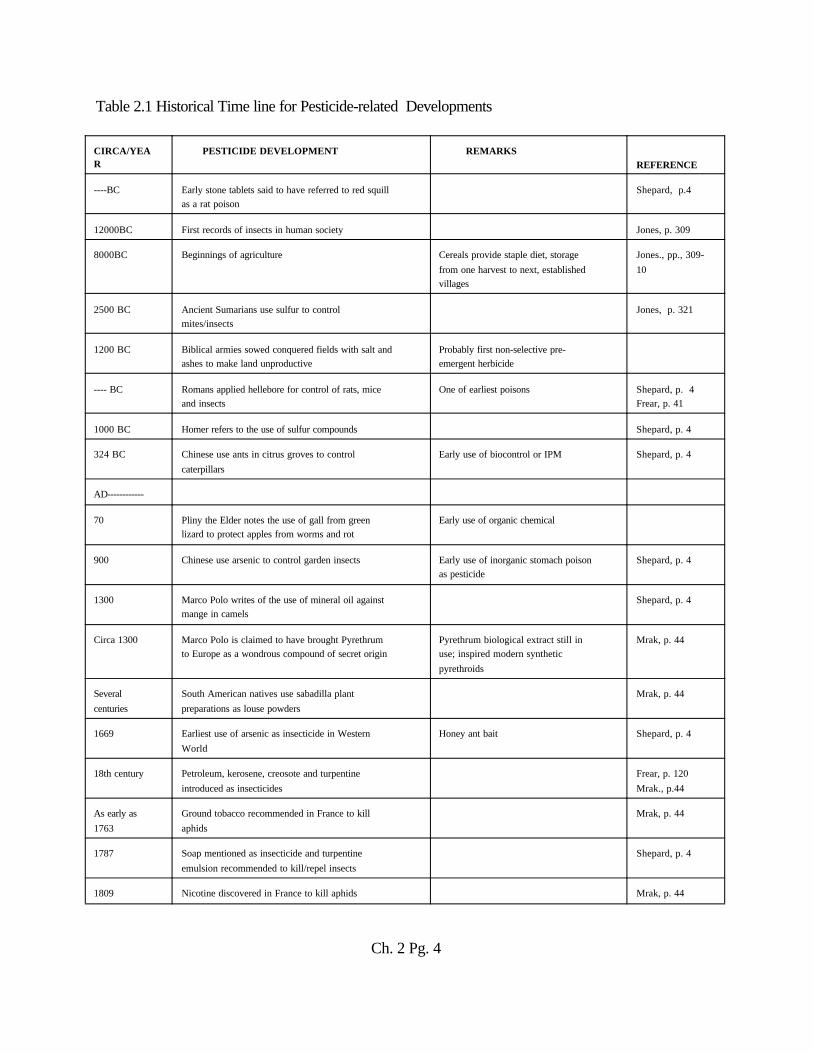
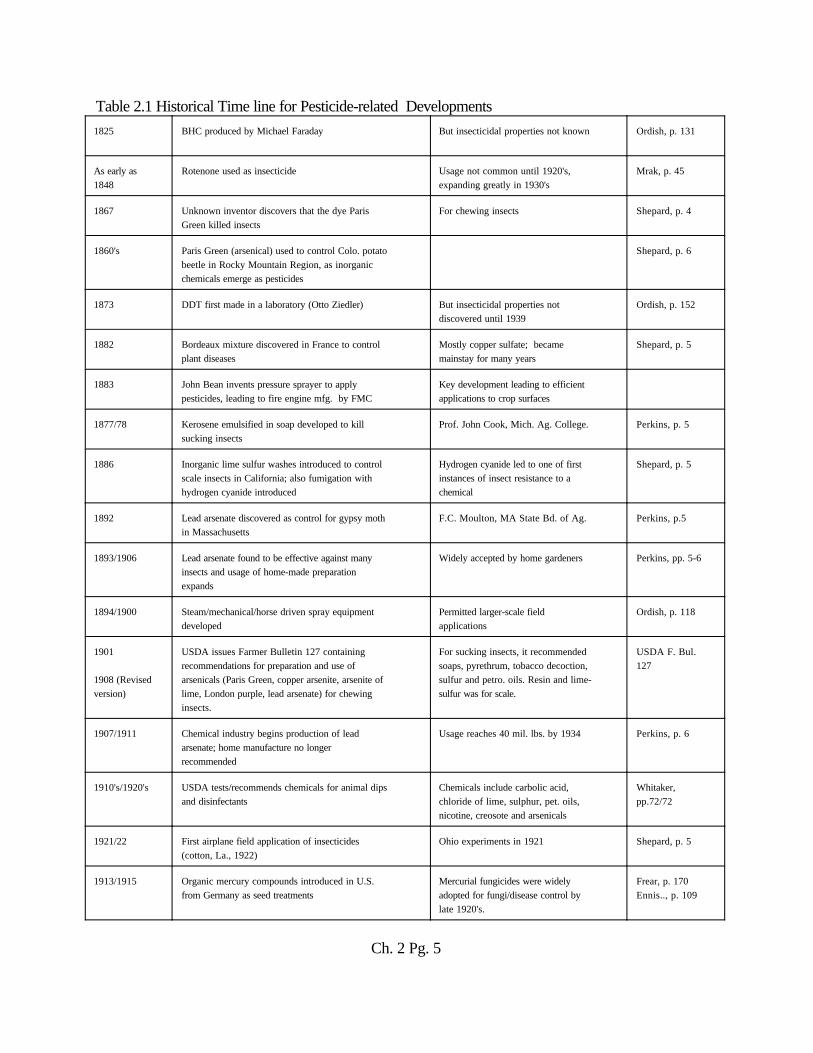
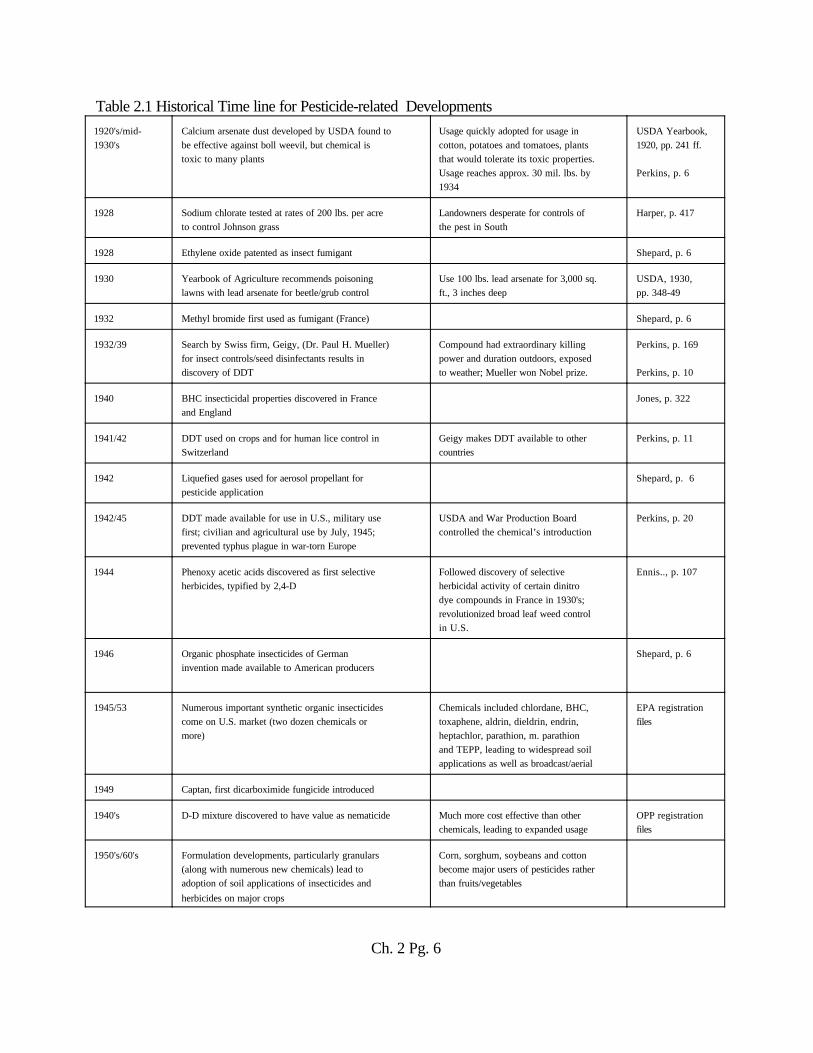
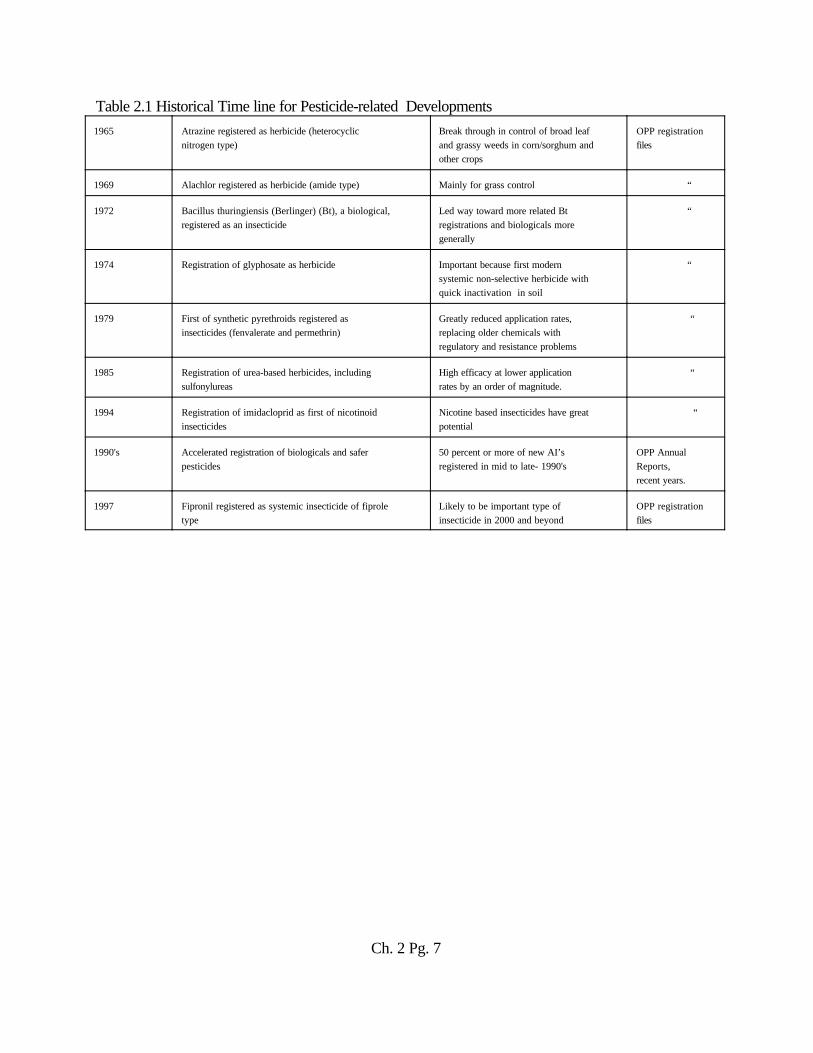
Presented in Table 2-1 is a listing of developments relating to pest control and pesticides inparticular, ranging form prehistoric times to the present. In looking over the listing, one realizes therehas been a rapid acceleration in the rate of pest control developments as time passed. For hundreds ofyears earlier on, few noteworthy things happened. On the other hand, during the last 100 years,especially the last 50 years, pest control has been revolutionized.
Table 2.1 Historical Time line for Pesticide-related Developments
Ch. 2 Pg. 4
CIRCA/YEAR
PESTICIDE DEVELOPMENT REMARKS REFERENCE
----BC Early stone tablets said to have referred to red squillas a rat poison
Shepard, p.4
12000BC First records of insects in human society Jones, p. 309
8000BC Beginnings of agriculture Cereals provide staple diet, storagefrom one harvest to next, establishedvillages
Jones., pp., 309-10
2500 BC Ancient Sumarians use sulfur to controlmites/insects
Jones, p. 321
1200 BC Biblical armies sowed conquered fields with salt andashes to make land unproductive
Probably first non-selective pre-emergent herbicide
---- BC Romans applied hellebore for control of rats, miceand insects
One of earliest poisons Shepard, p. 4Frear, p. 41
1000 BC Homer refers to the use of sulfur compounds Shepard, p. 4
324 BC Chinese use ants in citrus groves to controlcaterpillars
Early use of biocontrol or IPM Shepard, p. 4
AD------------
70 Pliny the Elder notes the use of gall from greenlizard to protect apples from worms and rot
Early use of organic chemical
900 Chinese use arsenic to control garden insects Early use of inorganic stomach poisonas pesticide
Shepard, p. 4
1300 Marco Polo writes of the use of mineral oil againstmange in camels
Shepard, p. 4
Circa 1300 Marco Polo is claimed to have brought Pyrethrumto Europe as a wondrous compound of secret origin
Pyrethrum biological extract still inuse; inspired modern syntheticpyrethroids
Mrak, p. 44
Severalcenturies
South American natives use sabadilla plantpreparations as louse powders
Mrak, p. 44
1669 Earliest use of arsenic as insecticide in WesternWorld
Honey ant bait Shepard, p. 4
18th century Petroleum, kerosene, creosote and turpentineintroduced as insecticides
Frear, p. 120Mrak., p.44
As early as1763
Ground tobacco recommended in France to killaphids
Mrak, p. 44
1787 Soap mentioned as insecticide and turpentineemulsion recommended to kill/repel insects
Shepard, p. 4
1809 Nicotine discovered in France to kill aphids Mrak, p. 44
Table 2.1 Historical Time line for Pesticide-related Developments
Ch. 2 Pg. 5
1825 BHC produced by Michael Faraday But insecticidal properties not known Ordish, p. 131
As early as1848
Rotenone used as insecticide Usage not common until 1920's,expanding greatly in 1930's
Mrak, p. 45
1867 Unknown inventor discovers that the dye ParisGreen killed insects
For chewing insects Shepard, p. 4
1860's Paris Green (arsenical) used to control Colo. potatobeetle in Rocky Mountain Region, as inorganicchemicals emerge as pesticides
Shepard, p. 6
1873 DDT first made in a laboratory (Otto Ziedler) But insecticidal properties notdiscovered until 1939
Ordish, p. 152
1882 Bordeaux mixture discovered in France to controlplant diseases
Mostly copper sulfate; becamemainstay for many years
Shepard, p. 5
1883 John Bean invents pressure sprayer to applypesticides, leading to fire engine mfg. by FMC
Key development leading to efficientapplications to crop surfaces
1877/78 Kerosene emulsified in soap developed to killsucking insects
Prof. John Cook, Mich. Ag. College. Perkins, p. 5
1886 Inorganic lime sulfur washes introduced to controlscale insects in California; also fumigation withhydrogen cyanide introduced
Hydrogen cyanide led to one of firstinstances of insect resistance to achemical
Shepard, p. 5
1892 Lead arsenate discovered as control for gypsy mothin Massachusetts
F.C. Moulton, MA State Bd. of Ag. Perkins, p.5
1893/1906 Lead arsenate found to be effective against manyinsects and usage of home-made preparationexpands
Widely accepted by home gardeners Perkins, pp. 5-6
USDA issues Farmer Bulletin 127 containing recommendations for preparation and use ofarsenicals (Paris Green, copper arsenite, arsenite oflime, London purple, lead arsenate) for chewinginsects.
For sucking insects, it recommendedsoaps, pyrethrum, tobacco decoction,sulfur and petro. oils. Resin and lime-sulfur was for scale.
USDA F. Bul.127
1907/1911 Chemical industry begins production of leadarsenate; home manufacture no longerrecommended
Usage reaches 40 mil. lbs. by 1934 Perkins, p. 6
1910's/1920's USDA tests/recommends chemicals for animal dipsand disinfectants
Chemicals include carbolic acid,chloride of lime, sulphur, pet. oils,nicotine, creosote and arsenicals
Whitaker,pp.72/72
1921/22 First airplane field application of insecticides(cotton, La., 1922)
Ohio experiments in 1921 Shepard, p. 5
1913/1915 Organic mercury compounds introduced in U.S.from Germany as seed treatments
Mercurial fungicides were widelyadopted for fungi/disease control bylate 1920's.
Frear, p. 170Ennis.., p. 109
Table 2.1 Historical Time line for Pesticide-related Developments
Ch. 2 Pg. 6
1920's/mid-1930's
Calcium arsenate dust developed by USDA found tobe effective against boll weevil, but chemical istoxic to many plants
Usage quickly adopted for usage incotton, potatoes and tomatoes, plantsthat would tolerate its toxic properties.Usage reaches approx. 30 mil. lbs. by1934
USDA Yearbook,1920, pp. 241 ff.
Perkins, p. 6
1928 Sodium chlorate tested at rates of 200 lbs. per acreto control Johnson grass
Landowners desperate for controls ofthe pest in South
Harper, p. 417
1928 Ethylene oxide patented as insect fumigant Shepard, p. 6
1930 Yearbook of Agriculture recommends poisoninglawns with lead arsenate for beetle/grub control
Use 100 lbs. lead arsenate for 3,000 sq.ft., 3 inches deep
USDA, 1930, pp. 348-49
1932 Methyl bromide first used as fumigant (France) Shepard, p. 6
1932/39 Search by Swiss firm, Geigy, (Dr. Paul H. Mueller)for insect controls/seed disinfectants results indiscovery of DDT
Compound had extraordinary killingpower and duration outdoors, exposedto weather; Mueller won Nobel prize.
Perkins, p. 169
Perkins, p. 10
1940 BHC insecticidal properties discovered in Franceand England
Jones, p. 322
1941/42 DDT used on crops and for human lice control inSwitzerland
Geigy makes DDT available to othercountries
Perkins, p. 11
1942 Liquefied gases used for aerosol propellant forpesticide application
Shepard, p. 6
1942/45 DDT made available for use in U.S., military usefirst; civilian and agricultural use by July, 1945;prevented typhus plague in war-torn Europe
USDA and War Production Boardcontrolled the chemical’s introduction
Perkins, p. 20
1944 Phenoxy acetic acids discovered as first selectiveherbicides, typified by 2,4-D
Followed discovery of selectiveherbicidal activity of certain dinitrodye compounds in France in 1930's; revolutionized broad leaf weed controlin U.S.
Ennis.., p. 107
1946 Organic phosphate insecticides of Germaninvention made available to American producers
Shepard, p. 6
1945/53 Numerous important synthetic organic insecticidescome on U.S. market (two dozen chemicals ormore)
Chemicals included chlordane, BHC,toxaphene, aldrin, dieldrin, endrin,heptachlor, parathion, m. parathionand TEPP, leading to widespread soilapplications as well as broadcast/aerial
EPA registrationfiles
1949 Captan, first dicarboximide fungicide introduced
1940's D-D mixture discovered to have value as nematicide Much more cost effective than otherchemicals, leading to expanded usage
OPP registrationfiles
1950's/60's Formulation developments, particularly granulars(along with numerous new chemicals) lead toadoption of soil applications of insecticides andherbicides on major crops
Corn, sorghum, soybeans and cottonbecome major users of pesticides ratherthan fruits/vegetables
Table 2.1 Historical Time line for Pesticide-related Developments
Ch. 2 Pg. 7
1965 Atrazine registered as herbicide (heterocyclicnitrogen type)
Break through in control of broad leafand grassy weeds in corn/sorghum andother crops
OPP registrationfiles
1969 Alachlor registered as herbicide (amide type) Mainly for grass control “
1972 Bacillus thuringiensis (Berlinger) (Bt), a biological, registered as an insecticide
Led way toward more related Btregistrations and biologicals moregenerally
“
1974 Registration of glyphosate as herbicide Important because first modernsystemic non-selective herbicide withquick inactivation in soil
“
1979 First of synthetic pyrethroids registered asinsecticides (fenvalerate and permethrin)
Greatly reduced application rates,replacing older chemicals withregulatory and resistance problems
“
1985 Registration of urea-based herbicides, includingsulfonylureas
High efficacy at lower applicationrates by an order of magnitude.
“
1994 Registration of imidacloprid as first of nicotinoidinsecticides
Nicotine based insecticides have greatpotential
“
1990's Accelerated registration of biologicals and saferpesticides
50 percent or more of new AI’sregistered in mid to late- 1990's
OPP AnnualReports,recent years.
1997 Fipronil registered as systemic insecticide of fiproletype
Likely to be important type ofinsecticide in 2000 and beyond
OPP registrationfiles
Ch. 2 Pg. 8
Pests were identified as problems going back to 2500BC and earlier, leading to chemicalcontrols, or pesticides as we now refer to them. In these earliest times, pests were not well understoodand controls were quite crude, if effective at all. There was some usage of chemicals, along withmechanical and biological methods. Existing chemicals, such as arsenic, plant extracts, sulfur andmineral oil were identified as useful in pest control. Ritual, religion and magic were also engaged.(Ordish, 1976, pp.28 ff.) From time to time, church officials took actions such as excommunication orbanishment of pests to deal with pest problems of the day. This is understandable, given some of theBible stories about pestilence attributed to God, such as visitation of locust plagues upon the Egyptians.
Science was not used in any organized or rigorous manner to address pest control problemsuntil the rise of the scientific method (generally associated with Francis Bacon), and its applicationparticularly by the beginning of the 18th Century. More was learned about pests and chemicalsresulting in identification of petroleum, turpentine, nicotine and rotenone as pesticides. BHC (benzinehexachloride) was produced as a chemical (Faraday, France, 1825), later to be discovered to havebroad application as an insecticide (1941/42). Apparently, knowledge of pests and control technologytook a remarkable step forward with the publication of a book entitled “Farm Insects” in 1860, writtenby John Curtis (Ordish, 1976, p.5), which ushered in a new period in pest control.
From about 1860 until the advent of DDT in 1942, there was widespread identification ofinorganic and natural organic chemicals for control of insects and plant diseases (fungi). Little progressoccurred in chemical control of weeds. The chemistry of arsenicals was further exploited to controlinsects (Paris Green). Bordeaux mixture (copper sulfate and lime) was found to be very useful in thecontrol of plant diseases leading to widespread usage. The pressure sprayer (hand and power driven)was invented, making efficient large scale application of pesticides feasible and economical. Aerialapplication was also invented (early 1920's) leading to expanded applications in agriculture.
The availability of DDT, starting in 1945 for civilian/agricultural usage, opened a new era ofpest control, leading to not only its extensive usage, but the development of numerous other syntheticorganic insecticides, e.g., organophosphates (1946). About the same time (1944), selective syntheticorganic herbicides were discovered, starting with 2,4-D which revolutionized weed control inagriculture and elsewhere. Also, synthetic organic fungicides (metal based) were developed aseffective controls of plant diseases (and for other applications). During the 1950's and 1960's, granularpesticide formulations were developed, which led to large expansions of pesticide usage on the majorfield crops.
Prior to the advent to DDT ( and other organic pesticides which rapidly followed), mostpesticides used in agriculture were applied to protect high value/small acreage crops, principally fruits,vegetables and cotton. This however, this changed dramatically starting in the 1950's, as major fieldcrops, ( e.g., corn, sorghum, grains and soybeans) quickly came to account for a majority of pesticideusage.
2 The U.S. Department of Agriculture is the logical agency in the Federal government to beconcerned with pesticides, as it was so designated early in the 20th Century, until 1970, when EPAwas formed and agriculture early on (and now) accounts for a majority of pesticide usage in the U.S.
Ch. 2 Pg. 9
By the 1960's, some very important new families of chemicals were discovered as herbicides(e.g., triazines, acetanilides and dinitroanilines). In the 1970's, the synthetic pyrethroids came on toreplace much of the insecticide chemistry developed during the previous 20 years. During the 1980's,imidazolinone and sulfonylurea herbicides came on to dramatically lower application rates for weedcontrol.
During the 1990's, new, powerful, chemistries have come forward and more will do so by theMillennium. There is heavy emphasis in industry, user groups and at EPA in the registration and usageof biologicals and “safer” pesticides, along with enhanced stewardship in use of available pesticides.
B. Overview of Pesticide Regulatory History in the U.S.
1. Purpose
This section provides a brief survey of national policies and laws which have been involved inthe social regulation of pesticides in the U.S. during the last century. Regulation of pesticides is anintegral part of the overall environment in which pesticides are developed, produced and used in theU.S. The paragraphs below chart a trend in national policies/laws starting from limited objectives,primarily protection of farmers from adulterated/ineffective products, and ending today withcomprehensive objectives, including human health and environmental protection, as well as pesticideuser protection.
2. Prior to 1947
The regulation of pesticides was given very little attention from earliest times until around theTurn of the Century. The pesticide chemicals in use were old chemicals with which people were quitecomfortable (e.g., sulfur, petroleum, lime, arsenicals) and there did not seem to many concerns withthe chemicals requiring regulation, other than from the point of view of consumer (user) protection. Reports of the Commissioner of Agriculture (today’s equivalent to the Secretary of Agriculture) goingback to the immediate Post-Civil War do not reveal regulatory attention to pesticide chemicals otherthan checking them for chemical content and development of recommendations for their use in pestcontrol, the latter being done extensively.2 For example, the Commissioner of Agriculture in 1865,Isaac Newton, reported to His Excellency Andrew John son, President, the following:
“The field open for chemical science never was so great as the present time. Chemistry beingindeed the life and soul of an intelligent, rational agriculture, the governments of Europe--
Ch. 2 Pg. 10
Germany, taking the lead-- impressed with this unquestionable fact, have establishedexperimental stations, consisting of an experimental garden and complete analytical laboratory. The chemist, provided with assistants, institutes on the spot, such original experiments, and testssuch theoretical problems in reference to agriculture as seem most prolific of benefit to thefarming community and the world at large... Thus every one may gradually be prepared toreceive and profit by the rich stores of science open to every intelligent farmer.” (page 7)
He goes on to highlight the progress along these lines in Germany (page 7), which no doubt was afactor (if not model) in setting up the Land Grant University system in the U.S. under legislation passedon July 2, 1862 (noted on page 140). The report (and others issued in later years) focuses heavily onefforts to improve agricultural crop production and control of pests including a section on weeds.(Commissioner’s Report, 1865)
Toward the end of the 19th Century, the usage of pesticides began to be more common andwidespread and Congress became alarmed at developments leading to the passage of the InsecticideAct in 1910. This Law was aimed at helping protect farmers against fraud as they purchasedinsecticides, often by mail or from itinerant dealers. At that time, many of the pesticides were actuallyprepared (formulated) by the farmer for use. The pesticide industry, as we now know it, did not beginto emerge until later. The Insecticide Act of 1910 appears to be the beginning of serious pesticideregulation in the U.S. although the Food and Drug Act of 1906 establishes jurisdiction over foodtreated with pesticides and traded in interstate commerce (NAS, p. 95)
Passage of the Food and Drug Act of 1906 occurred as public concerns for thewholesomeness of food supplies took a major turn when Upton Sinclair’s book, “The Jungle”, waspublished the previous year. It highlighted problems with the safety of the food supply, particularly thatproduced by the meat packing industry and wholesomeness as related to sanitation, product quality andhandling practices. Pesticide residues were not an apparent major concern at the time. Nevertheless,the Insecticide Act of 1910 provided for establishment of tolerances for specific insecticides, which wasdone later by regulation, primarily for arsenic and lead on apples and pears. (Odom, p.293) Theprincipal chemicals regulated were Paris green, pyrethrin and Bordeaux mixture. (Kenaga, p. 189) Other types of pesticides were not covered, e.g., chemicals used as fungicides, which were quitecommon by that time.
The next major development was passage of the Federal Food, Drug and Cosmetic Act(FFDCA) in 1938, which provided for tolerances to be established for chemicals including pesticides,primarily arsenicals such as lead arsenate and Paris green. The Act required that color be added to theformulations to prevent their misuse and set tolerances for residues in food where these materials werenecessary for production of the food supply. (Grodner, p. 3) The protection of the wholesomeness offood supplies dates back many centuries in the Western World. For example, Ms. Grodner makes thepoint by the following piece in her paper:
Ch. 2 Pg. 11
With a sword to his neck, King John of England signed the Magna Carta in June 1215AD but itwas not until 1265AD that the first Parliament was elected. Prior to the election of theParliament, Guilds made the rules necessary for a civilized society. In about 1236 AD, a rulewas passed that forbade the addition of anything to the food supply which was “notwholesome”. This was probably the first rule regulating the food supply, especially foodadditives. (Grodner, p. 2)
3. 1947 to Date
The 1910 and 1938 Acts did relatively little but set the stage for passage of the FederalFungicide, Insecticide and Rodenticide Act (FIFRA) in 1947, as the synthetic organic pesticide industrywas in its take off stages. Dramatic increases in production and usage of such chemicals as DDT,BHC, dithiocarbamic fungicides and 2,4-D were occurring and it was apparent there was a need toupdate pesticide regulation. FIFRA replaced the Federal Insecticide Act of 1910. Among otherthings it expanded coverage to all pesticides (not just insecticides) and required that all pesticides beregistered with the U.S. Department of Agriculture (which had responsibility for pesticide regulation,going back to the 1910 Act).
FIFRA maintained the function of protecting against ineffective or dangerous products from afarmer or other user’s standpoint and labels were to be approved by USDA before products weresold. Products were to be safe when used as directed by the label. The 1947 Act was primarily alabeling act, providing no sanctions for misuse, no authority for immediate stop-sale orders againstdangerous pesticides and limited penalties for companies selling such products. (Briggs, p. 279) Also, acompany could obtain a “protest registration” and sell the product even if USDA would not register it,which was done for a number of products. (Briggs, p. 279) These were major defects in FIFRA andwere changed by amendments in later years (Miller, p. 435) FIFRA was later amended to add federalregistration number as part of registration of pesticides (1959), include warnings on labels (1961) andremove safety claims from labels (1964).
Meanwhile, there was legislative action amending FFDCA during the 1950's related topesticides. The Miller act (1954) amended FFDCA to give FDA responsibility for monitoring food forresidues and provided a new mechanism for setting tolerances of pesticidal residues in foods.. Then, in1958, the Delaney Clause was passed by Congress, amending FFDCA to prohibit any pesticideadditives “found to induce cancer when ingested by man or animal”. The purpose of the 1954/58amendments to FFDCA was to give FDA authority to condemn raw agricultural commodities,processed foods and animal feeds if they contained any pesticide which had not been approved for useor in amounts above tolerance. The 1958 amendment (Delaney Clause) was quite controversial, as itessentially set a zero tolerance for any chemical with cancer activity. This basically was in conflict withFIFRA starting with its 1972 amendments (discussed below), which provided for “risk/benefitbalancing” under the “unreasonable adverse effects criterion”, and ultimately led to amendments in1996, repealing the Delaney Clause.
Ch. 2 Pg. 12
Pesticides were not a major concern during the 1950's and early 1960's; and USDA wasunder limited pressure to tighten regulation of pesticides. USDA lost a pesticide fraud case and wassuccessful in persuading Congress in 1964 to allow denial of registrations (or cancellation) for reasonsof safety or effectiveness, with the burden of proof switched to the registrant rather than USDA, asunder the original FIFRA. Despite the new authorities, USDA’s Pesticide Regulation Division was notprepared for the job of dealing with pesticides as their numbers and usage expanded and as there wereincreasingly vocal demands from the public for enhanced protection of human health and theenvironment. The result was that the responsibility for administering FIFRA was transferred to EPAwhich was created by Executive Order of President Nixon on December 2, 1970. (Miller, p. 435-36)
Pesticides were an issue at the forefront of the environmental movement leading to theestablishment of EPA. The publication of Rachel Carson’s book “Silent Spring” in 1962 dramatizedthe risks of DDT (and other pesticides) and helped crystallize the publics’ concerns in general aboutchemicals contaminating the air, water, wildlife and food supplies (and as found as residues in humantissues). In 1963, the President’s Science Advisory Committee issued a report entitled “The Use ofPesticides” which called for reduced use of pesticides, especially the persistent ones. Similarly, in1969, the HEW Secretary’s Commission on Pesticides and Their Relationship to Environmental Health (“Mrak Commission”, as it was known) issued its report recommending elimination of DDT and DDDusage (except essential public health uses) due to their adverse effects and restricting other persistentpesticides to “essential uses” which create no known hazard to man or the environment. (Mrak, pp. 8-9) ( See also, NAS, p. 96)
Congress responded to heightened concerns about pesticides and amended FIFRA in 1972,changing it to an environmental protection statute, addressing human health and environmentalprotection aspects, as well as maintaining the traditional role of protecting the user fromunsafe/ineffective products, dating back to the 1910 Act. The 1972 amendments were a majorrewriting of FIFRA. Among other things, they strengthened enforcement provisions, provided greaterflexibility in controlling dangerous chemicals, extended scope of federal law to cover intrastateregistrations, set up categories of registrations (e.g., general, restricted use), streamlined administrativeappeals processes, dealt with trade secrets/data sharing issues and called for reregistrations for oldpesticides.
The key operative criterion of the Amended FIFRA is “unreasonable adverse effects on theenvironment”, which is defined as “any unreasonable risk to man or the environment, taking intoaccount the economic, social and environmental costs and benefits of the use of the pesticide”. Thisbroad, flexible, mandate was used successfully to take many pesticides off the market during the 1970'sand 1980's starting most notably with the organochlorine insecticides, such as aldrin, dieldrin,chlordane, heptachlor and kepone. (EPA, Feb., 1990) The cancellation of DDT was taken (January,1971) and finalized (July, 1972) under FIFRA prior to the 1972 amendments which were in October,1972.
Ch. 2 Pg. 13
In the years 1975, 1978, 1980 and 1981, there were amendments to FIFRA which amountedto refinements to the basic law. They related primarily to enhanced penalties for misuse, pesticideclassification, registration/inspection of pesticide plants and scientific evidence proving performance andsafety of pesticides.
During the 1980's and 1990's, EPA actively pursued special reviews of problem pesticidesresulting in a number being removed from the market. The Agency struggled mightily with its mandate toreregister all old/existing pesticides by particular target dates (as early as 1976). But as of the late1980's and again in 1996, reregistration could not be expected to be completed until far into theMillennium according to available schedules. Amendments in 1988 helped some by providing feerevenue to enhance resources available to EPA to fund the Pesticide Program and by related measures. But reregistration was still not proceeding at a rapid rate. Largely as a result of this, Congress passedthe Food Quality Protection Act of 1996, which was designed to expedite the reregistration process,and at the same time, pay particular attention to protecting the safety of food supplies for all identifiablegroups (such as infants and children). Among other things, FQPA provides for:
! A new safety standard for all pesticide residues in food (reasonable certainty of noharm), considering exposure from all sources, including drinking water which eliminatesthe problems with the Delaney Clause;
! Special protections for infants and children and attention to endocrine disruptorchemicals;
! Comprehensive application of the new safety standard to tolerance assessment and reassessment of all tolerances within 10 years;
! Particular attention to minor pesticide uses and coordination with related/interested parties;
! New emphasis on right to know about pesticides by consumers;! Facilitated registration of reduced-risk pesticides;! Speed up reregistration and renew registrations after 15 years;! Enhanced antimicrobial program (speed registration and ensure efficacy).
The listing of FQPA mandates summarized above will be key features of the Pesticide Program for theforeseeable future. There also will be emphasis upon communication with affected/interested parties ingeneral and upon voluntary programs to reduce risks of pesticides (and unnecessary usage) underpesticide environmental stewardship programs initiated in recent years. OPP is working closely withUSDA to implement FQPA with involvement of the Vice President.
4. Other Regulatory Aspects
Although pesticides in the U.S. are regulated principally under the Federal Statute, FIFRA,which incorporates certain parts of FFDCA, other laws apply to them in one way or another. Some ofthe applicable laws are as follows:
Ch. 2 Pg. 14
! Clean Air Act, which can be used to regulate a pesticide if it is a hazardous airpollutant (which has been done with methyl bromide in the 1990's);
! Federal Water Pollution Control Act, can be used to regulate effluent frompesticide production/formulation facilities and certain other aspects, e.g., non-pointpollution;
! Waste Disposal Acts, e.g., RCRA, may be used to deal with pesticide disposalproblems;
! Occupational Safety and Health Act, administered by the Department of Labor. ThisAct overlaps with FIFRA and the two agencies have worked out a sharing ofresponsibilities such as with protection of farm workers from pesticide exposure.
! Endangered Species Act, administered by the Department of Interior, relates topesticides and EPA works with DOI in this regard.
So far in this discussion, no mention has been made of regulation other then at the national orfederal level. Actually, FIFRA provides for substantive involvement of the states under a federal/stateregulatory approach. Federal regulation has primacy in this scheme, but the states, along with TheIndian Tribes, are heavily involved, particularly in applicator certification/training and enforcement,under agreements with EPA. In addition, there are county/city/local statutes and programs whichimpact on pesticides in many instances across the Nation.
Finally, there are international aspects of the regulation of pesticides. The U.S. works asclosely as possible with other nations and international bodies to deal with pesticide matters. Anexample is support of the Codex Alimentarius Commission which sets recommended maximumresidues in food to protect consumers (while avoiding unnecessary interruption of foreign trade). Ajoint committee comprised of the Food and Agriculture Organization (FAO) and the World HealthOrganization (WHO) produces the Codex Alimentarius -- an authoritative guide for theglobal food market. (See FAO Codex A. Home Page)
In addition, cooperative U.S./Canada efforts on pesticides regulatory harmonization wereexpanded in 1996 to include Mexico through the new North American Free Trade Agreement's(NAFTA's) Technical Working Group (TWG) on Pesticides. The goal of the TWG is to develop acoordinated pesticides regulatory framework among NAFTA partners to address trade irritants, buildnational regulatory/scientific capacity, share the review burden, and coordinate scientific and regulatorydecisions on pesticides. This work has already begun to pay dividends by addressing specific tradeirritants, often caused by national differences in Maximum Residue Limits (MRLs or tolerances),developing a better understanding of each regulatory agency's assessment practices, working toharmonize each country's procedures and requirements, and encouraging pesticide registrants (productowners) to make coordinated data submissions to the three NAFTA countries to facilitate jointreviews.
Ch. 2 Pg. 15
C. Types of Pesticides and Why Used
1. Purpose
In order to deal with the scope of pesticide usage and trend in the U.S., it is necessary to havein mind the various types of pesticides that there are and what they are used for. Definitions arepresented for the data series to be presented later in the report.
2. What is a “Pesticide”?
In this section of the report, the term “pesticide” has been used without any particular attentionto what it means for regulatory purposes, to the average American or historically. For currentregulatory purposes, FIFRA (Sec. 2) defines a pesticide as:
“(1) any substance or mixture of substances intended for preventing, destroying, repelling, ormitigating any pest, (2) any substance or mixture of substances intended for use as a plantregulator, defoliant or desiccant, and (3) any nitrogen stabilizer”... (except that the term“pesticide” shall not include any article that is a new animal drug under FFDCA and certainother biocides/devices also covered by FFDCA).
The full scope of this definition can be better understood by considering the definition of the term “pest”in FIFRA, which is:
“(1) any insect, rodent, nematode, fungus, weed, or (2) any other form of terrestrial or aquaticplant or animal life or virus, bacteria, or other micro-organism which the Administrator declaresto be a pest”....(except viruses, etc. on or living in man/animals, which are generally regulatedby FFDCA)
The term “pesticide” includes natural and genetically engineered microbials. Certain microorganisms,such as bacteria, are effective as pesticide active ingredients. As a class, natural microbial pesticidestend to work without adversely affecting other organisms and do not leave harmful residues. For thisreason, these “safer” pesticides often are not subject to the same stringent registration requirements aschemical pesticides. Similarly, biochemicals, which are naturally occurring chemicals (or identical tothem), can often be treated as “safer” pesticides and receive expedited registration because of theirnatural environmental compatibility.
Obviously, the pesticide concept, from a regulatory perspective, has changed markedly in thelast 100 years. At the turn of the last century, the “pesticide” law covered only “insecticides”, whichwere the principal type of pesticides in use at the time. By 1947, the new pesticide law was based on amuch broader definition of the term, e.g., covering chemicals used against fungi, rodents and weeds.However, under the original 1947 FIFRA, the chemicals were generally regulated as “economic
Ch. 2 Pg. 16
poisons”, not as pesticides as we think of them today. This was changed in a major way in the 1972 FIFRA amendments in line with the definition shown above for current FIFRA (except for someclarifications v.z. FFDCA and addition of nitrogen stabilizers). Today EPA, in practice, uses a broaderterm for pesticides than a decade or two ago , particularly because of including the microbials andbiochemicals as pesticides (even though the definition in FIFRA has remained quite similar since 1972).
It seems fair to these authors to say that many people tend to think “insecticide” when the term“pesticide” is used. Very often you hear people use the term “pesticides and herbicides”, implying theyare not aware of the broader scope of the term “pesticide”. That is in line with the evolution of our lawsas well. The Insecticide Act was the principal pesticide act we had as a Nation from 1910 to 1947. The dictionary is quite consistent with FIFRA . Funk and Wagnalls Standard Dictionary definespesticide as: “a chemical or other substance used to destroy plant and animal pests”.
This report is intended to cover the usage of pesticides utilizing the current FIFRA definitionnoted above. This means that inorganic, synthetic organic and organic chemicals (biochemicals) arecovered along with microbials as data permit. In some cases, data are not available or very meaningfulfor biochemicals and microbials.
3. Particular Types of Pesticides and User Benefits
One may ask, what types of pesticides are used and why? Presented in Table 2.2 is a listing ofvarious rather specific types of pesticides that are used and a key word statement as to the kinds ofbenefits that inspire the user to employ the pesticides. As to the types of pesticides, over the years,pesticide producers, regulators, researchers and users have developed a set of terms for identifying pestcontrol chemicals that tend to follow the target pests for which they are to be used. They arecommonly referred to as pesticide classes as well as types. For example, those pesticides used totarget fungi are called fungicides in industry parlance. Often there is some overlap between types orclasses of pesticides identified because some pesticides control more than one type of pest. Also, someof the type categories are intentionally defined to be broader in scope than a particular listing mayprovide for. This listing in intended to be quite inclusive of the pesticides regulated by FIFRA. The usetypes in Table 2.2 are the basis for explaining the definitions for categories of pesticides that are used inreporting usage in this report, as developed below.
Pesticides are used for an amazingly broad range of pests. It seems that most every facet of thehome, garden, industry, commerce, government and agriculture are subject to possible infestation suchthat a pesticide may be applied at least at times. When pesticides began to be used in the U.S., focusfirst was generally on a few insects and plant diseases as discussed earlier in the section). But as timehas gone by, applications have been developed for a very broad range of use sites in our society andfor practically every type of plant or animal species. Most types of animal and plant species arecapable of becoming “economic pests”, in some circumstances. This means that users judge it wouldbe prudent or worthwhile to incur the cost of using a pesticide because of perceived benefits of such
Table 2.2 Types of Pesticides, Target Pests and Nature of User Benefits from Pest Control
Ch. 2 Pg. 17
usage.
PESTICIDE TYPE TARGET PEST(S) USER BENEFIT FROM PEST CONTROL
Acaricides/miticides
Mites Stop pests sucking juices from plants or liquids from animals,incl. nuisance
Algicides Algae, marine plants, scum Kill algae in desired locations
Avicides Birds Avoid nuisance and physical damage of birds
Bactericides Bacteria Kill bacteria in desired locations
Defoliants & desiccants Plants Removal of leaves/foliage of plants or completely kills plantimmediately, to facilitate harvest
Disinfectants/biocides/antimicrobials
Microorganisms of various types,viruses
Kill/eliminate microbes from target area, e.g., disinfection,sterilization, sanitization
Kill undesired species from soil, commodities or space
Fungicides Fungi Kill fungi causing plant diseases, nuisance or physicaldamage/problems
Herbicides Undesired plants (weeds) Elimination of visual or other nuisance of weeds or economicdamage due to use of water, nutrients and light by weeds
Insecticides/ins.Growth regulators
Insects Eliminate nuisance/disease threats to humans and animals,contamination/destruction of commodities/premises
Moluscicides Invertabrates, e.g., snails, slugs Eliminate nuisance or economic damage of invertebrates tovalued plants or crops
Piscicides Fishes Removal of undesired fish from target waters
Plant growth regulators Plants/fruits/seeds Control growth/development of plant or plant parts to obtaindesired effect, e.g., ripening, storage life, etc.
Repellents Various insect and other animalforms
Dissuades/deters animal from being on protected object or inprotected area.
Rodenticides Rodents Eliminate nuisance and disease to humans and damage tocommodities/premises
Silvicides Woody plants/weeds inforestry/ornamental production
Eliminate damage to by undesired species of trees
Slimicides Various lower plant/animal forms,microbes
Prevent development of slime in aquatic/aqueous environments
Wood preservatives Fungi & other life forms that attackwood
Prevent decay and destruction of wood products exposed to theelements
Ch. 2 Pg. 18
The “user benefits” may be very tangible, such as avoided loss in quantity (or quality) of a farmer’s cropyield, improved physical condition of a homeowner’s lawn or elimination of a pest-induced public health problem.Conversely, user-benefits may be purely intangible such as avoidance of the mere existence of a pest where it isnot desired, i.e., nuisance benefit. The benefits to the user may be real or imagined and may or may not turn outto be realized after the application, for one reason or another. The purpose here is not to address this topic ofeconomic thresholds rigorously or the social wisdom of applying pesticides. It is merely to present background asto why pesticides are used in our society and who makes those decisions, i.e., users of various kind who ultimatelypay for such applications.
4. Categories for Reporting Usage
Unfortunately comprehensive detailed data are not available for each of the pesticide use types (rows)identified in Table 2.2. Neither would it be within the scope of this project to report such detailed data even if itwere available (which it is in some cases). Data however are available to present estimates for general categoriesof usage. A framework for developing usage estimates is presented in Table 2.3. Overall estimates of U.S. usageare presented only for those usage categories. Breakouts (disaggregated data or market segments, e.g., by cropor economic sector) are presented where feasible and within the scope of reporting in this document.
“Conventional pesticides” is the first listed category shown in Table 2.3. These are the chemicals (activeingredients) developed and produced primarily for use as pesticides and the ones that have historically occupiedmuch of the focus of Federal regulation (due to their inherent biological potency, use in food production, quantitiesused). There are “other pesticide chemicals” used much like conventional pesticides for which estimates are alsopresented , e.g., sulfur and petroleum items. The focus of this report is upon these first two general categories ofpesticides. Only national summary data are presented on the other three categories: wood preservatives, specialtybiocides and chlorine/hypochlorites. The wood preservatives are used in industrial plants to treat wood againstmicrobial and other pest damage. The other two categories are also antimicrobial chemicals used for a broad rangeof applications as suggested in Table 2.3. Further discussion of the usage categories can be seen in a reportsummarizing U.S. pesticide usage for 1996 and 1997. (Aspelin, 1998) In this report, focus is upon estimating andreporting usage of pesticides regulated by EPA, apart from those only regulated by other agencies such as FDAand USDA. In some cases, EPA and FDA have joint responsibility for regulating certain pesticides and those areinclude in totals reported herein.
Table 2.3 Types of Pesticides Included in General Categories for Summarizing Usage in the U.S. Usage
Chlorine/hypochlorites Chems. for disinfection ofpotable/waste water; bleaching, disinfectant andpools
Excludes chemicals used for otherpurposes
GRAND TOTAL
REFERENCES TO PART TWO
Ch. 2 Pg. 20
Aspelin, Arnold L. and Arthur H. Grube Pesticides Industry Sales andUsage: 1996 and 1997 Market Estimates, EPA, Washington, DC
Briggs, Shirley A. U.S. Federal Regulation of Pesticides, 1910-1988, inBasic Guide to Pesticides: Their Characteristics and Hazards, Omega byHemisphere Publ. Co., 1992
Ennis, W. B., Jr., and McClellan, W. D. Chemicals in Crop Production , inYearbook of Agriculture, 1964, USDA, Washington, DC. 1964
Frear, Donald E.H. Chemistry of Insecticides and Fungicides, D. VanNostrand Co., New York, 1942
Georgia, Ada E. A Manual of Weeds, The Macmillan Co., New York,1933
Grodner, Mary L. Pesticide Regulation and Pesticide Education, Report byPres. Of American Assoc. Of Pesticide Safety Educators to American Assoc.Of Pesticide Control Officials, March 10, 1997
Harper, Horace J. The Use of Sodium Chlorate in the Control of JohnsonGrass, Journal of the American Society of Agronomy, Vol. 22, No. 5, May,1930
Jones, D. Price, Agricultural Entomology, in History of Entomology, Editedby Ray F. Smith, et. al., Annual Reviews, Palo Alto, CA, 1973
Kenaga, E.E. History of Insecticide Introduction, Use, and Regulation: ESAParticipation, Entomology Society of America, Vol. 35, No. 3, Fall, 1989
Martin, Herbert The Scientific Principles of Plant Protection with SpecialReference to Chemical Control, Longmans, Green & Co., New York, 1940
Miller, Marshall Lee Federal Regulation of Pesticides, in Environmental LawHandbook, Ninth Edition, Government Institutes, Rockville, MD, 1987
Mrak, Emil Pesticides and Their Relationship to Environmental Health, U.S.Dept of HEW, Wash., DC, 1969
NAS Pest Control: An Assessment off Present and Alternative Technologies,Vol. I, National Academy of Sciences, Washington, D.C., 1975
Odom, R.F. Historical Perspective on Regulations Governing the Use ofHerbicides and Other Pesticides, Proceedings, Southern Weed Society, Vol.44, 1991
Ordish, George The Constant Pest; A Short History of Pests and TheirControl, Charles Scribner’s Sons, New York, 1976 (See also, “150 Yearsof Crop Pest Control”, Lecture to British Agricultural History Society,Norwich, April 9, 1968)
Ch. 2 Pg. 21
Perkins, John H. The Introduction of DDT to the United States; ReshapingInsect Control Technologies in Wartime. Miami Univ., Oxford Ohio, undated,circa 1975 (See also, “Reshaping Technology in Wartime:the Effect of MilitaryGoals on Entomological Research and Insect-control Practices”, in Technologyand Culture, Society for History of Technology, 1978)
Shepard, Harold H. The Chemistry and Action of Insecticides, First Ed.,McGraw-Hill, New York, 1951
Sinclair, Upton The Jungle, 1905
Stakman, E. C. The role of Plant Pathology in the Scientific and SocialDevelopment of the World, in Plant Pathology: Problems and Progress, 1908-1958, Edited by C. S. Holton, et.al., Univ.of Wis. Press, Madison, 1959
US EPA Suspended, Cancelled and Restricted Pesticides, 20T-1002,Washington, DC, Feb., 1990
USDA Report of the Commissioner of Agriculture, Nov. 27, 1865, Washington, DC, 1865
USDA, Fleming, Walter E. Lawns Protected by Lead Arsenate from Beetle-grub Injury, in Yearbook of Agriculture, 1930, USDA, Washington, DC.1930
USDA, Marlatt, C. L., M.S. Important Insecticides; Directions for TheirPreparation and Use, Farmer’s Bulletin No. 117, a revision of Farmer’sBulletin No. 19, USDA, Washington, DC, 1901 (also, second revision ofFarmer’s Bulletin No. 127, dated 1908.)
USDA, Hall, Stanley A. The Place of Insecticides, in Yearbook ofAgriculture, 1964, USDA, Washington, DC, 1964
USDA, Quaintace, A. L. Information About Spraying for Orchard Insects, inYearbook of Agriculture, 1908, USDA, Washington, DC, 1908
USDA, Riley, C. V. Report of the Entomologist, in Report of theCommissioner of Agriculture, 1888, Washington, DC, 1888
Whitaker, Adelynne H. Pesticide Use in Early Twentieth Century: AnimalDisease Control, in Agricultural History, January, 1980.
Part 3 Pg. 1
PART THREE
PROFILE OF CURRENT OVERALL U.S. PESTICIDE USAGE
The purpose of this section is to present an overview of overall pesticide usage in the UnitedStates, covering the various types of pesticides regulated under FIFRA. For conventional/otherpesticides, information is also presented on quantities used and user expenditures by economic sector. Overall quantities used are viewed by type of land area where applied and a comparison is made ofU.S. conventional pesticide usage to World totals.
The profile information presented in this section is patterned after that already presented in themost recent “Pesticide Industry Market Report” published by the Agency which contains usageestimates through 1997. (EPA, November,1999) Most of the current numerical usage estimates andrelated profile information presented in this section of this report is contained in that earlier document. Presented below is a brief discussion of definitions used for pesticide types, economic sectors andsources of information. For further information on these aspects, reference is made to the latest“Market Report” ( EPA, November, 1999) and the section on “Approach and Data Sources”presented in Part Four of this report.
A.. Background on Pesticide Types and Usage Sectors
Pesticides of various types are used in most sectors of the U.S. Economy. In general terms, apesticide is any agent used to kill or control undesired insects, weeds, rodents, fungi, bacteria or otherorganisms. Thus, the term "pesticide" includes insecticides, herbicides, rodenticides, fungicides,nematicides, and acaricides as well as disinfectants, fumigants, wood preservatives and plant growthregulators. Pesticides play a vital role in controlling agricultural, industrial, home/garden and publichealth pests.
Many crops, commodities and services in the U.S. could not be supplied in an economicfashion without control of pests with chemicals or by other means. As a result of pesticide use, goodsand services can be supplied at lower costs and/or with better quality. These economic benefits frompesticide usage are not achieved without potential risks to human health and the environment due to thetoxicity and potency of pesticide chemicals. For this reason, the chemicals are regulated under thepesticide laws to avoid unacceptable risks. Below is an identification of the general types of pesticidesregulated under FIFRA.
Part 3 Pg. 2
1. General Pesticide Categories
Five general categories of pesticides are used in this report for reporting quantities used, andrelated information. They are as follows:
a. conventional pesticides,b. other pesticide chemicals,c. wood preservatives, d. specialty biocides, ande. chlorine/hypochlorites.
The first type, conventional pesticides, covers the majority of the active ingredients registered aspesticides (more than 800 out of nearly 900 active ingredients registered under FIFRA currently). These are the chemicals developed and produced primarily for use as pesticides and generally havelittle or no other applications or uses. The next type of pesticides, other pesticide chemicals, is forchemicals produced mostly for other purposes but which also happen to have useful applications aspesticides. Some examples of “other pesticide chemicals” are sulfur, petroleum and sulfuric acid, smallfractions of overall usage which are for pesticidal purposes. These “other pesticide chemicals” aregenerally formulated, marketed and used in a manner similar to conventional pesticides, contrary to theother, final three, types of pesticides, as noted below.
Wood preservatives are principally used in specialized industrial plants to treat wood so it canwithstand extended exposure to the outdoors, especially marine, aquatic and soil environments. Theprincipal chemicals used are creosote/coal tar/petroleum and arsenicals. Generally, the woodpreservatives are applied to wood by pressure treatment in kiln’s to obtain maximum penetration. Specialty biocides is a term used for antimicrobial chemicals used as disinfectants and sterilizers,including those to treat water in swimming pools, spas and industry. Chlorine and hypochlorites aregeneric chemicals, some fractions of which are also used as pesticides, principally to disinfect water andfor bleaching.
All of these categories of pesticides are regulated under the Pesticide Laws (principally theFederal Insecticide, Fungicide and Rodenticide Act FIFRA) administered by EPA in cooperation withother Federal Agencies (such as FDA and USDA) and the States. The separate quantities ofpesticide-type chemicals regulated by FDA (and USDA) apart from EPA are not included in numbersreported in this report, e.g., quantities of specialty biocides used as hospital/medical antiseptics,food/feed preservatives and cosmetics/toiletries.
Part 3 Pg. 3
2. Pesticide Classes
Conventional pesticides are customarily grouped into classes named for the types of targetpests they are designed to control. The estimates are also presented with breakouts for the varioustypes/classes of pesticides. In this report, conventional pesticides are separated into five classes asfollows: herbicides/plant growth regulators (H/PGR), insecticides/miticides (I/M), fungicides (F),fumigants/nematicides (F/N) and other conventional (OC). Other conventional (OC) includespesticides for rodents, molluscs, aquatic areas, fish/birds, insect growth regulators and othermiscellaneous pesticides. The “other pesticide chemicals” category is split into two classes as follows:sulfur/petroleum and other (which contains a number of chemicals/types as defined below Table 3-2 ). These particular types of classes are not used for the other general types of pesticides.
3. Economic Sectors
Quantities of pesticides used (and other parameters such as user expenditures) may be reportedwith separate breakouts for the economic sectors. In this report, the U.S. economy is divided intothree sector categories for reporting pesticide usage as follows: (a) agriculture; (b)industrial/commercial/governmental (professional market); and (c) home and garden (homeownerapplications, excluding applications to homes/gardens by professional applicators that are included inthe professional category). The estimates for agriculture include those by the farmer (or farmemployee) and also those done by commercial agricultural pesticide applicators (or other farmers forhire/barter). The specific definitions of the economic sectors are presented in Table 3-2 where U.S.usage of conventional pesticides and other pesticide chemicals is divided into the three economicsectors. Such breakouts are not available for the other general types of pesticides for which quantitiesused are presented later in this section.
B. Sources of Information
There are no programs at EPA or other agencies devoted specifically to estimation of theoverall pesticide market in quantitative and dollar terms each year. Accordingly, this report is preparedbased on the best information from the public domain and proprietary sources. A major effort wasmade to obtain information in addition to that already available in Pesticide Program files, libraries anddata bases. Numerous electronic and manual literature searches were performed in 1998 and 1999,with a particular eye toward obtaining information on historical pesticide usage. Site visits were madeto several Agency libraries in the Washington D.C. area including, USDA/Beltsville, USDA/ERS,USDA/South Building, Census Bureau, U.S. ITC and EPA main library. A wide variety of newliterature was assembled as result of the searches, particularly on historical usage and trends.
The Agency has available a wide variety of published and proprietary information on pesticideusage. Extensive files and library materials on pesticide usage are maintained at the Pesticide DataCenter, EPA/OPP/BEAD. For the agricultural sector, which accounts for a majority of use of
Part 3 Pg. 4
conventional pesticides, the Agency has available five national data bases/services including those in theU.S. Department of Agriculture plus a number of more specific and limited data sources. For thenon-agricultural sector, there is a similar number of sources of information. For both the agriculturaland non-agricultural estimates, use is made of proprietary data sources, with the permission ofvendors. The proprietary sources used by EPA are well known organizations, which are also utilized byregistrants and other private sector firms.
The methods used by the various sources of information to make estimates vary from largestatistically based grower/user samples or panels (e.g., 15,000-20,000 respondents annually) to use ofmore limited interview/survey approaches of growers, applicators, pesticide suppliers and pestmanagement consultants. Each source using a particular method must be considered on its merits injudging the usefulness and relevance to making usage estimates. Corroboration and cross checking areused where possible.
A brief summary of principal usage data sources available to Agency Staff is included inAppendix Three A of this report. The classification scheme for reporting usage discussed above issummarized in Appendix Three B. Also, there is further discussion of approaches used and datasources presented in Part Four of this report. In addition, text and table references are presentedthroughout the text and tables as needed.
The profile of U.S. pesticide usage and user sectors presented below in Part Three of thisreport (Tables 3-1 through 3-3) is centered on the year 1997 and is essentially as presented in the1996/97 Pesticide Market Report published as part of the EPA series covering years 1979 through1997. (EPA, November, 1999) A profile of U.S. pesticide usage by land-use type is presented inTable 3-4, which is an approximation based on most recent estimates of land use and pesticide usage,circa 1990's.
Part 3 Pg. 5
C. Current Overall U.S. Pesticide Usage, by General Type
More than 4.5 billion pounds of pesticide active ingredient are used in the U.S. in a currenttypical year. This figure is for the active ingredient only, which excludes the weight of the remainder offormulated products, i.e., the inert ingredients. Such “inerts” include a wide variety of compounds suchas diluents, carriers, stickers, propellants, etc. For 1997, the estimated total for all types of pesticides was 4.627 billion pounds (Table 3-1). The breakdown on this usage by general type of pesticides isshown in Table 3-1 and Figures 3-1a and 3-1b.
Conventional pesticides and "other pesticide chemicals" (e.g., sulfur, petroleum, etc.) accountfor about one-fourth of the total pesticide active ingredient used in the U.S. (1.231 billion pounds or 27percent of the total). Chlorine/hypochlorites are the leading type of pesticides in the U.S., with half ofthe U.S. total (2.459 billion pounds, or 53 percent of the total). Wood preservatives account for 14percent of the total with 665 million pounds of active ingredient used in 1997. Specialty biocides arethe smallest component of the total with 0.272 billion pounds, to make up the remainder of the U.S.total of 4.627 billion pounds in 1997.
The above aggregate quantities of pesticides used can be expressed on a per capita basis, toreflect the average volume used per person in the U.S. Figure 3-1c presents the results of suchcalculations for the U.S. for 1997. Overall usage was about 17.3 pounds per capita for all pesticidesregulated under FIFRA. For conventional pesticides, the figure was about 3.6 pounds per capita. More than nine pounds per capita of chlorine/hypochlorites were used in 1997.
Part 3 Pg. 6
Table 3-1 Overall U.S. Usage of Pesticide Active Ingredient, by General Type, l997 Estimates
Type Mil. Lbs. ActiveIngredient
Percent of Total
Conventional Pesticides 975 21
Other Pesticide Chemicals Sulfur, petroleum (oil, distillates, etc.), sulfuric acid, and other misc. chemicals used as pesticides
256 6
Wood Preservatives 1 665 14
Specialty Biocides by End Use
Swim pools, spas, ind. water treatment 2 186 4
Disinfectants and sanitizers 3 35 1
Other 4 51 1
Subtotal 272 6
Chlorine/ hypochlorites
Disinfection of potable and waste water 1,476 32
Bleaching disinfectant and pools 983 21
Subtotal 2,459 53
Total Regulated under FIFRA 4,627 100
SOURCES: Wood Preservatives–EPA estimate for 1997 is projected change from AWPI reported amount for 1996; Biocides–Kline & Co. Staff input; Chlorine/hypochlorites–EPA projections forward from estimates in report byCharles River Assoc’s., April, 1993.
NOTESTotals may not add due to rounding.1. Includes water and oil borne preservatives, fire retardants and creosote/coal tar/petroleum preservatives.2. Specialty biocides only. Does not include hypochlorite or chlorine consumption, which is reported
separately.3. Includes industrial/institutional application of household products. Specialty biocides only. Does not
include hypochlorite or chlorine consumption, which is reported separately.4. Includes biocides for adhesives and sealants, leather, synthetic latex polymers, metal working fluids, paints,
and coatings, petroleum products, plastics and textiles. Does not include: hospital and medical antiseptics,food and feed preservative, and cosmetics/toiletries, as they are regulated largely by FDA under the U.S.Food, Drug and Cosmetic Act, rather than FIFRA. FDA and EPA share regulatory responsibilities oversome of the specialty biocides reported in the table.
Part 3 Pg. 7
975
256
665
272
2459
4627
CONVENTIONAL
SULFUR, PETRO., ETC
WOOD PRESERVATIVES
SPECIALTY BIOCIDES
CHLORINE/HYPOCHLORITES
TOTAL UNDER FIFRA
Typ
e o
f P
esti
cid
e
0 1000 2000 3000 4000 5000
Million Pounds of Active Ingredient
Overall U.S. Usage of Pesticide Active Ingredient , by General Type, 1997 EstimatesFigure 3-1a
21.0%
6.0%
14.0%
6.0%
53.0%
Percent of Total Active Ingredient
CONVENTIONAL
SULFUR, PETRO., ETCWOOD PRESERVATIVES
SPECIALTY BIOCIDES
CHLORINE/HYPOCHLORITES
SOURCE: EPA Estimates, Table 3-1
Overall U.S. Pesticide Usage, Percentage by General Type, 1997 EstimatesFigure 3-1b
3.64
0.96
2.48
1.02
9.19
17.28
CONVENTIONAL
SULFUR, PETRO., ETC
WOOD PRESERVATIVES
SPECIALTY BIOCIDES
CHLORINE/HYPOCHLORITES
TOTAL UNDER FIFRATyp
e o
f P
esti
cid
e
0 5 10 15 20
Pounds of Active Ingredient Per Capita
Based on civilian population estimate of 267.7 million for 1997
Overall U.S. Usage of Pesticide Active Ingredient Per Capita ,by General Type, 1997 EstimatesFigure 3-1c
Part 3 Pg. 8
D. Volume of Conventional/Other Pesticides Used, by Class and Sector, 1997
The purpose of this section is to present estimates of the quantities of conventional/otherpesticide chemicals used in the U.S., by economic sector and pesticide class, for the year 1997. Estimates are not available, by economic sector, for the other general types of pesticides for whichquantities used were presented in Table 3-1. Quantities used are reported with separate breakouts forthe three economic sectors, which are specifically defined below Table 3-2. Home and garden refersto homeowner applications only (excluding applications to homes/gardens by professional applicatorswhich are covered the C/I/G category). The estimates for agriculture include those by the farmer (oremployee) and also those done by commercial agricultural pesticide applicators (or other farmers forhire/barter). The estimates are presented with breakouts for the five classes of conventional pesticidesand two classes of other pesticide chemicals. Major sources of information for the estimates of usageare noted below Table 3-2.
Agriculture dominates in usage of most classes of conventional and other pesticide chemicals asit accounted for 77 percent of active ingredient of such pesticides in 1997 (total of 944 million poundsof active ingredient). (Table 3–2) About one half of agricultural usage of pesticides is herbicides/plantgrowth regulators (470 million pounds out of a total of 944 million). The importance of herbicides inagriculture is a result of the widespread applications of such chemicals to the major field crops of corn,sorghum and soybeans, which are very large acreage crops. Fumigants/nematicides andsulfur/petroleum are also important in agriculture with about 140 million pounds of usage each (Table 3-2 and Figures 3-2a and 2b). They tend to be used on smaller acreage crops such as fruits, vegetablesand nuts, but at higher rates of chemical application per acre..
The industrial/commercial/governmental sector had estimated usage of 151 million pounds ofactive ingredient in 1997, which equaled 12 percent of the U.S. total (Table 3-2 and Figures 3-2a and2b). It's sector share was highest (about 25 percent) for insecticides/miticides and fungicides, followedby fumigants/nematicides (19 percent). Home and garden applications utilized an estimated 136 millionpounds of active ingredient in 1997, which equaled 11 percent of the total, just behind the professionalmarket (I/C/G) (Table 3-2). The largest market share for home and garden was for “other pesticidechemicals/other” pesticides due largely to use of moth treatment chemicals by homeowners.
The relative importance of pesticide usage in the various sector/class combinations can be seengraphically in Figures 3-2a and 2b. Agricultural usage is most dominant in herbicides/PGR’s,nematicides/fumigants and sulfur/oil.
Figure 3-2c depicts graphically the relative importance of “total conventional” and “other pesticide chemicals”, by sector for 1997. The professional market has the lowest share for “other”(14.6 percent), while home/garden is the highest (44.1 percent), due to extensive usage of mothproofing chemicals, to be discussed later in this report.
Part 3 Pg. 9
Table 3-2 Volume of Pesticide Active Ingredient Used in the U.S., by Type and EconomicSector, 1997 Estimates
Sector 3Pesticide Type Agriculture Ind./Comm./
Gov't. Home &Garden
Total
Mil. Lbs. Active IngredientConventional PesticidesHerbicides/Plant Growth Regulators 470 49 49 568Insecticides/Miticides 82 30 17 129Fungicides 53 20 8 81Fumigants/Nematicides 140 24 1 165Other 1 25 6 1 32 Total Conventional 770 129 76 975Other Pesticide ChemicalsSulfur/Oil 144 14 15 173Other 2 30 8 45 83 Total Other 174 22 60 256Total Conventional and Other 944 151 136 1,231
Percent of TotalConventional PesticidesHerbicides/Plant Growth Regulators 83 9 9 100Insecticides/Miticides 64 23 13 100Fungicides 65 25 10 100Fumigants/Nematicides 85 15 1 100Other 1 78 19 3 100 Total Conventional 79 13 8 100Other Pesticide ChemicalsSulfur/Oil 83 8 9 100Other 2 36 10 54 100 Total Other 68 9 23 100Total Conventional and Other 77 12 11 100
NOTES:Totals may not add due to rounding.Table does not cover industrial wood preservatives, specialty biocides and chlorine/hypochlorites.1 Includes rodenticides, molluscicides, aquatic, fish/bird pesticides, insect regulators, and
other miscellaneous pesticides.2. Includes sulfuric acid, insect repellents, zinc sulfate and other misc. chemicals produced largely for non-
pesticidal purposes. Moth control chemicals (e.g., paradichlorobenzine and napthaline) are included in totals
presented.3. Sector Definitions: Quantities and expenditures for pesticides in the U.S. are divided among economic
sectors as follows:
Agriculture–applications by owner/operators and custom/commercial applicators to farms andfacilities involved in production of raw agricultural commodities, principally food, fiber andtobacco; includes non-crop/post harvest usage as well as crop/field usage.Ind./Comm./Govt.–applications by owner/operators and custom/commercial applicators toindustrial, commercial and governmental facilities, buildings, sites and land; pluscustom/commercial applications to homes and gardens, including lawns.Home and Garden–homeowner applications to homes and gardens, including lawns; single andmultiple unit housing.
Part 3 Pg. 10
SOURCES:Estimates based on: American Crop Protection Association (ACPA) annual surveys, USDA/NASS Survey Reports (1996/98); inputs from Kline, Doane, and SRIConsulting; and USDA/ERS estimates (Ag. Handbook 712 series and preliminary values for 1996/97).
Part 3 Pg. 11
Herbicides/PGR's
Insecticides/Miticides
Fungicides
Fumigants/Nematicides
Other Conventional
Sulfur/Oil
Other Pesti. ChemicalsPes
ticid
e T
ype
0 100 200 300 400 500 600
Mil. Lbs. Active Ingredient
AgricultureInd./Comm./Gov't.Home & Garden
Excludes wood preservatives and biocides
Volume of Pesticide Active Ingredient Used in the U.S., by Type and Economic Sector, 1997 EstimatesFigure 3-2a
Agriculture
Ind./Comm./Gov't.
Home & Garden
Total
Herbicides/PGR's Insecticides/Miticides Fungicides Fumigants/Nematicides Other Conventional Sulfur/Oil Other Pesti. Chemicals
Other ConventionalSulfur/OilOther Pesti. Chemicals
Totals are millions of pounds active ingredient.Excludes wood preservatives and biocides
Volume of Pesticide Active Ingredient Usage in U.S.by Type and Economic Sector, 1997 EstimatesFigure 3-2b
Part 3 Pg. 13
81.6%
18.4%
AgricultureTotal: 944
85.4%
14.6%
Ind./Comm./Gov.Total: 151
55.9%44.1%
Home/GardenTotal: 136
79.2%
20.8%
All SectorsTotal: 1231
Total ConventionalTotal Other
Totals are millions of pounds active ingredient.Excludes wood preservatives and biocides
Volume of Pesticide Active Ingredient Used in U.S., Percentage Distributions, by Type and Economic Sector, 1997 EstimatesFigure 3-2c
Part 3 Pg. 14
E. Expenditures for Conventional/Other Pesticides by Type and Sector, 1997
The pesticide industry is quite significant in dollar terms. Annual expenditures by users ofpesticides totaled about $11.9 billion in 1997 (conventional pesticides plus sulfur, etc.). This estimateof total expenditures is shown in Table 3-3, with percentage breakdowns by type of pesticide(pesticide class) and economic sector. The definitions of economic sector and pesticide class are aspresented below Table 3-2. This type of user expenditure information has not been developed for theother types of pesticides covered in Table 3-1 (i.e., wood preservatives and biocides). The estimatesof user expenditures in Table 3-3 are based on a variety of sources, including USDA/ERS farmproduction expenses series (national totals only are published), ACPA annual surveys, and inputs fromKline, SRI, Doane and other sources.
Agriculture accounts for 70 percent of pesticide user expenditures as of 1997, with $8.303billion, followed by 17 percent for home/garden ($2.061 billion) and 13 percent forindustrial/commercial/governmental applications ($1.533 billion) (the I/C/G sector or “professionalmarket” as it is often termed) (Table 3-3 and Figures 3-3a and 3b). Insecticide expenditures arerelatively more important in the home and garden sector (67 percent of home and garden pesticideexpenditures) because of the quantities involved (larger percentage than for other types of pesticides,as indicated in Table 3-2), small unit quantities and relatively expensive formulations, e.g., aerosols. Agriculture dominates expenditures for herbicides with 82 percent and for fungicides with 79 percentdue to the large shares of active ingredient involved. (Table 3-2)
Herbicides (including plant growth regulators) lead other types in overall expenditures with 58percent for all sectors combined, and especially for agriculture with 68 percent of its total for all types(Table 3-3 and Figure 3-3c). Insecticides (including miticides) were second in importance with 30percent of the total for all sectors, far ahead of fungicides and other pesticides. Herbicides leadexpenditures for agriculture, while insecticides/miticides lead for the other two sectors (Table 3-3 andFigure 3-3d).
The pesticide user expenditures for agriculture (a total of $8.303 billion) equal an average ofabout $4,300 per farm in the U.S. for 1.925 million farms. The total for the I/C/G sector ($1.533billion) equals about $38,000 per commercial pesticide application firm (assuming 40,000 such firms inU.S.). (There were an estimated 33,100 certified/commercial pesticide application firms in the U.S.for four major certification categories according the EPA applicator survey for 1993; EPA, August,1995.) For homeowner applications only, a total of $2.061 billion equals about $21 per household(assuming 100 million households). (This does not include expenditures for pesticides applied tohomes and gardens by others for hire.) The U.S. total of $11.897 billion for 1997 equals about $44per capita in the U.S. (assumes about 268 million population).
Part 3 Pg. 15
Table 3-3 User Expenditures for Conventional and "Other " Pesticides in U.S., By Class and Economic Sector , 1997Estimates
Pesticide Type Agriculture Ind./Comm./Gov't. Home & Garden Total
Millions of DollarsAgriculture Ind./Comm./Gov't. Home & Garden Total
Herbicides/PGR's $5,610.00 $743.00 $493.00 $6,846.00Insecticides/Miticides $1,599.00 $576.00 $1,378.00 $3,553.00Fungicides $632.00 $144.00 $26.00 $802.00All other $462.00 $70.00 $164.00 $696.00Total $8,303.00 $1,533.00 $2,061.00 $11,897.00Pesticide Type Agriculture Ind./Comm./Gov't. Home & Garden Total
Class as Percent of Sector TotalHerbicides/Plant Growth Regulators 68 48 24 58Insecticides/Miticides 19 38 67 30Fungicides 8 9 1 7All Other 6 5 8 6Total 100 100 100 100
SOURCE: EPA estimates based on American Crop Protection Association (ACPA) annual surveys, USDA/ERS data series andinput from Doane, Kline, and SRI Consulting. Data published in 1996/97 Market Report, EPA, November, 1999).
Part 3 Pg. 16
6846
3553
802
696
11897
Herbicides/PGR's
Insecticides/Miticides
Fungicides
All other
TotalPes
ticid
e Ty
pe
0 2000 4000 6000 8000 10000 12000 14000
Millions of Dollars
AgricultureInd./Comm./Gov't.Home & Garden
Excludes wood preservatives and biocides
U.S. User Expenditures for Pesticides, by Class and Sector, 1997 EstimatesFigure 3-3a
Agriculture
Ind./Comm./Gov't.
Home & Garden
Herbicides/PGR's Insecticides/Miticides Fungicides All other Total
5610 1599 632 462 8303
743 576 144 70 1533
493 1378 26 164 2061
6846 3553 802 696 11897
Part 3 Pg. 17
830369.8%
153312.9%
206117.3%
Total: 11897
AgricultureInd./Comm./Gov't.Home & Garden
Millions of DollarsExcludes wood preservatives and biocides
U.S. Pesticide User Expenditures by Sector, 1997 EstimatesFigure 3-3b
684657.5%
355329.9%
8026.7%
6965.9%
Total: 11897
Herbicides/PGR'sInsecticides/MiticidesFungicidesAll other
Millions of DollarsExcludes wood preservatives and biocides
U.S. Pesticide User Expenditures by Type of Pesticide, 1997 EstimatesFigure 3-3c
Part 3 Pg. 18
67.6%
19.3%
7.6% 5.6%
AgricultureTotal: 8303
48.5%37.6%
9.4% 4.6%
Ind./Comm./Gov't.Total: 1533
23.9%
66.9%
1.3%8.0%
Home & GardenTotal: 2061
57.5%29.9%
6.7% 5.9%
All SectorsTotal: 11897
Herbicides/PGR'sInsecticides/MiticidesFungicidesAll other
Totals are millions of dollars.Excludes wood preservatives and biocides
U.S. User Expenditures for Pesticides, by Class and Sector, 1997 EstimatesFigure 3-3d
Part 3 Pg. 19
F. Overview of U.S. Land Area and Pesticide Usage
The purpose of this section is to consider the distribution of pesticide usage across the different types ofland in the U.S. Estimates are made only for conventional/other pesticide chemicals because limited informationexists to break out wood preservatives and biocides, by type of land use. The latest published estimates of U.S.land area by type of land use (12 types) were used (USDA/ERS, Handbook 712, July, 1997) along withestimates of water areas by Kellogg (1994). Usage of total active ingredient as estimated in the Pesticide MarketReport for the latest year (1997) was used as a basis for the breakouts by land-use type. The breakouts weremade primarily on the basis of the following sources of information: Doane Profile, USDA/ERS/NASS reports,particularly on percent of crops treated, and Kline Professional Market Reports. Estimates were made both foracreage treated (one or more times, i.e., base acres treated) and quantity of active ingredient used. The estimatesof U.S. land area are quite precise, while those for acreage treated and quantities applied by land area should beconsidered as approximate values as a certain amount of judgement was involved in arriving at the figures.
The total surface area of the U.S. is 1,940 million acres, including 49 million acres of water areas(estimates for 1992) (Table 3-4). About one-fourth of U.S. land area is in cropland (460 million acres). Grassland pasture/range (589 million acres) and forest land (559 million acres) are the leading land use categoriesand together account for nearly 60 percent of total surface area. Urban land accounts for only about threepercent of U.S. land area with 58 million acres. The urban land includes an estimated 24 million acres for urbanhomes and gardens, plus 34 million acres for other urban uses such as commercial, industrial and governmental(Table 3-4 and Figure 3-4a).
Conventional/other pesticide chemicals are applied to roughly one-third of a billion acres annually, as ofthe mid to late-1990's, which equals about 17 percent of the total surface area of 1.94 billion acres. Thebreakouts of acreage treated and usage of active ingredient by land-use type can be seen in Table 3-4 and Figure3-4b.
Cropland is the leading type with 256 million acres treated, using 881 million pounds of active ingredientper year. Other types of farm land (especially grassland pasture and range) and forest land are treated withpesticides much less intensively. Miscellaneous farmland, which includes farmsteads, livestock, poultry, storage,commodity storage facilities, etc. account for an estimated 55 million pounds per year of active ingredient per yeareven though there are only about 5 million acres involved.
Urban homes and gardens account for about 1.2 percent of the land area, but 2.7 percent of acreagetreated and 12.1 percent of active ingredient used (9 million acres treated with 148 million pounds of activeingredient) (Table 3-4). Other urban land also accounts for disproportional amounts of usage as it has about 1.7percent of the land area, but 6.0 percent of acreage treated and 6.2 percent of active ingredient usage (20 millionacres and 120 million pounds of active ingredient). Transportation land (including rights of way for electricaltransmission, etc.) are quite often treated (7 million of 25 million acres each year) but relatively small amounts ofactive ingredient are used (only 11 million pounds active ingredient).
Agricultural cropland is the most commonly treated major land type. An estimated 300 million acres are
Part 3 Pg. 20
treated with pesticides each year (about 90 percent). (Table 3-4 and Figures 3-4a and 4b)
On the average, cropland receives about 3 pounds of active ingredient per acre, given that agriculturalusage of pesticides is more than 900 million pounds per year. Urban land is often treated (25 out of 58 millionacres) and has higher rates of usage than most other types of land.
Part 3 Pg. 21
Table 3-4 Overview of U.S. Land Area, by Type of Land, and Conventional/Other Pesticide Usage, Circa 1990's
Land Use Type Total Acreage,Millions
Characterization of Site/Usage AcreageTreated,Millions
Total Land Area 1,891 48 statesTotal Farmland 1,055 273 944 Cropland, Total 460 256 881 Cropland for Crops 337 Accounts for majority of usage 240 870 Cropland Idled 56 Most often treated for weed control 10 7 Cropland for Pasture 67 Limited pesticide applications 6 4 Grassland Pasture & Range 589 Seldom treated 12 8 Misc. Farmland 6 Farmsteads, livestock, poultry, storage, facilities,
etc.5 55
Forest-use Land 559 Mostly herbicide treatments; a few insecticidetreatments
4 4
Forest, Grazed 145 Not grazed 414Urban Homes and Gardens 24 Residential, including applications by
professional applicators9 148
Other Urban/Industrial Land 34 Commercial, industrial, governmental 20 120Transportation 25 Electrical, pipeline, rail and roadways 7 11Other Land 194 3 5 Recreation/Wildlife 87 Often publicly owned National Defense areas 19 Misc. Other Land 88 Marshes, open swamps, etc.
NOTE: Usage does not include industrial wood preservatives and all biocides.
SOURCES:Land areas based on USDA Agric. Handbook 712, July, 1997; EPA January 1976; and Kellogg, 1994.Usage estimates by land type are based on sector totals published in EPA market report for 1997 (EPA, January, 2000). Breakouts of non-agricultural acreage treated and usage of active ingredient are based largely on Kline Professional Market reports for mid tolate 1990's.Agricultural breakouts based on Doane Profile estimates.
Part 3 Pg. 22
49337
5667
5896
5592434
25194
Water AreasCropland for Crops
Cropland IdledCropland for Pasture
Grassland Pasture & RangeMisc. Farmland
Forest-Use LandUrban Homes & Gardens
Other Urban/Industrial LandTransportation
Other Land
Use
Typ
e
0 100 200 300 400 500 600 700
Millions of Acres
SOURCE: See Table 3-4.
U.S. Land Area, Acreage by Type of Land Use, Circa 1990'sFigure 3-4a
Ch. 3 Pg. 23
Water Areas
Cropland for Crops
Cropland Idled
Cropland for PastureGrassland Pasture & Range
Misc. FarmlandForest-Use Land
Urban Homes & Gardens
Other Urban/Industrial Land
Transportation
Other Land
Use
Typ
e
0 100 200 300 400 500 600 700
Millions of Acres
Acres TreatedNot Treated
NOTE: Excludes wood preservatives and biocidesSOURCE: See Table 3-4.
U.S. Surface Acreage Treated with Conventional/Other Pesticides, Circa 1990'sFigure 3-4b
Acres Treated
Not Treated
Total
Water Areas Cropland for CropsCropland IdledCropland for PastureGrassland Pasture & RangeMisc. FarmlandForest-Use LandUrban Homes & GardensOther Urban/Industrial LandTransportation Other Land
8 240 10 6 12 5 4 9 20 7 3
41 97 46 61 577 1 555 15 14 18 191
49 337 56 67 589 6 559 24 34 25 194
Ch. 3 Pg. 24
9870
748
554
148120
115
Water Areas
Cropland for Crops
Cropland Idled
Cropland for Pasture
Grassland Pasture & RangeMisc. Farmland
Forest-Use Land
Urban Homes & Gardens
Other Urban/Industrial Land
Transportation
Other Land
Use
Typ
e
0100
200300
400500
600700
800900
1000
Millions of Pounds AI
NOTE: Excludes wood preservatives and biocides.SOURCE: See Table 3-4.
Volume of Conventional/Other Pesticide Active Ingredient Usage, by Land-Use Type, Circa 1990'sFigure 3-4c
Ch. 3 Pg. 25
G. Current U.S. Pesticide Usage Compared to the World
The U.S. is a major factor in the world market for pesticides. The U.S. accounts for about one thirdof pesticide user expenditures world wide ($11.987 billion out of $37.048 billion) in 1997 for conventionaland other pesticide chemicals (excluding wood preservatives and all biocides) (Table 3-5). The highestmarket share for the U.S. was for herbicides/plant growth regulators (41 percent) and the lowest was forfungicides (13 percent).
In terms of active ingredient volume, the U.S. accounts for 22 percent of the world total with 1.231billion pounds out of 5.684 billion pounds (Table 3-5 ). The U.S. accounts for 25 percent of herbicides used,but only 9 percent of the insecticides, world wide.
The relative importance of U.S. user expenditures and active ingredient used in 1997 is depicted inFigures 3-5a, b and c.
Ch. 3 Pg. 26
Table 3-5 U.S. and World Pesticide Sales at User Level, 1997 Estimates
Pesticide Class U.S. Market World Market U.S. % of WorldMarket
1 Other includes all other conventional pesticides and other pesticide chemicals as defined in Table 3-2. Wood preservatives and biocides are not included.
Ch. 3 Pg. 27
0
10000
20000
30000
40000
Mill
ions
of D
olla
rs
Excludes wood preservatives and biocides
U.S. and World Pesticide Sales at User Level, 1997 EstimatesFigure 3-5a
U.S.
World
Herbicides/PGR's Insecticides/Miticides Fungicides Other Total Conv. & Other
6846 3553 802 696 11897
16886 11592 6037 2533 37048
0
1000
2000
3000
4000
5000
6000
Mill
ions
of P
ound
s
U.S.World
Excludes wood preservatives and biocides
U.S. and World Pesticide Active Ingredient Usage, 1997 EstimatesFigure 3-5b
U.S.
World
Herbicides/PGR's Insecticides/Miticides Fungicides Other Total Conv. & Other
574 133 82 458 1247
2254 1470 539 1421 5684
0
10
20
30
40
50
Per
cent
of W
orld
U.S. Percent of $U.S. Percent of AI
U.S. Percentage of World Pesticide Active Ingredient Usageand User Expenditures, 1997 EstimatesFigure 3-5c
U.S. Percent of $
U.S. Percent of AI
Herbicides/PGR's Insecticides/Miticides Fungicides Other Total Conv. & Other
41 31 13 27 32
25 9 15 32 22
Part 4 Pg. 1
PART FOUR
LONG TERM TRENDS IN OVERALL U.S. PESTICIDE USAGE
The purpose of this section is to present information on trends in overall pesticide usage in theU.S. during roughly the last seven decades. Estimates of active ingredient usage are presented forconventional pesticides and other pesticide chemicals for three year periods, starting with the periodending with 1931 and concluding with the period ending in 1997. Totals are presented along withseparate breakouts by economic sector and type (class) of pesticide chemicals. Also, a separateseries was developed showing conventional pesticide usage broken down by chemical family (type ofchemistry of active ingredient) for each class of pesticides for every fifth year, 1930 through 1995, and1997. Annual estimates are presented for user expenditures for pesticides for the period of 1979through 1997. Estimates could not be made for years prior to 1979 for lack of information on non-agricultural pesticide expenditures for the earlier years
A. Approach and Data Sources
Information has been assembled on quantities of pesticide active ingredient used in U.S. goingback as far as possible in time so as to be able to make comprehensive usage estimates for earliestpossible years. This was done as part of a long term effort on the part of the author as well as specificresearch for this report. The result has been the location of enough information to make estimates ofoverall usage of conventional pesticides and other pesticide chemicals back to 1929. In this section,estimates are presented for conventional/other pesticide usage based on annual estimates starting with1929. The year 1929 was selected as the first year of the data series because it was the first year ofusage reported in a study for EPA by Battelle which contained estimates of usage from 1929 through1971 (Battelle, Feb., 1975). Estimates of usage by class and sector already have been published bythe Agency in the “Pesticide Market Series” (most recent edition for 1996/97) for each year from 1979through 1997 (EPA, November, 1999). Basically, a major thrust of this project has been to take thecoverage of the existing series for 1979/97 series back to1929.
The approach used was to assemble reported values for usage from all available sources andtabulate them on a worksheet showing the values by particular year and type of pesticide (along withsector, chemical family, etc. as available from the particular source). Once all of the entries were madefrom available sources, efforts were made to reconcile differences and conflicts which often occurred inthe reported values. Numbers were verified from their sources, with due consideration to datadefinitions. Taking into account apparent trends and relationships in the various tabulated values,estimates were developed for each year, by pesticide class and sector utilizing the best availableinformation and judgement of the analyst. Then, three-year averages were computed for purposes ofpresentation in this report for the periods ending on three year intervals from 1931 through 1997. This
Part 4 Pg. 2
was done to condense the volume of data for reporting and to avoid false precision suggested by annualestimates over the nearly 70 year period. The resulting data series is reported variously in this report,showing usage of active ingredient per year by class and sector for three year periods covering1929/97.
Estimates of active ingredient usage by chemical family were developed for each fifth year forthe period 1930 through 1995 and for 1997 based on best available information on individual chemicalsand chemical groupings or families. Such breakouts were made only for the four major conventionalpesticide classes (herbicides/PGR, insecticides/miticides, fungicides and fumigants/nematicides). Inother words, chemical family breakouts were not developed for conventional "other pesticidechemicals" and "other pesticides" as defined in Part Three of this report (especially pages 1 through 3and Table 3-2).
The numbers presented in this report should be considered approximate values rather thanprecise ones with known statistical properties. The author believes the numbers are reasonableapproximations and representative of trends over time. The presentation of the results in this section isprimarily with reference to charts, which contain essential values from the basic tables that are includedas referenced appendices to this report.
A wide variety of sources was utilized in developing the estimates covering the years 1929through 1997. Some of the principal sources were: Battelle study covering 1929-1971 (1975); annualreports of the commissioner of agriculture going back to as early as 1865 and yearbooks of agriculturefor more recent years; USDA “Agricultural Statistics” reports which replaced the yearbook ofagriculture as a reporting medium for agricultural statistics in the mid-1930's; US Bureau of the Censusreports and those of the U.S. Tariff Commission, often summarized in the USDA “Agricultural StatisticsReports” from 1936 on; periodic USDA surveys, particularly those of a comprehensive natureconducted in the 1960's and early 1970's; SRI Chemical Economics Handbook estimates covering theperiod since 1965; SRI contract study for CEQ covering period from 1950 to 1970; RVR Consultantsestimates of usage for various years 1972 through 1986; Doane Market Research reports and database covering late 1960's through 1997 (particularly the last 15 years); periodic reports on agriculturalpesticide usage by the National Center for Agricultural Policy (1980's and early 1990's, funded byEPA and others); USDA/ERS estimates of comprehensive crop use of pesticides based onextrapolations of USDA’s survey results to all crop acres; and EPA/OPP staff estimates published forthe period from 1979 through 1997 in the latest "Pesticide Market Report" (Aspelin and Grube, EPA,November, 1999).
Other key sources included: USDA/Commodity Stabilization Service (later ASCS) PesticideSituation reports (starting with 1953/54) and related Pesticide Reviews which were published through1980; a book by Harold H. Shepard which contains reported/estimated values for most pesticides as ofabout 1950, and earlier years (Shepard, 1951); (Shepard's work contained estimates by crop and non-crop use in many instances, which helped in making sector breakouts of usage; an article by R.C.
Part 4 Pg. 3
Roark, also as noted below (May, 1935); a book by Donald E.F. Frear on the chemistry ofinsecticides and fungicides (1942); an EPA-funded study report by ICF containing an economic profileof the pesticide industry, including long term statistics on pesticide usage by chemical) (ICF, August,1980); and EPA-sponsored surveys of pesticide usage (mid 1970's, all sectors), late 1980's (comm.applicators), 1990 (home and garden) and 1992 (certified/commercial applicators).
The same basic sources of information used for development of the estimates for usage for thethree year averages covering 1929/97 were used for developing the breakouts of usage by chemicalfamily for 1930-95 and 1997. The Chemical Economics Handbook Series by SRI published variouslyfrom the 1970's to date, was particularly useful for the years 1965 through 1997. (SRI, variouseditions, 1970-99) The pesticide market studies by RvR Consultants covering usage for 1974 through1986 contained usage estimates by chemical/chemical family or class, as did the study for the Councilfor Environmental Quality by SRI in 1972, which contained estimates for the years 1950 through 1970. (SRI, April, 1972) The USDA Pesticide Situation Reports and Reviews coving the years from1952/53 (with estimates back to the late 1940's in some instances) through 1980 were quite useful.Profiles of pesticide usage, by chemical/chemical family were developed by USDA staff for 1934(R.C. Roark, Industrial and Chemical Engineering, May, 1935), and for 1936, 1941 and 1944 aspublished in USDA Agricultural Statistics (1938, page 525; 1942, page 690; and 1945, page 468). EPA registration data bases and the Merck Index were used to check on when chemicals weredeveloped or patented as pesticides in some cases.
A data base was developed to compute net usage of pesticides, by chemical or family, basedon data developed by the U.S. Tariff Commission and by the U.S. Bureau of Census as reporteddirectly by those agencies and also as summarized in the U.S. Agricultural Statistics reports coveringthe years 1919 through the early 1960's. After that time, the reported numbers increasing do not permit detailed breakouts by chemical or family as was the case for earlier years.
The bibliography to this report contains a comprehensive listing of sources, some of which arenot discussed or noted above.
Time series resulting from the above noted approach are contained in Appendix 4 (usageestimates by class and sector, three year periods ending 1931-97, all conventional/other pesticidechemicals). Usage estimates by class and chemical family or group, stated fifth years 1930-95 and1997, conventional pesticides only are presented in Figures 4-7/10.
Part 4 Pg. 4
B. Total Usage of Conventional/Other Pesticides, 1929/1997
1. Aggregate Usage Trends
Usage of conventional pesticides and other pesticide chemicals was well underway by thebeginning of the 1930's. By that time, there was widespread usage of calcium arsenate, lead arsenate,copper sulfate and mercury compounds for insecticides and/or fungicides, principally to protectagricultural crops, as will be discussed further in part Five of this report. Estimated usage ofconventional/other pesticide chemicals was 579 million pounds per year by 1929/31. (Figure 4-1) Usage then declined markedly during the next three year period (to 409 million pounds per year), nodoubt due to the economic collapse of the Great Depression. (Figure 4-1) Following the low point inthe early 1930's, usage increased very significantly to more than double the low point, continuing through WWII and the latter 1940's (to just under 1.0 billion pounds per year). There was a rathersteady increase until around 1960 to a level of about 1.3 billion pounds, followed by some decline by1965/67. Then growth occurred again until usage peaked out at nearly 1.5 billion pounds per year by1977/79. Since that time, usage has declined to some degree, holding at about 1.2 billion pounds peryear during the last decade. The changes in usage by sector and pesticide class which are behind thesechanges will be discussed below.
2. Trends for Conventional and Other Pesticide Chemicals Separately
Figure 4-1 depicts trends separately for conventional pesticides and other pesticide chemicalsover the seven decades. Conventional pesticide usage was generally in the 200-400 million poundrange until the latter 1950's at which point it expanded consistently to a peak in the late 1970's/early1980's at about 1.l billion pounds per year. Since the mid-1980's, conventional pesticide usagedeclined somewhat and has been holding slightly under 1.0 billion pounds.
Usage of other pesticide chemicals generally equaled or exceeded conventional pesticidesduring the period from 1940 through 1964, with usage generally in the range of 500 to 750 millionpounds of active ingredient per year. Since that time, such usage has generally declined and has held ata level of about 250 million pounds per year during the last decade. The sharp decline in the usage ofother pesticide chemicals was due to greatly reduced use of sulfur in agriculture between 1964 and1967, as is noted further below in this section.
Part 4 Pg. 5
579
409 47
8
646
870 99
0
951 10
71
1045
1225 13
38
1267
1072 11
71 1305 13
86 1464
1422
1344
1236
1211
1211
1232
19311934
19371940
19431946
19491952
19551958
19611964
19671970
19731976
19791982
19851988
19911994
1997
Three Years Ending
0
500
1000
1500
2000
Mill
ions
of P
ound
s P
er Y
ear
Other ChemicalsConventional
Excludes wood preservatives and biocides
Volume of Pesticide Active Ingredient Usage in U.S., Conventional and Other Pesticide Chemicals, With TotalAll Economic Sectors, Three Year Periods Ending 1931-97Figure 4-1
3. Trends in Conventional/Other Pesticide Usage Per Capita
One way to place trends in pesticide usage into perspective is to relate them to the growth inpopulation by computing usage per capita. Aggregate usage of active ingredient divided by totalpopulation provides an average amount of pesticide active ingredient used to meet chemical pestcontrol needs in general without regard to the distribution among the various types of users. Figure 4-2contains a set of per-capita usage figures for the seven decades based on the aggregate numberpresented above in this section and U.S. Bureau of Census estimates of civilian population.
Figure 4-2 shows the following: • that usage per capita for conventional/other pesticide chemicals increased sharply until
the end of WWII when it was about 7.4 pounds, and held somewhat below that until1959/61;
• there was a decline in the mid-1960's to about 5.5 pounds per capita (primarily asresult of reduced sulfur usage) and a trend upward again to about 6.6 pounds percapita in 1977/79;
• and since then, there has been a rather consistent decline to a level of about 4.6 poundsper capita most recently.
Part 4 Pg. 7
4.70
3.273.73
4.94
6.47
7.42
6.486.95
6.46
7.167.43
6.72
5.485.81
6.23 6.43 6.596.20
5.705.10
4.86 4.70 4.64
19311934
19371940
19431946
19491952
19551958
19611964
19671970
19731976
19791982
19851988
19911994
1997
Three Years Ending
012345
6789
Pou
nds
Per
Cap
ita P
er Y
ear
Other ChemicalsConventional
Excludes wood preservatives and biocides
Volume of Pesticide Active Ingredient Usage Per Capita in U.S., Conventional and Other Pesticide Chemicals with Total,All Economic Sectors, Three Year Periods Ending 1931-97Figure 4-2
C. Usage of Conventional/Other Pesticides by Sector, 1929/97
Separate charts are presented in this section to depict trends for conventional pesticides, otherpesticide chemicals and the total of these.
1. Conventional Pesticides
Conventional pesticide usage, which currently accounts for four-fifths of the total including otherpesticide chemicals (as defined in Part Three of this report), has increased from a low of about 185million pounds per year in the early 1930's to a high of about 1.1 billion pounds per year during the late1970's/early 1980's. (Figure 4-3) Most of the growth was as result of increased usage for agriculturalpurposes between 1960 and 1980, although usage also increased for the I/C/G sector and H/G sector. Agricultural usage of conventional pesticides declined briefly after WWII to about 230 million poundsper year and then increased rather steadily to more than 800 million pounds per year around 1977/82. After that it generally has been in the range of 700 to 800 million pounds, with some slight trend upwardmost recently.
Part 4 Pg. 9
289
185 24
7
282 38
0 442
354 400
401 46
8 558
589 68
4 755 83
9
1006 11
12
1113
1059
965
968
965
986
19311934
19371940
19431946
19491952
19551958
19611964
19671970
19731976
19791982
19851988
19911994
1997
Three Years Ending
0
500
1000
Mill
ions
of P
ound
s
Home/GardenInd./Comm./Gov.Agriculture
Excludes wood preservatives and biocides
Volume of Conventional Pesticide Active Ingredient Usage in U.S.,by Economic Sector, Three Year Periods Ending 1931-97Figure 4-3
The trend in usage of other pesticide chemicals primarily reflects changes in the use of sulfurand petroleum. (Figure 4-4) Usage of other pesticide chemicals increased notably until about 1960(when about 780 millions pounds per year were used) and then declined rapidly by the mid-1960'swhen about half the former amounts were used (e.g., 388 million pounds). Since that time, usage hasdeclined further, to about 250 million pounds per year during most recent years. No doubt the declinesover the years since the 1960's are due to the replacement of sulfur/oil and other such basic chemicalswith modern conventional pesticides.
Part 4 Pg. 11
290
224
230
365
491 54
7 597 67
0
644
757
780
678
388 416 46
5
380
352
309
285
271
243
246
246
19311934
19371940
19431946
19491952
19551958
19611964
19671970
19731976
19791982
19851988
19911994
1997
Three Years Ending
0100200300400500600700800900
Mill
ions
of P
ound
s Home/GardenInd./Comm./Gov.Agriculture
Excludes wood preservatives and biocides
Volume of Other Pesticide Chemicals Active Ingredient Usage in U.S.,by Economic Sector, Three Year Periods Ending 1931-97Figure 4-4
3. Conventional Plus Other Pesticide Chemicals, by Economic Sector
Figure 4-5 contains the total of conventional and other pesticide chemical usage for the1929/97 period as discussed above for the two individual components. Notable features of the figureare the dip in agricultural usage during the late 1960's (to a level of 675 million pounds per year)followed by increases to about 1.1 billion pounds per year by around 1980, with somewhat lowerlevels since. Ind./comm./gov. usage per year has declined rather consistently since the late 1970's.
Part 4 Pg. 13
579
409 47
8 646 87
0 990
951 10
71
1045 12
25 1338
1267
1072 11
71 1305 13
86 1464
1422
1344
1236
1211
1211
1232
19311934
19371940
19431946
19491952
19551958
19611964
19671970
19731976
19791982
19851988
19911994
1997
Three Years Ending
0
500
1000
1500
2000
Mill
ions
of P
ound
s
Home/GardenInd./Comm./Gov.Agriculture
Excludes wood preservatives and biocides
Volume of Total Pesticide Active Ingredient Usage in U.S.,by Economic Sector, Three Year Periods Ending 1931-97Figure 4-5
D. Usage of Conventional/Other Pesticide Chemicals, by Type of Pesticide, 1929/97
Figure 4-6 presents a breakdown of conventional/other pesticide usage by pesticide type(class) for the period since 1929, in three year periods. The following observations can be made:
• most of the growth in usage per year was due to the increased usage of herbicides (andPGR’s) starting with the advent of the synthetic organic pesticide industry (as WWIIconcluded); (there was a peak of about 625 million pounds per year in early 1980's);
• decreased usage of sulfur/oil occurred since the early 1960's; • there were rather consistent increases in usage of fumigants/nematicides for the last
three decades, especially the last few three year periods; and• there was declining usage of insecticides/miticide active ingredient, as chemicals with
lower application rates have been adopted during the last 15 years.
Part 4 Pg. 15
579
409 47
8
646
870 99
0
951 10
71
1045
1225 13
38
1276
1085 11
81 1322 14
11 1471
1422
1344
1236
1211
1211
1232
19311934
19371940
19431946
19491952
19551958
19611964
19671970
19731976
19791982
19851988
19911994
1997
0
500
1000
1500
0
Mill
ions
of P
ound
s Other ChemicalsPetroleum/OilSulfurOther ConventionalFumigant/NematicideFungicideInsecticide/MiticideHerbicide/PGR
Excludes wood preservatives and biocides
Volume of Pesticide Active Ingredient Usage in U.S., All Economic Sectors, by Type of Pesticide,Three Year Periods Ending 1931-97Figure 4-6
Herbicide/PGRInsecticide/MiticideFungicideFumigant/NematicideOther ConventionalTotal ConventionalSulfurPetroleum/OilOther ChemicalsTotal Non-conventionalGrand Total
E. Trends in The Types of Chemistry Being Used as Pesticides, 1930-97
The types of chemicals used as active ingredients in pesticides have changed greatly since the1930's. In general, inorganic chemicals have declined in use and synthetic organic chemicals have takenover increasingly since the advent of the synthetic organic chemical industry starting in the mid-1940's. In this section, separate charts are presented showing trends in conventional pesticide usage in theU.S., by chemical family, for each of the four major classes of pesticides, since 1930. The designatedFigures which contain the charts are based on Appendix Table 4-B, which shows the principal chemicalactive ingredients included in the various chemical families or groups, along with estimated usagevolume. The principal chemicals in each family noted in Appendix 4-B are listed in alphabetic order,not necessarily in order of importance or usage within the family or group. Also, readers should becautioned that the values presented are only in terms of volume (weight) of active ingredient used. Accordingly, they do not reflect the relative importance of the pesticides with low volume applicationrates, which are common with many of the newer herbicides and insecticides. Unfortunately, it isbeyond the scope of this study to develop other indicators to deal with this aspect, such as acretreatments or dollar expenditures, by pesticide family.
1. Herbicides/Plant Growth Regulators (H/PGR's)
Figure 4-7 shows the limited usage of herbicides through1945, some growth by 1960 andthen dramatic increases until about 1980. Additionally, the following can be observed:
• relatively small amounts of inorganics (e.g., sodium azide and sodium arsenite) were inuse prior to the rapid growth of herbicide usage after 1960 and some inorganicscontinue to be used;
• the carboxylic acids were the first major herbicide group to emerge (largely due to thephenoxies, such as 2,4-D and 2,4,5-T) and continue to be important due to the usageof glyphosate as well as 2,4-D and others;
• the heterocyclic nitrogens, most notably the triazines, which emerged in the 1950's and1960's, became the leading herbicide family based active ingredient, which they still arein the 1990's;
• the amides, between 1960 and 1980, became the leading herbicide family and continueto account for more than 100 million pounds of active ingredient per year; (Acetochloris replacing alachlor within the amides.) and;
• the ureas, starting about 1955, and the phenyl ethers (about 1975), are examples ofnewer herbicides with small amounts of active ingredient usage, but large acreagestreated due to low application rates.
Volume of Conventional Herbicide/Plant Growth Regulator Active Ingredient Usage in U.S., All Economic Sectors, by Chemical Family or Group, Stated Years, 1930-97 Figure 4-7
Figure 4-8 shows trends I/M usage between 1930 and 1997 by chemical family in terms of active ingredient used. The pattern ininsecticide usage has been from dominance by inorganics until about 1950, followed by the organochlorines (led by DDT) through themid-1970's and then organophosphates became the leading insecticide family in terms of active ingredient usage. The following can alsobe noted:
• arsenical insecticides (particularly calcium and lead arsenates) were already in common use by 1930 with usage of more than 150million pounds per year and were the leading chemical family by far; their usage declined quite notably, by about 90 percent, by1955 as the organochlorines predominated;
• DDT came on stream by 1945 and reached its maximum usage around 1960; it was essentially no longer in use by the mid-1970's;
• other organochlorines, such as chlordane and toxaphene, increased in usage through the mid-1970's but declined to only a fewmillion pounds per year by 1990;
• botanicals, such as pyrethrum, nicotine and rotenone, were important insecticides already by 1930; their use along with otherbotanicals and biopesticides increased in usage to 28 million pounds in 1945, after which such usage declined;botanicals/biopesticides of various types have been in use within the range of 3 to 5 million pounds per year since 1965. Thesefigures do not reflect pesticide active ingredient generated by genetically modified organisms regulated as pesticides (GMO's);
• synthetic pyrethroids, which were in common use by 1980, account for a limited share of active ingredient due to their lowapplication rates;
• the organophosphates were in use by 1955 and have been the leading insecticide chemical family since 1970; their peak usageoccurred around 1975 with 142 million pounds of active ingredient, after which usage has declined to some degree; usage oforganophosphates was an estimated 87 million pounds in 1997; and
• carbamate insecticide usage in 1997 (26 million pounds) was about one half its peak amount of 55 million in 1975.
Volume of Conventional Insecticide/Miticide Active Ingredient Usage in U.S., All Economic Sectors, by Chemical Family or Group, Stated Years, 1930-97 Figure 4-8
Trends in the usage of fungicide active ingredient are shown in Figure 4-9. Copper sulfate hasbeen the leading fungicide in terms of active ingredient usage most of the 20th Century. It had peakusage of 150 million pounds in 1945 and is still in use today (18 million pounds in 1997). The followingcan also be stated:
• copper sulfate (used with lime, known as Bordeaux mixture) was introduced as a fungicide in theU.S. by 1887 and came into large-scale application by about 1910; (Shepard, pp. 72-80), mostoften for potato and apple disease control;
• mercury based fungicides were in use from 1935 until about 1975; • the dithiocarbamates were in use by 1950 and most of the time since have been the second
ranking fungicide chemical family; and• heterocyclic nitrogens were in use by 1955 and reached largest usage around 1975.
Figure 4-10 shows trends in usage of fumigants/nematicides from 1930 through 1997. Thehalogenated chemicals were in use by 1930 and since have been the leading chemical family for this classof pesticides. The following can also be stated:
• chloropicrin and carbon tetrachloride were among the first to be of importance in this class ofpesticides;
• methyl bromide has been an important fumigant/nematicide since it began use around 1945; and• the carbamates/dithiocarbamates have had expanded usage since the late 1980's to 66 million
pounds in 1997.
Part 4 Pg. 23
19301935
19401945
19501955
19601965
19701975
19801985
19901995
1997
0
50
100
150
200
250M
illio
ns o
f Pou
nds/
Yea
r
Other ChemicalsOrganophosphatesOther Halogenated ChemicalsMethyl BromideCarbamates/Dithiocarbamates
Volume of Conventional Fumigant/Nematicide Active Ingredient Usage in U.S., All Economic Sectors, by Chemical Family or Group, Stated Years, 1930-97 Figure 4-10
F. User Expenditures for Conventional/Other Pesticides, by Type of Pesticide and Sector, 1979/97
Pesticides are a significant sector of the U.S. economy as reflected by annual user expendituresfor pesticides. This section presents user expenditures for conventional pesticides and other pesticidechemicals on an annual basis for the period of 1979 through 1997. The figures are as previouslypublished by the Agency in the EPA "Pesticide Market Series" last published for 1979 through 1997. (ASPELIN and Grube, EPA, November, 1999) The annual user expenditures are broken down byclass of pesticide in current dollars. They also are converted to constant 1997 dollars to remove theinfluence of general inflationary trends in the U.S. economy, based on the U.S. gross domestic product(GDP) deflator published by the Department of Labor.
1. Trends in Aggregate Expenditures, 1979/97
Overall user expenditures have increased from about $5.3 billion in 1979 to about $11.9 billionin 1997. (Figure 4-11) These increasing expenditures reflect changes in a number of factors including:the quantities of pesticides purchased; improved/more useful active ingredients and formulations; less useof inexpensive generic chemicals; increasing development and regulatory costs; and general inflationarytrends in the economy affecting production and transportation costs. Herbicides account for more thanhalf of total user expenditures, followed by insecticides.
Aggregate user expenditures in constant 1997 dollars are presented in Figure 4-12 for the 18year period, 1979/97. Those estimates show that expenditures increased less than inflation generallyfrom 1979 through 1993, but have increased at a somewhat faster rate since that time. In other words,pesticide expenditures in the aggregate have been increasing somewhat during recent years.
2. Trends in User Expenditures, Per Capita of U.S. Population
Figure 4-12 indicates that user expenditures per capita for the U.S. civilian population are in thesame general range during recent years as they were in the 1979/84 period. As of 1997, expendituresper capita were $44.73 which is somewhat below the values for 1979 through 1984. These figures percapita are an indication as to what the average person is paying for conventional/other pesticidechemicals, whether purchased directly as a user or indirectly as part of the costs of goods and services, taking account of inflationary trends.
The purpose of Part Five of this report is to present comprehensive historical trend informationon the extent of pesticide usage in the agricultural sector of the U.S., by types of chemicals used. In thissection, estimates are presented for overall agricultural pesticide usage starting with 1929. Limitedquantitative information has been found on agricultural pesticide usage prior to the 1930's. For theperiod prior to 1929, information of a qualitative nature in presented on agricultural pesticide usage, i.e.,primarily the types of chemicals that were available and recommended. For most recent times, e.g., thelast decade, more detailed information is presented, such as quantities used by crop or crop grouping. Information is presented on dollar expenditures and acreages treated where data are available, as wellas quantities of active ingredient used, which is the principal focus of reporting in this section.
A. Profile of Agricultural Applicator Sector
Agriculture is an important part of the United States in many ways. It is the source of food andfiber for the Nation and people elsewhere in the world through exports. Table 5-1 contains a briefprofile of the U.S. agricultural sector, circa the 1980/90's, with some historical comparisons, withparticular reference to pesticide applications.
There are about 1.9 million farms in the U.S. (1997 Census of Agriculture). These farmscontain more than 930 million acres of land which is nearly half of the land area of the U.S. (about 1.9billion acres as shown in Table 3-4 earlier in this report). They have about 350 million acres ofcropland used for crops each year, which is where most of the agricultural pesticides are applied.
The relative importance of the agriculture sector in the U.S. economy has changed greatly overthe last several decades. In recent times, agriculture (farm sector) has accounted for about 1.0 percentof the gross domestic product in the U.S. (1.1 percent in 1997) and has about 1.5 percent of U.S.population (1997 estimate). This compares with earlier times such as 1930 when it accounted for 10.6percent of the GDP and 24.8 percent of population. (Table 5-1) In 1910, agriculture accounted for16.7 percent of the GDP and about 35 percent of the population. The percentage of U.S. land infarms was as low as 16 percent before the Civil War (1850) and was as high as about 60 percent in themid-1950's. (Table 5-1)
Since 1910, the average size of farm has increased from 140 acres to nearly 500 acres (491acres in 1992). Despite these various trends, the amount of land farmed most intensively has beenmuch more stable. During the 1980's and 1990's, cropland used for crops was generally in the rangeof 330 to 380 million acres, compared with 330 million acres in 1919.
Table 5-1 Profile Overview of U.S. Agriculture Pesticide User Sector, Circa 1980/90's, with Some Historical Comparisons
Reporting Item Units 1997 1992 1987 1982 Historical Comparisons
No. farms, total Thousands 1,912 1,925 2,088 2,241 Peak of 6.8 mil. circa 1935No. farms, with cropland Thousands 1,661 1,697 1,849 2,011No. farms with harvested cropland Thousands 1,411 1,492 1,644 1,810Land in farms, total Million Acres 932 945 964 987Average land acreage/farm Acres 487 491 461 440 Low of about 140 acres in 1910Cropland, total Million Acres 431 435 443 445 Over 500 mil. acres in 1925Cropland, used for crops Million Acres 353 337 331 383 330 mil. acres in 1919Cropland, harvested Million Acres 309 296 282 326Total land area of U.S. Million Acres 1,891 1,894 1,896 1,896
Percent of U.S. land in farms Percent 49.3 49.9 50.1 52.1 16 pct. in 1850; high 60 pct. in mid'50's
Percent of U.S. land in harv.cropland
Percent 16.3 15.6 14.9 17.2
PopulationU.S. total population Millions 268 255 243 232 123 mil. in 1930; 92 mil. in 1910Farm population 1,000 4,020 4,665 4,986 5,397 30.5 mil. in 1930; 32 mil. in 1910
Farm population as percent ofU.S.
Percent 1.5 1.9 2.1 2.4 24.8% in 1930; 35% in 1910
Gross Domestic Product
U.S. economy Billion $ 8,111 6,244 4,692 3,242 507 in 1959Agriculture Sector Billion $ 90 81 65 65 19 in 1959
Agriculture as percent of U.S. Percent 1.1 1.3 1.4 2.0 3.7 %in 1959; 10.6% in 1930 and16.7% in 1910
Farms using chems. for: Insects on hay/crops 1,000 Farms 366 480 554 530 584 in 1978 Nematodes 1,000 Farms 43 54 66 77 103 in 1978 Diseases on crops/orchards 1,000 Farms 113 121 129 128 129 in 1978 Weeds/grass/brush 1,000 Farms 685 757 914 872 960 in 1978 Defoliation/fruit thinning 1,000 Farms 51 65 75 74 82 in 1978 Any or all of above, or lime 1,000 Farms 941 1,093 1,263 1,125 1,439 in 1978
Acreage treated with chems. for:
Insects on hay/crops 1,000 Acres 61,520 62,592 68,823 72,848 75,888 in 1978 Nematodes 1,000 Acres 6,465 6,555 5,931 7,533 8,805 in 1978 Diseases on crops/orchards 1,000 Acres 13,315 11,642 10,467 11,685 11,415 in 1978 Weeds/grass/brush 1,000 Acres 184,195 178,99
Sources: U.S. Census of Agriculture for 1997, 1992, 1987, 1982 and 1978; U.S. historical statistics, biennial edition for earliertimes; DOC estimates of GDP; USDA/ERS, Ag. Handbook 712, July, 1997; Economic Report of President for 1999; farmpopulation estimate for 1997 developed by author based on personal communication with Calvin Beale, USDA/ERS, May, 2000;U.S. Census of Population.
The percentage of U.S. land area in farms was as high as 60 percent in the mid-1950,s but hasdeclined to about 50 percent in recent years. Quite remarkably, U.S. agriculture have been able toproduce food and fiber to meet market needs (and even produce surpluses from time to time), withabout the same amount of cropland it used many decades ago. This due apparently to ever improvingtechnology and efficiency in agriculture, including the use of more and more useful pesticides to controlpests of various kinds. Agriculture accounts for a disproportional share of pesticides (compared toshares of GDP and population) due to the vulnerabilities of crops to pests, e.g., it accounts for aboutthree-fourths of the U.S. total usage of conventional pesticides and other pesticide chemicals (SeeTable 3-3 presented earlier.).
Pesticides of one type or another are applied on a majority of U.S. farms raising crops. In1997, about 0.94 million of the 1.661 million farms with cropland used one or more pesticide types onat least some acres. (Table 5-1) Herbicides are used on the most farms (685,000 farms in 1997)followed by insecticides (366,000). The numbers of farms using pesticides has declined generallysince the 1987 Census of Agriculture, particularly those using insecticides, herbicides and defoliant/plantregulators. The declining numbers of farms using the various pesticides seems to be the result of thechemicals being used on more acres per farm, because acreages treated have not tended to decline inthe same proportion (and have increased in some cases). (Table 5-1) The acreages treated for eachof the pest treatment categories in the 1997 and 1992 census years were higher than in 1987 for all ofthe categories except treatment of insects on hay/crops.
As of 1997, there were 874,000 persons who had been certified under FIFRA provisions asprivate pesticide applicators. This figure is down somewhat from 963,000 in 1992 according toAgency records. (Figure 5-1) There is an average of nearly one certified private applicator per U.S.farm that applies pesticides in crop production (e.g, 874,000 certifications compared with 941,000farms using pesticides in crop production in 1997).
B. Principal Chemicals Available to Farmers For Pest Control Before End of WWII
Two dramatic changes occurred by the latter stages of WWII, with respect to the availability ofchemicals for farmers to control pests. The first was the discovery and commercial development ofnew chemical compounds which were efficacious pest controls, principally synthetic organic pesticidessuch as DDT and 2,4-D. These new chemistries were far superior to the older traditional chemicalswhich often worked because of very crude, gross animal toxicity characteristics, were dangerous touse and frequently had undesired features. The new chemicals were more specifically developed totake advantage of the particular vulnerabilities of insect, plant and other pests, based on emergingscientific knowledge of chemistry and biology. The second major change was the emergence of anindustry to produce pesticides for use by farmers, making use of the newly developed pesticidechemistry.
Until the new chemicals came along, basically there was limited industry to efficiently producepesticides and make them available to farmers at prices that made them cost effective. Farmersgenerally had to purchase raw chemicals (often crude industrial chemicals) and mix/formulate thepesticides for use themselves because ready-to-use/formulated pesticide products were not available.
This brief section of the report highlights the types of active ingredients that were available andgenerally recommended for use prior to the advent of DDT and 2,4-D, near the end of WWII.
Table 5-2 summarizes the principal chemicals that were available to farmers for pest control intwo periods as follows: circa 1910-20 and early 1940's. The table is prepared on the basis ofpublished references which are thought to be representative of the guidance being followed by farmersduring those periods. This qualitative information is being presented as a supplement to the quantitativeinformation presented later in this section, which is somewhat limited, especially for the early part of the20th Century.
For insect control, various arsenicals were important as early as 1910-20 (Paris Greencontaining copper metarsenite and lead arsenate) and increasingly by WWII. Various arsenicals wererecommended, such as white arsenic, sodium arsenite, calcium arsenate and lead arsenate. Sulfur andpetroleum were used as insecticides as were several plant-based items, including rotenone, pyrethrum,vegetable oils and nicotine/tobacco.
A limited spectrum of chemistry was available as fungicides in 1910-20, principally Bordeauxmixture (copper sulfate/lime) and lime/sulfur. The situation had not changed much by WWII asmercurials were added as fungicides.
Table 5-2. Principal Chemicals Available to Farmers for Pest Control Prior to Synthetic Organic Pesticide Revolution, Circa1910-20 and Early 1940's
Circa 1910-20 Early 1940's
Insecticides Paris Green (copper metarsenite/acetate) London Purple (arsenic, lime, acids, etc.) Lead arsenate White arsenic, sodium arsenite, calcium arsenateHellebore (root of veratrum album) Lead arsenates (various normal and basic compounds, plus mixtures) Lime sulfur Flourine compounds Kerosene/soap Rotenone Linseed oil Elemental sulfur and inorganic sulfur compoundsTobacco extract Petroleum oils (crude, kerosene, various other weights); coal tars Pyrethrum Pyrethrum Carbolic acid Vegetable/animal oils Whale oil Nicotine/tobacco
Repellants Slaked lime/talc New chemicals added such as methyl phthalate, hexanediol &indalone.
Burgundy mixture and other compounds related to Bordeauxmixture Mercuric chlorideOrganic mercurial compounds
Herbicides Common salt (sodium chloride) About the same chemicals available for herbicides Copperas (Green vitriol or iron sulfate) as 1910-20. Bluestone (blue vitriol or copper sulfate) Weeds still mostly controlled by cultural/mechanical means in
crops. Carbolic acid (phenol) Caustic soda (sodium hydrate orhydroxide)
Sodium chlorate
Oil of vitriol (sulfuric acid) Corrosive sublimate (bichloride ofmercury) Kerosene/crude petroleumArsenite of soda
The farmer did not have available highly useful chemicals for control of weeds in crops until theend of WWII, starting with 2,4-D. Rather common chemicals such as sodium chloride, iron sulfate,copper sulfate, carbolic acid, sulfuric acid and petroleum were basically all that was available and theywere neither very useful in crop production nor without undesired effects from usage.
Farmers basically did not commonly use fumigants/nematicides in crop production through WWIIand neither did they have available to them antimicrobials for dairy sanitation, and other purposes, as wethink of such applications today.
C. Approach and Information Sources, Circa 1930 to Date
Information has been assembled on quantities of pesticide active ingredient used in U.S. agriculturegoing back as far as possible in time so as to be able to make comprehensive usage estimates for earliestpossible years. The sources and approach used in making the estimates were discussed above in PartsThree and Four of this report.
The estimates of overall agricultural pesticide usage discussed in this section are based onAppendix 4 (estimates of active ingredient usage, by type of pesticide, three year periods ending 1931-97). The presentation focuses on a series of charts (Figures) showing levels and trends graphically, butwith tables included below the charts, based on Appendix 4. Total agricultural usage of conventional andother pesticide chemicals is covered by the data series, including non-crop usage of pesticides usage--onall types of “farms,” such as ranches, as covered by the Census of Agriculture. The usage figures do notinclude industrial wood preservatives and biocides, as was discussed in Part Four of this report.
A second time series is presented for average agricultural pesticide usage per crop acre, by threeyear periods ending 1931 through 1997. This series was developed by simply dividing the estimates ofoverall usage noted above by national estimated acreages used for crops (USDA's series entitled "acres ofcropland used for crops." This series gives an indicator for trends in intensity of pesticide chemical usagein food and fiber production, recognizing that not all pesticides used on farms are used on cropland (by thevast majority is).
A third time series is presented on expenditures for agricultural pesticides in the U.S., for the1929/97 time frame. The series is three-year averages covering the 69 year period, utilizing annualestimates of pesticide expenditures from USDA for 1929 through 1978 and the EPA series published inthe EPA "Pesticide Market Series" for 1979 through 1997. (Aspelin and Grube, EPA, November, 1999, Table 16) The expenditures are expressed in both nominal values and in constant 1997 dollars (based onthe Gross National Product Deflator series). The constant dollar series was divided by U.S. civilianpopulation estimates to develop an indicator for expenditures per capita for pesticides used to producefood and fiber.
The other major portion of this Part on agriculture is a data set dealing with changes in pesticideusage in crop production between 1988/89, 1992/93 and 1996/97, by crop grouping and type ofpesticide. Values were developed for aggregate usage of active ingredient and for average pounds ofactive ingredient per acre of crop grown (by type/class of pesticide and crop grouping as explained later inthis section of the report). The estimates of usage by class and crop grouping are aggregate usage
estimates from the EPA Market Report Series, apportioned across crop groupings based on estimatesprepared by Doane Market Research staff from the Doane Profile for years indicated.
Various work tables used to develop data series presented on agricultural pesticide usagepresented in this section are included in Appendix 5.
D. Overall Conventional/Other Pesticide Usage and Crop Acreage, 1929/97
Presented in Figure 5-1 are estimates of the volume of pesticide active ingredient used inagriculture (conventional pesticides plus sulfur/petroleum and other chemicals) for three year periods for1929 through 1997 (annual figures representative of each period). These are simply values for total activeingredient used without breakouts for different types/classes of pesticides as are presented later in thissection and in Appendix Table 3 A. Also data are presented on total acres of U.S. cropland for theperiods indicated.
As of 1929/31, about 460 million pounds of active ingredient were used in agriculture on an annualbasis. (Figure 5-1) Usage declined sharply during the next three-year period (ending 1934) to about 318million pounds per year, as the Nation was in the Great Depression. Following that low point, usageincreased quite consistently until after WWII when there was a slowing of growth. Then usage increasedrather steadily to about 950 million pounds per year around 1960. There was a brief cutback in usageduring the mid-1960's and then usage peaked out for the seven decades in 1977/79 at nearly 1.1 billionpounds of active ingredient per year. As will be discussed later, where more detailed data are presentedby type of pesticide usage, the above trends reflect expanded use of insecticides starting with late WWII,the growth of herbicide usage until the late 1980's, and a drop in usage of sulfur/oil, particularly in the mid-late 1960's.
Total acreage used for cropland was remarkably stable at 370/380 million acres from 1930through the early 1950's and then declined to a low of 333 million acres around 1968/70. Then itincreased to a peak of about 380 million acres in 1980/82, followed by a decline to about 335-345 millionacres where it has been during the last decade. (Acreages in this paragraph are from USDA “croplandused for crops” series.)
The volume of pesticide active ingredient used in agriculture has been quite closely correlated withacres of cropland since about 1960, as can be seen in Figure 5-1. The association is particularly strikingsince 1970. Variations in crop acreage did not appear to be a major factor shaping total agriculturalpesticide usage from the 1930's until about 1960, as insecticide and herbicide usage increaseddramatically, regardless of crop acres. Obviously changes in cropland acreage available for cropping donot totally explain changes in aggregate pesticide usage. Other key factors are at work including changesin crop selection, acreages treated (percent), numbers of applications, application rates, governmentprograms/policies and economic factors e.g., pesticide/commodity cost/price relationships. Also, thereare non-crop uses of pesticides in agriculture (e.g., post-harvest commodity storage and livestock/poultry)and uses of pesticides on non-cropland such as range, forests, fence rows and rights of way.
19311934
19371940
19431946
19491952
19551958
19611964
19671970
19731976
19791982
19851988
19911994
1997
Three Year Periods Ending
200300400500600700800900
100011001200
Mil.
Lbs
. Act
ive
Ingr
edie
nt
250
300
350
400
450
500
Mil.
of
Cro
p A
cres
Active Ingredient
Crop Acres
Volume of Pesticide Active Ingredient Usage In Agriculture,and Acres Used for Cropland, U.S., Three Year Periods Ending, 1931-97Figure 5-1
E. Agricultural Pesticide Usage by Type, Conventional and Other Chemicals, 1929/97
Presented in Figure 5-2 are estimates of aggregate agricultural pesticide usage over the period from1929 through 1997, with a breakout for conventional pesticides, separate from other pesticide chemicals(based on the definitions discussed earlier in Parts Three and Four of this report). The followingobservations can be made about the data depicted in Figure 5-2:
! from 1929/31 until the mid-1950's, conventional pesticide usage was quite stable in therange of 150 to 250 million pounds per year and there was growth in usage of otherpesticide chemicals to a peak of about 600 million pounds around 1960;
! by 1965/67, conventional usage surpassed other pesticide chemicals and continues to do soto date;
! since 1971/73, usage of other pesticide chemicals has generally declined and is far belowpeak levels achieved around 1959/61; and
! conventional pesticides currently account for about 80 percent of total agricultural pesticideusage, i.e., 782 million out of 947 million for 1995/97.
463
318 37
4 498
659 73
1
700 78
9
761
887 95
4
898
675 78
1
926 99
9 1071
1037
971
886
877
906
947
19311934
19371940
19431946
19491952
19551958
19611964
19671970
19731976
19791982
19851988
19911994
1997
Three Year Period Ending
0
200
400
600
800
1000
1200
Mill
ion
Po
un
ds
Other ChemicalsConventional
Excludes wood preservatives and biocides
Volume of Pesticide Active Ingredient Usage in U.S. Agriculture by Type of Pesticide,Three Year Periods Ending 1931-97Figure 5-2
Presented in Figure 5-3 are estimates of conventional and other pesticide chemical usage inagriculture expressed in terms of average per U.S. crop acre. The aggregate usage figures presentedabove (pounds of pesticide active ingredient) have been divided by total U.S. crop acreage in an effortto develop a rough indicator of pesticide usage intensity in agricultural production. U.S. cropland,about 345 million acres in 1995/97 (USDA's "cropland used for crops" series), is where mostintensively managed crops are grown and where most pesticides are used in U.S. agriculture. Thiscropland accounts for just under one-fifth of total U.S. land in farms of 1.9 billion acres. Thepesticides not used on cropland are used for other land uses such as range and forests and for non-landuses such as livestock and poultry production, commodity storage, etc. Also, not all cropland is treatedwith one pesticides. Abstracting from these considerations, the calculated average usage per crop acre(pounds of active ingredient) can still provide a general indicator or proxy for trends in intensity ofpesticide usage in agriculture.
The trends in aggregate quantities of pesticides used and crop acres resulted in a rapidly
increasing average rate of active ingredient used per acre of cropland-- from less than a pound per acrein the early 1930's to about 2.7 pounds during 1959/64. (Figure 5-3) This was followed by markedlylower levels through about 1970 due to less use of other pesticide chemicals. This is presumed to bethe result of new conventional pesticides coming on the market and replacing traditional chemicals suchas sulfur and petroleum/oil. The highest level of usage was reached in the 1977/79 period when therate per acre was 2.85 pounds, somewhat more than for the most recent three year period (2.76pounds for 1995/97). Basically, there has not been a consistent long term trend up or down during thelast 25 years, as usage has tended to equal about 2.6 to 2.7 pounds per acre. However, there hasbeen a slight tendency for the rate per acre to increase during the 1990's.
1.21
0.840.99
1.35
1.781.96
1.85
2.08 2.01
2.46
2.72 2.68
2.01
2.34
2.71 2.742.85
2.70 2.702.62 2.58
2.70 2.76
19311934
19371940
19431946
19491952
19551958
19611964
19671970
19731976
19791982
19851988
19911994
1997
Three Year Period Ending
0
1
2
3
Po
un
ds
Per
Acr
e P
er Y
ear Other Chemicals
Conventional
Excludes wood preservatives and biocides
Volume of Pesticide Active Ingredient Usage in U.S. Agriculture by Type of Pesticide,Per Acre of Cropland, Three Periods Ending 1931-97Figure 5-3
G. Agricultural Pesticide Usage, by Type (Class) of Pesticide, 1929/97
Some rather notable changes have occurred in the types of pesticide chemicals that have been used inagriculture since 1929/31. Figure 5-4 contains estimates of overall agricultural usage of active ingredientbroken down into seven different types of pesticides for the three year periods covering 1929 through 1997. Conventional pesticides are reported separately for five types and other pesticide chemicals are split intothree types. (Figure 5-4)
The following observations can be made: ! the advent of synthetic organic herbicides by about 1945 led to consistent and rapid growth in the use
of such chemicals in agriculture to a peak of about 500 million pounds of active ingredient in 1980/82,with some decline since;
! insecticide usage expanded during the 1960's and 1970's, but has tended to decline since as newer,low-dose, chemicals have replaced older pesticides;
! usage of fumigants/nematicides has been increasing steadily since the 1940's, and rather dramaticallyso in the 1990's (their usage is now exceeded only by herbicides/PGR’s);
! sulfur and petroleum are still important pesticides but usage is far below levels of earlier times, e.g.,three year periods ending 1943 through 1964; and
! fungicide usage has been remarkably stable at about 40-60 million pounds for several decades.
463
318 37
4
498
659 73
1
700 78
9
761
887 95
4
898
675
781
926 99
9 1071
1037
971
886
877 906 94
7
19311934
19371940
19431946
19491952
19551958
19611964
19671970
19731976
19791982
19851988
19911994
1997
Three Years Ending
0
200
400
600
800
1000
1200
Mill
ions
of P
ound
s Other ChemicalsPetroleum/OilSulfurOther ConventionalFumigant/NematicideFungicideInsecticide/MiticideHerbicide/PGR
Volume of Pesticide Active Ingredient Usage in U.S. Agriculture,by Type of Pesticide, Three Year Periods Ending 1931-97Figure 5-4
H. Active Ingredient Usage, by Crop Grouping, 1988/97
The purpose of this section of the report is to present information on the usage of pesticide active ingredient inU.S. crop production, by crop grouping and class (type) of pesticide, covering the 10 year period ending in 1997. Thisis done by using data for two year periods at the beginning, middle and end of the 10 year period, i.e., 1988/89,1992/93 and 1996/97. The raw data for individual years were merely averaged to get the two-year period averages. The goal of the effort is to show trends in usage for the various crop groups as well as to show the relative importanceof the various crop groups, along with figures on U.S. acreages grown of the crops. The crop acreages are those usedby Doane in its profile program, which rather closely track with USDA contemporary estimates and U.S. Census ofAgriculture estimates. The crop groupings used are those adopted by Doane in its Profile (crop groupings arepresented below tables in this section).
The estimates of usage by crop grouping presented in this section are a disaggregation of national totalspublished by EPA in the latest published market report (Aspelin and Grube, EPA, November, 1999). Doane estimatesof usage by crop grouping were used to apportion the published EPA national totals to the various crop groupings. Theclasses of pesticides assumed to be used in crop production from the EPA report were four types of conventionalpesticides ( herbicides/PGR, insecticides/miticides, fungicides, nematicides/fumigants) and sulfur/oil. Aggregateestimates of usage are presented first in this section of the report followed by comparable figures on average usage ofactive ingredient per acre of crop grown by crop grouping.
The resulting break-outs of aggregate active ingredient usage are shown in Table 5-3 and Figure 5-5. Someobservations which can be made about the data set are:
• Corn/sorghum and fruits/nuts are by far the leading crop groups in terms of overall usage of active ingredient;they are followed at a distance by agronomic crops (which include potatoes), vegetables and soybeans;.
• Herbicides are the leading pesticide type applied to major field crops such as corn/sorghum, soybeans andcereals;
• Sulfur/petroleum is used most widely on fruits/nuts, accounting for about half of all pesticide usage on thosecrops;
• Consistent increases occurred in usage on cotton, agronomic crops, fruits/nuts and vegetables over the decade,for the two-year periods presented; and
• Fumigant/nematicide usage increased noticeably over the 10 years for agronomic crops, vegetables and cotton.
Table 5-3 Pounds of Pesticide Active Ingredient Used in U.S. Crop Production, by Crop Group and Type of PesticideAlong with Total Acres Grown, Two Year Periods, 1988-97
AcresGrown
Pounds of active ingredient in thousands
Crop Group Years (000) Herbicides/PGR Ins./Miticides
Pesticide Active Ingredient Used for Crops, Millions of Pounds,by Crop Group, Two Year Periods (1988/97) and Type of Pesticide, U.S.Figure 5-5
Presented in Table 5-4 and Figure 5-6 are averages for active ingredient usage per acre derivedfrom the above aggregates, by crop grouping spanning the 10 year period. Some observations can bemade as follows:
• The average for all crops was 1.0 pounds per acre for 1996/97, somewhat higher than for1988/89 (0.91), but down slightly from 1.1 pounds in 1992/93;
• Fruits/nuts currently lead all other crop groups by far with about 45 pounds of active ingredientused per acre grown, followed by vegetables at about half the rate in 1996/97 (more than 23pounds);
• The most noticeable increase in usage per acre was vegetables, where usage per average acreincreased from 13.4 to 23.7 pounds per acre between 1988/89 and 1996/97;
• Nematicide/fumigant usage increased sharply for vegetables and to a lesser degree foragronomic crops; and
• Corn/sorghum is the only crop group for which usage per acre declined consistently in both1992/93 and in 1996/97.
Figures 5-7a and 7b, respectively, show aggregate and per acre usage of pesticide activeingredient by crop grouping for the most recent two year period, 1996/97. The importance of overallusage by corn sorghum and fruits/nuts is again evident. Similarly, the highest rates of usage per acre areevident for fruits/nuts, followed by vegetables and agronomic crops respectively.
Figures 5-8 a, b and c provide profiles of usage per acre by crop group for each of the threetwo-year periods.
Table 5-4 Average Pounds of Pesticide Active Ingredient Used Per Acre in U.S. Crop Production, by Crop Group and Type of Pesticide,Along with Total Acres Grown, Two Year Periods, 1988-97
SOURCE: Figures calculated by dividing aggregate usage estimates in Table 5-3 by total U.S. acres grown as estimated by Doane alsoshown above.Crop Groupings
SOURCE: Table 5-4 . NOTE: Figures calculated by dividing aggregate usage estimates in Table 5-3 by total U.S. acres grown as estimated by Doane also shown in Table 5-3.
Average Pesticide Active Ingredient Per Acre of Crop Grown,by Crop Group, Two Year Periods (1988/97) and Type of Pesticide, U.S.Figure 5-6
248.69
82.02
60.60
47.48
100.61
223.50
95.94
33.82
Corn/SorghumSoybeans
CottonCereals
Agronomic CropsFruits & Nuts
VegetablesMiscellaneous
Cro
p G
roup
0 50 100 150 200 250 300
Million Pounds Pounds Active Ingredient
Herbicides/PGRIns./MiticidesFungicides
Nem./FumigantsSulfur/oil
Pesticide Active Ingredient Used for Crops,Millions of Pounds, by Type of Pesticide, U.S., 1996/97Figure 5-7a
2.77
1.26
3.98
0.52
9.30
43.78
23.69
0.05
1.00
Corn/SorghumSoybeans
CottonCereals
Agronomic CropsFruits & Nuts
VegetablesMiscellaneous
All Crops
Cro
p G
roup
0 10 20 30 40 50
Average Pounds Active Ingredient/Acre Grown
Herbicides/PGRIns./MiticidesFungicides
Nem./FumigantsSulfur/oil
Pesticide Active Ingredient Per Acre of Crop Grown,by Type of Pesticide, U.S., 1996/97Figure 5-7b
3.31.6
3.70.5
9.144.1
13.40.1
0.9
Corn/SorghumSoybeans
CottonCereals
Agronomic CropsFruits & Nuts
VegetablesMiscellaneous
All Crops
Cro
p G
roup
0 10 20 30 40 50
Ave. Pounds Active Ingredient/Acre Grown
Herbicides/PGRIns./MiticidesFungicides
Nem./FumigantsSulfur/oil
Pesticide Active Ingredient Per Acre of Crop Grown,by Type of Pesticide, U.S., 1988/89Figure 5-8a
2.91
1.23
3.64
0.48
9.87
46.93
15.60
0.05
1.01
Corn/SorghumSoybeans
CottonCereals
Agronomic CropsFruits & Nuts
VegetablesMiscellaneous
All Crops
Cro
p G
roup
0 10 20 30 40 50
Ave. Pounds Active Ingredient/Acre Grown
Herbicides/PGRIns./MiticidesFungicides
Nem./FumigantsSulfur/oil
Pesticide Active Ingredient Per Acre of Crop Grown,by Type of Pesticide, U.S., 1992/93Figure 5-8b
2.77
1.26
3.98
0.52
9.30
43.78
23.69
0.05
1.00
Corn/SorghumSoybeans
CottonCereals
Agronomic CropsFruits & Nuts
VegetablesMiscellaneous
All Crops
Cro
p G
roup
0 10 20 30 40 50
Ave. Pounds Active Ingredient/Acre Grown
Herbicides/PGRIns./MiticidesFungicides
Nem./FumigantsSulfur/oil
Pesticide Active Ingredient Per Acre of Crop Grown,by Type of Pesticide, U.S., 1996/97Figure 5-8c
I. Expenditures for Agricultural Pesticides, 1929/97
USDA maintains data series on total farm production expenditures and with break-outs forcomponents, including pesticides. The series goes back to 1910. This section shows trends startingwith 1929 utilizing USDA/ERS’s expenditure series through 1978 and EPA’s series for 1979 through1997. Separate series for expenditures are presented for nominal dollars and constant 1997 dollarsbased on the U.S. GDP deflator published by the U.S. DOL.
Farm expenditures for pesticides have increased greatly over the last seven decades due totrends in the general level of prices in the U.S. economy and more importantly due to expanded usage ofpesticide chemicals, including more complex and costly pesticide products. Farm expenditures forpesticides have increased from $33 million in 1929/31 to about $8.4 billion in 1995/97 in nominaldollars. (Figure 5-9) When placed in constant 1997 dollars, the increase is from $296 million per year in1929/31 to $8.5 billion in 1995/97. As can be seen in Figure 5-9, the correction for inflationary pricetrends explains only a minor part of increasing levels of expenditures over the roughly seven decades. Some of the factors which relate to the increasing expenditures for pesticides include:
! more than three times as much conventional pesticide active ingredient usage in 1996/97 than in1929/31 (230 vs.782 million pounds);
! declining relative importance of other pesticide chemicals such as sulfur and petroleum, which areless expensive than conventional pesticides; and
! trends in conventional pesticides away from rather crude/inexpensive chemicals such asarsenicals, lead and coppers and toward sophisticated, potent, convenient and pest-specific/targeted products more valuable to users.
19311934
19371940
19431946
19491952
19551958
19611964
19671970
19731976
19791982
19851988
19911994
1997
Three Years Ending
0
1000
2000
3000
4000
5000
6000
7000
8000
9000
10000
0
Mill
ions
of D
olla
rs
1997 Dollars, Millions
Nominal Dollars, Millions
Agricultural Pesticide Expenditures, Nominal and Constant 1997 Dollars,U.S., Three Year Periods Ending 1931-97Figure 5-9
One way of considering the importance of pesticides in agriculture is to measure their relativeimportance in dollar terms among all farm inputs. Pesticides have accounted for an ever increasingpercentage of total farm production expenditures since about 1945, when they accounted for about 0.5percent. (Figure 5-10) Since that time, pesticides have steadily increased as a percentage of total farmproduction expenses to a level of 4.6 percent in 1995/97. Increases in this percentage have been ratherpronounced during the 1990's. Apparently agricultural producers are depending on pesticide chemicalsto carry an increasingly heavy pest management load and are willing to pay for it.
The increasing expenditures for pesticides are reflected in higher average expenditures per poundof active ingredient. For example, over the twenty one years between 1974/76 and 1995/97, theaverage expenditure per pound of active ingredient nearly doubled— from $4.84 per pound in 1974/76($4,837 mil. for 999 mil. pounds) to $8.99 ($8,517 mil. for 947 mil. pounds) (numbers from Figure 5-10 and 5-2 respectively). Over the years, pesticides have become effective at lower dosage rates andoften have features or functions that earlier chemicals did not have, all of which cost to develop but arevaluable to the grower or other user.
Another way of looking at the importance of agricultural pesticide usage is in terms ofexpenditures relative to the number of people in the U.S. One can calculate the average or pro-ratalevel of expenditures for pesticide used to produce food and fiber per capita. This has been done inFigure 5-11 which shows agricultural pesticide expenditures in total and per capita, for U.S. civilianpopulation over the last seven decades (1997 constant dollars). There are three rather distinct periodsas follows---before 1960; 1961/1982 and 1983/97. Following the rather low levels prior to 1960, expenditures increased quite rapidly and consistently through 1982; and then they have varied, at levelsgenerally at or below 1980/82. For the most recent period, 1995/97, the average expenditure percapita for agricultural pesticides was $32.10 (Figure 5-11).
19311934
19371940
19431946
19491952
19551958
19611964
19671970
19731976
19791982
19851988
19911994
1997
Three Years Ending
0100020003000400050006000700080009000
10000
0Mill
ion
s o
f C
on
stan
t 19
97 D
olla
rs
0
1
2
3
4
5
Per
cent
Million Dollars, 1997
Pecent of Total Exp.
SOURCE: USDA data series for total expenditures and for pesiticides, 1929-78.Percentage computed from nominal dollars; dollars computed from nominal dollars converted to 1997 dollars, using GDP deflator
Agricultural Pesticide Expenditures, Total and as Percentof Total Farm Production Expenses, U.S., Three Year Periods Ending 1931-97Figure 5-10
The purpose of Part Six of this report is to present comprehensive historical trend informationon homeowner applications of pesticides to homes and gardens, including lawns, by types of pesticidesused. Estimates of usage per year are presented for three year periods covering the time from 1929through 1997. The coverage of chemicals is conventional pesticides and other pesticide chemicals, butdoes not include biocides and wood preservatives, following the same definitions and reporting schemeused in Part Five of this report.
The definition of the home and garden sector is as provided in Part Three of this report andexcludes applications to homes and gardens by professional applicators, which are included under theindustrial/commercial/government sector for pesticide applications. The applications to homes andgardens by pest control operators, lawn services, arborists, etc., are included in Part Seven of thisreport. The professional applicator sector is sometimes referred to as the certified/commercialapplicator sector and will be discussed further in Part Seven.
A. Profile of Home and Garden User Sector
Home and garden pesticide applications (by homeowners and family members) account for asignificant portion of total usage of conventional pesticides and other pesticide chemicals. As wasshown earlier in Table 3-2, home and garden applications accounted for 136 million pounds of activeingredient in 1997, or 11 percent of the total for all user sectors that year. These applications were made by an estimated 123.7 million persons, of which 52.5 million were male and 71.1 million werefemale. (Table 6-1) These figures are based on estimates developed in the EPA Home and GardenPesticide Use Survey. (EPA, 1992) That study provided estimates of numbers of persons applyingpesticides and many other aspects, for the year 1990. Table 6-1 in this report contains the estimatesderived from the EPA study for 1990, and extrapolations forward to 1997, using the same proportions(e.g., percentages of households and population). The user profile information presented in thesubsection is from that EPA study, unless otherwise noted.
Nearly one half of the U.S. civilian population applies pesticides, 115.2 million out of 249.4million in 1990, or about 46 percent.(Table 6-1) Females tend to apply pesticides more commonlythan males as 66.3 million females applied pesticides compared with 48.9 million males in 1990.
There were an estimated 84.6 million households in the U.S. in 1990, of which 70.5 million(about 83 percent) were urban and 14.1 million rural. (Table 6-1) About three-fourths
Part 6, Page 2
Table 6-1 Profile Features of U.S. Home and Garden Pesticide Application Sector, 1990 and1997
Profile Feature 1990 1997Projected
Millions Percent ofU.S. Total
Millions
U.S. civilian population 249.4 100.0 267.9
No. U.S. households Urban 70.5 83.3 84.1 Rural 14.1 16.7 16.9 Total 84.6 100.0 101.0
Private lawn 66.8 79.0 79.8Private swimming pool 6.0 7.1 7.2 Hot tub 2.5 3.0 3.0
No. U.S. households that:Grew edible fruit/nut/grapes in lastyear
18.4 21.8 22.0
Grew veg., berries or mellons inlast year
23.2 27.4 27.7
Grew roses in last year 27.2 32.1 32.4
U.S. Home lawn acrege 23.3 100.0 26.0
No. U.S. households using :
Comm. lawn care co. 10.2 12.1 12.2 Landscaper for lawn care 0.7 0.9 0.9 Other lawn care service 2.0 2.3 2.4 Pest control operator for insects,etc
16.6 19.6 19.8
No. of resident personsapplying pesticides during year Male 48.9 42.5 52.5 Female 66.3 57.5 71.2 Total 115.2 100.0 123.7
SOURCES: EPA Home and Garden Pesticide Use Survey, March 1992 for numbers and percent 1990except for population and lawn acreage. Percentages for 1990 used to extrapolate for 1997. Population estimates from Census of Population1990 home lawn acreage from Economic Profile Estimates for Turf Insecticides, by DPRA for EPA, Jan.,1993; 1997 home lawn acres based on Kline Briefing, May 6, 1999.
Part 6, Page 3
of U.S. households have single-family dwellings (63.3 million in 1990), leaving one-fourth to have multi-family dwellings. More than three-fourths have private lawns (66.8 million in 1990), but few have privateswimming pools (6 million) and hot tubs (2.5 million). Significant proportions of households growfruit/nut/grapes (18.4 million or 22 percent in 1990), grow vegetables/berries/melons (23.2 million or 27percent) and grow roses (27.2 million or 32 percent). The EPA survey estimated that 16.6 millionhouseholds used pest control operators, which equaled about one-fifth to total U.S. households. (Table 6-1)
Commercial lawn care service is used by about one-eighth of households and some uselandscapers or other lawn care services. (Table 6-1) As of 1990, there was an estimated total of 23.25million acres of home lawns in the U.S. (Table 6-1), which equals an average of 0.34 acres per householdwith private lawn (66.8 million households). The estimated acreage of lawn per household remained aboutthe same in 1997, based on new estimates of turf acreage and assuming the same proportion of households with private lawns, as estimated in the EPA Survey for 1990. (Table 6-1)
A graphic version of the key user-profile data presented on the home and garden pesticide usagesector is presented in Figure 6-1.
Part 6, Page 4
84.1
16.9
101
75.6
25.4
79.8
7.2
3
22
27.7
32.4
12.2
0.9
2.4
19.8
70.5
14.1
84.6
63.3
21.2
66.8
6
2.5
18.4
23.2
27.2
10.2
0.7
2
16.6
Urban
Rural
Total
Single-family dwelling
Multi-family dwelling
Private lawn
Private swimming pool
Hot tub
Grew edible fruit/nut/grapes in last yr.
Grew veg., berries or mellons in last yr.
Grew roses in last yr.
Used comm. lawn care co. in last yr.
Used landscaper for lawn care in last yr.
Used other lawn care service in last yr.
Used pest control operator in last yr.
Typ
e o
f H
ou
seh
old
or
Ch
arac
teri
stic
0 20 40 60 80 100 120
Millions of Households
1990 1997
SOURCE: EPA Home and Garden Pesticide Use Survey, 1990
Numbers of Households in Home and Garden Pesticide Usage Sector, with Specified Charateristics,U.S., 1990 and 1997Figure 6-1
Part 6, Page 5
B. Quantitative Characteristics of Home and Garden Usage, 1990
The EPA home and garden pesticide use survey developed estimates of numbers of householdsusing pesticides by type (class) of pesticide and site of application, along with numbers of applications. Italso developed estimates of numbers of pesticide products in storage by type of pesticide and when used. A detailed table summarizing some of the key results of the survey are presented in Appendix Table 6 A,which provides the basis for a series of charts on home and garden use patterns for 1990 presented in thissection. That study did not undertake to estimate quantities of pesticide active ingredient (or formulatedproduct) used because of inherent difficulties involved in obtaining an entire year's worth of applicationsfrom selected households without a much more ambitious survey involving multiple contacts during theenumeration year and record keeping. So far, since that time, such a more ambitious national survey ofhome and garden usage has not been undertaken by EPA to derive estimates of quantities used. Accordingly, this report is based on other available secondary reports and sources as concerns quantitiesof pesticides used in the home and garden sector.
1. Numbers of Households Using Home and Garden Pesticides, 1990
Pesticides are used by homeowners (and/or family members) in a majority of U.S. households,including lawns, gardens and any other outside areas. As of 1990, 69 million households used one ormore types of pesticides, which equaled 81.6 percent of U.S. households that year. (Figure 6-2) In otherwords, about one-fifth of households did not use any pesticides. Insecticides and fungicides are the mostcommonly used conventional pesticides in homes and gardens. About 60 percent used an insecticide andabout 40 percent used a fungicide. Only about four percent of households used a molluscicides or arodenticide. (Figure 6-2) Disinfectants were used in nearly half of households and about one-fifth usedinsect repellents.
In terms of application site, three fourths of U.S. households apply one or more pesticides indoors(64 million in 1990). (Figure 6-3) About one-fifth have lawn pesticide applications, one-tenth, food cropapplications and one-sixth, ornamentals. Other outside areas, such as outbuildings were treated with oneor more pesticides by homeowners in 1990 (25 million households or 29 percent of the total).
Figure 6-4 contains a two-way breakout of the numbers of households with homeowner pesticideapplications showing numbers by both pesticide type and site of application. The leading combinations interms of numbers of households were: indoor insecticides (42 million), indoor disinfectants (40 million),indoor fungicides (32 million) and indoor repellents (15 million). The leading outdoor combinations were:insecticides on other outside areas, ornamentals and lawns; and herbicides on lawns.
Part 6, Page 6
42.0
61.9
4.2
4.1
16.6
76.0
47.6
20.2
81.6
35.5
52.4
3.6
3.5
14.0
64.3
40.3
17.1
69.0
Fungicide
Insecticide
Molluscicide
Rodenticide
Herbicide
Any Conventional
Disinfectant
Repellent
Any Type(s)
Pes
ticid
e Ty
pe
0.0 10.0 20.0 30.0 40.0 50.0 60.0 70.0 80.0 90.0
Millions of HouseholdsPercent of U.S. Households
SOURCE: EPA Home and Garden Survey, 1990
Numbers and Percentages of Households Using Home and Garden Pesticides, by Type of Pesticide, All Sites of Application, U.S., 1990Figure 6-2
Millions of Households
Percent of U.S. Households
Fungicide Insecticide Molluscicide Rodenticide Herbicide Any Conventional Disinfectant Repellent Any Type(s)
36 52 4 3 14 64 40 17 69
42.0 61.9 4.2 4.1 16.6 76.0 47.6 20.2 81.6
Part 6, Page 7
75
22
10
16
29
82
64
18
8
14
25
69
Indoors
Lawn
Food crops
Ornamentals
Other (outside)
Any site(s)
App
licat
ion
Site
0 10 20 30 40 50 60 70 80 90
Millions of HouseholdsPercent of U.S. Households
SOURCE: EPA Home and Garden Survey, 1990
Numbers and Percentages of Households Using Home and Garden Pesticides,by Application Site, All Types of Pesticides, U.S., 1990Figure 6-3
Millions of Households
Percent of U.S. Households
Indoors Lawn Food crops Ornamentals Other (outside) Any site(s)
64 18 8 14 25 69
75.3 21.8 9.6 16.2 29.1 81.6
Part 6, Page 8
32.0
41.63.0
1.2
40.0
15.2
Indoors
1.0
11.9
1.10.4
9.6
0.11.2
Lawn
2.2
7.1
1.00.10.7
0.1
Food crops
4.4
11.9
2.40.1
1.70.2
0.5
Ornamentals
1.8
20.80.90.4
5.6
1.32.1
Other (outside)
35.5
52.43.63.5
14.0
40.3
17.1
Any site
FungicideInsecticide
MolluscicideRodenticide
HerbicideDisinfectant
Repellent
SOURCE: EPA Home and Garden Use Survey, 1990NOTE: Millions of Households
Numbers of Households Using Home and Garden Pesticides, by Type of Pesticide and Site of Application, U.S., 1990Figure 6-4
Part 6, Page 9
2. Numbers of Home and Garden Pesticide Applications Per Household, 1990
The EPA Home and Garden Survey provided estimates of the number of pesticide applications aswell as numbers of households, as summarized in Appendix Table 6A, which also contains computationsof the average numbers for applications per household, for 1990. Averages were computed in twoalternative ways, one based on all U.S. households (84.6 million in 1990) and the other based only thenumber of households making the particular type of application.
Figure 6-5 contains estimates of average numbers of applications for all U.S. households byapplication sites, in different terms than presented above, e.g., person, animal/kennel, and primary livingarea. The average was about 52 applications per household during 1990 (about one per week) for alltypes of applications. The primary living area accounted for about two-thirds of the applications. Theother types of applications were much less frequent, with averages of less than 5 per year for the varioustypes other than "outdoor areas" for which the average was 6.28 applications.
The alternative set of calculations for the average number of applications per household issummarized in Figure 6-6, with separate breakouts for type of pesticide and indoor vs. outdoorapplications. As indicated in the Figure, the values for indoor applications are computed directly fromaggregate estimates of applications and households published in the study, while the values for outdoorapplications are mid-range estimates, assuming the midpoint of possible households making particulartypes of indoor applications. For any and all types of pesticides used indoors, the average was 60.89applications per year for using households. The highest indoor averages were for disinfectants (62.66),fungicides (54.13) and rodenticides (32.69). For outdoor applications, the average for any and all typesof pesticides was 11.87 applications per using household. The leading pesticide types were: disinfectants(13.25 applications), insecticides (10.19) and fungicides (7.56).
Part 6, Page 10
2.72
2.55
0.19
35.71
4.68
6.28
52.13
Person
Cat, dog or kennel
House plants or greenhouse
Primary living area
Detached structure or other inside
Outdoor areas
Total
Ap
plic
atio
n S
ite
0.0 10.0 20.0 30.0 40.0 50.0 60.0
U.S. Average Number of Applications/Year
NOTE: Average computed from EPA Survey, 1990using all U.S. households in divisor, i.e., 84.6 million.
Numbers of Home and Garden Pesticide Applications, by Site of Appplication, U.S., 1990Average Number of Applications Per U.S. Household During YearFigure 6-5
Part 6, Page 11
FungicideInsecticide
MolluscicideRodenticide
HerbicideAny Conventional
DisinfectantRepellent
All Type(s)
Pesticide Type
010203040
506070
Ave
. No
. A
pp
licat
ion
s/Y
ear
Indoor applications Outdoor applications
NOTE: Outdoors estimates computed directly from aggregages in EPA Home/Garden ReportIndoor figures are imputed mid-point estimates based on same EPA Survey Report. (See Appendix Table 6 A.)
Numbers of Home and Garden Pesticide Applications Indoors and Outside, by Type of Pesticide, U.S., 1990Average Numbers of Applications for Households Using Specified Pesticide TypeFigure 6-6
Indoor applications
Outdoor applications
Fungicide Insecticide Molluscicide Rodenticide Herbicide Any Conventional Disinfectant Repellent All Type(s)
54.13 25.66 32.69 29.55 49.97 62.66 19.77 60.89
7.56 10.19 6.47 6.04 5.29 11.59 13.25 8.38 11.87
Part 6, Page 12
3. Numbers of Home and Garden Pesticide Products in Storage, 1990
The EPA Home and Garden Survey found that rather large numbers of pesticide products were instorage at household. Estimates were made of the aggregate numbers of products in storage by type(class) of pesticide and use status (not used yet, used past year or used over one year ago). The numbersof products in storage are shown in Appendix Table 6 A. There also, are calculated averages for numbersof products in storage, based on numbers of households reporting use of the specified type of pesticide. They are also summarized and presented in Figure 6-7. On the average, using households had 4.7pesticides in storage, of which 0.34 were not used yet and 1.07 were used more than one year ago. Insecticides were most commonly in storage (3.38 products), followed by herbicides (2.34), while theother categories had values in the range of one and two products in storage on the average.
Part 6, Page 13
1.92
3.38
1.58
1.36
2.34
1.92
1.86
4.70
FungicideInsecticide
MolluscicideRodenticide
HerbicideDisinfectant
RepellentAny Type(s)
Pes
ticid
e T
ype
0 1 2 3 4 5Ave. no. of products in storage, using households only
Not used yetUsed in past yearUsed over one year ago
NOTE: Total products in storage divided by number of households using specified type of pesticidebased on results of EPA Home and Garden Survey for 1990.
Numbers of Home and Garden Pesticide Products in Storage, by Type and When Used,Average Numbers per Household Using Specified Type of Pesticide, U.S., 1990Figure 6-7
Not used yet
Used in past year
Used over one year ago
Total
Fungicide Insecticide MolluscicideRodenticide Herbicide Disinfectant Repellent Any Type(s)
0.09 0.27 0.06 0.09 0.23 0.09 0.11 0.34
1.52 2.19 1.13 1.01 1.38 1.74 1.25 3.30
0.32 0.91 0.39 0.26 0.73 0.10 0.50 1.07
1.92 3.38 1.58 1.36 2.34 1.92 1.86 4.70
Part 6, Page 14
C. Home and Garden Pesticide Usage, by Type, 1929/97
1. Approach and Data Sources
The approach used in this section to report home and garden usage trends tracks with thepresentations made in Parts Three, Four and Five earlier in the report. Reference can be made to thosesections concerning reporting definitions, e.g., sectors and pesticide classes, along with principal datasources/methods for the time series of three-year periods covering the years 1929 through 1997. Appendix 4 A contains master tables for the home and garden sector usage (along with other sectorsreported separately) covering the 1929/97 period.
The sector breakouts for home and garden applications presented in this section areapproximations based on best available information and judgement of the author. Firm, precise, figureswere particularly limited for the earlier years of the period from 1929 through 1997. Estimates of activeingredient usage (and user expenditures) on an annual basis for the home and garden sector have beenpreviously published in the EPA Pesticide Market Series for 1979 through 1997. (Aspelin and Grube,EPA, November,1999) Those figures were adopted for computing the three year averages presented inthis section. Reference was made to; the SRI Chemical Handbook Series, which has estimates going backas far as 1965; RvR Consultants Pesticide Market Studies for alternate years from 1974 through 1986;Kline Consumer Markets studies covering alternate years during the 1980's and 1990's; EPA home andgarden pesticide studies for 1976/77, 1985 and 1990; DPRA study of impacts from FIFRA as amendedin 1972 (DPRA, December, 1975); SRI study for CEQ covering 1950/70 with inferences about therelative sizes of homeowner and other market shares of U.S. pesticide usage (SRI, April, 1972); USDAPesticide Situation and Pesticide Reviews, which have various estimates of home and garden, professionaland agricultural usage (by chemical or groupings), going back as far as the 1940's in some cases (USDA,most years, 1952/53 through 1980); a study on usage of major pesticides by sector for CEQ by vonRumker and Lawrence (1974); a contract study for EPA presenting a profile of pesticide usage, with longterm statistical series on production and usage by sector for numerous pesticides (ICF, August, 1980) andUSDA annual Agricultural Statistics editions, which from time to time have information that can be used toapportion national usage to usage sectors, covering years as early as 1919.
Many other sources were consulted including: a book by Shepard containing valuableinformation on quantities of the older pesticides, by use site, going back to 1900 and earlier (Shepard,1951); a book on spraying, dusting and fumigating of plants (Mason, 1928); a rather comprehensive bookon chemistry and use of pesticides by Frear (1942 and 1955 editions); USDA homeowner and farmerbulletins starting as early as 1908 (Marlatte, M.S., 1908); an early manual on control of weeds bychemical and other means (Mason, 1933); a manual on tree and shrub insects and their control (Felt,1924); a 1920's manual on vegetable garden insects (Crosby, 1918); an early book on how to identify andcontrol injurious insects (O'Kane, 1915). Based on the above noted sources and others, estimates weremade of usage in the home and garden sector. The resulting estimates for three year periods are thoughtby the author to be representative
Part 6, Page 15
of general levels of usage and trends over time.
2. Conventional and Other Pesticide Chemicals, Aggregate Usage
Presented in Figure 6-8 are estimates of conventional pesticide usage, other pesticide chemicals,and the total of these, for the home and garden sector covering the 1929/97 period. The values areaverages per year for three year periods. The following observations can be made:
• the usage of conventional pesticides increased quite steadily from about 10 million poundsper year in the mid-1930's to about 85 million pounds per year around 1980; since then ithas declined to75 million in the most recent period;
• other pesticide chemical usage increased from about 30 million pounds per year in themid-1930's to a peak of about 115 million per year around 1960; since then such usagehas been generally in the range of 60 to 80 million pounds per year;
• the total of conventional and other pesticide chemical usages was at a low 40 millionpounds per year in 1932/34 and increased to 154 million pounds per year in 1959/61; usage was somewhat lower until around 1980 when usage returned to 150 million plusrange; during the last 10 years overall home and garden usage has declined slightly, to135 million pounds per year in 1995/97.
3. Conventional and Other Pesticide Chemicals, Per Capita Usage
The above aggregate usage figures have been divided by U.S. civilian population to place usage bythe home and garden sector on a per capita basis. The results are shown in Figure 6-9, graphically, alongwith a table. A pattern which emerges is generally lower levels of usage since 1959/61 when usage was0.85 pounds per capita, especially rather consistently since 1977/79 to a 1995/97 level of about one halfpound per capita.
Part 6, Page 16
5240 43
66
92
107 112
125 121
143154
137129 130 133
143153 154 151 146 143
136 135
19311934
19371940
19431946
19491952
19551958
19611964
19671970
19731976
19791982
19851988
19911994
1997
Three Years Ending
0
50
100
150
200
Mill
ion
s o
f Po
un
ds
Per
Per
Yea
r
Other ChemicalsConventional
Excludes wood preservatives and biocides
Volume of Pesticide Active Ingredient Usage in U.S., Conventional and Other Pesticide Chemicals with Total,Home and Garden Sector, Three Year Periods Ending 1931-97Figure 6-8
Volume of Pesticide Active Ingredient Usage Per Capita in U.S., Conventional and Other Pesticide Chemicals with Total,Home and Garden Sector, Three Year Periods Ending 1931-97Figure 6-9
4. Conventional and Other Pesticide Chemical Usage, by Class
The estimates of aggregates for conventional and other pesticide chemicals used by homeownersare presented in Figure 6-10 with breakouts by pesticide class for the period of 1929 through 1997. Thefollowing observations can be made:
• herbicide usage has increased steadily since WWII;• insecticide/miticide usage has declined somewhat since around 1980;• petroleum/oil and sulfur usage has declined since the 1960's;• other pesticide chemicals, consisting largely of moth treatment chemicals, have remained
at a relatively high level since the 1950's.
Part 6, Page 19
52
40 43
67
93
108
112 12
6
123
147 15
8
139
129
130
133 14
3 153
154
151
146
143
136
135
Three Years Ending
0
50
100
150
200
Mill
ions
of P
ound
s
Other ChemicalsPetroleum/OilSulfurOther Conventional
D. Home and Garden Pesticide User Expenditures, 1979/1997
Aggregate user expenditures are presented in Figure 6-11 for the home and garden sector for theyears of 1979 through 1997. These are as previously published in the EPA market report and are innominal dollars. Expenditures have about doubled from about $1.01 billion in 1979 to $2.01 billion in1997. Most of the increase has occurred due to more expenditures for herbicides and plant growthregulators, aside from general price trends which are dealt with below.
Figure 6-12 contains home and garden pesticide usage expenditures for 1979/97 in constant 1997dollars to take out the impact of inflation. The result was that expenditures have remained about the sameat about $2.0 billion per year since 1979. When placed on a per capita basis, expenditures have declinedsomewhat over the period, i.e., from about $9.10 to $7.70. Obviously, home and garden pesticides are aminor percentage of the average household budget, which has not been increasing during the last twodecades.
The purpose of Part Seven of this report is to present comprehensive trend information on theextent of pesticide usage in the industrial/commercial/governmental sectors of the U.S., by types ofchemicals used. As has been discussed earlier in this report, notably in Part Three, theindustrial/commercial/governmental pesticide usage sector is often referred to as the "professionalmarket." In general, it covers applications of conventional pesticides and other pesticide chemicals bycertified and/or professional applicators in the non-agricultural sectors of the U.S. economy, includingapplications to homes and gardens by professionals. The professional market includes applications bypest control operators, lawn services, arborists, exterminators, public health applicators, animal careprofessionals and many other types of professionals who apply pesticides, which may be for-hire orbe part of a firm, business or agency. Personnel with federal agencies such us Animal Health andProtection Service (of USDA) apply pesticides as do staff/contractors of state/localagencies/governments.
A brief profile is presented of the professional pesticide applicator sector, followed by historicalinformation and trends on the quantities of pesticides used, by type, covering about 70 years, using thesame approach and data sources used in preceding sections. Information is also presented on pesticideexpenditures for applications by professional applicators in the non-agricultural sectors. The samebasic approach and data sources were used in Part Seven as in the earlier parts of this report.
A. Profile of Professional Pesticide Applicator Sector
1. Profile of Applicators and Certifications
The industrial/commercial/governmental sector consists of applicators which apply pesticidesto a very diverse set of sectors, land uses and aquatic areas. The diversity is suggested by thecategories which are used for certifying applicators for application of restricted-use pesticides underFIFRA sec. 3 and 40 CFR 171. There are twelve broad categories of applicator certification of whichten generally relate to the non-farm application sectors (Table 7-1 and Figure 7-1). The two categoriesof "agricultural plant" and "agricultural animal" relate primarily to farm/ranch applications. In order toapply restricted-use pesticides, applicators must be certified as competent to apply such pesticides bymeeting national standards set by EPA. The applicators are trained and certified under cooperativeprograms involving EPA, USDA and the State Extension Services. Commercial applicators arerequired in all states to be recertified every three to five years to maintain certification (See: PesticideApplicator Certification and Training Program, information sheet, EPA/OPP, 1999)
Part 7 Pg. 2
Table 7-1 Number of Pesticide Applicator Certifications by CertifcationCategory and Total Number of Applicators with Certifications,, U.S., FY97
Certification Category No. (000) Percent
Agricultural plant 100 18.8Agricultural animal 6 1.1Forest 12 2.3Ornamental and turf 145 27.2Seed treatment 5 0.9Aquatic 20 3.8Right-of-way 57 10.7Ind., instit., structural, and health 130 24.4Public Health 11 2.1Regulatory 2 0.4Demonstration and research 13 2.4Other 32 6.0Total certifications 533 100.0
Total applicators 375
NOTE: Total of certifications exceeds number of applicators due to multiplecertifications. Numbers are for individuals certified under FIFRA sec. 23c andRegulation 40 CFR 171 under state/federal program.SOURCE: EPA/OPP pesticide applicator files, Michael Walsh, 7/20/99
Number of Pesticide Applicator Certifications by Certification Categoryand Total Number of Applicators with Certifications, U.S., FY97Figure 7-1
Part 7 Pg. 4
As of FY 1997, there were approximately 533,000 applicator certifications, involving 375,000individual applicators. The number of certifications exceeds the total number of applicators due tomultiple certifications of many applicators. By far the leading categories of non-agricultural certificationsare ornamental and turf (145,000) and industrial/institutional/structural and health (130,000), the lattercategory generally referred to as pest control operators (PCO's). The third ranking non-agriculturalcategory of certifications is right-of-way (ROW) with 57,000 certifications. About 65,000 commercialapplicators are newly certified each year, along with 120,000 which are recertified annually.
The above certifications of applicators are separate from the certifications of individuals as"private applicators", which in general is for farmers/ranchers applying pesticides to their own operatedland or that of neighbors. As of FY 1997, there were about 875,000 certified private applicators in theU.S. (See Table 5-1 of this report.)
Limited profile information is available about the overall certified/commercial pesticideapplication sector. EPA conducted a study of five major certification categories for the year 1993.(EPA, May 30, 1995). ( This study is commonly referred to as the certified/commercial pesticideapplication study, C/CPAS.) The categories covered were turf/ornamental, ROW, aquatic, structural(industrial., institutional., structural and health-related) and public health. These categories account for amajority of the certifications for non-agricultural pesticide applications. EPA conducted a related, morelimited, study for the year 1981, covering turf, tree and structural applications. (EPA, July, 1985) Presented below is profile information primarily from the EPA the study for 1993, C/CPAS
In the C/CPAS study, it was estimated that there were 165,500 certified applicators in the fivemajor categories in 1993, of which 69,800 were for hire (42 percent) and 95,700 were not for hire. The estimates of totals for the five broad categories are broken down into 11 mutually exclusivesubcategories. (Table 7-2 and Figure 7-2a). Turf/ornamental only and structural only were the leadingcategories. The third ranking category was ROW only, with 17,200 applicators, most of which werenot for hire.
The C/CPAS study also estimated that there were 29,500 commercial applicators for hirewhich were not certified. These applicators, along with the 165,500 certified, bring the total ofcertified and not certified for hire to about 195,000 for the five major certification categories. Theapplicators for hire (certified 69,800 and not certified 29,500) were associated with a total of 33,100businesses, of which turf/ornamental only and structural only were the most common, accounting forabout two-thirds of the total. (Table 7-2 and Figure 7-2b)
Part 7 Pg. 5
Table 7-2 Number of Non-agricultural Pesticide Applicators by For-hire and Certification Status and Number ofBusinesses in U.S., 1993, Covered by Five Major Non-agricultural Certification Categories (Turf/Ornamental, ROW,Aquatic, Structural and Public Health)
Certification Category For Hire,Certified
Not ForHire,
Certified
Certified, Total Not Certified, forHire
No. ofBusinesses
(000) (000) (000) (000) (000)
Turf and ornamental only 19.3 39.5 58.8 5.4 11.2Right-of-way (ROW) only 4 13.2 17.2 4.8 0.6Aquatic only 0.5 4.2 4.7 0.3 0.2Structural only 21.9 15.2 37.1 5.2 10.2Public health only 0.2 6.9 7.1 0.1 0.1Turf, orna. and ROW 3.8 4.2 8.1 0.4 1.3Turf, orna. and aquatic 0.6 2.5 3.1 0.1 0.2Turf, orna. and structural 7.1 2.2 9.3 9.1 3.1Turf, orna., ROW and structural 1.3 1.4 2.7 0.4 0.7Other combinations 4.5 5.3 9.8 1.1 1.4Unknown 6.5 1.1 7.6 2.7 4TOTAL 69.8 95.7 165.5 29.5 33.1
NOTE: Total of certifications exceeds number of applicators due to multiple certifications. Numbers are forindividuals certified under FIFRA sec. 23c and Regulation 40 CFR 171 under state/federal program.SOURCE: Certified/Commercial Pesticide Applicator Survey (C/CPAS), EPA/OPP, 5/95, Tables 2 and 6.
Part 7 Pg. 6
58.817.2
4.737.1
7.18
3.19.3
2.79.8
7.6
Turf and ornamental onlyRight-of-way (ROW) only
Aquatic onlyStructural only
Public health onlyTurf, orna. and ROW
Turf, orna. and aquaticTurf, orna. and structural
Turf, orna., ROW and structuralOther combinations
UnknownCer
tifi
cati
on
Cat
ego
ry
0 10 20 30 40 50 60 70
Thousands
For HireNot for Hire
Number of Certified Non-agricultural Pesticide Applicators by For-hire Status and Certification Category, U.S., 1993, Covered by Five Major Non-Agricultural Certification CategoriesFigure 7-2a
For Hire
Not for Hire
Total
Turf and ornamental onlyRight-of-way (ROW) onlyAquatic only Structural only Public health only Turf, orna. and ROWTurf, orna. and aquaticTurf, orna. and structuralTurf, orna., ROW and structuralOther combinations Unknown
19.3 4 0.5 21.9 0.2 3.8 0.6 7.1 1.3 4.5 6.5
39.5 13.2 4.2 15.2 6.9 4.2 2.5 2.2 1.4 5.3 1.1
58.8 17.2 4.7 37.1 7.1 8 3.1 9.3 2.7 9.8 7.6
Part 7 Pg. 7
11.2
0.6
0.2
10.2
0.1
1.3
0.2
3.1
0.7
1.4
4
33.1
Turf and ornamental only
Right-of-way (ROW) only
Aquatic only
Structural only
Public health only
Turf, orna. and ROW
Turf, orna. and aquatic
Turf, orna. and structural
Turf, orna., ROW and structural
Other combinations
Unknown
TOTAL
Cer
tific
atio
n C
ateg
ory
0 5 10 15 20 25 30 35
Thousands of Firms
Number of Pesticide Application Businesses by Certification Category, U.S., 1993Five Non-agricultural Certification Categories OnlyFigure 7-2b
Part 7 Pg. 8
Certified applicators not-for-hire (a total of 95,700 in FY97) are most commonly withthe public sector (31,700) followed by golf courses (11,100). Many persons holdingcertifications are not actually applying pesticides (33,100), based on the C/CPAS. (Table 7-3and Figure 7-3)
Table 7-4 presents the distribution of certified applicators covered in the C/CPASstudy by for-hire status and certification category (see also Figure 7-4), along with thenumbers of corresponding certifications. There were an estimated 165,500 applicators havingone or more certifications, with a total of 208,600 certifications. Turf/ornamental was themost common category for applicators and certifications, followed by structural.
Table 7-5 and Figure 7-5 present a summary of for-hire pesticide applicators bycertification status and certification type. More than twice as many applicators are certifiedthan not certified (69,800 compared with 29,500 not certified). Turf/ornamental and structuralare the leading categories in terms of applicator numbers and a majority of these applicatorsare certified, e.g., more than three-fourths certified.
Part 7 Pg. 9
Table 7-3 Numbers of Not-For-Hire Certified Pesticide Applicators byEmployers' Type of Business, U.S.,1993, Covered by Five MajorCertification Categories
NOTE: Five non-agricultural certified/commercial applicatorcategories are turf/ornamental, ROW, aquatic, structural, and publichealth.Numbers are for individuals certified under FIFRA sec. 23c andRegulation 40 CFR 171 under state/federal program.SOURCE: Certified/Commercial Pesticide Applicator Survey(C/CPAS), EPA/OPP, 5/95, Table 7.
Part 7 Pg. 10
11.1
3.4
31.7
2.5
4.9
8.9
33.1
95.7
Golf course
Nursery
Public/gov't.
Utility
Trans./ind./other comm.
Other/unknown
No application
TOTAL
Em
ploy
ers
busi
ness
0 20 40 60 80 100 120
Thousands of applicators
Numbers of Not-For-Hire Certified Non-agricultural Pesticide Applicators by Employers' Type of Businesss, U.S.,1993Five Non-agricultural Certification Categories OnlyFigure 7-3
Part 7 Pg. 11
Table 7-4 Numbers of Certified Pesticide Applicators and Certifications, by For-hire Status and Certification Type, Five MajorNon-agricultural Certification Categories, U.S., 1993
NUMBER OFAPPLICATORS
Certification Type For-hire Not-for-hire Total(000) (000) (000)
Turf/ornamental 35.0 52.4 87.5 ROW 11.4 22.9 34.2Aquatic 2.5 9.9 12.4 Structural 33.9 21.3 55.2 Public health 2.7 9.1 11.8 Unknown 6.5 1.1 7.6 Any of above 69.8 95.7 165.5
NUMBER OFCERTIFICATIONS
Certification Type For-hire Not-for-hire Total(000) (000) (000)
Turf/ornamental 55.4 70.5 125.8 ROW 22.1 37.6 59.6Aquatic 6.0 19.1 25.1 Structural 49.9 31.4 81.4 Public health 7.2 13.1 20.3 Unknown 6.5 1.1 7.6 Any of above 92.0 116.6 208.6
NOTE: Numbers are for individuals certified under FIFRA sec. 23cand Regulation 40 CFR 171 under state/federal program.SOURCE: Certified/Commercial Pesticide Applicator Survey(C/CPAS), EPA/OPP, 5/95, Table 4.
Part 7 Pg. 12
87.4
34.3
12.4
55.2
11.8
7.6
165.5
Turf/ornamental
ROW
Aquatic
Structural
Public health
Unknown
Any of above
Cer
tific
atio
n Ty
pe
0 50 100 150 200
Thousands of Applicators
For-hireNot-for-hire
Number of Certified Non-Agricultural Pesticide Applicators, by Certification Category and and For-Hire Status, U.S., 1993, Five Non-agricultural Certification Categories OnlyFigure 7-4
For-hire
Not-for-hire
Total
Turf/ornamental ROW Aquatic Structural Public health Unknown Any of above
35 11.4 2.5 33.9 2.7 6.5 69.8
52.4 22.9 9.9 21.3 9.1 1.1 95.7
87.4 34.3 12.4 55.2 11.8 7.6 165.5
Part 7 Pg. 13
Table 7-5 Number of Pesticide Applicators for Hire, by Certification Status and Type forFive Major Certification Categories, U.S., 1993
Certification Type Certified Not Certified Total(000) (000) (000)
Turf and ornamental only 19.3 5.4 24.7Right-of-way (ROW) only 4 4.8 8.7Aquatic only 0.5 0.3 0.8Structural only 21.9 5.2 27.1Public health only 0.2 0.1 0.3Turf, orna. and ROW 3.8 0.4 4.3Turf, orna. and aquatic 0.6 0.1 0.7Turf, orna. and structural 7.1 9.1 16.2Turf, orna., ROW and structural 1.3 0.4 1.7Other combinations 4.5 1.1 5.6Unknown 6.5 2.7 9.2TOTAL 69.8 29.5 99.3
NOTE: Numbers are for individuals certified under FIFRA sec. 23c and Regulation 40CFR 171 under state/federal program.SOURCE: Certified/Commercial Pesticide Applicator Survey (C/CPAS), EPA/OPP,5/95, Table 6.
Part 7 Pg. 14
24.78.8
0.827.1
0.34.2
0.7
16.21.7
5.69.2
99.3
Turf and ornamental onlyRight-of-way (ROW) only
Aquatic onlyStructural only
Public health onlyTurf, orna. and ROW
Turf, orna. and aquaticTurf, orna. and structural
Turf, orna., ROW and structuralOther combinations
UnknownTOTALC
ertif
icat
ion
Cat
egor
y
0 20 40 60 80 100 120
Thousands
CertifiedNot Certified
Number of For-hire Non-Agricultural Pesticide Applicators, by Certification Category and Certification Status, U.S., 1993Figure 7-5
Certified
Not Certified
Total
Turf and ornamental onlyRight-of-way (ROW) onlyAquatic onlyStructural onlyPublic health onlyTurf, orna. and ROWTurf, orna. and aquaticTurf, orna. and structuralTurf, orna., ROW and structuralOther combinationsUnknown TOTAL
As has been noted above, the professional market involves numerous applicators which canbe broken down into a number of categories or types which tend to follow such things as lines ofbusiness, professional disciplines, type of pesticide, economic sector and type of pest. There is nolimit to the various breakouts that could be made of the applicator/user sector in the professionalmarket. An example of profile information is presented in Table 7-6, which shows some of themajor segments covering turf/ornamentals, industrial vegetation control, structural and others. Theidentification of segment/categories is as used in general terms by one of the leading pesticidemarket research firms. It is not intended to be complete or exhaustive of the professional marketand the numbers presented are rough approximations, for recent years, e.g., circa 1995/99.
Part 7 Pg. 16
Table 7-6 Profile Information on Selected Non-agricultural Pesticide Applicator Segments
TURF AND ORNAMENTALSLawn care operators 18,000 professional applicators of pesticides to residential
and commercial lawns; include lawn mowing and landscapingGolf courses 15,000 public and private golf coursesInstitutional turf 15,000 identifiable state, county and municipal parks, and
park systems; 3,700 colleges; 15,000 local school districts;7,000 actively maintained cemeteries.
Landscape contractor 22,000 professional landscapers who also apply pesticides tolawns and gardens; low pesticide usage per establishment.
Nursery and greenhouse 42,000 growers of ornamental plants; includes all outdoorand under cover growing.
Turf farms 1,800 growers of commercial turf for use in residential orcommercial lawns, who also belong to national association.
INDUSTRIAL VEGETATION CONTROLElectric utilities 3,200 investor owned, rural coop, and muni. utilities which
maintain over 6 million miles of ROW for power linesRoadways 39,000 muni., county, state, and federal governing bodies
maintaining nearly 4 million miles of roads in U.S.Railroads 12 Class I railroads that maintain 182,000 miles of track,
85% of the total track miles in U.S.Industrial facilities over 14,000 facilities involved in petroleum, chemicals, bulk
storage and primary metals that may require weed control.Pipelines 20 largest pipeline co's. accounting for over 1 million miles of
pipelines in U.S., most of which need vegetation control.
Part 7 Pg. 17
STRUCTURAL PEST CONTROLPest control operators (PCO's) 14,000 PCO establishments who apply pesticides to
residential and other sites; 17 to 18 million residences treatedper year.
OTHERAquatic areas Public and private end users, including professional
applicationsForestry Public and private forest lands, mostly weed control, focused
on private holdings totaling 70 million acres out of total ofabout 600 million acres.
Mosquito abatement districts Mosquito control products applied by applicators at directionof over 900 mosquito control districts; acres available fortreatment total 103 million out of total of 690 million.
NOTE: Listing is not intended to be exhaustive or cover all non-ag sectors; numerical values are roughapproximations. SOURCE: Kline & Company, Inc., Briefing document by Mancur Cyr, May 6, 1999
Part 7 Pg. 18
B. Brief History of Pesticide Applicator Industry
The professional pesticide applicator industry we have today can be traced back to earliest times aspeople have struggled with pests of various sorts in the home, in industry, in commerce and in government. According to Snetzinger (1983), the history of applying pest control technology in the western world goes backto an early period of antiquity, e.g., 300 to 400 AD. (p. 245) In these early times, artisans or specialists wereusing various chemical and non-chemical controls for pests. Examples include apothecaries, embalmers, shipbuilders, and chandlers. Its history can be traced through five other somewhat overlapping ages including: MiddleAges/Renaissance (1200-1700 A.D.); the industrial revolution (1750-1930); professionalization (1933-1960+); modern chemical pesticides (1940-1975+); and environmental concern and regulation (1962 and later). Thefirst three periods were of long duration, with serious pest problems, and limited knowledge of technology/scienceabout pests. (Snetzinger, p. 245)
During the 12th Century in Europe, itinerant peddlers provided poisons and traps for rodent control. Alchemists and others discovered improved poisons by trial and error for vermin control. Ratcatching and verminexterminating became a livelihood for some persons as technology improved and trade expanded betweenEurope and the rest of the world. By the 18th Century, the itinerant ratcatchers had begun to settle down andoperate out of regular places of business, with ads, established accounts and competition with one another overclaims of control effectiveness, trade secrets, etc. About the middle of the 19th Century, some of the Europeanexterminators emigrated to the U.S. and used available chemistry for pest control which remained quite primitiveuntil around 1920. Arsenical and lead based chemicals became generally available for pest control, enablinggrowth of pest control operations. In the late 1920's, the more aware and ethical elements of the applicatorindustry began to band together to share ideas. They organized to promote regulation that would improve ethicalstandards and eliminate unscrupulous operators. Eventually, there was reluctant support from USDA, Fish andWildlife Service, land grant colleges and universities as the applicators professionalized. (Snetzinger, p. 246/47)
An example of the timing and growth of professionalism in pest control is provided by the history of thecurrent Pest Control Operators of California, Inc. and predecessor organizations. (http:///www.pcoc/org) Thishistory document indicates that 60 years ago, the pest control operators in California were "an unregulatedindustry" and "many consumers were being bilked by itinerant pest control impostors." In 1932, a number of pestcontrol operators in California joined together to promote industry standards and regulation. In 1935, Californiapassed the nation's first state structural pest control act directly focused on pest control operators.
The emergence of the synthetic organic pesticide industry in the 1940's manufacturing new highly effectivepesticides made possible the rapid growth and expansion of the pest control industry. Simultaneously, thedemand for pest control increased dramatically with the end of the Depression, WWII and ensuing economicgrowth, which has continued to date. People have increasingly demanded freedom from pestilence in the home,industry and elsewhere, in an ever more urban society. The result has been a growing role for the pest controloperator, both for hire and as a part of businesses, organizations, industry, institutions and government agencies atvarious levels.
Part 7 Pg. 19
The professional pesticide market of today consists of not only the applicators for hire, but those who areprofessionals in entities which are not pest control firms, but engaged primarily in other activities or pursuits. Aswas noted above in this section of the report, the C/CPAS survey indicated that there were more not-for hirecertified applicators than for hire (95,700 compared with 69,800 for hire as of 1993). (Table 7-4) Turf/ornamental, ROW and structural are the principal types of applicators that are not for hire. (Table 7-4)
Methods of application of pesticides in the professional market are very diverse such as, hand sprayers(dusters), ground boom and blast sprayers/dusters, directed aerosols, fumigant aerosols/canisters, fixed wing andhelicopter applications, injections and others. This diversity of application equipment types and methods hasevolved as influenced by emergent pest control needs, chemicals, user industry structure/characteristics andregulations.
Aerial applications of pesticides began with agricultural crops in 1921/22, but probably began to be usedon non-crop sites by WWII. Interestingly enough, Delta Air Lines history started with founding of the worlds firstaerial crop dusting organization—Huff Daland Dusters in 1924. This firm was founded to dust cotton in Georgiaand its parent firm (Huff Daland Mfg., Co) soon designed aircraft specifically for pesticide application. Itacquired a fleet of aircraft and diversified operations to include applications to crops in Peru to take advantage ofthe opposite seasons south of the equator.
At this point, data are not at hand as to the extent of pesticide application by aerial or other methods ofapplication in the professional market. No doubt aerial applications account for significant shares of theprofessional market such as for ROW for pipelines, utilities, forestry, etc.
Part 7 Pg. 20
C. Professional Market Pesticide Usage, by Type, 1929/97
1. Approach and Data Sources
The approach used in this section to report trends for professional market usage(industrial/commercial/governmental sector) is in line with the presentations made in the preceding Parts Threethrough Six. Reference can be made to those sections concerning definitions, e.g., sectors and pesticide classes,along with the principal data sources/methods for the time series of three-year periods covering 1929 through1997. Appendix Table Three A contains master tables for the professional market covering three-year periodsfor 1929 through 1997. In addition to active ingredient usage, estimates of user expenditures for the professionalmarket are presented on an annual basis for 1979 through 1997. Estimates of user expenditures for theprofessional market (and aggregate active ingredient usage) have been previously published in the EPA PesticideMarket Series for 1979 through 1997 on an annual basis (rather than three year averages as presented in thisreport). (Aspelin and Grube, EPA, November, 1999)
2. Conventional and Other Pesticide Chemicals, Aggregate Usage
Presented in Figure 7-6 are estimates of conventional pesticide usage, other pesticide chemicals, and thetotal of these, for the professional market covering the 1929/97 period. The values are averages per year forthree year periods. The following observations can be made:
• the usage of conventional pesticides increased quite steadily from about 50 to 60 million poundsper year in the early to mid-1930's to about 210 to 220 million pounds per year from the mid-1960's until around 1980; since then it has declined to just under 130 million per year;
• other pesticide chemical usage increased from about 15 million pounds per year in the mid-1930's to a peak of about 50 million per year during 1956/1967; since then such usage hastended to decline to a level of about 20 million pounds per year during most recent years;
• the total of conventional and other pesticide chemical usages was at a low of about 50 millionpounds per year in 1932/34 and increased to 267 million pounds per year in 1965/67; sincethen, total usage has declined rather steadily to150 million per year in 1995/97.
3. Conventional and Other Pesticide Chemicals, Per Capita Usage
The above aggregate usage figures have been divided by U.S. civilian population to place usage in theprofessional market sector on a per capita basis. The results are shown in Figure 7-7, graphically, along with atable. A pattern which emerges is consistently lower levels of usage per capita since 1965/67 when usage wasabout 1.5 pounds per capita. For 1995/97, usage was about 0.7 pounds per capita. This compares with about0.5 pounds per capita for the home and garden market (Figure 6-9) and 3.6 pounds per capita for agriculturalusage (based on 947 million pounds of active ingredient from Figure 5-2 and 265 million population for 1995/97).
Part 7 Pg. 21
6349
5980
115
147 137153 155
181
212225
267 259246 243 240 231
221205
191169
150
19311934
19371940
19431946
19491952
19551958
19611964
19671970
19731976
19791982
19851988
19911994
1997
Three Years Ending
0
100
200
300
Mill
ions
of P
ound
s P
er Y
ear
Other Chemicals
Conventional
Excludes wood preservatives and biocidesIncludes applications by professionals to homes and gardens
Volume of Pesticide Active Ingredient Usage in U.S., Conventional and Other Pesticide Chemicals with Total,Industrial/Commercial/Governmental Sector, Three Year Periods Ending 1931-97Figure 7-6
Excludes wood preservatives and biocidesIncludes applications by professionals to homes and gardens
Volume of Pesticide Active Ingredient Usage Per Capita in U.S., Conventional and Other Pesticide Chemicals,With Total, Industrial/Commercial/Governmental Sector, Three Year Periods Ending 1931-97Figure 7-7
4. Conventional and Other Pesticide Chemical Usage, by Class
The estimates of aggregates for conventional and other pesticide chemicals used in the professionalmarket are presented in Figure 7-8 with breakouts by pesticide class for the period of 1929 through 1997. Thefollowing observations can be made:
• herbicide usage emerged with significant quantities during WWII, held at about 75/85 millionpounds per year through 1983/85 and has declined since to about 50 million pounds per year;
• insecticide/miticide usage was already established by 1929/31, was in the general range of 35 to45 million pounds per year for 1961/91 and has since declined somewhat;
• fungicide usage expanded sharply during WWII and his remained at similar levels much of the last 50 years, showing some declines in the last decade;
• petroleum/oil and sulfur usage has remained much the same during the last 30 years; and• fumigant/nematicide usage expanded during WWII, leveled off during the 1960's and 1970's, and
has declined to some degree during the last decade..
Part 7 Pg. 24
64
50
61
82
118
150
139 15
6
160
191
225
231
267
259
246
243
240
231
221
205
191
169
150
19311934
19371940
19431946
19491952
19551958
19611964
19671970
19731976
19791982
19851988
19911994
1997
Three Years Ending
0
50
100
150
200
250
300
Mill
ions
of P
ound
s
Other ChemicalsPetroleum/Oil
SulfurOther Conventional
Fumigant/NematicideFungicide
Insecticide/MiticideHerbicide/PGR
Includes pesticides applied by professionals to homes and gardens
Volume of Pesticide Active Ingredient Usage in U.S. Industrial/Commercial/Governmental,Sector, By Type of Pesticide, Three Year Periods Ending 1931-97Figure 7-8
D. Professional Market Pesticide User Expenditures, 1979/1997
Aggregate user expenditures are presented in Figure 7-9 for the professional market for the years of1979 through 1997. These are as previously published in the EPA market report and are in nominal dollars. Expenditures have increased by about one-half from about $1.09 billion in 1979 to $1.53 billion in 1997. Muchof the increase is in insecticides/miticides, for which expenditures more than doubled over the nearly 20 years. Increases for herbicides and other types of pesticides have been much more nominal.
Figure 7-10 contains estimates of professional market user expenditures for 1979/97 in constant 1997dollars to take out the impact of inflation. The result was that expenditures in real terms declined from about $2.2billion in 1979 to $1.5 billion in 1997. When placed on a per capita basis, expenditures have declined rathersignificantly, reflecting the above aggregate trends and increasing population. On a per capita basis, expendituresdeclined from about $9.80 to $5.70 between 1979 and 1997. Professional market pesticides equal a minorpercentage of the average household budget, and have been declining in real terms during roughly the last twodecades.
Excludes wood preservatives and biocides.Current dollars
Expenditures for Pesticides Applied by Industrial/Commercial/Governmental Sector, U.S., 1979-97Including Applications by Professionals to Homes and GardensFigure 7-9
Expenditures for Pesticides Applied by Industrial/Commercial/Governmental Sector, U.S., 1979-97Total Expenditures and Per Capita, Including Applications by Professionals to Homes and Gardens in 1997 Dollars Figure 7-10
Andrilenas, P., T. Eichers, and A. Fox. 1967. Farmer’s Expenditures for Pesticides in 1964:Agricultural Economic Report No. 106. Washington, DC : U.S. Department of Agriculture.Economic Research Service.
U.S. Department Agriculture. July, 1997. An Economic Research Service Report: AgriculturalResources and Environmental Indicators, 1996-97, Washington, DC :.
Aspelin, Arnold L. 1994. Pesticides Industry Sales And Usage: 1992 and 1993 MarketEstimates. U.S. Environmental Protection Agency, Washington, DC:
Aspelin, Arnold L. 1997. Pesticides Industry Sales And Usage: 1994 and 1995 Market Estimates.
U.S. Environmental Protection Agency, Washington, DC : Aspelin, Arnold L. and Arthur H. Grube. 1999. Pesticides Industry Sales and Usage: 1996 and
1997 Market Estimates. U.S. Environmental Protection Agency, Washington, DC:
Barnard, C., Daberkow, S., Patgitt, M. 1997. Alternative Measures of Pesticide Use. Washington,DC : Economic Research Services. US Department of Agriculture.
Bohmont, B. L. 1981. The New Pesticide User’s Guide. B & K Enterprises, Inc.
Briggs, Shirley A. 1992. U.S. Federal Regulation of Pesticides, 1910-1988, in Basic Guide toPesticides: Their Characteristics and Hazards, Omega by Hemisphere Publ. Co.,
Brown, A. W. A., M.B.E, B.Sc.F., Ph.D. 1951. Insect Control by Chemicals. New York : JohnWiley & Sons, Inc.
Carleton, M. A. 1916. The Small Grains. New York : The Macmillan Company.
Carson, R.. 1962. Silent Spring. Fawcett Greenwich CT: Publications, Inc.
Cone, B. W., Laughlin B. M., McGinnis K. A. 1975. The Impact of Federal Crop Support Policiesand Acreage Allotment Programs on the Agricultural Use of Chemical Pesticides.Battelle. Pacific Northwest Laboratories.
Crafts, A. S. 1961. The Chemistry and Mode Of Action of Herbicides. New York : IntersciencePublishers.
Crosby, C. R., Leonard, M. D.1918. Manual of Vegetable-Garden Insects. New York : TheMacmillan Company.
2
Davidson, R. H., Peairs, L. M. 1966. Insect Pests of Farm, Garden, And Orchard. Sixth Edition.New York : John Wiley & Sons, Inc.
ICF Incorporated. August, 1980. Economic Profile of the Pesticide Industry, Report Volume andExhibits. Contractor report prepared for U.S. Environmental Protection Agency, Office ofPesticide Programs, Washington, DC:
U.S. Council of Economic Advisors. 1999. Economic Report of the President, Transmitted to theCongress. The Annual Report of the Council of Economic Advisers. Washington, DC. UntiedStates Government Printing Office.
Eichers, T., P. Andrilenas, R. Jenkins, and A. Fox. 1968. Quantities of Pescicides Used by Farmersin 1964, Agricultural Econo-ic Report No.131. Washington, DC : Economic ResearchService. U.S. Department of Agriculture.
Eichers, T., P. Andrilenas, H. Blake, R. Jenkins, and A. Fox. 1970. Quantities of Pesticides Used byFarmers 1966 , Argicultural Economic Report No. 179. Washington DC : EconomicResearch Service. U.S. Department of Agriculture.
Eichers, T., R. Jenkins, and A. fox. 1971. DDT Used in Farm Production, Agricultural Economicreport No. 158. Washington, DC : U.S. Department of Agriculture. Economic ResearchService.
Ennis, W. B., Jr., and McClellan, W. D. 1964 Chemicals in Crop Production. Washington, DC.: inYearbook of Agriculture, 1964. U.S. Department of Agriculture.
Blake, Helen T. et al. 1970. Farmers’ Pesticide Expenditures in 1966. 1970. AgriculturalEconomic Report No. 192. Washington, DC : Economic research Services. U.S. Departmentof Agriculture.
Felt, E. P. 1924. Manual of Tree and Shrub Insects. New York : The Macmillian Company.
Fleming, Walter E. 1930. Lawns Protected by Lead Arsenate from Beetle-grub Injury, inYearbook of Agriculture, 1930. Washington, DC: US Department of Agriculture.
Fox, A., T. Eichers, P. Andrilenas, R. Jenkins, and H. Blake. 1968. Extent of Farm Pesticide Use onCrops in 1966. Agricultural Economic Report No. 147. Washington, DC : EconomicResearch Service, U.S. Department of Agriculture.
Frear, Donald E.H. 1942. Chemistry of Insecticides and Fungicides. New York: D. Van
3
Nostrand Co.
Global Crop Protection Federation.. 1998. Status Report & Recommended Fungicide ResistanceManagement Guidelines.1998. Fungicide Resistance Action Committee(FRAC). BrusselsBelgium.
Gale, J. F., P. Andrilenas , A. Fox. 1968. Farmers’s Pesticide Expenditures for Crops, Livestock,and Other Selected Uses in 1964, Agricultural Economic Report No. 145. Washington, DC: Economic Research Services. U.S. Department of Agriculture.
Georgia A. E.1933. A Manual of Weeds. New York : The Macmillan Company.
Gianessi, L. P., Anderson, J. E. 1995. Pesticide Use In U.S. Crop Production. National SummaryReport. Washington, DC : National Center for Food And Agricultural Policy.
Gillette, N.E., Perkins, R.M., Hurley, E. 1981. Discussion and Abstracts of Pesticide Usage
Surveys In the U.S.- 1975-1980. Washington, DC : National Retired teachers AssociationAmerican Association of Retired Persons.
Grodner, Mary L. 1997. Pesticide Regulation and Pesticide Education. Report by President ofAmerican Association of Pesticide Safety Educators to American Association of PesticideControl Officials.
Hall, Stanley A. 1964. The Place of Insecticides in Yearbook of Agriculture, 1964. Washington,DC : US Department of Agriculture.
Harper, Horace J. 1930. The Use of Sodium Chlorate in the Control of Johnson Grass, Journalof the American Society of Agronomy, Vol. 22, No. 5.
Hiebert R. D., Stubbendieck, J. 1993. Handbook for Ranking Exotic Plants for Management andControl. U.S. Department of the Interior.
Hilton, J. L., Bovey, R. W., Hull, H. M. 1974. Herbicide Handbook of the Weed Science Society ofAmerica. Third Edition. Champaign, Illinois :
Holton, C. S., Fischer, G. W., Fulton, R. W. 1959. Plant Pathology Problems and Progress 1908-1958, Madison. The American Phytopathological Society. The University of Wisconsin Press.
Howard. L. O. 1867. Insects Affecting The Cotton Plant. Washington DC: U.S. Department OfAgriculture Farmers’ Bulletin No. 47.
Howard. L. O. 1900. The Principal Insects Affecting The Tobacco Plant. Washington, DC : U.S.
4
Department of Agriculture Farmers’ Bulletin No.120.
Howard. L. O. 1911. House Files. Washington, DC :U.S. Department Of Agriculture Farmers’Bulletin No.159.
Howard. L. O. 1915. House Files. Washington, DC : U.S. Department Of Agriculture Farmers’Bulletin 679.
Hyslop, J. A. July 1938. Losses Occasioned By Insects, Mites, And Ticks in The United States,Washington, DC. U.S. Department of Agriculture:
Immerman, F. W., Drummond, D. J. 1985. National Urban Pesticide Applicator Survey : FinalReport. Overview and Results. Washington, DC: US Environmental Protection Agency.
Development Planning & Research Associates, Inc. 1975. Incremental Cost Impacts of the 1972Federal Insecticide Fungicide And Rodenticide Act as Amended. Contract study for U.S.Environmental Protection Agency
. Jones, D. Price. 1973. Agricultural Entomology, in History of Entomology. Palo Alto, CA: Edited
by Ray F. Smith. et. al. Annual Reviews.
Johnson, J. M., Ware, G. W. 1996. Pesticide Litigation Manual, 1996 Edition. New York : ClarkBoardman Callaghan.
Kellogg, R. L., Nerhring, R., Grube, A., Plotkin, S., Goss, D. W., Wallace, S. 1999. Trends in thePotential for Environmental Risk from Pesticide Loss from Farm Fields. Posterpresentation for "The State of North America's Private Land," a conference held January 19-21, 1999, Chicago,Illinois.
Kenaga, E.E. 1989. History of Insecticide Introduction, Use, and Regulation: ESA Participation,Entomology Society of America. Vol. 35, No. 3.
Lee II, R. E., Aspelin, A. L. 1978. Economic Trends and Outlook of Pesticide Industry: Need for“Exclusive Use” Amendments to FIFRA. Washington, DC : US Environmental ProtectionAgency.
Lin, B. H., Padgitt, M., Bull, L. 1995. Pesticide and Fertilizer Use and Trends in U.S. Agriculture.Washington, DC : US Department of Agriculture.
Marlatt, C. L., M.S. 1901. Important Insecticides; Directions for Their Preparation and Use, Farmer’s Bulletin No. 117, a revision of Farmer’s Bulletin No. 19. Washington, DC: US
5
Department of Agriculture. (also, second revision of Farmer’s Bulletin No. 127, dated 1908.)
Marlatt, C. L. 1904. The Annual Loss Occasioned By Destructive Insects In The United States. Department of Agriculture.
Martin, Herbert. 1940. The Scientific Principles of Plant Protection with Special Reference toChemical Control. New York: Longmans, Green & Co.
Mason, A. F. 1928. Dusting and Fumigating of Plants, A Popular Handbook on Crop Protection. New York : The Macmillan Company.
Miller, Marshall Lee. 1987. Federal Regulation of Pesticides, in Environmental Law Handbook,Ninth Edition. Rockville, MD: Government Institutes. (CHECK THIS ONE)
Mrak, Emil. 1969. Pesticides and Their Relationship to Environmental Health. Washington, D.C. :U.S. Department of Health, Education and Welfare.
National Academy of Sciences. 1975. Pest Control: An Assessment off Present and AlternativeTechnologies, Vol. I. Washington D.C. : National Academy of Sciences.
National Academy of Sciences. 1978. Pesticide Decision Making, Volume VII. Washington, DC :The National Research Council.
National Academy of Sciences. 1980. Regulating Pesticides. Washington, DC : The NationalResearch Council.
Savage, Eldon P., Thomas J. Keefe and H.W. Wheeler. November 1979. National HouseholdPesticide Usage Study, 1976-1977, Final Report. Epidemiologic Pesticide Studies Center.Colorado State University.
Odom, R.F. 1991. Historical Perspective on Regulations Governing the Use of Herbicides andOther Pesticides, Proceedings, Southern Weed Society.Vol. 44.
U.S. Environmental Protection Agency. 1996. Office of Pesticide Programs Annual Report for1996. Washington, DC:
O’Kane, W. C. 1915. Injurious Insects How to Recognize and Control Them. New York : TheMacmillan Company.
Osteen, C. D., Szmedra, P. I. 1989. Agricultural Pesticide Use Trends and Policy Issues.Washington, DC: US Department of Agriculture.
6
Ordish, George. 1976. The Constant Pest; A Short History of Pests and Their Control, CharlesScribner’s Sons. New York: (See also, “150 Years of Crop Pest Control”, Lecture to BritishAgricultural History Society, Norwich, April 9, 1968)
Page, B. G., Thomson, W. T. 1986. The Insecticide, Herbicide, Fungicide Quick Guide. ThomsonPublications. Fresno CA:
Pease, William S., James Liebman, Dan Landy, and David Albright. 1996. Pesticide Use inCalifornia: University of California.
Perkins, John H. The Introduction of DDT to the United States; Reshaping Insect ControlTechnologies in Wartime. Miami Univ., Oxford Ohio, undated, circa 1975 (See also,“Reshaping Technology in Wartime: the Effect of Military Goals on Entomological Researchand Insect-control Practices”. in Technology and Culture. Society for History of Technology,1978)
US General Accounting Office. 1991. Pesticides: Better Data Can Improve the Usefulness ofEPA’s Benefit Assessments. Washington, DC :
Keil, Julian E., et al. 1977. Pesticide Usage Survey of Agricultural, Governmental, and IndustrialSectors in The United States, 1974, South Carolina Epidemiologic Studies Program Center.Study supported by U.S. Environmental Protection Agency.
Quaintace, A. L. 1908. Information About Spraying for Orchard Insects, in Yearbook ofAgriculture 1908, Washington, DC : US Department of Agriculture.
Quantities Of Pesticides Used By Farmers. 1964. Economic Research Services. U.S. Department ofAgriculture.
National Academy Of Sciences. 1980. Regulating Pesticides. Washington, DC : National ResearchCouncil.
Report of the Commissioner of Agriculture,1888. 1889. Washington Government Printing Office.
Riley, C. V. 1888. Report of the Entomologist, in Report of the Commissioner of Agriculture, Washington, DC : US Department of Agriculture.
Roark, R. C. 1935. Insecticides and Fungicides. in Industrial and Engineering Chemistry, Vol. 27,No. 5. Author on staff of Insecticide Division. Bureau of Entomology and Plant Quarantine,U.S. Department of Agriculture, Washington, DC.
7
von Rumker, R., Lawless, E. W., Meiners, A. F. 1974. Production, Distribution, Use andEnvironmental Impact Potential of Selected Pesticides. Study for U.S. EnvironmentalProtection Agency and Council on Environmental Quality. Washington, DC :
Savage, E.P., Keefe, T. J., Wheller, H. W. 1979. National Household Pesticide Usage Study.1976-1977. Fort Collins, Colorado: Edidemiologic Pesticide Studies Center.
Shepard, Harold H. 1951. The Chemistry and Action of Insecticides. First Ed. New York:McGraw-Hill.
Shepard, H. H., J. N. Mahan. 1964. The Pesticide Situation for 1963-1964. Washington DC : U.S.Department of Agriculture. Agriculture Stabilization and Conservation Service.
Shepard, H. H., J. N. Mahan. 1965. The Pesticide Situation for 1964-1965. Washington, D.C.: Agriculture Stabilization and Conservation Service. U.S. Department of Agriculture.
Shepard, H. H., J. N. Mahan, D. L. Fowler. 1966. The Pesticide Review 1966. Washington, D.C. : Agriculture Stabilization and Conservation Service. U.S. Department of Agriculture.
Shepard, H. H., J. N. Mahan, D. L. Fowler. 1967. The Pesticide Review 1967. AgricultureStabilization and Conservation Service. U.S. Department of Agriculture.
Sinclair, Upton. 1905. The Jungle. (publisher?)
Slingerland, M. V., Crosby, C. R. 1924. Manual of Fruit Insects. New York : The MacmillanCompany.
Smith, R. F., Mittler, T. E., Smith, C. N. 1973. History of Entomology. Annual Reviews Inc. incooperation with Entomology Society of America.
Sorensen, A. A. 1993. Constraints to the Adoption of Integrated Pest Management. NationalFoundation for Integrated Pest Management Education.
Stakman, E. C. 1959. The Role of Plant Pathology in the Scientific and Social Development ofthe World, in Plant Pathology: Problems and Progress.1908-1958, Edited by C. S.Holton, et al., University of Wisconsin Press, Madison.
U.S. Environmental Protection Agency. 1998 Status of Pesticides in Registration, Reregistration,and Special Review. Office of Pesticide Programs. Washington, DC:
California Agricultural Experiment Station. 1975. Tillage Systems for Cotton. A Comparison in the
8
US Western Region. 1975.
Tomlin, C. D. S. A World Compendium The Pesticide Manual. Eleventh Edition. British CropProtection Council.(CHECK THIS ONE OUT)
U.S. Department of Agriculture. 1971. 1967 Census of Manufactures, Vol. 1, Summary and SubjectStatistics. Bureau of Census.
U.S. Department of Agriculture. 1936-1999. Agricultural Statistics. Annual editions for years1936 through 1999. Washington, D.C.
U.S. Department of Agriculture. 1965. Losses in Agriculture, U.S. Agricultural Research Service.
US Department of Agriculture. 1865. Report of the Commissioner of Agriculture. Nov. 27, 1865, Washington, DC.
U.S. Department of Agriculture. 1967. The Pesticide Review 1967. Washington, DC : AgriculturalStabilization and Conservation Service.
U.S. Department of Agriculture. 1968. The Pesticide Review 1968. Washington, DC : AgriculturalStabilization and Conservation Service.
U.S. Department of Agriculture. 1969. The Pesticide Review 1969. Washington, DC : AgriculturalStabilization and Conservation Service.
U.S. Department of Agriculture. 1971. The Pesticide Review 1970. Washington, DC : AgriculturalStabilization and Conservation Service.
U.S. Department of Agriculture. 1972. The Pesticide Review 1971.Washington, DC : AgriculturalStabilization and Conservation Service.
U.S. Department of Agriculture. 1973. The Pesticide Review 1972. Washington, DC : AgriculturalStabilization and Conservation Service.
U.S. Department of Agriculture. 1974. The Pesticide Review 1973. Washington, DC : AgriculturalStabilization and Conservation Service.
U.S. Department of Agriculture. 1975. The Pesticide Review 1974. Washington, DC : AgriculturalStabilization and Conservation Service.
U.S. Department of Agriculture. 1976. The Pesticide Review 1975. Washington, DC: Agricultural
9
Stabilization and Conservation Service.
U.S. Department of Agriculture. 1977. The Pesticide Review 1976. Washington, DC : AgriculturalStabilization and Conservation Service.
U.S. Department of Agriculture. 1978. The Pesticide Review 1977. Washington, DC:Agricultural Stabilization and Conservation Service.
U.S. Department of Agriculture. 1980. The Pesticide Review 1978. Washington, DC : AgriculturalStabilization and Conservation Service.
U.S. Department of Agriculture. 1981. The Pesticide Review 1979. Defense Preparedness Branch,EIPD- ASCS.
U.S. Department of Agriculture. 1982. The Pesticide Review 1980. Defense Preparedness Branch.EOLPD-ASCS.
U.S. Department of Agriculture. 1982. The Pesticide Review 1981.Defense Preparedness Branch.EIPD- ASCS.
U.S. Department of Agriculture. 1953. The Pesticide Situation for 1952-53. Washington DC :Production and Marketing Administration.
U.S. Department of Agriculture. 1954.The Pesticide Situation for 1953-54. Washington DC :Commodity Stabilization Service.
U.S. Department of Agriculture. 1957. The Pesticide Situation for 1956-57. Washington, DC :Commodity Stabilization Service.
U.S. Department of Agriculture.1960. The Pesticide Situation for 1959-60.Washington, DC :Commodity Stabilization Service.
U.S. Department of Agriculture. 1964. The Pesticide Situation for 1963-64. Washington, DC :Agricultural Stabilization and Service.
U.S. Department of Agriculture. 1965. The Pesticide Situation for 1963-64. Washington, DC :Agricultural Stabilization and Service.
U.S. Department of Agriculture Farmers’ Bulletin No. 1408. 1925. The House Fly and How ToSuppress it. Washington, DC.
10
U.S. Department of Commerce. 1969. 1969 Business Statistics, and 1959 Business Statistics, TheBiennial Supplement to the “Survey of Current Business”, Office of Business Economics,Washington, DC : U.S. Government Priting Office.
U.S. Environmental Protection Agency. 1974. Index of EPA Legal Authority, Statutes &Legislative History Executive Orders Regulations.
U.S. Environmental Protection Agency . 1978. The Federal Insecticide, Fungicide, and RodenticideAct, As Amended. Washington, DC.
U.S. Environmental Protection Agency. 1990. Suspended, Canceled and Restricted Pesticides,20T-1002, Washington, DC.
U.S. Environmental Protection Agency. 1991. U.S. EPA’s Pesticide Programs. Washington, DC:
U.S. Environmental Protection Agency. 1997. The Federal Insecticide, Fungicide, and RodenticideAct (FIFRA) and Federal Food, Drug, and Cometic Act (FFDCA) As Amended by FoodQuality Protection Act (FQPA) of August 3, 1996. US Environmental Protection Agency.Office Of Pesticide Programs.
U.S. Tariff Commission, Synthetic Organic Chemicals, U.S. Production and Sales, 1960-1969,U.S. Government Printing Office, Washington, D.C., 1961-1970.
Whitaker, Adelynne H. 1980. Pesticide Use in Early Twentieth Century: Animal DiseaseControl, in Agricultural History.
Whitmore, R. W., Kelly, J. E., Reading, P. L. 1992. National Home And Garden Pesticide UseSurvey. Final Report. Volume I, Executive Summary, results, and Recommendations. ResearchTriangle Institute (RTI).
Windholz, M., Budavari, S. 1983. The Merck Index, an Encyclopedia of Chemicals, Drugs, andBiologicals. Tenth Edition. Rahway, NJ: Merck & CO., Inc.
Doane Market Research, Inc. 1969-1999. Reports, tabulations and data on agricultural pesticideusage in the U.S.. St Louis, MO.
SRI Consulting. 1965-1999. Reports, tabulations and data on U.S. pesticide usage in the U.S.. MenloPark, CA.
Kline & Co. 1978-1999. Reports, tabulations and data on non-agricultural pesticide usage in the U.S.Little Falls, NJ.
GLOSSARY
ACTIVE INGREDIENT (A.I.): The chemical or substance component of a pesticideproduct that can kill, repel, attract, mitigate or control a pest or that acts as a plant growthregulator, desiccant, or nitrogen stabilizer. The remainder of a formulated pesticide productconsists of one or more "inert ingredients" (such as water, solvents, emulsifiers, surfactants, clayand propellants), which are there for reasons other than pesticidal activity.
AGRICULTURAL USER SECTOR (OR MARKET): Pesticides applied byowner/operators and custom/commercial applicators to farms and facilities involved inproduction of raw agricultural commodities, principally food, fiber, and tobacco; includes non-crop and post-harvest use as well as crop/field applications.
CERTIFIED APPLICATOR: A person who is authorized to apply "restricted-use"pesticides as result of meeting requirements for certification under FIFRA-mandated programs.Applicator certification programs are conducted by states, territories and tribes in accordancewith national standards set by EPA. "Restricted use pesticides" may be used only by or underthe direct supervision of specially trained and certified applicators.
COMMERCIAL APPLICATOR: A person applying pesticides as part of a businessapplying pesticides for hire or a person applying pesticides as part of his or her job withanother (not for hire) type of business, organization or agency. Commercial applicators oftenare certified, but need to be so only if they use restricted-use pesticides.
CONVENTIONAL PESTICIDES: Pesticides that are chemicals or other substancesdeveloped and produced primarily or only for use as pesticides. The term is generally used inreference to active ingredients. An example is DDT, which was developed and used almostexclusively as a pesticide.
ECONOMIC USER SECTORS (OR MARKETS): In this report, estimates of quantitiesused and user expenditures for pesticides are broken out separately for the three generaleconomic user sectors (or markets) as follows: agriculture, industrial/commercial/governmental,and home/garden. These three sectors/markets are defined elsewhere in this glossary.
FDA: U.S. Food and Drug Administration, which is involved in regulation of pesticides in theU.S., particularly enforcement of tolerances in food and feed products.
FFDCA: Federal Food, Drug, and Cosmetic Act is the law which controls pesticide residuesin food and feed, along with FIFRA.
FIFRA: Federal Insecticide, Fungicide, and Rodenticide Act is the law which generallycontrols pesticide sale and use.
HOME AND GARDEN USER SECTOR (OR MARKET): Involves pesticides appliedby homeowners to homes and gardens, including lawns; single and multiple unit housing. Doesnot include pesticides for home/garden applications by professional applicators.
INDUSTRIAL/COMMERCIAL/GOVERNMENTAL USER SECTOR (ORMARKET): Involves pesticides applied by professional applicators (byowner/operators/employees and custom/commercial applicators) to industrial, commercial andgovernmental facilities, buildings, sites, and land; plus custom/commercial applications to homesand gardens, including lawns. May also be referred to as "professional market" for pesticides.
NON-AGRICULTURAL SECTORS: General term which refers to a combination ofhome/garden and industrial/commercial/governmental sectors.
OTHER PESTICIDE CHEMICALS: Chemicals registered as pesticides but which are produced and marketed mostly for other purposes, i.e., multi-use chemicals. Notableexamples are sulfur, petroleum products (e.g., kerosene, oils and distillates), salt and sulfuricacid.
PESTICIDE: May be used to refer to an active ingredient (as defined above) or formulatedpesticide product registered under FIFRA.
PESTICIDE TYPE/CLASS: Grouping of conventional pesticides used for a certain targetpest category. In this report, the types/classes generally used are: herbicides/plant growthregulators, insecticides/miticides, fungicides, fumigant/nematicides and other miscellaneouspesticides (e.g., rodenticides, molluscicides and fish or bird pesticides).
PESTICIDE USER EXPENDITURES: Dollar value of purchases by persons orbusinesses applying pesticides, such as farmers, commercial pesticide applicators andhomeowners. Reported numbers are nominal values for the years indicated, i.e., not adjustedor indexed for inflation.
PESTICIDE USAGE: Refers to actual applications of pesticides, generally in terms ofquantity applied or units treated.
PRIVATE APPLICATOR: A category of applicator certification for farmers and/oremployees such that they can legally apply restricted use pesticides or supervise others doingso who are not certified.
PROFESSIONAL MARKET: Sales of pesticides for application toindustrial/commercial/governmental sectors, homes and gardens by certified/commercialapplicators.
SAFER PESTICIDES: Pesticides designated as "safer" (or "reduced-risk") by EPA due tofavorable characteristics affecting health or environmental risks, resistance management andintegrated pest management. Safer pesticides may be conventional pesticides posing less riskor be biopesticides with unique modes of action, low use volume, lower toxicity, target speciesspecificity or natural occurrence.
SPECIALTY BIOCIDES: In this report, estimates are provided for end uses as follows: swimming pools, spas and industrial water treatment (excludes chlorine/hypochlorites which arereported separately); disinfectants and sanitizers (including industrial/institutional applicationsand household cleaning products); and other specialty biocides (including biocides foradhesives and sealants, leather, synthetic latex polymers, metal working fluids, paints andcoatings, petroleum products, plastics and textiles). These are categories of end usage whichare covered by FIFRA. There are other end uses of specialty biocides which are regulatedunder FFDCA and are not covered in this report. (such as hospital/medical antiseptics,food/feed preservatives and for cosmetics/toiletries).
TOLERANCE: The maximum amount of a pesticide allowable in a food or feed productbefore it is considered adulterated, usually specified in parts per million.
USDA: U.S. Department of Agriculture
WOOD PRESERVATIVES: Pesticide active ingredients used in treatment of wood toprotect it from insects, fungi and other pests. In this report, a total is presented for usage ofwood preservative chemicals in industrial plants, the bulk of which is for pressure treatment. The major categories of pesticide chemicals included in this report as industrial woodpreservatives are water borne preservatives (primarily arsenicals), oil borne preservatives (suchas copper naphthenate and pentachlorophenol), creosote, creosote-coal tar and creosotepetroleum.
APPENDIX THREE A
Major Pesticide Industry Profile and Usage Data Sources Available To EPA Staff
Source Brief Description Remarks
American Crop ProtectionAssociation
Annual surveys of U.S.pesticides production, sales andusage, 1960's to date
Survey of industryparticipants/members byindependent accountingorganization
Directed Research Inc. National estimates of U.S.usage and sales of pesticides,by market segment, ag andnon-ag (proprietary)
Industry interviews, datagathering,, etc..
Doane Market Research Reports and interactive database on U.S. agricultural/cropusage of pesticides, covering allland in farms, by geographicarea (proprietaryAgroTrak/Profile Service)
Comprehensive data base onquantities used, acres/farmstreated and expenditures, 1987to date; selected reports forearlier years back to late1960's; estimates based onresponses of grower panel withabout 17,000 members
EPA/OPP Usage Surveys User surveys of home/gardenapplications (1990) andcommercial applicators (1992)
Large sample design surveysconducted by interview byResearch Triangle Institute
FIFRA Section 7 Data Summaries of reports bypesticide producers onquantities of individualpesticides produced anddistributed annually, includingimports/exports
Freedonia Group Pesticide Industry/Marketprofile, by market segment(sector/class), selected pastyears to 1997 (proprietary)
Estimates based on Freedoniamarket research, interviews,publicly available data, etc.
Source Brief Description Remarks
Frost and Sullivan Pesticide industry profile andbiocides studies, 1990's; usageand market estimates bysegment (proprietary)
Frost & Sullivan marketresearch, interviews
Kline & Co. Profiles of home/garden andprofessional usage on alternateyears, by class/market segment,chemical; selected years, 1974to date; biocides profile startingin 1970's (proprietary)
Kline user surveys andinterviews ofsuppliers/applicators
Landell Mills/Produce StudiesLtd.
International crop usage database covering more than 60nations, including U.S.;electronic data for 1991-date(proprietary)
Current service was precededby Battelle international database starting in 1980's
Maritz Marketing Research Reports and interactive database, with estimates of U.S.usage by pesticide and crop,1991-95; also reports for someearlier years (proprietary)
Maritz became part of Doanein 1998; estimates based onresponses from large scalepanel/survey approach
Mike Buckley MarketingResearch
Reports of usage on variety ofcrops, by chemical andgeographic area, 1995/97(proprietary)
Reports and data base on U.S.usage, by chemical, crop,geographic area; data circa1987 and 1992
Estimates based on bestavailable information fromregistrants, growers,consultants, etc. and publishedreports
Seehusen and Associates Reports of market research onselected fruits, vegetables andnon-ag usage (i.e., mosquitocontrol) since 1980's (proprietary)
Seehusen interviews ofgrowers, applicators, etc.
Source Brief Description Remarks
SRI Consulting/International Chemical EconomicsHandbook Reports containingusage estimates (and sales) byclass/chemical and sector(proprietary)
Estimates cover overallproduction, trade and usagefrom 1965 to date
State Surveys and Data Extensive file of surveys byLand Grant Universities andUSDA/NASS state officesconducted primarily since themid-1980's; also, usage datafrom state regulatory programs,e.g., California
Agricultural primarily, but someof home/garden market;National Agricltural PesticideImpact Assessment Programfunded many state surveys
U.S. Department of Agriculture(NASS/ERS)
Reports based on annualsurveys for field crops andalternate years for fruits andvegetables, in major states,1990 to date; some resultsavailable in electronic form
Estimates of quantitiesused/acres based on interviews of large scalesamples of growers , e.g.,20,000
U.S. Census of Agriculture Acres/no. farms using pesticides, by type, censusyears, e.g., 1992
U.S. Dept. of Commerce Periodic reports on pesticideindustry and annual industryoutlook
Including reports by U.S.International Tariff Comm.
Prepared by: Arnold L. Aspelin 10/22/98
F:\USER\SHARE\USAGE\SOURCESA
APPENDIX FOUR
Pesticide Usage Per Year in U.S., Three Year Periods, 1931-97.
APPENDIX FOUR A -1 Volume of Pesticide Active Ingredient Usage Per Year in U.S., by Sector, Conventional Pesticides, Other Pesticide Chemicals and Total, Three Year Periods Ending 1931-97
Three YearsEnding
Conventional Pesticides Other Peticide Chemicals Total Conventional and Other
Agriculture Ind./Comm./Gov. Home/Garden All Sectors Agriculture Ind./Comm./Gov. Home/Garden All Sectors Agriculture Ind./Comm./Gov. Home/Garden All Sectors