See discussions, stats, and author profiles for this publication at: https://www.researchgate.net/publication/348406696 PET Imaging of Dopamine Neurotransmission During EEG Neurofeedback Article in Frontiers in Physiology · January 2021 DOI: 10.3389/fphys.2020.590503 CITATIONS 0 READ 1 7 authors, including: Tomas Ros University of Geneva 53 PUBLICATIONS 1,832 CITATIONS SEE PROFILE All content following this page was uploaded by Tomas Ros on 12 January 2021. The user has requested enhancement of the downloaded file.
Transcript
See discussions, stats, and author profiles for this publication at: https://www.researchgate.net/publication/348406696
PET Imaging of Dopamine Neurotransmission During EEG Neurofeedback
Article in Frontiers in Physiology · January 2021
DOI: 10.3389/fphys.2020.590503
CITATIONS
0READ
1
7 authors, including:
Tomas Ros
University of Geneva
53 PUBLICATIONS 1,832 CITATIONS
SEE PROFILE
All content following this page was uploaded by Tomas Ros on 12 January 2021.
The user has requested enhancement of the downloaded file.
Medical Physics and Imaging,a section of the journalFrontiers in Physiology
Received: 01 August 2020Accepted: 09 December 2020
Published: 11 January 2021
Citation:Ros T, Kwiek J, Andriot T,
Michela A, Vuilleumier P, Garibotto Vand Ginovart N (2021) PET Imaging ofDopamine Neurotransmission During
EEG Neurofeedback.Front. Physiol. 11:590503.
doi: 10.3389/fphys.2020.590503
PET Imaging of DopamineNeurotransmission During EEGNeurofeedbackTomas Ros1,2* , Jessica Kwiek1,3* , Theo Andriot1, Abele Michela1, Patrik Vuilleumier1* ,Valentina Garibotto4 and Nathalie Ginovart1,3*
1 Department of Basic Neurosciences, University of Geneva, Geneva, Switzerland, 2 CIBM Center for Biomedical Imaging,Lausanne, Switzerland, 3 Department of Psychiatry, University of Geneva, Geneva, Switzerland, 4 Division of NuclearMedicine and Molecular Imaging, Department of Medical Imaging, Geneva University Hospitals, Geneva, Switzerland
Neurofeedback (NFB) is a brain-based training method that enables users to controltheir own cortical oscillations using real-time feedback from the electroencephalogram(EEG). Importantly, no investigations to date have directly explored the potential impactof NFB on the brain’s key neuromodulatory systems. Our study’s objective was to assessthe capacity of NFB to induce dopamine release as revealed by positron emissiontomography (PET). Thirty-two healthy volunteers were randomized to either EEG-neurofeedback (NFB) or EEG-electromyography (EMG), and scanned while performingself-regulation during a single session of dynamic PET brain imaging using the highaffinity D2/3 receptor radiotracer, [18F]Fallypride. NFB and EMG groups down-regulatedcortical alpha power and facial muscle tone, respectively. Task-induced effects onendogenous dopamine release were estimated in the frontal cortex, anterior cingulatecortex, and thalamus, using the linearized simplified reference region model (LSRRM),which accounts for time-dependent changes in radiotracer binding following taskinitiation. Contrary to our hypothesis of a differential effect for NFB vs. EMG training,significant dopamine release was observed in both training groups in the frontaland anterior cingulate cortex, but not in thalamus. Interestingly, a significant negativecorrelation was observed between dopamine release in frontal cortex and pre-to-postNFB change in spontaneous alpha power, suggesting that intra-individual changes inbrain state (i.e., alpha power) could partly result from changes in neuromodulatory tone.Overall, our findings constitute the first direct investigation of neurofeedback’s effecton the endogenous release of a key neuromodulator, demonstrating its feasibility andpaving the way for future studies using this methodology.
Cortical oscillations are generated by collective fluctuations of synaptic and somatic membranepotentials (Buzsáki et al., 2012), and therefore closely reflect excitability changes of neuronalpopulations (Rossini et al., 1991; Haegens et al., 2011; Schalk et al., 2017). Behaviouralstates of attention/vigilance have been consistently tied to dynamic decreases (also known as
Ros et al. Dopamine Neurotransmission During Neurofeedback
desynchronization) of low-frequency electroencephalogram(EEG) rhythms (i.e.,<15 Hz) (Harris and Thiele, 2011; Luczaket al., 2013; Mcginley et al., 2015; Zerlaut and Destexhe, 2017),that otherwise dominate the cortical activity during quiet“resting.” In waking adult humans, the dominant resting-staterhythm is the alpha (8–12 Hz) rhythm (Groppe et al., 2013).Alpha rhythm increases or decreases, respectively, has beenfound to reflect neural inhibition and excitation of sensorycortices (Romei et al., 2008; Haegens et al., 2011), acting asan inhibitory gate for external stimuli (Cooper et al., 2003;Jensen and Mazaheri, 2010; Luczak et al., 2013). On task, lapsesof sensory detection (Ergenoglu et al., 2004; O’Connell et al.,2009), motor inhibition (Mazaheri et al., 2009), and subjectiveattention (Macdonald et al., 2011) have all been related to highertrial-by-trial levels of alpha synchronization.
Interestingly, at the synaptic level, cortical oscillatory activityis known to be neurochemically regulated by a complexcocktail of neurotransmitters/neuromodulators, includingdopamine (Lee and Dan, 2012). Hence, studies in humanshave shown that stimulation of dopaminergic pathways mayconcomitantly modify attention and resting-state EEG rhythms.In healthy adults for example, treatment with the indirectdopaminergic/noradrenergic agonist methylphenidate is ableto improve target detection by significantly reducing alphaoscillations which preceded lapses of attention (Dockree et al.,2017). Likewise, methylphenidate significantly suppressedtheta/alpha power in adults with ADHD who were classified asclinical responders (Bresnahan et al., 2006). Conversely, selectivedopaminergic antagonists have been found to enhance alphapower and degrade cognitive performance in animals (Puigand Miller, 2015). Moreover, a simultaneous EEG and positronemission tomography (PET) study revealed endogenous striataldopamine release to inversely correlate with power of alpharhythms during meditation (Kjaer et al., 2002). Importantly,the aforementioned in vivo studies are compatible with in vitroevidence that dopaminergic agonists decrease low-frequencyEEG rhythms (Sebban et al., 1999) while antagonists increasethem (Sebban et al., 1999), and this has been directly linkedto activation of dopamine receptors (Popoli et al., 1996;Chen et al., 2013).
These collective findings suggest there may be acommon electrochemical mechanism linking the release ofneuromodulators (such as dopamine) and the expression oflow-frequency EEG rhythms (such as alpha oscillations). Thecortex has strong reciprocal connections with the dopaminergicsystem and its subcortical nuclei. A major pathway involvesdopamine neurons localized in the ventral tegmental area andprojecting to the medial prefrontal cortex (Lohani et al., 2019)and the anterior cingulate cortex (ACC) (Steullet et al., 2014). Inaddition, the thalamus has also been shown to exhibit dopaminetransmission during attentional states (Christian et al., 2006)and is strongly implicated in the control of cortical oscillations(Liu et al., 2015)—especially alpha rhythms (Omata et al.,2013). Thus, we sought to investigate whether neurocognitivemodulation of cortical oscillations could impact dopaminetransmission in the frontal cortex (FC), ACC, and thalamus.Specifically, we examined whether directly manipulating the
dominant EEG oscillation, the alpha rhythm, may be associatedwith an endogenous release of dopamine using in vivo positronemission tomography (PET) imaging. An innovative way thatalpha rhythms can be modified is with neurofeedback (NFB),a technique that enables users to control their brain activityusing a closed-loop feedback. We have ourselves conductedextensive validation of alpha-desynchronizing NFB, whichinvolves suppressing alpha rhythms below their resting-statebaseline levels. First and foremost, we have found that this NFBprotocol can be quickly learned by naïve healthy participants(Ros et al., 2010, 2013) as well as psychiatric patients (Kluetschet al., 2014), while demonstrating its robust neurobehavioraleffects in the direct aftermath of NFB i.e., up to 30 min aftertermination of training. Our first study demonstrated thatone session of alpha-desynchronizing NFB was able to induceplastic increases in cortical excitability and decrease intracorticalinhibition by circa 150%. Although long-hypothesized (Lubar,1997), no studies have yet examined whether NFB effects may beassociated with changes in the brain’s neurochemical status.
Hence, through a combined PET and EEG experiment, ourstudy investigated whether NFB induces an upregulation ofdopamine transmission in key brain nuclei using the radiotracer[18F]Fallypride. Development of high-affinity radioligands forthe D2/3 receptor such as [18F]Fallypride have enabled non-invasive assessment of extrastriatal D2/3 receptor densitiesduring pharmacologic (Slifstein et al., 2010) and behavioralparadigms (Albrecht et al., 2014). For example, PET experimentswith [18F]Fallypride in monkeys showed that amphetaminechallenge may induce a striking reduction in binding in theanterior cingulate cortex (ACC) (Mukherjee et al., 1997). Ithas also been shown that a single [18F]Fallypride scan protocoland linearized simplified reference region modeling (LSSRM)analysis can be used to measure extrastriatal dopamine releaseinduced by a behavioural task (Christian et al., 2006; Latasteret al., 2011). Given that dopamine is widely implicated incognitive control and neural plasticity through neuromodulatoryprojections to several cortico-subcortical sites, investigating itsanatomical release could provide important insights on the realvalue of neurofeedback approaches for brain disorders suchas attention deficit hyperactivity disorder and schizophrenia.Our main hypotheses were that: (i) desynchronizing NFBwould induce a statistically greater decrease in alpha power,as well as lead to an increase in endogenous dopaminerelease in frontal cortex, anterior cingulate cortex and thalamuscompared to the EMG biofeedback group, and that (ii) dopaminerelease will be positively correlated to the degree of alphadesynchronization during NFB.
MATERIALS AND METHODS
Study Design and Sample SizeThis was a pilot, randomized, controlled study with twoindependent participant groups (healthy young adults, males andfemales, aged 20–40) sampled through the Geneva NeuroscienceCenter subject pool: (i) an experimental neurofeedback (NFB)group (n = 16; 26.1± 5.2 years old; nine males and seven females)
Frontiers in Physiology | www.frontiersin.org 2 January 2021 | Volume 11 | Article 590503
Ros et al. Dopamine Neurotransmission During Neurofeedback
and (ii) a control EEG-electromyography (EMG)-biofeedbackgroup (n = 16; 25.5± 5.4 years old; nine males and seven females).Prior to the study, written informed consent was obtained fromeach participant. The study was approved by the Research EthicCommittee of the Republic and Canton of Geneva. We excludedparticipants with past or current psychiatric or neurologicaldisorders, past or current clinically significant medical conditionand central nervous system disorder, addictive disorders (excepttobacco), or current psychotropic treatment.
PET ImagingAll subjects were examined with PET using the D2/3 receptorantagonist radiotracer [18F]Fallypride. A custom-fittedthermoplastic mask was made for each participant and usedto minimize head movement during the PET measurements.As depicted in Figure 1, a low dose (20 mA-s and 120 kV)computerized tomography (CT) scan of the head was acquiredprior to the PET acquisition for attenuation correction of thePET data. Subjects then received a 10-s bolus i.v. injectionof [18F]Fallypride at a specific radioactivity greater than74 GBq/mmol Mean injected dose was 184.9 ± 14.9 MBq for theNFB group and 184.6 ± 10.1 MBq for the EMG group. A PETdynamic emission was initiated simultaneously on radiotracerinjection and was acquired in 3-dimensional mode using aBiograph mCT Flow tomograph (Siemens medical solutions,United States, Inc.). The in-plane resolution of the scanner wasapproximately 4 mm full width at half-maximum. The PETemission scan was acquired in two dynamic scanning sequences,following a previously reported one-day PET protocols withmodifications (Christian et al., 2006; Lataster et al., 2011). Thefirst scanning sequence, with a duration of 70 min, representedbaseline [18F]Fallypride kinetics, during which subjects lieddown with their eyes open. Data were acquired in 60-s framesduring the first 6 min and in 120-s frames thereafter. The baselinesession was followed by a break period of 20 min, outside thescanner. After the break, subjects were repositioned on the PET
scanner and a second low dose CT of the head was acquiredimmediately prior to the second dynamic PET scanning sequencefor coregistration purpose to the first PET scanning sequence.A second emission dataset was then recorded for another 80 min(40 frames for 2 min/frame). In order to ensure that a possibledisplacement of radioligand induced by the task did not proceedfrom an “activation” due to the break, no task was presentedduring the first 20 min of this second emission scan.
At 110 min post-injection, the NFB or EMG-biofeedbacktask was initiated and performed for the 45 min, after whichdynamic imaging continued in eyes open resting-state foranother 15 min. EEG was simultaneously coregistered withPET (Kjaer et al., 2002), and attenuation correction was basedon mu-map approximation of air/tissue boundary of the head.Additionally, on a separate day, a high-resolution T1-weightedand standard transverse T2-weighted brain magnetic resonanceimage (MRI; 1.5 Tesla; Signa; General Electric, Milwaukee, WI,United States) scan was performed in each subject for anatomicalcoregistration and to exclude structural brain abnormalities.
EEG RecordingA multichannel EEG cap was used to measure whole-scalpactivity simultaneously during the PET recording. SpecificallyEEG measurements were made for 3-min under eyes openconditions before and after, and for 45 min during eachNFB/EMG session. The scalp signals were recorded using a19 Ag/AgCl electrodes cap (Electro-cap International, Inc.1),according to the 10–20 international system. The groundelectrode was placed on the scalp equidistant between Fpz andFz. Electrical signals were amplified with the 21-channel MitsarEEG system (Mitsar-201, CE0537, Mitsar, Ltd.2) and all electrodeimpedances was set to below 5 kOhm. For online recording,electrodes were referenced to linked earlobes, and then the
Ros et al. Dopamine Neurotransmission During Neurofeedback
common average reference was calculated off-line before furtheranalysis. EEG data was continuously recorded at a sampling rateof 250 Hz, and then filtered with a off-line bandpass filter of 0.5–50 Hz.
Neurofeedback and EMG-BiofeedbackProcedureEach NFB/EMG session lasted 45 min in total. The NFB sessionconsisted of “alpha” amplitude desynchronization (i.e., down-regulation) at midline parietal cortex [for a detailed descriptionsee Ros et al. (2013)]. In brief, the Pz channel was specificallyused for neurofeedback, using a Pro-Comp amplifier interfacingwith the EEGer 4.2 neurofeedback software (EEG SpectrumSystems, CA, United States). Separate ground and referenceelectrodes were placed on the right and left earlobe, respectively.Pz was selected as the electrode overlying the posterior parietalcortex, whose metabolic changes have been previously linkedto EEG alpha rhythm modulation. All participants interactedwith a “SpaceRace” game where they received continuous visualfeedback in the form of a moving spaceship and a dynamicbar graph whose height was inversely proportional to real-timealpha amplitude fluctuations. Participants were told that thespaceship would move forward whenever they were “in-the-zone”of their target brain activity (i.e., alpha lower than threshold),and that it would stop when they were “out-of-the-zone” (i.e.,alpha higher than threshold). The aim of the training was to usethe feedback they received during the game to learn to keep thespaceship traveling through space. For the purpose of online NFBtraining, the EEG signal was infinite impulse response band-passfiltered to extract alpha (8–12 Hz) with an epoch size of 0.5 s.Participants were rewarded upon suppression of their absolutealpha amplitude. For each participant, the reward threshold wasinitially set so that their alpha amplitude would fluctuate belowthe initial 3-min baseline average approximately 60% of the time(i.e., they received negative feedback about 40% of the time). Toensure that all participants received comparable frequencies ofreward, we readjusted their reward thresholds to meet the desiredratio, when they achieved disproportionately higher (>80%) orlower (<40%) rates of reward during feedback. The entire NFBsession was divided into 15× 3 min training periods with a shortbreak (1 s) after each period. During the breaks, the scores for thepreceding periods were displayed.
Electromyographic (EMG) biofeedback (Degood andChisholm, 1977) was presented using the same feedbackinterface and reward parameters as for NFB [i.e., 15 × 3 mintraining periods with a short break (10 s) after each period].This was based on downregulating (relaxing) the EMG power(20–45 Hz) from the facial jaw muscle with an electrode on theright masseter muscle. This condition was used to control forvisual stimuli exposure (same visual feedback game as NFB) andfeedback-related cognitive control.
PET Data AnalysisReconstructed SPECT images were processed using the PMODV3.9 software (PMOD Technologies Ltd., Zurich, Switzerland).First, the second PET scanning sequence was co-registered to
the first one using their respective CT scans. Both sequenceswere then merged to create a single dynamic PET sequence. Tominimize the effects of head movement, PET images underwentframe-to-frame realignment and were coregistered to individualT1-weighted MRI. Regions of interest (ROI) for the thalamus,frontal cortex, anterior cingulate cortex, and cerebellum weredrawn on the MRI and applied to the dynamic PET images toproduce time-activity curves (TACs). Non-linear least squaresfitting analyses based on the linear extension of the simplifiedreference region model (LSSRM; Alpert et al., 2003), usingthe cerebellum as a reference, were applied to the 170 minof [18F]Fallypride TAC data, to estimate the non-displaceablebinding potential (BPND) as an index of D2/3R availability, andγ as an index of AMPH-induced DA release in the thalamus,frontal and anterior cingulate cortices. In brief, the LSSRMtakes into account temporal perturbations in radioligand specificbinding caused by pharmacological or non-pharmacological-induced changes in endogenous levels of neurotransmittersuch as dopamine during a single-scan session (Alpert et al.,2003). The LSSRM assumes that a steady physiological state isdisturbed at a certain time of the experiment and allows thedissociation rate of the radioligand from the receptor, k2a, tochange over time in response to local variation in dopamineconcentration [k2a = k2/(1 + BPND)], where k2 is the tissue-to-plasma efflux constant in the target region. Changes in BPNDin competition studies are assumed to reflect inverse variationsin the concentration of extracellular neurotransmitter (Ginovart,2005). Competition between dopamine and radioligand forbinding on receptors is reflected by a temporal change ofk2a, which is accounted for by a time-dependent parameterk2a + γ · h(t), where γ represents the amplitude of the radioliganddisplacement and the function h(t) describes a rapid changefollowing competition onset and dissipation over time. The decayfunction h(t) = exp[−τ(t−T)] denotes temporal fluctuation in themodel parameters, where τ controls the rate at which competitioneffects die away and T represents the time of competition onset.Therefore, an increased in k2a, reflected by a decrease in BPNDcaused by an increased in task-induced dopamine release resultsin a positive value of γ. Here, T was set to the time of NFBinitiation (ie., 110 min post-radiotracer injection), and τ wasset to 0.03 min−1 in accordance with previous investigations ofbehavioral interventions with [18F]Fallypride (Christian et al.,2006; Lataster et al., 2011; Ceccarini et al., 2012; Kasanova et al.,2018). The entire set of time-activity data (170 min) was includedin the LSSRM fitting procedure.
EEG Data AnalysesThese were conducted with a combination of EEGLAB3 andthe Neurophysiological Biomarker Toolbox4 in Matlab. Foroffline analyses, EEG signals were re-referenced to common-average reference. Low- and high-pass filters were set to 0.5and 40 Hz, respectively, with a 55–65 Hz notch filter. We usedICA decomposition to first remove stereotypical artifacts usingthe Infomax algorithm (blinking and lateral eye movement).
Ros et al. Dopamine Neurotransmission During Neurofeedback
Statistically defined artifacting was then carried out with theFASTER plug-in (Nolan et al., 2010) removing segments basedon extremal deviations of amplitude and variance from themean. Then, resting-state EEG power was calculated offline usingthe Short Time Fourier Transform (STFT) in 4-s epochs (50%overlapping with Hanning window) in each of the followingbandwidths: delta (1–4 Hz), theta (4–8 Hz), alpha (8–12 Hz), andbeta (13–25 Hz). Higher frequencies (gamma > 25 Hz) were notanalyzed as they may easily be contaminated by muscle artifactthroughout the extended NFB session. Given the low anatomicalspecificity of EEG and the hypothesis of a generalized effect onneurotransmission, all analyses were conducted on the mean ofall 19 EEG channels. The normalized training EEG change foreach participant was estimated by the ratio of the average EEGamplitude across the whole biofeedback training period and thefirst baseline EEG, and designated as “training EEG change.”Likewise, the normalized change in the baseline EEG amplitudewas expressed by the ratio of the second divided by the firstbaseline, and designated as “resting EEG change.”
Statistical AnalysisBetween-group differences in [18F]Fallypride BPND, γ, andt-scores were analyzed using a two-way ANOVA, with the brainregion as the within-subject factor and the treatment group(EMG or NFB) as the between-subject factor.
The t-scores derived for γ based on the covariance matrixof the parameter as estimated by the LSSRM fitting procedurewere used to assess the statistical significance of task-induceddopamine release (Christian et al., 2006). According to the model,the t-scores (t = γ/SD(γ), where SD(γ) is the standard errorparametric value for (γ) represent effect sizes for DA releaseduring the task. With a degree of freedom of 75, a threshold oft > 2.4 was used to represent P < 0.05 with a one-tailed t-test(Christian et al., 2006).
To test for group/condition differences in EEG absolute powerspectrum, we used a permutation test with 5,000 repetitions on allchannels, and subsequently corrected for multiple comparisonsusing binomial correction. The significance threshold for allcomparisons was set to alpha = 0.05.
The quantitative relationship between dopamine release andEEG change was investigated using a Pearson correlationanalysis, where intra-individual alpha changes (training EEGchange, resting EEG change) were used as predictors of task-induced dopamine release (γ).
RESULTS
PET Signatures During NFB and EMGTraining[18F]Fallypride BPND values obtained in the EMG- and NFB-treated subjects are shown in Table 1. A two-way ANOVA forBPND with both region and treatment group as main factorsrevealed a significant main effect of region (F2,90 = 1,167;p < 0.001) but no main effect of treatment (F1,90 = 3.2; p > 0.05)and no interaction between region and treatment (F2,90 = 0.35;p > 0.05). BPND values between the NFB and EMG groups
TABLE 1 | [18F]Fallypride BPND values obtained in the NFB and EMGtreatment groups.
NFB EMG
Anterior cingulate cortex 0.62 ± 0.13 0.55 ± 0.11
Frontal cortex 0.47 ± 0.12 0.38 ± 0.11
Thalamus 3.33 ± 0.47 3.14 ± 0.34
Values are means ± SD.
were not statistically different in any brain regions investigated,indicating the two groups were physiologically well-matched atbaseline. BPND values of circa 0.60 were obtained in the ACCand in the FC for both treatment groups, and were 5–6 and 7–8 times lower, as expected, that those obtained in the thalamuswhere dopamine receptor binding is known to be stronger.
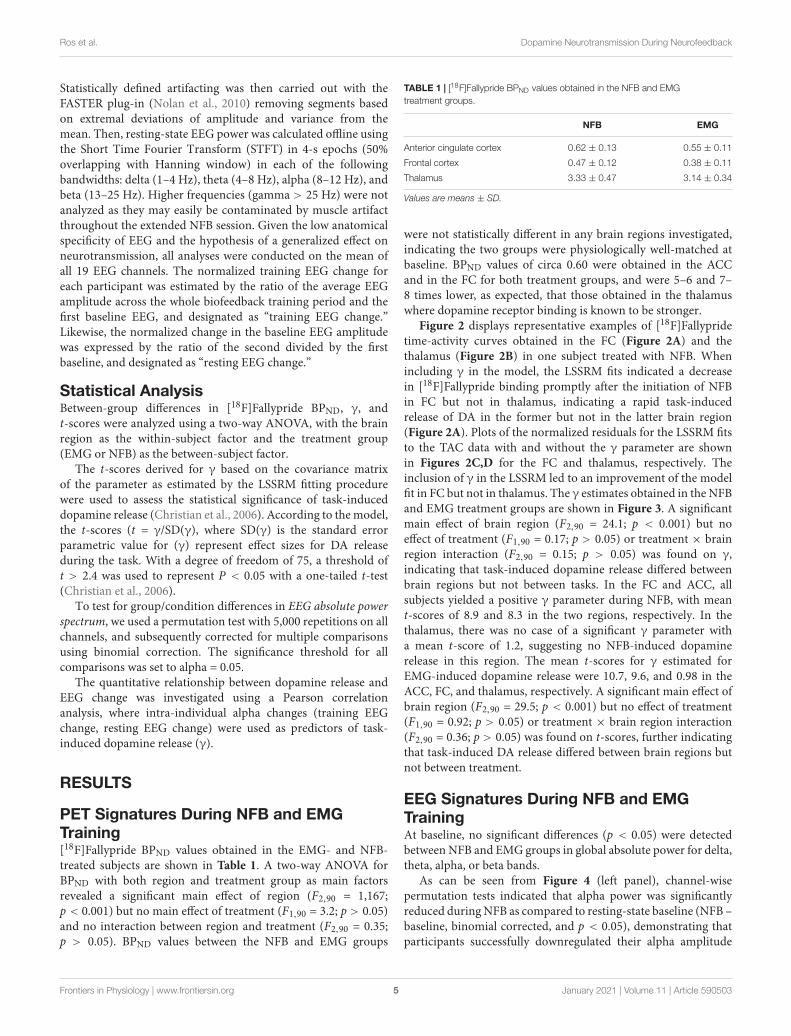
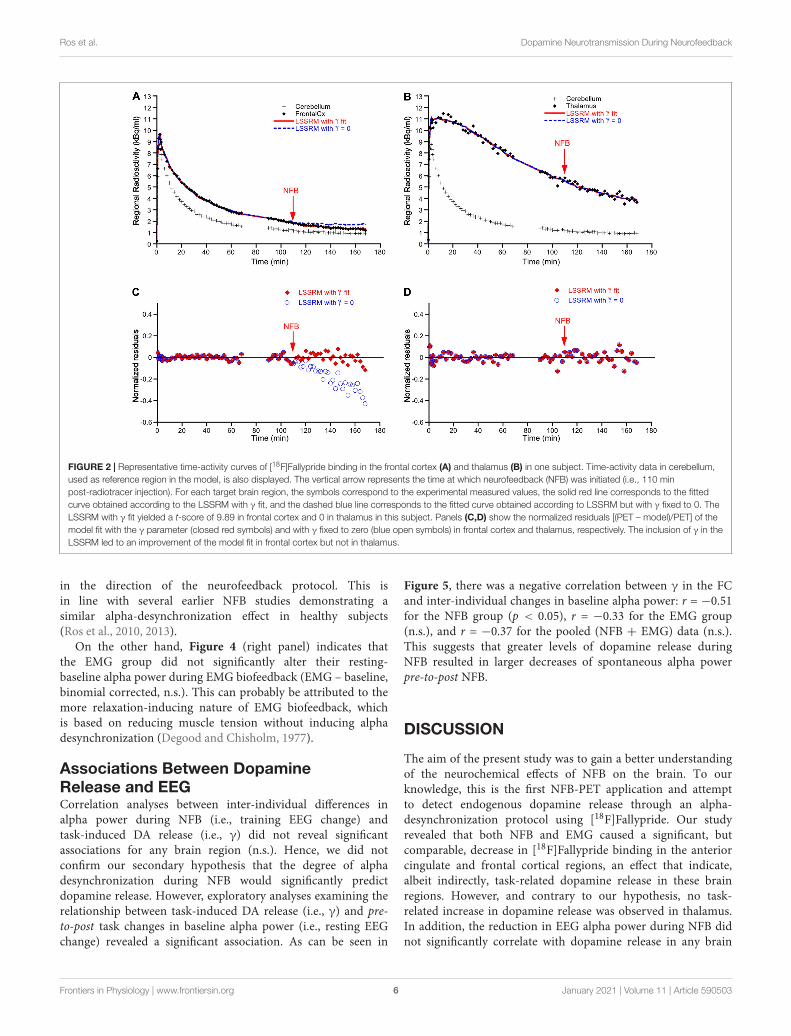
Figure 2 displays representative examples of [18F]Fallypridetime-activity curves obtained in the FC (Figure 2A) and thethalamus (Figure 2B) in one subject treated with NFB. Whenincluding γ in the model, the LSSRM fits indicated a decreasein [18F]Fallypride binding promptly after the initiation of NFBin FC but not in thalamus, indicating a rapid task-inducedrelease of DA in the former but not in the latter brain region(Figure 2A). Plots of the normalized residuals for the LSSRM fitsto the TAC data with and without the γ parameter are shownin Figures 2C,D for the FC and thalamus, respectively. Theinclusion of γ in the LSSRM led to an improvement of the modelfit in FC but not in thalamus. The γ estimates obtained in the NFBand EMG treatment groups are shown in Figure 3. A significantmain effect of brain region (F2,90 = 24.1; p < 0.001) but noeffect of treatment (F1,90 = 0.17; p > 0.05) or treatment × brainregion interaction (F2,90 = 0.15; p > 0.05) was found on γ,indicating that task-induced dopamine release differed betweenbrain regions but not between tasks. In the FC and ACC, allsubjects yielded a positive γ parameter during NFB, with meant-scores of 8.9 and 8.3 in the two regions, respectively. In thethalamus, there was no case of a significant γ parameter witha mean t-score of 1.2, suggesting no NFB-induced dopaminerelease in this region. The mean t-scores for γ estimated forEMG-induced dopamine release were 10.7, 9.6, and 0.98 in theACC, FC, and thalamus, respectively. A significant main effect ofbrain region (F2,90 = 29.5; p < 0.001) but no effect of treatment(F1,90 = 0.92; p > 0.05) or treatment × brain region interaction(F2,90 = 0.36; p > 0.05) was found on t-scores, further indicatingthat task-induced DA release differed between brain regions butnot between treatment.
EEG Signatures During NFB and EMGTrainingAt baseline, no significant differences (p < 0.05) were detectedbetween NFB and EMG groups in global absolute power for delta,theta, alpha, or beta bands.
As can be seen from Figure 4 (left panel), channel-wisepermutation tests indicated that alpha power was significantlyreduced during NFB as compared to resting-state baseline (NFB –baseline, binomial corrected, and p < 0.05), demonstrating thatparticipants successfully downregulated their alpha amplitude
Frontiers in Physiology | www.frontiersin.org 5 January 2021 | Volume 11 | Article 590503
Ros et al. Dopamine Neurotransmission During Neurofeedback
FIGURE 2 | Representative time-activity curves of [18F]Fallypride binding in the frontal cortex (A) and thalamus (B) in one subject. Time-activity data in cerebellum,used as reference region in the model, is also displayed. The vertical arrow represents the time at which neurofeedback (NFB) was initiated (i.e., 110 minpost-radiotracer injection). For each target brain region, the symbols correspond to the experimental measured values, the solid red line corresponds to the fittedcurve obtained according to the LSSRM with γ fit, and the dashed blue line corresponds to the fitted curve obtained according to LSSRM but with γ fixed to 0. TheLSSRM with γ fit yielded a t-score of 9.89 in frontal cortex and 0 in thalamus in this subject. Panels (C,D) show the normalized residuals [(PET – model)/PET] of themodel fit with the γ parameter (closed red symbols) and with γ fixed to zero (blue open symbols) in frontal cortex and thalamus, respectively. The inclusion of γ in theLSSRM led to an improvement of the model fit in frontal cortex but not in thalamus.
in the direction of the neurofeedback protocol. This isin line with several earlier NFB studies demonstrating asimilar alpha-desynchronization effect in healthy subjects(Ros et al., 2010, 2013).
On the other hand, Figure 4 (right panel) indicates thatthe EMG group did not significantly alter their resting-baseline alpha power during EMG biofeedback (EMG – baseline,binomial corrected, n.s.). This can probably be attributed to themore relaxation-inducing nature of EMG biofeedback, whichis based on reducing muscle tension without inducing alphadesynchronization (Degood and Chisholm, 1977).
Associations Between DopamineRelease and EEGCorrelation analyses between inter-individual differences inalpha power during NFB (i.e., training EEG change) andtask-induced DA release (i.e., γ) did not reveal significantassociations for any brain region (n.s.). Hence, we did notconfirm our secondary hypothesis that the degree of alphadesynchronization during NFB would significantly predictdopamine release. However, exploratory analyses examining therelationship between task-induced DA release (i.e., γ) and pre-to-post task changes in baseline alpha power (i.e., resting EEGchange) revealed a significant association. As can be seen in
Figure 5, there was a negative correlation between γ in the FCand inter-individual changes in baseline alpha power: r = −0.51for the NFB group (p < 0.05), r = −0.33 for the EMG group(n.s.), and r = −0.37 for the pooled (NFB + EMG) data (n.s.).This suggests that greater levels of dopamine release duringNFB resulted in larger decreases of spontaneous alpha powerpre-to-post NFB.
DISCUSSION
The aim of the present study was to gain a better understandingof the neurochemical effects of NFB on the brain. To ourknowledge, this is the first NFB-PET application and attemptto detect endogenous dopamine release through an alpha-desynchronization protocol using [18F]Fallypride. Our studyrevealed that both NFB and EMG caused a significant, butcomparable, decrease in [18F]Fallypride binding in the anteriorcingulate and frontal cortical regions, an effect that indicate,albeit indirectly, task-related dopamine release in these brainregions. However, and contrary to our hypothesis, no task-related increase in dopamine release was observed in thalamus.In addition, the reduction in EEG alpha power during NFB didnot significantly correlate with dopamine release in any brain
Frontiers in Physiology | www.frontiersin.org 6 January 2021 | Volume 11 | Article 590503
Ros et al. Dopamine Neurotransmission During Neurofeedback
FIGURE 3 | Endogenous dopamine release during NFB and EMG conditions.Bar graphs with NFB and EMG group γ parameter values {i.e., amplitude of[18F]Fallypride ligand displacement} for hypothesized regions-of-interest:anterior cingulate cortex (ACC), frontal cortex (FC), and thalamus. Nostatistically significant differences in were detected between groups.
regions, suggesting that alpha-desynchronization per se does notdirectly influence dopamine release. However, we did observecorrelational evidence for the reverse relationship, whereby
the degree of dopamine release in frontal cortex significantlypredicted decreases in spontaneous alpha power pre-to-postNFB. This is an interesting finding, as it supports a delayed(rather than instantaneous) effect of dopamine release on anEEG functional brain measure such as alpha power. Moreover,the observed negative relationship between alpha power anddopamine release is consistent with a previous EEG-PET studyin humans (Kjaer et al., 2002), suggesting that intra-individualchanges in alpha power post-NFB could be partly associated withchanges in dopamine tone.
Because of its high affinity and long half-life, [18F]Fallyprideoffers the possibility to explore D2/3 receptor-mediated signalingin both striatal and extrastriatal regions (Mukherjee et al., 1999,2002). However, due to the high concentration of D2/3 receptorsin striatum, [18F]Fallypride binding kinetics are relatively slow inthis brain region and scan durations of 180 min are needed toreliably reach equilibrium and achieve stable BPND in striatum(Christian et al., 2000; Vernaleken et al., 2011). In extrastriatalregions such as the cortex and thalamus, where D2/3 receptordensities are one to two orders of magnitude lower than in thestriatum (Kessler et al., 1993), equilibrium of [18F]Fallypridebinding is reliably reached within 60 min of scan duration(Vernaleken et al., 2011). In the present study, task timing,which is thus critical for assessing striatal and extrastriataldopamine release, was chosen and optimized for extrastriatalregions and did not permit a concomitant evaluation of striataldopamine release. Consistent with previous studies (Latasteret al., 2011, 2014; Ceccarini et al., 2012; Vrieze et al., 2013;
FIGURE 4 | EEG absolute power changes during NFB and EMG conditions. Top: EEG absolute power spectrum during baseline (green), and NFB/EMG (red) in NFB(left) and EMG (right) groups. Solid lines: mean value at the parietal (Pz) feedback electrode, highlighted areas: standard error interval. Bottom, first row: Topographicplots of absolute alpha amplitude during baseline and NFB, and paired permutation test p-values (binomial corrected, p < 0.05). Bottom, second row: Topographicplots of absolute alpha amplitude during baseline and EMG, and paired permutation test p-values (binomial corrected, p < 0.05).
Frontiers in Physiology | www.frontiersin.org 7 January 2021 | Volume 11 | Article 590503
Ros et al. Dopamine Neurotransmission During Neurofeedback
FIGURE 5 | Correlation between endogenous dopamine release and baselinealpha power change. Scatter plot between frontal cortex dopamine release (γ;y-axis) and baseline change in alpha power (ratio of baseline2/baseline1;x-axis). NFB group subjects are indicated by red crosses, EMG groupsubjects by blue circles. Red, blue, and black lines indicate linear regressionfits for NFB (r = –0.51, p < 0.05), EMG (r = –0.37, n.s.), and pooledNFB + EMG groups (r = –0.33, n.s.), respectively.
Hernaus et al., 2015), we found that [18F]Fallypride and theLSSRM single scan approach can be successfully used to detectdopamine released in cortical regions during task performance.Moreover, the BPND values estimated in the frontal and cingulateregions were consistent with those reported in previous studies(Mukherjee et al., 2002; Cropley et al., 2008).
During the performance of both NFB and EMG, increasesin dopamine release were observed in the ACC and FC. Theimplications from these findings are interesting in relation tocortical regions and their neurotransmitter response to an activetask. As there was an effect observed regardless of treatmentgroup, this indicates that both tasks similarly induced dopaminerelease but that this effect was preferentially circumscribed tocortical regions as it was not observed in subcortical regionssuch as thalamus. Interestingly, converging evidence suggest thatdopamine signaling in the PFC is essential for motivation and forpromoting attention during goal-directed behaviors (Bilder et al.,2004; Costa, 2007; Assadi et al., 2009). On the other hand, theACC has been proposed to play a central role in using actionoutcomes to guide future behaviors and to be involved in theprocessing of negative feedback information (Williams et al.,2004; Hayden and Platt, 2010). Dopamine release in both groupsmay have occurred as a result of the positive reward and/ornegative feedback presented to subjects during neurofeedbackgameplay. This is a plausible assumption, insofar other studieshave found that reward-correlated information is encoded inlow-frequency signals (<32 Hz) within the dopaminergic system(Pasquereau et al., 2019). Moreover, since neurofeedback is based
on closed-loop feedback, it has been proposed this involves error-prediction (Ros et al., 2014), which has historically been linkedto dopamine signaling (Schultz et al., 1997). Nevertheless, bothgoal-directed tasks and video games have been found to belinked to dopamine release, without any intent to control corticaloscillations (Koepp et al., 1998; Vrieze et al., 2013; Kasanovaet al., 2018). The present work raises questions to be addressed byfuture studies with regard to the experimental protocol betweentreatment groups. Specifically, the goal of examining dopaminerelease induced by an alpha-desynchronization neurofeedbackprotocol may not be optimal, given that the visual neurofeedbacktask conditions do not control for the potential influence of agoal-directed task or a video-game type interface.
On the other hand, we regard this a pilot “proof-of-concept”study and future refinement may be necessary. In addition to ROIanalysis, previous studies investigating task-induced dopaminerelease using the LSSRM have used voxel-based parametricimages of t-scores to quantify the spatial extent of task-activatedvoxels exceeding a significant t-score threshold (Christian et al.,2006). Indeed, task-induced activations are not necessarilyassociated with a sharp peak of dopamine release, and canalso manifest as spatially distributed dopamine activation eventswithin certain brain areas. Such a spatial-extent-based approachis generally viewed as more sensitive (Poline et al., 1997), and hasbeen successfully used to detect the spatial extent of task-induceddopamine neuromodulation (Christian et al., 2006; Lataster et al.,2011; Ceccarini et al., 2012; Kasanova et al., 2017). Large ROIscontain a large number of voxels and taking the mean of allthe voxels in one ROI may lessen the significance of the smallpopulation of voxels that may have been exhibiting activation(Davis et al., 2014; Tong et al., 2016). Using voxel-wise parametricmaps rather than ROI-based analysis to measure changes in D2/3receptor binding is deemed a better way to deal with inter-subjectvariability that may be induced by the decreasing accuracy ofactivation measures caused by the larger radius of an entire regionof interest (Oosterhof et al., 2011; Matheson et al., 2017). Voxel-by voxel analyses would allow to preserve spatial resolution,improve signal-to-noise ratio, and provide high-quality bindingparametric images and reliable and regionally specific parameterestimates (Friston et al., 1994; Tomasi et al., 2009; Odano et al.,2017). It would enable refinement of sub-regions in alreadyhighlighted regions of interest, where activation may have beenmasked within a region, as voxel-by-voxel analysis is moresensitive to fluctuations compared to ROI analysis. Put simply,minimal visual inspection of parametric maps may be better atdetecting phenomena invisible to ROI analysis, such as a task-associated effects in smaller regions/subdivisions of the brain(Tomasi et al., 2009).
CONCLUSION
Our aim was to assess the effect of EEG-based neurofeedbackon endogenous dopamine release using PET imaging. By useof the radiotracer [18F]Fallypride, we were able to measureD2/3 receptor activity in target brain regions, and by applyinga linearized version of the simplified reference tissue model
Frontiers in Physiology | www.frontiersin.org 8 January 2021 | Volume 11 | Article 590503
Ros et al. Dopamine Neurotransmission During Neurofeedback
(LSRTM), we were able to quantify ligand displacement andreceptor density. It was hypothesized that there would be astatistically significant increase in endogenous dopamine releasein the neurofeedback group in the FC, the ACC, and in thethalamus, and that a differential effect would be observedin the EMG group. Our observations showed that, contraryto our hypothesis, both NFB and EMG treatment inducedsimilar increases in dopamine release and that this effect wasrestricted to cortical regions. We are thus unable to concludethat neurofeedback differentially induces endogenous dopaminerelease, and further investigations in this area are suggestedto gain a deeper understanding of neurofeedback’s potencyin inducing dopamine release, and its specific ability to alterneuromodulatory pathways. Future replication of our work iswarranted using different stimuli between experimental groupsin order to better distinguish the effect of neurofeedback ondopamine release. We hope that this investigation will lead tofurther studies on neurofeedback’s prospective ability to inducemeasurable changes in brain function and brain plasticity.
DATA AVAILABILITY STATEMENT
The raw data supporting the conclusions of this article will bemade available by the authors, without undue reservation.
ETHICS STATEMENT
The studies involving human participants were reviewedand approved by Commission Cantonale d’Ethique de laRecherche (CCER). The patients/participants provided theirwritten informed consent to participate in this study.
AUTHOR CONTRIBUTIONS
TR and NG contributed to the study conception, study design,study supervision, data analysis, data interpretation, manuscriptdrafting, and manuscript revision. TR and VG also contributedto the data collection. PV and VG contributed to manuscriptdrafting and revision. JK, TA, and AM contributed to the dataanalysis and statistical analysis. All authors contributed to thearticle and approved the submitted version.
FUNDING
The study was supported by the BIAL Foundation(grant number 442/14).
REFERENCESAlbrecht, D. S., Kareken, D. A., Christian, B. T., Dzemidzic, M., and Yoder, K. K.
(2014). Cortical dopamine release during a behavioral response inhibition task.Synapse 68, 266–274. doi: 10.1002/syn.21736
Alpert, N. M., Badgaiyan, R. D., Livni, E., and Fischman, A. J. (2003). A novelmethod for noninvasive detection of neuromodulatory changes in specificneurotransmitter systems. Neuroimage 19, 1049–1060. doi: 10.1016/s1053-8119(03)00186-1
Assadi, S. M., Yucel, M., and Pantelis, C. (2009). Dopamine modulates neuralnetworks involved in effort-based decision-making. Neurosci. Biobehav. Rev. 33,383–393. doi: 10.1016/j.neubiorev.2008.10.010
Bilder, R. M., Volavka, J., Lachman, H. M., and Grace, A. A. (2004). The catechol-O-methyltransferase polymorphism: relations to the tonic-phasic dopaminehypothesis and neuropsychiatric phenotypes. Neuropsychopharmacology 29,1943–1961. doi: 10.1038/sj.npp.1300542
Bresnahan, S. M., Barry, R. J., Clarke, A. R., and Johnstone, S. J. (2006).Quantitative EEG analysis in dexamphetamine-responsive adults withattention-deficit/hyperactivity disorder. Psychiatry Res.141, 151–159.doi: 10.1016/j.psychres.2005.09.002
Buzsáki, G., Anastassiou, C. A., and Koch, C. (2012). The origin of extracellularfields and currents — EEG, ECoG, LFP and spikes. Nat. Rev. Neurosci. 13,407–420. doi: 10.1038/nrn3241
Ceccarini, J., Vrieze, E., Koole, M., Muylle, T., Bormans, G., Claes, S., et al. (2012).Optimized In Vivo Detection of Dopamine Release Using 18F-Fallypride PET.J. Nuclear Med. 53, 1565–1572. doi: 10.2967/jnumed.111.099416
Chen, C.-R. R., Yang, S.-R. R., Liu, Y.-Y. Y., Qu, W.-M. M., Urade, Y., and Huang,Z.-L. L. (2013). Roles of Adrenergic ??1 and Dopamine D1 and D2 Receptorsin the Mediation of the Desynchronization Effects of Modafinil in a MouseEEG Synchronization Model. PLoS One 8:e76102. doi: 10.1371/journal.pone.0076102
Christian, B. T., Lehrer, D. S., Shi, B., Narayanan, T. K., Strohmeyer, P. S.,Buchsbaum, M. S., et al. (2006). Measuring dopamine neuromodulation in thethalamus: Using [F-18]fallypride PET to study dopamine release during a spatialattention task. NeuroImage 31, 139–152. doi: 10.1016/j.neuroimage.2005.11.052
Christian, B. T., Narayanan, T. K., Shi, B., and Mukherjee, J. (2000). Quantitationof striatal and extrastriatal D-2 dopamine receptors using PET imaging of[(18)F]fallypride in nonhuman primates. Synapse 38, 71–79. doi: 10.1002/1098-2396(200010)38:1<71::aid-syn8>3.0.co;2-2
Cooper, N. R., Croft, R. J., Dominey, S. J. J., Burgess, A. P., and Gruzelier,J. H. (2003). Paradox lost? Exploring the role of alpha oscillations duringexternally vs. internally directed attention and the implications for idling andinhibition hypotheses. Int. J. Psychophysiol. 47, 65–74. doi: 10.1016/s0167-8760(02)00107-1
Costa, R. M. (2007). Plastic corticostriatal circuits for action learning: what’sdopamine got to do with it? Ann. N. Y. Acad. Sci. 1104, 172–191. doi: 10.1196/annals.1390.015
Cropley, V. L., Innis, R. B., Nathan, P. J., Brown, A. K., Sangare, J. L., Lerner,A., et al. (2008). Small effect of dopamine release and no effect of dopaminedepletion on [18F]fallypride binding in healthy humans. Synapse 62, 399–408.doi: 10.1002/syn.20506
Davis, T., Larocque, K. F., Mumford, J. A., Norman, K. A., Wagner, A. D.,and Poldrack, R. A. (2014). What do differences between multi-voxeland univariate analysis mean? How subject-, voxel-, and trial-level varianceimpact fMRI analysis. NeuroImage 97, 271–283. doi: 10.1016/j.neuroimage.2014.04.037
Degood, D. E., and Chisholm, R. C. (1977). Multiple response comparison ofparietal EEG and frontalis EMG biofeedback. Psychophysiology 14, 258–265.doi: 10.1111/j.1469-8986.1977.tb01171.x
Dockree, P. M., Barnes, J. J. M., Matthews, N., Dean, A., Abe, R., Nandam, L. S.,et al. (2017). The Effects of Methylphenidate on the Neural Signatures ofSustained Attention. Biological Psychiatry 82, 687–694. doi: 10.1016/j.biopsych.2017.04.016
Ergenoglu, T., Demiralp, T., Bayraktaroglu, Z., Ergen, M., Beydagi, H., and Uresin,Y. (2004). Alpha rhythm of the EEG modulates visual detection performancein humans. Cognitive Brain Research, 20, 376–383. doi: 10.1016/j.cogbrainres.2004.03.009
Friston, K. J., Holmes, A. P., Worsley, K. J., Poline, J. P., Frith, C. D., andFrackowiak, R. S. J. (1994). Statistical parametric maps in functional imaging:A general linear approach. Hum. Brain Map. 2, 189–210. doi: 10.1002/hbm.460020402
Frontiers in Physiology | www.frontiersin.org 9 January 2021 | Volume 11 | Article 590503
Ros et al. Dopamine Neurotransmission During Neurofeedback
Ginovart, N. (2005). Imaging the dopamine system with in vivo [11C]raclopridedisplacement studies: understanding the true mechanism. Mol. Imaging Biol. 7,45–52. doi: 10.1007/s11307-005-0932-0
Groppe, D. M., Bickel, S., Keller, C. J., Jain, S. K., Hwang, S. T., Harden, C., et al.(2013). Dominant frequencies of resting human brain activity as measured bythe electrocorticogram. NeuroImage 79, 223–233. doi: 10.1016/j.neuroimage.2013.04.044
Haegens, S., Nacher, V., Luna, R., Romo, R., and Jensen, O. (2011). -Oscillationsin the monkey sensorimotor network influence discrimination performance byrhythmical inhibition of neuronal spiking. Proc. Natl. Acad. Sci. 108, 19377–19382. doi: 10.1073/pnas.1117190108
Harris, K. D., and Thiele, A. (2011). Cortical state and attention. Nat. Rev. Neurosci.12, 509–523. doi: 10.1038/nrn3084
Hayden, B. Y., and Platt, M. L. (2010). Neurons in anterior cingulate cortexmultiplex information about reward and action. J. Neurosci. 30, 3339–3346.doi: 10.1523/jneurosci.4874-09.2010
Hernaus, D., Collip, D., Kasanova, Z., Winz, O., Heinzel, A., Van Amelsvoort, T.,et al. (2015). No evidence for attenuated stress-induced extrastriatal dopaminesignaling in psychotic disorder. Transl. Psychiatry 5, e547. doi: 10.1038/tp.2015.37
Jensen, O., and Mazaheri, A. (2010). Shaping Functional Architecture byOscillatory Alpha Activity: Gating by Inhibition. Front. Human Neurosci. 4:186.doi: 10.3389/fnhum.2010.00186
Kasanova, Z., Ceccarini, J., Frank, M. J., Amelsvoort, T. V., Booij, J., Heinzel,A., et al. (2017). Striatal dopaminergic modulation of reinforcement learningpredicts reward-oriented behavior in daily life. Biol.0 Psychol. 127, 1–9. doi:10.1016/j.biopsycho.2017.04.014
Kasanova, Z., Ceccarini, J., Frank, M. J., Van Amelsvoort, T., Booij, J., VanDuin, E., et al. (2018). Intact striatal dopaminergic modulation of rewardlearning and daily-life reward-oriented behavior in first-degree relatives ofindividuals with psychotic disorder. Psychol. Med. 48, 1909–1914. doi: 10.1017/s0033291717003476
Kessler, R. M., Whetsell, W. O., Ansari, M. S., Votaw, J. R., De Paulis, T., Clanton,J. A., et al. (1993). Identification of extrastriatal dopamine D2 receptors inpost mortem human brain with [125I]epidepride. Brain Res. 609, 237–243.doi: 10.1016/0006-8993(93)90878-q
Kjaer, T. W., Bertelsen, C., Piccini, P., Brooks, D., Alving, J., and Lou,H. C. (2002). Increased dopamine tone during meditation-induced change ofconsciousness. Cognitive Brain Res. 13, 255–259. doi: 10.1016/s0926-6410(01)00106-9
Kluetsch, R. C., Ros, T., Théberge, J., Frewen, P. A., Calhoun, V. D., Schmahl, C.,et al. (2014). Plastic modulation of PTSD resting-state networks and subjectivewellbeing by EEG neurofeedback. Acta Psychiatrica Scandinavica 130, 123–136.doi: 10.1111/acps.12229
Koepp, M. J., Gunn, R. N., Lawrence, A. D., Cunningham, V. J., Dagher, A., Jones,T., et al. (1998). Evidence for striatal dopamine release during a video game.Nature 393, 266–268. doi: 10.1038/30498
Lataster, J., Collip, D., Ceccarini, J., Haas, D., Booij, L., Van Os, J., et al. (2011).Psychosocial stress is associated with in vivo dopamine release in humanventromedial prefrontal cortex: A positron emission tomography study using[18F]fallypride. NeuroImage 58, 1081–1089. doi: 10.1016/j.neuroimage.2011.07.030
Lataster, J., Collip, D., Ceccarini, J., Hernaus, D., Haas, D., Booij, L., et al. (2014).Familial liability to psychosis is associated with attenuated dopamine stresssignaling in ventromedial prefrontal cortex. Schizophr. Bull 40, 66–77. doi:10.1093/schbul/sbs187
Lee, S. H., and Dan, Y. (2012). Neuromodulation of Brain States. Neuron 76,109–222.
Liu, J., Lee, H. J., Weitz, A. J., Fang, Z., Lin, P., Choy, M., et al. (2015). Frequency-selective control of cortical and subcortical networks by central thalamus. Elife4:e09215.
Lohani, S., Martig, A. K., Deisseroth, K., Witten, I. B., and Moghaddam,B. (2019). Dopamine Modulation of Prefrontal Cortex Activity IsManifold and Operates at Multiple Temporal and Spatial Scales. Cell Rep.27:e116.
Lubar, J. F. (1997). Neocortical dynamics: implications for understanding the roleof neurofeedback and related techniques for the enhancement of attention.Appl. Psychophysiol. Biofeedback 22, 111–126.
Luczak, A., Bartho, P., and Harris, K. D. (2013). Gating of sensory inputby spontaneous cortical activity. J. Neurosci. 33, 1684–1695. doi: 10.1523/jneurosci.2928-12.2013
Macdonald, J. S. P., Mathan, S., and Yeung, N. (2011). Trial-by-trial variationsin subjective attentional state are reflected in ongoing prestimulus EEG alphaoscillations. Front. Psychol. 2:1–16. doi: 10.3389/fpsyg.2011.00082
Matheson, G. J., Stenkrona, P., Cselényi, Z., Plavén-Sigray, P., Halldin, C., Farde,L., et al. (2017). Reliability of volumetric and surface-based normalisation andsmoothing techniques for PET analysis of the cortex: A test-retest analysis using[11C]SCH-23390. NeuroImage 155, 344–353. doi: 10.1016/j.neuroimage.2017.04.031
Mazaheri, A., Nieuwenhuis, I. L. C., Van Dijk, H., and Jensen, O. (2009).Prestimulus alpha and mu activity predicts failure to inhibit motor responses.Hum. Brain Mapp. 30, 1791–1800. doi: 10.1002/hbm.20763
Mcginley, M. J., Vinck, M., Reimer, J., Batista-Brito, R., Zagha, E., Cadwell, C. R.,et al. (2015). Waking State: Rapid Variations Modulate Neural and BehavioralResponses. Neuron 87, 1143–1161. doi: 10.1016/j.neuron.2015.09.012
Mukherjee, J., Christian, B. T., Dunigan, K. A., Shi, B., Narayanan, T. K.,Satter, M., et al. (2002). Brain imaging of 18F-fallypride in normal volunteers:blood analysis, distribution, test-retest studies, and preliminary assessmentof sensitivity to aging effects on dopamine D-2/D-3 receptors. Synapse 46,170–188. doi: 10.1002/syn.10128
Mukherjee, J., Yang, Z. Y., Brown, T., Lew, R., Wernick, M., Ouyang, X., et al.(1999). Preliminary assessment of extrastriatal dopamine D-2 receptor bindingin the rodent and nonhuman primate brains using the high affinity radioligand,18F-fallypride. Nucl. Med. Biol. 26, 519–527. doi: 10.1016/s0969-8051(99)00012-8
Mukherjee, J., Yang, Z. Y., Lew, R., Brown, T., Kronmal, S., Cooper, M. D., et al.(1997). Evaluation of d-amphetamine effects on the binding of dopamine D-2 receptor radioligand, 18F-fallypride in nonhuman primates using positronemission tomography. Synapse 27, 1–13. doi: 10.1002/(sici)1098-2396(199709)27:1<1::aid-syn1>3.0.co;2-9
Nolan, H., Whelan, R., and Reilly, R. B. (2010). FASTER: Fully AutomatedStatistical Thresholding for EEG artifact Rejection. J. Neurosci. Methods 192,152–162. doi: 10.1016/j.jneumeth.2010.07.015
O’Connell, R. G., Dockree, P. M., Robertson, I. H., Bellgrove, M. A., Foxe, J. J.,and Kelly, S. P. (2009). Uncovering the neural signature of lapsing attention:electrophysiological signals predict errors up to 20 s before they occur. J.Neurosci. 29, 8604–8611. doi: 10.1523/JNEUROSCI.5967-08.2009
Odano, I., Varrone, A., Hosoya, T., Sakaguchi, K., Gulyás, B., Padmanabhan, P.,et al. (2017). Simplified estimation of binding parameters based on image-derived reference tissue models for dopamine transporter bindings in non-human primates using [18F]FE-PE2I and PET. Am. J. Nucl. Med. Mole. Imag.7, 246–254.
Omata, K., Hanakawa, T., Morimoto, M., and Honda, M. (2013). Spontaneous SlowFluctuation of EEG Alpha Rhythm Reflects Activity in Deep-Brain Structures: ASimultaneous EEG-fMRI Study. PLoS One 8:e66869. doi: 10.1371/journal.pone.0066869
Oosterhof, N. N., Wiestler, T., Downing, P. E., and Diedrichsen, J. (2011). Acomparison of volume-based and surface-based multi-voxel pattern analysis.NeuroImage 56, 593–600. doi: 10.1016/j.neuroimage.2010.04.270
Pasquereau, B., Tremblay, L., and Turner, R. S. (2019). Local Field Potentials ReflectDopaminergic and Non-Dopaminergic Activities within the Primate Midbrain.Neuroscience 399, 167–183. doi: 10.1016/j.neuroscience.2018.12.016
Poline, J. B., Worsley, K. J., Evans, A. C., and Friston, K. J. (1997). Combiningspatial extent and peak intensity to test for activations in functional imaging.Neuroimage 5, 83–96. doi: 10.1006/nimg.1996.0248
Popoli, P., Ferré, S., Pèzzola, A., Reggio, R., Scotti De Carolis, A., and Fuxe, K.(1996). Stimulation of adenosine A1 receptors prevents the EEG arousal due todopamine D1 receptor activation in rabbits. Eur. J. Pharmacol. 305, 123–126.doi: 10.1016/0014-2999(96)00242-7
Puig, M. V., and Miller, E. K. (2015). Neural Substrates of Dopamine D2 ReceptorModulated Executive Functions in the Monkey Prefrontal Cortex. CerebralCortex 25, 2980–2987. doi: 10.1093/cercor/bhu096
Romei, V., Brodbeck, V., Michel, C., Amedi, A., Pascual-Leone, A., and Thut,G. (2008). Spontaneous fluctuations in posterior ??-band EEG activity reflectvariability in excitability of human visual areas. Cerebral Cortex 18, 2010–2018.doi: 10.1093/cercor/bhm229
Frontiers in Physiology | www.frontiersin.org 10 January 2021 | Volume 11 | Article 590503
Ros et al. Dopamine Neurotransmission During Neurofeedback
Ros, T. B. J. B., Lanius, R. A., and Vuilleumier, P. (2014). Tuning pathological brainoscillations with neurofeedback: a systems neuroscience framework. Front.Hum. Neurosci. 8:1008.doi: 10.3389/fnhum.2014.01008
Ros, T., Munneke, M., Ruge, D., Gruzelier, J., and Rothwell, J. (2010). Endogenouscontrol of waking brain rhythms induces neuroplasticity in humans. Eur. J.Neurosci. 31, 770–778. doi: 10.1111/j.1460-9568.2010.07100.x
Ros, T., Théberge, J., Frewen, P. A., Kluetsch, R., Densmore, M., Calhoun, V. D.,et al. (2013). Mind over chatter: Plastic up-regulation of the fMRI saliencenetwork directly after EEG neurofeedback. NeuroImage 65, 324–335. doi: 10.1016/j.neuroimage.2012.09.046
Rossini, P. M., Desiato, M. T., Lavaroni, F., and Caramia, M. D. (1991). Brainexcitability and electroencephalographic activation: non-invasive evaluation inhealthy humans via transcranial magnetic stimulation. Brain Res. 567, 111–119.doi: 10.1016/0006-8993(91)91442-4
Schalk, G., Marple, J., Knight, R. T., and Coon, W. G. (2017). InstantaneousVoltage as an Alternative to Power- and Phase-Based Interpretation ofOscillatory Brain Activity. NeuroImage 157, 545–554. doi: 10.1016/j.neuroimage.2017.06.014
Schultz, W., Dayan, P., and Montague, P. R. (1997). A neural substrate of predictionand reward. Science 275, 1593–1599. doi: 10.1126/science.275.5306.1593
Sebban, C., Zhang, X. Q., Tesolin-Decros, B., Millan, M. J., and Spedding,M. (1999). Changes in EEG spectral power in the prefrontal cortexof conscious rats elicited by drugs interacting with dopaminergic andnoradrenergic transmission. Br. J. pharmacol. 128, 1045–1054. doi: 10.1038/sj.bjp.0702894
Slifstein, M., Kegeles, L. S., Xu, X., Thompson, J. L., Urban, N., Castrillon, J.,et al. (2010). Striatal and extrastriatal dopamine release measured with PET and[(18)F] fallypride. Synapse 64, 350–362. doi: 10.1002/syn.20734
Steullet, P., Cabungcal, J. H., Cuenod, M., and Do, K. Q. (2014). Fast oscillatoryactivity in the anterior cingulate cortex: dopaminergic modulation and effectof perineuronal net loss. Front. Cell Neurosci. 8:244. doi: 10.3389/fncel.2014.00244
Tomasi, G., Bertoldo, A., and Cobelli, C. (2009). PET parametric imaging improvedby global-two-stage method. Ann. Biomed. Eng. 37, 419–427. doi: 10.1007/s10439-008-9612-y
Tong, Y., Chen, Q., Nichols, T. E., Rasetti, R., Callicott, J. H., Berman, K. F.,et al. (2016). Seeking optimal region-of-interest (ROI) single-value summarymeasures for fMRI studies in imaging genetics. PLoS One 11:1–20. doi: 10.1371/journal.pone.0151391
Vernaleken, I., Peters, L., Raptis, M., Lin, R., Buchholz, H. G., Zhou, Y., et al. (2011).The applicability of SRTM in [(18)F]fallypride PET investigations: impact ofscan durations. J. Cereb. Blood Flow Metab. 31, 1958–1966. doi: 10.1038/jcbfm.2011.73
Vrieze, E., Ceccarini, J., Pizzagalli, D. A., Bormans, G., Vandenbulcke, M.,Demyttenaere, K., et al. (2013). Measuring extrastriatal dopamine releaseduring a reward learning task. Hum. Brain Mapp. 34, 575–586.
Williams, Z. M., Bush, G., Rauch, S. L., Cosgrove, G. R., and Eskandar, E. N. (2004).Human anterior cingulate neurons and the integration of monetary reward withmotor responses. Nat. Neurosci. 7, 1370–1375. doi: 10.1038/nn1354
Zerlaut, Y., and Destexhe, A. (2017). Enhanced Responsiveness and Low-LevelAwareness in Stochastic Network States. Neuron 94, 1002–1009. doi: 10.1016/j.neuron.2017.04.001
Conflict of Interest: The authors declare that the research was conducted in theabsence of any commercial or financial relationships that could be construed as apotential conflict of interest.


![Regulation of dopamine neurotransmission from serotonergic ...€¦ · DA by serotonergic terminals [45, 47, 64, 65, 77]. This overwhelming exposure of the DA-depleted striatal MSNs](https://static.documents.pub/doc/80x56/608c24dabdeeb6661d2d50cd/regulation-of-dopamine-neurotransmission-from-serotonergic-da-by-serotonergic.jpg)
