Page 1
This is a confidential document solely for the use of client personnel. No part of it may be circulated, quoted, or reproduced for distribution outside the client organization without prior written approval
from Tata Strategic Management Group.
Petrochem Feedstock Overview
Indian Petrochem 2014
- Charu Kapoor, Principal - Chemicals
30th October, 2014
Page 2
Overview of Global Feedstock Scenario
• Feedstocks for Indian Petrochemical Industry
• Key Imperatives
• About Tata Strategic
Page 3
3
Key strategic questions on Feedstock Availability and Imperatives for Indian
Petrochemical Industry
KEY STRATEGIC QUESTIONS
How is the feedstock scenario going to change with major shale gas discoveries in USA?
With availability of cheaper feedstock in terms of shale gas, what is the outlook for global ethylene market?
What processes/ technologies would be adopted for propylene, aromatics production?
How can India leverage its strength of large number of refineries?
What are the imperatives and opportunities for India in this changing scenario?
1
2
3
4
5
Source: Tata Strategic
Page 4
4
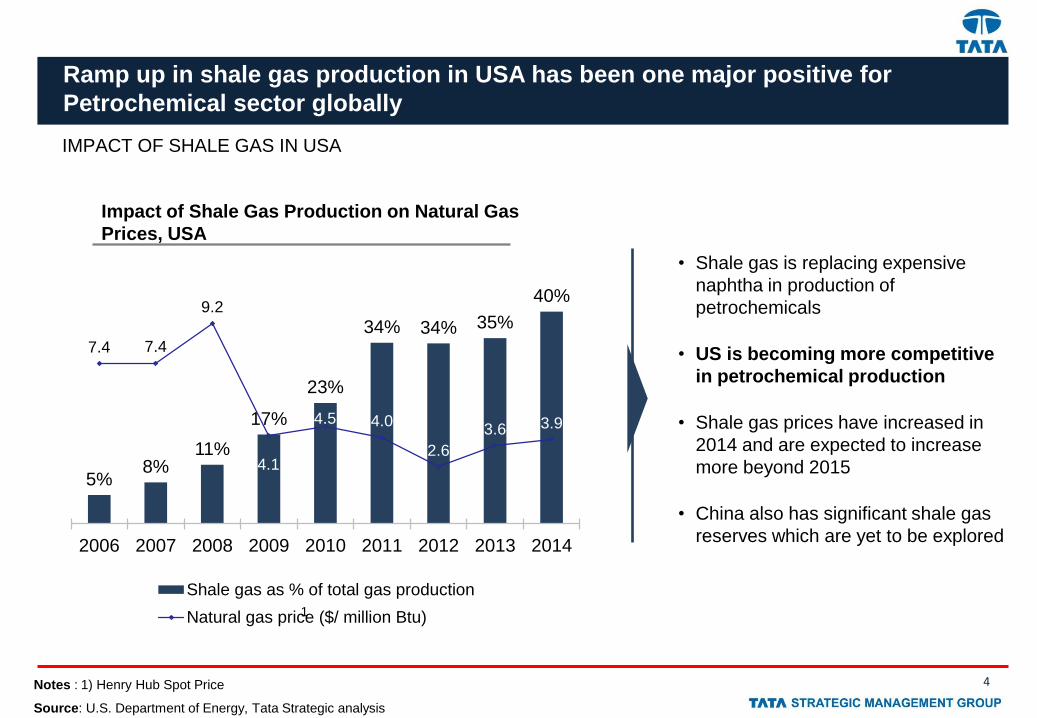
Ramp up in shale gas production in USA has been one major positive for
Petrochemical sector globally
IMPACT OF SHALE GAS IN USA
5% 8%
11%
17%
23%
34% 34% 35%
40%
7.4 7.4
9.2
4.1
4.5 4.0
2.6
3.6 3.9
2006 2007 2008 2009 2010 2011 2012 2013 2014
Shale gas as % of total gas production
Natural gas price ($/ million Btu)
Impact of Shale Gas Production on Natural Gas
Prices, USA
Source: U.S. Department of Energy, Tata Strategic analysis
1
Notes : 1) Henry Hub Spot Price
• Shale gas is replacing expensive
naphtha in production of
petrochemicals
• US is becoming more competitive
in petrochemical production
• Shale gas prices have increased in
2014 and are expected to increase
more beyond 2015
• China also has significant shale gas
reserves which are yet to be explored
Page 5
5
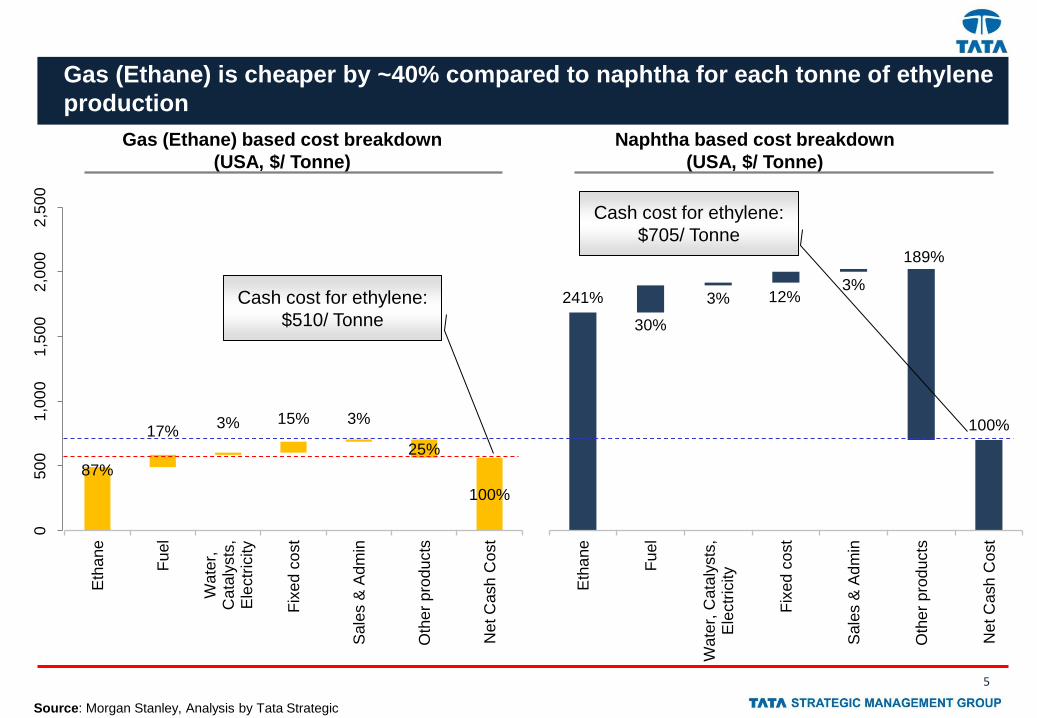
Gas (Ethane) is cheaper by ~40% compared to naphtha for each tonne of ethylene
production
Gas (Ethane) based cost breakdown
(USA, $/ Tonne)
241%
30%
3% 12% 3%
189%
100%
Eth
ane
Fuel
Wa
ter,
Cata
lysts
,E
lectr
icity
Fix
ed
co
st
Sale
s &
Ad
min
Oth
er
pro
du
cts
Net C
ash
Co
st
87%
17% 3% 15% 3%
25%
100%
Eth
ane
Fu
el
Wa
ter,
Cata
lysts
,E
lectr
icity
Fix
ed
co
st
Sale
s &
Ad
min
Oth
er
pro
du
cts
Net C
ash
Co
st
05
00
1,0
00
1,5
00
2,0
00
2,5
00
Naphtha based cost breakdown
(USA, $/ Tonne)
Cash cost for ethylene:
$510/ Tonne
Cash cost for ethylene:
$705/ Tonne
Source: Morgan Stanley, Analysis by Tata Strategic
Page 6
6
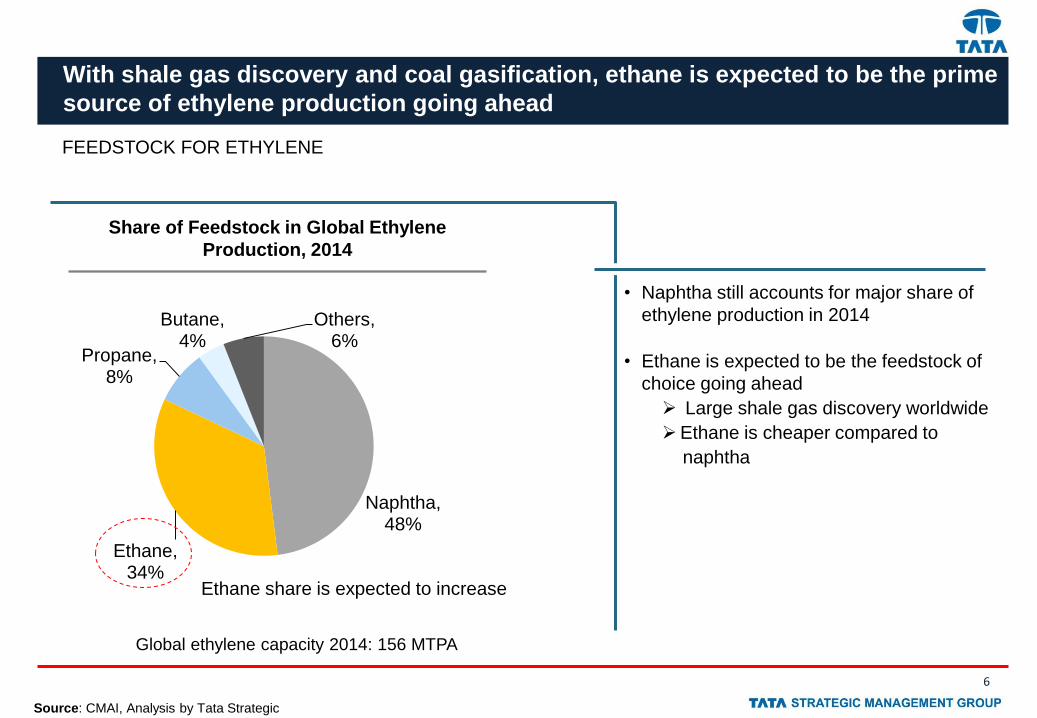
With shale gas discovery and coal gasification, ethane is expected to be the prime
source of ethylene production going ahead
Share of Feedstock in Global Ethylene
Production, 2014
Naphtha, 48%
Ethane, 34%
Propane, 8%
Butane, 4%
Others, 6%
Source: CMAI, Analysis by Tata Strategic
FEEDSTOCK FOR ETHYLENE
• Naphtha still accounts for major share of
ethylene production in 2014
• Ethane is expected to be the feedstock of
choice going ahead
Large shale gas discovery worldwide
Ethane is cheaper compared to
naphtha
Ethane share is expected to increase
Global ethylene capacity 2014: 156 MTPA
Page 7
7
Rising shale gas production in USA has led to overcapacity in ethylene and
polyethylene production
ETHYLENE PRODUCTION IN USA
Source: U.S. Department of Energy, Tata Strategic analysis
Ethylene Capacity, USA (Mn tons)
32 34 37 40
51
2010 2012 2014 2017 (E) 2020 (E)
• 14 million tons of ethylene and 10 million
tons of PE capacity addition is planned in
USA by 2020 leading to concerns on
margins
• If all the expansions go through as
planned, the US is looking at a massive
38% increase in existing ethylene capacity
to over 51 Mn tons by 2020
• USA will need to export 25% to 45% of PE
by 2018 if they want to operate at 90%
capacity utilization
Page 8
8
PETROCHEMICALS CAPACITY ADDITIONS
INCREMENTAL ETHYLENE CAPACITY, 2014-2019 [‘000 TONS]
• Large capacities (>1 MnTPA) by
SINOPEC-KPC PC JV in
China
Borouge in UAE
Kayan, Saudi Polymers in
Saudi Arabia
Exxon Mobil in Singapore
Reliance Industries &
OPAL in India
Coal
gasification Natural gas Natural
gas, mixed feedstock
Feedstock
Middle East and Asia would also witness significant ethylene capacity additions
in the next 5 years
Source: Deutsche Bank Chemicals
950
5600
2750
5500
2,550
Africa China India Middle East Asia ex India& China
Page 9
9
With new crackers being ethane based, supply of other olefins has become a
concern
Cracking - yield
Ethylene: 80.0%
Propylene: 1.6%
Butadiene: 1.6%
Others1: 16.8%
Ethylene: 42.7%
Propylene: 22.2%
Butadiene: 2.1%
Others: 33.0%
Ethylene: 33.3%
Propylene: 14.0%
Butadiene: 4.3%
Others: 48.4%
Natural Gas - Ethane Natural Gas - Propane Naphtha
Source: Industry reports, Analysis by Tata Strategic
Notes : 1) Includes benzene, toluene, fuel oil etc
Yield of other olefins such as Propylene, Butadiene, Benzene is low from ethane compared to naphtha
PRODUCTS FROM VARIOUS FEEDSTOCKS
Page 10
10
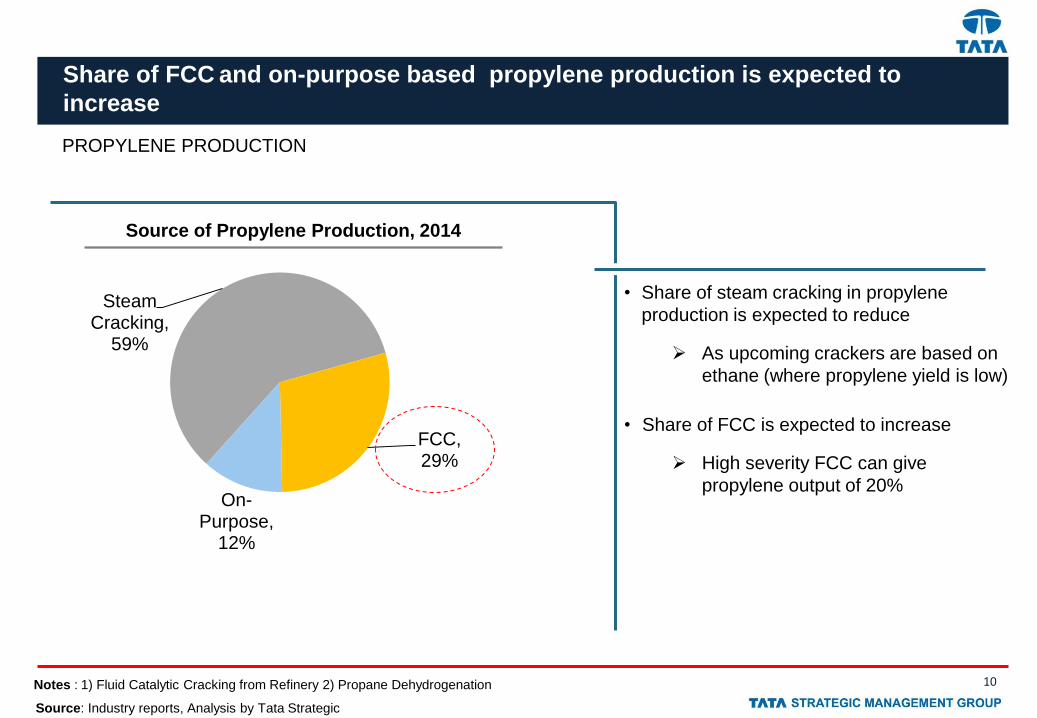
Share of FCC and on-purpose based propylene production is expected to
increase
PROPYLENE PRODUCTION
Source of Propylene Production, 2014
Steam Cracking,
59%
FCC, 29%
On-Purpose,
12%
• Share of steam cracking in propylene
production is expected to reduce
As upcoming crackers are based on
ethane (where propylene yield is low)
• Share of FCC is expected to increase
High severity FCC can give
propylene output of 20%
Notes : 1) Fluid Catalytic Cracking from Refinery 2) Propane Dehydrogenation
Source: Industry reports, Analysis by Tata Strategic
Page 11
11
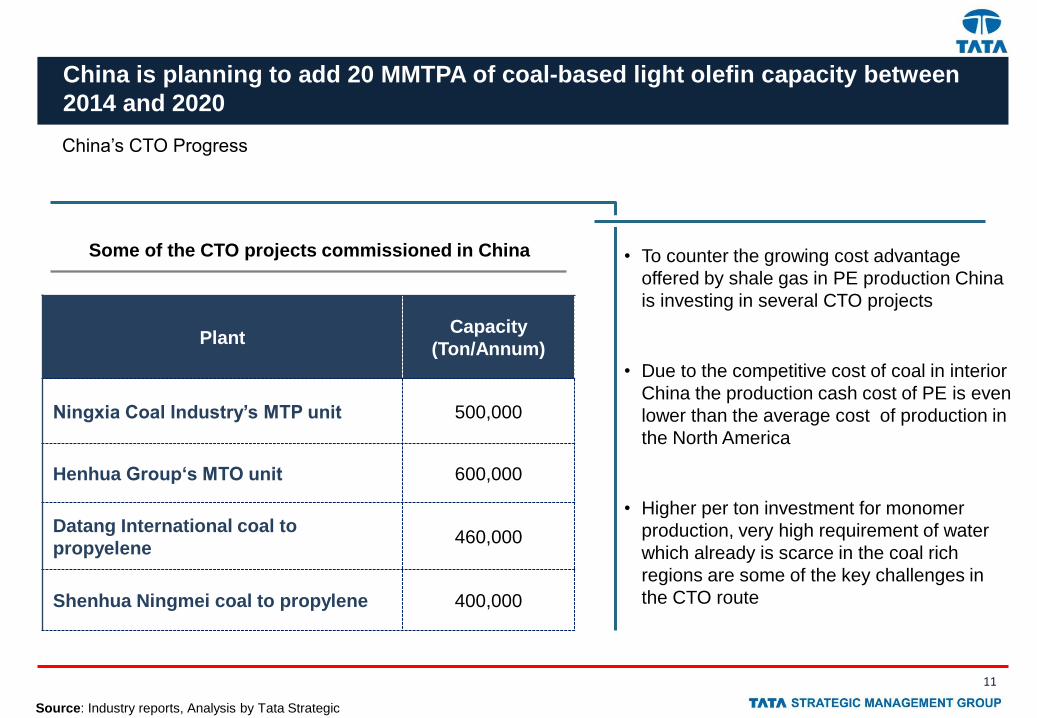
China is planning to add 20 MMTPA of coal-based light olefin capacity between
2014 and 2020
China’s CTO Progress
Some of the CTO projects commissioned in China • To counter the growing cost advantage
offered by shale gas in PE production China
is investing in several CTO projects
• Due to the competitive cost of coal in interior
China the production cash cost of PE is even
lower than the average cost of production in
the North America
• Higher per ton investment for monomer
production, very high requirement of water
which already is scarce in the coal rich
regions are some of the key challenges in
the CTO route
Source: Industry reports, Analysis by Tata Strategic
Plant Capacity
(Ton/Annum)
Ningxia Coal Industry’s MTP unit 500,000
Henhua Group‘s MTO unit 600,000
Datang International coal to
propyelene 460,000
Shenhua Ningmei coal to propylene 400,000
Page 12
12
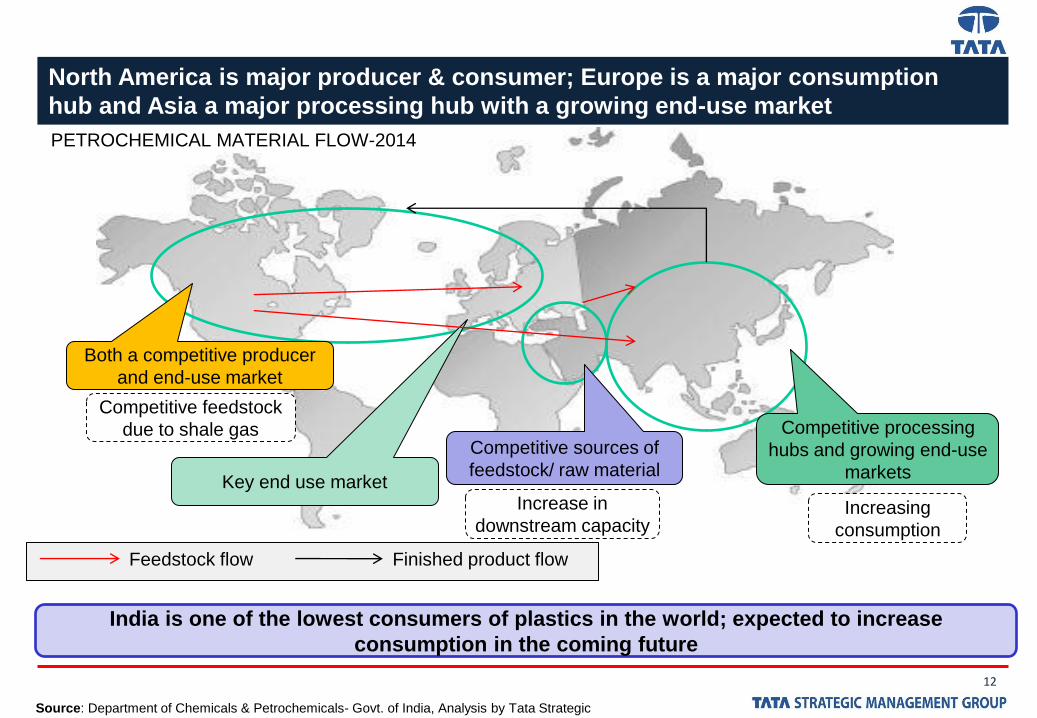
North America is major producer & consumer; Europe is a major consumption
hub and Asia a major processing hub with a growing end-use market
Competitive sources of
feedstock/ raw material
Competitive processing
hubs and growing end-use
markets
Both a competitive producer
and end-use market
Feedstock flow Finished product flow
Source: Department of Chemicals & Petrochemicals- Govt. of India, Analysis by Tata Strategic
Increasing
consumption
Increase in
downstream capacity
Competitive feedstock
due to shale gas
Key end use market
PETROCHEMICAL MATERIAL FLOW-2014
India is one of the lowest consumers of plastics in the world; expected to increase
consumption in the coming future
Page 13
• Overview of Global Feedstock Scenario
Feedstocks for Indian Petrochemical Industry
• Key Imperatives
• About Tata Strategic
Page 14
14
India is expected to remain surplus in naphtha, naphtha based crackers would
not be cost competitive
Demand from petrochemicals in FY19 includes demand from existing crackers, new crackers & aromatics complexes
NAPHTHA DEMAND SUPPLY SCENARIO IN INDIA
Source: MoPNG,Industry reports, Estimates by Tata Strategic
Notes : 1) Capacity utilization of refineries is assumed to stay at current levels of ~85%
2) Naphtha percentage by weight as refinery output is assumed to stay at current levels of 8.7%
Naphtha Demand supply (Mn Tons)
18.9
23.6
11.5
17.9
2014 2019 (E)
Production Consumption
NAPHTHA
• Aromatics can be produced from Naphtha
cracker Py-gas
• Py-gas is primarily used for gasoline blending in
India
• Toluene and higher aromatics can be extracted
from py-gas stream from naphtha cracker. India
is significantly short in these raw material
Advantages
Progress so far
• Currently there is no production of Styrene in
India (~100% imports)
• This can be met through the excess Naphtha
cracker capacity
Page 15
15
Petroleum coke has made significant developments in the steam coal industry
over the last few years and will continue to do so in the future
PETCOKE APPLICATIONS
Petcoke
Petcoke to
liquids
Syngas
Synthetic
Natural Gas
As a fuel in
Power Plants
Source: Analysis by Tata Strategic
PETCOKE
• Gasification of petcoke is a favorable technique
since it can capture most of the energy content
and is environmental friendly.
• Petcoke has lower ash, lower moisture, and
lower volatiles than steam coal, resulting in a
much higher heating value
• Production costs associated with pet coke are
considerably low because it is a by-product of
the refining process
Advantages
Petcoke application as a fuel or as a feedstock
Progress so far
• Major global players have plans to set up a
1.1MnTPA acetic acid plant with pet coke as
feedstock
Page 16
16
Low-rank coal as a source of carbon for conversion to olefins has a significant
raw materials advantage over crude oil
Source: Ministry of Coal, GoI, Industry Reports, Tata Strategic Analysis
COAL RESERVES IN INDIA
COAL TO OLEFINS
Raniganj
Jharia
Bokaro
Godavari
Valley
Chanda -
Wardha
Singrauli
Total estimated reserves: ~61 Bn Tonne
Tawa
Valley
Talcher
• Carbon from low grade coal is ~33 times less
costly than carbon from crude oil
• Coal to olefins also offers significant
environmental advantages as it is a wet, low-
severity thermochemical process
• The trend of oil prices staying high in the
international markets have improved the long
term outlook of this industry
Advantages
India’s position vis-à-vis
Leadership position
Progress so far
• Coal block cancellation affecting the project
feasibility
• Coal India Limited to foray into Coal to
Chemical
Reserves Production
China 114 3.8
India 61 0.6Bt
Page 17
17
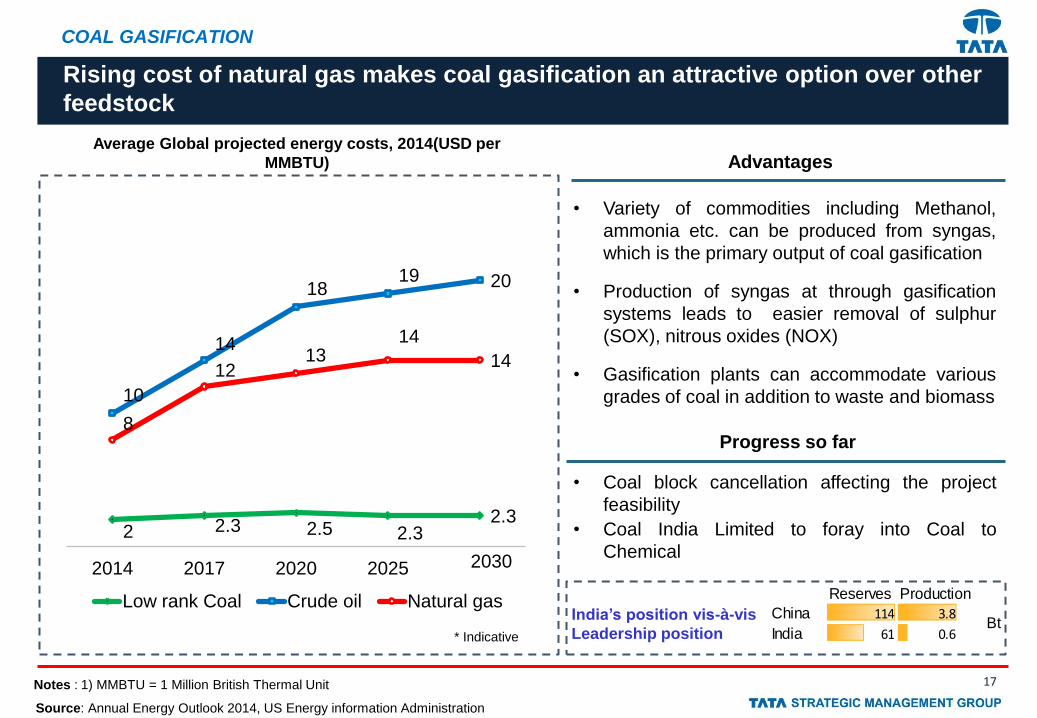
Rising cost of natural gas makes coal gasification an attractive option over other
feedstock
Average Global projected energy costs, 2014(USD per
MMBTU)
2 2.3 2.5 2.3 2.3
10
14
18 19 20
8
12 13
14
14
2014 2017 2020 2025
Low rank Coal Crude oil Natural gas
2030
Source: Annual Energy Outlook 2014, US Energy information Administration
* Indicative
• Variety of commodities including Methanol,
ammonia etc. can be produced from syngas,
which is the primary output of coal gasification
• Production of syngas at through gasification
systems leads to easier removal of sulphur
(SOX), nitrous oxides (NOX)
• Gasification plants can accommodate various
grades of coal in addition to waste and biomass
Advantages
COAL GASIFICATION
Notes : 1) MMBTU = 1 Million British Thermal Unit
Progress so far
• Coal block cancellation affecting the project
feasibility
• Coal India Limited to foray into Coal to
Chemical
India’s position vis-à-vis
Leadership position
Reserves Production
China 114 3.8
India 61 0.6Bt
Page 18
18
CBM is emerging as an alternative feedstock for production of light olefins
through methanol route
Total estimated reserves: 71 Tcf
Source: DGH, GoI
Matix Fertilizer
& Chemicals
Raniganj
Jharia
Sohagpur
Godavari
Cambay
Barmer-
Sanchor
COAL BED METHANE IN INDIA
COAL BED METHANE
• CBM can be used as a feedstock for fertilizer,
steel plants, methanol production and as an
auto fuel in compressed natural gas form
• The products produced from CBM
environmentally superior to many fuels because
they are free of aromatics, nitrogen, and
sulphur, and have a high cetane number
Advantages
Notes : 1) Tcf = Trillion cubic feet
Progress so far
• Commercial production of CBM started in 2007
and latest production numbers are close to 0.30
MMSCMD (million cubic meter per day)
India’s position vis-à-vis
Leadership position
Reserves Production
Russia 1730 1.6
India 71 0.08Tcf
Page 19
19
India’s shale gas reserves may be larger than the conventional gas deposits
and has the potential of being the new and significant contributor to gas supply
KG
Pranhita
Godavari Cambay
Jaisalmer Vindyan Damodar
Valley
Seismic
studies by OIL
in Assam
ONGC is carrying
out pilot projects
Source: EIA, Govt. of India, Industry reports, Tata Strategic Analysis
SHALE GAS RESERVES IN INDIA
SHALE GAS
Total estimated reserves: ~63 Tcf
• The unlocking of domestic shale gas can
help India meet its growing energy demand
• Shale gas industry will have a multiplier
effect on the economy. It is expected that for
every $1 investment in the shale gas
industry will have a new income generation
capability of up to $5
Advantages
Notes : 1) Tcf = Trillion cubic feet
Progress so far
• ONGC & OIL carrying out pilot studies in
Damodar valley
• ONGC to explore 30 additional wells in the
next 2 years
India’s position vis-à-vis
Leadership position
Reserves Production
US 660 4
India 63 0Tcf
Page 20
20
Source: Secondary Research, Industry Report
Biomass as a feedstock can be a significant opportunity for India
Top Field Crop Residues for FY14, Mn tons
159
116 103
Wheat Straw Rice Straw SugarcaneTops
Top Processing Crop Residues for FY14, Mn tons
59
23
6
SugarcaneBagasse
Rice Husk Rice Bran
• A huge array of diverse chemicals are available
from biomass giving the user many new
structural features to exploit.
• India has 180 million hectares of arable land
and >1.5 billion MT/year of food + agri residue
is produced, Hence a large amount of bio waste
at fields & Agri processing units
BIOMASS
Advantages
India’s position vis-à-vis
Leadership position US 16.5
India 14.5Lakh Km2
Progress so far
• India is a favorable establishment for conversion
of residual biomass to olefins due to the
abundance of raw material, but the opportunity
is still untapped.
Page 21
Global Feedstock Scenario
Feedstocks for Indian Chemical Industry
Key Imperatives
• About Tata Strategic
Page 22
22
Key Imperatives for the Industry
Initiatives that Industry can take to
compete globally
1
4 2
3
Ethylene
Source: Analysis by Tata Strategic
• Secure off-take agreements with
upcoming crackers in USA, Middle east
• Investing in downstream derivative unit
or through reverse SEZ route
Aromatics
• Invest in extracting feedstock like Toluene from Naphtha Cracker py-gas
Alternate Feedstocks
• Focus on alternatives like Coal Bed Methane, Coal To Olefins, Biofeedstocks, Domestic Shale gas
Propylene
• Set up High Severity FCCs in refineries
which can process heavier crude for
Propylene production
Page 23
Global Feedstock Scenario
Feedstocks for Indian Chemical Industry
Key Imperatives
About Tata Strategic
Page 24
24
Tata Strategic is the largest Indian owned management consulting firm
AN OVERVIEW
Founded in 1991 as a division of Tata Industries Ltd.
The largest Indian owned Management Consulting firm
Supported by a panel of domain experts
Growing client base outside India
500+ engagements, 100+ clients, across countries, across sectors
Page 25
25
We offer a comprehensive range of solutions covering Direction Setting,
Driving Strategic Initiatives and Implementation
Facilitate
Implementation
Drive Strategic
Initiatives
• Organization Structure
• Culture & HR Transformation
• Manpower Planning &
Optimization
• Leadership Development &
succession planning
Organization Effectiveness
• Revenue Enhancement
• Product Innovation
• Market Share Growth –
Rural/Urban/B2B
• Channel Effectiveness
• Route to Market
Marketing & Sales
• Supply Chain Optimization
• Throughput enhancement
• Superior Fulfillment
• Project Excellence
• Procurement Transformation
• Resource Management
Operations
Set Direction
Strategy
• Scenarios & Vision
• Market insights
• Entry / Growth Strategy
• CSR Strategy
• India Entry
• Alliance & Acquisition Planning
• Strategic due diligence
• Manufacturing Strategy
• Program Management
• Change Management
• Benefit Realization
Implementation
Page 26
26
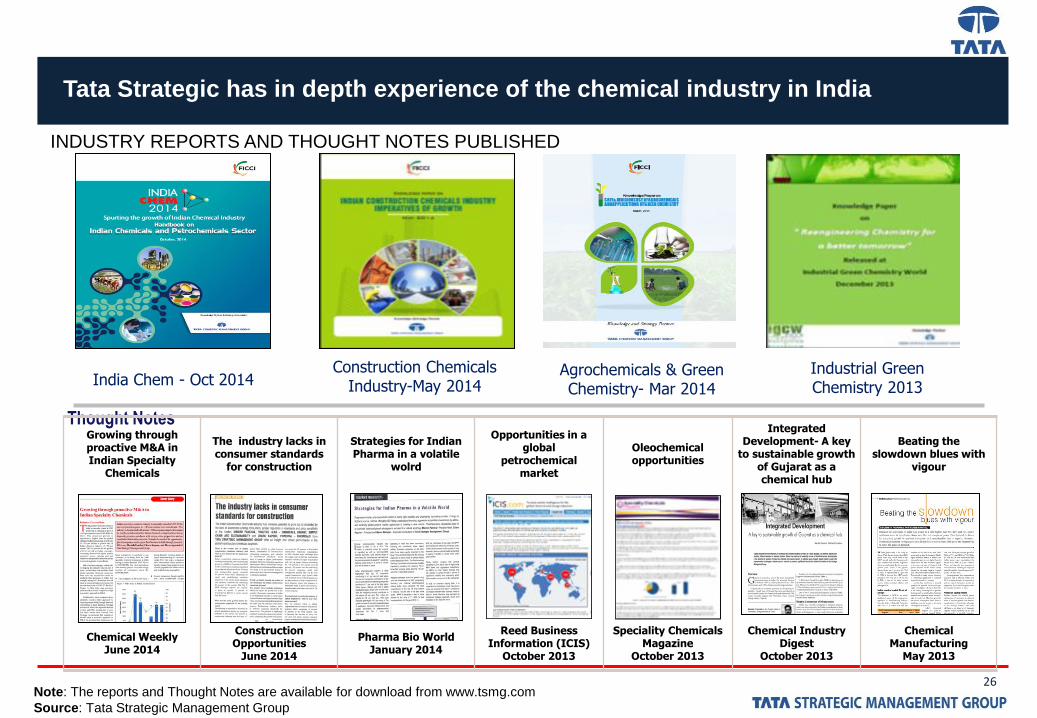
Tata Strategic has in depth experience of the chemical industry in India
Note: The reports and Thought Notes are available for download from www.tsmg.com
Source: Tata Strategic Management Group
INDUSTRY REPORTS AND THOUGHT NOTES PUBLISHED
India Chem - Oct 2014 Industrial Green Chemistry 2013
Agrochemicals & Green Chemistry- Mar 2014
Thought Notes
Construction Chemicals Industry-May 2014
Growing through proactive M&A in Indian Specialty
Chemicals
The industry lacks in consumer standards
for construction
Strategies for Indian Pharma in a volatile
wolrd
Opportunities in a global
petrochemical market
Oleochemical opportunities
Integrated Development- A key
to sustainable growth of Gujarat as a chemical hub
Beating the slowdown blues with
vigour
Chemical Weekly June 2014
Construction Opportunities
June 2014
Pharma Bio World January 2014
Reed Business Information (ICIS)
October 2013
Speciality Chemicals Magazine
October 2013
Chemical Industry Digest
October 2013
Chemical Manufacturing
May 2013
Page 27
27
We assist clients in addressing their strategic business priorities
• How do I make existing businesses effective – sales &
distribution strategy, pricing strategy etc.?
• How do I reduce costs (material, conversion,
overheads, manpower), reduce risks, & improve
productivity?
• What should be my logistics and supply chain
strategies? How do I optimize costs and services?
• How can I grow – portfolio optimization, new products,
new technologies, new geographies?
Typical Client Concerns Tata Strategic Expertise
• Functional strategies
• Integrated cost reduction ; OPTIC/ OSMIC
• Strategic Risk Management
• Procurement, logistics and supply chain optimization
• How do I manage people, align resources, improve retention?
• How do I ensure that people are aligned with vision? • Organizational Effectiveness
• What should be the levers of growth – organic vs.
inorganic growth, strategic alliances etc.?
• Growth/ entry strategy
• Business due diligence
• Target Identification and Valuation for M&A
STRATEGY FORMULATION AND DEPLOYMENT
Page 28
Mumbai
B - 1001, Marathon Futurex,
N.M. Joshi Road
Lower Parel (East),
Mumbai 400 013. INDIA
Tel:+91 22 66376789
Fax: +91 22 66376600
Delhi
Level 12, Building No.8, Tower C
DLF Cyber City, Phase II
Gurgaon – 122002
Haryana, INDIA
Tel:+91 124 4696692
Fax: +91 124 4696970
Contacts :
MANISH PANCHAL
CHARU KAPOOR
PRACTICE HEAD – CHEMICAL, ENERGY
& SUPPLY CHAIN MANAGEMENT
Phone: +91 22 6637 6713
Mobile: +91 98205 20303
e-mail: [email protected]
PRINCIPAL – CHEMICALS
Phone: +91-22-66376756
Mobile: +91 98218 06071
e-mail: [email protected]