32
Petrochemicals
Petrochemicals
Petrochemicals
Perspectives from india px/pta market
19th Sept’14
2
Petrochemicals
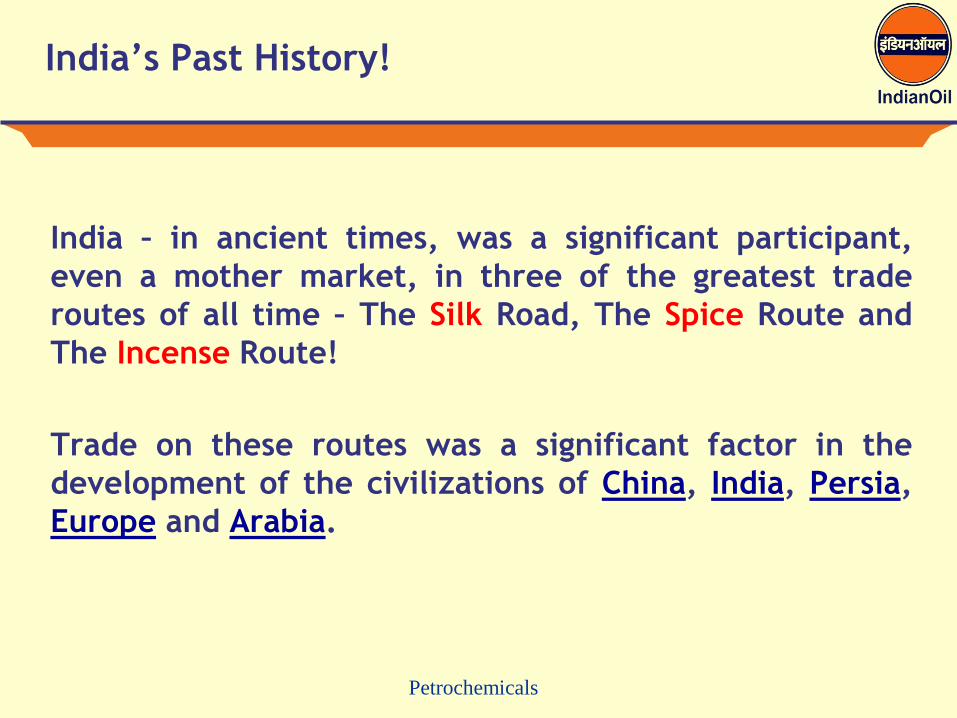
India – in ancient times, was a significant participant,
even a mother market, in three of the greatest trade
routes of all time – The Silk Road, The Spice Route and
The Incense Route!
Trade on these routes was a significant factor in the
development of the civilizations of China, India, Persia,
Europe and Arabia.
India’s Past History!
Petrochemicals
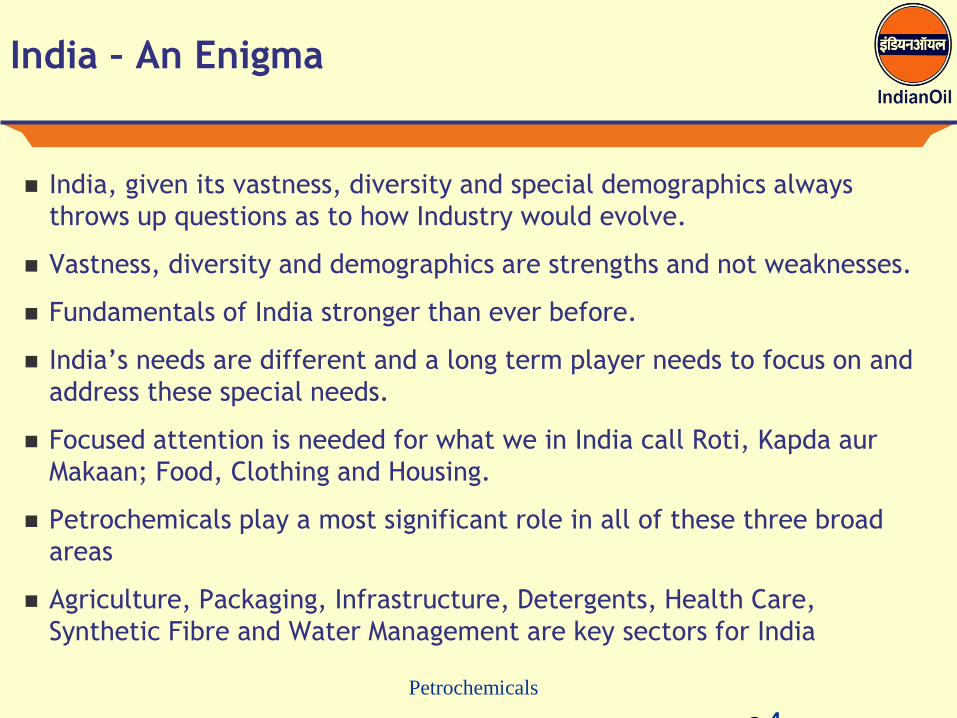
India – An Enigma
India, given its vastness, diversity and special demographics always
throws up questions as to how Industry would evolve.
Vastness, diversity and demographics are strengths and not weaknesses.
Fundamentals of India stronger than ever before.
India’s needs are different and a long term player needs to focus on and
address these special needs.
Focused attention is needed for what we in India call Roti, Kapda aur
Makaan; Food, Clothing and Housing.
Petrochemicals play a most significant role in all of these three broad
areas
Agriculture, Packaging, Infrastructure, Detergents, Health Care,
Synthetic Fibre and Water Management are key sectors for India
4
Petrochemicals
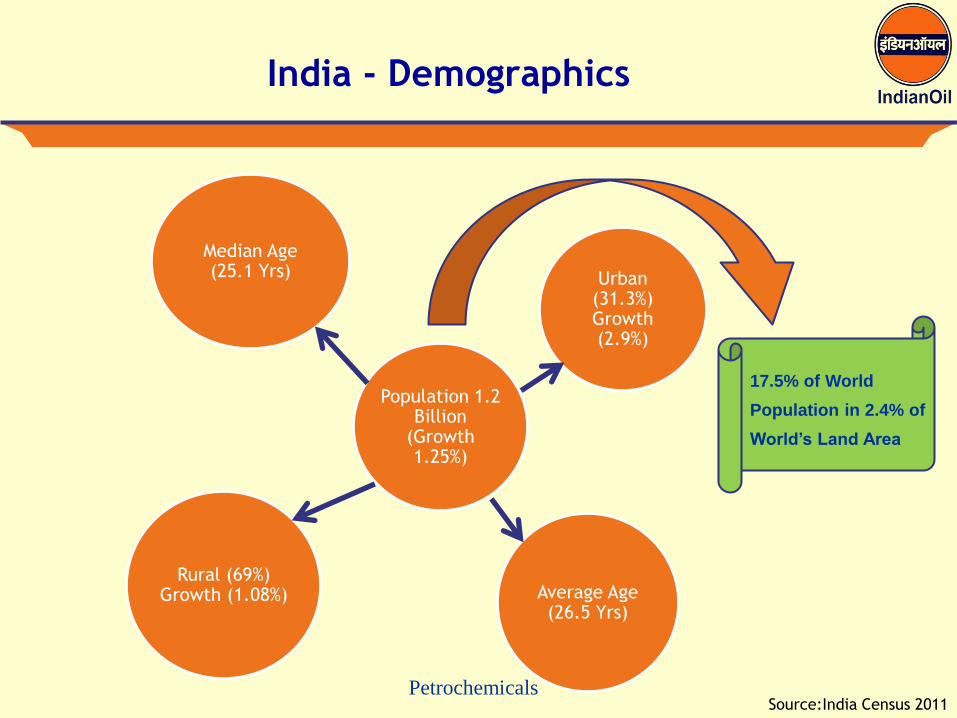
India - Demographics
Source:India Census 2011
17.5% of World
Population in 2.4% of
World’s Land Area
Population 1.2 Billion
(Growth 1.25%)
Average Age (26.5 Yrs)
Urban (31.3%) Growth (2.9%)
Rural (69%) Growth (1.08%)
Median Age (25.1 Yrs)
Petrochemicals
India – Megatrend
Population Growth and Shifting Population Centers.
Population growth in India has stabilized at around 1.25%; urban
growth is almost 3% whereas rural growth is just over 1%.
Increased urbanization demands improvement in – infrastructure;
power, water, roads, buildings and transportation.
Another major trend; producing food remotely and transporting it to
the consumption center – agricultural, packaging and transportation
efficiencies need to be achieved.
Urbanization would lead to other sub-trends – consumerism, health
care and recycling
Urban per-capita consumption of fibres, even at today’s level, is 5
times that of rural consumption.
Petrochemicals
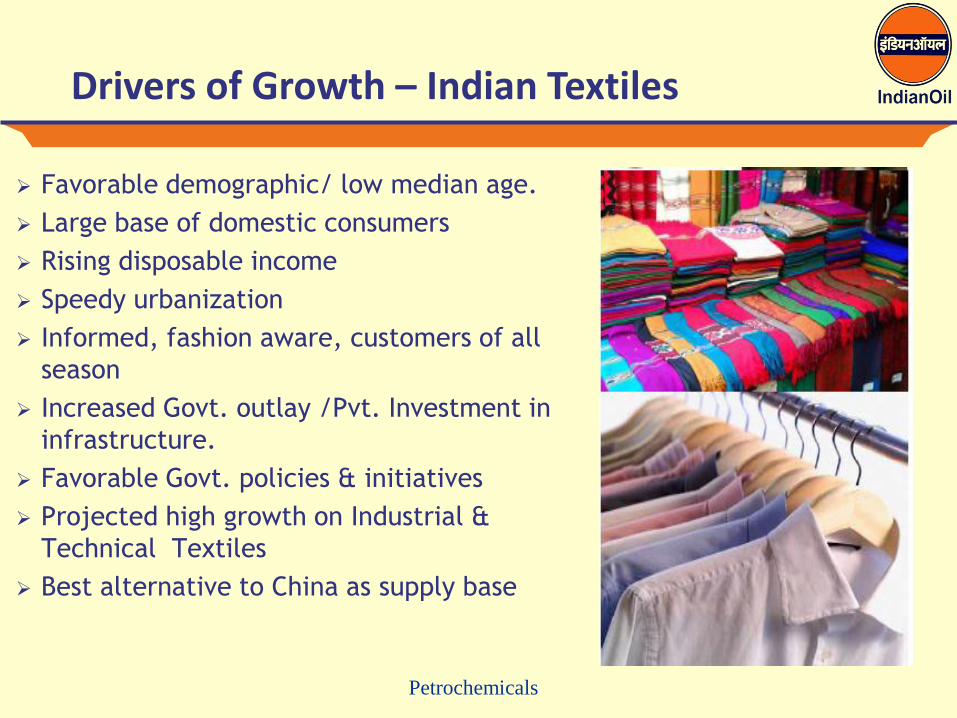
Drivers of Growth – Indian Textiles
Favorable demographic/ low median age.
Large base of domestic consumers
Rising disposable income
Speedy urbanization
Informed, fashion aware, customers of all
season
Increased Govt. outlay /Pvt. Investment in
infrastructure.
Favorable Govt. policies & initiatives
Projected high growth on Industrial &
Technical Textiles
Best alternative to China as supply base
Petrochemicals
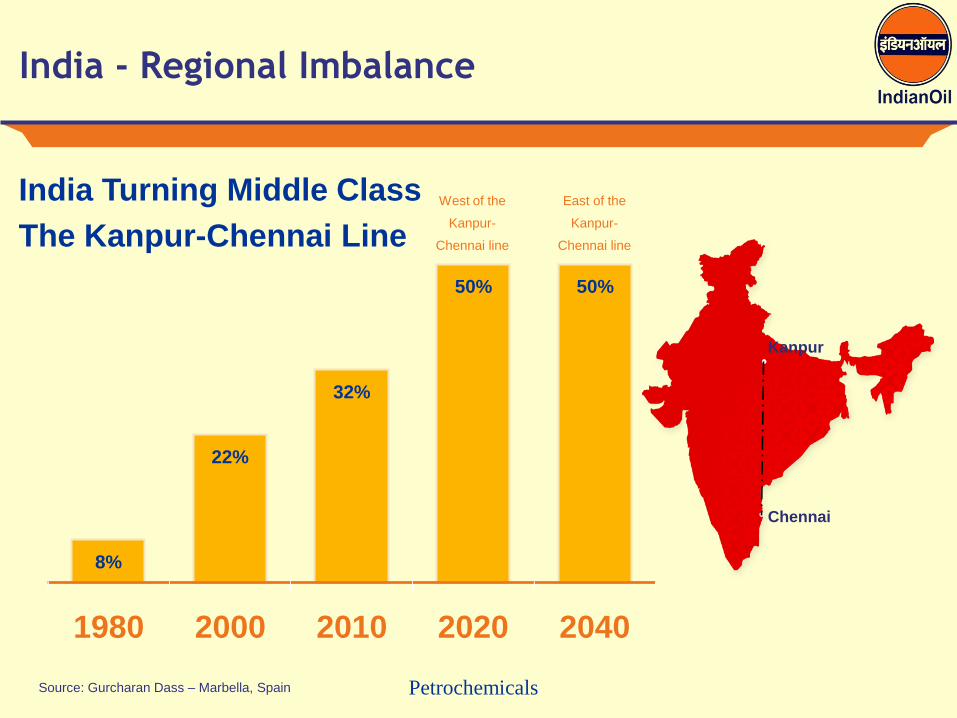
50% 50%
India - Regional Imbalance
8%
22%
32%
1980 2000 2010 2020 2040
West of the
Kanpur-
Chennai line
East of the
Kanpur-
Chennai line
Chennai
Kanpur
Source: Gurcharan Dass – Marbella, Spain
India Turning Middle Class
The Kanpur-Chennai Line
Petrochemicals
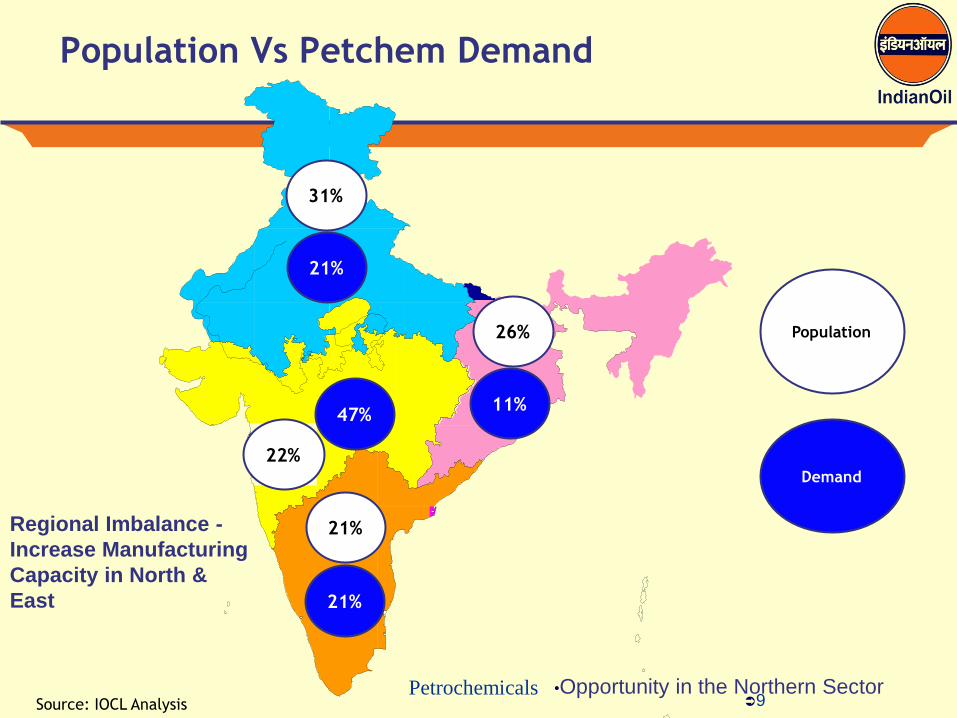
31%
22%
26%
21%
Population Vs Petchem Demand
9 Source: IOCL Analysis
21%
11% 47%
21%
Demand
Population
Regional Imbalance -
Increase Manufacturing
Capacity in North &
East
•Opportunity in the Northern Sector
Petrochemicals
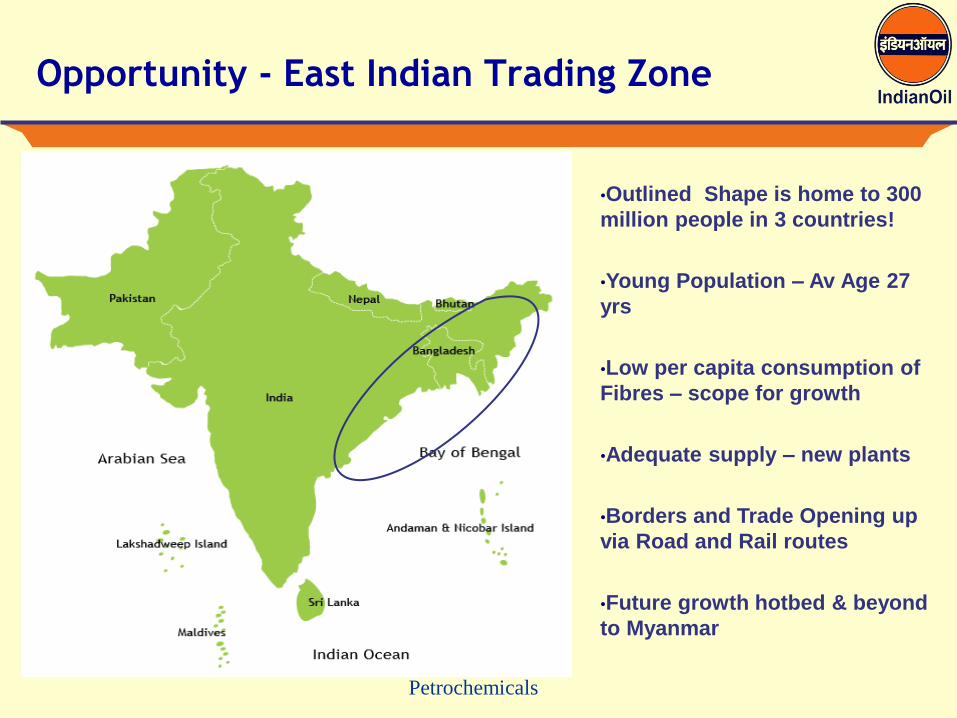
Opportunity - East Indian Trading Zone
•Outlined Shape is home to 300
million people in 3 countries!
•Young Population – Av Age 27
yrs
•Low per capita consumption of
Fibres – scope for growth
•Adequate supply – new plants
•Borders and Trade Opening up
via Road and Rail routes
•Future growth hotbed & beyond
to Myanmar
Petrochemicals
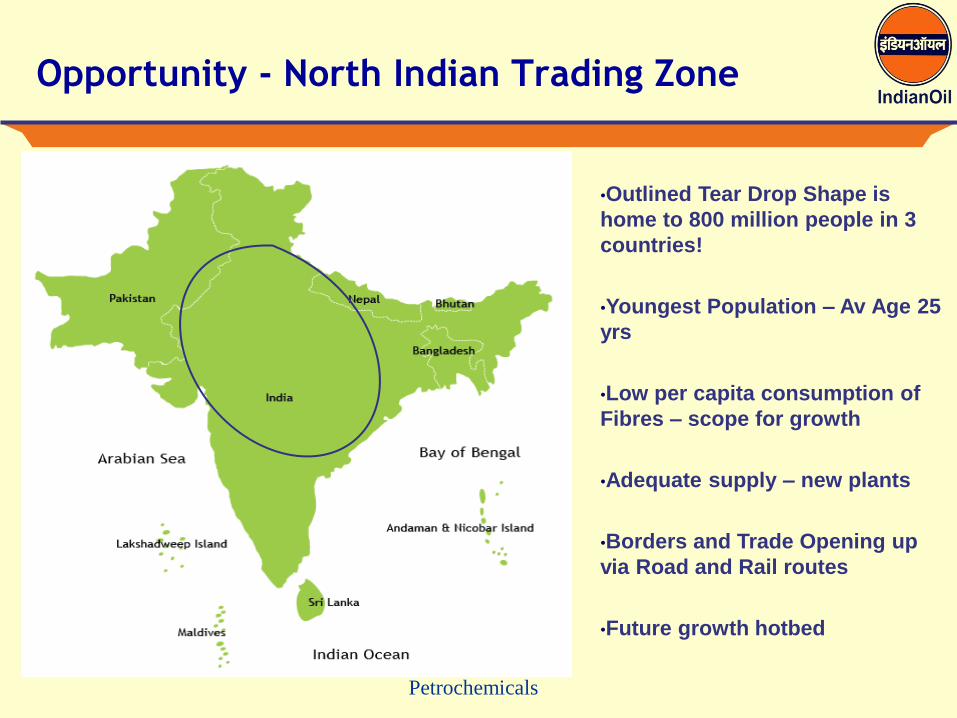
Opportunity - North Indian Trading Zone
•Outlined Tear Drop Shape is
home to 800 million people in 3
countries!
•Youngest Population – Av Age 25
yrs
•Low per capita consumption of
Fibres – scope for growth
•Adequate supply – new plants
•Borders and Trade Opening up
via Road and Rail routes
•Future growth hotbed
Petrochemicals
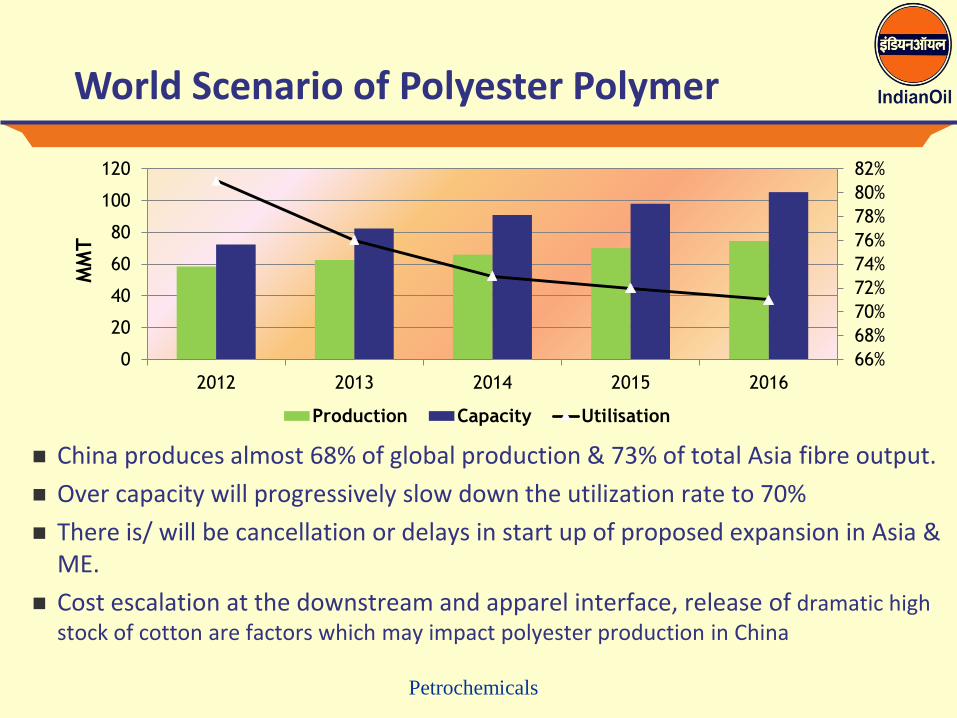
World Scenario of Polyester Polymer
China produces almost 68% of global production & 73% of total Asia fibre output.
Over capacity will progressively slow down the utilization rate to 70%
There is/ will be cancellation or delays in start up of proposed expansion in Asia & ME.
Cost escalation at the downstream and apparel interface, release of dramatic high stock of cotton are factors which may impact polyester production in China
Fig. in TMT
66%
68%
70%
72%
74%
76%
78%
80%
82%
0
20
40
60
80
100
120
2012 2013 2014 2015 2016
MM
T
Production Capacity Utilisation
Petrochemicals
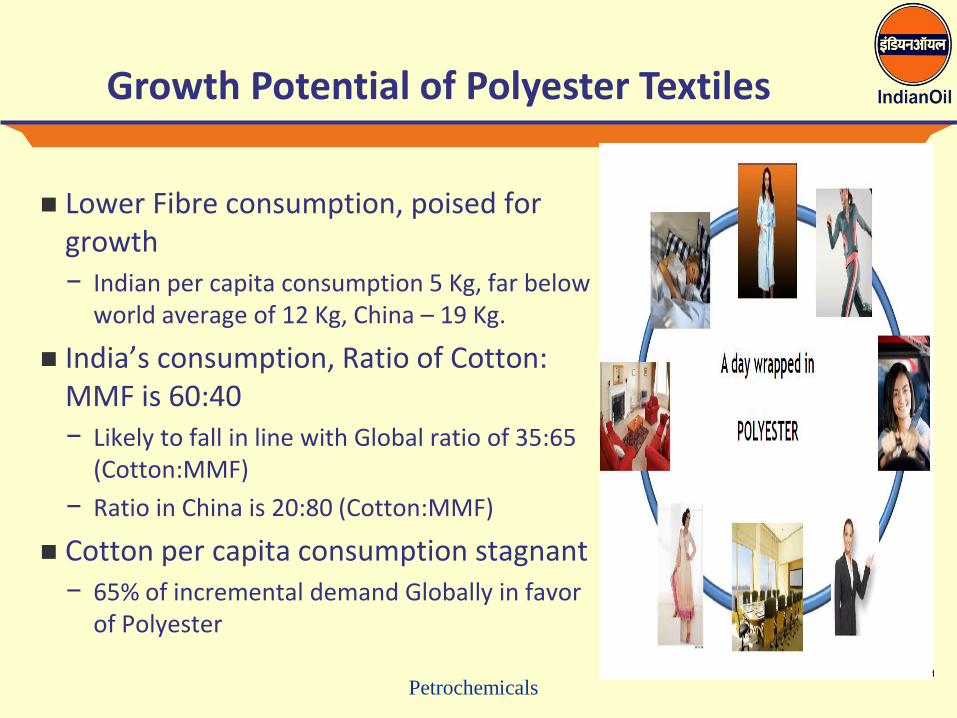
Growth Potential of Polyester Textiles
Lower Fibre consumption, poised for growth − Indian per capita consumption 5 Kg, far below
world average of 12 Kg, China – 19 Kg.
India’s consumption, Ratio of Cotton: MMF is 60:40 − Likely to fall in line with Global ratio of 35:65
(Cotton:MMF)
− Ratio in China is 20:80 (Cotton:MMF)
Cotton per capita consumption stagnant − 65% of incremental demand Globally in favor
of Polyester
Petrochemicals
Cotton production trend of world & China, India, Pakistan reached stagnancy − World 25 to 27 MMTPA
− China, India, Pakistan – 15 to 16 MMTPA
Cotton price volatility & upward swings globally in favor of Polyesters
Polyester, the most economical fibres for textile industry.
Growing presence of Global Brand & Pvt. Label − Preference of fibre mix in favor of Polyesters
Per capita consumption of PET in India
− 0.55 Kg against world avg. of 2.67 Kg growing rapidly.
Growth Potential of Polyester Textiles…cont/-
Petrochemicals
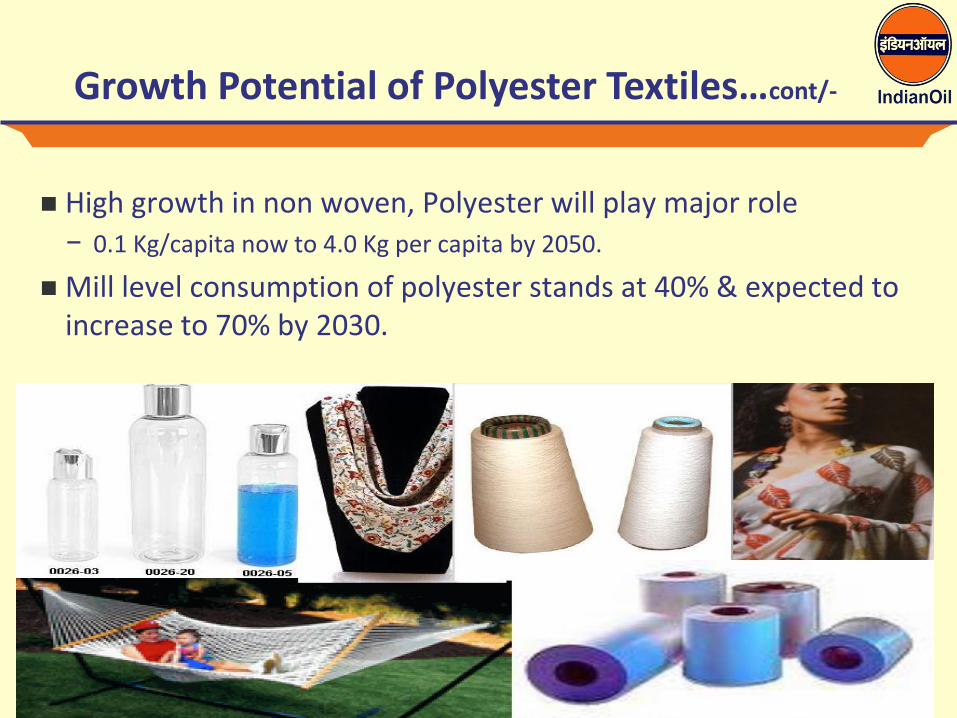
Growth Potential of Polyester Textiles…cont/-
High growth in non woven, Polyester will play major role − 0.1 Kg/capita now to 4.0 Kg per capita by 2050.
Mill level consumption of polyester stands at 40% & expected to increase to 70% by 2030.
Petrochemicals
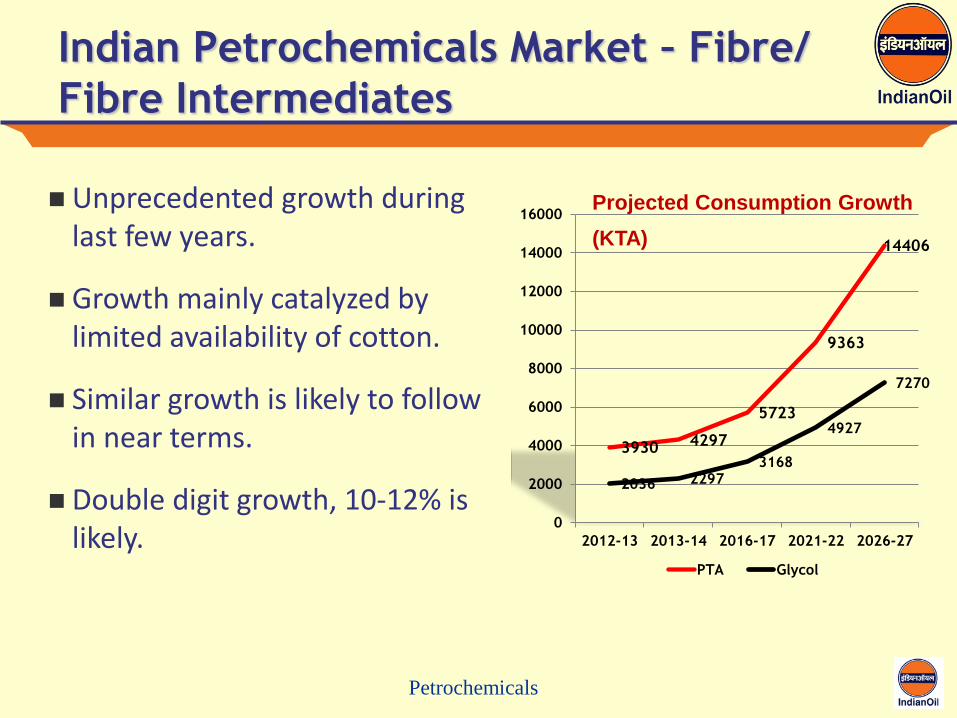
Indian Petrochemicals Market – Fibre/
Fibre Intermediates
Unprecedented growth during last few years.
Growth mainly catalyzed by limited availability of cotton.
Similar growth is likely to follow in near terms.
Double digit growth, 10-12% is likely.
3930 4297
5723
9363
14406
2036 2297 3168
4927
7270
0
2000
4000
6000
8000
10000
12000
14000
16000
2012-13 2013-14 2016-17 2021-22 2026-27
PTA Glycol
Projected Consumption Growth
(KTA)
Petrochemicals
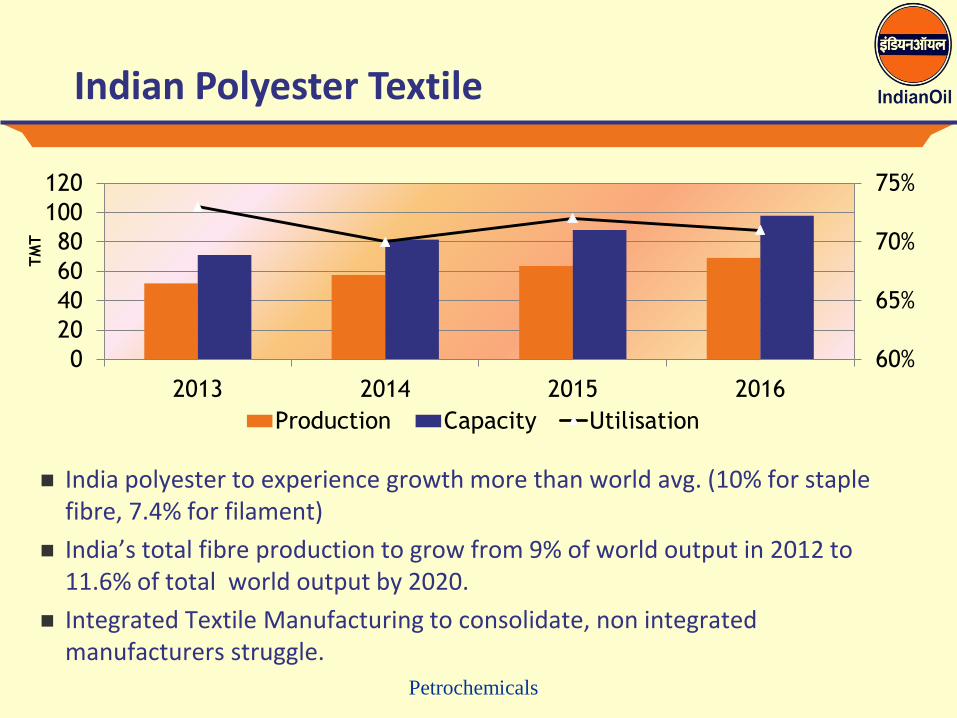
Indian Polyester Textile
India polyester to experience growth more than world avg. (10% for staple fibre, 7.4% for filament)
India’s total fibre production to grow from 9% of world output in 2012 to 11.6% of total world output by 2020.
Integrated Textile Manufacturing to consolidate, non integrated manufacturers struggle.
60%
65%
70%
75%
0
20
40
60
80
100
120
2013 2014 2015 2016
TM
T
Production Capacity Utilisation
Petrochemicals
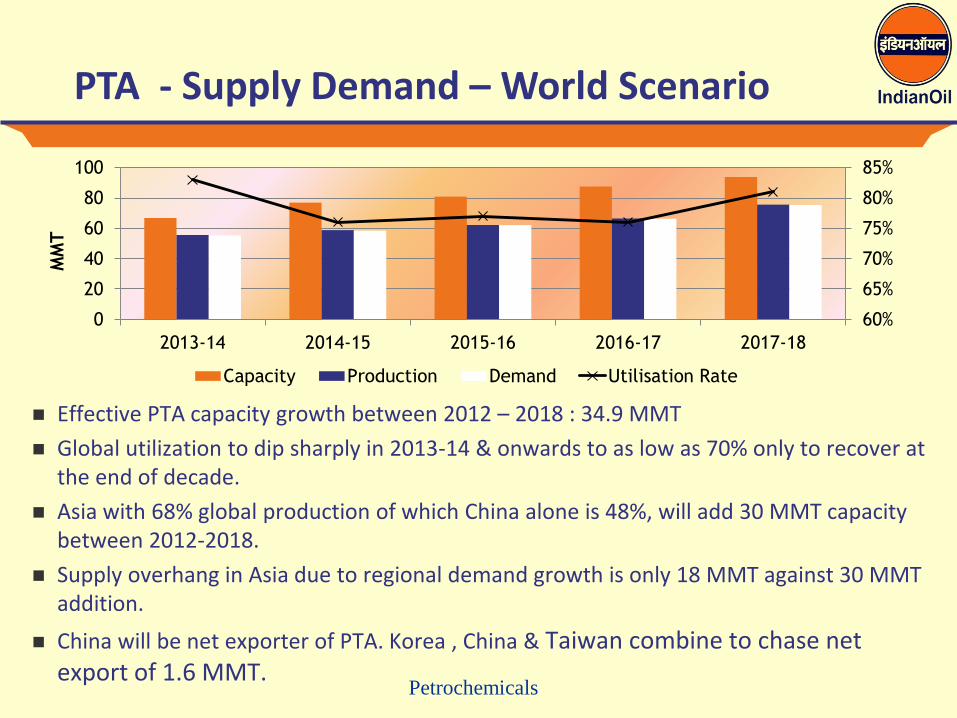
PTA - Supply Demand – World Scenario
Effective PTA capacity growth between 2012 – 2018 : 34.9 MMT
Global utilization to dip sharply in 2013-14 & onwards to as low as 70% only to recover at the end of decade.
Asia with 68% global production of which China alone is 48%, will add 30 MMT capacity between 2012-2018.
Supply overhang in Asia due to regional demand growth is only 18 MMT against 30 MMT addition.
China will be net exporter of PTA. Korea , China & Taiwan combine to chase net export of 1.6 MMT.
60%
65%
70%
75%
80%
85%
0
20
40
60
80
100
2013-14 2014-15 2015-16 2016-17 2017-18
MM
T
Capacity Production Demand Utilisation Rate
Petrochemicals
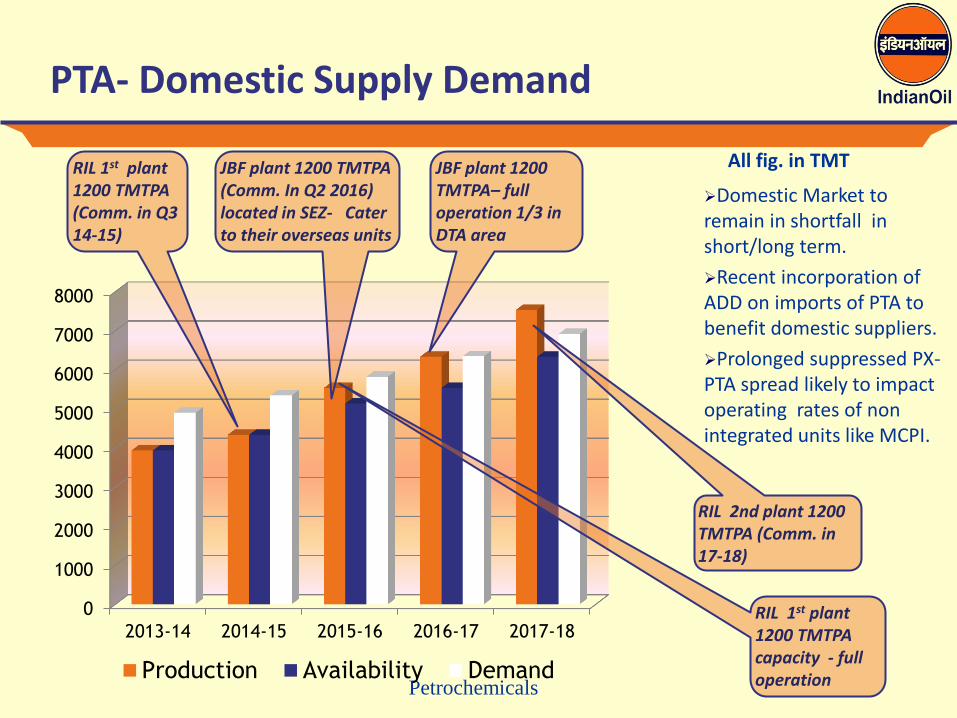
PTA- Domestic Supply Demand
Domestic Market to remain in shortfall in short/long term.
Recent incorporation of ADD on imports of PTA to benefit domestic suppliers.
Prolonged suppressed PX-PTA spread likely to impact operating rates of non integrated units like MCPI.
All fig. in TMT
0
1000
2000
3000
4000
5000
6000
7000
8000
2013-14 2014-15 2015-16 2016-17 2017-18
Production Availability Demand
RIL 1st plant 1200 TMTPA (Comm. in Q3 14-15)
JBF plant 1200 TMTPA– full operation 1/3 in DTA area
RIL 2nd plant 1200 TMTPA (Comm. in 17-18)
RIL 1st plant 1200 TMTPA capacity - full operation
JBF plant 1200 TMTPA (Comm. In Q2 2016) located in SEZ- Cater to their overseas units
Petrochemicals
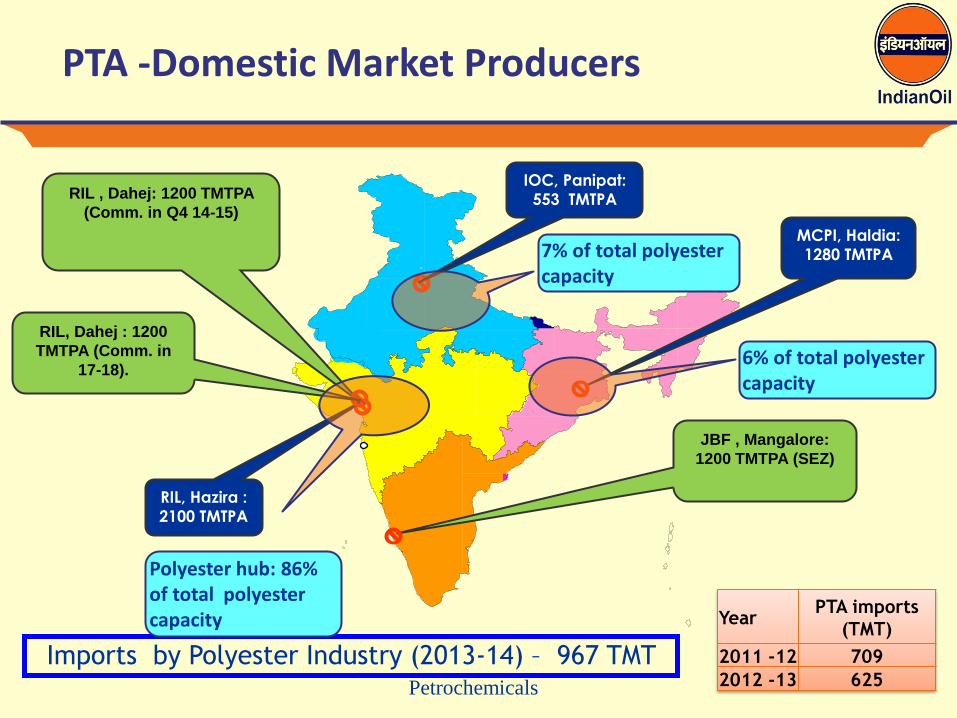
MCPI, Haldia:
1280 TMTPA
IOC, Panipat:
553 TMTPA
RIL, Hazira :
2100 TMTPA
PTA -Domestic Market Producers
Imports by Polyester Industry (2013-14) – 967 TMT
RIL , Dahej: 1200 TMTPA
(Comm. in Q4 14-15)
RIL, Dahej : 1200
TMTPA (Comm. in
17-18).
JBF , Mangalore:
1200 TMTPA (SEZ)
Polyester hub: 86% of total polyester capacity
6% of total polyester capacity
7% of total polyester capacity
Year PTA imports
(TMT)
2011 -12 709
2012 -13 625
Petrochemicals
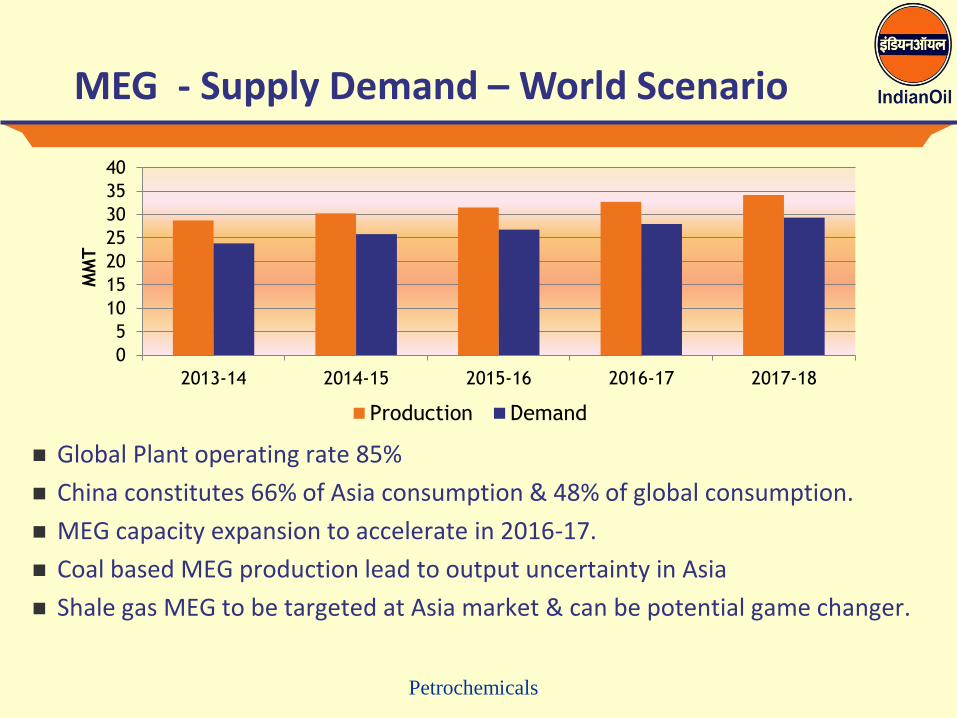
MEG - Supply Demand – World Scenario
Global Plant operating rate 85%
China constitutes 66% of Asia consumption & 48% of global consumption.
MEG capacity expansion to accelerate in 2016-17.
Coal based MEG production lead to output uncertainty in Asia
Shale gas MEG to be targeted at Asia market & can be potential game changer.
0
5
10
15
20
25
30
35
40
2013-14 2014-15 2015-16 2016-17 2017-18
MM
T
Production Demand
Petrochemicals
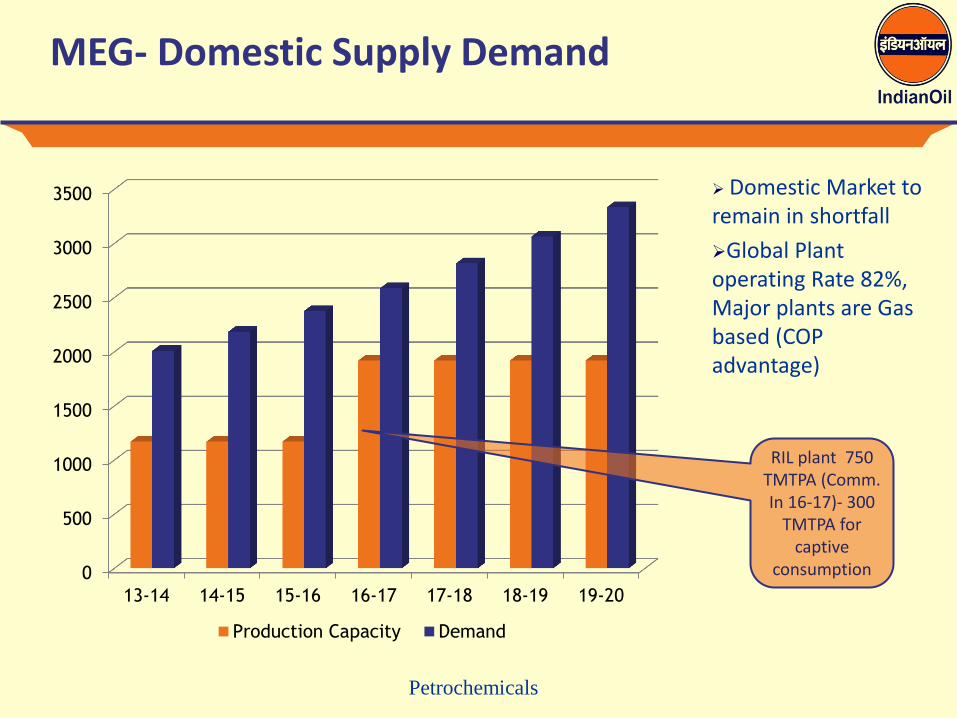
MEG- Domestic Supply Demand
Domestic Market to remain in shortfall
Global Plant operating Rate 82%, Major plants are Gas based (COP advantage)
0
500
1000
1500
2000
2500
3000
3500
13-14 14-15 15-16 16-17 17-18 18-19 19-20
Production Capacity Demand
RIL plant 750 TMTPA (Comm. In 16-17)- 300
TMTPA for captive
consumption
Petrochemicals
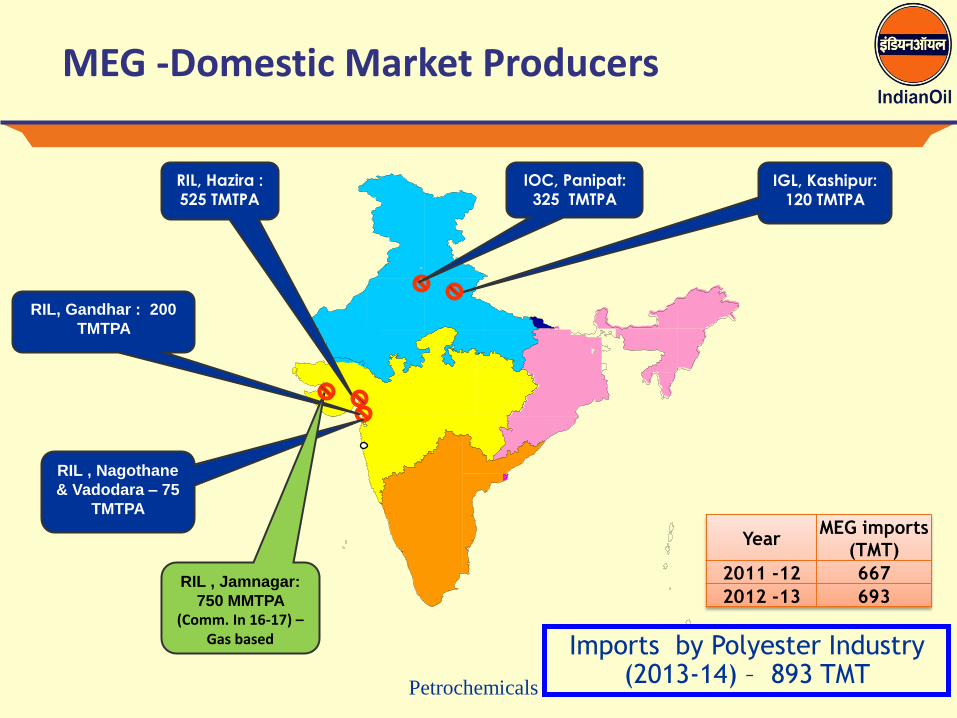
IGL, Kashipur:
120 TMTPA
IOC, Panipat:
325 TMTPA RIL, Hazira :
525 TMTPA
MEG -Domestic Market Producers
Imports by Polyester Industry (2013-14) – 893 TMT
RIL , Nagothane
& Vadodara – 75
TMTPA
RIL, Gandhar : 200
TMTPA
RIL , Jamnagar:
750 MMTPA (Comm. In 16-17) –
Gas based
Year MEG imports
(TMT)
2011 -12 667
2012 -13 693
Petrochemicals
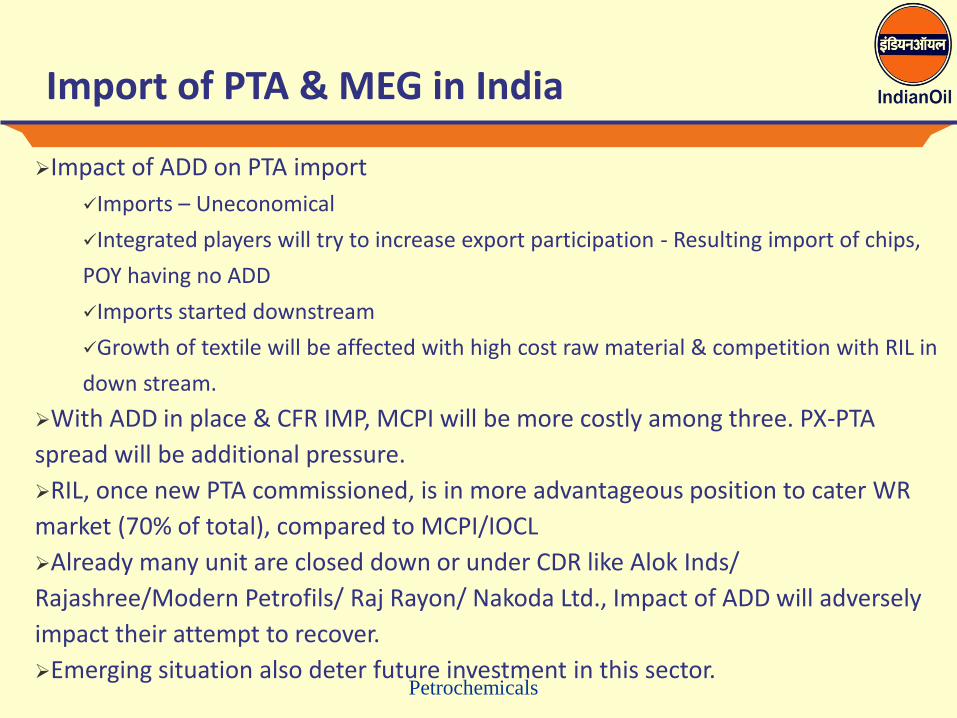
Import of PTA & MEG in India
Impact of ADD on PTA import
Imports – Uneconomical
Integrated players will try to increase export participation - Resulting import of chips,
POY having no ADD
Imports started downstream
Growth of textile will be affected with high cost raw material & competition with RIL in
down stream.
With ADD in place & CFR IMP, MCPI will be more costly among three. PX-PTA
spread will be additional pressure.
RIL, once new PTA commissioned, is in more advantageous position to cater WR
market (70% of total), compared to MCPI/IOCL
Already many unit are closed down or under CDR like Alok Inds/
Rajashree/Modern Petrofils/ Raj Rayon/ Nakoda Ltd., Impact of ADD will adversely
impact their attempt to recover.
Emerging situation also deter future investment in this sector.
Petrochemicals
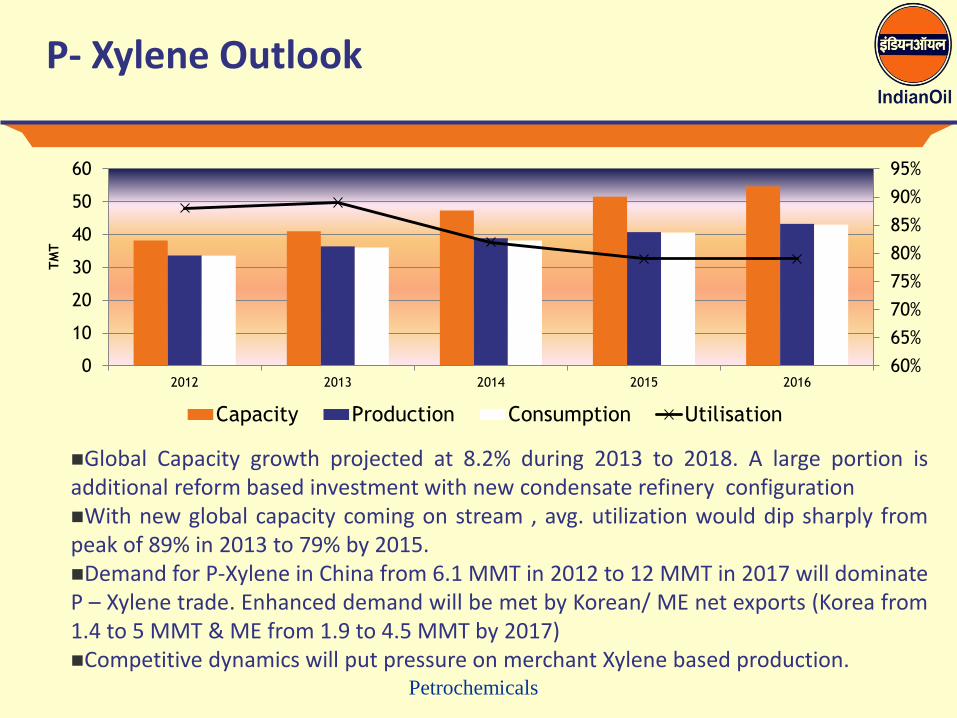
P- Xylene Outlook
Global Capacity growth projected at 8.2% during 2013 to 2018. A large portion is additional reform based investment with new condensate refinery configuration With new global capacity coming on stream , avg. utilization would dip sharply from peak of 89% in 2013 to 79% by 2015. Demand for P-Xylene in China from 6.1 MMT in 2012 to 12 MMT in 2017 will dominate P – Xylene trade. Enhanced demand will be met by Korean/ ME net exports (Korea from 1.4 to 5 MMT & ME from 1.9 to 4.5 MMT by 2017) Competitive dynamics will put pressure on merchant Xylene based production.
60%
65%
70%
75%
80%
85%
90%
95%
0
10
20
30
40
50
60
2012 2013 2014 2015 2016
TM
T
Capacity Production Consumption Utilisation
Petrochemicals
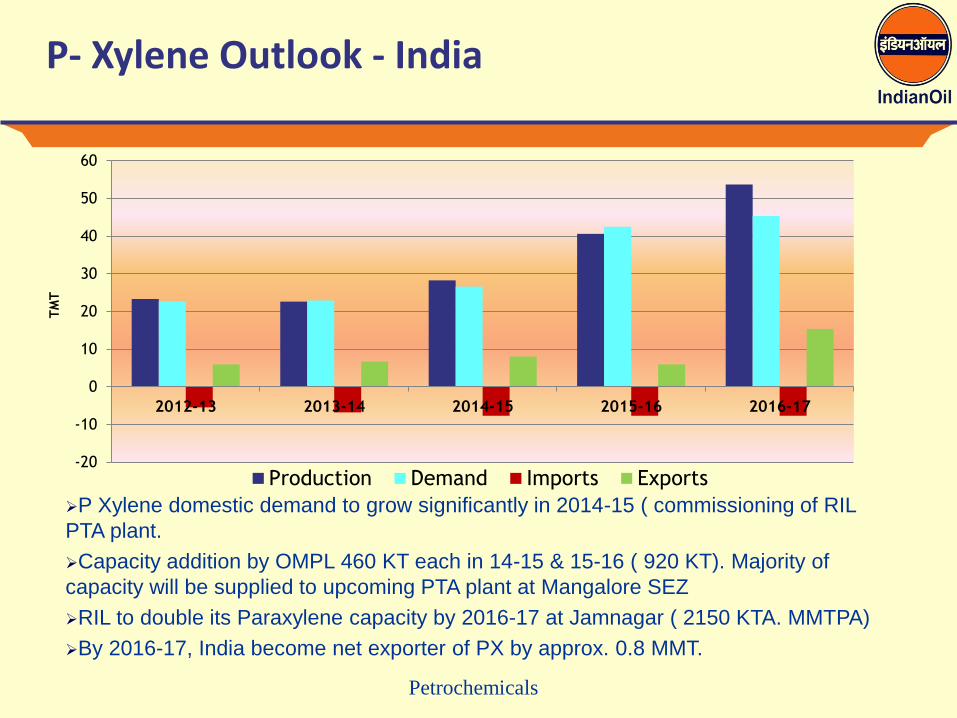
P- Xylene Outlook - India
-20
-10
0
10
20
30
40
50
60
2012-13 2013-14 2014-15 2015-16 2016-17
TM
T
Production Demand Imports Exports
P Xylene domestic demand to grow significantly in 2014-15 ( commissioning of RIL
PTA plant.
Capacity addition by OMPL 460 KT each in 14-15 & 15-16 ( 920 KT). Majority of
capacity will be supplied to upcoming PTA plant at Mangalore SEZ
RIL to double its Paraxylene capacity by 2016-17 at Jamnagar ( 2150 KTA. MMTPA)
By 2016-17, India become net exporter of PX by approx. 0.8 MMT.
Petrochemicals
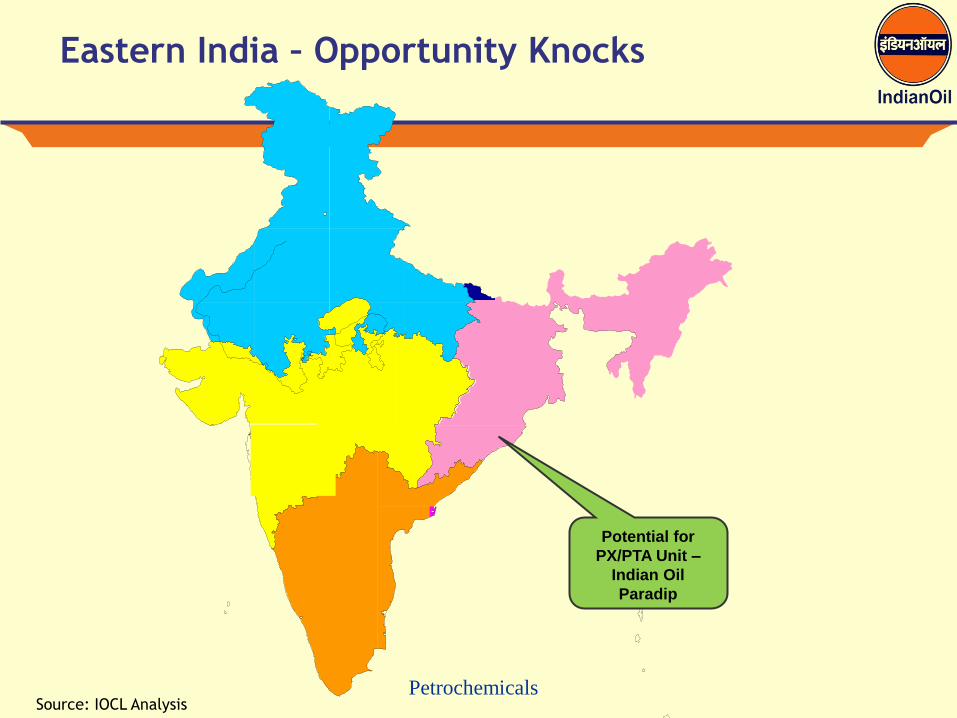
Eastern India – Opportunity Knocks
Source: IOCL Analysis
Potential for
PX/PTA Unit –
Indian Oil
Paradip

Petrochemicals
Spread Data (Naphtha/PX/PTA/MEG)
USD/MT
For FY 11-12, FY 12-13 & FY 13-14 – PTA quotes is CFR China
For Apr –July’14 – PTA quotes is CFR India
-50
0
50
100
150
200
250
300
350
400
Avg (11-12)Avg (12-13)Avg (13-14) Apr-14 May-14 Jun-14 Jul-14 Aug-14
Naphtha-PTA Spread Naphtha - PX spread
PX-PTA Spread MEG -Naphtha Spread
Petrochemicals
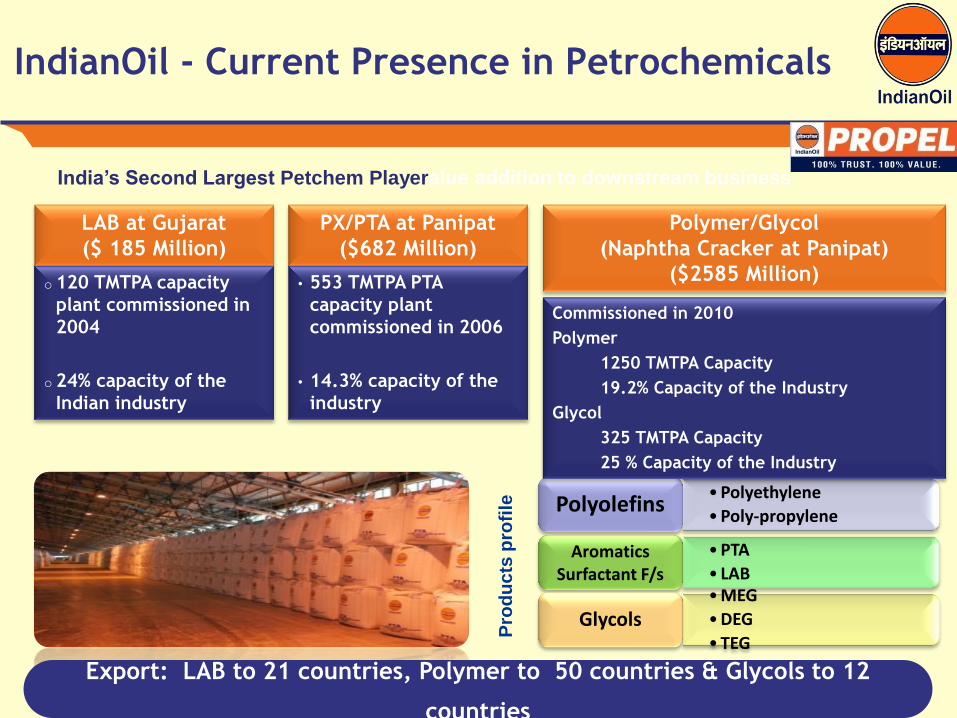
IndianOil - Current Presence in Petrochemicals
India’s Second Largest Petchem Playeralue addition to downstream business
• Polyethylene
• Poly-propylene Polyolefins
• PTA
• LAB Aromatics
Surfactant F/s • MEG
• DEG
• TEG Glycols
Pro
du
cts
pro
file
LAB at Gujarat
($ 185 Million)
o 120 TMTPA capacity
plant commissioned in
2004
o 24% capacity of the
Indian industry
PX/PTA at Panipat
($682 Million)
• 553 TMTPA PTA
capacity plant
commissioned in 2006
• 14.3% capacity of the
industry
Polymer/Glycol
(Naphtha Cracker at Panipat)
($2585 Million)
Commissioned in 2010
Polymer
1250 TMTPA Capacity
19.2% Capacity of the Industry
Glycol
325 TMTPA Capacity
25 % Capacity of the Industry
Export: LAB to 21 countries, Polymer to 50 countries & Glycols to 12
countries
Petrochemicals
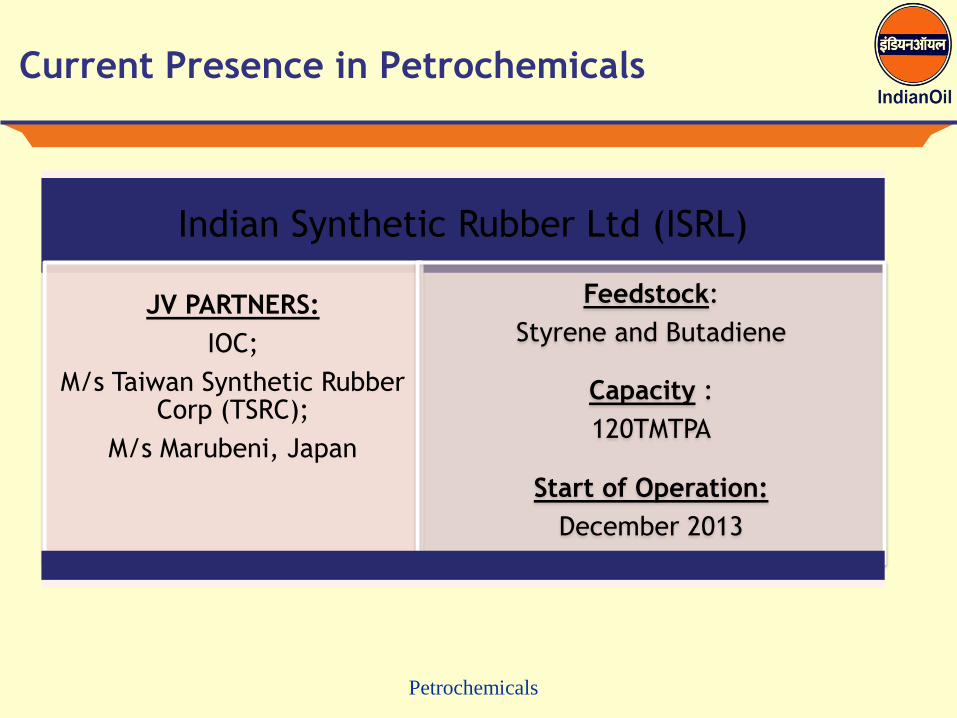
Current Presence in Petrochemicals
Indian Synthetic Rubber Ltd (ISRL)
JV PARTNERS:
IOC;
M/s Taiwan Synthetic Rubber Corp (TSRC);
M/s Marubeni, Japan
Feedstock:
Styrene and Butadiene
Capacity :
120TMTPA
Start of Operation:
December 2013
Petrochemicals 31
Initiatives Planned for Future Growth
DEVELOPMENT OF PCPIRs (PETROLEUM, CHEMICALS &
PETROCHEMICALS INVESTMENT REGIONS)
• PCPIR approved at Paradip with IndianOil as Anchor tenant
• IndianOil to set up Polypropylene Unit & Ethylene derivative
Complex based on propylene & ethylene availability from
Refinery FCC
• Accelerated development of downstream petrochemical industry
for polymer processing like packaging, fibre & filament,
automotive, health care & personal care
• Creation of employment opportunities
• Impetus to petrochemical demand growth in Eastern India
where petrochemical consumption is the lowest.
Petrochemicals
C S Shankar
General Manager (Petrochemicals Marketing)
IndianOIl Corporation Ltd


