PETROFACIES AND PALEOTECTONIC EVOLUTION OF GONDWANAN AND POST-GONDWANAN SEQUENCES OF NEPAL Except where reference is made to the work of others, the work described in this thesis is my own or was done in collaboration with my advisory committee. This thesis does notinclude proprietary or classified information. _____________________________________ Raju Prasad Sitaula Certificate of Approval: _____________________ _____________________ Charles E. Savrda Ashraf Uddin, Chair Professor Associate Professor Geology and Geography Geology and Geography _____________________ _____________________ Willis E. Hames George T. Flowers Professor Dean Geology and Geography Graduate School
Transcript
PETROFACIES AND PALEOTECTONIC EVOLUTION OF GONDWANAN AND
POST-GONDWANAN SEQUENCES OF NEPAL
Except where reference is made to the work of others, the work described in this thesis is my own or was done in collaboration with my advisory committee.
This thesis does notinclude proprietary or classified information.
Certificate of Approval: _____________________ _____________________ Charles E. Savrda Ashraf Uddin, Chair Professor Associate Professor Geology and Geography Geology and Geography _____________________ _____________________ Willis E. Hames George T. Flowers Professor Dean Geology and Geography Graduate School
PETROFACIES AND PALEOTECTONIC EVOLUTION OFGONDWANAN AND
POST-GONDWANAN SEQUENCES OF NEPAL
Raju Prasad Sitaula
A Thesis
Submitted to
the Graduate Faculty of
Auburn University
in Partial Fulfillment of the
Requirement for the
Degree of
Master of Science
Auburn, Alabama
Auburn, Alabama December 18, 2009
iii
PETROFACIES AND PALEOTECTONIC EVOLUTION OF GONDWANAN AND
POST-GONDWANAN SEQUENCES OF NEPAL
Raju Prasad Sitaula
Permission is granted to Auburn University to make copies of this thesis at its discretion,
upon the request of individuals or institutions and at their expense. The author reserves all publication rights.
_____________________________
Raju Prasad Sitaula
___________________________
Date of Graduation
iv
VITA
Raju Prasad Sitaula, son of Mr. Murari Prasad Sitaula and Mrs. Renuka Devi
Sharma Sitaula, was born in 1979 in Bhadrutar, Nuwakot. He passed his school Leaving
Certificate Examination in 1996 from Adarsha Yog Hari Madhyamik Vidhyalaya. He
passed the Proficiency Certificate Level Examination in 1998 from Amrit Science
College. He received his Bachelor of Science and Master of Science degrees in Geology
in 2002 and 2005, respectively, from Tri-Chandra Multiple Campus and Tribhuvan
University in Nepal. He entered the graduate school at Auburn University to pursue his
second Masters degree from the Department of Geology and Geography in Fall 2007.
v
THESIS ABSTRACT
PETROFACIES AND PALEOTECTONIC EVOLUTION OF GONDWANAN AND
POST-GONDWANAN SEQUENCES OF NEPAL
Raju Prasad Sitaula
Master of Science, December 18, 2009 (Bachelor of Science, Trichandra College, Nepal, 2004) (Master of Science, Tribhuvan University, Nepal, 2005)
206 Typed Pages
Directed by Ashraf Uddin
The Gondwanan sequences are widely distributed in several intracratonic basins
of peninsular India and also as discontinuous patches along the Himalayan orogenic belt.
The Tansen Group (2400 m) in western Nepal is thicker and more complete than the
Katari (380 m) and the Barahachettra (350 m) groups located in eastern Nepal.
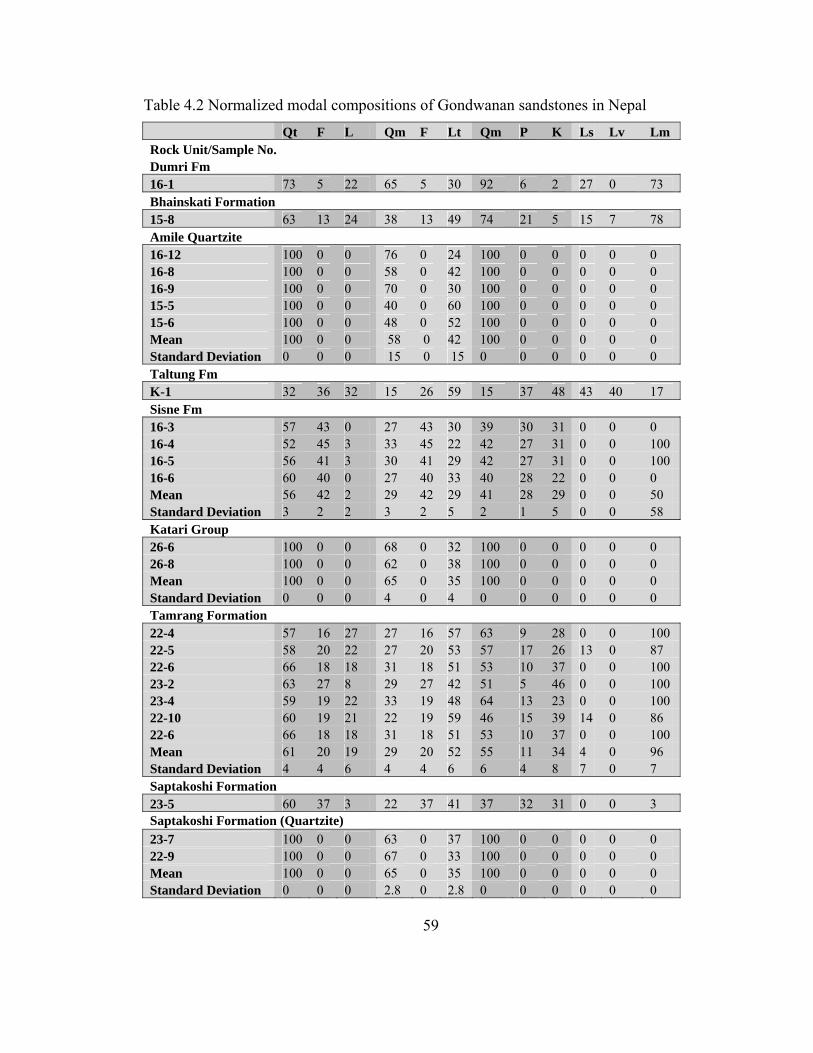
In the Tansen Group, modal compositions of sandstone change from arkosic
(Permo-Carboniferous unit) to quartz arenitic and then to litharenitic (Eocene-Early
Miocene). Similar modal compositions are also present only in alleged Permo-
Carboniferous units Katari and Barahachettra groups of eastern Nepal. The
quartzofeldspathic sandstones of the Permo-Carboniferous Sisne (western Nepal) and
Saptakoshi (eastern Nepal) formations show high Eu values. The Quartzite unit of the
Saptakoshi Formation seems similar to the Amile Formation of western Nepal as both
contain higher percentages of mature quartz and stable heavy minerals, and show similar
vi
REE patterns. High contents of lithic fragments with relatively rare feldspars indicate that
the Tamrang sandstones were deposited in the juvenile foreland basin between India and
Tibet like the Eocene Bhainskati Formation of western Nepal.
Garnet chemistry suggests sediment supply from variously graded metamorphic
rocks. Tourmaline chemistry indicates sediments derivation from both lithium-high and
lithium-low igneous rocks. Chrome-spinels with low TiO2 contents in the Taltung
Formation show evidence of provenance from alkaline basalts.
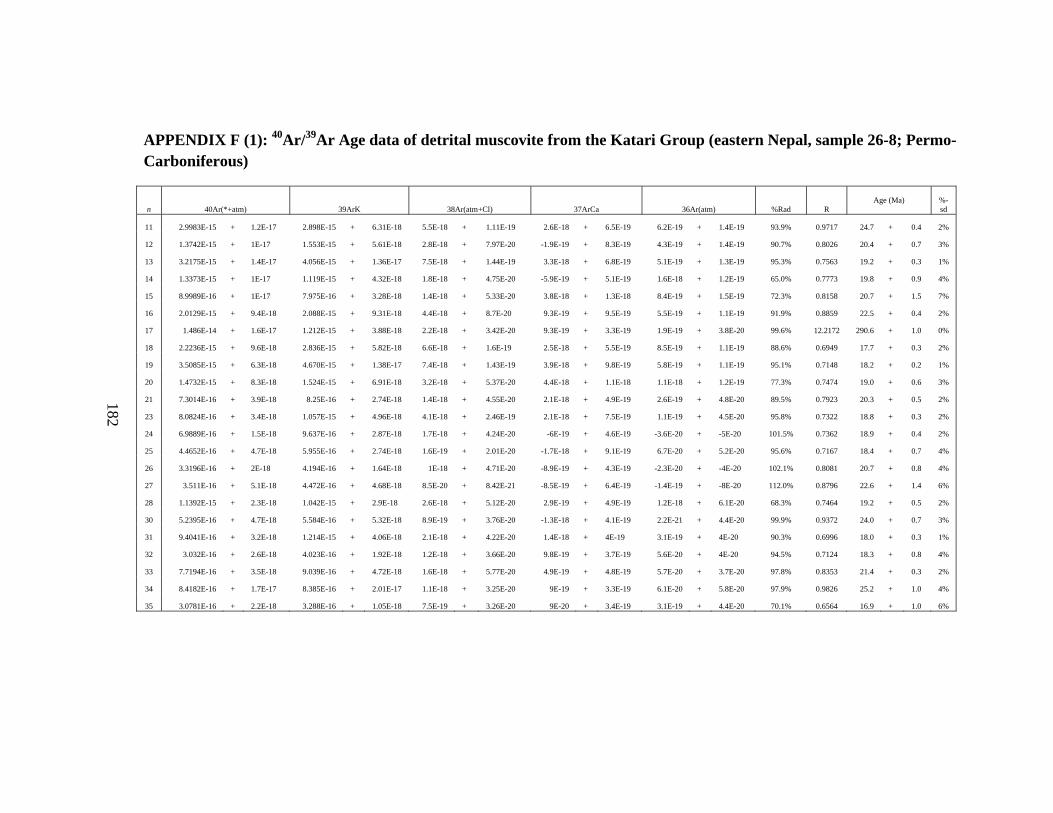
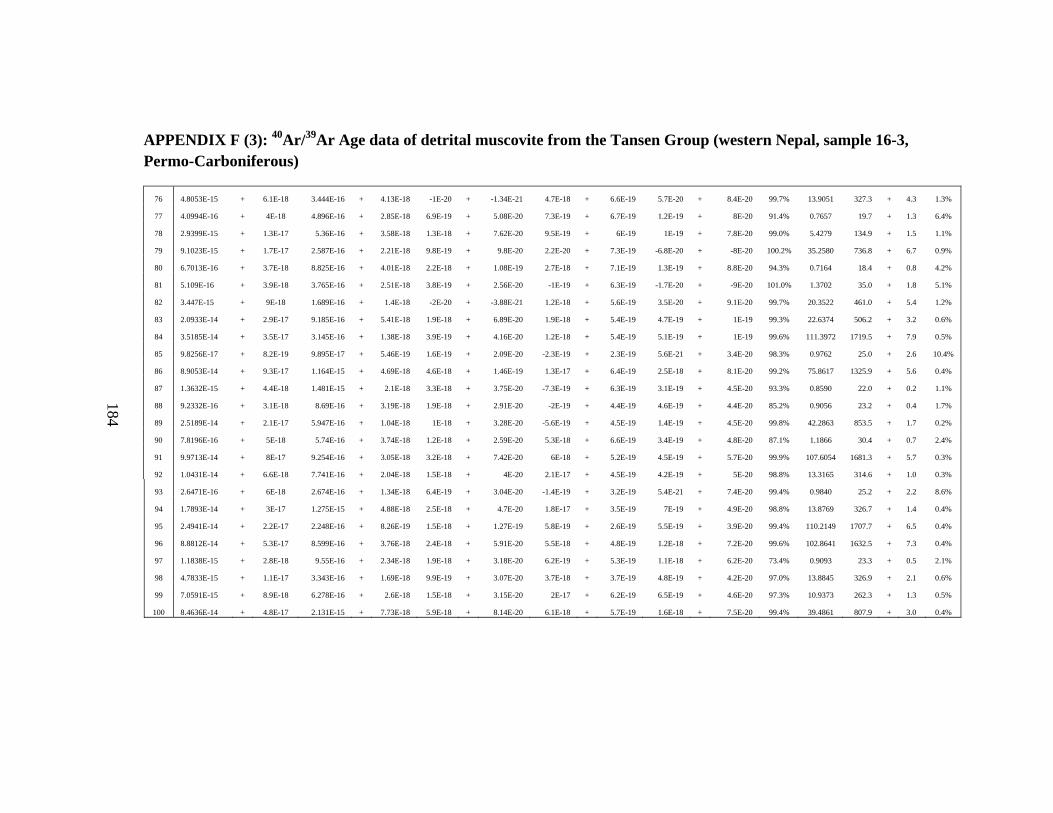
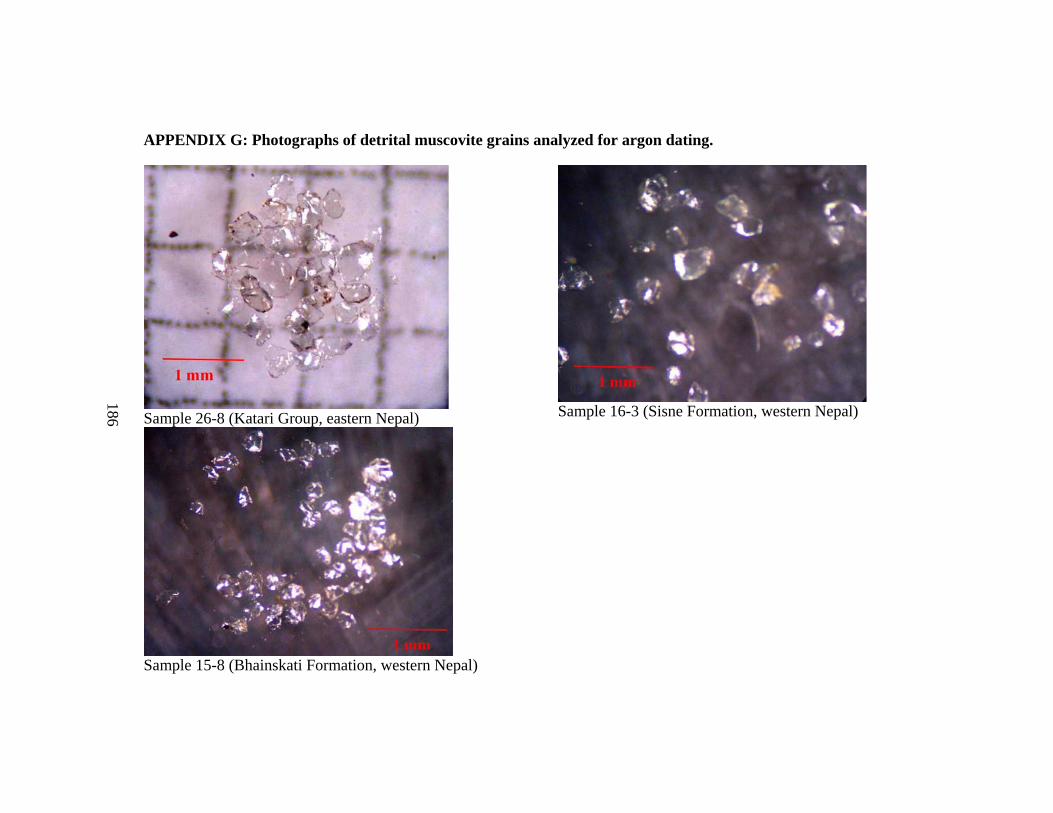
Cooling ages of detrital muscovites from the Permo-Carboniferous units of all
three study sections show some older ages (300 Ma to 1700 Ma) and few younger (17 Ma
to 25 Ma) ages. The older ages could be related to the magmatism in the Indian craton
muscovites from the Bhainskati Formation suggest a Himalayan orogenic source.
Relatively younger ages, however, could indicate about the possible argon loss from the
muscovite or misinterpretation of the stratigraphy.
This study suggests that the stratigraphy of the Gondwana sequences in eastern
Nepal needs to be re-evaluated. The existing quartzite unit of supposedly Permo-
Carboniferous Saptakoshi Formation (eastern Nepal) should belong to Late Cretaceous,
equivalent to the Amile Formation of western Nepal. The Tamrang Formation (eastern
Nepal), which is currently considered as Permo-Carboniferous to Cretaceous, could be an
equivalent unit of the Eocene Bhainskati Formation of western Nepal.
vii
ACKNOWLEDGEMENTS
I would like to express my thanks and gratitude to my dear teacher Dr. Ashraf
Uddin for bringing me to Auburn University and giving me the chance to get a Master’s
degree in Geology. Dr. Uddin helped me not only as the principal advisor but also as a
real guardian to get the best outcome of this research.
I would like to express my sincere thanks to Dr. Charles Savrda, who helped with
significant editing in this thesis. It would have been difficult to get this research work
done without Dr. Savrda. I also would like to thank Dr. Willis Hames for help with the
geochronology part of this research.
I also acknowledge Mr. Chris Fleisher of University of Georgia for help during
microprobe analysis. I thank Dr. Bishal Nath Upreti and Dr. Megh Raj Dhital for
continuously guiding me through my research, supporting my fieldwork, and reviewing
my thesis work. I want to thank my colleagues Pawan Budhathoki, Ashok Sigdel, and
Biraj Gautam for their immense help in my fieldwork. I also want to pay my sincere
thanks to Mr. Suryalal Shrestha who provided lodging support at Masyam, Palpa, during
my fieldwork at the Tansen section. I am truly grateful to my colleagues at Auburn
University, Subhadip Mandal and Shahadat Hossain, for their significant support
throughout the development of thesis work, for literature review, lab work, data analysis
viii
and computer work. I am thankful for Subhadip not only for his support but also for the
support I got from him while sharing an apartment.
I am very grateful to Eva Lilly and Sheila Arington for their kind support
throughout my study with all administrative work. John Simms always helped to solve
the computer hardware problems I got during my work in the department. I also like to
thank Dr. Zeki Billor for his moral support and proper guidance for muscovite separation.
I also want to pay my sincere thanks to my seniors Prakash Dhakal and
Mohammad Wahidur Rahman for their guidance. Prakash was the one who helped me to
adjust with educational system and social life in United States. I am also grateful to
Bibek Upreti for his support in my thesis work as well as in my daily life. It was Bibek
who broke most of my sandstones samples which were very hard.
This research was funded by the U.S National Science Foundation (NSF-EAR-
0310306), Geological Society of America, and the Department of Geology and
Geography of Auburn University.
I want to thank my parents who gave me the opportunity to see this wonderful
world and supported me in every step of my life. I would like to thank my brother and
sisters for their love and support.
ix
Style manual or journal used
Geological Society of America Bulletin
Computer software used
Adobe Acrobat 6 Professional
Adobe Illustrator 8.0
Adobe Photoshop CS 2
Macromedia FreeHand 11.0
Golden Software Grapher 3.0
Golden Software Surfer 8.0
Microsoft Excel 2007
Microsoft Word 2007
Microsoft Office Picture Manager 2007
x
TABLE OF CONTENTS PageLIST OF FIGURES xii
LIST OF TABLES xx
CHAPTER 1: INTRODUCTION……………………………………………….......
1
1.1 Introduction…………………………………………………………………….. 11.2 Location of the study area……………………………………………..……….. 41.3 Previous Works………………………………………………………………… 51.4 Objectives……………………………………………………………………….
7
CHAPTER 2: GONDWANAN SEQUENCES OF NEPAL HIMALAYA AND PENINSULAR INDIA……………………………………………………………...
8
2.1 General Geological Setting of Nepal Himalaya………………………………... 82.2 Gondwana Stratigraphy of Nepal………………………………………………. 102.3 Gondwanan Sequences in other parts of Nepal………………………………… 242.4 Distribution of Gondwanan Basins in Peninsular India………………………... 262.5 Gondwanan Stratigraphy of other parts of extra-Peninsular India and other parts of Gondwanaland……………………………………………………………...
31
CHAPTER 3: EVOLUTION OF GONDWANAN BASINS………………………
36
3.1 Continental Breakup of Gondwanaland………………………………………... 363.2 Evolution of the Passive Margin at the Northern Boundary of India…………... 383.3 Evolution of Facies and Climatic control during the Evolution of Gondwanan Sequences…………………………………………………………………………...
(SPB), and Rajmahal Basin (RB). All these basins are aligned with three linear tracts of
India (Fig. 2.11).
The evolution of these basins is related to mountain building and other crustal
movements. Earlier crustal movements include the rejuvenation of the Aravalli and the
Eastern Ghat ranges, which caused the subsidence of large blocks between vertical or
slightly inclined normal faults (Wadia, 1919). However, normal faulting in extensional
lineaments between the cratonic blocks of India is also considered as the mechanism of
Gondwanan basin development in India (Dutta, 2002). Most of the Gondwanan basins are
half-graben basins bounded by a fault on one side. However, this mechanism does not
apply to all Gondwanan basins.
27
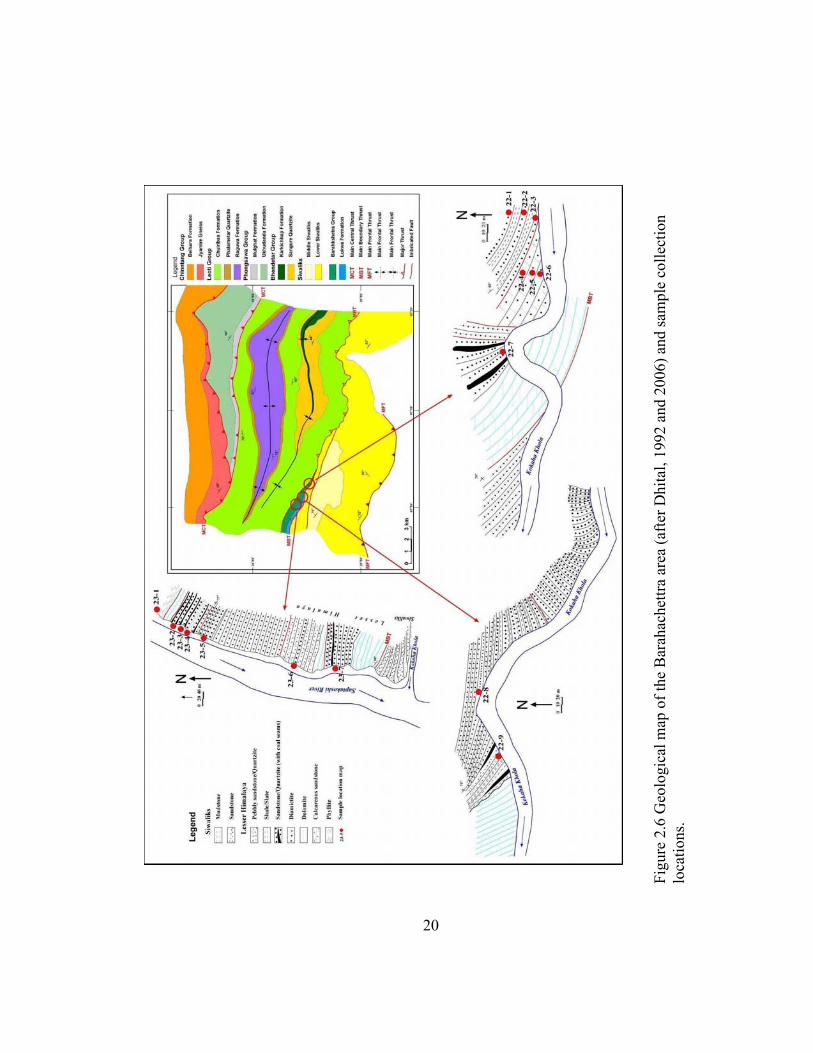
Figure 2.11 (A) Geological map of peninsular India (after Najman, 2005) and (B) distribution of Gondwanan basins in peninsular India (after Dutta, 2002)
A
B
28
The Gondwanan system of India is divided into three classic divisions-- the
Lower, Middle and Upper--corresponding in a general way to the Permian, Triassic, and
Jurassic of Europe, respectively (Wadia, 1919). These units have been further divided
into different formations. Lithological associations of the Gondwanan sequences that are
distinct are designated as facies. Veevers (1995) has provided a composite startigraphic
column for the Damodar Basin (DB) (Fig. 2.12)
Talchir Formation: The Talchir Formation refers to of the lowermost beds of
Gondwanan sequences that were first recognized in the Talchir district of Orissa,
southeast India. This series is quite homogenous and uniform in composition over
different basins and thus is considered as a valuable stratigraphic horizon. Boulder beds
characteristically contain glaciated, striated, and faceted blocks embedded in a fine
matrix, and, thus, suggest glacial action during the deposition. The formation is
approximately 300 m thick in the Damodar basin and is considered to have been derived
from a granitic source (Dutta, 2002)
Damuda Group: The Damuda Group is further divided into three formations: the
Raniganj, the Barren Measures, and Barkar formations.
Barakar Formation: The Barakar Formation rests conformably upon the Talchir
Formation and consists mostly of coarse-grained, white, massive sandstones and shales
with coal seams. The Barakar Formation contains a large quantity of coal in thick seams.
Sandstones of the Barakar Formation are more mature compared to the Talchir
Formation; sandstones are subarkosic, occasionally grading to quartz arenite (Dutta,
2002).
29
Figure 2.12 Stratigraphic column of Gondwanan sequences in the Damodar Basin (after Veveers and Tiwari, 1995).
30
Barren Measures: The Barren Measures is a thick sequence of carbonaceous
shales with concretions of impure iron carbonates and oxides. This unit varies in
thickness and composition among basins (Wadia, 1919). Towards the eastern part (in the
DB), shale is more predominant, while in the west sandstone is more common,
particularly in the PGB (Dutta, 2002).
Raniganj Formation: The Raniganj Formation consists of coal, carbonaceous
shale, siltstone, and sandstone. Coal seams of the Raniganj Formation are thinner than
those of the Barakar Fomation; sandstones, mostly arkosic and sub-arkosic, are finer than
the Barakar sandstones (Dutta, 2002). The thickness of this formation ranges from 700 m
to 900 m.
Panchet Formation: The Panchet Formation lies unconformably on the Raniganj
Formation, but in some places it directly overlies the Barakar Formation. The formation
contains alternations of red clay and coarse sandstone. However, greenish shale and
sandstone are abundant in the lower part of the formation, near the boundary with the
underlying Raniganj Formation (Dutta, 2002).
Mahadev Formation (Supra Panchet): The Mahadev Formation is well
developed in Madhya Pradesh where a section of approximately 1,300 m is exposed near
Nagpur. This formation contains of variegated, massive, coarse- to medium-grained
sandstones with ferruginous and micaceous clay. Sandstones are super-mature quartz
arenites with very little or no feldspar (Dutta, 2002). In the Damodar Basin, thick-bedded,
massive sandstones and shale beds of the Mahadev Formation are exposed. The thickness
of this formation is about 800 m at SB, but in some basins it just appears as a thin cover.
31
2.4 GONDWANAN STRATIGRAPHY OF OTHER PARTS OF EXTRA-
PENINSULAR INDIA AND PARTS OF GONDWANALANDS
The Gondwanan sequences on the Indian subcontinent are not confined to
peninsular India. Outliers of Gondwanan units have been found in northern India across
the Indo-Gangetic plain in the western Himalayas (Punjab Salt Range, Hazara,
Afghanistan, Kashmir) and the eastern Himalayas (Nepal, Sikkim, Bhutan, Assam, etc.).
These units developed along the northern boundary of India during the Permo-
Carboniferous (Fig. 2.13) and are known as extra-peninsular Gondwanan sequences.
Gondwanan sequences of peninsular India are usually relatively undisturbed. The extra-
peninsular occurrences have been folded, compressed, and, in many cases,
metamorphosed. Basic problems related with Gondwanan sequences in extra-peninsular
India along the Himalayan range include the identification and age evaluation of the
sequences.
In Kumaon Himalaya, the Blaini Formation of the Krol Belt has been correlated
with the Sisne Formation of Nepal (Sakai, 1983; Bashyal, 1979). However, later works
disputed the late Paleozoic position of the Blaini Formation. Nummulite-bearing shales of
the Subathu Formation of the Garhwal Himalaya are, however, easily correlated with the
post-Gondwanan Bhainskati Formation of the Nepal Himalaya. Only Eocene and Upper
Cretaceous units are present in Jammu and Simla area of the western Himalaya. In
contrast, only Permian units are found in Bhutan and Arunachal areas of the eastern
Himalaya.
32
Permian Gondwanan units have been reported from the Khalaspur Basin. Here,
these are overlain by Miocene and younger deposits (Hossain et al., 2002). Gondwanan
sequences have been divided into six facies including coal lithofacies. However, unlike in
Nepal and India, marine successions have not been reported from this Bangladesh
Gondwanan basin in Bangladesh.
Figure 2.13 Distribution of Gondwanan basins on the Indian subcontinent (Frakes, 1975)
33
Fluvial conglomerates have been reported from this basin (Hossain et al., 2002).
However, Gondwanan sequences of this basin belongs to peninsular Indian Gondwanan
sequences based on paleo-tectonic reconstructions (Khan, 1994).
Figure 2.14 Main tectonic subdivision and relation of Indian Precambrian shield (after
Khan, 1994).
34
Based on gravity data, the eastward extension of Gondwanan basins extends up to
the Yilgarn craton of Western Australia (Fig. 2.14; Khan et al., 1994). This east-west
stretched basin is the northernmost Gondwanan sub-basin that was separated from
southern Gondwanan sub-basin by a northeast-southwest intra-cratonic high connecting
the Shillong Massif and the Chhotanagpur gneissic terrane. The southern Gondwanan
sub-basin was extended from Eastern Ghat palaeo-shelf to the western periphery of the
Shillong plateau through Ghatal- Behrampur.
Gondwanan basins were distributed on all continental blocks of Gondwanaland
including India, Australia, Antarctica, Africa, and South America. However, the
distributions of basins and facies were controlled by paleolatitude and topographic highs
(Fig. 2.15). Gondwanan sequences of peninsular India are usually correlated with the
Collie Basin of Australia and Karoo Basin of South Africa (Veevers, 2006)).
The Collie Basin lies within the Yilgarn craton and contains Permian coal-bearing
sequences (Veveers, 2006). The oldest unit of Collie Basin is the Stockton Formation,
which consists of sandstone, shale, and diamictite confirming a glaciogenic origin of
sediments. Three coal measures with varying thickness (Ewington, Premier, and Muja
Coal measures) overly the Stockton Formation (Veveers, 2006). These coal measures are
underlain by sandstones of the Cretaceous Nakina Formation.
The Karoo Basin of South Africa consists of several connected or isolated basins
that developed between the Carboniferous and Jurassic. The Karoo system in the south,
also known main Karoo system, includes the signature of a subduction environment. To
the west, the system reflects deposition associated with an extensional environment
35
(Catuneanu et al., 2005). The lowermost part of the Dwyka Formation consists of glacial
till. The overlying Volksrust Formation consists mostly of shale with sandstone. The
Estcourt, Belmont, Otterburn, Mol Teno, and Elliot formations contain varying amount of
sandstone and shale. The Estcourt Formation also contains several coal horizons. The
total thickness of the Karoo system at the Main Karoo Basin (South Africa) is 1100 m.
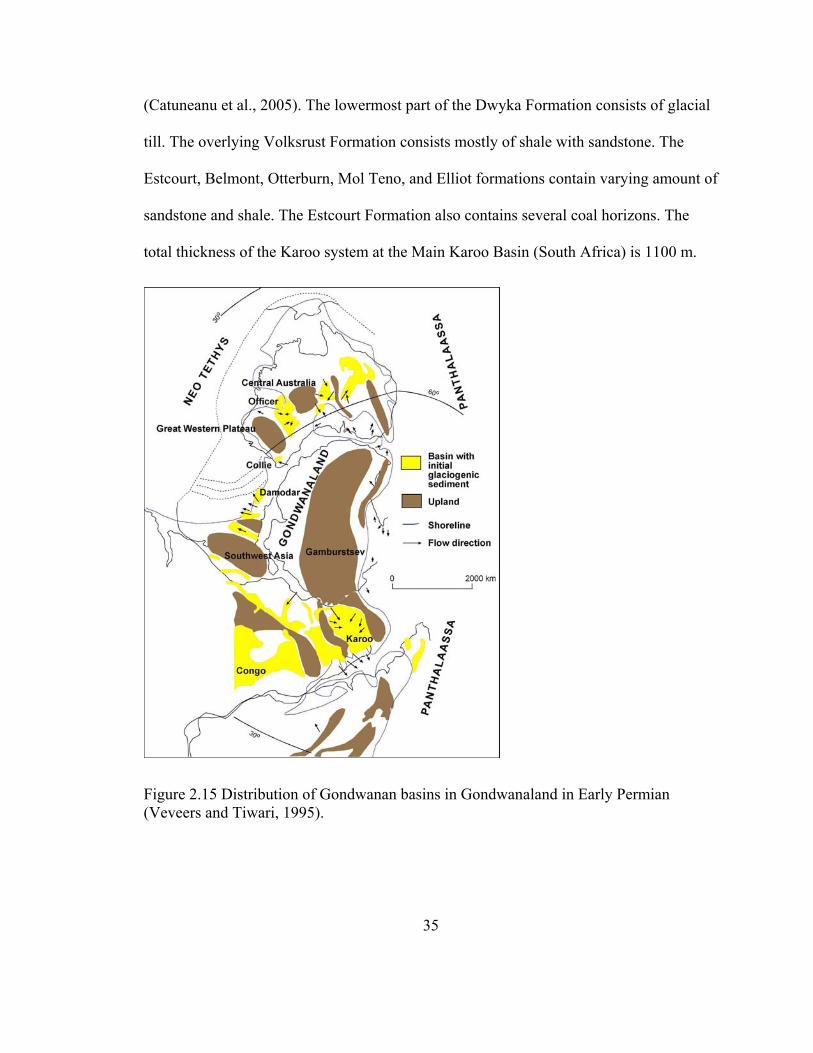
Figure 2.15 Distribution of Gondwanan basins in Gondwanaland in Early Permian (Veveers and Tiwari, 1995).
36
CHAPTER 3: EVOLUTION OF GONDWANAN BASINS
3.1 CONTINENTAL BREAK UP OF GONDWANALAND
The sedimentation cycle in the Purana Basin of peninsular India and its
equivalents, in the Lesser Himalaya was ended by early Cambrian time
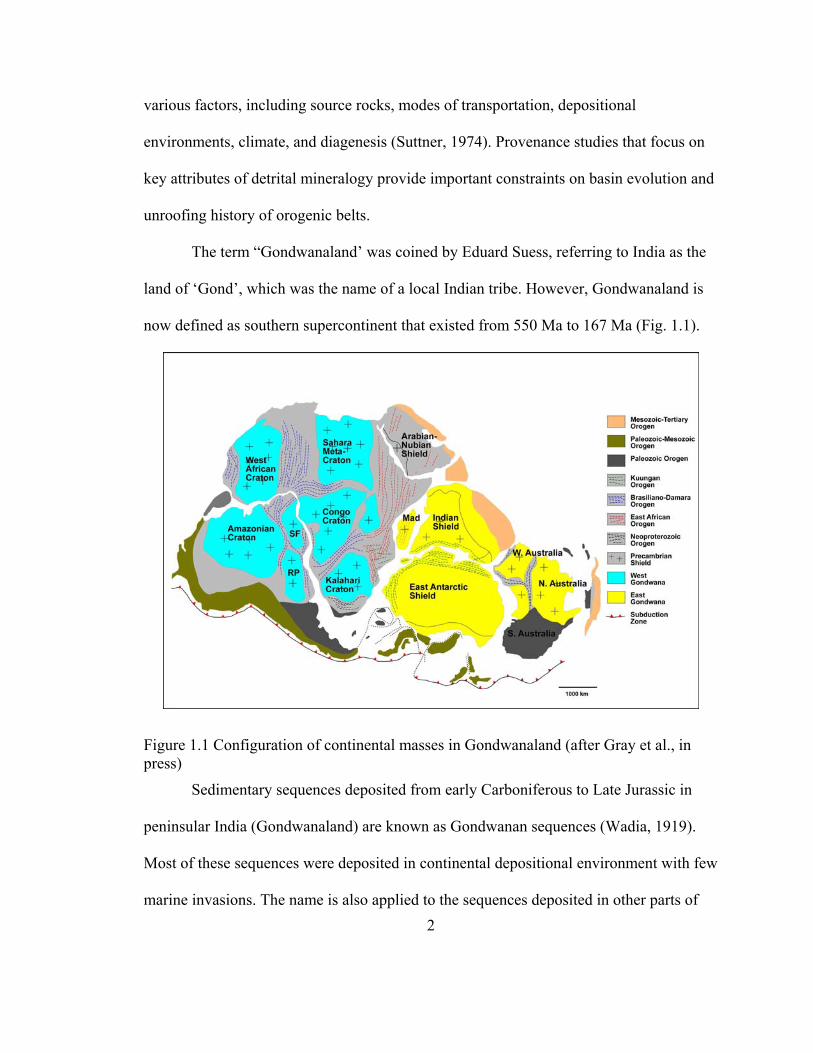
contemporaneously with Pan-African mountain-building (Valdiya, 1997). However, due
to localized uplift, narrow fluvial depositional system developed in the Zanskar and
Hazara areas.
The break up of the Gondwanaland has been related with continental flood
volcanism that occurred since early Mesozoic (Segev, 2002). Several models have been
proposed to explain the mechanisms for the break up, but none of these are free from
controversy. However, the popular model involves lower mantle upwelling. The
Carboniferous Variscan (Hercynian) orogen has been related with the collision of several
Gondwanan plates and Laurasia during the final assembly of Pangaean supercontinent
and to post-convergent extension by crustal thinning, lowering of crustal viscosity,
formation of numerous sedimentary basins and widespread alkaline magmatism between
320- 240 ma (Segev, 2002). The load of accumulated sediments in these rifted basin
caused normal faulting that resulted in the famous half-graben Gondwanan basins.
The Gondwana supercontinent was bounded on its southern side until Early
Jurassic by an active subduction zone responsible for the fold belts of South Africa,
37
South America, and southwest Antarctica. During the Jurassic, the Karoo area was
uplifted and subsequent Karoo plume activity resulted in proto oceanic rifting between
East Gondwana (India, Antarctica, and Australia) and West Gondwana (Africa and South
America) (Segev, 2002).
Extensional movement between East Antarctica, India, and the western Australian
margin was reactivated during the Early Cretaceous. The break up between India and
Western Australia along the Cuvier and Gascyone Abyssal Plains started between 132-
130 Ma (Segev, 2002). During that period, a variety of igneous rocks were emplaced in
the northeast Indian graben along with seaward dipping flows forming the Rajmahal,
Bengal and Sylhet traps (Fig. 3.1 A). After break up and initial drifting, the space
between India and Antarctica was filled by Kerguelen plateau basalts. During the Upper
Cretaceous, the rifting between Madagascar and Seychelles-India occurred, along with
basaltic volcanism in Madagascar and Seychelles, and gabbroic intrusions in India.
The breakup between Seychelles and India was followed by rifting along the Goa,
Narmada-Son, which resulted in the extrusion of the Deccan Trap basalts between 70-61
Ma (Segev, 2002) (Fig. 3.1B).
38
Figure 3.1 Generalized reconstructions of (A) Early Cretaceous and (B) Tertiary Gondwanaland (from Segev, 2002)
3.2 EVOLUTION OF PASSIVE MARGIN ALONG THE NORTHERN
BOUNDARY OF PENINSULAR INDIA
The character of the northern margin of peninsular India prior to collision with
Tibet remains controversial. What was the total length of India subducted beneath Tibet?
In the various models and mechanism proposed, the length has been estimated to be as
little as a few kilometers and as high as 2800 km. The latter estimate involves the concept
of a ‘Greater India’. India was a part of Gondwanaland from the Precambrian to Jurassic,
A B
39
before it became isolated from Africa, Australia, and Antarctica. India remained a passive
margin during its northeast-directed movement from the Cretaceous to the Eocene when
it collided with Asia (Brookfield, 1993).
The Tibetian block was separated from India during the Permian, which resulted
in subsidence of the High Himalaya and deposition of a very thick sedimentary
succession on oceanic crust in the North Himalaya (Brookfield, 1993). Some still believe
that a proto-Himalayan range and Himalayan micro-continent existed between the Lesser
Himalaya and Tethys Himalayan zones between the Cambrian and late Paleozoic. Such a
high would have an important role as a sedimentary and faunal barrier between the basins
of both zones (Sakai, 1989) (Fig. 3.2). However, this hypothesis cannot be proved with
existing stratigraphic, sedimentological, and paleomagnetic field data. Rather, spatial and
environmental differentiation between the Lesser Himalayan and the Tethys Himalayan
basins with separation of about 5,000 km is proposed as the probable cause of different
sedimentary facies development in these two domains (Jain and Kunwar, 1970).
Generally, the classification of ‘extra-peninsular Gondwanan sequence’ is given
only to the sequences developed in the Lesser Himalayan terrains that have more or less
similar depositional environment and source rocks as peninsular Indian Gondwanan
sequences.
40
Figure 3.2 Schematic reconstruction of micro continent barrier supposed to have existed between the Lesser Himalayan and the Higher Himalayan terrains.
3.3 EVOLUTION OF FACIES AND CLIMATIC CONTROL DURING
DEPOSITION OF GONDWANAN SEQUENCES
Variation of paleoclimate was an important factor controlling sedimentation in
Gondwanan basins. The separations of eastern Gondwanaland from western
Gondwanaland, then separation of India from Australia and later from Madagascar were
accompanied by the northward movement of India. Hence, the distributions of lithologies
on these basins are related with paleolatitudes (Fig. 3.3) of the basins and ongoing
tectonic activity.
The composition of sand and clay minerals in shale, and the presence of coal in
these different facies was controlled by climatic conditions during deposition (Dutta,
2002).
41
Figure 3.3 Paleogeography of Gondwanaland (www.paleoportal.com, 2009).
42
Dutta (2002) inferred that initial embryonic basins started to receive glacial
deposits, when the Gondwanan basins were situated along southern high latitudes.
Afterwards, glacial outwash plains and glacial lakes gave rise to a meandering fluvial
system with well-defined channels and broad flood plains. The latter were filled with
coal, carbonaceous shale, gray shale and siltstone (Dutta, 2002) during the Permian when
the climate was humid. After sometime, climate became less humid and deposition of
coal was reduced; sand, carbonaceous shale, and gray shale-siltstone became more
abundant. However, coal-forming environments returned during the Late Permian, but
were not as extensive as earlier (Dutta, 2002). Although this facies formed mainly in
meandering fluvial systems, some marine signatures have been identified by some
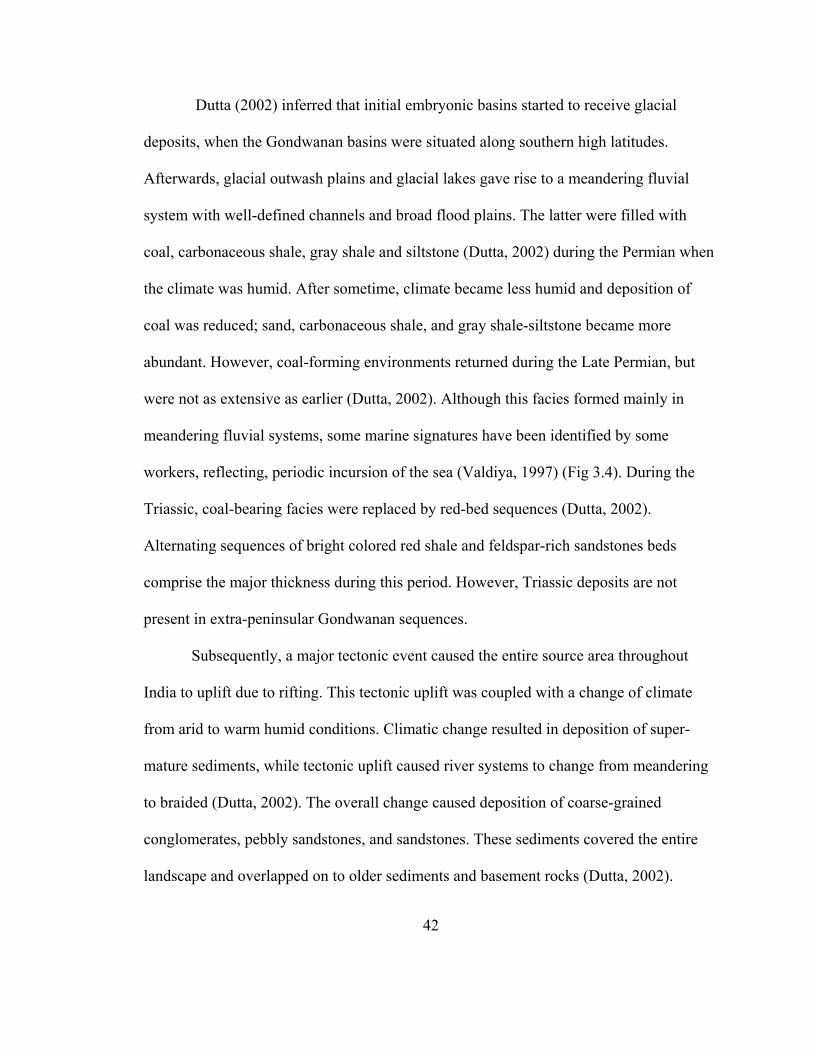
workers, reflecting, periodic incursion of the sea (Valdiya, 1997) (Fig 3.4). During the
Triassic, coal-bearing facies were replaced by red-bed sequences (Dutta, 2002).
Alternating sequences of bright colored red shale and feldspar-rich sandstones beds
comprise the major thickness during this period. However, Triassic deposits are not
present in extra-peninsular Gondwanan sequences.
Subsequently, a major tectonic event caused the entire source area throughout
India to uplift due to rifting. This tectonic uplift was coupled with a change of climate
from arid to warm humid conditions. Climatic change resulted in deposition of super-
mature sediments, while tectonic uplift caused river systems to change from meandering
to braided (Dutta, 2002). The overall change caused deposition of coarse-grained
conglomerates, pebbly sandstones, and sandstones. These sediments covered the entire
landscape and overlapped on to older sediments and basement rocks (Dutta, 2002).
43
Extra-peninsular Gondwanan sequences were being deposited in meandering-
braided fluvial systems but also reflect periodic marine incursion. Few extra-peninsular
Gondwanan successions consist of volcanic clasts and volcanic flows that show the proof
of syn- or pre-depositional volcanic activities (Fig 21 B). During deposition of the Amile
Formation, which is dominated by sandstones, the environment was shallow marine. The
Eocene Bhanskati Formation not only shows the change in depositional environment
from marine to continental but also a change in provenance from cratonic India to the
Himalayan orogenic belt. Deposition of Gondwanan sequences in eastern and western
parts of Nepal was not synchronous; sequences are older towards the west (Bashyal,
1980).
Figure 3.4 Marine incursion in Gondwanaland during the Permian (Valdiya, 1998).
44
CHAPTER 4: SANDSTONE PETROGRAPHY
4.1 INTRODUCTION
Sandstone petrography is a classical method of provenance study. Sandstone
petrology is based on the assumption that sandstones from similar tectonic settings will
have similar composition. The ratios of major clastic components (e.g., quartz, feldspar,
and lithic fragments) from known tectonic settings have been plotted by several workers
to discrminate various provenance fields (Dickinson and Suczek, 1979; Ingersoll and
Suczek, 1979; Dickinson, 1985). Besides rock types in source areas, sediments are also
influenced by climate, relief, transporting agent, weathering and diagenesis. Hence,
sandstone composition can help to reconstruct paleogeography, paleotectonics, and
paleoclimate (Suttner, 1977; Ingersoll et al., 1984; Johnson, 1993).
Provenance studies based on mineralogical abundance are based on the
assumption that detrital composition has not been altered significantly by sedimentary
processes including, transportation, weathering, and diagenesis. However, tectonic
discrimination based on mineralogical analysis will not be that effective to trace
provenance if there is mixing detritus derived from different source areas (Velbel, 1985).
Multiple basin analytical techniques, including mineral chemistry, bulk-rock chemistry,
detrital thermochornology, and traditional modal analysis, are generally required to
identify the influence of multiple provenances or source terranes (Morton and
Hallsworth, 1999).
45
4.2 METHODS
A total of twenty-three sandstone samples were collected from three different
Gondwanan sequences of Nepal; the Tansen (western Nepal), Katari (eastern Nepal), and
Barahachettra (eastern Nepal) groups. After preparation in the rock cutting lab of
Department of Geology and Geography at Auburn University, samples were sent to
Spectrum Laboratories in Vancouver, WA for preparation of petrographic thin sections.
Half of each thin section was stained to assist in the identification of various feldspar
grains. Mineralogical compositions of the samples were determined by compositional
modal analysis following the Gazzi-Dickinson point-count convention which minimizes
the control of grain size on sand composition (Dickinson, 1970; Ingersoll et al., 1984). A
minimum of 300 framework grains were counted from each sample. Different end-
members were recalculated from the point-count data to plot different ternary diagrams
for the discrimination of tectonic setting (Dickinson, 1970; Dorsey, 1988; Uddin and
Lundberg, 1998). The following compositional parameters (Table 4.1) were calculated:
[Stability of mineral increases towards the top part of the table; *Epidote has lower ranking than garnet and **Calcic Amphibole has lower ranking than clino- and ortho-pyroxene for eolian cover deposits in Bateman and Catt (1985)’s work; # doesn’t include the opaque minerals]
Heavy mineral analysis has been used for in several provenance studies of
peninsular India and also the adjoining Himalayan domain. The study of heavy mineral
suites in the Barakar sandstone (Gondwanan sequence) of the Moher sub-basin in
70
peninsular India was done by Aslam et al. (1991). The method has been applied to paleo-
tectonic and provenance studies of Himalayan foreland sequences (Chaudhri, 1972; Sinha
and Sastri, 1973; Cerveny et al., 1989, Uddin and Lundberg, 1998a; Najman and
Garzanti, 2000; Uddin et al., 2007) and on deep-sea cores from the Bengal fan
(Yokoyama et al., 1990; Amano and Taira, 1992). These studies have been proved
powerful in evaulating the nature of source rocks, in reconstructing the course of
ancestral fluvial systems, and in establishing associations of source rocks to the unroofing
of the Himalayas and Indo-Burman Ranges.
Further advances in heavy mineral analysis has led to the method of varietal
studies that concentrates on relative abundances of minerals that are stable during
diagenesis and have similar hydraulic behavior (Morton and Hallsworth, 1994). The
hydraulic parameter is controlled by grain size, density, and shape. Morton and
Hallsworth (1994) formulated several mineral ratios, pairs and indexes of heavy minerals
comprising similar hydraulic behavior (e.g. index ATi with mineral pair apatite and
tourmaline, GZi with mineral pair Garnet and Zircon, CZi with mineral pair chrome
spinel and zircon). However, these methods are only applicable to the sedimentary rocks
containing abundant heavy minerals.
In the absence of a full range of heavy minerals, study can be accomplished by
determining the relative abundance of all important heavy mineral species preserved in
each stratigraphic unit, recognizing dominant members of mineral groups, identifying the
first key minerals indicative of certain levels of metamorphism, evaluating associations or
71
paragenesis of specific heavy minerals, and establishing index minerals from
stratigraphic levels in selected sections (Rahman, 2008).
5.2 METHODS
Due to similar hydraulic behaviors, heavy minerals remain in certain grain-size
fractions. Samples were disintegrated by drying in an oven and then sieving to extract 0-
4 phi the size fractions. The samples were then treated with high-density liquids to
separate the heavy minerals. As there is sharp difference in the density of heavy minerals
with regular framework minerals, the heavy fraction gets settled first due to gravity. The
liquid used for heavy mineral separation in this study was tetrabromoethane (C2B2Br4,
density 2.89-2.96 gm/cc). The samples were weighed and added to the heavy liquid in a
separating funnel. The mixture was stirred three times to ensure that the grains were
thoroughly wetted and not coagulated. As time passed, the heavy minerals settled down
to the bottom of the funnel and the lighter fractions appeared floating above the heavy
liquid at the top of the separating funnel. After 24 hours, the stopcock was opened slowly
and the liquid bearing the heavy mineral fraction in the bottom part of the separating was
allowed to flow slowly through a filter paper. The separated heavy fractions were washed
carefully with acetone and dried in the open air and oven for 2 hours. The lighter fraction
of the samples were also cleaned with acetone, dried, and stored. The heavy mineral
fractions of samples were weighed and processed for magnetic separation. Magnetic
separation of heavy minerals was carried out using a Frantz magnetometer at the
Department of Geology and Geography at Auburn University. Four fractions of different
magnetic susceptibility (Hess, 1966) were separated, including Group-1: Strongly
72
Magnetic (SM); Group-2: Moderately Magnetic (MM); Group-3: Weakly Magnetic
(WM); and Group-4: Poorly Magnetic (PM). The separation of four groups of mineral
was done by applying different slide slope angle and current values in the magnetic
separator (Table 5.2).
Table 5.2 Four fractions of different magnetic susceptibility (Hess, 1966)
Side slope 15o Side slope 5o Strongly magnetic Moderately magnetic Weakly
magnetic Poorly magnetic
Hand magnet 0.4 Amps 0.8 Amps 1.2 Amps 1.2 Amps
Magnetite Pyrrhotite
Fe-oxides
Illmenite Garnet Olivine
Chromite Chloritoid
Hornblende Hypersthene
Augite Actinolite Staurolite Epidote Biotite
Chlorite Tourmaline
(dark)
Diopside Tremolite Enstatite Spinel
Staurolite (light)
Muscovite Zoisite
Clinozoisite Tourmaline
(light)
Sphene Leucozxene
Apatite Andalusite Monazonite
Xenotine
Zircon Rutile
Anatase Brookite
Pyrite Corundum
Topaz Fluorite Kyanite
Silimanite Anhydrite
Beryl Group 1 Group 2A Group 2B Group 3 Group 4
Group-1 consists of strongly magnetic minerals including magnetite, pyrrhotite
and Fe-oxides. However, this group was not separated using a hand magnet. Rather, it
was separated along with Group 2A minerals including illmenite, garnet, olivine,
chromite and chloritoid using a 15o side slope and a 0.4-Amp current.
Group 2B minerals include of hornblende, hypersthene, augite, actinolite,
staurolite, epidote, biotite, chlorite, and tourmaline. These were separated from weakly to
poorly magnetic minerals using a 0.8-Amp current and a 15º side slope. Group 3
73
minerals, including diopside, tremolite, enstatite, spinel, staurolite (light), muscovite,
zoisite, clinozoisite, and tourmaline (light), were separated from Group 4 using a 1.2-
Amp current and a 15º side slope. The rest of the heavy minerals were classified as Group
4 (poorly magnetic) which was not separated further due to presence in small amount.
This group includes slightly magnetic minerals, such as sphene, leucoxene, apatite,
andalusite, monazite, and xenotine, and other non-magnetic minerals like zircon, rutile,
pyrite, corundum, fluorite, kyanite, sillimanite and beryl. However, separation of heavy
minerals belonging to all four groups was not achieved for each sample due to the
absence or rarity of minerals from certain groups.
Separated heavy minerals were sent to Spectrum Laboratories in Vancouver, WA
to prepare polished thin sections. Fourteen polished thin sections were prepared from
fourteen samples. Each of the magnetically separated heavy mineral fractions were
segregated in different areas (holes) of each thin section. Identification of minerals was
carried out using a petrographic microscope and a modified Fleet method (Fleet, 1926).
Numbers of grains from each holes were counted and then added together to calculate the
percentage of different species of heavy minerals.
74
5.3 RESULTS
Heavy mineral assemblages of Gondwanan sandstones of Nepal are not very
diverse. Only four to five minerals specimens dominate in all samples (Tables 5.3 and
5.4).
Heavy mineral suites in the Permo-Carboniferous Sisne sandstones (samples 16-3
and 16-5) differ markedly those of younger units (the Taltung and Amile formations of
the Tansen Group). Highly stable minerals (ZTR) are present in very small numbers, and
moderately stable garnets are abundant (Table 5.3) (Fig. 5.3). The abundance of opaque
minerals is less than in overlying other units. A possible explanation for this major
difference in heavy mineral assemblage is due to change of provenance in younger units.
The garnets are irregular in shape and highly fractured (Fig. 5.3). Some of the grains also
show corroded surfaces. These surface features suggest a burial dissolution for the Sisne
heavy minerals letting only garnets to survive among all heavies contributed by source
rocks.
The heavy mineral assemblage of Cretaceous-Jurassic Taltung sandstone (sample
K-1) mostly consists of zircon, chrome-spinel, rutile, tourmaline, garnet, and dolomite as
well as common opaque minerals (Table 5.3). Tourmaline grains are highly fractured and
also show the effects of corrosion (Fig. 5.2). Chrome-spinel grains are in variable sizes
and shapes. Garnets are rare and are irregular in shape. Abundant opaque grains present
in this sample could have contributed from source rocks or formed as authigenic iron-
oxide coating is the basin.
75
The Paleocene-Cretaceous Amile Formation of the Tansen Group in western
Nepal is dominated by tourmaline, zircon and rutile, as well as opaque grains. Three
samples from the Amile Formation were subjected to heavy mineral analysis (samples
15-6, 16-8, and 16-9) (Table 5.3).
Figure 5.1 Representative photomicrograph of tourmalines in Amile sandstone (sample 15-6) of the Tansen Group, western Nepal.
Tourmaline grains are easy to identify with their strong pleochroism and low
relief. Tourmalines from the Amile Formation are highly fractured (both primary and
secondary fractures are present). The shape and size of the grains are variable (Fig. 5.1).
Some of the grains are corroded. The zircon crystals are rounded and a little smaller than
the tourmalines. The rutile grains are deep red and rounded. The presence of numerous
76
opaque minerals could have contributed from authigenic coating of iron oxides on
mineral grains as well as a contribution from source rocks.
Figure 5.2 Representative photomicrograph of heavy mineral assemblage in the Taltung sandstone (sample K-1) of the Tansen Group, western Nepal (Cr- Chromium, Rt-Rutile, Tr-Tourmaline).
The Permo-Carboniferous Katari Group in eastern Nepal also shows variations in
heavy mineral assemblage. Besides common heavy minerals present in other Gondwanan
samples, this unit also contains biotite and chlorite/chloritoid (Table 5.4). The garnet
grains are more irregular in shape than the zircons which are mostly rounded. As
expected based on hydraulic equivalence, biotite and chlorite grains are larger than other
types of heavy minerals (Morton and Hallsworth, 1999). However, the mica grains are
deformed and folded (Figs. 5.4 and 5.5). This likely is related to some kind of
77
deformation in the source rocks rather than in the depositional basin as petrographic
analyses of the thin section of this sample does not reflect post depositional deformation.
The Saptakoshi and Tamrang formations of the Barahachettra Group, another
Permo-Carboniferous unit in eastern Nepal, show quite different heavy mineral
assemblages. However, these assemblages are correlatable with assemblages of some
units of the Tansen Group, albeit of different age.
The Tamrang sandstones (samples 22-6, 22-10, 23-4) from eastern Nepal are
primarily dominated by highly stable minerals like zircon, tourmaline and rutile (Table
5.4) (Fig. 5.6) as well as opaque grains. However, the Tamrang Formation also contains
common micas and a large number of unidentified heavy minerals.
The Saptakoshi sandstone (sample 23-5) contains few highly stable heavy
minerals (i.e. zircon, rutile and tourmaline) but large numbers of less stable garnets
(Table 5.4). This dominant assemblage of garnets in the Saptakoshi sandstone is similar
to that of the Sisne sandstone of western Nepal. However, the sizes of garnets are smaller
than that in the Sisne Formation. The Saptakoshi sandstones contain fewer opaque grains
than the Sisne Formation.
78
Figure 5.3 Representative photomicrograph of heavy mineral assemblage in the Sisne sandstone (sample 16-3) of the Tansen Group, western Nepal, showing abundance of garnets.
Figure 5.4 Representative photomicrograph of heavy mineral assemblage in the Permo-Carboniferous sandstone (sample 26-8) of the Katari Group, eastern Nepal. (Bt—Biotite; Chl- Chlorite; Gt—Garnet).
79
Table 5.3 Heavy mineral data in Gondwanan sandstones from western Nepal (Tansen Group).
Sample No 16-9 16-8 15-6 Rock Unit Amile Formation Amile Formation Amile Formation Age (Paleo-Cretaceous) (Paleo-Cretaceous) (Paleo-Cretaceous) Heavy Minerals
Figure 5.5 Representative photomicrograph of heavy mineral assemblage in the Permo-Carboniferous sandstone (sample 26-8) of the Katari Group, eastern Nepal (Bt-Biotite; Rt-Rutile; Zr-Zircon).
Figure 5.6 Representative photomicrograph of heavy mineral assemblage in the Permo-Carboniferous sandstone (sample 23-4) of the Barahachettra Group, eastern Nepal (Tr-Tourmaline).
82
5.3 PROVENANCE
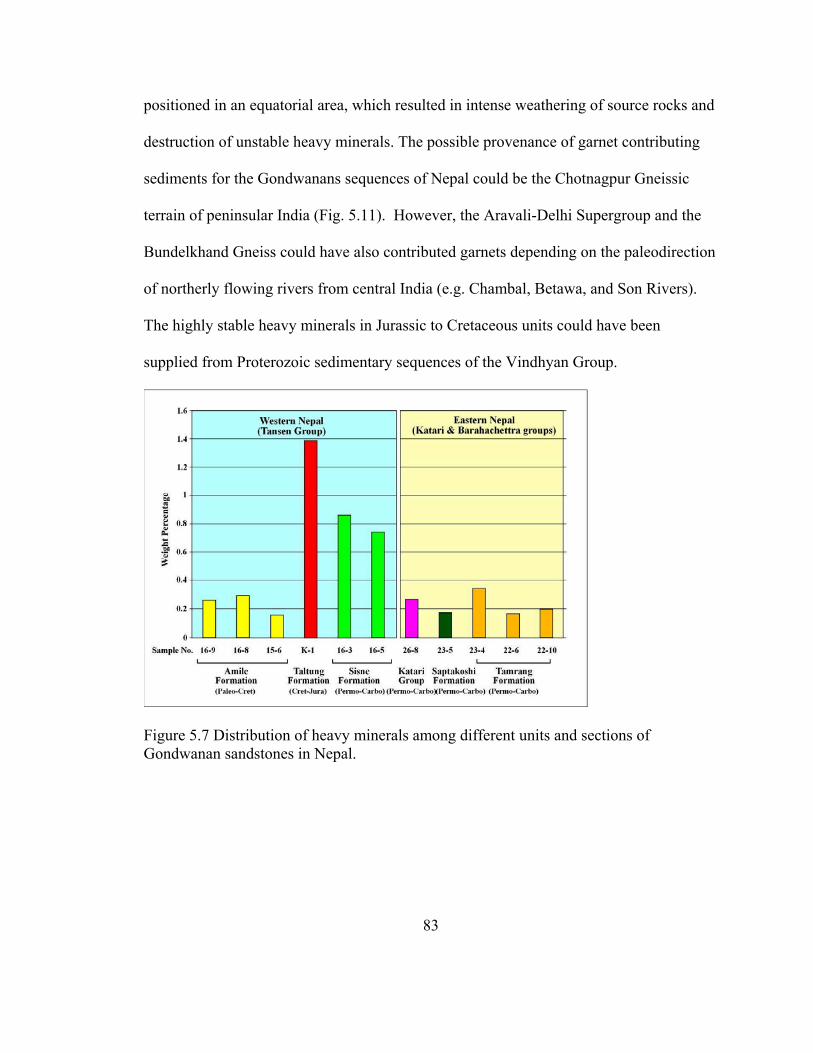
The weight percentage of heavy minerals of the Gondwanan sandstones in eastern
Nepal is less than that of western Nepal (Fig. 5.7). The presence of numerous faults in the
eastern part could have played a significant role by allowing acid water to leach the
heavy minerals (Morton and Hallsworth, 1999). Among individual units, the Taltung
Formation (Cretaceous-Jurassic) of the Tansen Group contains the highest amount of
heavy minerals, which may reflect sediment contribution from nearby lava flows (Sakai,
1983). The overall signature of heavy minerals in Gondwanan sequences of Nepal is the
dominant contribution of garnet in Permo-Carboniferous units in western and eastern
Nepal (Fig. 5.8). Assemblages dominated by highly stable minerals ( zircon, rutile and
tourmaline) characterize the Cretaceous-Paleocene Amile Formation of western Nepal
(Tansen Group) and purported Permo-Carboniferous unit (Bashyal, 1979) of western
Nepal (Fig. 5.9).
Presence of abundant chrome-spinel in the Jurassic-Cretaceous Taltung Formation
of the western Nepal indicates a volcanic source. The puported Permo-Carboniferous
Katari Group does not show similarities in heavy mineral contents with the Permo-
Carboniferous units of Tansen and Barahachettra groups.
The garnet and tourmaline contents of Gondwanan units of Nepal show strong
negative correlation (Fig. 5.10), which suggests a change in source rocks rather than
some other control. Moreover, during the Permo-Carboniferous, India together with
other masses of Gondwanaland, was situated in high southern latitudes (Veever and
Tiwari, 1995). However, during Jurassic to Cretaceous deposition, India was already
83
positioned in an equatorial area, which resulted in intense weathering of source rocks and
destruction of unstable heavy minerals. The possible provenance of garnet contributing
sediments for the Gondwanans sequences of Nepal could be the Chotnagpur Gneissic
terrain of peninsular India (Fig. 5.11). However, the Aravali-Delhi Supergroup and the
Bundelkhand Gneiss could have also contributed garnets depending on the paleodirection
of northerly flowing rivers from central India (e.g. Chambal, Betawa, and Son Rivers).
The highly stable heavy minerals in Jurassic to Cretaceous units could have been
supplied from Proterozoic sedimentary sequences of the Vindhyan Group.
Figure 5.7 Distribution of heavy minerals among different units and sections of Gondwanan sandstones in Nepal.
84
Figure 5.8 Distribution of highly stable heavy minerals (ZTR) among different units and sections of Gondwanan sandstones in Nepal.
Figure 5.9 Distribution of garnets among different units and sections of Gondwanan sandstones in Nepal.
85
Figure 5.10 Variation in distribution of garnets and ZTR among different units and sections of Gondwanan sandstones in Nepal.
Figure 5.11 Possible source rock units for the Gondwanan sandstones of Nepal from cratonic India.
86
CHAPTER 6: MICROPROBE ANALYSIS
6.1 INTRODUCTION
Heavy mineral studies have been used as one of the most powerful tools in
provenance analysis in the past and are gaining more recognition recently. Sandstones are
easy to collect in the field and to process and analyze in the lab and hence are the
materials utilized for heavy mineral analysis.
Mineral chemistry of some heavy minerals are very good indicators on
discriminating source rock types. Chrome-spinel chemistry is useful in differentiating
various types of mafic igneous rocks. The supply of sediment from different-grade
metamrophic rocks can be tracked down with the help of garnet chemistry. Tourmaline
chemistry is valuable in distinguishing types of plutonic source rocks.
Mineral chemistry analysis on some selected heavy minerals has been carried out
with an objective to fingerprint provenance of Gondwanan sequences distributed in
several patches along the Nepal Himalaya.
6.2 MINERAL CHEMISTRY
Three mineral groups were chosen for microprobe analysis: garnet, tourmaline,
and chrome-spinel. Several workers have used these minerals to determine provenance of
of these mineral can be linked to different source rocks (Henry and Guidotti, 1985;
87
Morton, 1985; Henry and Dutrow, 1990; Morton and Taylor, 1991; Nanayama, 1997,
Zhu et. al, 2004).
Garnet [X3Y2(Si04)3], found commonly in metamorphic rocks and also in some
igneous rocks, has proven to be a good indicator of pressure and temperature conditions
during the formation of the source rock. The X-site is occupied by Fe2+, Mg2+, Ca2+ , and
Mn2+. As the metamorphic grade of the source rock will increases, the ratio of (Fe2+ +
Mg2+)/(Ca2+ + Mn2+) also increases (Sturt, 1962; Nandi, 1967). With an increase in
metamorphic grade, pelitic schists will show an increase in Mg concentration with
respect to Fe2+ (Spear, 1993). The Y-site is occupied by trivalent cations like Fe3+, Cr3+
except Al3+ . The cations occupancy of this site can also be related to the type of source
rock.
Compositional analysis of chrome-spinel has also been used by several workers
for sediments provenance analysis. Chrome-spinel is a good indicator of provenance,
particularly for discriminating different types of mafic and ultramafic rocks (Irvine,
1973, 1977; Dick and Bullen, 1984; Nixon et al., 1990). Chrome-spinel [AB2O4], found
mostly in mafic igneous rocks, gives a good indication of source rocks based on
variations of elements in cation sites. There are 4 oxygen ions and 3 cations in the unit
cell (Brady and Perkins, 2009). The A-site is occupied by Fe2+, Mg2+, Ca2+ , Mn2+ and
the B-site is occupied by Al3+, Cr3+, Ti4+, Si4+. Different end members can be calculated
based on the occupancy of these two sites. In most cases, there will be presence of solid
solutions rather than true end members (Deer et al., 1992).
88
Tourmaline generally has very complex compositional structure. The general
structural formula of tourmaline is XY3Z6(BO3)Si6O18(OH)4. The X-site is usually
occupied by Na+, Ca2+, the Y-site is by Mn2+, Fe2+, Al3+, Li2+, Mg2+, and the Z-site by
Al3+, Cr3+, Mn2+or Mg2+ (Deer et. al, 1992). This mineralogical structure provides the
opportunity for a wide range of cation substitutions during crystallization of tourmalines.
Plots of tourmaline composition, Al-Fe(tot)-Mg and Ca-Fe(tot)-Mg, have been used for
provenance analysis by many authors (e.g., Henry and Guidotti, 1985; Henry and
Dutrow, 1990).
6.3 SAMPLE PREPARATION
Heavy minerals were separated from disintegrated samples using a heavy liquid.
The separation process is described in the heavy mineral chapter (Chapter 5). Thin
sections used for normal microscopic study of heavy mineral were also used for the
microprobe analysis. The polished thin sections were carbon-coated to ensure proper
conduction of the electron beam on the surface of the thin sections. Along with the
desired samples, one standard sample was also coated to the same thickness. The carbon
coating was carried out by carbon evaporation under vaccum, and the thickness of the
carbon coat was monitered with the reference of its color on polished brass block. As the
thickness of coat increases on the brass, its color will change from orange (150 Å) to
indigo red (200 Å), then to blue (250 Å) and then to bluish green ( 300 Å).
89
6.4 THE ELECTRON MICROPROBE
An electron microprobe (EMP) is an analytical tool used for nondestructive
micron-scale quantitative chemical analysis of small volumes of solid materials. It is also
referred to as an electron probe microanalyser (EPMA) or electron micro probe analyser
(EMPA).The working method of EMP is similar to the scanning electron microscope
(SEM). The method utilizes characteristic x-rays excited by the bombardment on the
surface of sample with an electron beam. When the electron beam hits on the surface of
the sample it creates two different kinds of response. Some of the electrons of the
incident beam will be scattered backward elastically multiple times carrying the energy
between 0 and Eo (the incident beam energy). These back-scattered electrons carry
information about the chemical composition of the sample. As the electron beam hits the
sample, electron beam will loses its energy which will be received by the electrons in the
shell of atoms of the sample. These electrons of the sample will be excited and jump from
one shell to another shell throwing certain amount of energy. That energy transforms to
x-rays that are very characteristic of the compositon of the sample. Secondary electrons
from the sample are also mobilized by the beam through inelastic scattering. These have
energies in the range of 0-50 eV (most probable energy 3-5 of eV). Different detector
setups are required to detect these different types of electron signal.
The basic purposes of EPM are: (1) to get a complete quantitative chemical
analysis of a small sample through x-ray emission spectral analysis without destroying
the samples; and (2) to get high-resolution scanning electron and concentration maps
(scanning x-ray). Among the scanning electron images, backscattered electron (BSE) will
90
show compositional contrast, while secondary electron (SE) will enhance surface and
topographic features.
For this research, a JEOL JXA 8600 Superprobe was utilized at the Department
of Geology, University of Georgia. The probe is automated by a Geller Micro analytical
laboratory dQANT with the an accelerating voltage of 15 KV and a beam current of 15
nanno amps. Both natural and synthetic standards were used to calibrate the data.
Standard Intensity Calibration:
Before starting the actual microprobe analysis of samples, the standard x-ray
intensities of the elements to be measured were obtained on appropriately chosen
standards. These standards were also verified for the reproduction by analyzing
secondary standards that were run as unknowns. The analytical environment (e.g.,
accelerating voltage, beam current, etc.) was remained fixed throughout the lab session.
The list of the standards used during this analysis is given in Table 6.1. Most of
the standards came from C.M. Taylor Corporation. The USNM standards came from the
National Museum of Natural History, a branch of the Smithsonian Institution. Standards
from University of Oregon Microprobe Laboratory and an almandine standard obtained
from the Harvard Mineral Museum were also used. Calbration for each analysis session
was checked using the Kakanui Hornblende (USNM) and Pyrope # 39 (C.M. Taylor)
standards.
91
Table 6.1 Electron microprobe standards used for this study
Electron Microprobe Standards
Element Standard Source Comment
Cr Chromite#5 C M Taylor Corp
Mn Spessartine#4b C M Taylor Corp
TiO2 Rutile C M Taylor Corp
Ca Sphene#1A C M Taylor Corp
Fe Hematite#2 C M Taylor Corp Used for oxide (spinel) analysis
Fe Syn. Fayalite Ol-11
Univ. of Oregon Used for silicate analyses
Ni Ni metal C M Taylor Corp
Si Diopside 5A C M Taylor Corp Si standard for all phases except garnet
Mg Olivine #1 C M Taylor Corp
Al Syn. Spinel C M Taylor Corp
K Orthoclase MAD-10
C M Taylor Corp
Na Ameila Albite USNM This is ubiquitous Na
Standard
Si Almandine Harvard Mineral Museum oxygen standard # 112140
Si standard for garnet
analyses
F Syn. Fluoro-Phlogopite
University of Oregon M-6
Cl Scapolite USNM R 6600-1
92
6.5 RESULTS
A total of 45 grains were analyzed under the supervision of Mr. Chris Fleisher.
These included garnets, tourmalines, and chrome-spinels.
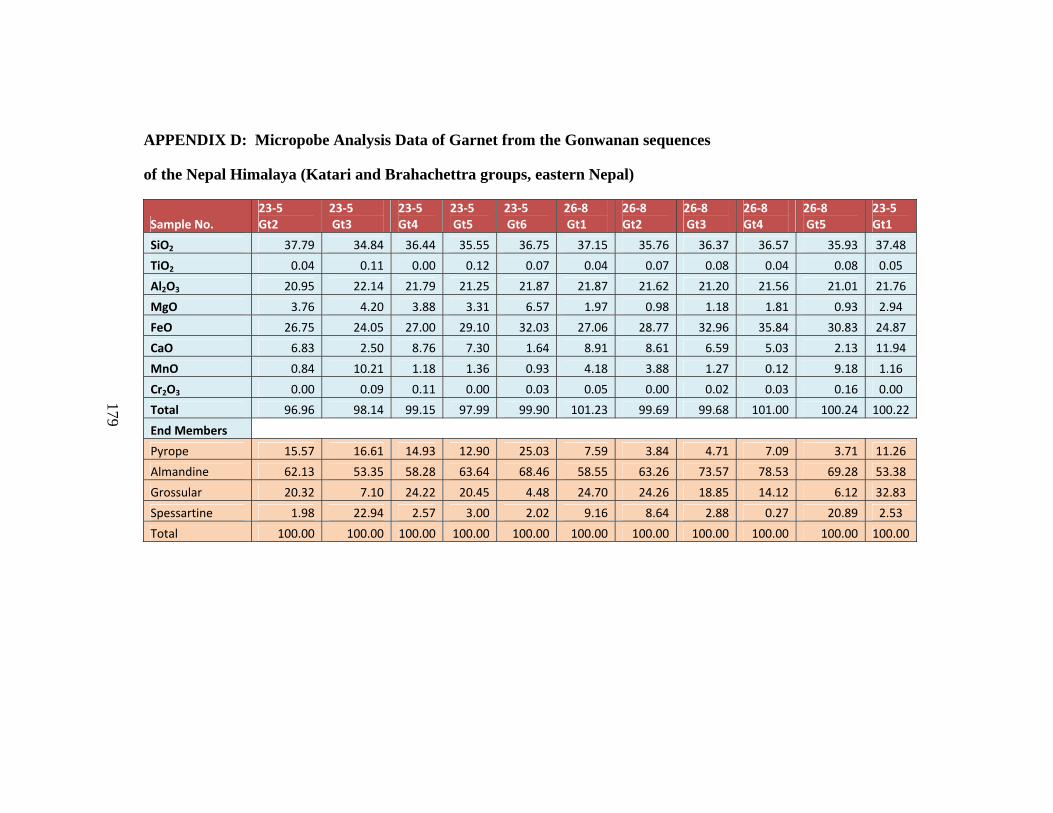
6.5.1 Garnet
Garnet grains are abundant in the Sisne Formation of the Tansen Group and also
in the Barahachettra and Katari groups. However, garnets are rare to absent in younger
units (Taltung and Amile formations ) of the Tansen Group. Calculated endmembers and
their variations of 20 garnet grains are plotted in figures 6.1 through 6.6. The end-
member calculation was done for four endmembers-- almandine, pyrope, grossular and
spessartine-- among which almandine is the dominant end-member. The average and
maximum content of almandine in garnet grains is 65.49% and 81.88%, respectively.
The average pyrope content is 14.44% with a maximum of 35.80%. Higher pyrope
contents are found in the Taltung Formation of the Tansen Group. The average grossular
content is 13.70% with a maximum of 32.83%. The average spessartine content is 6.35%.
However, this average usually reflects high spessartine contents in just a few grains.
The (Sp+Gro)-Py-Alm plot (Fig. 6.1) shows that most of the garnets have high
almandine content. Almost all of the grains from the Katari Group have very low pyrope
content. Similary, the (Py+Alm)-Gro-Sp plot (Fig. 6.2) shows that most of the grains
have high Py+Alm, particularly garnets from the Taltung Formation. Garnet grains from
the Barahachettra Group show low spessartine contents of except one grain. The
(Alm+Sp)-Py-Gro plot (Fig. 6.3) shows that all the garnets from the Katari Group fall in
93
field I with almandine and grossular and pyrope < 10%. Most of the garnets from the
Barahachettra Group fall in field III with both pyrope and grossular >10%. The garnets
from the Taltung Formation falls in field II with grossular <10%. The plot of Sp-Alm-Py
(Fig. 6.4) shows that most of the garnet grains from all rock units fall in the amphobolite
facies. Only one grain of the Sisne Formation falls in granulite facies. However, the
grains from the Taltung Formation fall in the overlapping field between granulite facies
and amphioblite facies.
The plot of grossular content (mol %) with the number of grains from each rock
unit (Fig. 6.5) also shows that most of the grains fall in low- to medium-grade
metamorphic pressure regimes. The only one grain from the Sisne Formation falls in
eclogite facies. Garnet from the Taltung Formation reflects a low-grade metamorphic
regime.
94
Figure 6.1 Chemical composition of garnets of Gondwanan sequences of Nepal (Tansen Group, western Nepal; Barahachettra and Katari groups in eastern Nepal) plotted on (Sp+Gro)-Py-Alm (adapted after Nanayama, 1997).
Figure 6.2 Chemical composition of garnets of Gondwanan sequences of Nepal (Tansen Group, western Nepal; Barahachettra and Katari groups in eastern Nepal) plotted on (Py+Alm)-Gro-Sp (adapted after Nanayama, 1997).
95
Figure 6.3 Chemical composition of garnets of Gondwanan sequences of Nepal (Tansen Group, western Nepal; Barahachettra and Katari groups in eastern Nepal) plotted on (Alm+Sp)-Py-Gro (adapter afted Nanayama, 1997).
Figure 6.4 Chemical composition of garnets of Gondwanan sequences of Nepal (Tansen Group, western Nepal; Barahachettra and Katari groups in eastern Nepal) plotted on Alm-Py-Sp (adapted after Nanayama, 1997).
96
Figure 6.5 Grossular contents of garnets from Gondwanan sequences of Nepal (Tansen Group, western Nepal; Barahachettra and Katari groups in eastern Nepal) plotted on Alm-Py-Sp (adapted after Nanayama, 1997).
6.5.2 Tourmaline
Tourmaline has very complex structure and is commonly considered in terms of
end-members. There is a complete solid solution between two end-member series: schorl-
elbaite and schorl-dravite. However, there is a large miscibility gap between elbaite and
dravite. Hence, tourmalines are usually described by their positions in the schorl-elbaite
series or in the schorl-dravite series. Two different plot have been prepared using Al-
Al50Fe50(tot) -Al50Mg50 ( Fig. 6.6) and Ca-Fe(tot)-Mg (Fig. 6.7). These plots Al-
Al50Fe50(tot) -Al50Mg50 show that all tourmaline grains from three different sections of
Nepal (the Tansen, Barahachettra and Katari groups) fall between Li-poor granitiods and
pegmatites and aluminous meta-pelites and meta-psammites.
97
On the Ca-Fe(tot)-Mg plot (Fig. 6.7), tourmalines from the Katari Group fall in
three different fields: Li-rich granitoids pegmatites, Li-poor granitoids pegmatites, and
Ca-poor metapelites, metapsammites. Samples from Barahachettra and Tansen groups
have fallen only between the Li-poor granitoids pegmatites and Ca-poor metapelites,
metapsammite fields. As the compositon of grains are fallen in different rock group
types, there should be different sources of rocks for these units.
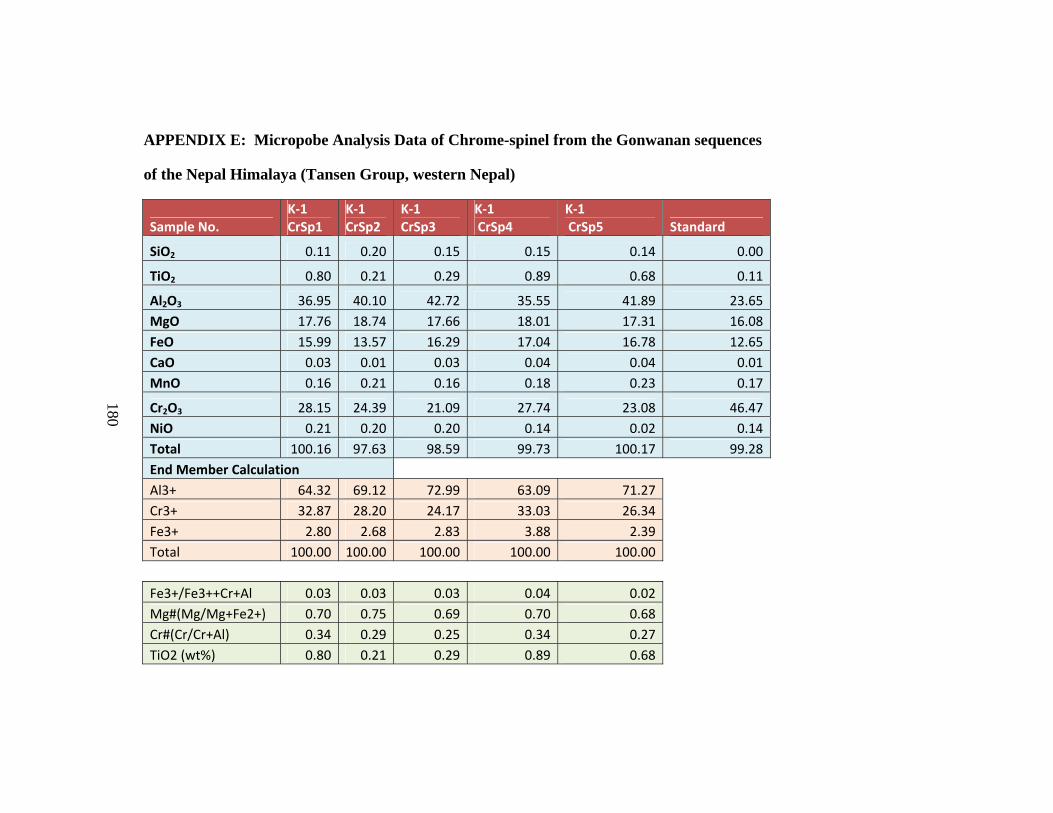
6.5.3 Chrome-spinel
Chrome-spinel was only found in the Taltung Formation of the Tansen Group.
Five grains of chrome-spinel from this unit were analyzed. The average elemental
percentage of chormium in these grains is 24.17%, with the maximum of 33.02%.
Various plots have been prepared from the compositional data of these chrome-
spinel grains to judge the source rock of the sediment. A ternary plot of Al3+-Cr3+-Fe3+
suggests Alpine-type peridotite source rock (Fig 6.8). Alpine-type peridotites have
compositions of > 95% harzburgite and originate as depleted residues of partial melting.
The lower concentration of Fe3+ also supports this scenario.
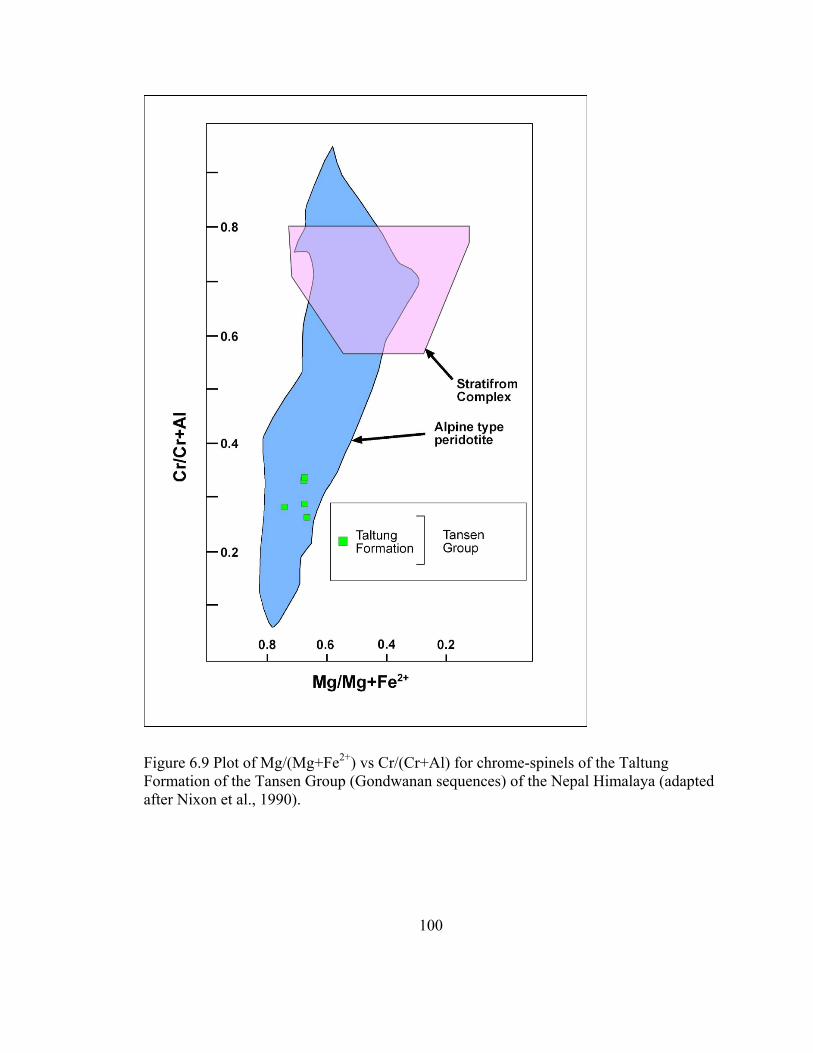
The possibility that chrome-spinels from the Taltung Formation were derived
from Alpine-type peridotite is also supported by a plot of Cr/(Cr+Al) with
Mg/(Mg+Fe2+) (Fig. 6.9). The low value of Cr# makes the grains fall in the Alpine-type
peridotite field.
The plot of Mg/(Mg+Fe3+) versus Fe3+/(Fe3++Al+Cr) (Fig. 6.10) also shows the
Alpine-type peridotite as the possible source rock. However, the plots also overlap with
98
the field of stratiform complexes. Hence, derivation of these sediments from stratiform
complex source terranes is also possible.
Figure 6.6 Al-Fe (tot)-Mg plot (in molecular proportion) for tourmalines from Gondwanan sequences of Nepal (Tansen Group, western Nepal; Barahachettra and Katari groups in eastern Nepal) plotted on Al-Al50Fe(tot)50-Al50Mg50 (adapted after Henry and Guidotti, 1985).
99
Figure 6.7 Ca-Fe(tot)-Mg plot (in molecular proportion) for tourmalines from Gondwanan sequences of Nepal (Tansen Group, western Nepal; Barahachettra and Katari groups in eastern Nepal) plotted on Ca-Fe(tot)-Mg, (adapted after Henry and Guidotti, 1985).
Figure 6.8 Ternary plot of major trivalent cations in chrome-spinels of the Taltung Formation of the Tansen Group (Gondwanan sequences) of the Nepal Himalaya with three major provenance fields (adapted after Nixon et al., 1990).
100
Figure 6.9 Plot of Mg/(Mg+Fe2+) vs Cr/(Cr+Al) for chrome-spinels of the Taltung Formation of the Tansen Group (Gondwanan sequences) of the Nepal Himalaya (adapted after Nixon et al., 1990).
101
Figure 6.10 Plot of Mg/(Mg+Fe2+) vs the ratio of trivalent cations Fe3+/( Fe3++Cr+Al) for chrome-spinels of the Taltung Formation of the Tansen Group (Gondwanan sequences) of the Nepal Himalaya (adapted after Irvine, 1974). Note that all grains fall in the overlap between Alpine and stratifrom peridotite fields.
102
6.6 DISCUSSION
6.6.1 Garnets
Garnet composition of samples from different Gondwanan sequences in Nepal
suggest different source terranes. The Katari Group, with low pyrope contents, belongs to
the amphibolite regime, while the Taltung Formation, with low grossular and spessartine
contents reflects low metamorphic grade (Figs 6.4 and 6.11). Most of the grains from the
Barahachettra Group contain both grossular and pyrope (Fig. 6.3) but have low
spessartine content. The most probable source of garnet could be the Bihar Mica Belt, the
Ranchi Supracrustal Belt and the Munger Belt of Chotanagapur Gneissic Terrain.
However, different igneous bodies, including the Malani Granite of the Delhi Supergroup
and the Vindhyan System of peninsular India also could have supplied garnets to the
Gondwanan basins of Nepal (Sakai, 1983).
6.6.2 Tourmaline
Microprobe data for tourmaline supports that the source rock for these
tourmalines are Li-poor granitoids and aluminous meta-psammities and meta-pelites (Fig.
6.6). However, the plot of Ca, Fe(tot) and Mg, suggests different types of source rocks
(Fig 6.7). The Amile Formation, which is basically rich in quartz arenite, shows a
granitoid provenance, whereas other formations show a mixed provenance of granitioids
and meta-psammites and meta-pelites. Hence, different granitic bodies of the Indian
craton as well as pelites, from Vindhyan could have contributed tourmaline.
103
Figure 6.11 Petrographic grid for the KFMASH system contoured with isopleths of XAlm in garnet (after Spear and Cheney, 1989). The isopleths are constructed assuming that garnet formed in equilibrium with biotite in a rock of pelitic bulk composition. The blue region shows the range of isopleth values for garnets from Gondwanan sequences of Nepal while solid color lines show the average of isopleth value for different rock units.
104
6.6.3 Chrome-spinel
The TiO2% versus Cr# in chrome spinels shows that these grains were derived
from mid-oceanic, island arc and alkaline basaltic sources (Fig. 6.11). However, as TiO2
contents of these chrome-spinel grains are very low which is charecteristic of alkaline
basalts, these chrome-spinel grains could have been contributed by the alkaline Aulis
Basalt considered to be equivalent to the Rajmahal Traps (Sakai, 1983; Segev, 2002).
The Cr# value for the peridotites and basalts of mid-ocean ridges is less than 0.06
with Mg# between 0.55 -0. 85 (Dick and Bullen, 1984). This tectonic setting has been
classified as Type I. Another type of tectonic setting that is also regarded as Type I
setting is depleted marginal seafloor basalts which show slightly lower value for Mg# and
narrower range of Cr# than mid-oceanic ridge basalts (MORB). The Cr# and Mg# of the
Taltung Formation indicate mid oceanic ridge type basalts or peridotite as the source of
chrome-spinels. The Cr# and Mg# for island arc basalts (Types III setting) are 0.6-0.9,
and 0.4-0.69, respectively (Cookenboo et al., 1997). Ophiolites, which have compositions
transitional between Type I and Type III are regarded as Type II settings (Dick and
Bullen, 1984).
The high aluminium and high chromium contents of the Taltung Formation also
suggest a mid-oceanic type of source rock.
105
.
Figure 6.12 Plot of TiO2 vs Cr# of Gondwanan sequences of Nepal (Tansen Group, western Nepal; Barahachettra and Katari groups in eastern Nepal) relative to spinels from various potential source rocks. MORB=Mid-oceanic ridge basalt (after Nanayama, 1992).
106
Figu
re 6
.13
Sche
mat
ic d
iagr
am sh
owin
g sp
inel
com
posi
tion
from
diff
eren
t tec
toni
c se
tting
s, in
clud
ing
thos
e of
sea-
floor
and
con
tinen
tal c
rust
orig
ins (
mod
ified
from
Coo
kenb
oo e
t al.,
19
97).
107
CHPATER 7: WHOLE ROCK CHEMISTY
7.1 INTRODUCTION
The whole rock chemistry of a sedimentary rock can provide an improved
understanding of provenance of sediments and contemporaneous and subsequent
sedimentary and weathering processes that impacted the sediments or the rock.
Composition of sedimentary rock is primarily controlled by the composition of the source
rocks and to some extent also by weathering and diagenetic processes (Dickinson, 1985;
McLennan et al., 1993,).
It is necessary to understand the weathering process and climatic conditions
during deposition of sedimentary rocks before making final interpretations on the source
rock. The chemistry of sedimentary rocks is significantly influenced by weathering of the
source rock and also post depositional diagenetic processes after the deposition of
sediments (Nesbitt and Young, 1992). The ‘Chemical Index of Alteration’ (CIA) and
ternary plot of Al2O3-(CaO+Na2O)-K2O are valuable tools to evaluate the degree of
weathering and diagenetic processes. All chemical constituents present in a source rock
do not behave in same way under a given weathering regime. When source rocks are
exposed to weathering, they become depleted in oxides that are not resistant to
weathering. Other more resistant oxides remain almost in the same amount that they were
in parent rock. The proportions of some of the major oxides, such as SiO2, Al2O3 and
K2O, have been found to be constant from source rock to the basin (Bhatia, 1983; Roser
108
and Korsch, 1988). Some trace elements (Zr, Th, Sc, Nb, Ga) and rare earth elements
(REE) are generally remain constant from source rocks to the sediment because of their
low solubility in water during weathering (McLennan et al. 1985; Bhatia and Crook,
1986). Relative concentration of resistant major oxides and trace elements present in
sedimentary rocks are valuable indicators of source rocks.
One major limitation of using whole-rock chemistry alone is the inability to detect
the mixing of different kinds of source rocks. Hence, chemical analyses should be
supported by other methods of provenance study (e.g., traditional petrography, heavy
mineral analysis, detrital geochronology, etc.). Representative sandstone samples have
been subjected to whole-rock geochemical study to aid in the interpretation of
paleotectonics and sediment provenance of Gondwanan sequences from Nepal.
7.2 METHODS
Nine representative sandstone samples were selected for the whole-rock
geochemical analysis. The selected samples representing the Gondwanan sequence
(Tansen Group) in the western part of Nepal include sample 16-1 from the Dumri
Formation, sample 15-8 from the Bhainskati Formation, sample 15-5 from the Amile
Formation, sample K-1 from the Taltung Formation, and sample 16-6 from the Sisne
Formation. Samples from the eastern part of Nepal include samples 26-3 and 26-8 from
the Katari Group, and sample 23-5 from the Tamrang Formation, and sample 22-9 from
the Saptakoshi Formation of the Barahachhetra Group.
109
Selected samples were crushed in the rock-preparation lab of the Department of
Geology and Geography, Auburn University. The size of the samples was further reduced
with a mortar and pestle to the 200 mesh. Subsamples of ~10 gm from each sample were
sent to ACME Laboratories Limited. Each sample was analyzed for 58 parameters
including major oxides, minor elements, trace elements (rare earth and refractory
elements), and precious and base metals. Major oxides, minor, rare earth and refractory
elements were determined by ‘Inductively Coupled Plasma’ (ICP) mass spectrometry
following lithium metaborate/tetraborate fusion and nitric acid digestion of 0.2-gm sub-
samples. Precious and base metals were analyzed by ICP mass spectrometer after
digesting separate 0.5-gm splits in Aqua Regia. Loss of ignition was calculated by
weighing the difference after ignition at 1000oC.
110
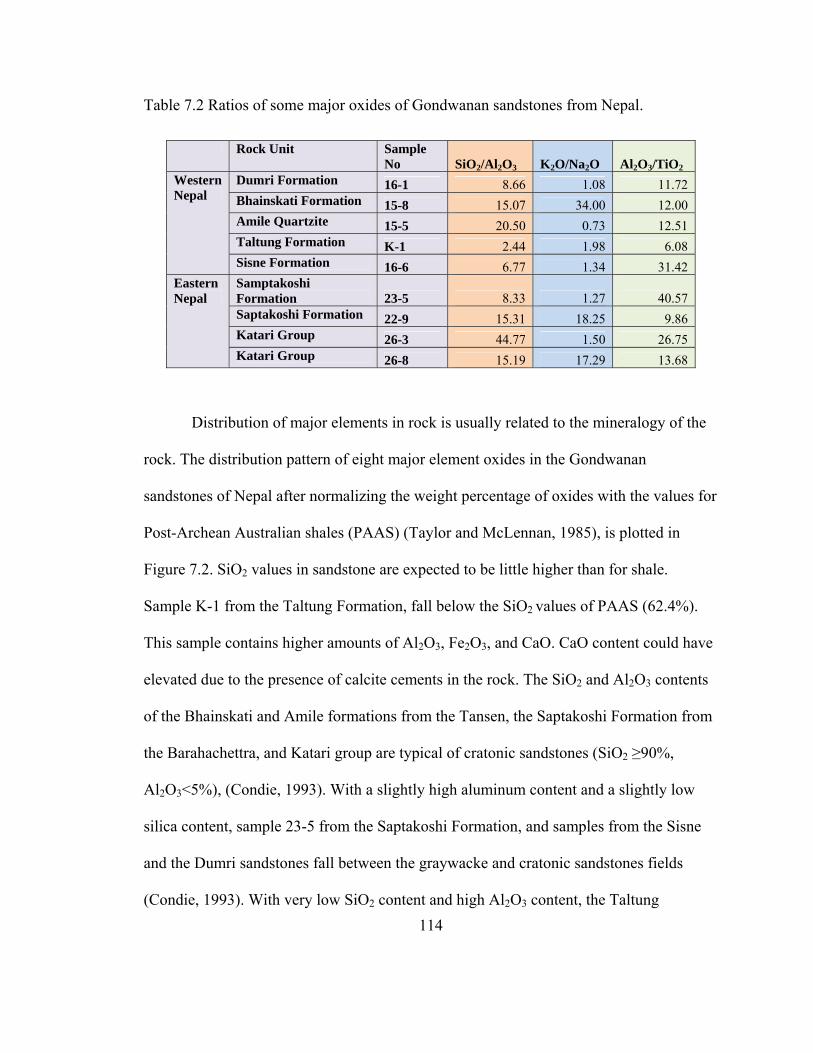
7.3 RESULTS
The results of geochemical analysis of 9 samples for 58 parameters including major
oxides, minor elements, and trace elements are given in Table 7.1.
Table 7.1 Results of whole-rock chemical analysis of Gondwanan sandstones from Nepal
Most of the trace element ratios of trace elements support that all Gondwanan
sandstones are supplied from mixed sources of felsic and mafic igneous rocks (Table
7.3). The Eu/Eu* ratio shows possible mafic source rock for the Taltung sandstone. La/Sc
values for all samples support the supply from felsic igneous rocks. Th and Sc being
incompatible and compatible respectively are used widely in provenance studies. The
calculated ratio supports a mafic igneous source only for the Sisne Formation. La/Co
ratios show that all the Gondwanan sandstones received sediment from felsic igneous
sources, while Th/Co ratio indicates the possibility of mafic igneous source for the
123
Taltung and Sisne formations. Cr/Th ratio strongly supports a mafic source for the
Taltung sandstone. The calculated Zr/Nb value of 1.95 indicates possible derivation from
alkali-olivine basalt (Rollinson, 1993).
The distribution pattern (Fig. 7.6) of trace elements of the Gondwanan sandstones
shows enrichment of some elements and depletion of others. The high value of Sr in the
samples form the Taltung Formation correlates with Eu distribution (Fig. 7.7), which is
probably due to high concentration of plagioclase. Also high Zr and Hf can be related
with zircon content of this sample. Another major departure in the distribution pattern of
trace elements is the high contents of Sr in many of samples. This also supports an
alkaline source rock where Sr can replace K. The copper content of the Taltung sandstone
is notably lower than other samples.
The distribution pattern of rare earth elements (REE), (Fig. 7.7) shows that
sample K-1 from the Taltung Formation has high LREE (Light REE, La-Sm) than HREE
(Heavy REE, Gd-Y). However, Eu value is significantly high in this sample. Generally,
initial partial melting of mantle generates magma enriched in LREE (incompatible) and
depleted in HREE (relatively compatible) (Rollinson, 1993). However, Eu is usually
incorporated in Ca-plagioclase. Very high value of Eu and also LREE in any particular
type of source rock is unusual and suggests for the mixing of source rocks or enrichment
of plagioclase by sedimentary sorting (Nance and Taylor, 1977). In comparison to
Archean basalts, post-Archean basalts are enriched in LREE (Condie, 1993). Hence, the
REE pattern of the Taltung Formation can be explained by a post-Archean basalt source
rock and sedimentary enrichment of plagioclase. Sample 26-3 from the Katari Formation
124
and the sample from the Amile Formation show relatively lower values of REE than
PAAS which is expected for quartz-rich sandstones (McLennan, 1989). The Amile
Formation is comparatively enriched LREE. Several samples, including samples from the
Dumri, Bhainskati, Sisne, Saptakoshi formations and sample 26-8 from the Katari Group,
show patterns similar to PAAS, although a few of them have slightly little lower values.
This is typical for a provenance consisting of recycled sedimentary debris and/or older
plutionic/metamorphic material with a relatively small volcanic component (Potter, 1978)
125
Figu
re 7
.6 D
istri
butio
n pa
ttern
s of t
race
ele
men
ts in
Gon
dwan
an sa
ndst
one
of N
epal
. Dat
a ar
e no
rmal
ized
to P
ost
Arc
hean
Aus
tralia
n Sh
ale
(PA
AS)
(Tay
lor a
nd M
cLen
nan,
199
5).
126
Figu
re 7
.7 D
istri
butio
n pa
ttern
s of r
are
earth
ele
men
ts (R
EE) i
n G
ondw
anan
sand
ston
e of
Nep
al. D
ata
are
norm
aliz
ed
to P
ost A
rche
an A
ustra
lian
Shal
e (P
AA
S) (T
aylo
r and
McL
enna
n, 1
995)
.
127
The relationships among some major oxides and trace elements also have been used to
trace source-rock types and tectonic setting. The immobile oxide TiO2 and immobile
trace element Zr have been used to infer the type of igneous source rock (Hayashi et al.
1997). The TiO2-Zr plot (Fig. 7.8) shows that, except for the sample from the Taltung
Formation, all units are derived from felsic igneous source rocks. Data for the Taltung
Formation suggests derivation from an intermediate source rock.
Figure 7.8 Plot of TiO2 vs Zr content of the Gondwanan sandstones of Nepal. Fields for
source rocks are drawn from Hayashi et al. (1997).
128
7.4.5 Tectonic Setting and Source Rocks
The K2O/Na2O-SiO2 discrimination diagram of Roser and Korsh (1986) is plotted
in figure 7.9. The plot suggests that Dumri sandstone of the Tansen Group fall in active
margin setting. The sample K-1 of the Taltung Formation falls in the volcanic arc setting
(Fig. 7.9). All other samples including Eocene Bhainskati sandstone fall in passive
margin setting.
Figure 7.9 Tectonic discrimination diagram for Gondwanan sandstones of Nepal.
Tectonic fields are from Roser and Korsh (1986). Tectonic setting: ARC = Volcanic Arc;
ACM = Active Continental Margin; PM = Passive Margin.
129
The trace element plot of La-Th-Sc (Fig. 7-10, adopted from Bhatia and Crook,
1986) also shows that most of the samples fall in the passive and active continental
margin fields. However, the Taltung Formation samples fall in the continental island arc
field, and the Sisne Formation samples unexpectedly falls into continental island arc
field.
Figure 7.10 Plot of elemental percentage of La-Th-Sc of Gondwanan sandstones of
Nepal. Fields of tectonic setting are drawn from Bhatia and Crook (1986).
130
CHAPTER 8
40Ar/39Ar DETRITAL MUSCOVITE DATING
8.1 INTRODUCTION
Argon is a naturally occurring noble gas occupying 0.94% of the total
atmospheric volume of the earth. The main isotopes of argon found in the earth are 40Ar
(99.6%), 36Ar (0.34%), and 38Ar (0.06%). Naturally occurring 40K, with a half-life of
1.25 × 10⁹ years, decays to stable 40Ar (11.2%) by electron capture and positron emission,
and also to stable 40Ca (88.8%) via beta decay (Scherer, 2007). As 40K in rock decays into
40Ar through the time, the ratio of 40Ar to its other isotopes will increase. The 40Ar/36Ar in
the atmospheric air is 295.5, which is taken as reference to compare with 40Ar/36Ar in
rock (McDougall and Harrison, 1999). 38Ar forms by the radioactive decay of 38Cl, 37Ar
formed from 40Ca, and 36Ar forms by the radioactive decay of 40Ca (Dickin, 1995) (Fig.
8.1).
The 40K/40Ar method of dating is based on the decay of 40K to 40Ar with a half life
of 1.25 Ga (McDougall and Harrison, 1999). This method was first applied by Wanke
and Konig (1959). The 40K/40Ar dating method and the 40Ar/39Ar method differ. In
40K/40Ar method, K is determined by independent analysis, while in the 40Ar/39Ar dating
method, 40Ar and 39Ar, produced by neutron irradiation of sample, are measured
131
simultaneously. The abundance of 39Ar in the irradiated sample is a measure of the K
content of that sample. The nuclear reaction that takes place during the irradiation is
where n denotes neutron capture and p proton emission (Faure, 1986).
In addition to 39Ar several other beneficial and undesirable isotopes are produced
during irradiation in nuclear reactors. The effects of these interference reactions are
corrected by using laboratory salt and glasses (Scherer, 2007). Table 8.1 shows the
isotopes produced during the irradiation process.
Figure 8.1 Some stable and radioactive isotopes related to 40Ar/39Ar dating method. The isotopes in yellow box are unstable isotopes. The blue arrow shows the natural decay reaction of 40K→40Ar. The red arrow shows the 39K (n,p)39ArK reaction during irradiation.
39 19 K (n, p) 39
18 Ar
132
Table 8.1 Isotopes produced during the irradiation process of muscovite.
Laboratory analytical errors listed in the appendices (Appendix –F) represent the
precision of argon isotopic measurements for the individual muscovite crystals, and
generally result in an uncertainty of about 1% in the single-crystal ages. The J-values
were constrained by placing monitor minerals in close proximity to the samples of this
study and are reproducible to within 0.5%. Combining all sources of laboratory and
monitor mineral uncertainty a resulting accuracy for the ages determined would be within
2% (or, about 200,000 years for the Miocene ages determined in this study). Thus, it is
certain that laboratory errors cannot be responsible for producing the Miocene ages in
samples of this study.
2. Sample misidentification, and mislabeling, or contamination in the field or in
the laboratory.
Samples 15-8, 16-3, and 22-8 contain muscovite with ages of calculated 500-1700
Ma that are compatible with Gondwanan source terranes in the Indian craton, and ages
less than ~ 17 Ma are not found in these samples or in sample 26-8. In contrast,
muscovite samples collected and processed for laboratory analysis in the same general
142
time frame as samples of the present study are from the Bengal Basin (with typical
muscovite ages of 14-20 Ma, and a large proportion of micas that are 15-16 Ma) and the
Appalachians (with ages of 300-450 Ma). Considerable care was taken in handling
samples, both in the field and laboratory, and sample contamination is very unlikely to be
a cause of the ages that are younger than stratigraphic assignment. Furthermore, the
modes of 19-22 Ma (see samples 26-8, 22-8, and 16-3), and the pre-500 Ma ages, are not
compatible with other laboratory samples. Therefore, there is no basis to infer sample
mishandling or laboratory contamination could be responsible for the Miocene ages
determined for these presumably pre-Cretaceous stratigraphic units.
3. Incorrect assessment of geology including (3a) stratigraphy and (3b) tectonics
of the study area.
3a. Wide-ranging and polymodal age distributions for the Bhainskati Formation
(sample 15-8) of the Tansen Group was expected. Post-Gondwanan fossils like
Nummulites beaumonti d’ARCHAIC and HEIME, and Assilina papillata NUTTLE are
reported from the Eocene Bhainskati Formation (Sakai, 1983). The Bhainskati Formation
is considered as the record of sediment source switching from Indian craton to the
Himalayan orogenic belt (Najman, 2003).
The depositional age of the Sisne Formation has been suggested to be Permo-
Carboniferous based on discovery of Fenestella, Polypora and Acanthocladia from the
Tansen area (Sakai, 1983). Sakai (1983) has suggested that this formation was supplied
sediment from cratonic India. However, muscovite dating of sample 16-3 from the Sisne
Formation unexpectedly yields few much younger age of 30 Ma and other expected older
143
ages correlatable to Indian source rocks. Notably, the Sisne Formation is overlain by the
Taltung Formation. The latter unit contains basalt flows considered to be equivalent of
Rajmahal Traps (Sakai, 1983). The age of the Rajmahal Traps is considered to be 118 Ma
(Kent et al., 2002). Thus, the Permo-Carboniferous ages inferred for regional Gondwanan
sequences in the Tansen area seem well supported.
The age distribution of sample 22-8 from the Saptakoshi Formation of the
Barahachettra Group poses a similar problem. The Gondwanan plant fossils, Schizoneura
gondwanesis FEISTM of Permian age, have been reported from the black slate of the
Barahachettra Group (Bashyal, 1980). However, occurrence of plant fossils in that area
has not been reported afterwards. The quartzite unit of the Saptakoshi Formation, which
also includes fossiliferous slate, has been kept below the diamictic beds and above
Precambrian basement rock (Bashyal, 1980, Dhital 1992). Everywhere else, diamictite
beds are reported above Precambrian basement in the Gondwanan sequences. Moreover,
the contact between the quartzite beds and Precambrian basement rocks is not an
unconformity but a normal fault. So, all these controversies make the stratigraphy of the
Barahachettra difficult to understand. The younger muscovite ages for sample 22-8 (~17
Ma) would be compatible with the Miocene Dumri Formation. However, the latter is a
litharenite and is lithologically very different than the Barahachettra quartzite unit.
Sample 26-8 of Katari Group poses similar problem. Muscovite grains from this sample
are not giving significant older age modes representing source rocks from the India
except one 290 Ma. The major age modes occur at 18 and 24 Ma (Fig. 8.5).
144
3b. The major tectonic structure of the Himalayan orogenic belt is Main Central
Thrust (MCT) (Fig. 2.1) which was activated during 25~20 Ma and reactivated during
~10 Ma (Le Fort, 1996). Another major thrust is Main Boundary Thrust (MBT) which
became activated ~3 Ma and move the Lesser Himalayan rocks above the Siwaliks.
However, there are several small scale thrusts between MCT and MBT and the area of
this study, particularly in the eastern part. MCT itself is an issue of major debate in
Himalayan geology. Several believe that the MCT is a zone rather than single plane. The
Barahachettra and Katari groups include several small scale thrusts and some of the
samples in the present study show post-depositional deformational features.
4. Thermal resetting of muscovite grains
A closure temperature of 350-400 °C has been commonly suggested for
muscovite (e.g., Hames and Bowring, 1994; McDougall and Harrison, 1999). In
metamorphic rocks, early-formed muscovite has been shown to be resistant to argon loss
during overprinting metamorphism (to temperatures of at least 425°C; Hames and
Cheney, 1997). There are also many examples of detrital muscovite that was not
completely reset during low grade metamorphism of slates (Dallmeyer and Takasu,
1992). The muscovite grains analyzed during this study shows their detrital
characteristics with well rounded shape and average diameter of grains ~0.3 - 0.5 mm
(see representative photographs in Appendix – G). So there is no possibility to get young
ages by analyzing the diagenetically formed sericitic muscovite in low temperature due to
activities of the Main Central Thrust (MCT). Quartz textures in the sandstones of this
study, including sample 26-8, include undulose extinction, sutured grain boundaries, and
145
polycrystalline grains. Such intercrystalline strain textures and disequilibrium grain
boundaries would presumably anneal if sandstone were heated to ~ 300 °C or higher for a
geologically significant length of time. MCT, which could be the only possible
deformational agent, was suggested to be active around 24 Ma (Le Fort, 1996) that may
not provide sufficient heat and time period of high temperature for resetting of muscovite.
In metamorphic rocks younger ages of muscovite has been recorded from the overgrown
muscovite due to polymetamorphism rather than the lattice diffusion due to temperature
increase (Hames and Cheney, 1997). But none of these Gondwanan samples show any
attribute of metamorphism. The loss of argon along deformed edges and cracks of
muscovite has been also reported. However, the relationship of detrital muscovite
behavior to that of metamorphic muscovite is unclear. The older, Precambrian ages
determined in this are compatible with Gondwanan sources and do not seem ‘reset’ by
younger events. Thus, on the basis of preserved detrital mineral texture (e.g., quartz
undulose extinction) and previous studies of muscovite, it is not easy to explain younger
ages by thermal resetting.
8.4 PROVENANCE INTERPRETATION
The older muscovite age mode for the Gondwanan sandstone samples can be
correlated with the ages of possible source rocks in Pennisular India, primarily the
Aravalli-Delhi Supergroup, the Malani Igneous Suite, the Bundelkhand Massif, and the
Chotnagpur Gneissic Terrain (Fig. 8.8). In addition to these igneous and metamorphic
units; the Vindhyan Supergroup, equivalent to the Lesser Himalaya, also may have been
a major contributor of sediments for the Gondwanan sequences of Nepal (Sakai, 1983).
146
Chaudhary et al. (1984) have identified five broad periods of acid magmatism in the
Delhi Supergroup, including 1700-1500 Ma which gave rise to Erinpura Granite, and
870-750 Ma, which related with the Malani Igneous Suites. These ages were obtained
from Rb-Sr geochronology. Another possible source of older muscovites could be the
Pilbara craton of Western Australia, where alkaline intrusive rocks have been dated at
1,724 Ma using 40Ar/39Ar analyses (Matchan, 2008).
Figure 8.8 Possible source rock with the age given by the detrital muscovite analyzed.
147
CHAPTER 9: DISCUSSION
9.1 SYNTHESIS
Permo-Carboniferous Gondwanan sequences of the Nepal Himalaya are mostly
continental deposits developed along a passive-margin setting. However, sequences also
include some marine beds and have been influenced by at least one event of rifting. The
setting gradually changed to a foreland basin when the Indian plate collided with the
Tibetan plate. Post-Gondwanan sequences preserve the history of this collision. The
research carried on the petrography; heavy minerals, whole-rock geochemistry, mineral
chemistry, and detrital muscovite dating of sandstones has generated two important types
of information regarding the provenance and the correlation of the Gondwanan sequences
in different sections of Nepal Himalaya.
9.2 SANDSTONE PETROGRAPHY AND STRATIGRAPHY
The Tansen Group, the type section of the Gondwanan sequence and post-
Gondwanan sequences, shows very sharp compositional variation between different time-
stratigraphic units. The Permo-Carboniferous Sisne Formation contains abundant
feldspars in sandstones that are interbedded with daimictitic beds (Sakai, 1983). Another
important character of the Sisne sandstones is common garnets. Clasts of the diamicite
are believed to have come from the Malani Granite and other associated rock units,
including the Vindhyan Group (Sakai, 1983). The depositional environment can be
148
inferred to be glacial with intervals of glacio-fluvial deposits. The Chotanagpur Gneissic
terrain of peninsular India could have been the main source for providing garnets. The
300 Ma alkaline syenite intrusive rocks in the Chotanagapur Terrain (Mahadevan, 2000)
may have been a source for the feldspars in the Sisne Formation (Fig. 4.1A).
A major shift is observed in the depositional environment of Jurassic- Cretaceous
Taltung Formation. The fluvial depositional basin was not only receiving detritus from
the southern highland in India but also accumulating volcanic rock fragments from the
rift volcanics, which are believed to be contemporary with the Rajmahal Basalt (Sakai,
1983). Diagenetic replacement of quartz and feldspars by calcite is very strong in the
Taltung Formation (Fig. 4.1B). The Late Cretaceous-Paleocene Amile Formation is
shallow-marine deposit that is dominated by mature quartz (Figure 4.2 A). Besides quartz
arenite, the sequence contains shale and limestone, which likely reflect sea-level changes
rather than shifts in source terranes.
The Eocene Bhainskati Formation contains abundant lithic fragments (Fig. 4.2B).
The Bhainskati Formation has been suggested to receive sediments from both the
Himalayan orogenic belts and as well as the Indian craton (DeCelles, 1998). The lower
Miocene Dumri Formation is considered to be a foreland deposit. It is distinguished from
other units based on low abundance of feldspar contents (DeCelles, 1998).
The Permo-Carboniferous Gondwanan sequence of the Katari area in the eastern
Nepal has not been studied well (Dhital, 2006). Petrographic study of the carbonaceous
quartzite from the Katari area shows mature quartz grains cemented by calcite. The
quartzites are deformed but the degree of deformation is variable. From perspective of
149
petrology only, the quartzite beds of the Katari section can be correlated with the Amile
Formation of western Nepal.
Dhital (1992) revised the stratigraphy of the Barahachettra area of eastern Nepal.
The Saptakoshi Formation of the Barahachettra Group consists of diamictite, quarzites,
and volcanic materials. Quartzites are carbonaceous and interbedded with gray shale.
Petrographic studies of quartzites show that these are pure quartz arenites with mature
quartz grains. However, the quartz grains are deformed in many instances. The
petrography of these quartzites as well as the alternation with the gray shale strongly
suggests correlation with the Amile Formation of the Tansen Group (western Nepal). The
sandstone beds, interbedded in diamictites, contain abundant plagioclase and garnet (Fig.
4.4 A), which suggests that the Saptakoshi Formation may be correlated with the Sisne
sandstones.
The Tamrang sandstone contains of angular to subrounded grains of quartz,
feldspar, and metamorphic rock fragments. Abundant mica is present. The matrix consists
of calcite and clay. This formation was earlier proposed to be Cretaceous-Paleocene by
Dhital (1992). However, based on high percentages of metamorphic fragments; it could
be correlated with the Bhainskati Formation of western Nepal.
The occurrence of quartzite beds below the diamictite in the Saptakoshi
Formation which is below the diamictite makes the finding of the Gondwanan fossils in
these beds suspicious. Elsewhere, in peninsular India and in extra-peninsular basins,
Gondwanan sequences always begin with a diamictite directly above the Precambrian
basement which is not consistent in the Barahachettra Group (Sakai, 1983; Dhital, 1992,
150
Veevers, 1995, Dhital, 2006). The fossils reported from the Barahachettra Group have
been never reported in that area by other workers after their first discovery by Bashyal
(1980, 1981). The unconformity considered contact between the quartzites of the
Saptakoshi Formation and the underlying Precambrian basement is actually a normal
fault.
Based on a recent communication with Dr. Meghraj Dhital, a leading expert in
Gondwana sequences of Nepal, a new stratigraphic framework for eastern Nepal is
proposed (Table 9.1) (Fig. 1).
Table 9.1 Proposed Stratigraphy of Gondwanan and post- Gondwanan sequences in the Barahachettra area (eastern Nepal) and its correlation with Gondwanan sequences in other parts of Nepal.
The 40Ar/39Ar muscovite dating of the Gondwanan sandstones carried for this
study has provided two types of ages. The older ages (>40 Ma) provide cooling ages of
muscovite crystals from igneous intrusions or metamorphic events that took place in the
Indian craton. Hence, this gives the approximate ages of source rocks. In contrast,
155
younger ages (<24 Ma) given by muscovites could have one of the reasons including
misunderstanding of stratigraphy or loss of argon from the detrital muscovites. Several
older ages of detrital muscovite grains from the Gondwanan sandstone samples may be
related with the cooling ages of the Malani igneous suites (870-750 Ma), the Erinpura
granite (1700 – 1500 Ma), the Munger orogeny (400 – 320 Ma) and or alkali syenite
intrusions ( 300 Ma) in the Chotanagpur Terrain (Fig. 9.3).
The 40 Ma age found from muscovite grains in the Eocene Bhainskati Formation
(sample 15-8) indicates the source rocks from the Himalayan orogenic belt and other
older ages going up to 900 Ma indicates source rocks from Indian craton as well. 40 Ma
could refers to the cooling ages may also be related to the Gangdese batholith (Copeland
et al., 1995).
9.7 PALEOTECTONIC SETTING During the Permo-Carboniferous, West Gondwanaland had already separated
from East Gonwananland. India together with East Gonwanaland was in the southern
hemisphere around 60o S (Fig. 9.4A). Due to initial stretching along a major lineament,
the half graben basins were created in peninsular India. At the same time, towards the
northern margin of India, glacial diamictite and glacio-fluvial deposits were being
deposited.
156
Figu
re 9
.3 40
Ar/39
Ar c
oolin
g ag
es o
f sin
gle
grai
n m
usco
vite
from
the
Gon
dwan
an sa
ndst
one
of N
epal
. The
thic
k ho
rizon
tal b
ars r
epre
sent
pub
lishe
d ge
ochr
onol
ogic
al d
ata
for p
oten
tial s
ourc
e ro
cks i
n pe
nins
ular
Indi
a an
d H
imal
ayas
.
157
During the Cretaceous, Gondwanaland was positioned around 30oS latitude and
deposition was in fluvial environments. As Australia rifted from India toward east,
several hot spots formed in India (Fig. 9.4 B), including the well-known Rajmahal Trap.
Further west, more volcanic activities were taking place, including the eruption of the
Aulis Trap, which contributed volcanic clasts to the Taltung Formation.
Due to global fall of sea level during the Late Cretaceous-Paleocene, sediments
eroding from the central region of India had to cover a longer distance. Moreover, as the
Indian continent was already in a temperate zone at that time, weathering was extreme
resulting in deposition of the Amile Formation (Fig. 9.4 C).
The collision between India and Tibet occurred by the Eocene. However, there
was still a shallow sea at the backbulge of the foreland basin (DeCelles, 1998). Sediment
derived from the Himalayan belt as well as from the Indian craton towards the south were
deposited in these shallow sea (Fig. 9.4 D).
The India-Tibet collision was complete by the early Miocene, resulting in the
complete retreat of the sea. A thick pile of sediment resulting from the rapid unroofing of
the Himalayan belt was deposited in the forebulge of the foreland (Fig. 9.4 E).
158
Figure 9.4 Paleotectonic setting of India from Permo-Carboniferous to Miocene during deposition of Gondwanan and post-Gondwanan sequences (modified after Sakai, 1989; Veevers and Tiwari, 1995; DeCelles et al., 1998) (1= Delhi-Aravalli Supergroup, 2= Bundelkhand Granite, 3= Chotanagapur Gneissic Terrain).
159
9.8 CONCLUSIONS
Based on the results of Analysis done for this research following conclusions can been
drawn:
1. Gondwanan and post-Gondwanan sequences were deposited along the northern
passive margin of India from Late Carboniferous to Early Miocene.
2. In the Barahachettra area, quartzites of the Saptakoshi Formation are not Permo-
Carboniferous in age. These quartzites are equivalent to the Paleocene-late
Cretaceous Amile Formation of western Nepal. The contact between quartzites of
the Saptakoshi Formation and underlying Precambrian basement is a fault, not an
unconformity.
3. The carbonaceous quartzite beds of the Katari area also do not belong to the
Permo-Carboniferous age. Rather, based on sandstone petrography, whole-rock
geochemistry, heavy mineral analysis and mineral chemistry of this unit suggest
that they are equivalent to the Amile Formation of western Nepal.
4. The Tamrang Formation, which contains high percentage of the lithic fragments,
could be equivalent to the Eocene Bhainskati Formation of western Nepal.
5. The older detrital muscovite ages are sensibly correlated to the source rocks in the
Aravali-Delhi Supergroup, Bundelkhand Granite, and Chotanagpur Gneissic
Terrain. Source rocks from the Himalayan orogenic belts have been inferred for
the ~40 Ma ages from the Eocene Bhainskati Formation. However, the younger
muscovites ages (< 30 Ma) are difficult to explain given our present
160
understanding and the argon-retention characteristics of muscovite along with the
regional stratigraphic and tectonic constraints for the study area.
6. Further sampling from the study area is suggested to address the problem related
with younger ages. Dating of basalt flow units from all three units may give a
better control on stratigraphy. The fossil study on the Cretaceous-Paleocene units
will be also helpful to clarify the stratigraphy.
161
REFERENCES
Amatya, K.M., and Jnawali, B.M., 1994, Geological map of Nepal: Department of Mines
and Geology, Nepal, Scale 1:1000000, 1 sheet
Acharya, S.K., 2000, Coal and lignite resources of India: an overview: Geological
Society of India, Banglore, 50 p.
Amano, K., and Taira, A., 1992, Two-phase uplift of Higher Himalayas since 17 Ma:
Geology, v. 20, p. 391-394.
Auden, J. B., 1935, Traverses in the Himalaya, Record of Geological Survey of India, v.
69, p. 123–169.
Aslam, M., Arora, M., and Tewari, R.C., 1991, Heavy mineral suite in the Barakar
sandstone of Moher sub-basin, Singrauli coalfield, central India: Journal of the
Geological Society of India, v. 29, p. 66-75.
Baksi, A.K., 1995, Petrogenesis and timing of volcanism in the Rajmahal flood basalt
province, north eastern India: Chemical Geology, v. 121, p 73-90
Azmi, R.J., and Pancholi, V.P., 1983, Early Cambrian (Tommotian) conodonts and other
shelly microfauna from the Upper Krol of Mussoorie Syncline, Garhwal Lesser
Himalaya, with remarks on the Precambrian-Cambrian boundary: Himalayan
Geology, v. 11, p. 360-372.
Bateman, R.M., and Catt, J.A., 1985, Modification of heavy mineral assemblages in
English coversands by acid pedochemical weathering: Catena, v. 12, p. 1-21.
Bashyal, R.P., 1980, Phosphatic rocks of Barakhsetra Formation: 3rd International field
workshop and seminar, Khubsugul, Ulan-bator, p. 1-9.
Bashyal, R.P., 1979, The Gondwana type of formation with phosphatic rocks in
southeastern Nepal: Report Published by Department of Mines and Geology, p. 4-
18.
162
Bhatia, M., 1983, Plate tectonics and geochemical composition of sandstones: Journal of
Geology, v. 91, p. 611-627.
Bhatia, M. R., and Crook, K. A. W., 1986, Trace element chracteristics of graywacke and
tectonic setting discrimination of sedimentary basins: Contributions to
Mineralogy and Petrology, v. 92, p. 181-193.
Bock, Barbara, McLennan, S.M., and Hanson, G.N., 1998, Geochemistry and provenance
of the Middle Ordovician Austin Glen Member (Normanskill Formation) and the
Taconian Orogeny in New England: Sedimentology, v. 45, p. 635-655.
Brookfield, M.E., 1993, The Himalayan passive margin from Precambrian to Cretaceous
Irradiation: 1/30/2009 Monitor Age 9.879E+07 Air 40Ar/36Ar: 293.0 + 1.5 Single crystal, total fusion analyses of muscovite crystals, obtained with automated laser extraction in the ANIMAL facility. Data are in Moles; samples generally run with a sensitivity of 5.1x10⁻¹⁵ moles/volt Data are corrected for interfering nuclear reactions and blanks. Errors are the standard deviation in precision, obtained by regression or averaging of measurements (8 cycles).
182
APPENDIX F (1): 40Ar/39Ar Age data of detrital muscovite from the Katari Group (eastern Nepal, sample 26-8; Permo-Carboniferous)
n 40Ar(*+atm) 39ArK 38Ar(atm+Cl) 37ArCa 36Ar(atm) %Rad R