Petroleum & Petrochemical Engineering Journal Formation Damage Evaluation of Produced Water Re-Injection Using an Advanced Software in Vertical and Horizontal Wells Pet Petro Chem Eng J Formation Damage Evaluation of Produced Water Re- Injection Using an Advanced Software in Vertical and Horizontal Wells Elkatatny SM 1 *, Farid A 2 , Mohamed I 3 , Abou-Sayed OA 4 and Block GI 5 1 King Fahd University, Formerly with advantek international, Saudi Arabia 2 Texas A&M University, Formerly with Advantek International, USA 3 Head of subsurface engineering team, Advantek Waste Management Services, USA 4 CEO, Advantek Waste Management Services, USA 5 CEO, Visual Semantics, Formerly with Advantek Waste Management Services, USA *Corresponding author: Salaheldin Elkatatny Mohamud, Department of Petroleum, King Fahd University, Formally with Advantek International, Saudi Arabia, Tel: 00966138608489; Email: [email protected]Abstract Produced water re-injection (PWRI) is often the safest and most economical method for disposal of produced water in the oil industry. Two key issues that affect the management of PWRI are the formation damage and the constrained pumping pressure at the wellhead. A simulator was developed to handle the design of single-zone or multi-zone water injection in multi-layered reservoirs. The simulator can accommodate both vertical and horizontal wells operated under matrix and/or fractured regimes. It is also able to account for the impact of formation damage and user-defined wellhead pressure constraints. Results obtained from the simulator showed good agreement with known injection behaviors. For vertical wells, injection conformance depends on KH (permeability-thickness) and the minimum horizontal stress; in the case of multi-fractured horizontal wells, the outermost fractures (those near the tip and the heel of the horizontal well) are longer than the fractures in the middle. Lastly, by constraining the maximum allowable surface pressure, frictional pressure drops in both the wellbore and fracture cause the injection rate to decline, which in turn affects both the fracture geometry and the maximum disposal volumes. Keywords: Produced water re-injection; Formation damage; Hydraulic fracture; Fracture simulator; Injectivity decline; Constraint wellhead pressure Introduction Produced water re-injection (PWRI) provides an environmentally acceptable solution to the waste water disposal, reservoir pressure maintenance and enhanced oil recovery. PWRI performance depends on a number of key factors, including water quality, formation compatibility, reservoir properties, and near-well geomechanics [1-5]. Moreover, many PWRI wells assumed to be operating under matrix injection conditions have actually become hydraulically fractured. Our results indicate that this transition from matrix to Research Article Volume 1 Issue 1 Received Date: February 23, 2017 Published Date: March 21, 2017
Transcript
Petroleum & Petrochemical Engineering Journal
Formation Damage Evaluation of Produced Water Re-Injection Using an Advanced Software in Vertical and Horizontal Wells Pet Petro Chem Eng J
Formation Damage Evaluation of Produced Water Re-
Injection Using an Advanced Software in Vertical and
Horizontal Wells
Elkatatny SM1*, Farid A2, Mohamed I3, Abou-Sayed OA4 and Block
GI5
1King Fahd University, Formerly with advantek international, Saudi Arabia
2Texas A&M University, Formerly with Advantek International, USA
3Head of subsurface engineering team, Advantek Waste Management Services, USA
4CEO, Advantek Waste Management Services, USA
5CEO, Visual Semantics, Formerly with Advantek Waste Management Services, USA
*Corresponding author: Salaheldin Elkatatny Mohamud, Department of Petroleum, King Fahd University, Formally
with Advantek International, Saudi Arabia, Tel: 00966138608489; Email: [email protected]
Abstract
Produced water re-injection (PWRI) is often the safest and most economical method for disposal of produced water in the
oil industry. Two key issues that affect the management of PWRI are the formation damage and the constrained pumping
pressure at the wellhead. A simulator was developed to handle the design of single-zone or multi-zone water injection in
multi-layered reservoirs. The simulator can accommodate both vertical and horizontal wells operated under matrix
and/or fractured regimes. It is also able to account for the impact of formation damage and user-defined wellhead
pressure constraints. Results obtained from the simulator showed good agreement with known injection behaviors. For
vertical wells, injection conformance depends on KH (permeability-thickness) and the minimum horizontal stress; in the
case of multi-fractured horizontal wells, the outermost fractures (those near the tip and the heel of the horizontal well)
are longer than the fractures in the middle. Lastly, by constraining the maximum allowable surface pressure, frictional
pressure drops in both the wellbore and fracture cause the injection rate to decline, which in turn affects both the
fracture geometry and the maximum disposal volumes.
Keywords: Produced water re-injection; Formation damage; Hydraulic fracture; Fracture simulator; Injectivity decline;
Constraint wellhead pressure
Introduction
Produced water re-injection (PWRI) provides an environmentally acceptable solution to the waste water disposal, reservoir pressure maintenance and enhanced oil recovery. PWRI performance depends on a number of
key factors, including water quality, formation compatibility, reservoir properties, and near-well geomechanics [1-5]. Moreover, many PWRI wells assumed to be operating under matrix injection conditions have actually become hydraulically fractured. Our results indicate that this transition from matrix to
Research Article
Volume 1 Issue 1
Received Date: February 23, 2017
Published Date: March 21, 2017
Petroleum & Petrochemical Engineering Journal
Elkatatny SM, et al. Formation Damage Evaluation of Produced Water Re-Injection Using an Advanced Software in Vertical and Horizontal Wells. Pet Petro Chem Eng J 2017, 1(1): 000103.
fractured injection is often essential to the long-term maintenance and successful operation of the PWRI well. PWRI performance depends critically on evolution of near-well formation damage. Both chemical and mechanical processes may lead to a loss of matrix injectivity even in highly permeable formations. Two mechanisms are often to blame: particulate matter carried within the injected water and chemical precipitates formed within the wellbore or reservoir during injection may become deposited on rock surfaces to form a heterogeneous and highly compressible filter cake that clogs the pore throats and/or fracture surfaces [6-12]. In each of these scenarios, the permeability near the well decreases and injectivity begins to decline [13]. During the period of formation damage, surface pressures are observed to increase as the desired flow rate is maintained. (Note that the maximum surface pressure may act as an important constraint.) If the bottom-hole pressure rises above the breakdown pressure, a fracture is created and the well injectivity subsequently increases: the newly formed fracture allows for a rapid increase in the accommodated fluid volume, and the fracture’s surfaces enable the injected water to leak off into undamaged rock further from the well. Continued PWRI operation causes the fracture to grow and well performance to improve. Indeed, advanced step-rate and fall-off tests are able to determine this transition from matrix to fractured injection, as well as to determine the influence of water properties, leak-off and reservoir permeability on each mode of injection.
@FRAC2D Simulator
The goal of this section is to outline a newly developed PWRI simulator that satisfies these requirements: Account for the damage that results from solids and
oil in the injected water Account for the possibility of a constrained well-head
pressure and allow injection under constant flow rate and under constant surface pressure
Permit matrix and/or fractured injection into multi-layered formations for both vertical and horizontal wells
Include effects of “stress shadowing” on the propagation of multiple fractures in horizontal wells
Incorporate “flow partitioning” within the wellbore to accurately account for dynamic changes in fluid pressures and rates in the case of multiple propagating fractures
Simulator Background
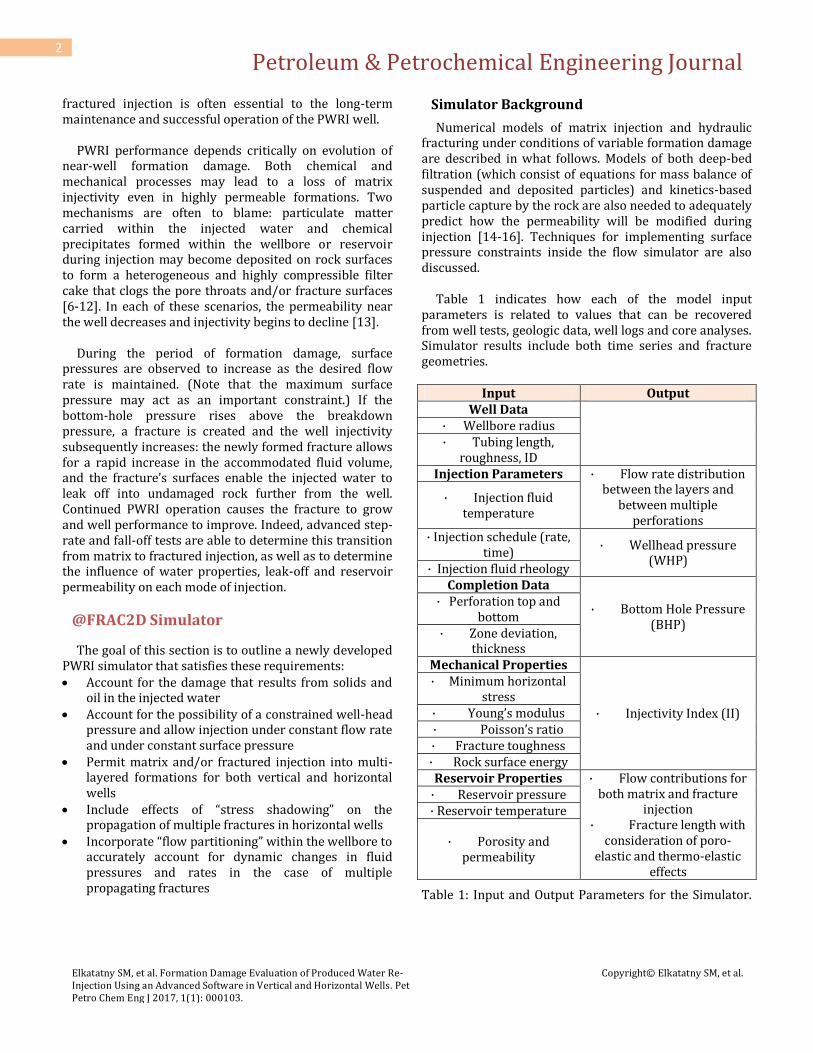
Numerical models of matrix injection and hydraulic fracturing under conditions of variable formation damage are described in what follows. Models of both deep-bed filtration (which consist of equations for mass balance of suspended and deposited particles) and kinetics-based particle capture by the rock are also needed to adequately predict how the permeability will be modified during injection [14-16]. Techniques for implementing surface pressure constraints inside the flow simulator are also discussed. Table 1 indicates how each of the model input parameters is related to values that can be recovered from well tests, geologic data, well logs and core analyses. Simulator results include both time series and fracture geometries.
Input Output Well Data
· Wellbore radius · Tubing length,
roughness, ID Injection Parameters · Flow rate distribution
between the layers and between multiple
perforations
· Injection fluid temperature
· Injection schedule (rate, time)
· Wellhead pressure (WHP)
· Injection fluid rheology Completion Data
· Bottom Hole Pressure (BHP)
· Perforation top and bottom
· Zone deviation, thickness
Mechanical Properties
· Injectivity Index (II)
· Minimum horizontal stress
· Young’s modulus · Poisson’s ratio · Fracture toughness · Rock surface energy Reservoir Properties · Flow contributions for
both matrix and fracture injection
· Fracture length with consideration of poro-
elastic and thermo-elastic effects
· Reservoir pressure · Reservoir temperature
· Porosity and permeability
Table 1: Input and Output Parameters for the Simulator.
Petroleum & Petrochemical Engineering Journal
Elkatatny SM, et al. Formation Damage Evaluation of Produced Water Re-Injection Using an Advanced Software in Vertical and Horizontal Wells. Pet Petro Chem Eng J 2017, 1(1): 000103.
Prior to fracture initiation, the simulator uses multi-zone KH (permeability-thickness) analysis, wellbore friction, and reservoir pressure to predict injectivity conformance profiles along the wellbore. The transition from matrix to fractured injection is controlled by the following condition [17]
w
iwfrv
UEP
)1(2 21
(1)
Where 1 is total stress perpendicular to the fracture:
pTH 11min1 )( (2)
Here:
Piwf = Flowing bottom-hole pressure, psi = Poisson’s ratio U = Rock surface energy, ft-lbf/sq in. E = Young's modulus, psi
minH = Minimum in-situ horizontal stress, psi
rw = Radius of the wellbore, ft The simulator models each fracture as if it were embedded within an elliptical (multi-layered) cylindrical reservoir. Each layer is assumed homogeneous. Multiple concentric reservoirs can be included to determine the extent of formation damage far from the fracture. In this case, the inner cylinder contains the fracture and is allowed to become damaged; a cylindrical reservoir containing the inner cylinder captures the effect of the background (unaltered) reservoir outside the extent of the inner zone. Dynamic equilibration between the fracture’s internal pressure and far-field pressure leads to additional terms in the total stress that acts on the fracture’s evolution:
p1 =
Temporal change (final - initial) in average interior stress perpendicular to the major axis of the ellipse resulting from a pressure difference (p
- PR) between the elliptical cylinder and the surroundings
T1 =
Temporal change (final - initial) in average interior stress perpendicular to the major axis of
the ellipse resulting from a temperature difference (T - TR) between the elliptical cylinder
and the surroundings
Fracture Propagation Model
Once the fracture has been initiated, the pressure at the fracture tip is determined using:
frv
UEp
)1(2 211
(3)
The difference between the wellbore pressure and the average pressure at the face of the fracture is determined using an expression that relates the fracture geometry, uniform leak-off and internal flow (assumed to be laminar) [18]:
fiwf pPp 1 (4)
where
4
1
43
3
)1(3
f
wf L
hv
Gip
(5)
and iw = Water injection rate, BBL/day µ = Fluid viscosity, cp Lf = Fracture half length, ft h = Reservoir thickness, ft G = Elastic shear modulus, psi
rf = Radius of the extending edge of the fracture
(equals the smaller of the two values: Lf or h/2), ft
The fracture width W is controlled by the fracture net pressure, Pnet:
W = F(Pnet) (6) Expressions for the nonlinear function F are numerically complex, but analytical examples can be found in a variety of sources.
Plugging Damage Model
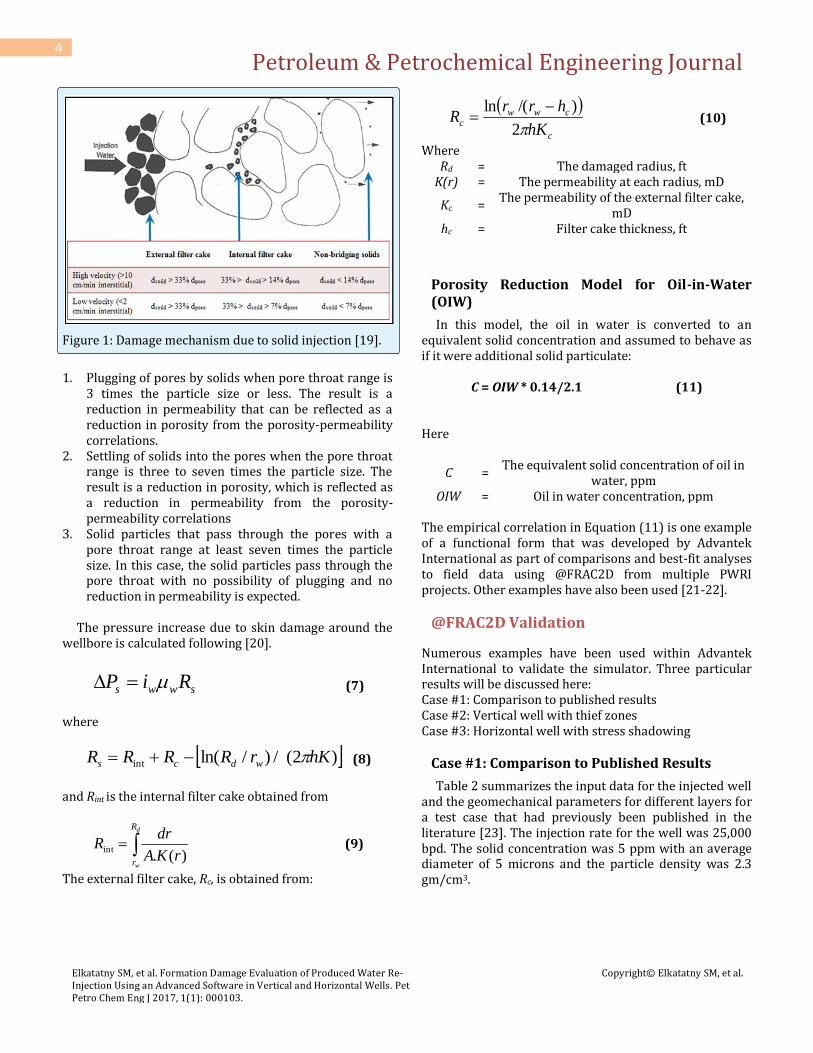
Formation damage considered in the simulator focuses on the reduction of permeability resulting from injection of solids. Three pore-scale scenarios are explored in Figure 1:
Petroleum & Petrochemical Engineering Journal
Elkatatny SM, et al. Formation Damage Evaluation of Produced Water Re-Injection Using an Advanced Software in Vertical and Horizontal Wells. Pet Petro Chem Eng J 2017, 1(1): 000103.
Figure 1: Damage mechanism due to solid injection [19].
1. Plugging of pores by solids when pore throat range is
3 times the particle size or less. The result is a reduction in permeability that can be reflected as a reduction in porosity from the porosity-permeability correlations.
2. Settling of solids into the pores when the pore throat range is three to seven times the particle size. The result is a reduction in porosity, which is reflected as a reduction in permeability from the porosity-permeability correlations
3. Solid particles that pass through the pores with a pore throat range at least seven times the particle size. In this case, the solid particles pass through the pore throat with no possibility of plugging and no reduction in permeability is expected.
The pressure increase due to skin damage around the wellbore is calculated following [20].
swws RiP (7)
where
)2(/)/ln(int hKrRRRR wdcs (8)
and Rint is the internal filter cake obtained from
d
w
R
rrKA
drR
)(.int
(9)
The external filter cake, Rc, is obtained from:
c
cwwc
hK
hrrR
2
)/(ln (10)
Where Rd = The damaged radius, ft
K(r) = The permeability at each radius, mD
Kc = The permeability of the external filter cake,
mD hc = Filter cake thickness, ft
Porosity Reduction Model for Oil-in-Water (OIW)
In this model, the oil in water is converted to an equivalent solid concentration and assumed to behave as if it were additional solid particulate:
C = OIW * 0.14/2.1 (11) Here
C = The equivalent solid concentration of oil in
water, ppm OIW = Oil in water concentration, ppm
The empirical correlation in Equation (11) is one example of a functional form that was developed by Advantek International as part of comparisons and best-fit analyses to field data using @FRAC2D from multiple PWRI projects. Other examples have also been used [21-22].
@FRAC2D Validation
Numerous examples have been used within Advantek International to validate the simulator. Three particular results will be discussed here: Case #1: Comparison to published results Case #2: Vertical well with thief zones Case #3: Horizontal well with stress shadowing
Case #1: Comparison to Published Results
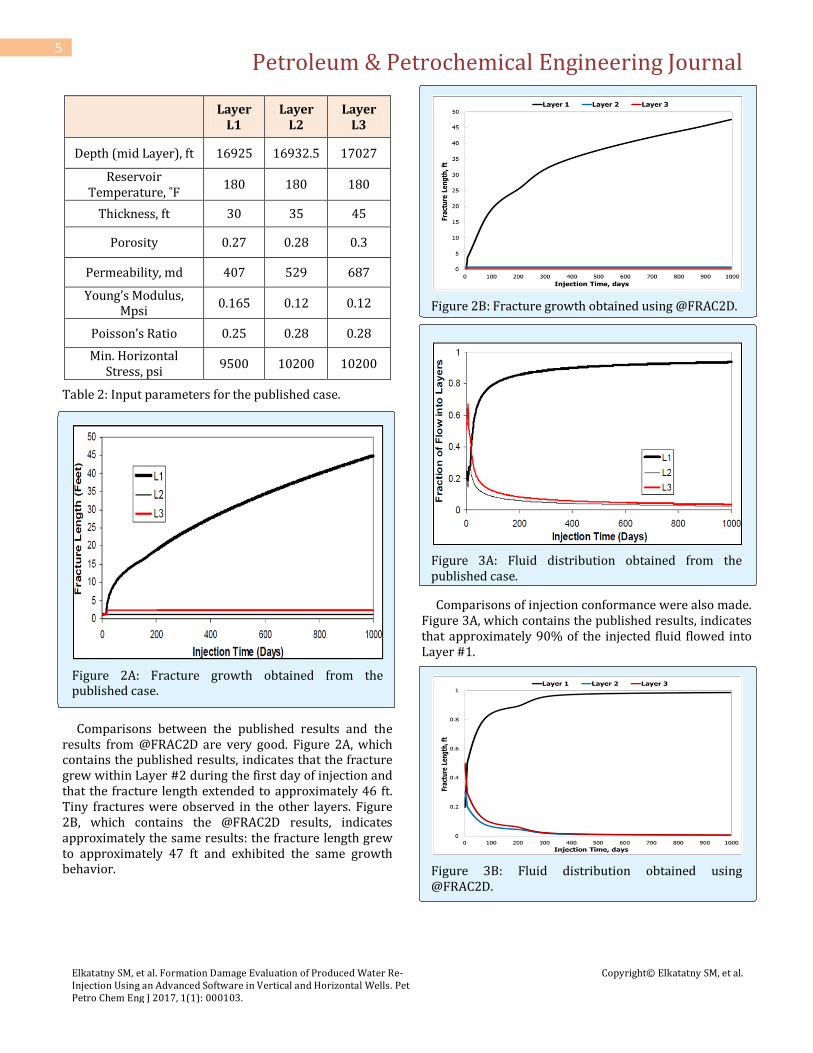
Table 2 summarizes the input data for the injected well and the geomechanical parameters for different layers for a test case that had previously been published in the literature [23]. The injection rate for the well was 25,000 bpd. The solid concentration was 5 ppm with an average diameter of 5 microns and the particle density was 2.3 gm/cm3.
Petroleum & Petrochemical Engineering Journal
Elkatatny SM, et al. Formation Damage Evaluation of Produced Water Re-Injection Using an Advanced Software in Vertical and Horizontal Wells. Pet Petro Chem Eng J 2017, 1(1): 000103.
Figure 2A: Fracture growth obtained from the published case.
Comparisons between the published results and the results from @FRAC2D are very good. Figure 2A, which contains the published results, indicates that the fracture grew within Layer #2 during the first day of injection and that the fracture length extended to approximately 46 ft. Tiny fractures were observed in the other layers. Figure 2B, which contains the @FRAC2D results, indicates approximately the same results: the fracture length grew to approximately 47 ft and exhibited the same growth behavior.
Figure 2B: Fracture growth obtained using @FRAC2D.
Figure 3A: Fluid distribution obtained from the published case.
Comparisons of injection conformance were also made. Figure 3A, which contains the published results, indicates that approximately 90% of the injected fluid flowed into Layer #1.
Figure 3B: Fluid distribution obtained using @FRAC2D.
Petroleum & Petrochemical Engineering Journal
Elkatatny SM, et al. Formation Damage Evaluation of Produced Water Re-Injection Using an Advanced Software in Vertical and Horizontal Wells. Pet Petro Chem Eng J 2017, 1(1): 000103.
Figure 3B, which contains the @FRAC2D results, indicates essentially the same qualitative and quantitative behaviors.
Case #2: Vertical Well
The simulator input and formation parameters for the vase of a vertical well are summarized in Tables 3 and Table 4. Three distinct scenarios are described below.
Injection Time 25 years
Injection Rate 35,000 bpd
Tubing Roughness 0.0001
Tubing Head Pressure 3,500 psi
Minimum Horizontal Stress, Shale σmin 0.8 psi/ft
Total Solid Concentration, TSS 5 ppm
ΔT -60 ˚F
Oil in Water, OIW 10 ppm
Poisson Ratio 0.24
Young’s Modulus for Shale, Eshale 55,0000 psi
Young’s Modulus for Sand, Esand 85,0000 psi
Sand Linear Coefficient of Thermal Expansion 6.5E-6
Shale Linear Coefficient of Thermal Expansion 4.5E-6
Tubing ID 6 inch
Table 3: The input parameters for the @FRAC2D.
Formation Parameters
Layer 1
Layer 2
Layer 3
Layer 4
K, md 2000 1000 4000 8000
h, ft 15 60 40 10
σmin, psi/ft 0.6 0.55 0.58 0.6
Top, ft 9415 9510 9620 9700
Bottom, ft 9430 570 9660 9710
Pressure, psi/ft 0.445 0.445 0.445 0.445
Table 4: The formation parameters.
Matrix Injection with No Damage: In this scenario, it was assumed that no damage would occur during injection (i.e., 100 % of the total injection solid will pass through the formation.). The wellhead pressure was assumed to be 3,500 psi.
Figure 4: Fluid distribution under matrix injection.
Figure 4 shows that the injection rate was distributed between four layers based on the various KH (permeability-thickness) values, as expected. Layer #3, which had the highest KH value, received the highest flow rate, while Layer #1 received the lowest flow rate. The injection rate was constant for the four layers during the injection time because there was no damage. This scenario confirmed that when no damage or fracturing occurs, flow portioning between the layers nearly mirrors
Petroleum & Petrochemical Engineering Journal
Elkatatny SM, et al. Formation Damage Evaluation of Produced Water Re-Injection Using an Advanced Software in Vertical and Horizontal Wells. Pet Petro Chem Eng J 2017, 1(1): 000103.
the KH distribution. Differences from this distribution are due to the effects of wellbore friction and differing reservoir pressures, which slightly decreases the flow to the deeper layers, as shown in Table 5.
Layer
1 Layer
2 Layer
3 Layer
4
KH % of total
9.1 18.2 48.5 24.2
Q % of total 9.3 19.1 48.2 35.5
Table 5: Fluid distribution is a mirror of the KH in case of no damage or fracture.
Distributed Damage: In this scenario, it was assumed that 80% of solids pass through Layer #1, 60% of solids pass through Layer #2, 90% of solids pass through Layer #3, and 100% of solids pass through Layer #4. The wellhead pressure was again assumed to be 3,500 psi. As damage accumulates, the undamaged layer acts as a thief zone which accumulates all of the flow, as shown in Figure 5.
Figure 5: Undamaged zone acts as a thief zone.
If it was assumed that 80% of the injected solids pass through the four layers and the wellhead pressure was 3500 psi. Damage accumulated in each of the layers. Layer #2 fractured after 430 days, but the fracture propagated only slightly (until it reached 2 ft long), as shown in Figure 6, Figure 7 indicates that as the fracture propagated, most of the fluid flowed in this layer (90% of the injection fluid).
Figure 6: Fracture propagation and formation plugging.
Figure 7: Fluid distribution and formation plugging. After 2,705 injection days, the fracture in Layer # 2 became completely plugged and as a result, the injected fluid distributed again through the other layers, which caused each to hydraulically fracture. As the damage accumulated in the shortest fracture, Layers #1 and #4 were plugged after 4,030 days. This resulted in all of the fluid flow redistributing to Layer #3. After 4,670 days, Layer #3 became completely plugged and injection was stopped due to complete formation plugging. Damage with Constrained Surface Pressure: In this case, it was assumed that 80% of the injected solids could pass through the formation and that the wellhead pressure was assumed to be only 1,350 psi.
Petroleum & Petrochemical Engineering Journal
Elkatatny SM, et al. Formation Damage Evaluation of Produced Water Re-Injection Using an Advanced Software in Vertical and Horizontal Wells. Pet Petro Chem Eng J 2017, 1(1): 000103.
Figure 8: Impacts of imposed constraints on the surface pressure.
Figure 8 indicates that after 110 days, the required well-head pressure reached the maximum value (of 1,350 psi) because of damage – as a result, the injected flow rate declined and no fracture were occurred in any layers. Oscillations in the predicted wellhead pressure arise because of the particular method that was used to enforce the constraint; new penalty methods are being developed to ensure that the constraint is met exactly at each time step, which results in a smooth pressure response.
Case #3: Horizontal Well
The term “stress shadow” corresponds to the stress field generated by a hydraulic fracture. This stress field impacts neighboring fractures, faults, the surrounding reservoir (and pore pressure field), as well as the wellbore itself. The increase in stress is greatest at the fracture face and fracture tip, but the stress variation extends out into the reservoir for hundreds of feet. The impact of stress shadows is essential for optimizing frac job planning in horizontal wells, since fractures are initiated simultaneously at multiple perforation clusters. @FRAC2D is able to determine how the stress field generated by each fracture (including the roles of leak-off and net pressure) will impact each of the neighboring fractures’ geometries. The results from a simple example of injection into a horizontal well are shown in Figure 9.
Figure 9: Effect of the stress shadow on the fracture length for a horizontal well.
In this case, the fractures were initiated uniformly along the wellbore. The longest fractures were found close to the heel and the toe of the well (at 72 and 75 ft, respectively), while the shortest fracture was found in the middle (52 ft in length). In general, increased compressive stresses from a dominant fracture were found to prevent the initiation of nearby parallel fractures, which provided a natural diversion mechanism along the wellbore. If fractures were initiated too close together, stress shadows tended to decrease fracture growth along the mid-section of horizontal wellbores and to encourage fracture growth at the heel and toe of the wellbores (similar to results found elsewhere [24].)
Conclusion
Results from @FRAC2D have been shown to effectively and accurately re-produce expected hydraulic fracture behaviors for a range of cases. The impact of both matrix and fracture injection can be understood, as can the role of thief zones and formation damage on injection conformance. @FRAC2D also captures formation damage caused by solids and solid settling, and oil in water during both matrix and fractured injection. Simulation results also compare very well to results from other published, benchmark cases. @FRAC2D, which considers stress changes due to thermal and poro-elastic effects, has also been shown to predict fracture containment (vertical growth) and stress shadowing (for horizontal wells with multiple, propagating fractures). The simulator can also accommodate various penalty methods to enforce facility constraints such as a maximum allowable surface pressure and constant rate or constant pressure. In
Petroleum & Petrochemical Engineering Journal
Elkatatny SM, et al. Formation Damage Evaluation of Produced Water Re-Injection Using an Advanced Software in Vertical and Horizontal Wells. Pet Petro Chem Eng J 2017, 1(1): 000103.
conclusion, @FRAC2D is a fast, numerical tool that allows an operator to understand the impact of injection fluid properties on injectivity, pump horsepower requirements, surface treatment needs, maximum disposal rates and volumes. Advantek International continues to improve the simulator’s robustness and underlying models as it is used for PWRI and other field management projects.
References
1. Pang S, Sharma MM (1997) A Model for Predicting Injectivity Decline in Water-Injection Wells. SPE Formation Evaluation Journal 12(3): 194-201.
2. Wennberg KE, Sharma MM (1997) Determination of the filtration coefficient and the transition time for water injection Wells. Society of Petroleum Engineers, SPE European Formation Damage Conference, Hague, Netherlands.
3. Detienne JL, Po V (2005) PWRI Design for Soft Sand Formations. SPE ATW Produced Water Re-Injection France.
4. Raaen AM (2005) PWRI: Analysis of Fracture Behaviour Consequences for Design. SPE ATW Produced Water Re-Injection, France.
5. Van den Hoek PJ, Bjoerndal HP (2005) Design of PWRI. SPE ATW Produced Water Re-Injection, France.
6. Barkman JH, Davidson DH (1972) Measuring Water Quality and Predicting Well Impairment. J Pet Technol 24(7): 7865-7873.
7. Rousseau D, Latife H, Nabzar L (2008) Injectivity Decline from Produced-Water Reinjection: New Insights on In-Depth Particle-Deposition Mechanisms. Society of Petroleum Engineers, SPE Production and Operations 23(4): 4525-4531.
8. Van den Hoek PJ, Matsurra T, De Kroom M, Gheissary G (1996) Simulation of Produced Water Re-Injection Under Fracturing Conditions. Society of Petroleum Engineers, European Petroleum Conference, Milan, Italy.
9. Al-Abduwani FAH, Shirazadi A, Van den Broek, WMGT, Currie PK (2003) Formation Damage vs. Solid Particles Deposition Profile during Laboratory Simulated PWRI. Society of Petroleum Engineers, SPE
European Formation Damage Conference, Hague, Netherlands.
10. Bedrikovetsky P, Marchesin D, Shecaira F, Souza AL, Milanez PV, et al. (2001) Characterization of Deep Bed Filtration System from Laboratory Pressure Drop Measurements. J Pet Sci Eng 32(2-4): 167-177.
11. Hofsaess T, Kleinitz W (2003) 30 Years of Predicting Injectivity After Barkman and Davidson: Where are we Today?. Society of Petroleum Engineers, SPE European Formation Damage Conference, Hague, Netherlands.
12. Zhang NS, Somerville JM, Todd AC (1993) An Experimental Investigation of the Formation Damage Caused by Produced Oily Water Injection. Society of Petroleum Engineers, Offshore Europe, Aberdeen, United Kingdom.
13. Alvarez AC, Bedrikovetsky P, Hime G, Marchesin D, Rodriguez JR (2006) A Fast Inverse Solver for the Filtration Function for Flow of Water with Particles in Porous Media. Invpro 22(1): 69-88.
14. Herzig JP, Leclerc DM, Le Goff P (1970) Flow of Suspensions through Porous Media-Application to Deep Filtration. Industrial Engineering Chemistry 62(5): 8-35.
15. Ochi J, Detienne JL, Rivet P, Lacourie Y (1999) External Filter Cake Properties During Injection of Produced Waters. Society of Petroleum Engineers, SPE European Formation Damage Conference, Netherlands.
16. Detienne JL, Ochi J, Rivet PA (2005) A Simulator for Produced Water Reinjection in Thermally Fractured Wells. Society of Petroleum Engineers, SPE European Formation Damage Conference, Sheveningen, Netherlands.
17. Perkins TK, Gonzales JA (1985) The Effect of Thermoelastic Stress on Injection Well Fracturing. SPE Journal 25(1): 78-88.
18. Perkins TK, Kern LR (1961) Widths of Hydraulic Fractures. J Pet Technol 13(9): 9937-9949.
19. Bennion DB, Bennion DW, Thomas FB, Bietz RF (1998) Injection Water Quality-A Key Factor to Successful Water flooding. J Can Pet Technol 37(6): 53-62.
Elkatatny SM, et al. Formation Damage Evaluation of Produced Water Re-Injection Using an Advanced Software in Vertical and Horizontal Wells. Pet Petro Chem Eng J 2017, 1(1): 000103.
20. Prasad KS, Bryant SL, Sharma MM (1999) Role of Fracture Face and Formation Plugging in Injection Well Fracturing and Injectivity Decline. Society of Petroleum Engineers, SPE/EPA Exploration and Production Environmental Conference, Austin, Texas, USA.
21. Thro ME, Arnold KE (1994) Water Droplet Size Determination for Improved Oil Treater Sizing. Society of Petroleum Engineers, SPE Production & Facilities 12(2).
22. Janssen P (2000) Characterization of oil-water mixtures produced in high-water cut oil wells. Faculty of Civil Engineering and Geosciences, Department of Applied Earth Sciences. Delft, Delft University of Technology. PhD.
23. Sharma MM (2006) REPSEA Produced Water Forum.
24. Fisher MK, Heinze JR, Harris CD, Davidson BM, Wright CA, et al. (2004) Optimizing Horizontal Completions Techniques in the Barnett Shale Using Microseismic Fracture Mapping. Society of Petroleum Engineers, SPE Annual Technical Conference and Exhibition, Houston, USA.