August 6, 2020 from 3:00-4:00 pm ET PFAS Removal in Drinking Water Treatment Systems EPA turns 50 this year! Join us in our year-long anniversary celebration. epa.gov/50 Disclaimer: The views expressed in these presentations are those of the authors and do not necessarily represent the views or policies of the U.S. Environmental Protection Agency. Any mention of trade names or commercial products does not constitute EPA endorsement or recommendation for use.
Transcript
August 6, 2020 from 3:00-4:00 pm ET
PFAS Removal in Drinking Water Treatment Systems
EPA turns 50 this year! Join us in our year-long anniversary celebration.
epa.gov/50
Disclaimer: The views expressed in these presentations are those of the authors and do not necessarily represent the views or policies of the U.S. Environmental Protection Agency. Any mention of trade names or commercial products does not constitute EPA endorsement or recommendation for use.
Removing PFAS from drinking water can be an expensive proposition. It is known that three treatment processes can be effective for PFAS removal: granular activated carbon, ion exchange resins, and high-pressure membrane systems. The optimal choice between these technologies is a balance between many factors such as water quality, PFAS to be removed, level of removal, capital cost, operating costs, operational complexity, footprint of the system, residual handling, and desire to avoid unintended consequences to other aspects of the treatment and distribution of the water. Also, even with the choice of the optimal technology, the design of the system will impact whether it is effective or not.
This webinar will provide an overview of treatment issues and the EPA models that are available free to the public, along with examples of how they can be used. The information generated from the models will provide states and utilities with a better understanding of the fundamentals of carbon adsorption and what that means to the operation, performance, and costs associated with this technology. The first part of the webinar will cover the background treatment issues. The second portion of the webinar will be a step-by-step tutorial on where to find the models, how to download the models, and how run them.
Overview
• Background of USEPA PFAS Treatment Research • USEPA’s Models
• Demonstration of Performance Models How to download Example runs
3
EPA’s PFAS Drinking Water Research
Problem: Utilities lack treatment technology cost data for PFAS removalAction: • Gather performance and cost data from available sources (DOD, utilities,
industry, etc.)• Conduct EPA research on performance of treatment technologies including
home treatment systems• Update EPA’s Treatability Database, Treatment Models and Unit Cost Models • Connect EPA’s Treatability Database to EPA’s Unit Cost Models for ease of
operation• Model performance and cost, and then extrapolate to other scenarios• Address treatment impact on corrosion• Evaluate reactivation of granular activated carbonImpact: Enable utilities to make informed decisions about cost-effective treatment strategies for removing PFAS from drinking water
4
Model Scenarios
• Variable source waters
• Variable PFAS concentrations in source water
• Alternate treatment goals
• Changing production rates
• Different reactivation/disposal options
• Document secondary benefits
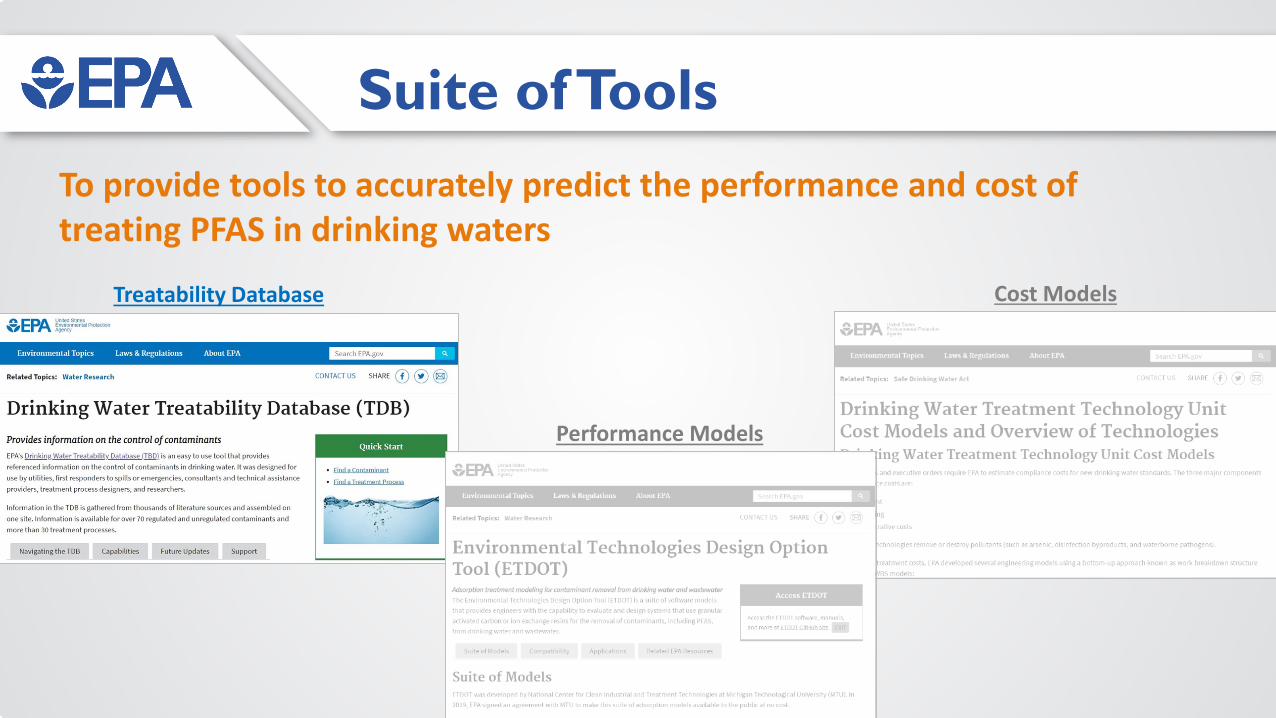
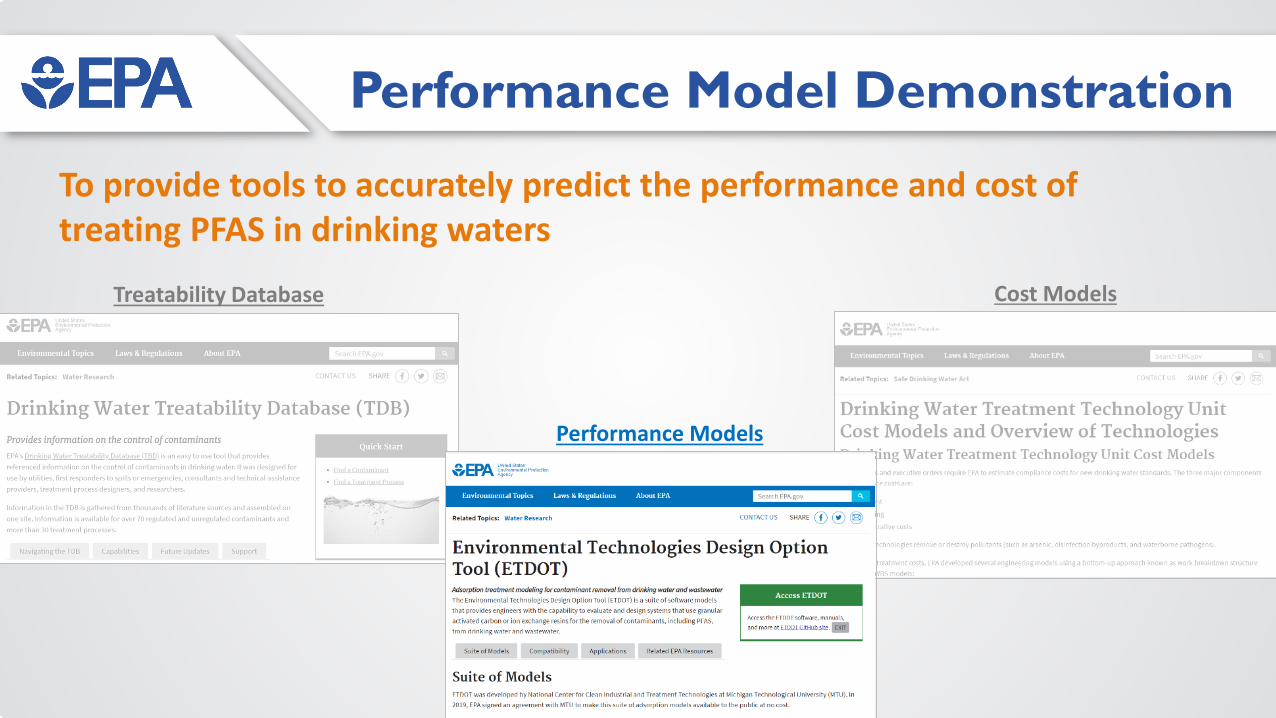
Cost Models
To provide tools to accurately predict the performance and cost of treating PFAS in drinking waters
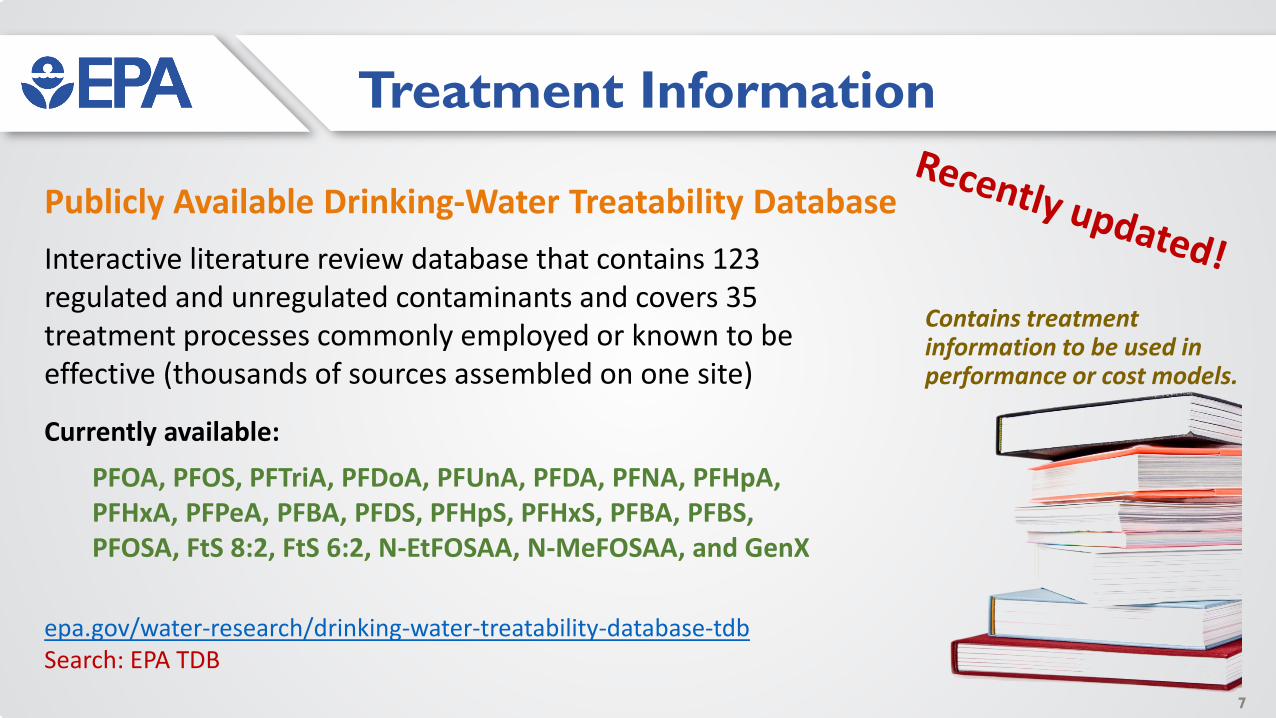
Interactive literature review database that contains 123 regulated and unregulated contaminants and covers 35 treatment processes commonly employed or known to be effective (thousands of sources assembled on one site)
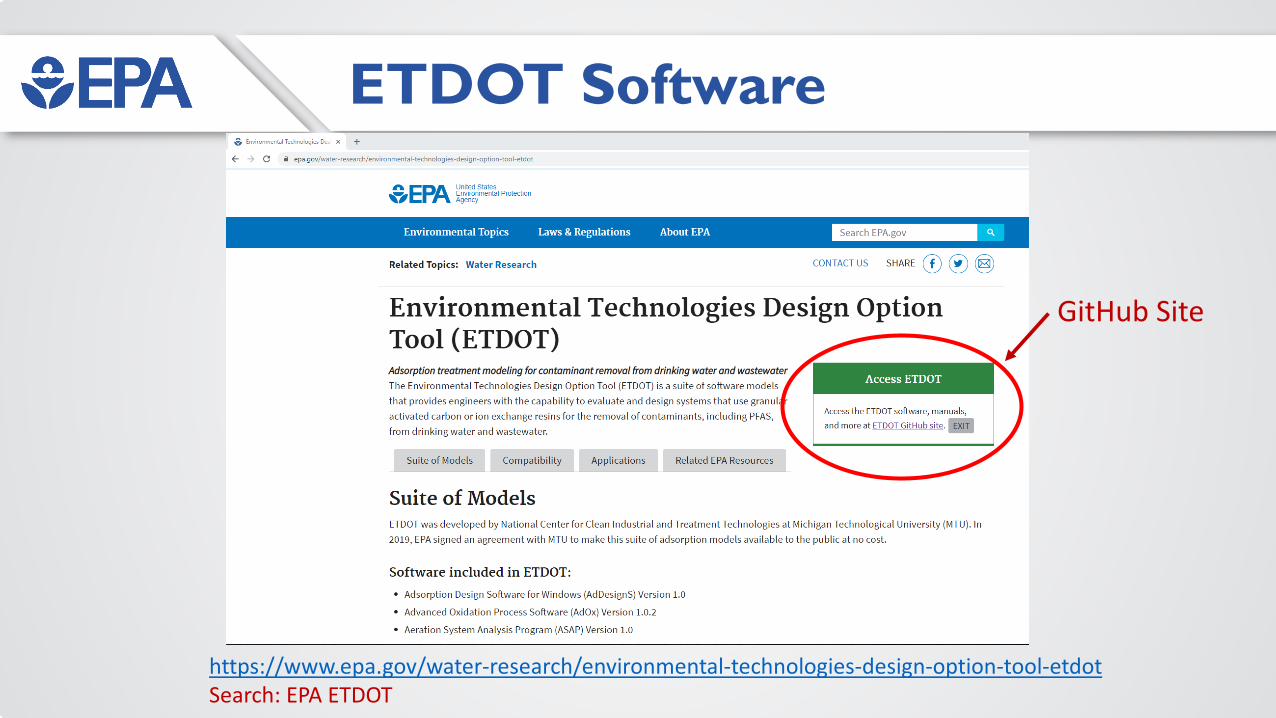
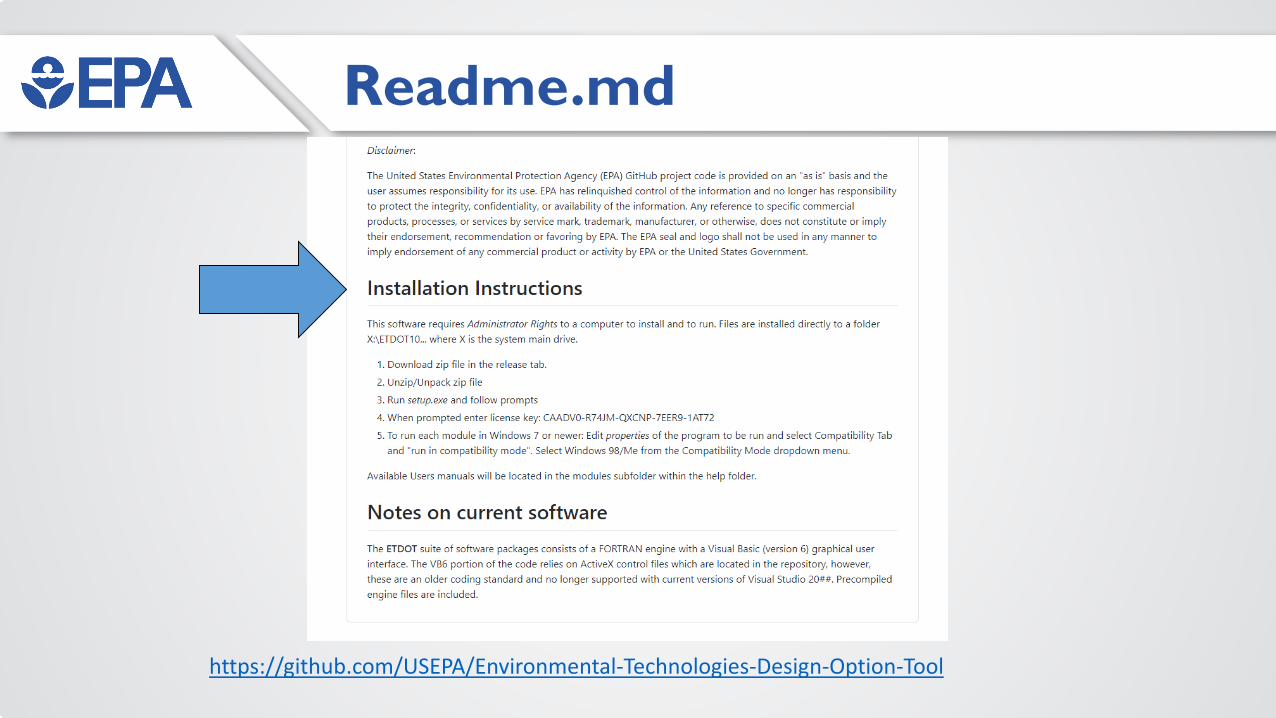
ETDOT Modeling ToolA number of years ago, a series of treatment models, data sets, and parameter estimation tools were put together under the moniker of the Environmental Technologies Design Option Tool (ETDOT) at Michigan Technological University (MTU). ETDOT was developed by National Center for Clean Industrial and Treatment Technologies.
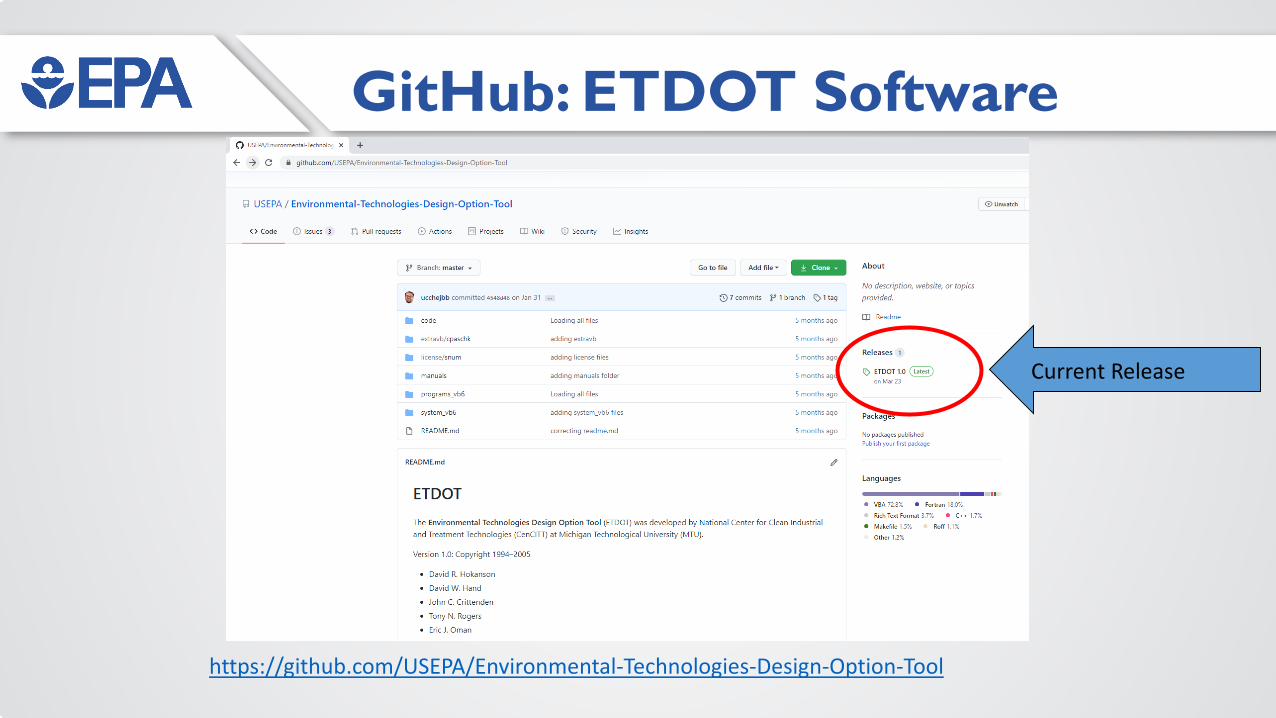
Members of the ETDOT team were David Hand, John Crittenden, David Hokanson, Eric Oman, Tony Rogers, Alex Mayer, Jim Mihelcic, and numerous graduate students and collaborators through the years.
The models were sold as a package for numerous years. In 2019, EPA signed an agreement with MTU to make this suite of water and air treatment models available to the public at no cost.
Modeling Agreement
15
The engines are written in FORTRAN with a Visual
Basic front end.
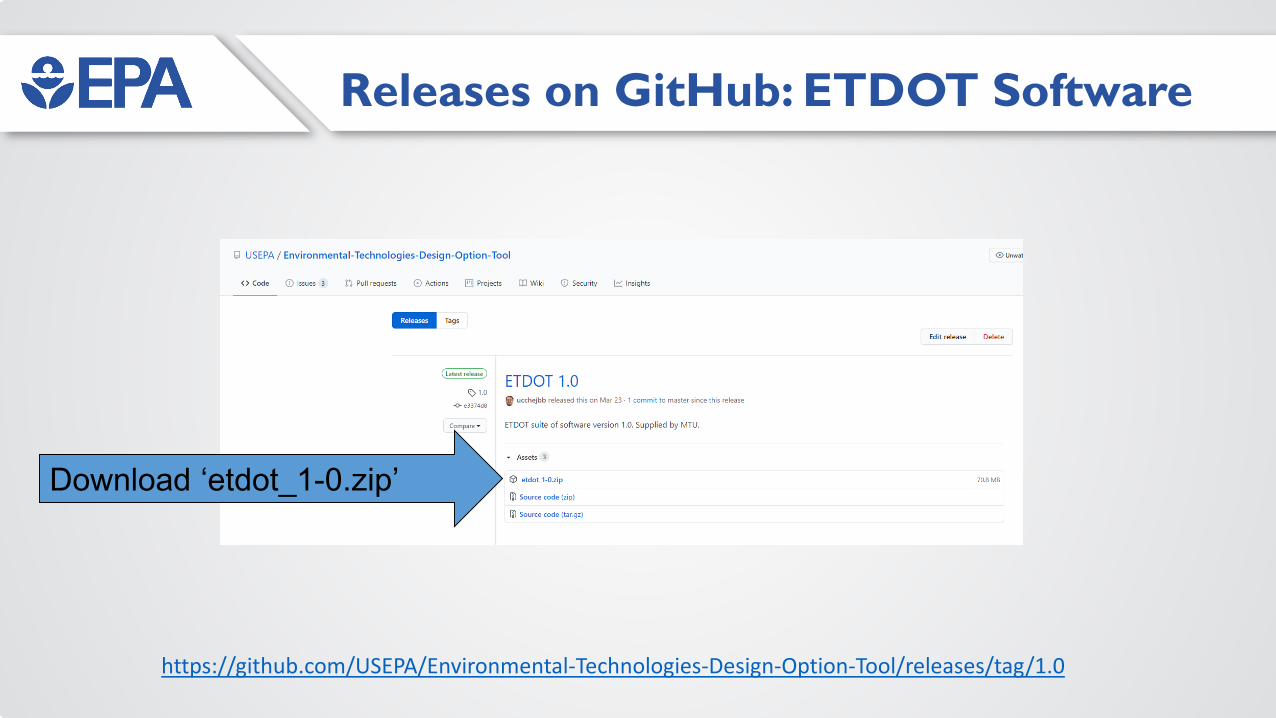
Available Modeling Tools
Models available at the GitHub site…• Adsorption Design Software for Windows (AdDesignS) Version 1.0• Advanced Oxidation Process Software (AdOx) Version 1.0.2• Aeration System Analysis Program (ASAP) Version 1.0• Biofilter Design Software Version 1.0.27• Continuous Flow Pore Surface Diffusion Model for Modeling
Powdered Activated Carbon Adsorption Version 1.0• Dye Study Program (DyeStudy) Version 1.0.0• Predictive Software for the Fate of Volatile Organics in Municipal
Wastewater Treatment Plants (FaVOr) Version 1.0.11• Ion Exchange Design Software (IonExDesign) Version 1.0.0• Software to Estimate Physical Properties (StEPP) Version 1.0
It is expected that these established and new models will be useful to the following entities:
• Consulting engineers• University academicians• Water utilities with experience in running models• State primacy personnel interested in evaluating data sets
Expected Interest
ETDOT Modeling Tool
Incorporation of Complex Mechanisms
Flow
Surface diffusion
Film transfer resistance
Pore diffusion
17
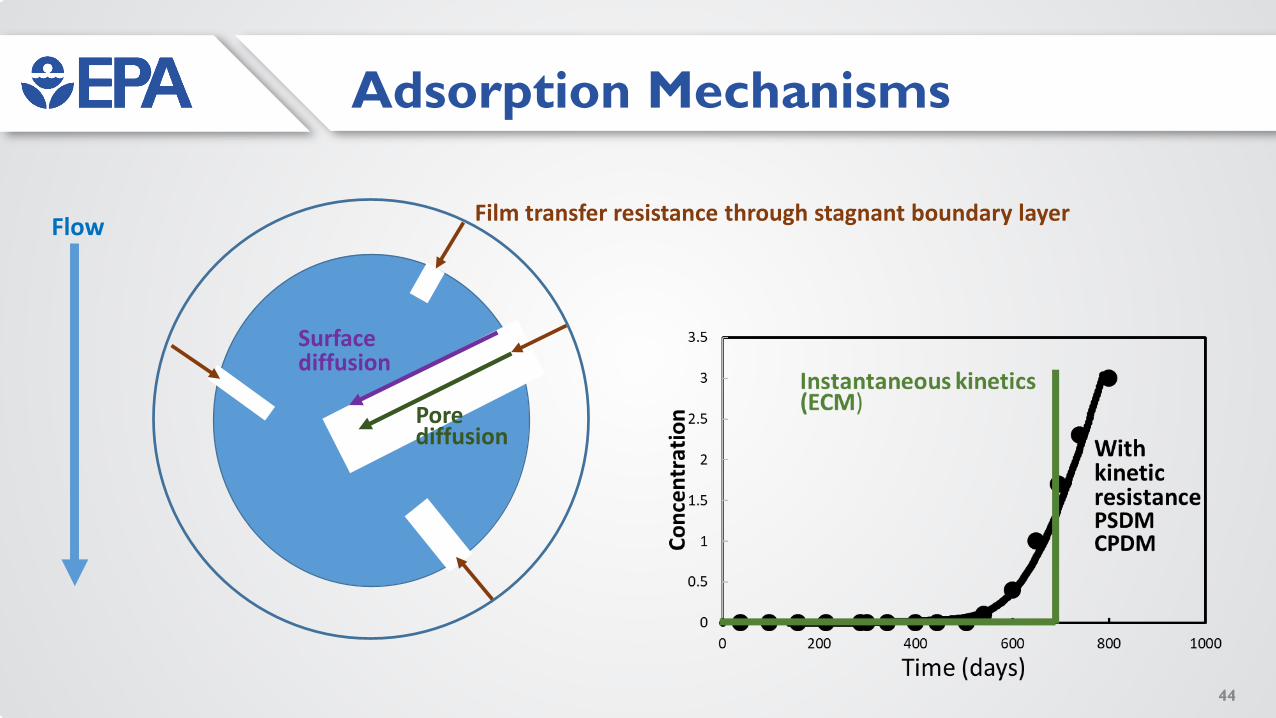
Instantaneous kinetics
With fouling/preloading that reduces capacity and slows down kinetics
Example: GAC Model
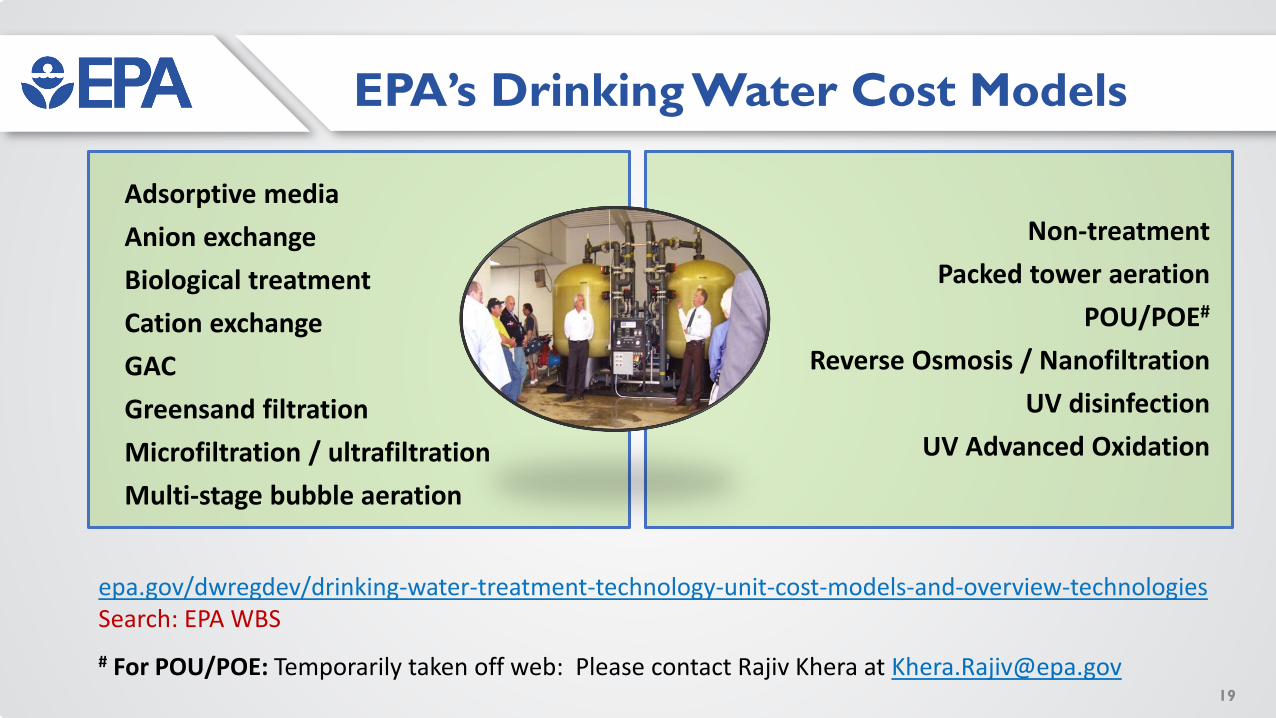
Cost Models
To provide tools to accurately predict the performance and cost of treating PFAS in drinking waters
epa.gov/dwregdev/drinking-water-treatment-technology-unit-cost-models-and-overview-technologiesSearch: EPA WBS # For POU/POE: Temporarily taken off web: Please contact Rajiv Khera at [email protected]
• Similar to nitrate and perchlorate, under certain conditions, POU devices can be the low-cost alternative to centralized treatment for PFAS although a state/utility will have to resolve other implementation concerns.
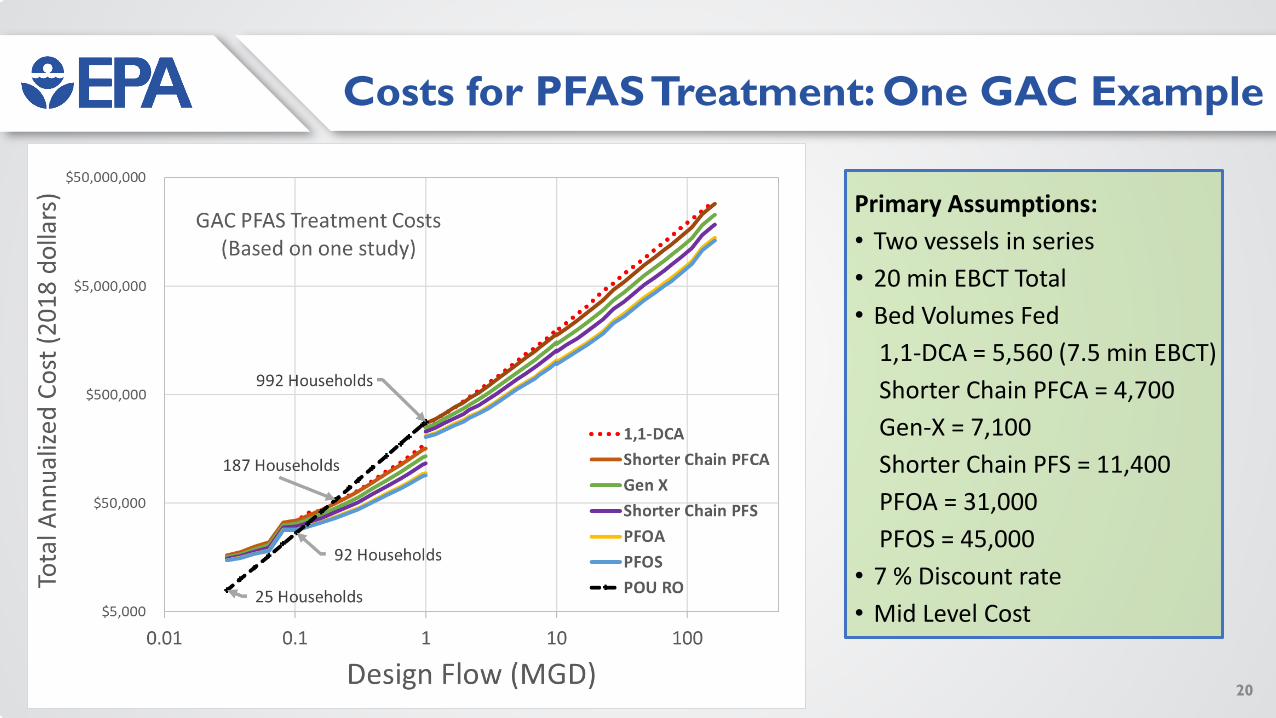
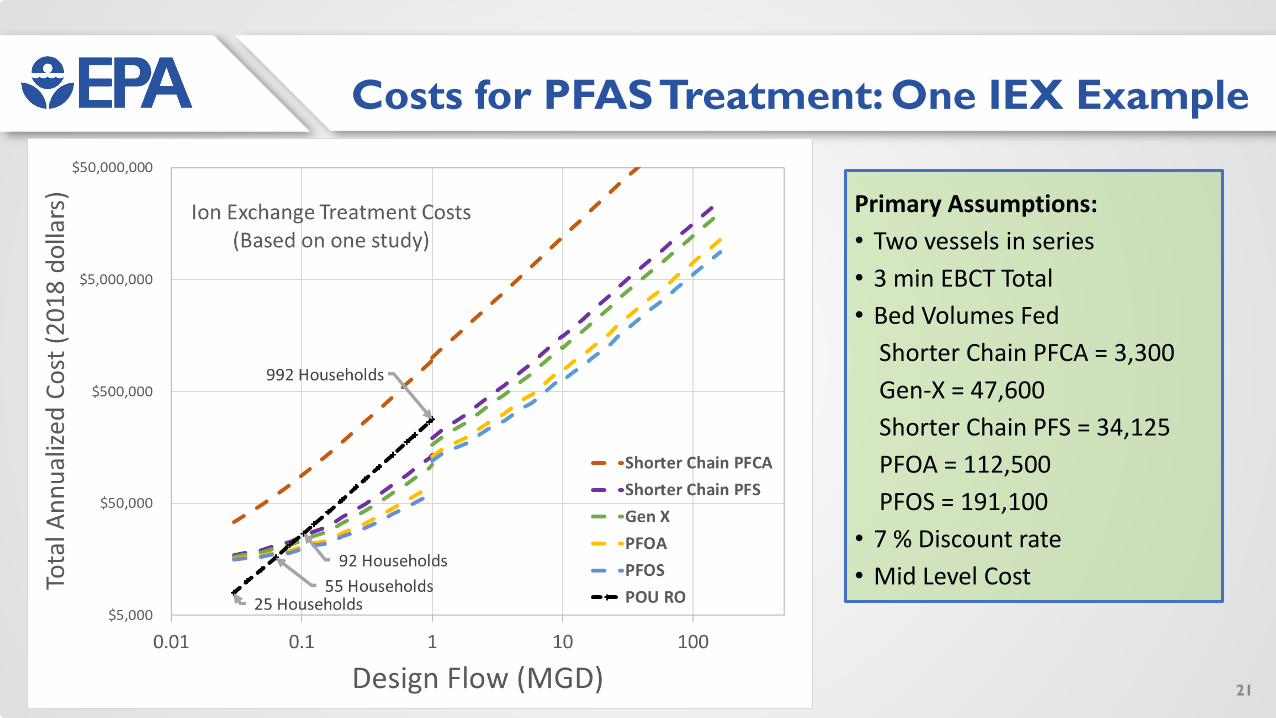
• In this instance, the cost of controlling PFAS by centralized GAC treatment is possible. Ion exchange is similar except for shorter chained PFCA, in this case.
• Although GAC showed many fewer bed volumes fed to breakthrough than ion exchange, the cost was similar to ion exchange treatment.
• Note: This exercise herein was based on one pilot study, data from additional sites will be needed for an exhaustive evaluation. Also, an evaluation at other relevant treatment goals and conditions is needed.
22
Granular Activated Carbon Systems Reverse Osmosis SystemCould experience contaminant breakthrough if the carbon change-out schedule is not followed. Frequent change out of smaller system GAC.
Unlikely to have contaminant breakthrough unless membrane has integrity issues.
May not be effective on short-chain PFAS Treats many long- and short-chain PFAS No residual stream except for spent media Disposal of concentrate waste stream (20-50% of flow)
may be an issueNo corrosion issues to deal with Corrosion control in household plumbing may be an
issue for point-of-entry water treatmentFor large GAC system, cold water temperature not affected because of flow on demand – no holding tank. For small system, holding tank is required.
Like the small GAC system, holding tank is required. Residents may complain about room temperature “cold water”
Potential issues with logistics, cost, and safety of carbon replacement
Potential issues with sanitizing components and replacing cartridges & tubing on a regular basis
Household GAC and RO POE Systems
23
24
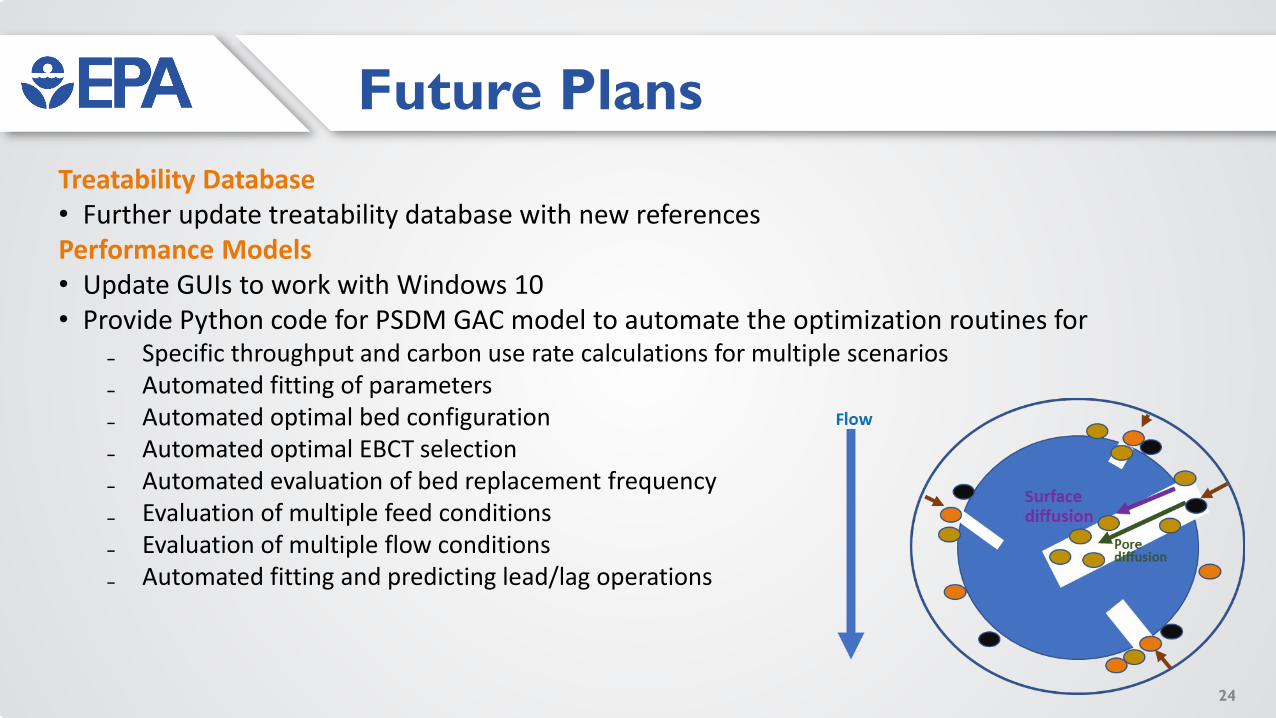
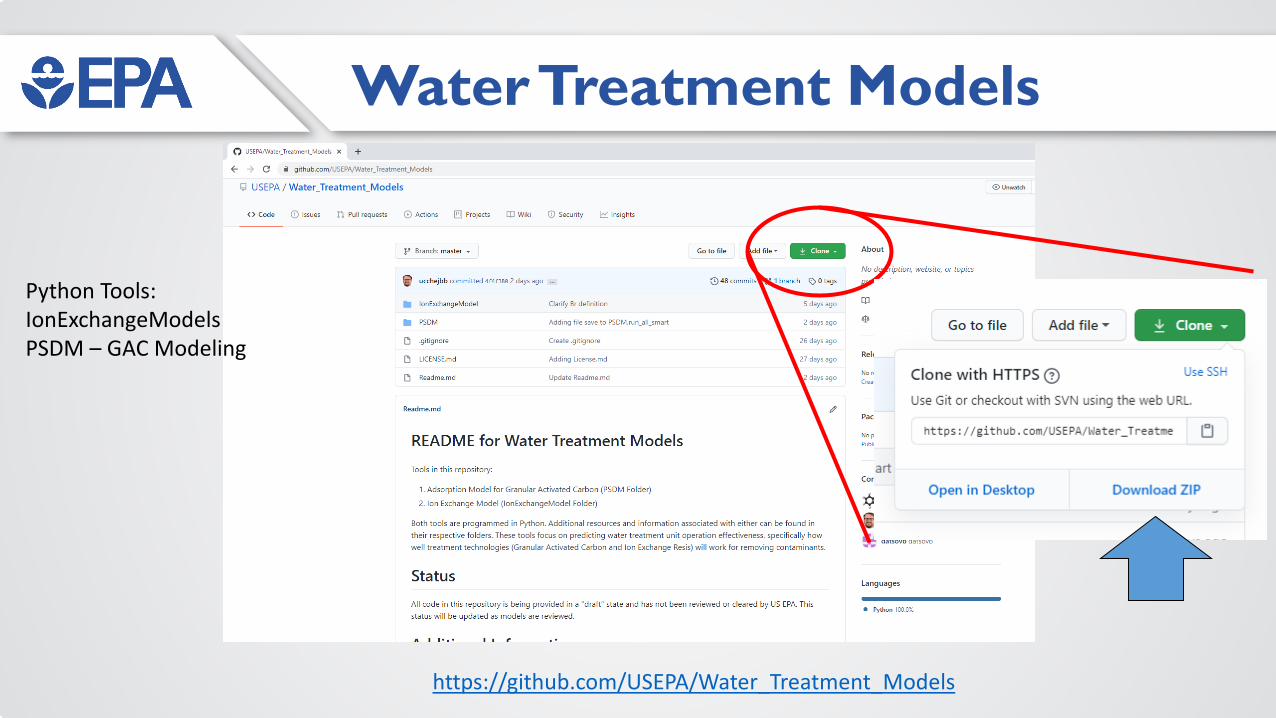
Treatability Database• Further update treatability database with new referencesPerformance Models• Update GUIs to work with Windows 10• Provide Python code for PSDM GAC model to automate the optimization routines for
₋ Specific throughput and carbon use rate calculations for multiple scenarios₋ Automated fitting of parameters₋ Automated optimal bed configuration₋ Automated optimal EBCT selection₋ Automated evaluation of bed replacement frequency₋ Evaluation of multiple feed conditions₋ Evaluation of multiple flow conditions₋ Automated fitting and predicting lead/lag operations
Future Plans
25
Performance Models (continued)• Provide code for ion exchange models for
₋ Include competition (e.g., inorganic ions, and PFAS)₋ Continuous flow (columns) and batch (isotherm and
kinetics)₋ Gel (HSDM) and macroporous (PSDM) resins₋ with automation features
Cost Models• Further updates to the cost modelsCombined Models• Further merge Treatability Database, performance models,
and cost models• Further merge the Treatability Database with EPA’s
CompTox Chemicals Dashboard
Future Plans
Cost Models
To provide tools to accurately predict the performance and cost of treating PFAS in drinking waters
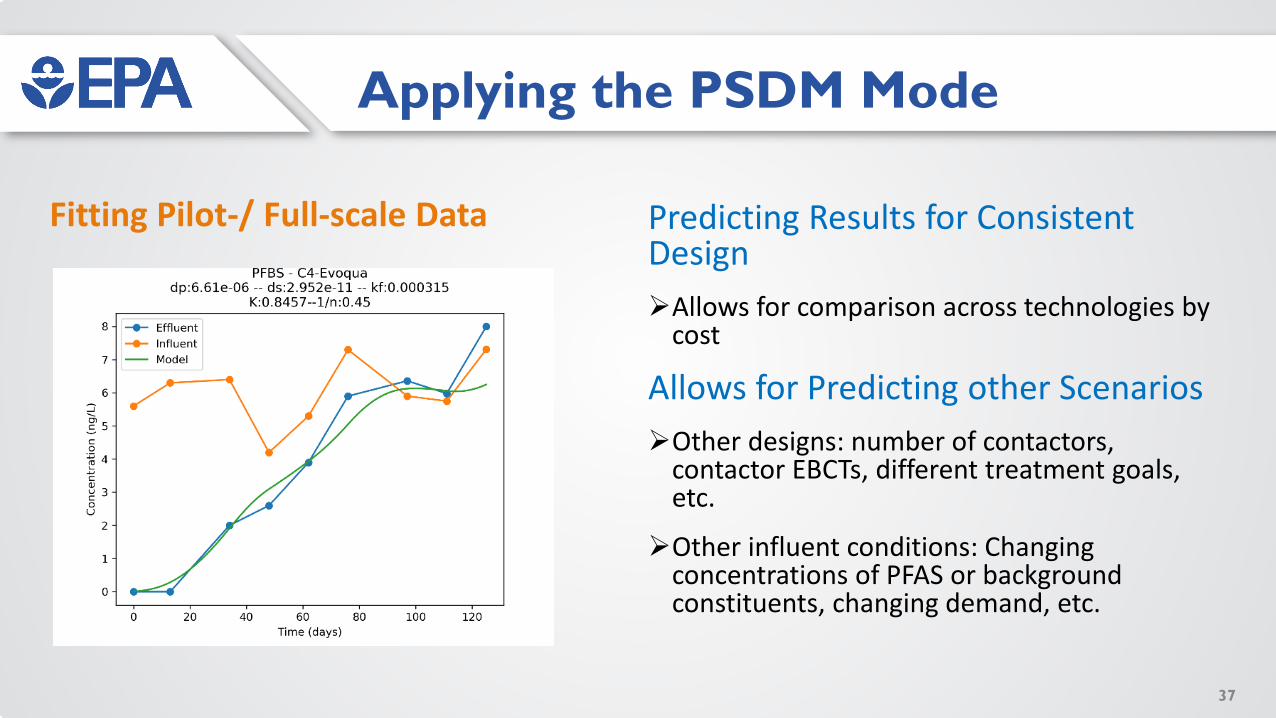
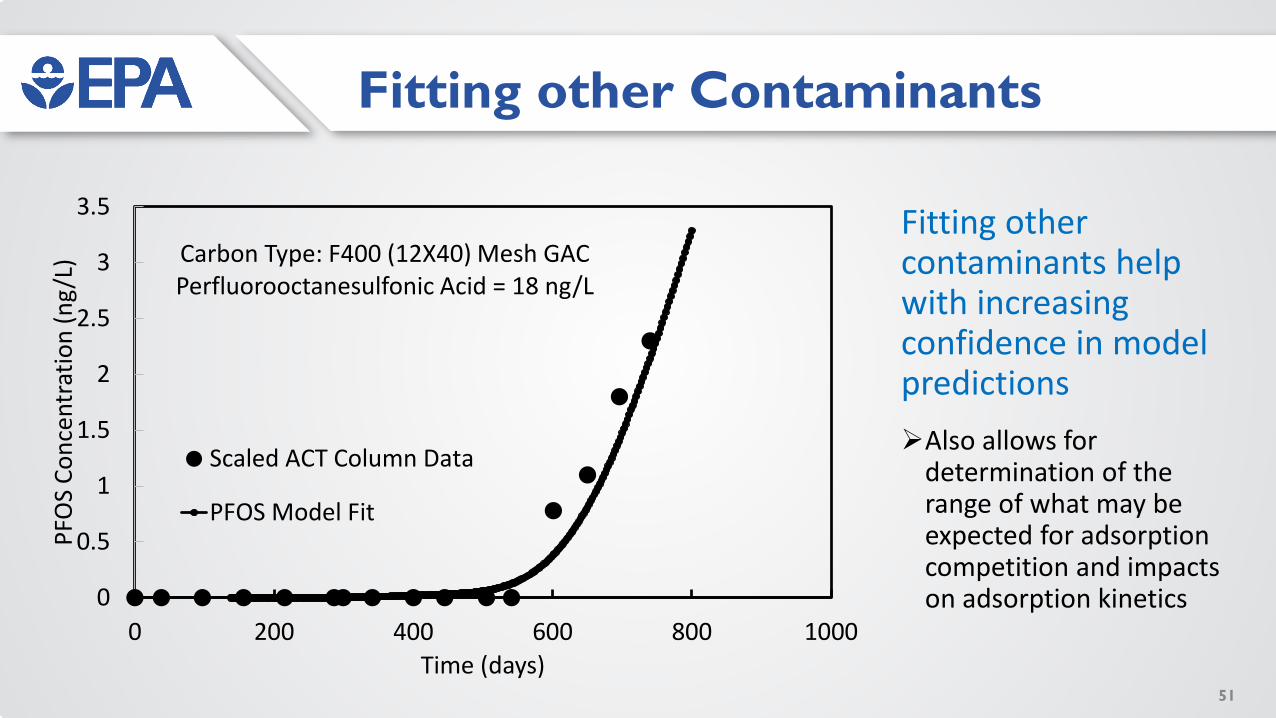
Predicting Results for Consistent DesignAllows for comparison across technologies by
cost
Allows for Predicting other ScenariosOther designs: number of contactors,
contactor EBCTs, different treatment goals, etc.
Other influent conditions: Changing concentrations of PFAS or background constituents, changing demand, etc.
Fitting Pilot-/ Full-scale Data
37
Impact of Bed Size for other Conditions
Example: What is the optimal EBCT choice in the future? The models can evaluate
EBCT for various PFAS for different PFAS at different influent concentrations, effluent goals, etc.
0
20
40
60
80
100
120
0 5 10 15 20
Spec
ific
Thro
ughp
ut (m
^3/k
g)
EBCT (minutes)
Relationship Between Specific Throughput and EBCT
PFOA
PFOS
PFBS
PFHpA
PFHxA
PFPeA
PFBA
Co = 100 ng/L, Cto = 2 ng/L
38
Design/Operation Evaluations
Example: How should the beds be deployed and replaced? The models can evaluate how many and how often beds need to be brought online or replaced
39
Lead/Lag Operation Evaluations
Example: What advantage can be gained with a lead/lag configuration? The models can predict this increased carbon use rate. Note: Lead/lag operations can complicate modeling efforts, especially for those that take
NOM fouling/preloading into effect.
40
#2#1 #3#2 #4#3
After a certain breakthrough (1st
or 2nd column), a fresh column is added to the back of the train.
After a similar breakthrough point, a fresh column is added to the back of the train again.
In an ideal situation, the first column would be completely saturated to maximize the use of the carbon.
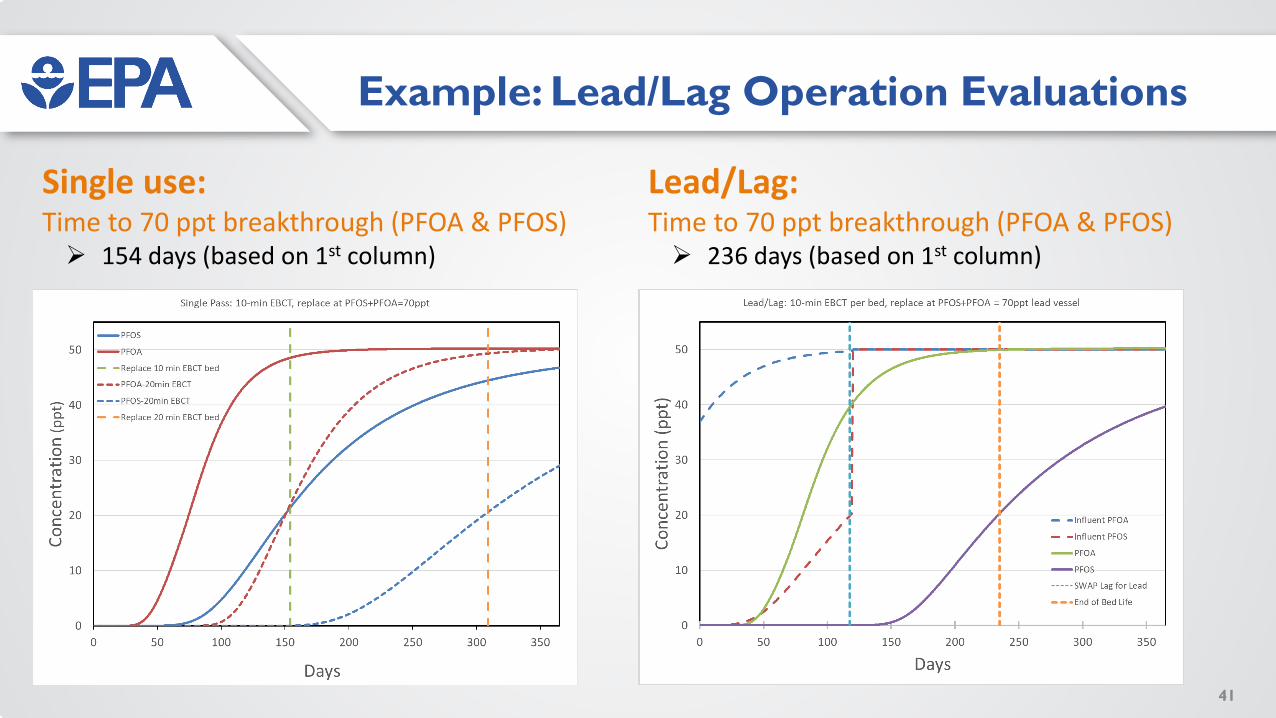
Example: Lead/Lag Operation Evaluations
Single use: Time to 70 ppt breakthrough (PFOA & PFOS) 154 days (based on 1st column)
41
Lead/Lag: Time to 70 ppt breakthrough (PFOA & PFOS) 236 days (based on 1st column)
Film transfer resistance through stagnant boundary layer
Pore diffusion
44
Adsorption Mechanisms (with preloading)
Flow
Surface diffusion
Film transfer resistance
Pore diffusion
45
Organic moleculesIronManganese
Sontheimer, H.; Crittenden, J. C.; Summers, R. S.; Frick, B. R.; Fettig, J.; Hörner, G.; Hubele, C.; Zimmer, G. Activated Carbon for Water Treatment; 2 ed.; DVGW-Forshungsstelle, Engler-Bunte-Institut, Univ. of Karlsruhe, FRG. Distributed by AWWA Research Foundation.: Denver, CO, 1988.
GAC Column ModelingAdDesigns Package • Equilibrium column model (ECM)
₋ Used to predict simple breakthrough in multi-component mixtures (Ideal adsorbed solution theory - IAST)₋ Ignores mass transfer resistance (vertical breakthrough profiles)
• Constant Pattern Diffusion Model (CPDM)₋ Used for single solute breakthrough when computational time is at a premium ₋ For favorably adsorbed compounds, the mass transfer zone will increase until it attains a constant shape₋ Assumes that the bed length is long enough and loading rate is low enough for the mass transfer wave to
become constant • Pore Surface Diffusion Model (PSDM)
₋ Used for the most complex GAC modeling efforts₋ Multicomponent mixtures (IAST)₋ Accounts for external diffusion resistance, pore diffusion, surface diffusion₋ Can incorporate NOM pre-loading or GAC fouling mechanisms (select fouling parameters are provided)
Because processing speeds have increased tremendously in recent decades, there is less need for the ECM or CPDM; however, there are still times when they come in handy.
46
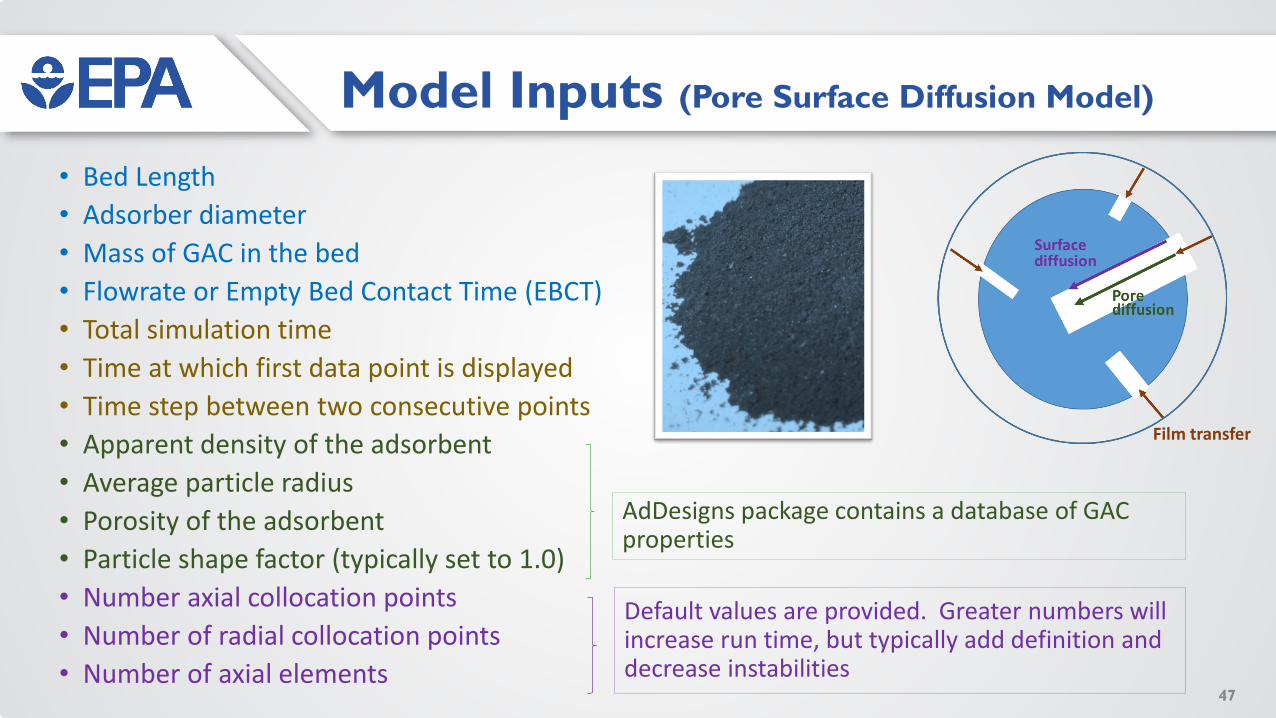
Model Inputs (Pore Surface Diffusion Model)
• Bed Length • Adsorber diameter• Mass of GAC in the bed• Flowrate or Empty Bed Contact Time (EBCT)• Total simulation time• Time at which first data point is displayed• Time step between two consecutive points• Apparent density of the adsorbent• Average particle radius• Porosity of the adsorbent• Particle shape factor (typically set to 1.0)• Number axial collocation points• Number of radial collocation points• Number of axial elements
AdDesigns package contains a database of GAC properties
Default values are provided. Greater numbers will increase run time, but typically add definition and decrease instabilities
47
Film transfer
Model Inputs (Pore Surface Diffusion Model Cont’d)
• Contaminant molecular weight• Contaminant concentration (can be variable)• Contaminant Freundlich K and 1/n• Film mass-transfer coefficient
Gnielinski correlation provided: molar volume of contaminant (MW/density), water viscosity, liquid density, bed void fraction, interstitial velocity
• Pore diffusion coefficient From liquid diffusivity coefficient (Hayduk and Laudie) plus tortuosity: molar volume of contaminant (MW/density), water viscosity, tortuosity
• NOM preloading fouling adjustment • Must choose a fouling correlation (factors for six waters are provided),• must choose a fouling correlations (factors for eight contaminants provided, factors for other
compounds can be found in Magnuson and Speth (2005) based on QSPRs approach, but are not available in AdDesignS yet), and
• must click the “Use Pore Diff. Corr. For Tortuosity” button in Kinetics page
AdDesignS package contains a database of contaminant properties including K and 1/n and correlation packages for estimating K and 1/n. See also EPA’s Treatability Database.
48
Data Needs for Fitting Field Data
• Influent concentrationsPFASs (both removal targets and other PFASs)Other competing contaminants Influent water characteristics (TOC) to help choose fouling factor
• Study scale (RSSCT, pilot-, or full-scale)• Type of GAC tested• Bed operation (e.g.., lead lag operation)• Definition of breakthrough associated with a given bed life value. For example, does
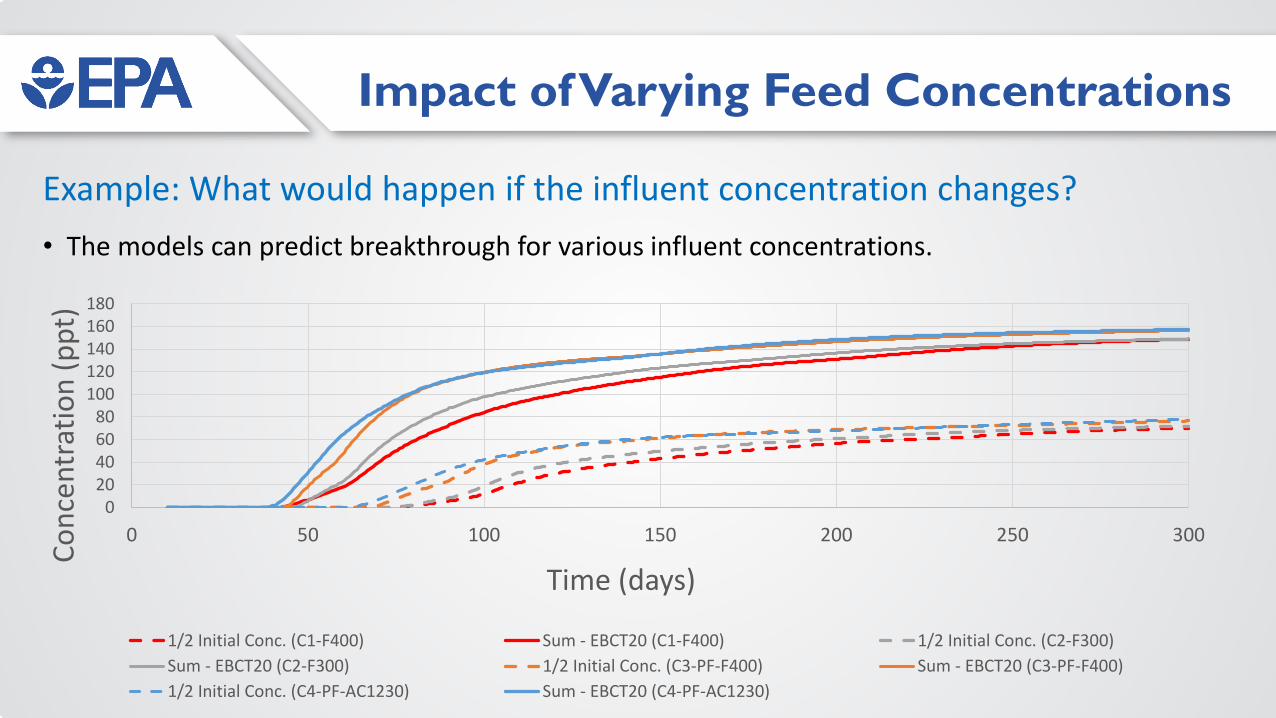
1/2 Initial Conc. (C1-F400) Sum - EBCT20 (C1-F400) 1/2 Initial Conc. (C2-F300)Sum - EBCT20 (C2-F300) 1/2 Initial Conc. (C3-PF-F400) Sum - EBCT20 (C3-PF-F400)1/2 Initial Conc. (C4-PF-AC1230) Sum - EBCT20 (C4-PF-AC1230)
Example: What would happen if the influent concentration changes?• The models can predict breakthrough for various influent concentrations.
Impact of Bed Size
0
50
100
150
200
250
0 5 10 15 20
Spec
ific
Thro
ughp
ut (m
^3/k
g)
EBCT (minutes)
Relationship Between Specific Throughput and EBCT
PFOA
PFOS
PFBS
PFHpA
PFHxA
PFPeA
PFBA
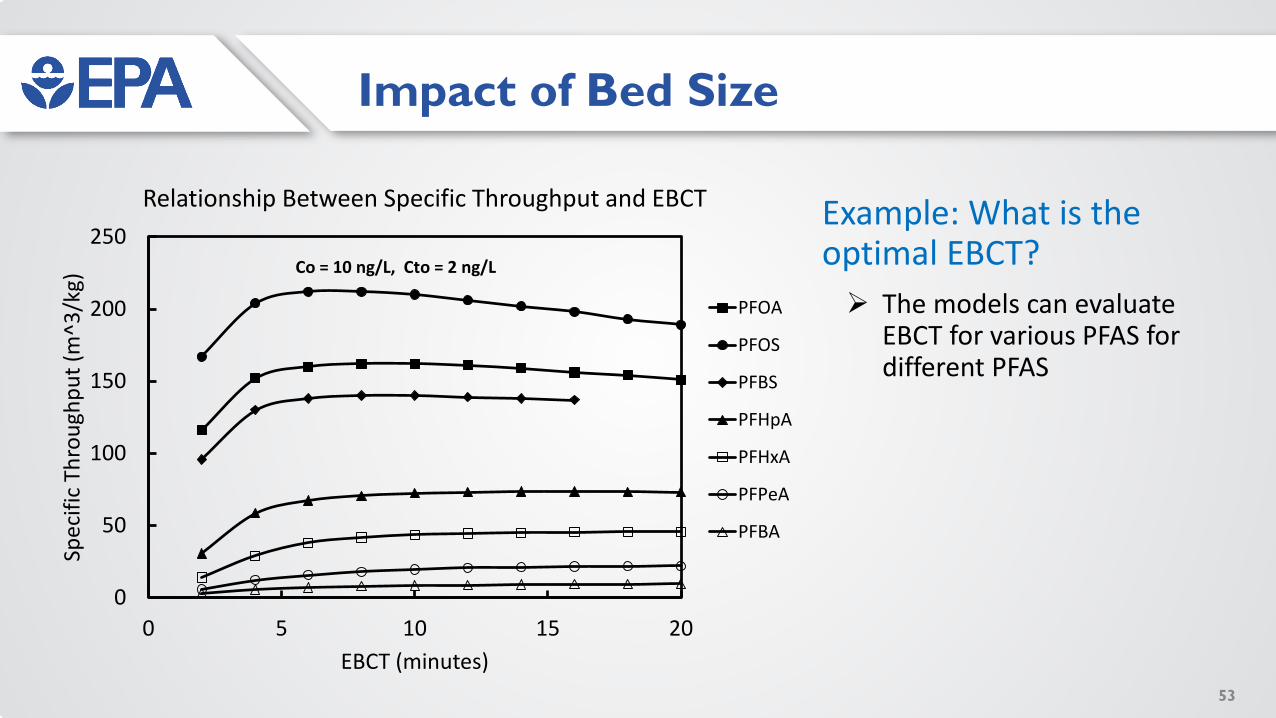
Co = 10 ng/L, Cto = 2 ng/L
Example: What is the optimal EBCT? The models can evaluate
EBCT for various PFAS for different PFAS
53
Design/Operation Evaluations
Example: How should the beds be deployed and replaced? The models can evaluate
how many and how often beds need to be brought online or replaced for various bed depths (EBCTs).
54
Cost Modeling: Additional Data Needs
As-built costs:• Installed equipment cost• System engineering and other indirect cost• Annual operating cost
The more detail, the better:• Detailed breakdown of cost by line item• Total cost with list of categories included, for example:
Equipment includes vessels, piping, valves, instrumentation, concrete pad, buildings Indirect includes engineering, permitting, pilot testing, site work, mobilization Operating cost includes media replacement, labor, electricity
Associated flow rates, vessel sizes, materials of construction for major components (e.g., stainless steel, fiberglass)