PFC Energy 50 Te Defnitive Annual Ranking othe World’s Largest Listed Energy Firms January 2010 Strategic Advisors in Global EnergyCombined Value of PFC Energy 50 Climbs 35% • The combined market capitalization of the 50 largest energy companies rose 35% to $3.9 trillion from $2.8 trillion a year ago. The PFC Energy 50 has recovered its combined value ofthree years ago, but remains 26% below the $5.2 trillion high of December 2007. • The 35% value gain compares with increases of 71% in the WTI oil price and 20% in the S&P 500 index. Most 2008 Trends Reversed • The biggest losers in last year’ s PFC Energy 50 were the National Oil Companies (NOCs), which experienced a 64% market capitalization decline, compared with average losses of 35% by Integrated Oil Companies (IOCs). This year, the picture was reversed, with the list’s nine returning NOCs posting a 66% average value increase, while the fteen returning IOCs gained only 9%. • Following large value declines last year, the four service companies on the PFC Energy 50 list delivered a 67% value gain. • Two NOCs more than doubled their values. Petrobras’ increase from $96.8 billion to $199.2 billion pushed the company to #4, up from #23 eight years ago. Rosneft’s increase from $39.7 billion to $89.2 billion pushed it ahead 7 places, to #13 from #20 last year. • The six SuperMajors, which were affected least negatively by the 2008 value decline, squeezed out an average gain below 1% in 2009; the market valuations for ExxonMobil and ConocoPhillips declined by 20% and 2%, respectively. Emerging Markets Redux • The countries worst hit in 2008 outperformed in 2009. The fourteen emerging markets companies returning to the PFC Energy 50 increased their value 67%, compared with only 17% for OECD companies. • Russian companies, last year’s weakest performers, bounced back in 2009; Gazprom, Rosneft and LUKOIL produced a combined 88% value gain. • The value of Chinese companies increased 52% and PetroChina recaptured the list’s top position. Industry Restructuring Begins • Restructurings affected several of this year’s PFC Energy 50 companies: - EnCana and its spin-off Cenovus had a combined value 24% higher than one year ago, but the now-smaller EnCana fell from #22 to #45, the list’s largest drop. - Merging with Petro-Canada helped Suncor increase its market cap by 91% and climb from #37 to #22. - ExxonMobil’s acquisition of XTO was not completed at year end. While the announcement boosted XTO’s value, the combined market cap of XOM and XTO would fall short of displacing PetroChina from the #1 position. - The service sector has also seen consolidati on. Cameron’s value reects a $1 bn merger with Natco; the $18 bn Baker Hughes-B J Services merger is expected to close in 1Q 2010. Independents Outperform Integrateds • The OECD E&P companies posted an average 34% value gain—ve ry close to the 35% gain for the list as a whole. • Weak rening values hurt integrated companies: OECD integrateds gained only 6% in value and SuperMajors less than 1%. • Rening weakness is also reected in the disappearance of some companies from the list. The PFC Energy 50 lost US-based rener Valero last year and Spanish rener Cepsa (#27 last year) failed to make this year’s list. Not an Alternatives Year• The PFC Energy Top 15 Alternative Energy companies increased their combined value 28%, far short of reversing last year’s 61% decline. Introducing… • The PFC Energy 50 welcomes Brazilian E&P OGX at #33 and the list’s growth leader (+336%). • Imperial Oil, TNK-BP and Gazprom Neft are also new on this year’s list. Prior eligibility rules barred companies that are owned at least 50% by other PFC Energy 50 companies. The PFC Energy 50 website at www.pfcenergy50.com provides dynamic charts illustrating key trends as well as interactive tools for testing market capitalization drivers and tracking 2009 performance. The website also includes the PFC Energy 100 listing (including power, coal and nuclear companies) and an archive of previous PFC Energy 50 reports. www.HidrocarburosBolivia.com
PFC Energy 50 Te Defnitive Annual Ranking o the World’sLargest Listed Energy Firms
January 2010
Strategic Advisors in Global Energy
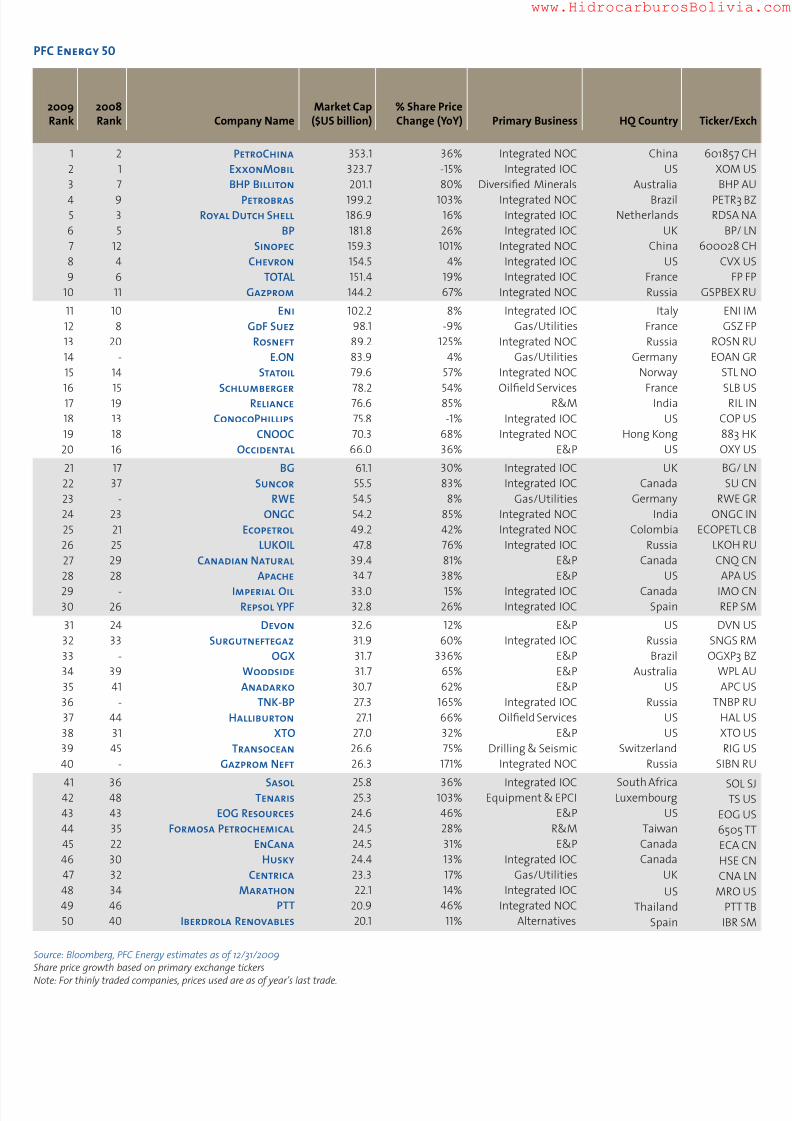
Combined Value of PFC Energy 50 Climbs 35%• The combined market capitalization of the
50 largest energy companies rose 35% to $3.9trillion from $2.8 trillion a year ago. The PFCEnergy 50 has recovered its combined value of three years ago, but remains 26% below the$5.2 trillion high of December 2007.
• The 35% value gain compares with increasesof 71% in the WTI oil price and 20% in theS&P 500 index.
Most 2008 Trends Reversed
• The biggest losers in last year’s PFC Energy50 were the National Oil Companies (NOCs),
which experienced a 64% market capitalizationdecline, compared with average losses of 35%by Integrated Oil Companies (IOCs). This year,the picture was reversed, with the list’s ninereturning NOCs posting a 66% average valueincrease, while the fteen returning IOCsgained only 9%.
• Following large value declines last year, thefour service companies on the PFC Energy 50list delivered a 67% value gain.
• Two NOCs more than doubled their values.Petrobras’ increase from $96.8 billion to $199.2billion pushed the company to #4, up from #23eight years ago. Rosneft’s increase from $39.7
billion to $89.2 billion pushed it ahead 7 places,to #13 from #20 last year.
• The six SuperMajors, which were affectedleast negatively by the 2008 value decline,squeezed out an average gain below 1% in2009; the market valuations for ExxonMobiland ConocoPhillips declined by 20% and2%, respectively.
Emerging Markets Redux• The countries worst hit in 2008 outperformed
in 2009. The fourteen emerging marketscompanies returning to the PFC Energy 50increased their value 67%, compared with only17% for OECD companies.
• Russian companies, last year’s weakestperformers, bounced back in 2009; Gazprom,Rosneft and LUKOIL produced a combined 88%value gain.
• The value of Chinese companies increased 52%and PetroChina recaptured the list’stop position.
Industry Restructuring Begins• Restructurings affected several of this year’s
PFC Energy 50 companies:- EnCana and its spin-off Cenovus had a
combined value 24% higher than one yearago, but the now-smaller EnCana fell from#22 to #45, the list’s largest drop.
- Merging with Petro-Canada helped Suncorincrease its market cap by 91% and climbfrom #37 to #22.
- ExxonMobil’s acquisition of XTO wasnot completed at year end. While theannouncement boosted XTO’s value, thecombined market cap of XOM and XTO
would fall short of displacing PetroChinafrom the #1 position.
- The service sector has also seenconsolidation. Cameron’s value re ects a$1 bn merger with Natco; the $18 bn BakerHughes-BJ Services merger is expected toclose in 1Q 2010.
Independents Outperform Integrateds• The OECD E&P companies posted an average
34% value gain—very close to the 35% gain fothe list as a whole.
• Weak re ning values hurt integratedcompanies: OECD integrateds gained only 6%in value and SuperMajors less than 1%.
• Re ning weakness is also re ected in thedisappearance of some companies from thelist. The PFC Energy 50 lost US-based re nerValero last year and Spanish re ner Cepsa(#27 last year) failed to make this year’s list.
Not an Alternatives Year
• The PFC Energy Top 15 Alternative Energycompanies increased their combinedvalue 28%, far short of reversing last year’s61% decline.
Introducing…
• The PFC Energy 50 welcomes Brazilian E&P Oat #33 and the list’s growth leader (+336%).
• Imperial Oil, TNK-BP and Gazprom Neft arealso new on this year’s list. Prior eligibility rulbarred companies that are owned at least 50%by other PFC Energy 50 companies.
The PFC Energy 50 website at
www.pfcenergy50.com provides dynamiccharts illustrating key trends as well asinteractive tools for testing marketcapitalization drivers and tracking 2009performance. The website also includes thePFC Energy 100 listing (including power,coal and nuclear companies) and an archiveof previous PFC Energy 50 reports.
In last year’s chart, only one company showed one-year market cap growth and most declined over both periods. The 2009 market recovery has shifted bubbles to theright and reshuf ed them. Most NOCs and independent E&Ps are in positive territory for three-year growth, while the IOCs cluster around the no-growth axis. Notehat the Suncor and EnCana rings are in uenced by the Petro-Canada merger and Cenovus spin-off, respectively. While service companies rebounded strongly in 2009,heir three-year growth is not impressive. The Russian companies, too, rebounded strongly in 2009, but underperformed over the longer period.
Please visit the PFC Energy 50 website at www.pfcenergy50.com for additional information and analysis.
1-Year and 3-Year Growth in Market Capitalization
2009-Bouncing Back, More or Less
While almost all PFC Energy 50 companies added value in 2009, few recouped what they lost in the second half of 2008. The chart compares how marketcapitalizations changed in 2009 (vertical axis) with the second half of 2008 (horizontal axis) and the contours show the combined net value change over the last 18months. Companies along the value contours experienced the same net change—but by different routes. Proximity to the WTI and S&P 500 index points indicateshow closely company performance correlated with oil prices and market movements. Moving from top right to bottom left, the companies lost more value. Moving upand left along the contours, values were more volatile. Only companies above the ∆ = 0% contour increased in value at the end of 2009 compared with mid-2008. Notshown is GdF Suez, which gained 70% with its 2008 merger and lost value in 2009 for a net +54%.
Please visit the PFC Energy 50 website at www.pfcenergy50.com for additional information and analysis.
BP
Chevron
TNK-BP
ExxonMobilHAL
Lukoil
Statoil
Surgut
Gazprom Neft
Transocean
GdF*
DVN
BHP
Reliance
ONGC
IBR Renovables
CNOOOccidental
Petrobras
Encana*
Gazprom
Suncor*
Schlumberger
COP
Rosneft
EOG
Petrochina
CNQBG
Tenaris
Sinopec
1-YEAR GROWTH IN MARKET CAPITALIZATION
3 - Y E A R G R O W T H I N M A R K E T C A P I T A L I Z A T I O N
IOCs
NOCs
E&P
R&M
SERVICE COMPAN
GAS/UTILITIES
OTHER
50%0%
50% 100% 150% 200% 250%
175%
125%
25%
75%
-25%
-75%
PETROCHINA
BHP
PBR
RDSBP
SINOPEC
TOT
GAZP
E.ON
STL
SLB
RIL
CNOOC
OXYBG
SU
RWE
ONGC
ECPTL
LUKCNQ
APA
REP
WPLSNGS
APC
TNK
HAL
XTO
RIG
SIBN
SOL
TEN
FORM
EOG
CNAMRO
PTT
XOM
ENI
CVX
COP
IMOHSE
ECA
DVN
IBR
225%
200%
175%
150%
125%
100%
75%
50%
25%
0%20%-20%-40%-60%-80%
-25%
-50%
IOCs
NOCs
E&P
R&M
SERVICE COMPANIES
GAS/UTILITIES
OTHER
= 0%
= -20%
= -40%
MARKET CAPITALIZATION
JUL 1 TO DEC 31 2008
MARKET CAPITALIZATION
JAN 1 TO DEC 31 2009
WTI
S&P 500
Data source: Bloom
Data Source: BloomCircle size indicates marke* Value affected by merger/
Source: Bloomberg, PFC Energy estimates as of 12/31/2009 *Partial year (new listing) • Share price growth based on primary exchange tickers• P/E based on earnings from continuing operations for the 12 months ended 9/30/2009• Debt/Capital is ratio between total debt and total capital based on most recent published balance sheet ** BHP Billiton is a diversi ed minerals company with E&P activities (20-25% of the total) having an estimated value in the $30-35 billion range.
m em b er s h i p
Data source: Bloomberg, PFC Energy estimates, as of 12Note: For thinly traded companies, prices used are as of year’s last t
In strong contrast to last year, almost all PFC Energy 50 companies achievedshare price increases in 2009, with segment leaders delivering growth of 50%and higher. The overall top performers were Brazilian E&P OGX (+336%), Chialternatives company GCL-Poly Energy (+280%) and UK based engineer Petrof(+234%). Note that the IOC and NOC leaders, Russian companies TNK-BP and
Gazprom Neft, are both very thinly traded as their shares are almost entirely helby BP and Gazprom, respectively.
1 1 Reliance 76.6 85% 20 39% India RIL2 2 Formosa Petrochemical 24.5 28% 52 52% Taiwan 6505 T
3 4 Indian Oil 16.0 50% 28 50% India IOCL4 3 Valero 9.5 -23% 19 32% US VLO5 7 SK Energy 9.3 74% 12 57% Korea 096770 K6 - Cepsa 8.4 -67% 21 23% Spain CEP7 5 Nippon Oil 6.8 -6% 46 59% Japan 5001 J8 8 S-Oil 5.2 -2% 14 42% Korea 010950 K9 11 PKN Orlen 5.1 37% n/a 40% Poland PKN PW
10 12 Tupras 5.0 89% 17 33% Turkey TUPRS11 - Bharat Petroleum 4.9 77% 36 63% India BPCL12 - SNP Petrom 4.8 33% 14 36% Romania SNP R13 6 TonenGeneral Sekiyu 4.7 -15% 7 26% Japan 501214 10 Neste Oil 4.6 19% 33 40% Finland NES1V F15 - Essar Oil 3.6 68% n/a 75% India ESOIL I
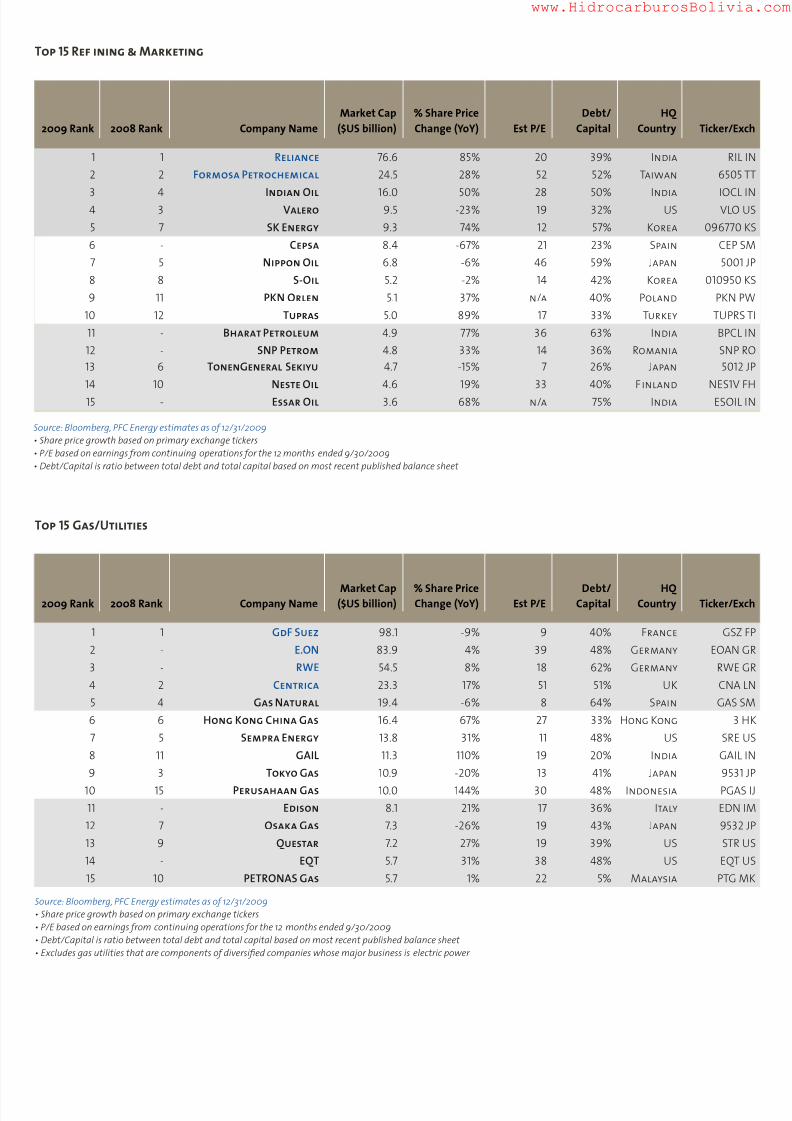
top 15 Gas/U es
2009 Rank 2008 Rank Company NameMarket Cap($US billion)
% Share PriceChange (YoY) Est P/E
Debt/Capital
HQCountry Ticker/Ex
1 1 GdF Suez 98.1 -9% 9 40% France GSZ F2 - E.ON 83.9 4% 39 48% Germany EOAN G3 - RWE 54.5 8% 18 62% Germany RWE G4 2 Centrica 23.3 17% 51 51% UK CN5 4 Gas Natural 19.4 -6% 8 64% Spain GAS S6 6 Hong Kong China Gas 16.4 67% 27 33% Hong Kong 3 H7 5 Sempra Energy 13.8 31% 11 48% US SR8 11 GAIL 11.3 110% 19 20% India GAI9 3 Tokyo Gas 10.9 -20% 13 41% Japan 9531
10 15 Perusahaan Gas 10.0 144% 30 48% Indonesia PGAS11 - Edison 8.1 21% 17 36% Italy EDN12 7 Osaka Gas 7.3 -26% 19 43% Japan 953213 9 Questar 7.2 27% 19 39% US STR14 - EQT 5.7 31% 38 48% US EQT15 10 PETRONAS Gas 5.7 1% 22 5% Malaysia PTG M
Source: Bloomberg, PFC Energy estimates as of 12/31/2009 • Share price growth based on primary exchange tickers• P/E based on earnings from continuing operations for the 12 months ended 9/30/2009• Debt/Capital is ratio between total debt and total capital based on most recent published balance sheet • Excludes gas utilities that are components of diversi ed companies whose major business is electric power
Source: Bloomberg, PFC Energy estimates as of 12/31/2009 • Share price growth based on primary exchange tickers• P/E based on earnings from continuing operations for the 12 months ended 9/30/2009• Debt/Capital is ratio between total debt and total capital based on most recent published balance sheet
2009 Rank 2008 Rank Company NameMarket Cap($US billion)
% Share PriceChange (YoY) Est P/E
Debt/Capital
HQCountry Ticker/Ex
1 1 Schlumberger 78.2 54% 21 22% France SLB2 2 Halliburton 27.1 66% 16 35% US HAL
3 4 Weatherford 13.2 66% 17 41% US WFT4 3 Baker Hughes 12.5 26% 14 20% US BHI5 5 China Oilf ield Services 8.9 37% 28 61% China 601808 CH6 6 Smith International 6.7 19% 17 28% US SI7 7 BJ Services 5.5 59% 27 13% US BJS8 9 SBM Offshore 3.2 56% 13 58% Netherlands SBMO 9 10 Oceaneering International 3.2 101% 16 9% US OII
10 12 Core Laboratories 2.7 99% 22 45% US CLB11 8 Tidewater 2.5 19% 7 11% US TDW12 11 Bourbon 2.3 65% 9 55% France GBB13 14 Superior Energy 1.9 52% 10 36% US SPN14 - Trican Well Services 1.7 106% 94 25% Canada TCW C15 - Carbo Ceramics 1.6 92% 26 0% US CRR
Source: Bloomberg, PFC Energy estimates as of 12/31/2009 • Share price growth based on primary exchange tickers• P/E based on earnings from continuing operations for the 12 months ended 9/30/2009• Debt/Capital is ratio between total debt and total capital based on most recent published balance sheet • Oil eld Services companies have operations that are primarily tied to oil and gas company operating expenses
top 15 Equ pmen & EPCi
2009 Rank 2008 Rank Company NameMarket Cap($US billion)
% Share PriceChange (YoY) Est P/E
Debt/Capital
HQCountry Ticker/Ex
1 1 Tenaris 25.3 103% 25 15% Luxembourg TS2 2 National Oilwell Varco 18.4 85% 10 6% US NOV3 4 Saipem 15.3 107% 11 46% Italy SPM4 7 Cameron 10.2 104% 17 31% US CAM5 6 Keppel 9.3 94% 8 20% Singapore KEP S6 3 Fluor 8.1 0% 11 4% US FL7 8 Technip 7.7 133% 9 23% France TEC8 10 FMC Technologies 7.1 143% 20 24% US FT9 14 WorleyParsons 6.2 162% 18 30% Australia WOR A
10 - Petrofac 5.8 234% 20 13% UK PFC11 15 McDermott International 5.5 143% 15 1% US MD12 5 Offshore Oil 5.4 12% 29 29% China 600583 C13 11 Sembcorp Industries 4.7 63% 13 19% Singapore SCI14 - Jacobs Engineering 4.7 -22% 12 1% US JEC15 13 AMEC 4.2 78% 12 0% UK AMEC
Source: Bloomberg, PFC Energy estimates as of 12/31/2009 • Share price growth based on primary exchange tickers• P/E based on earnings from continuing operations for the 12 months ended 9/30/2009• Debt/Capital is ratio between total debt and total capital based on most recent published balance sheet • Equipment & EPCI companies have operations that are primarily tied to oil and gas company capital spending• Excludes major equipment and services suppliers that are components of diversi ed equipment and engineering companies, such as GE and ABB
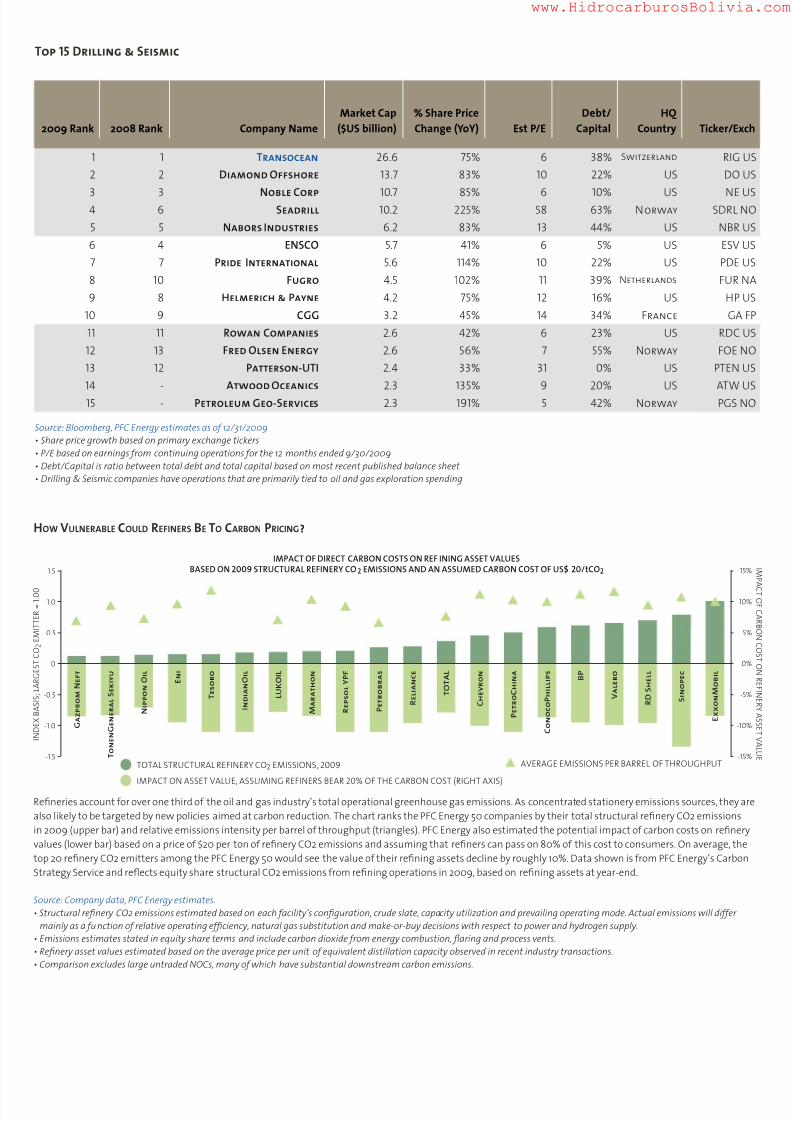
H ow V ulnerable C ould r efiners b e To C arbon P riCing ?
top 15 Dr ng & Se sm c
Source: Bloomberg, PFC Energy estimates as of 12/31/2009 • Share price growth based on primary exchange tickers• P/E based on earnings from continuing operations for the 12 months ended 9/30/2009• Debt/Capital is ratio between total debt and total capital based on most recent published balance sheet • Drilling & Seismic companies have operations that are primarily tied to oil and gas exploration spending
2009 Rank 2008 Rank Company Name
Market Cap($US billion)
% Share PriceChange (YoY) Est P/E
Debt/Capital
HQCountry Ticker/Ex
1 1 Transocean 26.6 75% 6 38% Switzerland RIG2 2 Diamond Offshore 13.7 83% 10 22% US DO
3 3 Noble Corp 10.7 85% 6 10% US NE4 6 Seadrill 10.2 225% 58 63% Norway SDRL N5 5 Nabors Industries 6.2 83% 13 44% US NBR6 4 ENSCO 5.7 41% 6 5% US ESV7 7 Pride International 5.6 114% 10 22% US PDE8 10 Fugro 4.5 102% 11 39% Netherlands FUR9 8 Helmerich & Payne 4.2 75% 12 16% US HP
10 9 CGG 3.2 45% 14 34% France GA11 11 Rowan Companies 2.6 42% 6 23% US RDC12 13 Fred Olsen Energy 2.6 56% 7 55% Norway FOE N13 12 Patterson-UTI 2.4 33% 31 0% US PTEN14 - Atwood Oceanics 2.3 135% 9 20% US ATW15 - Petroleum Geo-Services 2.3 191% 5 42% Norway PGS N
Re neries account for over one third of the oil and gas industry’s total operational greenhouse gas emissions. As concentrated stationery emissions sources, they arealso likely to be targeted by new policies aimed at carbon reduction. The chart ranks the PFC Energy 50 companies by their total structural re nery CO2 emissionsin 2009 (upper bar) and relative emissions intensity per barrel of throughput (triangles). PFC Energy also estimated the potential impact of carbon costs on re neryvalues (lower bar) based on a price of $20 per ton of re nery CO2 emissions and assuming that re ners can pass on 80% of this cost to consumers. On average, thetop 20 re nery CO2 emitters among the PFC Energy 50 would see the value of their re ning assets decline by roughly 10%. Data shown is from PFC Energy’s CarbonStrategy Service and re ects equity share structural CO2 emissions from re ning operations in 2009, based on re ning assets at year-end.
Source: Company data, PFC Energy estimates.• Structural re nery CO2 emissions estimated based on each facility’s con guration, crude slate, capacity utilization and prevailing operating mode. Actual emissions will differ
mainly as a function of relative operating ef ciency, natural gas substitution and make-or-buy decisions with respect to power and hydrogen supply.• Emissions estimates stated in equity share terms and include carbon dioxide from energy combustion, aring and process vents.• Re nery asset values estimated based on the average price per unit of equivalent distillation capacity observed in recent industry transactions.• Comparison excludes large untraded NOCs, many of which have substantial downstream carbon emissions.
TOTAL STRUCTURAL REFINERY CO2 EMISSIONS, 2009
IMPACT OF DIRECT CARBON COSTS ON REF INING ASSET VALUESBASED ON 2009 STRUCTURAL REFINERY CO2 EMISSIONS AND AN ASSUMED CARBON COST OF US$ 20/t CO2
IMPACT ON ASSET VALUE, ASSUMING REFINERS BEAR 20% OF THE CARBON COST (RIGHT AXIS)
AVERAGE EMISSIONS PER BARREL OF THROUGHPUT
1.5
1.0
0.5
0
-0.5
-1.0
-1.5
1
-1
-
I N D E X B A S I S ; L A R G E S T C O 2 E M I T T E R = 1 . 0 0
8 - SMA Solar Technology 4.6 153% 27 22% Germany S92 GR
9 - GCL-Poly Energy Hldgs 4.6 280% 17 55% China 3800 HK
10 6 Gamesa 4.1 -6% 18 31% Spain GAM SM
11 11 EdF Energies Nouvelles 4.0 46% 32 63% France EEN FP
12 13 Suzlon 3.0 52% 57 58% India SUEL IN
13 14 Suntech Power 2.9 42% 28 52% US STP US
14 9 Covanta Holding 2.8 -18% 26 64% US CVA US
15 12 Solar World 2.5 3% 13 45% Germany SWV GR
Source: Bloomberg, PFC Energy estimates as of 12/31/2009 *Partial year (new listing)• Except where noted, share price growth based on primary exchange tickers• P/E based on earnings from continuing operations for the 12 months ended 9/30/2009, except 12 months ended 6/30/09 for Xinjiang Goldwind, EdFEN, SolarWorld• Debt/Capital is ratio between total debt and total capital based on most recent published balance sheet • Other PFC Energy 100 companies own substantial shares in Iberdrola Renovables, EDP Renovaveis and EdF Energies Nouvelles
The PFC Energy 50 website includes several exciting features:· Dynamic charts illustrating key trends· An interactive tool showing how the market value of PFC Energy 50 companieschanged during 2009
· A tool for testing market capitalization drivers· The third annual PFC Energy 100 listing—including power, coal andnuclear companies