44
Konstancja Julia Laskowska Pharmaceutical market in emerging countries in 2014-2019 Bachelor Thesis Supervisor: Antonio Quesada Degree in Business Administration and Management Reus 2014

Konstancja Julia Laskowska
Pharmaceutical market in emerging countries
in 2014-2019
Bachelor Thesis
Supervisor: Antonio Quesada
Degree in Business Administration and Management
Reus
2014

2
DECLARACIÓN PERSONAL DE NO PLAGIO
Dña Konstancja Julia Laskowska NIE Y0387034G
Estudiante del Grado de Administración y Dirección de Empresas de la Universitat Rovira
i Virgili, curso 2013/2014 como autora de este documento académico, titulado:
Pharmaceutical market in emerging countries in 2014-2019
Y presentado como Trabajo Fin de Grado, para la obtención del título correspondiente,
DECLARO QUE
Es fruto de mi trabajo personal, que no copio ni utilizo ideas, formulaciones, citas
integrales e ilustraciones diversas, sacadas de cualquier obra, artículo memoria, etc. (en
versión impresa o electrónica), sin mencionar de forma clara y estricta su origen, tanto en
el cuerpo del texto como en las referencias.
Así mismo, soy plenamente consciente de que el hecho de no respetar estos extremos es
objeto de sanciones universitarias y/o de otro orden.
En Reus, a 12 de junio de 2014
Fdo:

3
Contents
List of figures and tables ..................................................................................... 4
Table of acronyms used in the paper ................................................................. 5
1. Introduction ........................................................................................................ 6
2. Conceptual description of the pharmaceutical industry .................................. 9
2.1 Supply: Producers ....................................................................................... 10
2.2 Product: Drugs ............................................................................................ 11
2.3 Demand: Diseases ....................................................................................... 13
2.4 Buyers: Who pays? ..................................................................................... 15
3. Empirical description ....................................................................................... 16
3.1 Supply: Producers ...................................................................................... 16
3.2 Medical spending per capita and global launches of drugs .................... 20
3.3 Product: Drugs ............................................................................................ 22
3.4 Demand: Diseases ........................................................................................ 27
3.5 Buyers: Who pays? ..................................................................................... 31
4. Interferences from the empirical description ................................................ 35
5. Conclusion ......................................................................................................... 39
References .......................................................................................................... 42

4
List of figures and tables
Figure 1: Geographic distribution of medicine spending (USD billion)
Figure 2: The growth gap. Pharmerging and tier-2 emerging markets will contribute
three quarters of global growth in 2009
Figure 3: Spending on pharmaceuticals in 2007-2011 on the African continent
(percentage)
Figure 4: Global Launches of NMEs in 2005-2012
Figure 5: Global Spending in Drugs: Brand, Generic, Other in 2012-2017 (USD billion)
Figure 6: R+D spending has soared, but the number of NMEs and biologics approved
by the FDA is falling down
Figure 7: The biologics market 2002-2017 (USD billion)
Figure 8: Estimated spending by therapy area in 2017 (USD billion)
Figure 9: Older people consume more healthcare than younger people do
Figure 10: Figure 10: Global spending on medicines in 2008-2017 (USD billion) and
estimated growth
Table 1: Conceptual segmentation of the pharmaceutical industry
Table 2: GNI per capita, GDP (USD), population and life expectancy (years) at birth
growth in India
Table 3: Disability-adjusted life year percentage in high income countries and globally,
R+D pipeline, new launches
Table 4: Losses of big pharmaceutical companies due to patent expirations in 2010-
2012 (USD billion)
Table 5: 10 Leading broad causes of death (thousands)
Table 6: Population growth rates (annual growth in %)
Table 7.1: Supply: National companies
Table 7.2 Demand: Pharmerging countries
Table 7.3: Buyers: Pharmerging countries
Table 7.4: Demand: African continent
Table 7.5: Supply: Local companies
Table 7.6: Buyers: African countries
5
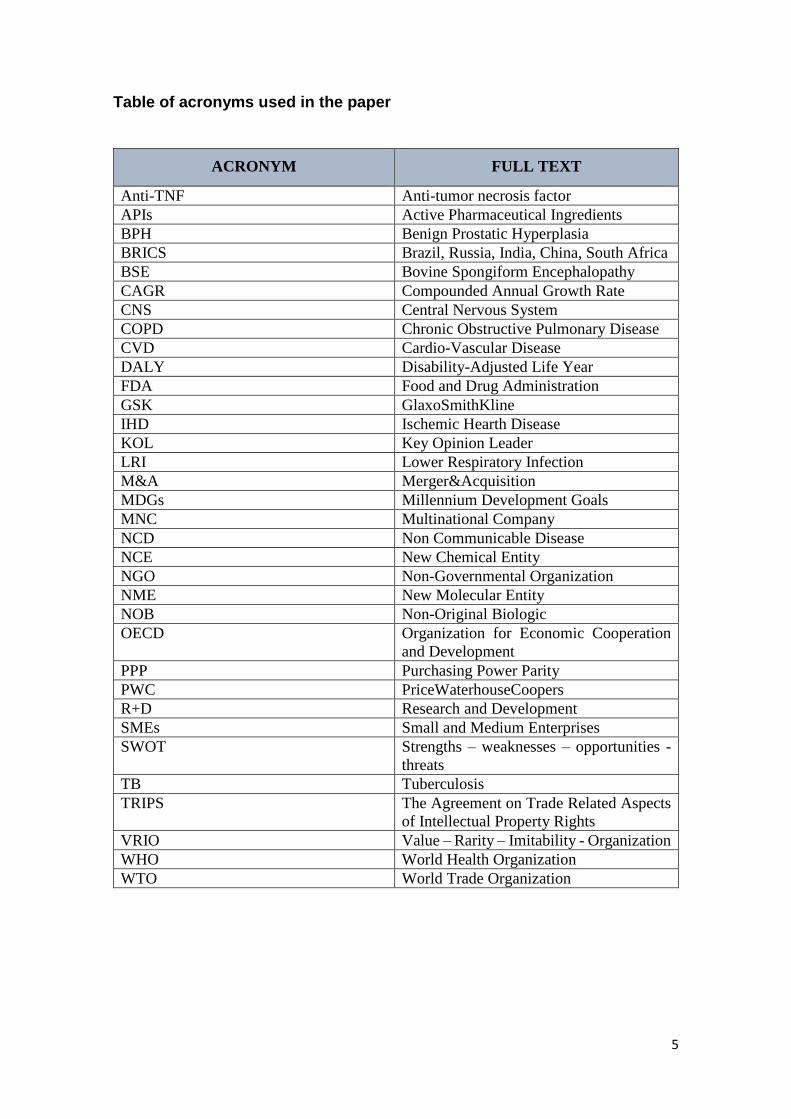
Table of acronyms used in the paper
ACRONYM FULL TEXT
Anti-TNF Anti-tumor necrosis factor
APIs Active Pharmaceutical Ingredients
BPH Benign Prostatic Hyperplasia
BRICS Brazil, Russia, India, China, South Africa
BSE Bovine Spongiform Encephalopathy
CAGR Compounded Annual Growth Rate
CNS Central Nervous System
COPD Chronic Obstructive Pulmonary Disease
CVD Cardio-Vascular Disease
DALY Disability-Adjusted Life Year
FDA Food and Drug Administration
GSK GlaxoSmithKline
IHD Ischemic Hearth Disease
KOL Key Opinion Leader
LRI Lower Respiratory Infection
M&A Merger&Acquisition
MDGs Millennium Development Goals
MNC Multinational Company
NCD Non Communicable Disease
NCE New Chemical Entity
NGO Non-Governmental Organization
NME New Molecular Entity
NOB Non-Original Biologic
OECD Organization for Economic Cooperation
and Development
PPP Purchasing Power Parity
PWC PriceWaterhouseCoopers
R+D Research and Development
SMEs Small and Medium Enterprises
SWOT Strengths – weaknesses – opportunities -
threats
TB Tuberculosis
TRIPS The Agreement on Trade Related Aspects
of Intellectual Property Rights
VRIO Value – Rarity – Imitability - Organization
WHO World Health Organization
WTO World Trade Organization

6
1. Introduction
Medicine is for people, not for profits, said George Merck, boss of the Merck Company,
a huge American pharmaceutical firm. His face and the, now famous, phrase were
captured by the Time magazine in 1952. As he admitted in an article published by the
same magazine, the choice was false. More or less around that time, after the World War
II, big pharmaceutical companies began a golden age in drug development,
manufacturing vaccines, antibiotics and other treatments aiming to improve people’s
lives.
This golden age still continues for the Big Pharma. A monopolistic position, medical
innovation, patent protection, and an increasing number of patients worldwide allow the
pharma companies to make billions of USD every year. Nobody will be so innocent to
say that they do it for people! They do it for money.
In the face of crisis, few industries are profitable and well-functioning, but there are some
that still keep on generating benefits and offering work places. The pharmaceutical
industry is one of the most profitable sectors on our globe, among construction of
railways, automotive industry, IT services and electronic devices, financial data services
and oil and gas extraction1. Total global spending on medicines will exceed one trillion
USD in 2014 and reach almost $1.2 trillion in 2017. By 2017, the global spending on
medicines will have almost doubled the spending in 20072. Contrary to industries that are
based on natural resources, such as the petrochemicals, the pharmaceutical companies
have a bright future: due to the increasing global population and unhealthy environments
we live in, the number of patients is continuously increasing.
In the present dissertation, we will describe the pharmaceutical market and try to answer
the question What are going to be the tendencies in diseases, production of drugs and
spending on medicines over the next 5 years? in order to define opportunities for national
and local pharmaceutical companies in emerging countries, opposed to multinational
companies in developed nations.
1 Willron (2013). 2 Rickwood et al. (2013).

7
The methodology applied in this paper is an empirical study based on available reports
and statistics published by important institutions and consulting firms, such as the World
Health Organization, World Bank, Organization for Economic Cooperation and
Development, PriceWaterhouseCoopers and IMS Institute for Healthcare Informatics.
After presenting a summarized information extracted from their studies, we develop our
own model and draw conclusions.
Due to the geographic segmentation of producers, the pharmaceutical market is highly
monopolized with few possibilities to reach the leader position by emerging economies.
The laws on patents and high requirements on quality (ISO certifications and WHO
standards) increase these difficulties. Patents and the monopolistic position makes this
industry highly profitable for the top ten players in developed countries. However, with
the expiration of patents for some important drugs, a new market has emerged for national
and local companies in developing nations. They can provide generics to emerging and
African countries, number one buyer of these medicines. Through governmental tenders
and international NGOs, pharmerging countries and African nations buy between 70-
95% of generics.
The increasing importance of pharmerging countries has several reasons: the growing
number of population assures more patients, cheap labor used in contractual agreements
with MNCs from developed economies makes them competitive, and an increasing
number of national pharmaceutical firms provides profits. Africa, in change, is a hedge
against a possible slowdown in pharmerging and developed economies. Although it is a
high risk market, it presents very good opportunities to invest in the future.
In reference to diseases, there is a shift in the number of patients from infectious diseases
to chronic non-communicable diseases, due to better medical facilities worldwide, trained
professionals and higher standards, as well as actions undertaken by the WHO, such as
the Millennium Development Goals and the universal health coverage. However, these
tendencies in diseases might be altered by demographic, migratory, legal, political,
corporate, and climate changes, for instance: growing global population, high migration
to cities, new laws on patents for drugs, political situation in unstable regions, incentives
for creating national companies in pharmerging countries, and global warming.
It is important to underline that our goal was to show differences in consumption of
medicines during a period of 5 years (2014-2019); nevertheless, we have not noticed big
8
modifications. It is because at least two to three decades are necessary to make this market
alter.
The first part of this paper consists of a conceptual description of the industry, taking into
account four main elements: the producers, products, demand and buyers. It is supposed
to help the reader better understand the functioning of the pharmaceutical market and
familiarize him/her with some medical terms. In Section 3, we present our empirical
study, supported by medical reports and statistics. After the reader is acquainted with the
drugs market, we introduce him into the current situation of this sector, the world of most
widespread diseases currently, Indian national companies outsourced by big Western
MNCs, top treatments and governmental spending on drugs. In Section 4, we develop
interferences from the empirical study and present the most viable options in production
of drugs for national and local companies, and tendencies in purchases of public and
private agents. We finish with the theory of Mike W. Peng explaining why Africa fails to
establish MNCs and is in the last place in medical innovation.
The basic ideas and results of this research can be useful for all pharmaceutical
companies, especially national companies in pharmerging countries and local companies
on the African continent, when deciding about the portfolio of products and preparing
strategies for the future.
9
2. Conceptual description of the pharmaceutical industry
In order to understand better the pharmaceutical industry, we will start with a tabular
explication of its functioning followed by detailed definitions.
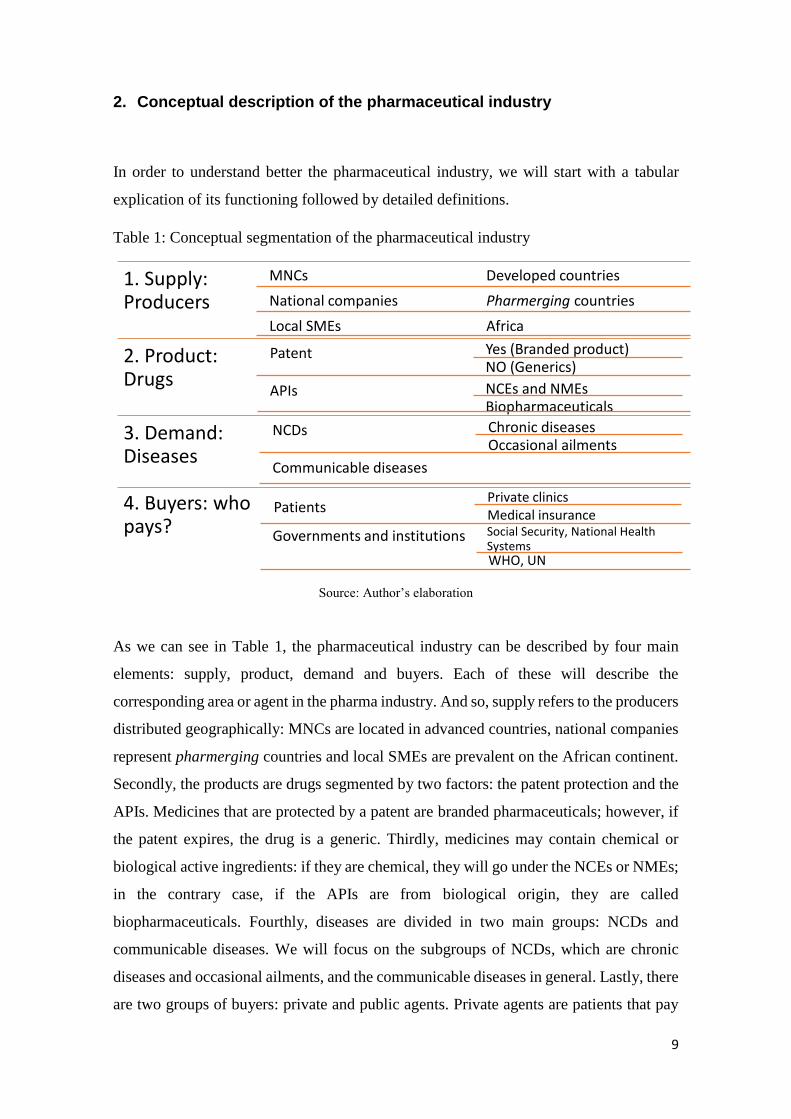
Table 1: Conceptual segmentation of the pharmaceutical industry
Source: Author’s elaboration
As we can see in Table 1, the pharmaceutical industry can be described by four main
elements: supply, product, demand and buyers. Each of these will describe the
corresponding area or agent in the pharma industry. And so, supply refers to the producers
distributed geographically: MNCs are located in advanced countries, national companies
represent pharmerging countries and local SMEs are prevalent on the African continent.
Secondly, the products are drugs segmented by two factors: the patent protection and the
APIs. Medicines that are protected by a patent are branded pharmaceuticals; however, if
the patent expires, the drug is a generic. Thirdly, medicines may contain chemical or
biological active ingredients: if they are chemical, they will go under the NCEs or NMEs;
in the contrary case, if the APIs are from biological origin, they are called
biopharmaceuticals. Fourthly, diseases are divided in two main groups: NCDs and
communicable diseases. We will focus on the subgroups of NCDs, which are chronic
diseases and occasional ailments, and the communicable diseases in general. Lastly, there
are two groups of buyers: private and public agents. Private agents are patients that pay
1. Supply: Producers
MNCs Developed countries
National companies Pharmerging countries
Local SMEs Africa
2. Product: Drugs
Patent Yes (Branded product)NO (Generics)
APIs NCEs and NMEsBiopharmaceuticals
3. Demand: Diseases
NCDs Chronic diseasesOccasional ailments
Communicable diseases
4. Buyers: who pays?
PatientsPrivate clinicsMedical insurance
Governments and institutions Social Security, National Health SystemsWHO, UN

10
themselves through private clinics or medical insurance. Public agents refer to
governments and international institutions that provide patients with medicines.
2.1 Supply: Producers
The pharmaceutical market is organized by the producer, not the product, as in the
majority of cases. In industries such as agriculture, fashion or entertainment, the place
where the product is manufactured is the decisive factor. However, the pharmaceutical
industry, the same as the industry of luxurious items, is distributed geographically
according to the producer. And so, MNCs are in developed countries, the national
companies are prevalent in emerging countries, and local companies (SMEs) are the
biggest group in Africa. We can think of several reasons for this occurrence: developed
nations require quality certifications, a lot of investment and legal procedures to start a
pharma business. Four or five decades ago, it was only possible in, what we call today,
developed countries. So, the big multinationals have started years ago to establish the
position where they are now.
Developed countries such as US, Japan, Germany, France, Italy, Spain, and UK are
countries that spend most on medicines and health systems in general3. Some of these
countries experience, at the moment, austerity measures and do not grow as fast as in the
past, as well as spend relatively less money on their health system (apart from switching
to generics which automatically result in smaller quantities spent on governmental
tenders), although there is still a positive increase in the general spending compared to
the past. The top 10 pharma companies originate in the developed countries: Pfizer (US),
GlaxoSmithKline (UK), Novartis (Switzerland), Sanofi-Aventis (France), AstraZeneca
(UK), Hoffmann – La Roche (US), Johnson&Johnson (US), Merck&Co. (US), Abbott
(US), Eli Lilly&Co. (US) (positions may change due to annual profits fluctuations). In
the course of this paper, we will refer to several of them.
The MNCs will not be our main focus throughout the paper as we guess that their own
strategic departments have developed projections for the near future and are aware of all
the risk factors that are going to be exposed in our research.
3 The numerical spending is described deeply in Section 3.

11
Currently, emerging countries have a lot of financial power and cheap labor, and thus are
playing an important role in the global trade as exporters. In reference to the
pharmaceutical industry, the so called pharmerging countries are developing economies
whose annual GDP per capita is less than $25,000: India, Brazil, Turkey, Mexico, Russia,
Indonesia, and China4. Their national companies specialize in the production of
pharmaceuticals and many times are outsourced by the MNCs mentioned above. These
countries are expected to carry industry growth and contribute mightily to profitability
for the next decade5.
Finally, the African local SMEs represent 99.5% of all firms established on the continent6.
The African regions suffer from a set of factors that inhibits the permanent installation of
big national companies (factors such as bureaucracy, corruption, unstable political
systems, weakly developed business environment, lack of crucial infrastructure, etc.) and
the only viable business model as for now is a local firm. Due to complex entry
regulations in some countries and laws impeding the entrance of foreign companies in
others, many MNCs have established branches on the African continent, invested in local
companies (FDI) or joined the market through M&As and joint-ventures. This is the case
of Aspen and Cipla Medpro, companies funded from such an acquisition, two of the three
largest pharmaceutical companies in Africa right now.
2.2 Product: Drugs
We are going to present two basic classifications of drugs that are relevant for our paper:
according to the patent protection and the APIs. We will contemplate branded drugs
(which are protected by a 20 years patent) vs. generics (the patent is expired, any company
can produce this drug) and NCEs/NMEs vs. biopharmaceuticals. The main difference
between the last two is the active pharmaceutical ingredient: in the first ones, it is a
chemical particle, and in the biopharmaceuticals, it is taken from the nature.
Patents in most countries last for 20 years (under the international law of Intellectual
Property, TRIPS by WTO). After the expiration of a patent, the protection is removed and
4 PWC (2007). 5 The growth of pharmerging countries is described deeply in Section 3. 6 Fjose et al. (2010), p. 5.

12
any pharmaceutical company can produce the medicine in question, under another name.
A drug produced in such process is a generic and usually called after the most relevant
API or the disease it pretends to cure. For example, the generic drug Ibuprofen, produced
in Spain by pharmaceutical companies KERN Pharma or Actavis Spain, can be also
bought in the pharmacies as branded product under the name of Ibupirac® produced by
Chemopharma. Its API is ibuprofen, the same as in the generic drug, but the name and
the producer change, as well as does the price.
Branded products are always more expensive than generics (7 to 10 times more
expensive). It is because the companies having a patent are monopolies or oligopolies
producing this drug and can set any price they want. Big pharma companies face now a
strong competition given that many patents for their products have expired7 and it makes
them erode most of the monopolistic income when enjoying this protection. Producers of
generics have a lot of room to play because the margin of the branded products was set
very high. To avoid this competition, pharmaceutical companies have developed different
strategies to continue selling their products, for example establishing a KOL at hospitals
and clinics who are in charge of recommending this company's products to managers and
physicians or advising the direction to vote for this brand in a tender. More strategies on
how to maintain the leader position in a market or prolong the duration of a patent are
explained in Section 3.
When speaking about patents, we have to mention the compulsory licensing: sometimes,
in serious situations of national range (such as the avian flu virus or another pandemic,
bovine spongiform encephalopathy (BSE), commonly known as mad cow disease, or the
African swine fever), pharmaceutical companies are forced to issue a license to domestic
firms in order to produce as much vaccines as possible. This type of licensing is allowed
by TRIPS. Of course, the mother company will be paid for it, but the money paid by the
government is usually less and late. Also, the formula for the medicine is revealed,
causing even more harm. An example for an external event that may alternate a
company’s profits and strategy plans is the case of Roche's Tamiflu vaccine and the avian
flu in Taiwan in 20058.
7 Names and numerical examples given in Section 3. 8 Schmit (2005).

13
Out of the different types of medicines, we are going to focus on the chemically
synthetized, so called New Chemical Entities or New Molecular Entities, and
biopharmaceuticals, which include biosimilars and non-original biologics (NOBs). A
biopharmaceutical, also known as a biologic medical product or, more simply, as a
biologic or biological, is any medicinal product manufactured in or extracted from
biological sources. Biopharmaceuticals are distinct from chemically synthesized
pharmaceutical products. Examples of biopharmaceuticals include vaccines, blood or
blood components, allergenics, somatic cells, gene therapies, tissues, recombinant
therapeutic protein and living cells9. The biopharmaceuticals are relatively new and
researches and clinical trials are still hold.
Now, an interference between both classifications is possible: a branded product can be a
NME or a biopharmaceutical, the same as a generic. However, we will exclude from our
paper the biopharmaceutical generics since, until the present moment, no research or
production have been undertaken in this direction due to a very basic reason: profitability.
Generics are supposed to be the cheapest option available on the market, whereas
biopharmaceuticals are an innovative product of the future, and still require a lot of
investment in clinical researches. Obviously, an expensive innovative branded drug
cannot end up as a cheap generic very quickly.
2.3 Demand: Diseases
In this paragraph, we are going to suggest a very simple classification of diseases. It is
not supposed to be very detailed nor taken from the medical point of view; our goal is to
make a difference for sometimes ambiguous cases and help readers that are not familiar
with medical terms to better understand the characteristics of diseases. It is also designed
to demonstrate diseases which treatments provide the highest profits for the
pharmaceutical companies.
The non-communicable diseases are not transferable from one person to another and
originate in the proper body of the patient, not in an infection or the intake of a medicine.
It is mainly caused by environmental conditions, such as living in an asbestos
9 American Medical Association complete medical encyclopedia (2003), p. 203.

14
construction, or a long-term intake of harmful substances, for example tobacco. The 4
main non-communicable chronic diseases are: cancers, CVDs, respiratory diseases and
diabetes. Chronic means that they last for a long period of time. There are also short-term
or occasional ailments inside the same group of NDCs, such as fever, cough or pain, for
example headache.
The communicable diseases we will contemplate are HIV/AIDS, malaria, TB and
hepatitis B and C. Some studies consider them as chronic communicable diseases10,
although for our purposes we will not distinguish between chronic and non-chronic
communicable diseases.
We will not consider in our dissertation plastic surgery (it is not a disease), although it
represents a very profitable sector, nor road injuries (the same, it causes deaths, but is not
a disease), nor dental care. Some cancers that occur in the buccal area are reflected in our
study; the same applies to teeth pain, which would go under the area of pain in general.
However, small surgeries such as implants, or ailments (caries, mouth sores, root canal
cleaning or infections) are not of our interest as it is more of esthetic medicine or comfort
than real threat for the patient’s life.
The last term to introduce in this part is the concept of orphan diseases. These are diseases
that have not been adopted by the pharmaceutical industry because they provide little
financial incentive for the private sector to make and market new medications to treat or
prevent them. An orphan disease may be a rare disease (according to US criteria, a disease
that affects fewer than 200,000 people) or a common disease that has been ignored (such
as tuberculosis, cholera, typhoid, and malaria) because it is far more prevalent in
developing countries than in the developed world. We will refer to orphan diseases in
Section 3.
10 Farmer (2013).

15
2.4 Buyers: Who pays?
This part has two main agents: the governments, international institutions, private clinics
and medical insurance agencies. In the first case, the governments in different countries
and global institutions are who pays the medicines, staff and facilities to administrate
drugs. In the second case, it is the patients who pay for medicines through medical
insurance or private clinics.
Governments can administrate drugs through two main channels: Social Security or
National Health Systems. Usually, the National Health Systems, which is public, is a part
of the Social Security. However, there are countries, such as US, that do not have national
health systems or are in transition to create one. In this case, the Social Security can refund
some medical treatments that a patient had undergone, when presenting bills.
International organizations, for instance the United Nations, WHO, Red Cross, and the
NGO Médecins sans frontières, are mainly present in poor countries administrating drugs
and providing basic health care. In order to assure a universal health coverage to all the
populations in the world, the WHO has initiated the Millennium Development Goals. It
is an agreement between all the world’s countries and all the world’s leading development
institutions in order to meet the needs of the world’s poorest. We will go into details of
this agreement in Section 3.

16
3. Empirical description
Once the readers are familiar with the functioning of the pharmaceutical industry and the
medical terms referring to diseases and pharmaceuticals, we can move to the empirical
description. We will maintain the same structure as above, speaking about the four main
elements of the pharmaceutical industry, but giving data and numbers.
3.1 Supply: Producers
Previously, we said that the pharmaceutical market is a geographically distributed market.
In Figure 1, we can see the geographical distribution of global spending on medicines,
which confirms our theory of the market distribution according to producers:
Figure 1: Geographic distribution of medicine spending (USD billion)
Source: Rickwood et al. (2013)
Developed countries spend most on medicines: US, Japan, Germany, France, Italy, Spain,
and UK are countries that account for 61% of global spending in 2012. They are expected
to be responsible for 53% of global contribution in 2017.
Pharmerging countries, such as China and India, contribute a substantial part. Since their
GDP is rising towards Western levels, there will be more and more consumers from
emerging economies. In India, for example, the population grows over the years, and so
does the GDP and, respectively, the GNI per capita (Table 2).

17
However wildly they differ from one another in culture or politics, the seven pharmerging
markets (India, Brazil, Turkey, Mexico, Russia, Indonesia, and China) have in common
more than just their above average growth in the pharma sector. They also share disease
profiles that are markedly different from that of the major pharma markets (read: high
income countries). Their GDP is expanding, along with public health programs and access
to medicines for their populations. And the main focus of each market is on traditional
areas and generics. Only the emerging economies account for 3.5 billion people, or almost
50 percent of the planet. While much is made of their exploding middle-class
population—and its potential buying power—in fact less than one tenth of these 3 billion
can afford Western medicine. Still, that adds up to 300 million— a population close to
that of the United States.
Table 2: GNI per capita, GDP (USD), population and life expectancy (years) at birth
growth in India
2008 2009 2010 2011 2012
GNI per capita,
PPP (current international $)
3,800 4,100 4,500 4,840 5,080
Population
(Total)
1,174,662,334 1,190,138,069 1,205,624,648 1,221,156,319 1,236,686,732
GDP (current
US$)
1,224,095,295,162 1,365,372,433,342 1,708,450,861,364 1,880096,894,406 1,858,740,105,864
GDP growth
(annual %)
4 8 10 7 5
Life expectancy
at birth, total
(years)
65 65 66 66 66
Source: World Development Indicators
In fact, the first projections for the pharmerging countries were that they would contribute
three quarters of global growth in 2009 (mainly production, Figure 2) and could account
for as much as one-fifth of global sales by 2020 (PWC, 2007, p. 5).
We should not forget about the growing upper class in the emerging countries whose PPP
is as high as a middle class citizen in developed economies (US, Canada, EU) or even
higher. Law and Bhattacharya (2011, p. 3) demonstrate that this class represents the same
patterns for spending as the Western upper-middle class and upper class and follows the

18
same model when treating diseases as the developed markets: seeks private insurance,
buys branded products, travels abroad for consultations or to treat chronic diseases and
undergo operations, invests a lot of money in private clinics, best facilities and brings
home professionals of international fame.
Figure 2: The growth gap. Pharmerging and tier-2 emerging markets will contribute three
quarters of global growth in 2009
Source: Hill (2009)
In reference to the last producer, Africa is a place where one can replicate the low-cost,
high-efficiency business model countries such as India (to say one of the pharmerging
countries) have honed at home some 15 years ago. In fact, Africa has many similarities
with India or China: it has hundreds of millions of underserved consumers eager to buy
products tailored to their needs. Consumer spending in Africa may double, to as much as
$1.8 trillion by 2020. It is not any more the poor continent with an exponentially growing
population. It is acquiring purchasing power, mobile subscriptions and working-age men
and women. However, as for now, it is still coping with come important hurdles: the very
time-consuming bureaucracy (registering, pricing, distributing the product) and lack in
information on medicine consumption, in addition to corruption, unstable political
systems, weakly developed business environment, and lack of crucial infrastructure are
some of the troubles the continent is coping with.
Speaking about Africa, we have to underline that this market is the center of interest of
many countries and companies. The appeal of Africa does not lie in its size – the continent
accounts for just 3% of the global economy – but in the dynamics that drive sustainable

19
growth at a time when the major established pharmaceutical markets face a more
uncertain future due to financial crisis or patent expirations. Africa is a hedge against a
possible slowdown in pharmerging countries and developed economies which are now
in plain growth. If some day these economies take a U-turn, then at least there are other
markets which are growing. The growing middle class on the African continent is going
to be the main consumer in few years which, at the same, will expand the demand for
medicine consumption.
Of course, not all the African countries have the same rate of growth and are equal in
terms of pharmaceutical growth. The main players, based on their spending on
pharmaceuticals, are southern and eastern states: South Africa, members of the South
African Development Community (SADC), East African Community (Tanzania, Uganda
and Kenia) and Eastern states, such as Egypt, Sudan, Ethiopia and Somalia, among others.
It is visible in Figure 3.
As we can see, Africa is not only different in terms of pharmaceutical growth. It is highly
heterogeneous in terms of language and trading blocks. On one side, this variability offers
quite a lot opportunities. On the other hand, one cannot apply the same models as in the
developed or emerging countries to make profits. Understanding the differences is clue
to success.
Figure 3: Spending on pharmaceuticals in 2007-2011 on the African continent
(percentage)
Source: Logendra et al. (2012)

20
3.2 Medical spending per capita and global launches of drugs
There exist two more factors that correlate with the geographical distribution according
to the producer: the annual spending on medicine per capita and the number of medicines
launched in the markets.
Medicine spending per capita and growth rates are different in high income and low
income countries. We can demonstrate it in a very simple calculus that it is true: the
population of the developed economies together is smaller than the population of one
pharmerging country: Europe, US, Japan and South Korea account together for
1,237,148,868 people while China has 1,390,510,630 inhabitants11. Now, the first group
spends more money that the second, we have seen it above in Figure 1, so that the
comparison is very obvious. Developed nations spend more money per capita on
medicine than emerging countries.
Rickwood et al. (2013, p. 6) shows the same: whereas in countries with a GNI of $25,000
or more per capita (advanced countries) the average spending on medicines is of $400-
$1,000, in countries with an annual income below $25,000 (emerging countries), the
spending lies in the interval of $10-$300.
Another factor that correlates with the geographical distribution of the pharmaceutical
market is the number of medicines being launched in developed and emerging countries.
Figure 4: Global Launches of NMEs in 2005-2012
Source: Rickwood et al. (2013)
11 World Population Statistics (2014).

21
In Figure 4, we can see that novel mechanisms and existing mechanisms are drugs that
are being commercialized most. They refer to innovative medicines (novelty
mechanisms), mostly sold in developed countries, and existing drugs, sold in both:
developed and emerging countries. Orphan diseases, typical for the African continent, are
the smallest group of interest. This figure demonstrates that majority of drugs is being
produced for developed countries, followed by emerging economies, and, at the very end,
African countries.
Unsurprisingly, pharma companies tend to focus on treating ailments which affect
developed, wealthy nations, and not the afflictions of those countries with less money. As
such, it is often the case that highly treatable, yet serious diseases, are left unstudied,
because there is little profit to be made from the communities in which these diseases are
most prevalent. Table 3 shows that drugs to prevent or help patients in high income
countries are being launched and R+D studies to increase their effectiveness are being
held (on average, 63 drugs in the late-stage R+D pipeline and 48 new drug launches).
Many common diseases in emerging markets, such as malaria, neonatal sepsis and
diarrhea, have been paid less attention: there are fewer products in the pipeline (26 on
average) and fewer launches (11 on average) (Table 3, Rickwood et al. (2013)).
Table 3: Disability-adjusted life year percentage in high income countries and globally,
R+D pipeline, new launches

22
The concept of disability-adjusted life year in Table 3 measures the overall disease
burden, expressed as the number of years lost due to ill-health, disability or early death12.
For example, 4.7 years are lost in high income countries due to strokes. It means that a
person that suffered from a stroke and died, could have lived 4.7 years longer if he/she
didn´t have it.
3.3 Product: Drugs
In the previous section, we have classified the medicines according to the patent
protection and the APIs. A pharmaceutical enjoying a patent protection is a branded
product, whereas when this patent expires and any company can manufacture the drug, it
becomes a generic. We provide some numerical data for brands and generics.
The global predictions for generics are very positive: The mix of total global spending on
medicines will shift toward generics over the next five years, rising from 27% to 36% of
the total by 2017, even as brands will continue to account for more than two thirds of
spending in developed markets. The estimation of Rickwood et al. (2013, p.23) is that
generics will gain importance and increase the market share in favor of the branded
pharmaceuticals: those whose patents have expired and which have been present in the
markets for a long time. Innovative and specialty treatments and biopharmaceuticals will
continue being sold, most probably as branded products. Figure 5 represents this situation.
On the other side, the use of generics will be at its highest point in pharmerging markets
where 63% of the spending on medicines will go to generic products. The most probable
answer to this phenomenon is the price of the product: emerging economies are unstable
organisms which do not dispose of a big budget for social issues. This is why the
governments cannot spend huge amounts of money on drugs and prefer buying cheaper
medicines in tenders, the same as international institutions that go for quantity and not
quality, believing that generics are safe and effective. Also, the emerging markets are still
behind developed economies as for innovation in medicine and, in face of growing
number of patients, opt for using traditional solutions.
12 American Medical Association complete medical encyclopedia (2003), p. 475.

23
On the opposite site from generics, there are the patented drugs. Some popular drugs,
such as Lipitor and Viagra, lost patent protection in 2011 and 2012, making Pfizer losing
a lot of money. Other drugs whose patents are going off in 2013-2016 are listed in Stone
(2013).
Figure 5: Global Spending in Drugs: Brand, Generic, Other in 2012-2017 (USD billion)
Source: Rickwood et al. (2013)
The leading pharmaceutical companies will lose between 14% and 41% of their existing
revenues as a result of patent expiries, according to PWC (2007). More numbers are
available in Table 4.
Table 4: Losses of big pharmaceutical companies due to patent expirations in 2010-2012
(USD billion)
Source: PWC (2007)
24
As anticipated in Section 2, big companies undertake actions to prolong the life of a patent
or maintain the same sales volume. There are administrative and marketing actions to
achieve this goal, apart from some illegal activities. We will describe all of them.
A very efficient way to postpone the entrance to the market of generic medicines is to
apply to the administration for an additional period of protection, mostly 5 years, due to
the delays caused during the registration process of a patent and approvals for the
commercialization of a specific product. This approval is present in many FTAs between
the US and South American countries such as Colombia, Panama and Peru.
For an illegal action to protect the patent accounts the agreement to pay a generic
competitor certain amount of money to hold its competing product off the market for an
agreed period of time. These so-called “pay-for-delay” contracts have arisen as part of
patent litigation settlement agreements between brand-name and generic pharmaceutical
companies. However, consumers lose: they keep on paying the higher price for a branded
product, in many cases 7 to 10 times more as for a generic drug.
The most numerous group of actions undertaken by companies to prevent a decrease in
sales is the marketing group. Firstly, firms create a premium price based on the brand's
prestige. Big companies are aware of the fact that the majority of patients doesn't know
the market and the different prices or even that a generic has been commercialized for the
same drug they're using. They take advantage of this fact and reinforce publicity and
marketing actions for their brands. Secondly, pharmaceutical companies undertake
advertising campaigns designed to demonstrate that imitations do not have the same
quality of the original product, which technically is attributed to differences in
bioequivalence and relevant drug absorption.
Also, we have to consider the consumer’s perception. Sometimes he/she prefers to stick
to one brand medicine due to brand loyalty or habits. Philip Kotler in his big work
Marketing Management defines loyalty as:
A deeply held commitment to rebuy or repatronize a preferred product or service in the
future despite situational influences and marketing efforts having the potential to cause
switching behavior13.
13 Kotler (2009), p. 163.

25
There are several actions a company can undertake to retain the customer, particularly
promising to deliver benefits in form of value, effectiveness and safety (for
pharmaceuticals). In case of other products, it could be social benefits or a very reliable,
24/7 service. The goal of the firms, in reference to the customers, should always be to
increase the Customer-perceived value (CPV) which is:
The difference between the prospective customer’s evaluation of all the benefits and all
the costs of an offering and the perceived alternatives14.
The higher this value, the higher the willingness of the customers to rebuy our product.
Another group of customers mentioned by Kotler are the hardcore loyals15 who always
buy the same product: they believe strongly in the quality of the product and identify its
strengths, what makes them stick to it. What’s more, they do not know how their bodies
would react to a new product, in this case a drug, and prefer not testing it, although the
APIs are proved to be the same. Pharmaceutical companies may be very interested in
localizing this group of customers and retaining them.
Summarizing: although generics may be up to 10 times cheaper, there is no assurance that
they will always be the option to be chosen. However, pharmaceutical companies should
reconsider their sales strategies for the next five years, because generics will be gaining
more weight in the pharmaceutical market continuously, despite the obstacles.
The second classification refers to the APIs: NCEs/NMEs vs. biopharmaceuticals.
According to Rickwood et al. (2013), an increasing number of new molecular entities
(NMEs) is estimated to address unmet needs in specialty disease areas and orphan
diseases, as well as target smaller patient populations that suffer from: arthritis, systematic
fibrosis, melanoma, ovarian cancer, multiple sclerosis, hepatitis C, and malaria.
Innovation, the ultimate engine of growth for the global provision of medicines, is
projected to see a revival of activity through 2017 after a slow-down due to the crisis.
Although the majority of NMEs mainly address patients in high income countries, some
of the emerging countries have improved their economic situation and offer very
profitable opportunities to pharmaceutical companies like new treatment options,
including malaria, neonatal sepsis and tuberculosis.
14 Idem, p. 161. 15 Idem, p. 264.
26
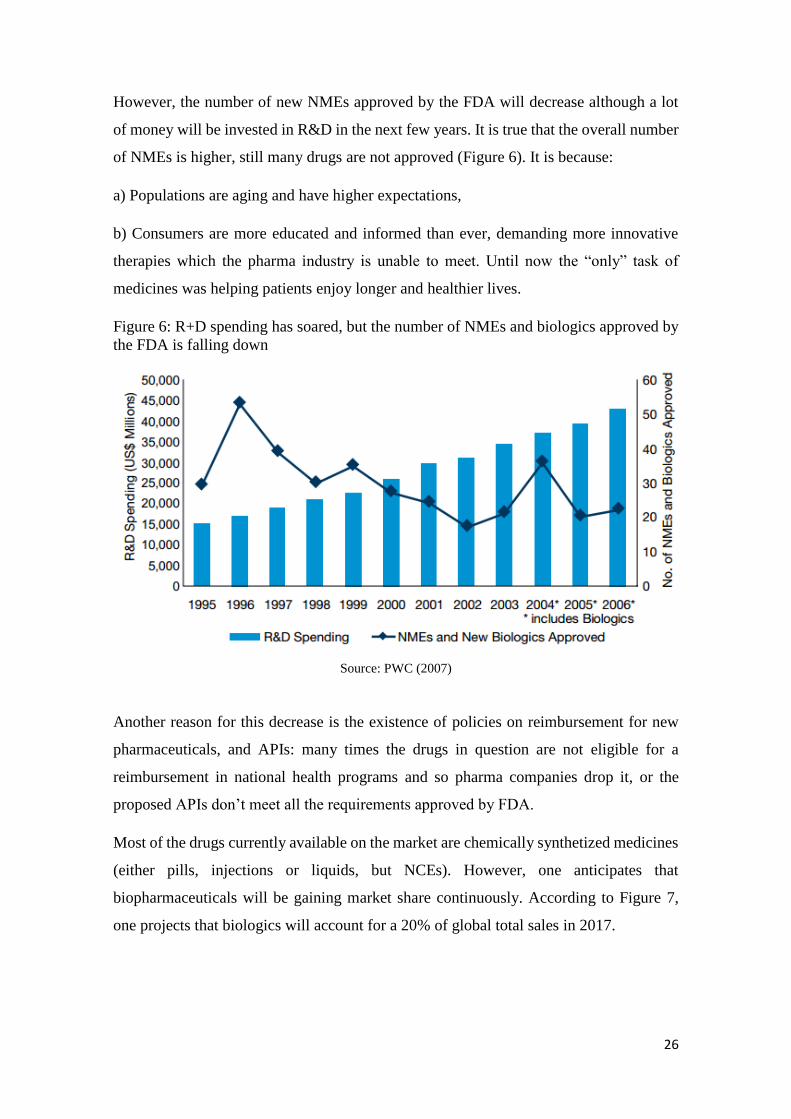
However, the number of new NMEs approved by the FDA will decrease although a lot
of money will be invested in R&D in the next few years. It is true that the overall number
of NMEs is higher, still many drugs are not approved (Figure 6). It is because:
a) Populations are aging and have higher expectations,
b) Consumers are more educated and informed than ever, demanding more innovative
therapies which the pharma industry is unable to meet. Until now the “only” task of
medicines was helping patients enjoy longer and healthier lives.
Figure 6: R+D spending has soared, but the number of NMEs and biologics approved by
the FDA is falling down
Source: PWC (2007)
Another reason for this decrease is the existence of policies on reimbursement for new
pharmaceuticals, and APIs: many times the drugs in question are not eligible for a
reimbursement in national health programs and so pharma companies drop it, or the
proposed APIs don’t meet all the requirements approved by FDA.
Most of the drugs currently available on the market are chemically synthetized medicines
(either pills, injections or liquids, but NCEs). However, one anticipates that
biopharmaceuticals will be gaining market share continuously. According to Figure 7,
one projects that biologics will account for a 20% of global total sales in 2017.

27
Figure 7: The biologics market 2002-2017 (USD billion)
Source: Rickwood et al. (2013)
3.4 Demand: Diseases
In Section 2, we have presented the classification of diseases in a very simplified way. In
this Section, we will deepen this subject providing numbers for: the leading causes of
death, biggest therapies areas, health care use among different age groups, as well as name
main risk factors for mortality. Although the main risk factors for mortality are not
essential for our paper, we would like to raise awareness among our readers and prevent
them from these risk factors.
The leading risk agent for mortality is high blood pressure, responsible for 13% of deaths
globally, and the childhood underweight is the leading risk factor for burden of disease
and is responsible for over 2 million children dying per year, mainly in low-income
countries. But these are not the only relevant figures. Also environmental risks such as
unsafe water, sanitation, hygiene and indoor smoke from solid fuels cause around 2
million children deaths per year; not to mention the low fruit and vegetable intake,
physical inactivity, alcohol and tobacco intake, overweight and obesity, high cholesterol,
and high blood glucose. All of the above factors are responsible for more than half of the
deaths due to heart disease, the leading cause of death in the world16.
However, our intention is to focus on the most widespread diseases in the world, not the
leading risk factors for mortality. In the section that follows, we will not differentiate
16 Mathers (2009), p. V.

28
between adults and children, but treat them as a global sample (WHO always
differentiates between children under the age of five and the rest of population, mainly
because one of its priorities is to decrease mortality among children under five). For our
purposes, we have used statistics that show the leading causes of death globally, not data
about people becoming sick and people in actual treatment. There is one reason for our
choice: data about numbers of deaths is more reliable than data about people having some
disease. Usually, deaths are registered, while some people with diseases such as cancer
or HIV infection are not aware of having it because they are not visible (no symptoms in
first stages). According to Table 5, CVDs are number 1 cause for death in the world. It is
followed by infectious diseases (HIV infections/AIDS, TB, hepatitis B and C, diarrhea,
malaria), cancer of all types (breast, prostate and lung cancer being the most widespread
ones17), respiratory diseases and injuries (including road accidents, poisonings and falls,
among others, which we won’t consider in this study; nor will we contemplate neonatal
conditions such as preterm birth complications, birth asphyxia etc.)
Table 5: 10 Leading broad causes of death (thousands)
Source: GHE (2013)
Although the WHO states that the most common diseases in the world are the above ones,
it does not coincide with the production of drugs by pharmaceutical companies, which
we will see next in Figure 8. Of course, not all of the medicines generate the same benefits
and it is obvious that trade and capital flows are always ahead of the people. Despite the
fact that they occur less frequently (according to Table 5), oncology and diabetes (number
17 World Cancer Research Fund International (2014).

29
3 and 8, respectively, in Table 5) receive more attention than infectious and respiratory
diseases (number 2 and 5, respectively, in Table 5) (in high income countries).
Summarizing, diseases with a lower percentage of deaths receive more attention from
pharmaceutical companies than diseases responsible for more deaths. It demonstrates
perfectly that oncology and diabetes must be more profitable for the pharma companies.
Figure 8 represents how disease areas are expected to differ depending on the region (a
prediction for 2017). On the left hand side, the developed markets are estimated to invest
primarily in oncology and diabetes drugs, while on the right, the pharmerging markets,
anticipate to focus on pain, antibiotics and Central Nervous Systems (CNSs) drugs. Also,
we can say that it is more probable that developed markets will invest more in specialty
drugs than the pharmerging markets. Half of the first ten projected areas are specialty
areas whereas, in pharmerging countries, they are only two out of ten.
Figure 8: Estimated spending by therapy area in 2017 (USD billion)
Source: Rickwood et al. (2013)
Two reasons are responsible for this situation: populations in developed markets get older
and gain on weight, making cancer and diabetes illnesses number one (the so called
diseases of affluence), apart from other chronic diseases that require a long time treatment.
As stated in PWC (2007):
30
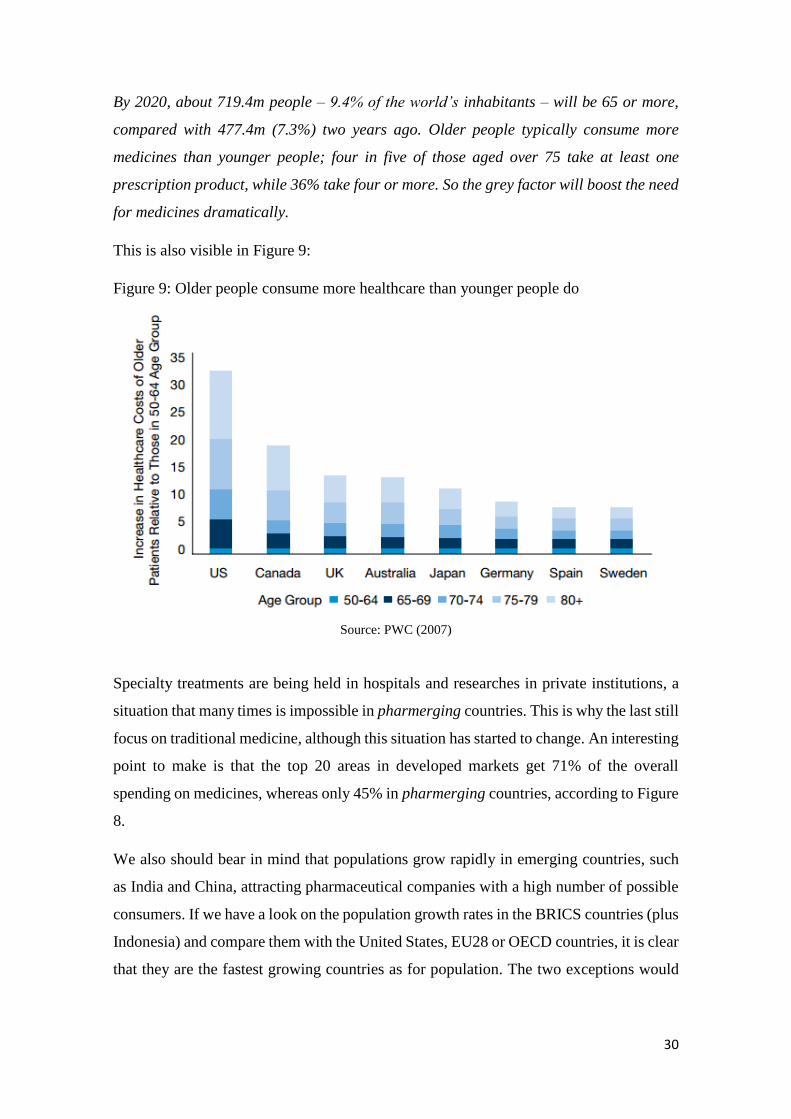
By 2020, about 719.4m people – 9.4% of the world’s inhabitants – will be 65 or more,
compared with 477.4m (7.3%) two years ago. Older people typically consume more
medicines than younger people; four in five of those aged over 75 take at least one
prescription product, while 36% take four or more. So the grey factor will boost the need
for medicines dramatically.
This is also visible in Figure 9:
Figure 9: Older people consume more healthcare than younger people do
Source: PWC (2007)
Specialty treatments are being held in hospitals and researches in private institutions, a
situation that many times is impossible in pharmerging countries. This is why the last still
focus on traditional medicine, although this situation has started to change. An interesting
point to make is that the top 20 areas in developed markets get 71% of the overall
spending on medicines, whereas only 45% in pharmerging countries, according to Figure
8.
We also should bear in mind that populations grow rapidly in emerging countries, such
as India and China, attracting pharmaceutical companies with a high number of possible
consumers. If we have a look on the population growth rates in the BRICS countries (plus
Indonesia) and compare them with the United States, EU28 or OECD countries, it is clear
that they are the fastest growing countries as for population. The two exceptions would

31
be Russia and China, probably because of the policy of one child (Table 6, data only
available until 2012).
Table 6: Population growth rates (annual growth in %)
Source: OECD (2014)
These numbers can boost the demand for medicines drastically. Pharmaceutical
companies should foresee this demand and have in stock the mostly bought drugs in
emerging markets.
3.5 Buyers: Who pays?
We have seen previously that the two main agents who pay are the governments and
international institutions, as well as patients through private clinics and medical insurance
agencies. Figure 10 shows the global spending on medicines of both agents in 2007 and
2012 and the estimated growth for the period: 2013-2017:
Figure 10: Global spending on medicines in 2008-2017 (USD billion) and estimated
growth
Source: Rickwood et al. (2013)

32
Once we have introduced governments as one of the agents responsible for drug bills in
Section 2, we would like to focus on some governmental policies on health care
undertaken in emerging countries to show that spending on medicines and medical care
by the governments is projected to increase in the near future.
Domestic policies on health systems in the emerging economies play an important role
for the spending on pharmaceuticals. For example, China implemented a four-year plan
(2012 to 2015) for the prevention and control of chronic diseases. In India, by 2016, health
insurance is planned to reach half of the Indian population (630 million people), mainly
by broadening basic healthcare provision to families living below the poverty line.
Russian government is responsible for a significant investment in healthcare, which
announced plans to increase healthcare spending from 5.6% of GDP in 2012 to 7.5% by
2020, including a national health insurance scheme covering drugs in the retail setting18.
Comparable to pharmerging markets, government, but also NGOs and private sector in
Africa invest in the health systems across the continent, strengthening the infrastructure,
capacity building, treatment provision and specialized services (Logendra et al. (2012).
In reference to international institutions that assure health care to a huge number of
people, we would like to introduce the World Health Organization (WHO) and its actions
undertaken to change limited access to health care, such as the Millennium Development
Goals, and one of its tools, the universal health coverage. MDGs is an agreement between
all the world’s countries and all the world’s leading development institutions in order to
meet the needs of the world’s poorest. Among them, we find three goals that are of our
particular interest, which are: reduce child mortality, improve maternal health (both
indirectly linked to the pharmaceuticals), and combat HIV/AIDS, malaria, tuberculosis
and other major communicable diseases (directly linked to pharmaceutical companies).
The last one has to do with the desire to lower the number of new infections, provide
health care for people living with HIV, expand access to antiretroviral therapy in poor
countries, and disseminate knowledge of HIV transmission, especially among young
people. As for malaria, the main goal is to diminish deaths from this disease19.
In order to achieve the MDGs and in the face of unequal access to health systems around
the world, the WHO is trying to introduce the universal health coverage which goal is to
18 Hill (2013). 19 Dye et al. (2013), p.iv-v.

33
offer all the populations equal access to treatments and medicines without a risk of
financial ruin or impoverishment.
In 2005, all WHO Member States made the commitment to achieve universal health
coverage. The commitment was a collective expression of the belief that all people should
have access to the health services they need […]. Working towards universal health
coverage is a powerful mechanism for achieving better health and well-being, and for
promoting human development20.
What is more, apart from the principal goal of providing with health coverage all the
people in the world, its secondary objective is to improve the quality of live and ensure
peace and security around the globe. It sounds logical: if the majority of countries offer
the same life quality, migration for medical reasons is going to decrease and so will do
political conflicts.
How the WHO wants to introduce the Universal Health Coverage? Along with the
increasing GDP in emerging countries and a higher spending on public health systems,
which automatically will cover more people with appropriate services, WHO’s General
Director, Mr. Margaret Chan, suggests improve the efficiency of the services offered
instead of cutting on the public systems in this period of austerity21. Continuously, better
hiring procedures would assure more health professionals and a higher quality of services.
What matters is quality, not quantity, she emphasizes22. There are other proposals of how
and where to find money for larger health coverage: a higher use of generics, prophylaxis
(healthy diet and more exercise) promoted by the governments, a better use of the
resources, more incentives for the suppliers, available financing at low interest rates and
simplified administrative procedures. She underlines the relevance of community-based
interventions as a measure to improve overall health level and make the health coverage
universal: conscious communities will boost healthy praxis among the populations and
make them claim their rights for the health coverage. Specific data about the universal
health service coverage and health systems can be found in point 4: Health Service
Coverage, and point 6: Health systems (World Health Statistics, 2014).
20 Idem, p. xi. 21 Evans et al. (2010), p. vi-vii. 22 Idem, p. vi.
34
In reference to private clinics and medical insurance, not all the countries offer basic
health coverage so some patients opt to pay it from their own pocket. On the other side,
sometimes only basic services are paid by the national health system, and additional
services have to be paid by the patient. In these situations patients opt for private clinics
disappointed with the public health system or because a specialist has been recommended
by a family member or friend.
35
4. Interferences from the empirical description
From the empirical description, we can extract the following information for each market,
presented in Tables 7.1 – 7.6, containing each decisive factor (type of producer, product,
demand, buyers).
As we have discarded MNCs previously and, automatically, developed countries, we will
consider for our models only pharmerging economies with their national companies, and
African local companies. The tables below pretend to show in percentages the most viable
options in drugs for each market and tendencies of purchases for public and private
agents23.
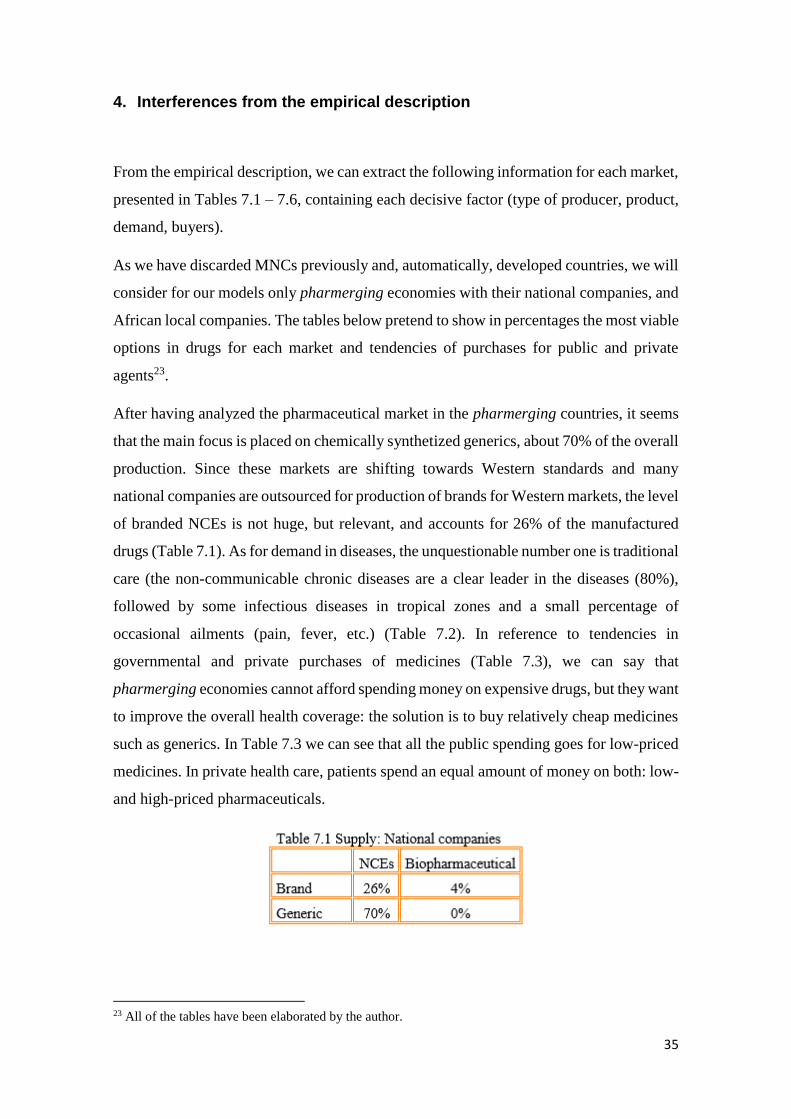
After having analyzed the pharmaceutical market in the pharmerging countries, it seems
that the main focus is placed on chemically synthetized generics, about 70% of the overall
production. Since these markets are shifting towards Western standards and many
national companies are outsourced for production of brands for Western markets, the level
of branded NCEs is not huge, but relevant, and accounts for 26% of the manufactured
drugs (Table 7.1). As for demand in diseases, the unquestionable number one is traditional
care (the non-communicable chronic diseases are a clear leader in the diseases (80%),
followed by some infectious diseases in tropical zones and a small percentage of
occasional ailments (pain, fever, etc.) (Table 7.2). In reference to tendencies in
governmental and private purchases of medicines (Table 7.3), we can say that
pharmerging economies cannot afford spending money on expensive drugs, but they want
to improve the overall health coverage: the solution is to buy relatively cheap medicines
such as generics. In Table 7.3 we can see that all the public spending goes for low-priced
medicines. In private health care, patients spend an equal amount of money on both: low-
and high-priced pharmaceuticals.
23 All of the tables have been elaborated by the author.

36
Speaking about the African market, we have seen previously in Section 3 that the main
causes of death are infectious diseases such as HIV infections/AIDS, malaria, and TB.
This is reflected in Table 7.4: the main emphasis, 80%, is placed on communicable
diseases, followed by a growing sector of non-communicable chronic diseases (15%).
Local companies provide mostly generics (95%) and only 5% of branded drugs (Table
7.5). This has an explanation in the political and financial situation of the agents:
governments and global institutions go for quantity than quality in order to save the
biggest number possible of lives (paying a lower price, you can get more of a product).
The same is evident in Table 7.6: the purchases of cheap medicines by public agents
account for 90% of overall spending, leaving the rest to private clinics.

37
The above percentages reflect the present and might be acknowledged as likely to persist
in the near future (5 years from now), since the pharmaceutical market is not likely to
change very quickly. It takes a generation (about 20-25 years) to alter tendencies in
diseases, as it occurs with celiac children or diabetic patients: about 2 decades ago nobody
knew what it means to suffer from the celiac disease or being diabetic. Nowadays, they
have both become very common and widespread problems.
What’s more, it is possible that the above assumptions might be altered by demographic,
migratory, legal, political, corporate, and climate changes, such as: growing global
population, high migration to cities, new laws on patents for drugs, political situation in
unstable regions, incentives for creating national companies in pharmerging countries,
and global warming.
Growing global population may not change significantly in 5 years, but it will do
so in two decades. Depending on where the increase is the highest, more producers
and drugs will appear in order to respond to the market demand.
Secondly, people moving to cities, a very common currently phenomenon in
emerging countries will be responsible for creation of new bacteria and diseases.
Growing cities in emerging countries are a bustle and maintaining basic hygiene
is many times impossible. The pollution makes these places very unhealthy to
human lives and provokes higher mortality due to high density. (In change, in
Western cultures, we see the contrary movement: out of the cities, looking for
fresh air and a peaceful environment after a busy day. In emerging countries,
living in the city is still perceived as a symbol of success.)
Thirdly, the legal alternations in laws on patents may boost the production of
branded drugs or, depending on the law, make the producers abandon this branch
of industry.
We should not forget about political issues, such as the current situation in
Ukraine, which, in case of becoming a conflict of arms, may completely change
the current production of medicines.
It is possible that pharmerging countries will encourage the creation of national
companies and strengthen their development as a way to open successful MNCs.
Governments of these countries could create laws reinforcing these companies,

38
and not foreign companies. It has already happened in the past with the computer
technology brand Lenovo®, which is currently the owner of IBM personal
computer business (acquired in 2005) and Motorola Mobility (bought it January
2014), or Pearl River® pianos, Chinese pianos that achieved to become an
international recognized brand for instruments.
Lastly, climate change will have enormous implications for human health,
especially for the burden of infectious diseases24. Many scientists believe that
global warming could bring diseases such as malaria, cholera, diphtheria and
dengue fever to more developed regions. That would provoke a come-back of
diseases that so much has cost to decrease on global scale. If this happens, the
production of innovative drugs, specialty area treatments and traditional care
medicines would shift to anti-infectives.
24 Shuman (2010).

39
5. Conclusion
In this part, we would like to introduce the theory of Mike W. Peng, an American scientist
from the University of Texas at Dallas, and his institution-based view and the resource-
based view. This theory, reinforced by cinematographic and literary examples, described
next, give an explanation of why Africa fails to have strong national and multinational
companies, why it is in the last place in innovation and progress in pharmaceuticals, and
also what makes it a risky region to invest.
In order to answer the question Why do firms fail or succeed in different countries and
regions?, Peng argues that the decisive factors are institutions and resources, which in
turn govern global economics25. Institutions are the rules of the game - both formal and
informal. Now, formal constraints include laws, regulations, and rules. Informal
limitations are norms, cultures, and ethics, which can be continuously divided into
normative and cognitive supportive pillars. Referring to the resource-based view, Peng
suggests using the SWOT (strengths - weaknesses - opportunities - treats), but even more
the VRIO framework (value - rarity - imitability - organization) when evaluating the
companies26.
Peng's theory is especially valuable when applied to international business. When going
abroad, familiar rules of the game are often not available. To capture the hearts, minds,
and wallets of customers in other markets, companies need to pay attention to the rules
of the game there, especially unwritten informal ones. As Michael Peng says,
Coca-Cola and PepsiCo, whose products have been perfectly legal, have been singled
out by activists in India for selling allegedly contaminated products.27 Under certain
institutional conditions, a cost leadership strategy can be accused of being unethical -
think of the trouble Wal-Mart faced by pursuing the "everyday low price" strategy. Under
other conditions, a cost leadership strategy may become illegal - in the Japanese
bookselling industry, price fixing is legal while price competition is banned (!)28.
25 Peng (2013), p. 32. 26 Idem, p. 100. 27 Peng et al. (2008). 28 Peng et al. (2009).

40
It all depends on the country we come from or operate in. If a corporate behavior is
accepted in one country, it does not necessarily have to be so in another one. Unethical
and illegal actions in one reality occur on daily basis in others.
Guns, Germs and Steel’s author, Jarod Diamond supports this theory in his book. He
states that not just geography, religion, history, and culture have a big effect on national
wealth and on personal incomes, but also institutions. He goes further and makes us think
about historic events that affected this region such as the colonization by European
nations or the apartheid. Actually, the authors looked back over thousands of years of
human history to examine fundamental questions behind why some societies built
empires while others withered.
The history of interactions among disparate peoples is what shaped that modern world
through conquest, epidemics, and genocide. Those collisions created reverberations that
have still not died down after many countries, and that are actively continuing in some of
the world’s most troubled areas today. For example, much of Africa is still struggling
with its legacies from recent colonialism. In other regions – including much of Central
America, Mexico, Peru, New Caledonia, the former Soviet Union, and parts of Indonesia
– civil unrest or guerrilla warfare pits still – numerous indigenous populations against
governments dominated by descendants of invading conquerors.29
To keep it short, even if companies show all the required variables to succeed, depending
on their location, they can fail due to national institutions. Or the other way round:
although being located in perfect environment (business opportunities, geography for
logistics and human knowledge), many firms will fail due to a weak VRIO framework.
Many of us who have seen The Constant Gardener, have been thinking about what
attracts pharmaceutical companies to test drugs in African countries (the main focus of
this movie in placed on illegal clinical trials led by multinational pharmaceutical
companies, and the attempt to hide deaths caused by the drugs). The leitmotifs in other
movies showing African realities are: dictatorship of Idi Amin in The last king of
Scotland, diamonds mines in Sierra Leone during the Civil War 1996-2001 and a country
torn apart by the struggle between government’s loyalists and insurgent forces (Blood
Diamond, the Rwandan genocide in 1994 in Hotel Rwanda30. The existing corruption,
29 Diamond (1997), p. 16-17. 30 Wikipedia (2014).

41
fights between tribes and lack of health systems play an important role, too. And here
comes the theory of Peng: weak formal institutions are unable to fight deeply rooted
corruption and mostly analphabet populations, provide an efficient health systems and
security for its inhabitants. Although the continent is rich in natural resources, such as
gold, oil, diamonds, ivory and rubber, they are exploited and neither miners nor
inhabitants get profits from this industry. The benefits go to private hands, boost more
corruption and start political and tribal disputes. Political parties remain in power for
years (regimes) and force people to emigrate looking for better lives. In other regions,
political systems change every year or more often, provoking protests and strikes,
stopping production, supplies of electricity, and classes in school, causing unnecessary
deaths.
Analyzed from the resource-based point of view, despite many natural resource and
perfect geographic location (one could grow plants throughout the year thanks to the
warm climate), Africa fails to be successful and foster health economic environment. The
faulty factor are the weak institutions and lack of regulations or lack of organisms that
would push through these regulations.
What implication does this theory have on the pharma industry? Pharmaceutical
companies are taking advantage of the "unique" opportunity of leading drug trials in
African regions without being stopped by weak institutions: firstly, people need money
and what is easier than swallow a pill and get paid for it. Secondly, the majority of the
people are analphabets, so they won’t be able to read on the package about the side effects.
Thirdly, it seems that African governments are so corrupt that they would take any money
to allow the trials; they simply do not care about Africans.
The above factors make Africa an unstable region where doing business is very unsure
and unpredictable. In one word, it is a high-risk market and many investors will cross it
from the list. Also, continuous stops in production and supplies do not make this market
very reliable. Finally, lack of investments result in lack of researches and Africa remains
in the last place in innovation and progress in pharmaceuticals.

42
References
1. Blood Diamond [video]. Directed by Edward Zwick. Warner Bros: 2006. Ca. 143
min.
2. Diamon, Jared, Guns, Germs and Steel. The Fates of Human Societies. W.W.
Norton&Company, New York, 1997.
3. Dye, Ch., Boerma, T., Evans, D., Harries, A., Lienhardt, Ch., and others, The
World Health Report 2013: Research for Universal Health Coverage. WHO,
Luxembourg, 2013.
4. Evans, D.B., Elovainio, R., Humphreys, G., and others, The World Health Report
2010: Health systems financing: the path to universal coverage. WHO, 2010.
5. Fjose, S., Grünfeld, L.A., Green, Ch., SMEs and growth in Sub-Saharan Africa.
Identifying SME roles and obstacles to SME growth. MENON Business
Economics, no. 14/2010, June 2010.
6. Global Health Estimates Summary Tables: Deaths by cause, age and sex, June
2013, WHO, Geneva, Switzerland, 2013.
7. Hill, R., Chui, M., The Pharmerging future. Pharmaceutical Executive, The
Business Magazine of Pharma, Vol. 29, No. 7, July 2009.
8. Hotel Rwanda [video]. Directed by Terry George. Lions Gate Entertainment:
2004. Ca. 121 min.
9. Kotler, Philip, Marketing Management. Pearson Prentice Hall, 2009, 13th ed.
10. Law, H., Bhattacharya, S.R., China’s pharmaceutical industry – Poised for the
giant leap. KPGM, 2011.
11. Leikin, J. B., Lipsky, M. S., American Medical Association complete medical
encyclopedia. Random House Reference, 2003, University of Michigan.
12. Logendra, R., Rosen, D., Rickwood, S., Africa: A ripe opportunity.
Understanding the pharmaceutical market opportunity and developing
sustainable business models in Africa. IMS, 2012.
13. Mathers, C., Stevens, G., Mascarenhas, M., Global Health Risks: Mortality and
burden of disease attributable to selected major risks. WHO, 2009.
14. OECD.Stats Extracts, 2014. http://stats.oecd.org/ consulted on May 26, 2014.
15. Paul E. Farmer, Chronic Infectious Disease and the Future of Health Care
Delivery. The New England Journal of Medicine, 369:2424-2436. December 19,
2013.
16. Pay-for-Delay. How Drug Company Pay-Offs Cost Customers Billions. Federal
Trade Commission, January 2010.

43
17. Peng, M. W., Sun, S. L., Pinkham, B., Chen, H., The Institution-Based View as a
Third Leg for a Strategy Tripod. Academy of Management Perspectives, August,
2009.
18. Peng, M. W., Wang, D. YL., Jiang, Y., An institution-based view of international
business strategy: a focus on emerging economies. Journal of International
Business Studies, Vol. 39, No. 5, 2008.
19. Peng, Mike W., Global Business. South-Western CENGAGE Learning, 2013, 3rd
ed.
20. Pharma 2020: The vision. Which path will you take? PWC, 2007.
21. Rickwood, S., Kleinrock, M., Núñez-Gaviria, M., The Global Use of Medicines:
Outlook through 2017. IMS Institute for Healthcare Informatics, November 2013.
22. Schmit, Julie, Avian flu scare has Tamiflu maker navigating minefield. USA
Today, posted on July 12, 2005,
http://usatoday30.usatoday.com/money/industries/health/drugs/2005-12-06-
roche-tamiflu_x.htm?csp=N009 consulted on May 26, 2014.
23. Shuman, Emily K., Global Climate Change and Infectious Diseases. The New
England Journal of Medicine, 362:1061-1063. March 25, 2010.
24. Stone, Kathlyn, Which popular drugs are going off-patent in 2013-2016?
http://pharma.about.com/od/BigPharma/a/Which-Popular-Drugs-Are-Going-
Off-Patent-In-2013-2016.htm consulted on June 5, 2013.
25. The Constant Gardener [video]. Directed by Fernando Meirelles. Focus Features:
2005. Ca. 129 min.
26. The Dominican Republic – Central America – United States Free Trade
Agreement, CAFTA-DR, Article 15.9: Patents, point 6.b.
http://www.sice.oas.org/trade/cafta/caftadr_e/chapter13_22.asp#Article15.9
consulted on May 26, 2014.
27. The last king of Scotland [video]. Directed by Kevin MacDonald. Fox Searchlight
Pictures: 2006. Ca. 123 min.
28. The World Bank, 2014. http://data.worldbank.org/data-catalog/world-
development-indicators consulted on May 26, 2014.
29. Wikipedia. The Free Encyclopedia, 2014.
http://en.wikipedia.org/wiki/Main_Page consulted on June 9, 2014.
30. Willron, Alley, The most profitable companies in the Global 500. Fortune
Magazine, July 8, 2013.
31. World Cancer Research Fund International, 2014.
http://www.wcrf.org/cancer_statistics/world_cancer_statistics.php consulted on
May 22, 2014.
44
32. World Health Statistics 2014. WHO, 2014.
http://apps.who.int/iris/bitstream/10665/112738/1/9789240692671_eng.pdf?ua=
1 consulted on May 13, 2014.
33. World Population Statistics, 2014.
http://www.worldpopulationstatistics.com/countries/ consulted on June 5, 2014.


