91
PharmCAS Applicant Data Report 2019-2020 2019-2020 PharmCAS Applicant Data Report 2019-2020 Admissions Cycle for the 2020 Entering Class

PharmCAS Applicant Data Report 2019-2020
2019-2020
PharmCAS Applicant Data Report 2019-2020 Admissions Cycle for the 2020 Entering Class

PharmCAS Applicant Data Report 2019-2020
All uses of this data should reference the American Association of Colleges of Pharmacy (AACP) as the source of the data and acknowledge that AACP bears no responsibility for interpretations presented or conclusions reached based on analysis of the data. 2
CONTENTS
Institutions Participating in PharmCAS: 2019-2020 ............................................................................................. 4 Overall Applicant and Application Trends ........................................................................................................... 6
Figure 1: PharmCAS Participation, Applicant, and Application Trends (2004-2020) ................................................ 6 Figure 2: Number of Schools Participating in PharmCAS (2004-2020) ..................................................................... 7 Figure 3: PharmCAS Applications per Applicant Ratio (2004-2020) ......................................................................... 7 Figure 4: Total Number of PharmCAS Applications (2004-2020) .............................................................................. 8 Figure 5: Total Number of PharmCAS Applicants (2004-2020) ................................................................................. 8 Figure 6: PharmCAS Applications per School (2004-2020) ....................................................................................... 9 Figure 7: Mean Number of PharmCAS Applications per School (2004-2020) ........................................................... 9 Figure 8: PharmCAS Early Decision Applicants and Schools (2013-2020) ............................................................... 10 Figure 9: PharmCAS Accepted Applicants (2004-2020) .......................................................................................... 10
Age and Sex ...................................................................................................................................................... 11 Figure 10: PharmCAS Applicants by Age and Sex.................................................................................................... 11 Figure 11: Accepted PharmCAS Applicants by Age and Sex .................................................................................... 11 Figure 12: Percentage of PharmCAS Applicants by Age and Sex ............................................................................ 12 Figure 13: Percentage of Accepted PharmCAS Applicants by Age and Sex ............................................................ 12 Figure 14: Percentage of PharmCAS Applicants by Sex and Acceptance Status ..................................................... 13 Figure 15: PharmCAS Applicants by Sex per Cycle (2004-2020) ............................................................................. 14 Figure 16: Percentage of PharmCAS Applicants by Sex per Cycle (2004-2020) ...................................................... 15 Figure 17: Accepted PharmCAS Applicants by Sex per Cycle (2004-2020) ............................................................. 16 Figure 18: Percentage of Accepted PharmCAS Applicants by Sex per Cycle (2004-2020) ...................................... 17
Race/Ethnicity .................................................................................................................................................. 18 Figure 19: PharmCAS Applicants by Race/Ethnicity and Sex .................................................................................. 18 Figure 20: Accepted PharmCAS Applicants by Race/Ethnicity and Sex .................................................................. 19 Figure 21: PharmCAS Applicants by Race/Ethnicity and Acceptance Status .......................................................... 19 Figure 22: Percentage of MALE PharmCAS Applicants by Race and Acceptance Status ........................................ 20 Figure 23: Percentage of FEMALE PharmCAS Applicants by Race and Acceptance Status ..................................... 20 Figure 24: PharmCAS Applicants by All Race and Ethnicity Designations ............................................................... 21 Figure 25: Percentage of PharmCAS Applicants by Race Designations and Acceptance Status ............................. 21 Figure 26: Percentage of PharmCAS Applicants by Race Designations and State .................................................. 22 Figure 27: PharmCAS Applicants by Race/Ethnicity per Cycle (2004-2020) ........................................................... 24 Figure 28: Percentage of PharmCAS Applicants by Race/Ethnicity per Cycle (2004-2020) .................................... 25
Disadvantaged Status ........................................................................................................................................ 26 Figure 29: PharmCAS Applicants by Education Occupation (EO) Status ................................................................. 26 Figure 30: Economically Disadvantaged Applicants ................................................................................................ 27 Figure 31: Environmentally Disadvantaged Applicants .......................................................................................... 27
Citizenship ........................................................................................................................................................ 28 Figure 32: PharmCAS Applicants by Citizenship Status ........................................................................................... 28 Figure 33: Percentage of PharmCAS Applicants by Citizenship Status ................................................................... 28 Figure 34: Percentage of Accepted PharmCAS Applicants by Citizenship Status ................................................... 28
Permanent State of Residency ........................................................................................................................... 29 Figure 35: PharmCAS Applicants by Permanent State of Residency and Acceptance Status ................................. 29 Figure 36: Permanent State of Residency of PharmCAS Applicants Sorted by Volume ......................................... 31
Grade Point Averages (GPAs) ............................................................................................................................ 33 Figure 37: PharmCAS GPAs by Sex and Acceptance Status .................................................................................... 33 Figure 38: Mean Cumulative Undergraduate GPA for PharmCAS Applicants ........................................................ 34 Figure 39: Mean Overall Undergraduate Science GPA for PharmCAS Applicants .................................................. 34

PharmCAS Applicant Data Report 2019-2020
All uses of this data should reference the American Association of Colleges of Pharmacy (AACP) as the source of the data and acknowledge that AACP bears no responsibility for interpretations presented or conclusions reached based on analysis of the data. 3
Figure 40: Undergraduate GPAs for Accepted PharmCAS Applicants by Cycle (2004-2020) .................................. 35 Figure 41: Undergraduate GPA for Accepted PharmCAS Applicants by Cycle (2004-2020) ................................... 36 Figure 42: Science GPA for Accepted PharmCAS Applicants by Cycle (2004-2020) ................................................ 36
Degrees Earned ................................................................................................................................................. 37 Figure 43: Degrees Earned by PharmCAS Applicants .............................................................................................. 37 Figure 44: Summary of Degrees Earned by PharmCAS Applicants ......................................................................... 41
College Majors .................................................................................................................................................. 42 Figure 45: College Majors for PharmCAS Applicants .............................................................................................. 42 Figure 46: Most Identified College Majors for Accepted PharmCAS Applicants .................................................... 48
Primary Institutions Attended ........................................................................................................................... 49 Figure 47: Primary Institutions Attended for PharmCAS Applicants ...................................................................... 49 Figure 48: Top Primary Institutions Attended by Accepted PharmCAS Applicants ................................................ 85
PharmCAS Fee Waivers ..................................................................................................................................... 86 Figure 49: PharmCAS Fee Waiver Summary ........................................................................................................... 86 Figure 50: PharmCAS Fee Waiver Requests and Actions ........................................................................................ 86 Figure 51: PharmCAS Fee Waiver and Early Decision Status .................................................................................. 87 Figure 52: PharmCAS Fee Waiver Status by Race and Ethnicity Designations ........................................................ 87 Figure 53: PharmCAS Fee Waiver Status by Sex ..................................................................................................... 88 Figure 54: PharmCAS Fee Waiver Status by Disadvantaged Status ........................................................................ 88
Official PCAT Scores .......................................................................................................................................... 89 Figure 55: Mean Official PCAT Scores and Percentiles for PharmCAS Applicants .................................................. 89 Figure 56: PCAT Composite Percentiles for Accepted PharmCAS Applicants (2014-2020) .................................... 89 Figure 57: PCAT Test Takers by Cycle (2004-2020) ................................................................................................. 90 Figure 58: Number of Schools with PCAT Requirement (2008-2020) ..................................................................... 90
Regional............................................................................................................................................................ 91 Figure 59: PharmCAS Submitted Applicants by Program Type and District (18-19 vs 19-20) ................................ 91
PharmCAS Applicant Data Report 2019-2020
All uses of this data should reference the American Association of Colleges of Pharmacy (AACP) as the source of the data and acknowledge that AACP bears no responsibility for interpretations presented or conclusions reached based on analysis of the data. 4
INSTITUTIONS PARTICIPATING IN PHARMCAS: 2019-2020 The 2019-2020 PharmCAS Applicant Data Report was developed by the American Association of Colleges of Pharmacy and reflects data for the 135 programs that participated in PharmCAS during its 17th admissions cycle. The additional programs that joined PharmCAS during the 2020-2021 cycle are not listed below or included in this report. For a current list of participating doctor of pharmacy (Pharm.D.) degree programs, please visit the PharmCAS website at www.pharmcas.org.
* Indicates new institutions in PharmCAS during the 2019-2020 admissions cycle.
Albany C of Pharmacy and Hlth Sci American U of Hlth Sci Appalachian C of Pharmacy Auburn U Belmont U Binghamton U - SUNY Butler U California Hlth Sci U California Northstate U Campbell U Cedarville U Chapman U Chicago State U Concordia U Wisconsin Creighton U Drake U D'Youville C East Tennessee State U Fairleigh Dickinson U Ferris State U Florida A&M U * Hampton U Harding U High Point U Howard U Husson U Idaho State U Keck Graduate Inst Lake Erie C of Osteopathic Med (LECOM) Larkin U Lipscomb U Loma Linda U Long Island U
Manchester U Marshall B. Ketchum U Marshall U MCPHS - Boston MCPHS - Manchester and Worcester Medical College of Wisconsin Medical U of South Carolina Mercer U Midwestern U - Downers Grove Midwestern U - Glendale North Dakota State U Northeast Ohio Med U (NEOMED) Northeastern U Notre Dame of Maryland U Nova Southeastern U Ohio State U, The Oregon State U Pacific U Oregon Palm Beach Atlantic U Philadelphia C of Osteopathic Med Presbyterian C Purdue U Regis U Roosevelt U Rosalind Franklin U of Med and Sci Roseman U of Hlth Sci Samford U Shenandoah U South C (TN) South U Southern Illinois U Edwardsville St. John Fisher C St. Louis C of Pharmacy
PharmCAS Applicant Data Report 2019-2020
All uses of this data should reference the American Association of Colleges of Pharmacy (AACP) as the source of the data and acknowledge that AACP bears no responsibility for interpretations presented or conclusions reached based on analysis of the data. 5
Sullivan U Temple U Texas A&M U Texas Southern U Texas Tech U Hlth Sci Ctr Thomas Jefferson U Touro C (NY) Touro U (CA) U at Buffalo - SUNY U of Arizona U of Arkansas for Med Sci U of California, San Diego U of California, San Francisco U of Charleston U of Cincinnati U of Colorado U of Connecticut U of Findlay, The U of Florida U of Georgia U of Hawaii at Hilo U of Houston U of Illinois at Chicago U of Iowa, The U of Kansas, The * U of Kentucky U of Louisiana Monroe, The U of Maryland U of Maryland Eastern Shore U of Michigan U of Minnesota U of Mississippi, The U of Missouri-Kansas City U of Montana U of Nebraska Med Ctr
U of New England U of New Mexico, The U of North Carolina at Chapel Hill, The U of North Texas Hlth Sci Ctr U of Oklahoma, The U of Pittsburgh U of Puerto Rico U of Saint Joseph U of South Carolina U of South Florida U of Southern California U of Tennessee, The U of Texas at Austin, The U of Texas at El Paso, The U of Texas at Tyler, The U of the Incarnate Word U of the Pacific U of the Sci in Philadelphia U of Toledo, The U of Utah U of Washington U of Wisconsin - Madison U of Wyoming Union U Virginia Commonwealth U Washington State U Wayne State U West Coast U West Virginia U Western New England U Western U of Hlth Sci William Carey U Wingate U Xavier U of Louisiana
PharmCAS Applicant Data Report 2019-2020
All uses of this data should reference the American Association of Colleges of Pharmacy (AACP) as the source of the data and acknowledge that AACP bears no responsibility for interpretations presented or conclusions reached based on analysis of the data. 6
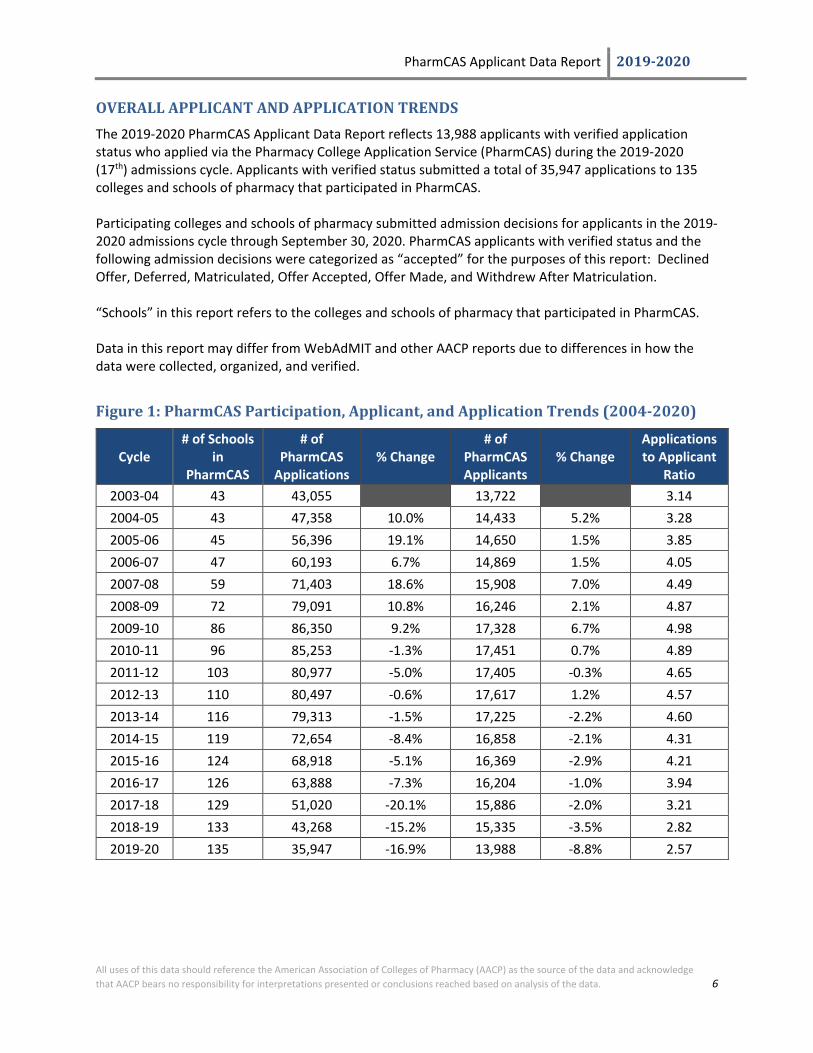
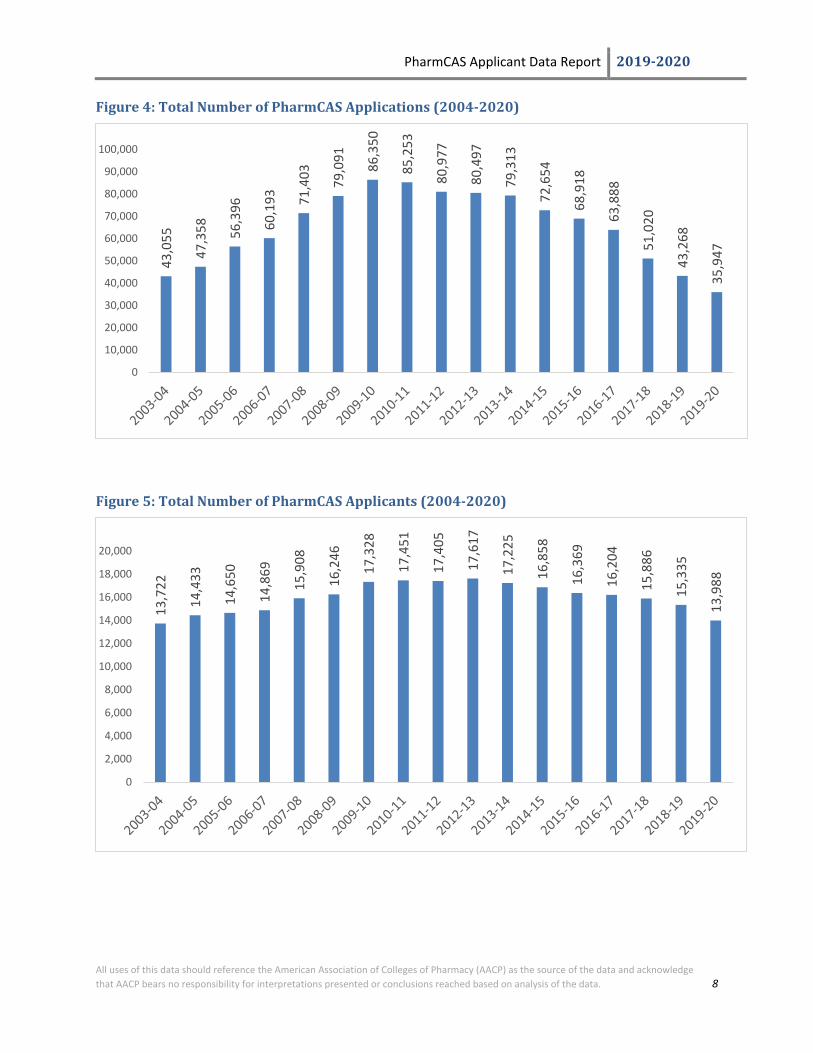
OVERALL APPLICANT AND APPLICATION TRENDS The 2019-2020 PharmCAS Applicant Data Report reflects 13,988 applicants with verified application status who applied via the Pharmacy College Application Service (PharmCAS) during the 2019-2020 (17th) admissions cycle. Applicants with verified status submitted a total of 35,947 applications to 135 colleges and schools of pharmacy that participated in PharmCAS. Participating colleges and schools of pharmacy submitted admission decisions for applicants in the 2019-2020 admissions cycle through September 30, 2020. PharmCAS applicants with verified status and the following admission decisions were categorized as “accepted” for the purposes of this report: Declined Offer, Deferred, Matriculated, Offer Accepted, Offer Made, and Withdrew After Matriculation. “Schools” in this report refers to the colleges and schools of pharmacy that participated in PharmCAS. Data in this report may differ from WebAdMIT and other AACP reports due to differences in how the data were collected, organized, and verified.
Figure 1: PharmCAS Participation, Applicant, and Application Trends (2004-2020)
Cycle # of Schools
in PharmCAS
# of PharmCAS
Applications % Change
# of PharmCAS Applicants
% Change Applications to Applicant
Ratio 2003-04 43 43,055 13,722 3.14 2004-05 43 47,358 10.0% 14,433 5.2% 3.28 2005-06 45 56,396 19.1% 14,650 1.5% 3.85 2006-07 47 60,193 6.7% 14,869 1.5% 4.05 2007-08 59 71,403 18.6% 15,908 7.0% 4.49 2008-09 72 79,091 10.8% 16,246 2.1% 4.87 2009-10 86 86,350 9.2% 17,328 6.7% 4.98 2010-11 96 85,253 -1.3% 17,451 0.7% 4.89 2011-12 103 80,977 -5.0% 17,405 -0.3% 4.65 2012-13 110 80,497 -0.6% 17,617 1.2% 4.57 2013-14 116 79,313 -1.5% 17,225 -2.2% 4.60 2014-15 119 72,654 -8.4% 16,858 -2.1% 4.31 2015-16 124 68,918 -5.1% 16,369 -2.9% 4.21 2016-17 126 63,888 -7.3% 16,204 -1.0% 3.94 2017-18 129 51,020 -20.1% 15,886 -2.0% 3.21 2018-19 133 43,268 -15.2% 15,335 -3.5% 2.82 2019-20 135 35,947 -16.9% 13,988 -8.8% 2.57
PharmCAS Applicant Data Report 2019-2020
All uses of this data should reference the American Association of Colleges of Pharmacy (AACP) as the source of the data and acknowledge that AACP bears no responsibility for interpretations presented or conclusions reached based on analysis of the data. 7
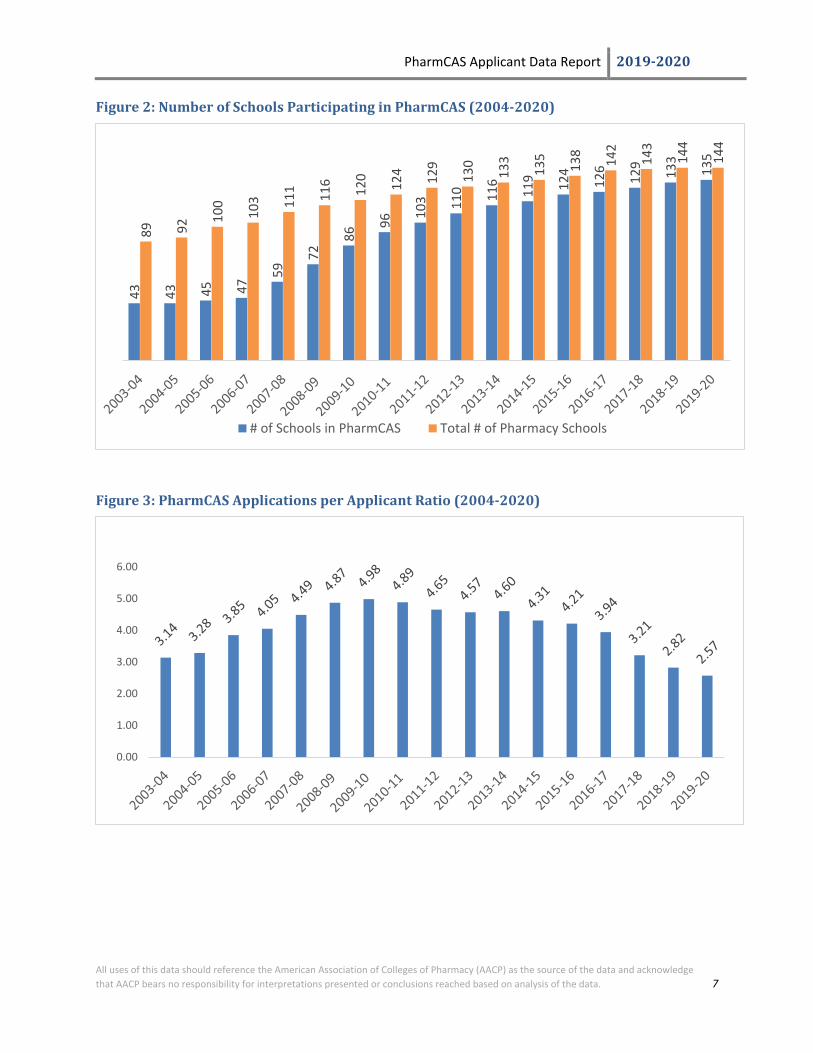
Figure 2: Number of Schools Participating in PharmCAS (2004-2020)
Figure 3: PharmCAS Applications per Applicant Ratio (2004-2020)
43 43 45 47
59
72
86
96
103 11
0 116
119 12
4
126
129
133
135
89 92
100
103 11
1 116
120
124 12
9
130
133
135
138
142
143
144
144
# of Schools in PharmCAS Total # of Pharmacy Schools
0.00
1.00
2.00
3.00
4.00
5.00
6.00
PharmCAS Applicant Data Report 2019-2020
All uses of this data should reference the American Association of Colleges of Pharmacy (AACP) as the source of the data and acknowledge that AACP bears no responsibility for interpretations presented or conclusions reached based on analysis of the data. 8
Figure 4: Total Number of PharmCAS Applications (2004-2020)
Figure 5: Total Number of PharmCAS Applicants (2004-2020)
43,0
55
47,3
58 56,3
96
60,1
93 71,4
03 79,0
91
86,3
50
85,2
53
80,9
77
80,4
97
79,3
13
72,6
54
68,9
18
63,8
88
51,0
20
43,2
68
35,9
47
0
10,000
20,000
30,000
40,000
50,000
60,000
70,000
80,000
90,000
100,00013
,722
14,4
33
14,6
50
14,8
69
15,9
08
16,2
46
17,3
28
17,4
51
17,4
05
17,6
17
17,2
25
16,8
58
16,3
69
16,2
04
15,8
86
15,3
35
13,9
88
0
2,000
4,000
6,000
8,000
10,000
12,000
14,000
16,000
18,000
20,000

PharmCAS Applicant Data Report 2019-2020
All uses of this data should reference the American Association of Colleges of Pharmacy (AACP) as the source of the data and acknowledge that AACP bears no responsibility for interpretations presented or conclusions reached based on analysis of the data. 9
Figure 6: PharmCAS Applications per School (2004-2020)
Cycle # of Schools in PharmCAS
# of PharmCAS Applications
MEAN # of Applications Per School
MEDIAN # of Applications Per School
RANGE in # of Applications Per
School
2003-04 43 43,055 1001.3 902 316 to 2,022 2004-05 43 47,358 1101.3 1059 220 to 2,070 2005-06 45 56,396 1253.2 1237 289 to 2,251 2006-07 47 60,193 1280.7 1142 148 to 3,218 2007-08 59 71,403 1210.2 1124 122 to 2,608 2008-09 72 79,091 1098.5 910 105 to 2,507 2009-10 86 86,350 1004.1 856 170 to 2,543 2010-11 96 85,253 888.1 772 137 to 2,265 2011-12 103 80,977 786.2 684 156 to 2,003 2012-13 110 80,497 731.8 681 135 to 1,771 2013-14 116 79,313 683.7 625 84 to 1,667 2014-15 119 72,654 610.5 563 103 to 1,585 2015-16 124 68,918 555.8 515 71 to 1,152 2016-17 126 63,888 507.0 448 88 to 1,183 2017-18 129 51,020 395.5 361 96 to 986 2018-19 133 43,268 325.3 277 57 to 849 2019-20 135 35,947 266.3 231 20 to 693
Figure 7: Mean Number of PharmCAS Applications per School (2004-2020)
0.0
200.0
400.0
600.0
800.0
1000.0
1200.0
1400.0
PharmCAS Applicant Data Report 2019-2020
All uses of this data should reference the American Association of Colleges of Pharmacy (AACP) as the source of the data and acknowledge that AACP bears no responsibility for interpretations presented or conclusions reached based on analysis of the data. 10
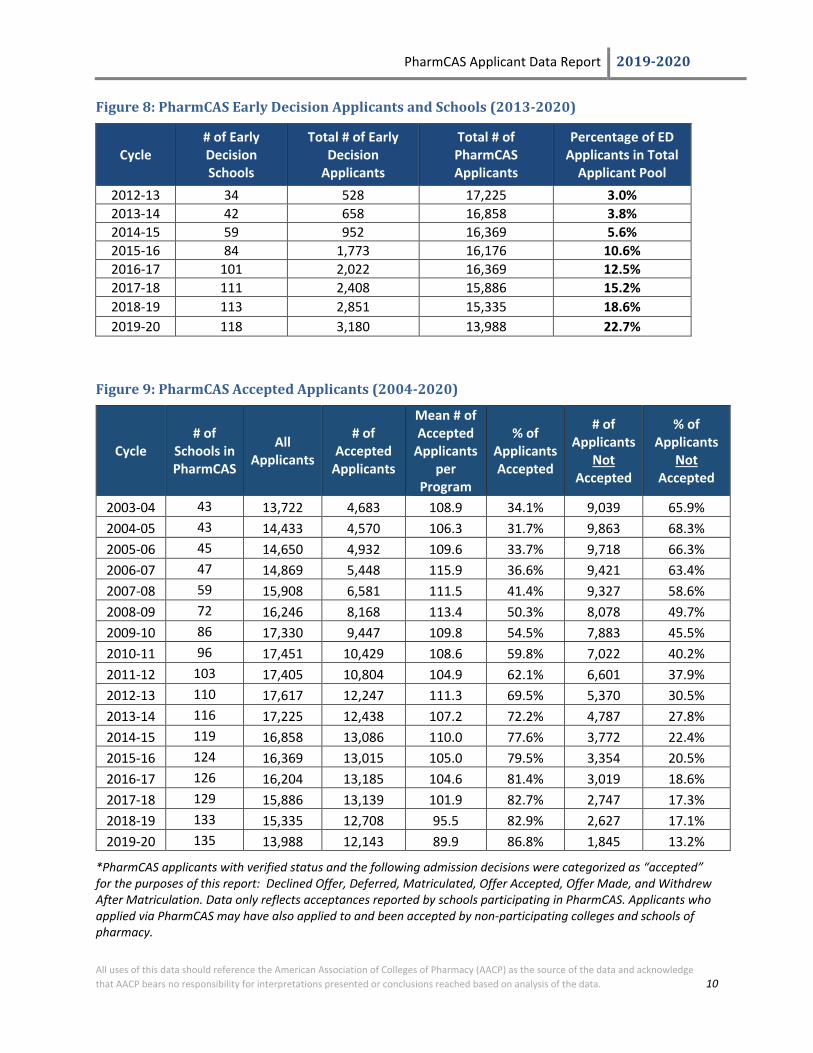
Figure 8: PharmCAS Early Decision Applicants and Schools (2013-2020)
Cycle # of Early Decision Schools
Total # of Early Decision
Applicants
Total # of PharmCAS Applicants
Percentage of ED Applicants in Total
Applicant Pool 2012-13 34 528 17,225 3.0% 2013-14 42 658 16,858 3.8% 2014-15 59 952 16,369 5.6% 2015-16 84 1,773 16,176 10.6% 2016-17 101 2,022 16,369 12.5% 2017-18 111 2,408 15,886 15.2% 2018-19 113 2,851 15,335 18.6% 2019-20 118 3,180 13,988 22.7%
Figure 9: PharmCAS Accepted Applicants (2004-2020)
Cycle # of
Schools in PharmCAS
All Applicants
# of Accepted
Applicants
Mean # of Accepted
Applicants per
Program
% of Applicants Accepted
# of Applicants
Not Accepted
% of Applicants
Not Accepted
2003-04 43 13,722 4,683 108.9 34.1% 9,039 65.9% 2004-05 43 14,433 4,570 106.3 31.7% 9,863 68.3% 2005-06 45 14,650 4,932 109.6 33.7% 9,718 66.3% 2006-07 47 14,869 5,448 115.9 36.6% 9,421 63.4% 2007-08 59 15,908 6,581 111.5 41.4% 9,327 58.6% 2008-09 72 16,246 8,168 113.4 50.3% 8,078 49.7% 2009-10 86 17,330 9,447 109.8 54.5% 7,883 45.5% 2010-11 96 17,451 10,429 108.6 59.8% 7,022 40.2% 2011-12 103 17,405 10,804 104.9 62.1% 6,601 37.9% 2012-13 110 17,617 12,247 111.3 69.5% 5,370 30.5% 2013-14 116 17,225 12,438 107.2 72.2% 4,787 27.8% 2014-15 119 16,858 13,086 110.0 77.6% 3,772 22.4% 2015-16 124 16,369 13,015 105.0 79.5% 3,354 20.5% 2016-17 126 16,204 13,185 104.6 81.4% 3,019 18.6% 2017-18 129 15,886 13,139 101.9 82.7% 2,747 17.3% 2018-19 133 15,335 12,708 95.5 82.9% 2,627 17.1% 2019-20 135 13,988 12,143 89.9 86.8% 1,845 13.2%
*PharmCAS applicants with verified status and the following admission decisions were categorized as “accepted” for the purposes of this report: Declined Offer, Deferred, Matriculated, Offer Accepted, Offer Made, and Withdrew After Matriculation. Data only reflects acceptances reported by schools participating in PharmCAS. Applicants who applied via PharmCAS may have also applied to and been accepted by non-participating colleges and schools of pharmacy.
PharmCAS Applicant Data Report 2019-2020
All uses of this data should reference the American Association of Colleges of Pharmacy (AACP) as the source of the data and acknowledge that AACP bears no responsibility for interpretations presented or conclusions reached based on analysis of the data. 11
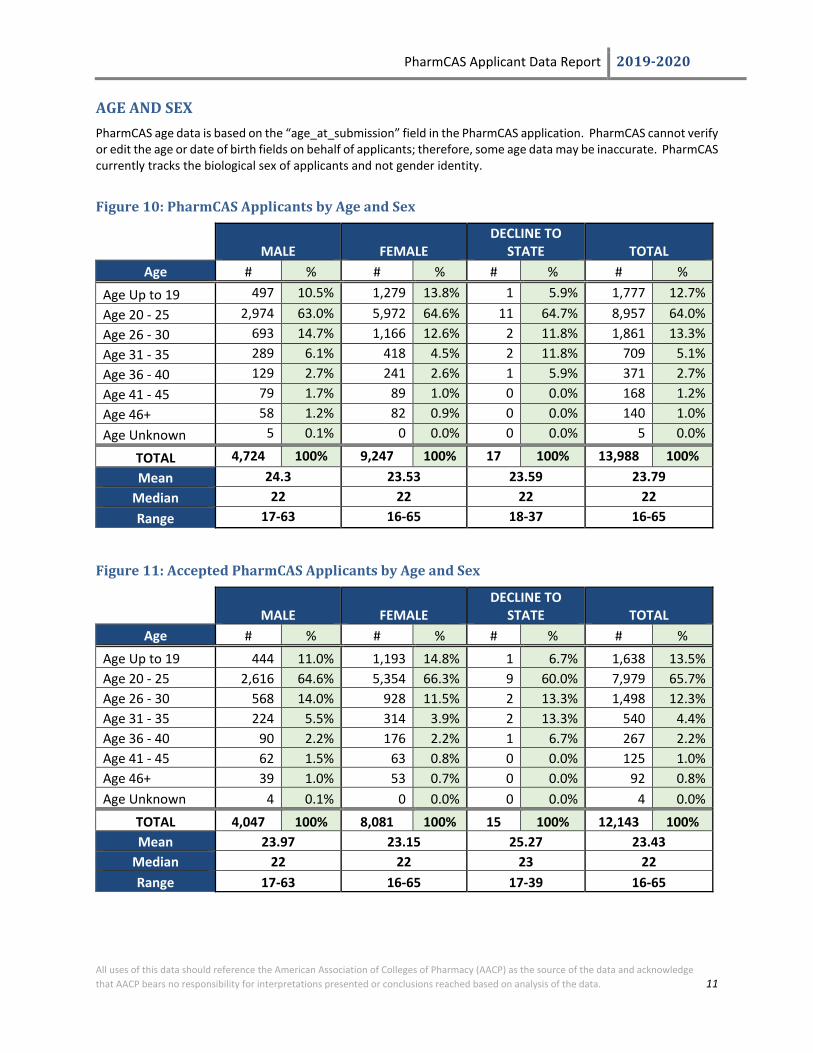
AGE AND SEX PharmCAS age data is based on the “age_at_submission” field in the PharmCAS application. PharmCAS cannot verify or edit the age or date of birth fields on behalf of applicants; therefore, some age data may be inaccurate. PharmCAS currently tracks the biological sex of applicants and not gender identity.
Figure 10: PharmCAS Applicants by Age and Sex
MALE FEMALE DECLINE TO
STATE TOTAL Age # % # % # % # %
Age Up to 19 497 10.5% 1,279 13.8% 1 5.9% 1,777 12.7% Age 20 - 25 2,974 63.0% 5,972 64.6% 11 64.7% 8,957 64.0% Age 26 - 30 693 14.7% 1,166 12.6% 2 11.8% 1,861 13.3% Age 31 - 35 289 6.1% 418 4.5% 2 11.8% 709 5.1% Age 36 - 40 129 2.7% 241 2.6% 1 5.9% 371 2.7% Age 41 - 45 79 1.7% 89 1.0% 0 0.0% 168 1.2% Age 46+ 58 1.2% 82 0.9% 0 0.0% 140 1.0% Age Unknown 5 0.1% 0 0.0% 0 0.0% 5 0.0%
TOTAL 4,724 100% 9,247 100% 17 100% 13,988 100% Mean 24.3 23.53 23.59 23.79
Median 22 22 22 22 Range 17-63 16-65 18-37 16-65
Figure 11: Accepted PharmCAS Applicants by Age and Sex
MALE FEMALE DECLINE TO
STATE TOTAL Age # % # % # % # %
Age Up to 19 444 11.0% 1,193 14.8% 1 6.7% 1,638 13.5% Age 20 - 25 2,616 64.6% 5,354 66.3% 9 60.0% 7,979 65.7% Age 26 - 30 568 14.0% 928 11.5% 2 13.3% 1,498 12.3% Age 31 - 35 224 5.5% 314 3.9% 2 13.3% 540 4.4% Age 36 - 40 90 2.2% 176 2.2% 1 6.7% 267 2.2% Age 41 - 45 62 1.5% 63 0.8% 0 0.0% 125 1.0% Age 46+ 39 1.0% 53 0.7% 0 0.0% 92 0.8% Age Unknown 4 0.1% 0 0.0% 0 0.0% 4 0.0%
TOTAL 4,047 100% 8,081 100% 15 100% 12,143 100% Mean 23.97 23.15 25.27 23.43
Median 22 22 23 22 Range 17-63 16-65 17-39 16-65

PharmCAS Applicant Data Report 2019-2020
All uses of this data should reference the American Association of Colleges of Pharmacy (AACP) as the source of the data and acknowledge that AACP bears no responsibility for interpretations presented or conclusions reached based on analysis of the data. 12
Figure 12: Percentage of PharmCAS Applicants by Age and Sex
Figure 13: Percentage of Accepted PharmCAS Applicants by Age and Sex
* The percentages in these graphs were calculated based on the total number of applicants in the 2019-2020 pools (all and accepted). Applicants who declined to report an age on the PharmCAS application are reported as “Age Unknown”. Applicants who declined to report a sex are not represented in this graph.
3.6%
21.3
%
5.0%
2.1%
0.9%
0.6%
0.4%
0.0%
9.1%
42.7
%
8.3%
3.0%
1.7%
0.6%
0.6%
0.0%
Age Up to19
Age 20 - 25 Age 26 - 30 Age 31 - 35 Age 36 - 40 Age 41 - 45 Age 46+ AgeUnknown
MALE FEMALE
3.7%
21.5
%
4.7%
1.8%
0.7%
0.5%
0.3%
0.0%
9.8%
44.1
%
7.6%
2.6%
1.4%
0.5%
0.4%
0.0%
Age Up to19
Age 20 - 25 Age 26 - 30 Age 31 - 35 Age 36 - 40 Age 41 - 45 Age 46+ AgeUnknown
MALE FEMALE

PharmCAS Applicant Data Report 2019-2020
All uses of this data should reference the American Association of Colleges of Pharmacy (AACP) as the source of the data and acknowledge that AACP bears no responsibility for interpretations presented or conclusions reached based on analysis of the data. 13
Figure 14: Percentage of PharmCAS Applicants by Sex and Acceptance Status
* The percentages in the graph above were calculated based on the total number of applicants in each pool (accepted and all). Applicants who declined to report a sex on the PharmCAS application are reported as “Unknown Sex”.
33.8%
66.1%
0.2%
33.3%
66.5%
0.1%
MALE FEMALE UNKNOWN SEX
All Accepted
PharmCAS Applicant Data Report 2019-2020
All uses of this data should reference the American Association of Colleges of Pharmacy (AACP) as the source of the data and acknowledge that AACP bears no responsibility for interpretations presented or conclusions reached based on analysis of the data. 14
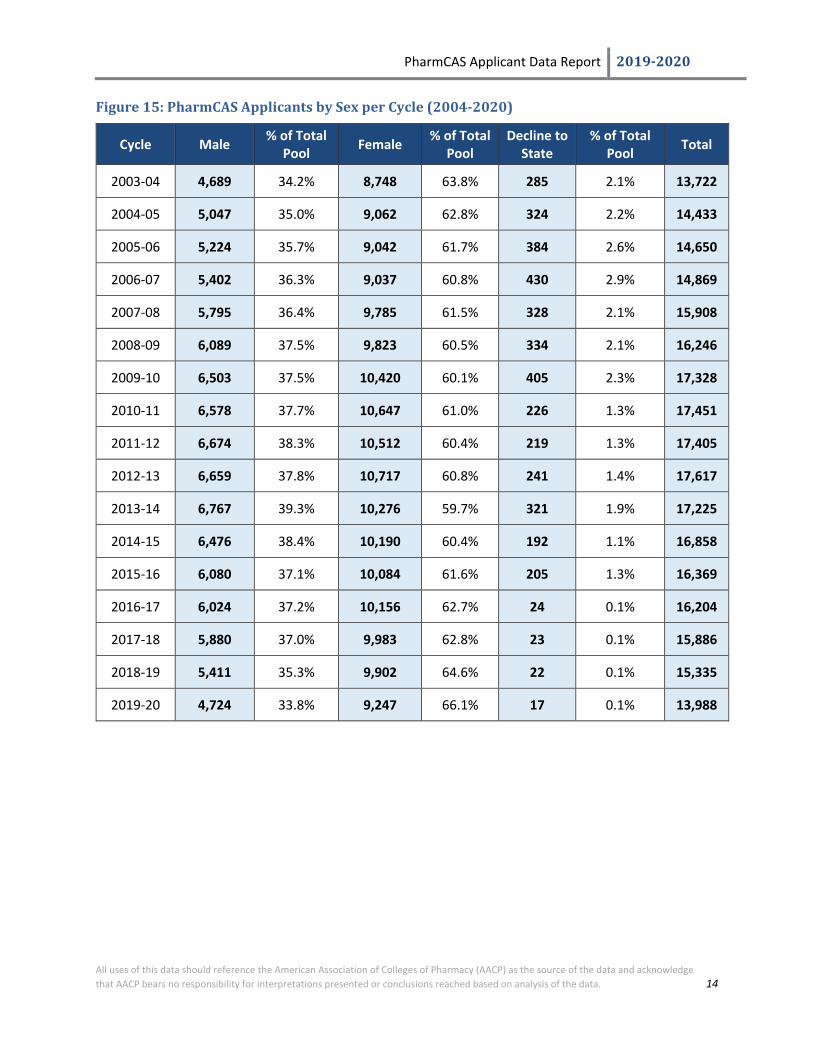
Figure 15: PharmCAS Applicants by Sex per Cycle (2004-2020)
Cycle Male % of Total Pool Female % of Total
Pool Decline to
State % of Total
Pool Total
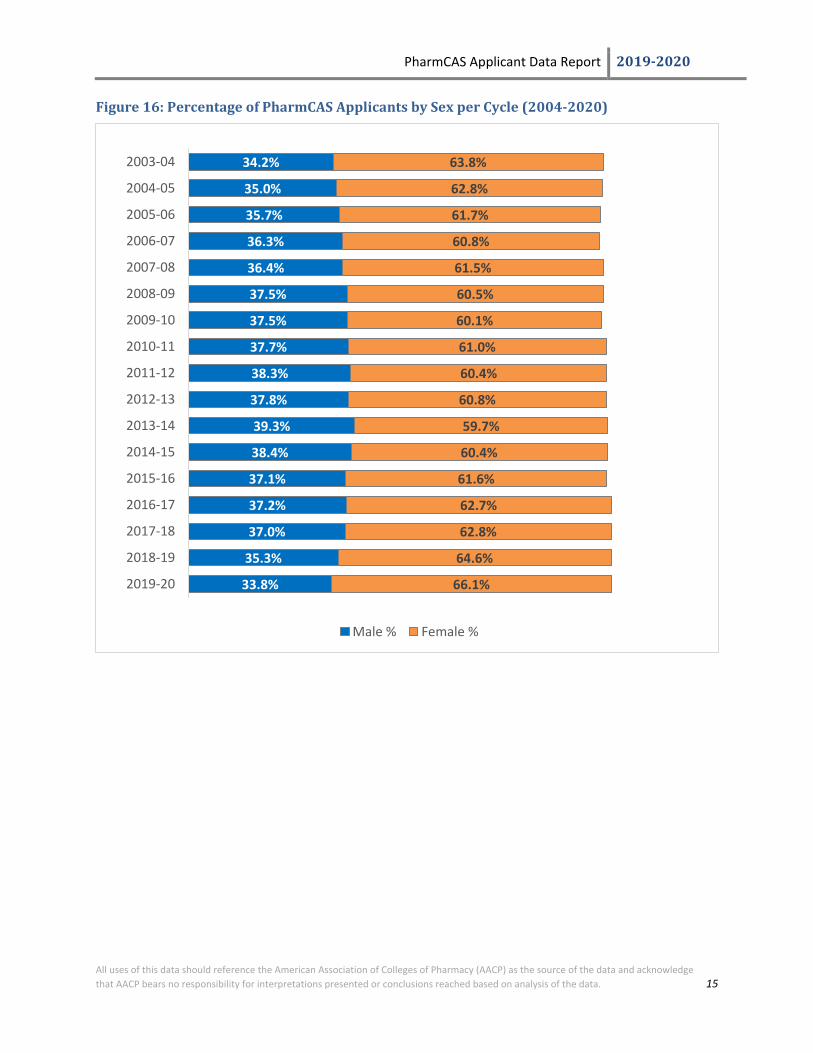
2003-04 4,689 34.2% 8,748 63.8% 285 2.1% 13,722
2004-05 5,047 35.0% 9,062 62.8% 324 2.2% 14,433
2005-06 5,224 35.7% 9,042 61.7% 384 2.6% 14,650
2006-07 5,402 36.3% 9,037 60.8% 430 2.9% 14,869
2007-08 5,795 36.4% 9,785 61.5% 328 2.1% 15,908
2008-09 6,089 37.5% 9,823 60.5% 334 2.1% 16,246
2009-10 6,503 37.5% 10,420 60.1% 405 2.3% 17,328
2010-11 6,578 37.7% 10,647 61.0% 226 1.3% 17,451
2011-12 6,674 38.3% 10,512 60.4% 219 1.3% 17,405
2012-13 6,659 37.8% 10,717 60.8% 241 1.4% 17,617
2013-14 6,767 39.3% 10,276 59.7% 321 1.9% 17,225
2014-15 6,476 38.4% 10,190 60.4% 192 1.1% 16,858
2015-16 6,080 37.1% 10,084 61.6% 205 1.3% 16,369
2016-17 6,024 37.2% 10,156 62.7% 24 0.1% 16,204
2017-18 5,880 37.0% 9,983 62.8% 23 0.1% 15,886
2018-19 5,411 35.3% 9,902 64.6% 22 0.1% 15,335
2019-20 4,724 33.8% 9,247 66.1% 17 0.1% 13,988
PharmCAS Applicant Data Report 2019-2020
All uses of this data should reference the American Association of Colleges of Pharmacy (AACP) as the source of the data and acknowledge that AACP bears no responsibility for interpretations presented or conclusions reached based on analysis of the data. 15
Figure 16: Percentage of PharmCAS Applicants by Sex per Cycle (2004-2020)
34.2%
35.0%
35.7%
36.3%
36.4%
37.5%
37.5%
37.7%
38.3%
37.8%
39.3%
38.4%
37.1%
37.2%
37.0%
35.3%
33.8%
63.8%
62.8%
61.7%
60.8%
61.5%
60.5%
60.1%
61.0%
60.4%
60.8%
59.7%
60.4%
61.6%
62.7%
62.8%
64.6%
66.1%
2003-04
2004-05
2005-06
2006-07
2007-08
2008-09
2009-10
2010-11
2011-12
2012-13
2013-14
2014-15
2015-16
2016-17
2017-18
2018-19
2019-20
Male % Female %

PharmCAS Applicant Data Report 2019-2020
All uses of this data should reference the American Association of Colleges of Pharmacy (AACP) as the source of the data and acknowledge that AACP bears no responsibility for interpretations presented or conclusions reached based on analysis of the data. 16
Figure 17: Accepted PharmCAS Applicants by Sex per Cycle (2004-2020)
Cycle Male % of
Accepted Pool
Female % of
Accepted Pool
Decline to State
% of Accepted
Pool Total
2003-04 1,599 34.1% 2,996 64.0% 88 1.9% 4,683
2004-05 1,544 33.8% 2,941 64.4% 85 1.9% 4,570
2005-06 1,707 34.6% 3,091 62.7% 134 2.7% 4,932
2006-07 1,993 36.6% 3,315 60.8% 140 2.6% 5,448
2007-08 2,438 37.0% 4,021 61.1% 122 1.9% 6,581
2008-09 3,176 38.9% 4,846 59.3% 146 1.8% 8,168
2009-10 3,615 38.3% 5,626 59.6% 206 2.2% 9,447
2010-11 4,014 38.5% 6,296 60.4% 119 1.1% 10,429
2011-12 4,236 39.2% 6,444 59.6% 124 1.1% 10,804
2012-13 4,585 37.4% 7,370 60.2% 292 2.4% 12,247
2013-14 4,906 39.4% 7,405 59.5% 127 1.0% 12,438
2014-15 5,038 38.5% 7,915 60.5% 133 1.0% 13,086
2015-16 4,832 37.1% 8,026 61.7% 157 1.2% 13,015
2016-17 4,880 37.0% 8,290 62.9% 17 0.1% 13,187
2017-18 4,808 36.6% 8,314 63.3% 17 0.1% 13,139
2018-19 4,473 35.2% 8,218 64.7% 17 0.1% 12,708
2019-20 4,047 33.3% 8,081 66.5% 15 0.1% 12,143

PharmCAS Applicant Data Report 2019-2020
All uses of this data should reference the American Association of Colleges of Pharmacy (AACP) as the source of the data and acknowledge that AACP bears no responsibility for interpretations presented or conclusions reached based on analysis of the data. 17
Figure 18: Percentage of Accepted PharmCAS Applicants by Sex per Cycle (2004-2020)
34.1%
33.8%
34.6%
36.6%
37.0%
38.9%
38.3%
38.5%
39.2%
37.4%
39.4%
38.5%
37.1%
37.0%
36.6%
35.2%
33.3%
64.0%
64.4%
62.7%
60.8%
61.1%
59.3%
59.6%
60.4%
59.6%
60.2%
59.5%
60.5%
61.7%
62.9%
63.3%
64.7%
66.5%
2003-04
2004-05
2005-06
2006-07
2007-08
2008-09
2009-10
2010-11
2011-12
2012-13
2013-14
2014-15
2015-16
2016-17
2017-18
2018-19
2019-20
Accepted Male % Accepted Female %

PharmCAS Applicant Data Report 2019-2020
All uses of this data should reference the American Association of Colleges of Pharmacy (AACP) as the source of the data and acknowledge that AACP bears no responsibility for interpretations presented or conclusions reached based on analysis of the data. 18
RACE/ETHNICITY During the 2003-2004 (first) admissions cycle, applicants could select only one racial or ethnic category on the PharmCAS application. Applicants in the 2009-10 cycle could select one or more racial or ethnic categories, and the “Hispanic or Latino” category was moved to a separate field. The “other” racial and ethnic category was eliminated in the 2009-2010 cycle. Programs in PharmCAS can view all of the racial and ethnic designations for each application received. For the purpose of this report only, applicants with multiple racial and ethnic categories selected are categorized as “Multiple”, unless otherwise indicated. Additional tables in this report reflect the total number of racial and ethnicity designations. The number of “Hispanic/Latino” applicants in the following figures reflects all applicants who self-identified as Hispanic or Latino, regardless of race selected. There were 1,238 applicants who selected YES to the “race_hispanic” field and YES to at least one race field (as compared to 1,252 in the previous cycle). There were 433 applicants who selected YES to the “race_hispanic” field only and did not select a race field (as compared to 492 in the previous cycle.) Per the application, the “American Indian” category is inclusive of individuals who identify as “Alaska Native”. “Native Hawaiian” is inclusive of individuals who identify as “Other Pacific Islander”.
Figure 19: PharmCAS Applicants by Race/Ethnicity and Sex
2019-2020 Applicants in PharmCAS MALE FEMALE UNKNOWN TOTAL RACE/ETHNICITY # % # % # % # % American Indian 10 0.21% 18 0.19% 0 0.00% 28 0.20% Hispanic/Latino 593 12.55% 1,076 11.64% 2 9.09% 1,671 11.95% Asian 1,165 24.66% 2,281 24.67% 8 36.36% 3,454 24.69% Black or African American 639 13.53% 1,353 14.63% 1 4.55% 1,993 14.25% Native Hawaiian 4 0.08% 15 0.16% 0 0.00% 19 0.14% White 2,069 43.80% 4,048 43.78% 0 0.00% 6,117 43.73% Other 0 0.00% 0 0.00% 0 0.00% 0 0.00% Multiple 146 3.09% 304 3.29% 1 4.55% 451 3.22% Did Not Report 98 2.07% 152 1.64% 5 22.73% 255 1.82%
TOTAL 4,724 100% 9,247 100% 17 77% 13,988 100%
*Race/ethnicity categories in table are mutually exclusive. Each applicant is represented in only one category.

PharmCAS Applicant Data Report 2019-2020
All uses of this data should reference the American Association of Colleges of Pharmacy (AACP) as the source of the data and acknowledge that AACP bears no responsibility for interpretations presented or conclusions reached based on analysis of the data. 19
Figure 20: Accepted PharmCAS Applicants by Race/Ethnicity and Sex
2019-2020 Accepted Applicants in PharmCAS MALE FEMALE UNKNOWN TOTAL RACE/ETHNICITY # % # % # % # % American Indian 9 0.22% 15 0.19% 0 0.00% 24 0.20% Hispanic/Latino 494 12.21% 906 11.21% 2 13.33% 1402 11.55% Asian 981 24.24% 2022 25.02% 7 46.67% 3010 24.79% Black or African American 498 12.31% 1066 13.19% 1 6.67% 1565 12.89% Native Hawaiian 4 0.10% 14 0.17% 0 0.00% 18 0.15% White 1851 45.74% 3667 45.38% 0 0.00% 5518 45.44% Other 0 0.00% 0 0.00% 0 0.00% 0 0.00% Multiple 126 3.11% 271 3.35% 1 6.67% 398 3.28% Did Not Report 84 2.08% 120 1.48% 4 26.67% 208 1.71%
TOTAL 4,047 100.0% 8,081 100% 15 100% 12,143 100%
*Race/ethnicity categories in table are mutually exclusive. Each applicant is represented in only one race category.
Figure 21: PharmCAS Applicants by Race/Ethnicity and Acceptance Status
* Percentages were calculated based on the total number of applicants in each pool (all and accepted). Race/ethnicity categories in table are mutually exclusive.
0.2%
11.9
% 24.7
%
14.2
%
0.1%
43.7
%
0.0% 3.
2%
1.8%
0.2%
11.5
% 24.8
%
12.9
%
0.1%
45.4
%
0.0% 3.
3%
1.7%
ALL ACCEPTED
PharmCAS Applicant Data Report 2019-2020
All uses of this data should reference the American Association of Colleges of Pharmacy (AACP) as the source of the data and acknowledge that AACP bears no responsibility for interpretations presented or conclusions reached based on analysis of the data. 20
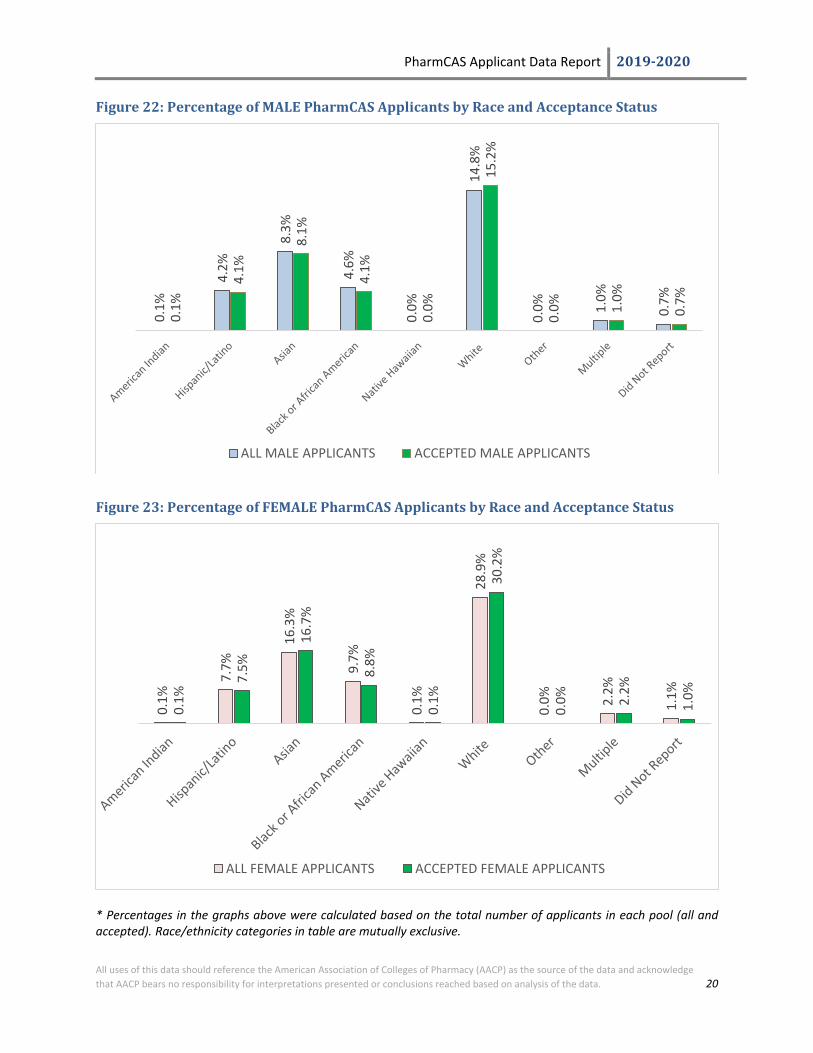
Figure 22: Percentage of MALE PharmCAS Applicants by Race and Acceptance Status
Figure 23: Percentage of FEMALE PharmCAS Applicants by Race and Acceptance Status
* Percentages in the graphs above were calculated based on the total number of applicants in each pool (all and accepted). Race/ethnicity categories in table are mutually exclusive.
0.1%
4.2%
8.3%
4.6%
0.0%
14.8
%
0.0% 1.
0%
0.7%
0.1%
4.1%
8.1%
4.1%
0.0%
15.2
%
0.0% 1.
0%
0.7%
ALL MALE APPLICANTS ACCEPTED MALE APPLICANTS
0.1%
7.7%
16.3
%
9.7%
0.1%
28.9
%
0.0% 2.
2%
1.1%
0.1%
7.5%
16.7
%
8.8%
0.1%
30.2
%
0.0% 2.
2%
1.0%
ALL FEMALE APPLICANTS ACCEPTED FEMALE APPLICANTS

PharmCAS Applicant Data Report 2019-2020
All uses of this data should reference the American Association of Colleges of Pharmacy (AACP) as the source of the data and acknowledge that AACP bears no responsibility for interpretations presented or conclusions reached based on analysis of the data. 21
Figure 24: PharmCAS Applicants by All Race and Ethnicity Designations
Racial and ethnicity categories in the table and graph below are not mutually exclusive. Therefore, the report totals exceed the total number of PharmCAS applicants in each pool (all and accepted).
All Applicants Accepted Applicants
RACE/ETHNICITY DESIGNATIONS # % # %
American Indian 123 0.78% 105 0.77%
Asian 3,796 24.05% 3,319 24.26%
Black or African American 2,247 14.24% 1,764 12.89%
Native Hawaiian 79 0.50% 72 0.53%
Hispanic/Latino 1,671 10.59% 1,402 10.25%
Other 0 0.00% 0 0.00%
White 7,613 48.23% 6,812 49.79%
Did Not Report 255 1.62% 208 1.52%
Total 15,784 100% 13,682 100%
Figure 25: Percentage of PharmCAS Applicants by Race Designations and Acceptance Status
* Racial and ethnicity categories in graph are not mutually exclusive.
0.8%
24.0
%
14.2
%
0.5%
10.6
%
0.0%
48.2
%
1.6%
0.8%
24.3
%
12.9
%
0.5%
10.2
%
0.0%
49.8
%
1.5%
AmericanIndian
Asian Black orAfrican
American
Hawaiian Hispanic Other White Did NotReport
All Accepted

PharmCAS Applicant Data Report 2019-2020
All uses of this data should reference the American Association of Colleges of Pharmacy (AACP) as the source of the data and acknowledge that AACP bears no responsibility for interpretations presented or conclusions reached based on analysis of the data. 22
Figure 26: Percentage of PharmCAS Applicants by Race Designations and State
Permanent State of Residency White Asian Hispanic/
Latino
Black or African
American
American Indian/ Alaskan Native
Hawaiian/ Pacific
Islander
Alabama 70.4% 7.9% 4.1% 16.5% 1.1% Alaska 56.3% 18.8% 6.3% 12.5% 6.3% Arizona 51.4% 24.4% 14.6% 7.6% 1.6% 0.3% Arkansas 71.6% 10.6% 2.1% 14.9% 0.7% California 26.6% 55.9% 10.9% 5.3% 0.7% 0.6% Colorado 50.0% 22.4% 15.8% 9.7% 1.5% 0.5% Connecticut 57.8% 23.8% 5.4% 12.9% Delaware 19.0% 33.3% 47.6% District of Columbia 8.3% 16.7% 8.3% 66.7% Florida 43.9% 11.8% 23.3% 20.0% 0.7% 0.3% Georgia 42.1% 19.9% 3.8% 32.3% 1.5% 0.4% Hawaii 14.7% 54.9% 4.9% 1.0% 2.0% 22.5% Idaho 74.1% 13.6% 8.6% 2.5% 1.2% Illinois 56.2% 23.8% 7.5% 12.1% 0.1% 0.1% Indiana 69.9% 14.2% 5.6% 9.6% 0.7% Iowa 81.4% 8.6% 5.7% 3.6% 0.7% Kansas 59.4% 26.3% 4.6% 9.1% 0.6% Kentucky 85.0% 9.1% 1.6% 4.0% 0.4% Louisiana 46.5% 12.7% 4.7% 35.3% 0.7% Maine 79.4% 11.8% 8.8% Maryland 20.5% 26.5% 1.5% 51.1% 0.4% Massachusetts 47.5% 26.5% 5.8% 19.7% 0.4% Michigan 76.4% 14.2% 1.9% 7.2% 0.4% Minnesota 64.7% 20.0% 0.4% 13.6% 0.9% 0.4% Mississippi 56.0% 13.8% 1.4% 28.0% 0.9% Missouri 72.2% 13.7% 1.7% 11.1% 0.9% 0.4% Montana 86.0% 6.0% 2.0% 2.0% 4.0% Nebraska 76.9% 8.7% 3.8% 8.7% 1.0% 1.0% Nevada 33.1% 35.5% 12.9% 16.1% 0.8% 1.6% New Hampshire 74.1% 7.4% 7.4% 11.1% New Jersey 39.8% 35.2% 7.7% 17.0% 0.3% New Mexico 46.4% 14.4% 34.0% 4.1% 1.0% New York 49.5% 31.3% 5.2% 13.3% 0.6% 0.1% North Carolina 55.6% 14.0% 6.5% 21.2% 2.6% 0.3% North Dakota 73.2% 4.9% 2.4% 14.6% 4.9%

PharmCAS Applicant Data Report 2019-2020
All uses of this data should reference the American Association of Colleges of Pharmacy (AACP) as the source of the data and acknowledge that AACP bears no responsibility for interpretations presented or conclusions reached based on analysis of the data. 23
Permanent State of Residency White Asian Hispanic/
Latino
Black or African
American
American Indian/ Alaskan Native
Hawaiian/ Pacific
Islander
Ohio 68.1% 14.7% 2.1% 14.7% 0.5% Oklahoma 44.2% 25.0% 6.7% 13.5% 9.6% 1.0% Oregon 49.0% 39.2% 5.6% 3.5% 1.4% 1.4% Pennsylvania 58.0% 27.0% 3.8% 11.0% 0.2% Puerto Rico 34.0% 57.0% 8.1% 0.9% Rhode Island 40.0% 20.0% 13.3% 26.7% South Carolina 59.3% 12.6% 4.4% 23.0% 0.4% 0.4% South Dakota 85.7% 14.3% Tennessee 65.6% 12.0% 2.6% 19.5% 0.3% Texas 35.7% 22.2% 22.3% 18.7% 0.7% 0.5% Utah 73.4% 16.5% 3.7% 2.8% 1.8% 1.8% Vermont 83.3% 8.3% 8.3% Virginia 45.9% 26.7% 5.5% 21.6% 0.4% Washington 40.3% 42.5% 6.7% 7.1% 1.1% 2.2% West Virginia 87.4% 6.3% 0.9% 3.6% 1.8% Wisconsin 80.3% 12.4% 2.3% 4.1% 0.5% 0.5% Wyoming 71.4% 11.4% 5.7% 2.9% 8.6%
All Applicants in PharmCAS 48.23% 24.05% 10.59% 14.24% 0.78% 0.50%
*Racial and ethnicity categories in the table are not mutually exclusive. Percentages were calculated based on the total number of race designations per permanent state of residency. Applicants with a permanent address in other locations (e.g., international) or declined to report a race or ethnicity on the PharmCAS application are not represented in this table. The table does not reflect the state of the applicants’ selected pharmacy schools. Total percentages at the bottom of the table reflect the race designation percentages for all applicants in Figure 24.
PharmCAS Applicant Data Report 2019-2020
All uses of this data should reference the American Association of Colleges of Pharmacy (AACP) as the source of the data and acknowledge that AACP bears no responsibility for interpretations presented or conclusions reached based on analysis of the data. 24
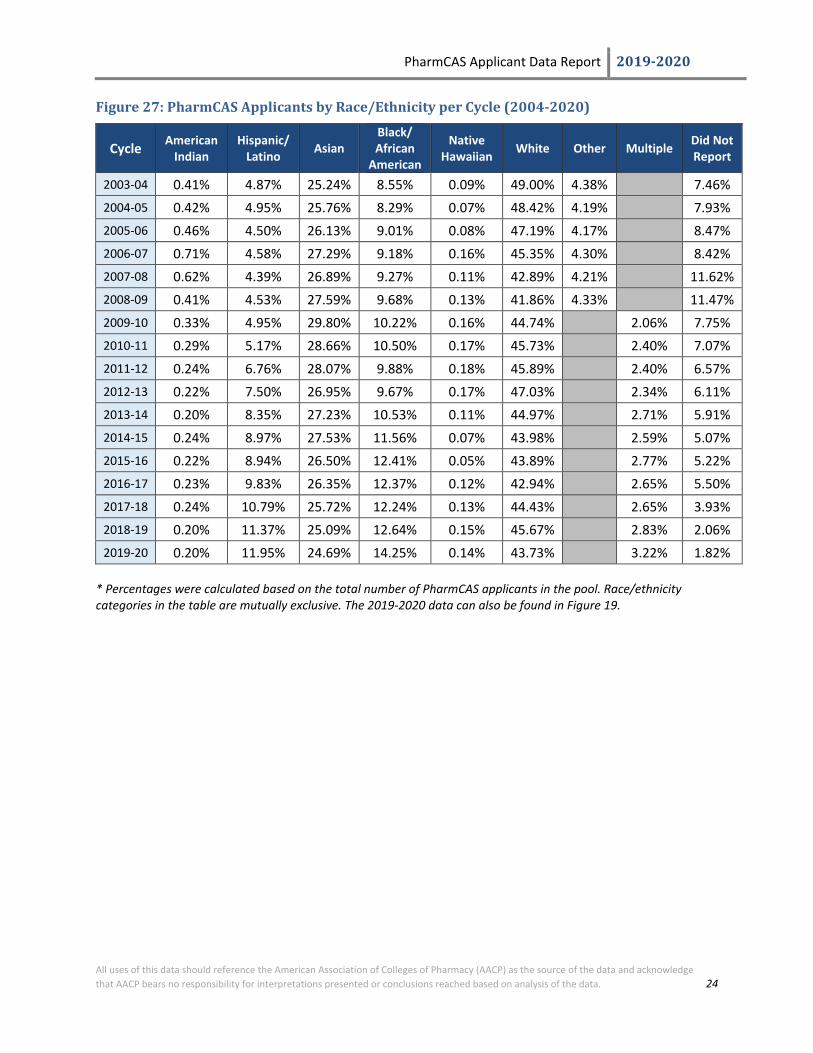
Figure 27: PharmCAS Applicants by Race/Ethnicity per Cycle (2004-2020)
Cycle American Indian
Hispanic/ Latino Asian
Black/ African
American
Native Hawaiian White Other Multiple Did Not
Report
2003-04 0.41% 4.87% 25.24% 8.55% 0.09% 49.00% 4.38% 7.46% 2004-05 0.42% 4.95% 25.76% 8.29% 0.07% 48.42% 4.19% 7.93% 2005-06 0.46% 4.50% 26.13% 9.01% 0.08% 47.19% 4.17% 8.47% 2006-07 0.71% 4.58% 27.29% 9.18% 0.16% 45.35% 4.30% 8.42% 2007-08 0.62% 4.39% 26.89% 9.27% 0.11% 42.89% 4.21% 11.62% 2008-09 0.41% 4.53% 27.59% 9.68% 0.13% 41.86% 4.33% 11.47% 2009-10 0.33% 4.95% 29.80% 10.22% 0.16% 44.74% 2.06% 7.75% 2010-11 0.29% 5.17% 28.66% 10.50% 0.17% 45.73% 2.40% 7.07% 2011-12 0.24% 6.76% 28.07% 9.88% 0.18% 45.89% 2.40% 6.57% 2012-13 0.22% 7.50% 26.95% 9.67% 0.17% 47.03% 2.34% 6.11% 2013-14 0.20% 8.35% 27.23% 10.53% 0.11% 44.97% 2.71% 5.91% 2014-15 0.24% 8.97% 27.53% 11.56% 0.07% 43.98% 2.59% 5.07% 2015-16 0.22% 8.94% 26.50% 12.41% 0.05% 43.89% 2.77% 5.22% 2016-17 0.23% 9.83% 26.35% 12.37% 0.12% 42.94% 2.65% 5.50% 2017-18 0.24% 10.79% 25.72% 12.24% 0.13% 44.43% 2.65% 3.93% 2018-19 0.20% 11.37% 25.09% 12.64% 0.15% 45.67% 2.83% 2.06% 2019-20 0.20% 11.95% 24.69% 14.25% 0.14% 43.73% 3.22% 1.82%
* Percentages were calculated based on the total number of PharmCAS applicants in the pool. Race/ethnicity categories in the table are mutually exclusive. The 2019-2020 data can also be found in Figure 19.

PharmCAS Applicant Data Report 2019-2020
All uses of this data should reference the American Association of Colleges of Pharmacy (AACP) as the source of the data and acknowledge that AACP bears no responsibility for interpretations presented or conclusions reached based on analysis of the data. 25
Figure 28: Percentage of PharmCAS Applicants by Race/Ethnicity per Cycle (2004-2020)
* Percentages were calculated based on the total number of PharmCAS applicants in the pool. Race/ethnicity categories in the table are mutually exclusive. Trend data is also available in Figure 27. The 2019-2020 data can also be found in Figure 19.
4.9%
5.0%
4.5%
4.6%
4.4%
4.5%
5.0%
5.2%
6.8%
7.5%
8.3%
9.0%
8.9%
9.8%
10.8%
11.4%
11.9%
25.2%
25.8%
26.1%
27.3%
26.9%
27.6%
29.8%
28.7%
28.1%
27.0%
27.2%
27.5%
26.5%
26.4%
25.7%
25.1%
24.7%
8.6%
8.3%
9.0%
9.2%
9.3%
9.7%
10.2%
10.5%
9.9%
9.7%
10.5%
11.6%
12.4%
12.4%
12.2%
12.6%
14.2%
49.0%
48.4%
47.2%
45.4%
42.9%
41.9%
44.7%
45.7%
45.9%
47.0%
45.0%
44.0%
43.9%
42.9%
44.4%
45.7%
43.7%
4.4%
4.2%
4.2%
4.3%
4.2%
4.3%
2.1%
2.4%
2.4%
2.3%
2.7%
2.6%
2.8%
2.7%
2.6%
2.8%
3.2%
7.5%
7.9%
8.5%
8.4%
11.6%
11.5%
7.8%
7.1%
6.6%
6.1%
5.9%
5.1%
5.2%
5.5%
3.9%
2.1%
1.8%
0.0% 10.0% 20.0% 30.0% 40.0% 50.0% 60.0% 70.0% 80.0% 90.0% 100.0%
2003-04
2004-05
2005-06
2006-07
2007-08
2008-09
2009-10
2010-11
2011-12
2012-13
2013-14
2014-15
2015-16
2016-17
2017-18
2018-19
2019-20
American Indian Hispanic Asian
Black or African American Native Hawaiian White
Other Multiple Did Not Report

PharmCAS Applicant Data Report 2019-2020
All uses of this data should reference the American Association of Colleges of Pharmacy (AACP) as the source of the data and acknowledge that AACP bears no responsibility for interpretations presented or conclusions reached based on analysis of the data. 26
DISADVANTAGED STATUS Beginning in the 2019-2020 admissions cycle, PharmCAS used the socioeconomic status (SES) of an applicant's parents or guardians to produce Education Occupation (EO) indicator scores. The EO indicator is derived from an applicant’s parental/guardian education and occupation information. Four education levels and two aggregate groups of occupations provide the schema that is used to determine the EO indicator for each parent/guardian. The lowest socioeconomic group is EO-2 and the highest is EO-6. If the Parental Education and/or Occupation Data for a parent is not reported, then no EO score is calculated. Additional information about the EO indicator is available in the PharmCAS School Manual.
• EO 6 Very High SES • EO 5 High SES • EO 4 Moderate SES • EO 3 Low SES • EO 2 Very Low SES
Figure 29: PharmCAS Applicants by Education Occupation (EO) Status
All Applicants Accepted Applicants
Education Occupation (EO) Status # % # %
# of Applicants without an EO Score 4,538 32.44% 3,718 30.62%
# of Applicants with an EO Score 9,450 67.56% 8,425 69.38%
Mean EO Score 4.12 4.14
Median EO Score 4.00 3.50
Total 13,988 100% 12,143 100%
* Only those applicants with one or more parental/guardian EO indicator scores calculated by PharmCAS were included in the calculations. If PharmCAS calculated more than one parental/guardian EO indicator per applicant, the scores were averaged.
PharmCAS Applicant Data Report 2019-2020
All uses of this data should reference the American Association of Colleges of Pharmacy (AACP) as the source of the data and acknowledge that AACP bears no responsibility for interpretations presented or conclusions reached based on analysis of the data. 27
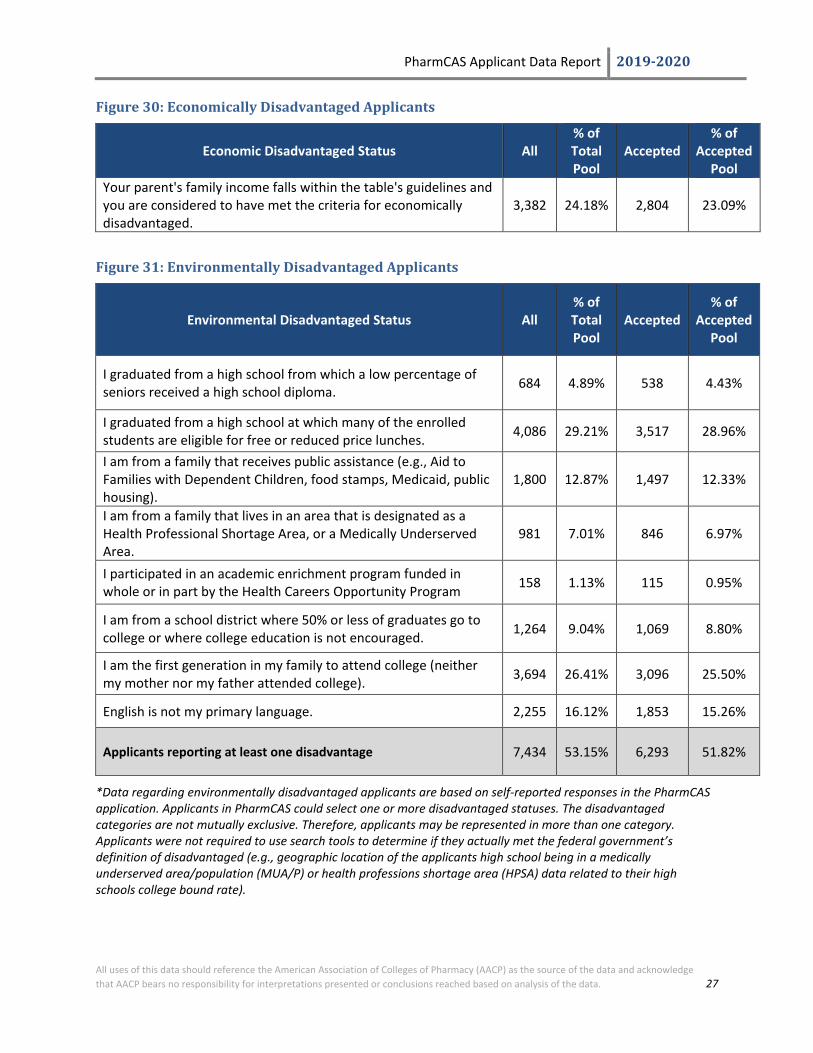
Figure 30: Economically Disadvantaged Applicants
Economic Disadvantaged Status All % of Total Pool
Accepted % of
Accepted Pool
Your parent's family income falls within the table's guidelines and you are considered to have met the criteria for economically disadvantaged.
3,382 24.18% 2,804 23.09%
Figure 31: Environmentally Disadvantaged Applicants
Environmental Disadvantaged Status All % of Total Pool
Accepted % of
Accepted Pool
I graduated from a high school from which a low percentage of seniors received a high school diploma. 684 4.89% 538 4.43%
I graduated from a high school at which many of the enrolled students are eligible for free or reduced price lunches. 4,086 29.21% 3,517 28.96%
I am from a family that receives public assistance (e.g., Aid to Families with Dependent Children, food stamps, Medicaid, public housing).
1,800 12.87% 1,497 12.33%
I am from a family that lives in an area that is designated as a Health Professional Shortage Area, or a Medically Underserved Area.
981 7.01% 846 6.97%
I participated in an academic enrichment program funded in whole or in part by the Health Careers Opportunity Program 158 1.13% 115 0.95%
I am from a school district where 50% or less of graduates go to college or where college education is not encouraged. 1,264 9.04% 1,069 8.80%
I am the first generation in my family to attend college (neither my mother nor my father attended college). 3,694 26.41% 3,096 25.50%
English is not my primary language. 2,255 16.12% 1,853 15.26%
Applicants reporting at least one disadvantage 7,434 53.15% 6,293 51.82%
*Data regarding environmentally disadvantaged applicants are based on self-reported responses in the PharmCAS application. Applicants in PharmCAS could select one or more disadvantaged statuses. The disadvantaged categories are not mutually exclusive. Therefore, applicants may be represented in more than one category. Applicants were not required to use search tools to determine if they actually met the federal government’s definition of disadvantaged (e.g., geographic location of the applicants high school being in a medically underserved area/population (MUA/P) or health professions shortage area (HPSA) data related to their high schools college bound rate).

PharmCAS Applicant Data Report 2019-2020
All uses of this data should reference the American Association of Colleges of Pharmacy (AACP) as the source of the data and acknowledge that AACP bears no responsibility for interpretations presented or conclusions reached based on analysis of the data. 28
CITIZENSHIP
Figure 32: PharmCAS Applicants by Citizenship Status
All Applicants Accepted Applicants Citizenship Status # % # %
U.S. Citizen 12,515 89.47% 10,958 90.24% Permanent U.S. Resident 893 6.38% 749 6.17% Temporary U.S. Resident 120 0.86% 97 0.80% Non Resident 284 2.03% 223 1.84% None 176 1.26% 116 0.96% Did Not Report 0 0.00% 0 0.00%
Total 13,988 100% 12,143 100%
Figure 33: Percentage of PharmCAS Applicants by Citizenship Status
Figure 34: Percentage of Accepted PharmCAS Applicants by Citizenship Status
U.S. Citizen, 89.5%
Permanent U.S. Resident, 6.4%
Temporary U.S. Resident, 0.9%
Non Resident, 2.0%
None, 1.3%
U.S. Citizen, 90.2%
Permanent U.S. Resident, 6.2%
Temporary U.S. Resident, 0.8%
Non Resident, 1.8%
None, 1.0%
PharmCAS Applicant Data Report 2019-2020
All uses of this data should reference the American Association of Colleges of Pharmacy (AACP) as the source of the data and acknowledge that AACP bears no responsibility for interpretations presented or conclusions reached based on analysis of the data. 29
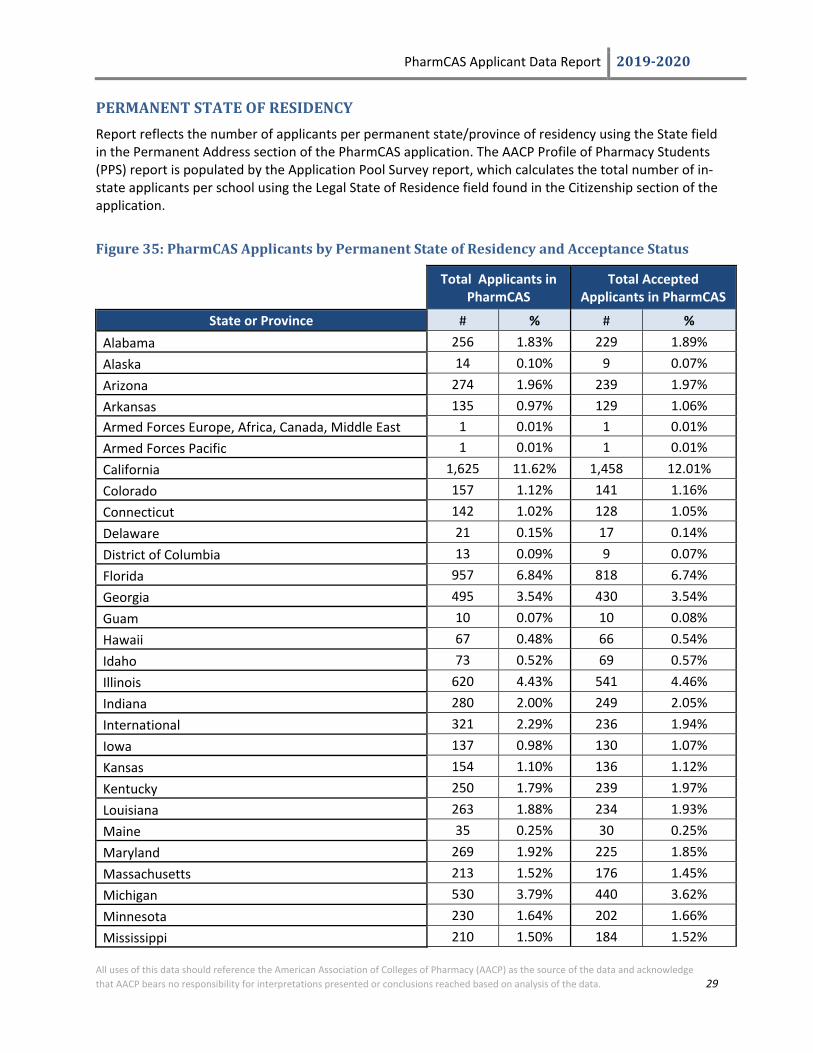
PERMANENT STATE OF RESIDENCY Report reflects the number of applicants per permanent state/province of residency using the State field in the Permanent Address section of the PharmCAS application. The AACP Profile of Pharmacy Students (PPS) report is populated by the Application Pool Survey report, which calculates the total number of in-state applicants per school using the Legal State of Residence field found in the Citizenship section of the application.
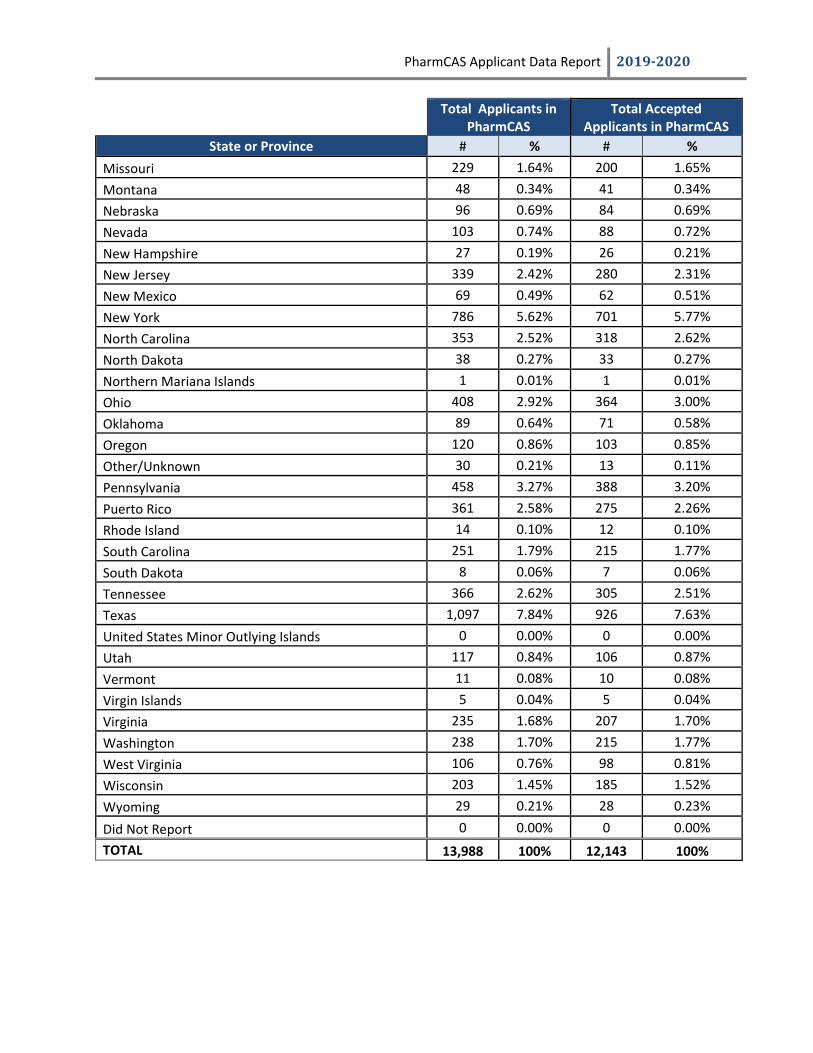
Figure 35: PharmCAS Applicants by Permanent State of Residency and Acceptance Status
Total Applicants in PharmCAS
Total Accepted Applicants in PharmCAS
State or Province # % # % Alabama 256 1.83% 229 1.89% Alaska 14 0.10% 9 0.07% Arizona 274 1.96% 239 1.97% Arkansas 135 0.97% 129 1.06% Armed Forces Europe, Africa, Canada, Middle East 1 0.01% 1 0.01% Armed Forces Pacific 1 0.01% 1 0.01% California 1,625 11.62% 1,458 12.01% Colorado 157 1.12% 141 1.16% Connecticut 142 1.02% 128 1.05% Delaware 21 0.15% 17 0.14% District of Columbia 13 0.09% 9 0.07% Florida 957 6.84% 818 6.74% Georgia 495 3.54% 430 3.54% Guam 10 0.07% 10 0.08% Hawaii 67 0.48% 66 0.54% Idaho 73 0.52% 69 0.57% Illinois 620 4.43% 541 4.46% Indiana 280 2.00% 249 2.05% International 321 2.29% 236 1.94% Iowa 137 0.98% 130 1.07% Kansas 154 1.10% 136 1.12% Kentucky 250 1.79% 239 1.97% Louisiana 263 1.88% 234 1.93% Maine 35 0.25% 30 0.25% Maryland 269 1.92% 225 1.85% Massachusetts 213 1.52% 176 1.45% Michigan 530 3.79% 440 3.62% Minnesota 230 1.64% 202 1.66% Mississippi 210 1.50% 184 1.52%
PharmCAS Applicant Data Report 2019-2020
Total Applicants in PharmCAS
Total Accepted Applicants in PharmCAS
State or Province # % # % Missouri 229 1.64% 200 1.65% Montana 48 0.34% 41 0.34% Nebraska 96 0.69% 84 0.69% Nevada 103 0.74% 88 0.72% New Hampshire 27 0.19% 26 0.21% New Jersey 339 2.42% 280 2.31% New Mexico 69 0.49% 62 0.51% New York 786 5.62% 701 5.77% North Carolina 353 2.52% 318 2.62% North Dakota 38 0.27% 33 0.27% Northern Mariana Islands 1 0.01% 1 0.01% Ohio 408 2.92% 364 3.00% Oklahoma 89 0.64% 71 0.58% Oregon 120 0.86% 103 0.85% Other/Unknown 30 0.21% 13 0.11% Pennsylvania 458 3.27% 388 3.20% Puerto Rico 361 2.58% 275 2.26% Rhode Island 14 0.10% 12 0.10% South Carolina 251 1.79% 215 1.77% South Dakota 8 0.06% 7 0.06% Tennessee 366 2.62% 305 2.51% Texas 1,097 7.84% 926 7.63% United States Minor Outlying Islands 0 0.00% 0 0.00% Utah 117 0.84% 106 0.87% Vermont 11 0.08% 10 0.08% Virgin Islands 5 0.04% 5 0.04% Virginia 235 1.68% 207 1.70% Washington 238 1.70% 215 1.77% West Virginia 106 0.76% 98 0.81% Wisconsin 203 1.45% 185 1.52% Wyoming 29 0.21% 28 0.23%
Did Not Report 0 0.00% 0 0.00% TOTAL 13,988 100% 12,143 100%

PharmCAS Applicant Data Report 2019-2020
All uses of this data should reference the American Association of Colleges of Pharmacy (AACP) as the source of the data and acknowledge that AACP bears no responsibility for interpretations presented or conclusions reached based on analysis of the data. 31
Figure 36: Permanent State of Residency of PharmCAS Applicants Sorted by Volume
Rank State or Province # % 1 California 1,625 11.62% 2 Texas 1,097 7.84% 3 Florida 957 6.84% 4 New York 786 5.62% 5 Illinois 620 4.43% 6 Michigan 530 3.79% 7 Georgia 495 3.54% 8 Pennsylvania 458 3.27% 9 Ohio 408 2.92%
10 Tennessee 366 2.62% 11 Puerto Rico 361 2.58% 12 North Carolina 353 2.52% 13 New Jersey 339 2.42% 14 International 321 2.29% 15 Indiana 280 2.00% 16 Arizona 274 1.96% 17 Maryland 269 1.92% 18 Louisiana 263 1.88% 19 Alabama 256 1.83% 20 South Carolina 251 1.79% 21 Kentucky 250 1.79% 22 Washington 238 1.70% 23 Virginia 235 1.68% 24 Minnesota 230 1.64% 25 Missouri 229 1.64% 26 Massachusetts 213 1.52% 27 Mississippi 210 1.50% 28 Wisconsin 203 1.45% 29 Colorado 157 1.12% 30 Kansas 154 1.10% 31 Connecticut 142 1.02% 32 Iowa 137 0.98% 33 Arkansas 135 0.97% 34 Oregon 120 0.86% 35 Utah 117 0.84% 36 West Virginia 106 0.76% 37 Nevada 103 0.74% 38 Nebraska 96 0.69% 39 Oklahoma 89 0.64% 40 Idaho 73 0.52%

PharmCAS Applicant Data Report 2019-2020
All uses of this data should reference the American Association of Colleges of Pharmacy (AACP) as the source of the data and acknowledge that AACP bears no responsibility for interpretations presented or conclusions reached based on analysis of the data. 32
Rank State or Province # % 41 New Mexico 69 0.49% 42 Hawaii 67 0.48% 43 Montana 48 0.34% 44 North Dakota 38 0.27% 45 Maine 35 0.25% 46 Other/Unknown 30 0.21% 47 Wyoming 29 0.21% 48 New Hampshire 27 0.19% 49 Delaware 21 0.15% 50 Alaska 14 0.10% 51 Rhode Island 14 0.10% 52 District of Columbia 13 0.09% 53 Vermont 11 0.08% 54 Guam 10 0.07% 55 South Dakota 8 0.06% 56 Virgin Islands 5 0.04% 57 Armed Forces Europe, Africa, Canada, Middle East 1 0.01% 58 Armed Forces Pacific 1 0.01% 59 Northern Mariana Islands 1 0.01%
* Percentages were calculated based on the total number of PharmCAS applicants in the pool. Each applicant is represented in only one state, province, or territory.

PharmCAS Applicant Data Report 2019-2020
All uses of this data should reference the American Association of Colleges of Pharmacy (AACP) as the source of the data and acknowledge that AACP bears no responsibility for interpretations presented or conclusions reached based on analysis of the data. 33
GRADE POINT AVERAGES (GPAS) PharmCAS calculates standardized grade point averages (GPAs) to help participating programs evaluate applicants using uniform and consistent criteria, regardless of different institutional transcript policies. PharmCAS GPAs are automatically generated by the system and are likely to be different from those calculated by the colleges and universities attended due to the grade standardization process. PharmCAS includes initial and repeated coursework in its GPA calculations using a 4.0 semester-based scale.
Figure 37: PharmCAS GPAs by Sex and Acceptance Status
ALL APPLICANTS ACCEPTED APPLICANTS
PharmCAS GPAs Male Female Unknown All Male Female Unknown All Freshman 3.18 3.31 3.15 3.26 3.23 3.36 3.20 3.32 Sophomore 3.11 3.17 3.16 3.15 3.16 3.24 3.21 3.22 Junior 3.07 3.10 3.12 3.09 3.12 3.18 3.17 3.16 Senior 3.11 3.14 3.23 3.13 3.16 3.20 3.30 3.19 Post-Baccalaureate 3.40 3.35 3.75 3.37 3.45 3.41 3.75 3.42 Graduate 3.24 3.27 3.98 3.27 3.33 3.29 3.98 3.31 Cumulative Undergraduate 3.17 3.25 3.15 3.22 3.22 3.31 3.20 3.28
Freshman Math 3.04 3.19 3.13 3.14 3.10 3.25 3.22 3.20 Sophomore Math 2.98 3.05 2.82 3.03 3.04 3.14 2.91 3.11 Junior Math 3.00 3.01 3.27 3.01 3.06 3.10 3.30 3.09 Senior Math 2.99 2.97 3.40 2.98 3.04 3.06 3.40 3.05 Post-Baccalaureate Math 3.31 3.27 4.00 3.28 3.37 3.35 4.00 3.36 Cumulative Undergrad Math 3.06 3.16 3.14 3.13 3.12 3.24 3.20 3.20 Graduate Math 3.42 3.51 4.00 3.48 3.48 3.53 4.00 3.51 Overall Math 3.06 3.16 3.14 3.13 3.12 3.24 3.21 3.20
Freshman Non-Science 3.26 3.42 3.21 3.36 3.30 3.47 3.23 3.41 Sophomore Non-Science 3.31 3.41 3.34 3.37 3.36 3.47 3.42 3.43 Junior Non-Science 3.33 3.41 3.56 3.38 3.38 3.47 3.60 3.44 Senior Non-Science 3.37 3.44 3.67 3.42 3.41 3.50 3.67 3.47 Post-Baccalaureate Non-Science 3.51 3.48 4.00 3.49 3.56 3.54 4.00 3.54 Cum Undergrad Non-Science 3.32 3.45 3.36 3.40 3.37 3.50 3.38 3.46 Graduate Non-Science 3.47 3.49 4.00 3.48 3.51 3.50 4.00 3.51 Overall Non-Science 3.33 3.45 3.36 3.41 3.37 3.50 3.39 3.46
Freshman Science 3.05 3.10 2.90 3.08 3.10 3.17 2.97 3.15 Sophomore Science 2.95 2.97 3.12 2.96 3.01 3.04 3.17 3.03 Junior Science 2.93 2.93 2.88 2.93 2.98 3.01 2.96 3.00 Senior Science 2.99 2.99 2.92 2.99 3.05 3.06 3.01 3.05 Post-Baccalaureate Science 3.34 3.30 3.64 3.31 3.39 3.35 3.64 3.36 Cumulative Undergrad Science 3.04 3.06 2.94 3.05 3.10 3.14 3.00 3.12 Graduate Science 3.15 3.22 3.96 3.20 3.24 3.24 3.96 3.25 Overall Science 3.04 3.07 2.95 3.06 3.10 3.14 3.01 3.13
Overall 3.17 3.25 3.17 3.23 3.23 3.32 3.21 3.29
* Bolded items are also referenced in one or more of the subsequent GPA tables in this report.
PharmCAS Applicant Data Report 2019-2020
All uses of this data should reference the American Association of Colleges of Pharmacy (AACP) as the source of the data and acknowledge that AACP bears no responsibility for interpretations presented or conclusions reached based on analysis of the data. 34
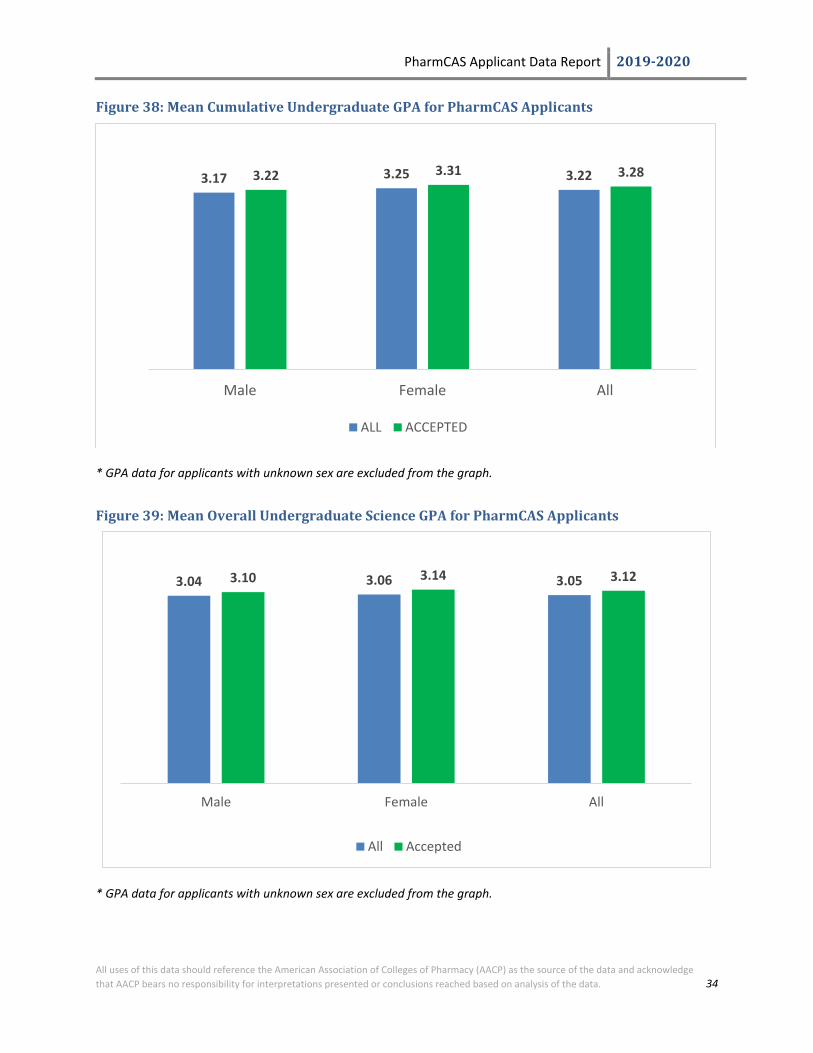
Figure 38: Mean Cumulative Undergraduate GPA for PharmCAS Applicants
* GPA data for applicants with unknown sex are excluded from the graph.
Figure 39: Mean Overall Undergraduate Science GPA for PharmCAS Applicants
* GPA data for applicants with unknown sex are excluded from the graph.
3.17 3.25 3.223.22 3.31 3.28
Male Female All
ALL ACCEPTED
3.04 3.06 3.053.10 3.14 3.12
Male Female All
All Accepted

PharmCAS Applicant Data Report 2019-2020
All uses of this data should reference the American Association of Colleges of Pharmacy (AACP) as the source of the data and acknowledge that AACP bears no responsibility for interpretations presented or conclusions reached based on analysis of the data. 35
Figure 40: Undergraduate GPAs for Accepted PharmCAS Applicants by Cycle (2004-2020)
Cycle Science GPA Non-Science GPA Math GPA Cumulative Undergraduate GPA
2003-04 3.34 3.56 3.26 3.43 2004-05 3.37 3.61 3.31 3.47 2005-06 3.39 3.62 3.44 3.48 2006-07 3.40 3.63 3.45 3.49 2007-08 3.35 3.62 3.40 3.45 2008-09 3.30 3.59 3.37 3.42 2009-10 3.29 3.59 3.37 3.41 2010-11 3.29 3.58 3.61 3.40 2011-12 3.27 3.59 3.35 3.40 2012-13 3.25 3.58 3.33 3.38 2013-14 3.23 3.57 3.31 3.36 2014-15 3.21 3.56 3.28 3.34 2015-16 3.18 3.55 3.26 3.32 2016-17 3.16 3.55 3.24 3.31 2017-18 3.15 3.47 3.24 3.30 2018-19 3.15 3.48 3.22 3.30 2019-20 3.12 3.46 3.20 3.28
* GPAs reflect undergraduate coursework only

PharmCAS Applicant Data Report 2019-2020
All uses of this data should reference the American Association of Colleges of Pharmacy (AACP) as the source of the data and acknowledge that AACP bears no responsibility for interpretations presented or conclusions reached based on analysis of the data. 36
Figure 41: Undergraduate GPA for Accepted PharmCAS Applicants by Cycle (2004-2020)
* GPAs reflect undergraduate coursework only.
Figure 42: Science GPA for Accepted PharmCAS Applicants by Cycle (2004-2020)
* GPAs reflect undergraduate coursework only.
2.00
2.20
2.40
2.60
2.80
3.00
3.20
3.40
3.60
3.80
4.00
2.00
2.20
2.40
2.60
2.80
3.00
3.20
3.40
3.60
3.80
4.00
PharmCAS Applicant Data Report 2019-2020
All uses of this data should reference the American Association of Colleges of Pharmacy (AACP) as the source of the data and acknowledge that AACP bears no responsibility for interpretations presented or conclusions reached based on analysis of the data. 37
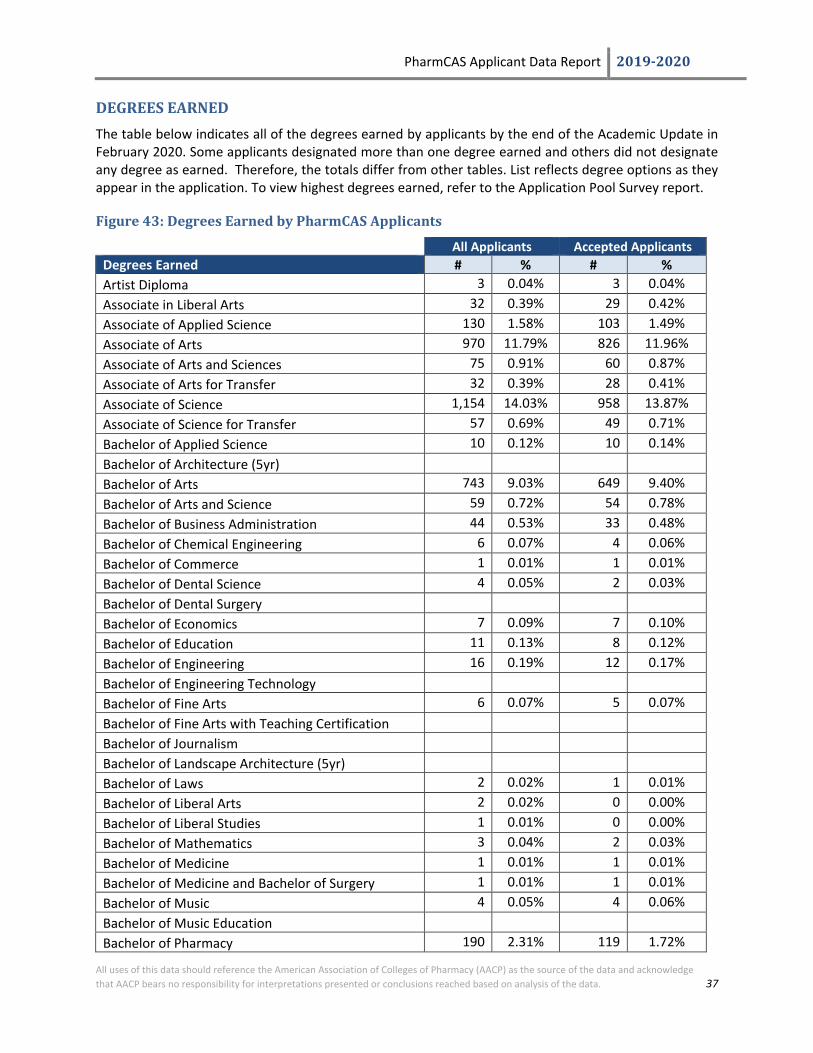
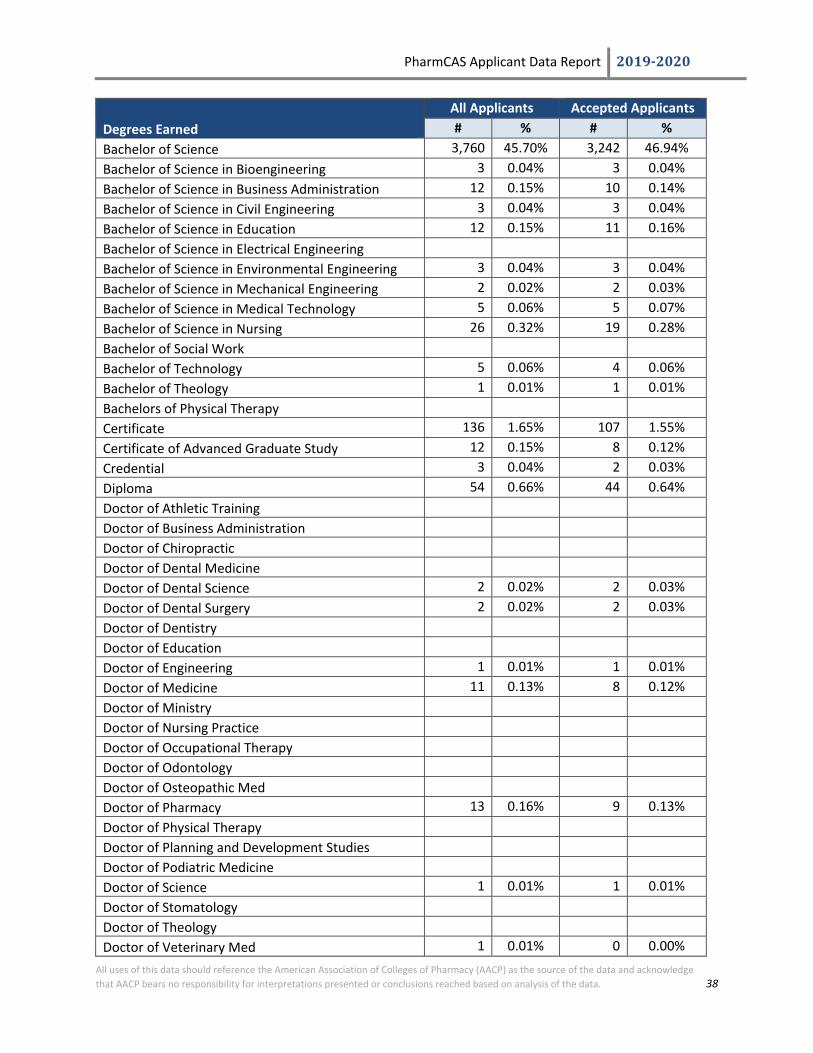
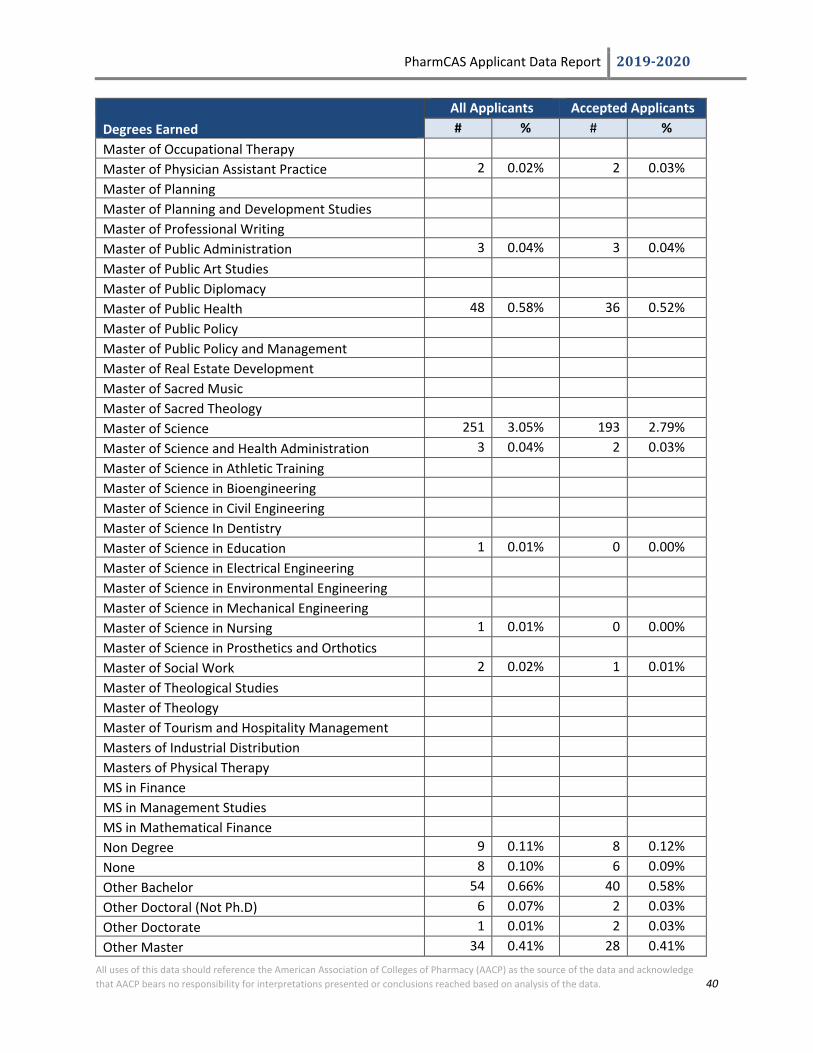
DEGREES EARNED The table below indicates all of the degrees earned by applicants by the end of the Academic Update in February 2020. Some applicants designated more than one degree earned and others did not designate any degree as earned. Therefore, the totals differ from other tables. List reflects degree options as they appear in the application. To view highest degrees earned, refer to the Application Pool Survey report.
Figure 43: Degrees Earned by PharmCAS Applicants
All Applicants Accepted Applicants Degrees Earned # % # % Artist Diploma 3 0.04% 3 0.04% Associate in Liberal Arts 32 0.39% 29 0.42% Associate of Applied Science 130 1.58% 103 1.49% Associate of Arts 970 11.79% 826 11.96% Associate of Arts and Sciences 75 0.91% 60 0.87% Associate of Arts for Transfer 32 0.39% 28 0.41% Associate of Science 1,154 14.03% 958 13.87% Associate of Science for Transfer 57 0.69% 49 0.71% Bachelor of Applied Science 10 0.12% 10 0.14% Bachelor of Architecture (5yr) Bachelor of Arts 743 9.03% 649 9.40% Bachelor of Arts and Science 59 0.72% 54 0.78% Bachelor of Business Administration 44 0.53% 33 0.48% Bachelor of Chemical Engineering 6 0.07% 4 0.06% Bachelor of Commerce 1 0.01% 1 0.01% Bachelor of Dental Science 4 0.05% 2 0.03% Bachelor of Dental Surgery Bachelor of Economics 7 0.09% 7 0.10% Bachelor of Education 11 0.13% 8 0.12% Bachelor of Engineering 16 0.19% 12 0.17% Bachelor of Engineering Technology Bachelor of Fine Arts 6 0.07% 5 0.07% Bachelor of Fine Arts with Teaching Certification Bachelor of Journalism Bachelor of Landscape Architecture (5yr) Bachelor of Laws 2 0.02% 1 0.01% Bachelor of Liberal Arts 2 0.02% 0 0.00% Bachelor of Liberal Studies 1 0.01% 0 0.00% Bachelor of Mathematics 3 0.04% 2 0.03% Bachelor of Medicine 1 0.01% 1 0.01% Bachelor of Medicine and Bachelor of Surgery 1 0.01% 1 0.01% Bachelor of Music 4 0.05% 4 0.06% Bachelor of Music Education Bachelor of Pharmacy 190 2.31% 119 1.72%
PharmCAS Applicant Data Report 2019-2020
All uses of this data should reference the American Association of Colleges of Pharmacy (AACP) as the source of the data and acknowledge that AACP bears no responsibility for interpretations presented or conclusions reached based on analysis of the data. 38
Degrees Earned All Applicants Accepted Applicants # % # %
Bachelor of Science 3,760 45.70% 3,242 46.94% Bachelor of Science in Bioengineering 3 0.04% 3 0.04% Bachelor of Science in Business Administration 12 0.15% 10 0.14% Bachelor of Science in Civil Engineering 3 0.04% 3 0.04% Bachelor of Science in Education 12 0.15% 11 0.16% Bachelor of Science in Electrical Engineering Bachelor of Science in Environmental Engineering 3 0.04% 3 0.04% Bachelor of Science in Mechanical Engineering 2 0.02% 2 0.03% Bachelor of Science in Medical Technology 5 0.06% 5 0.07% Bachelor of Science in Nursing 26 0.32% 19 0.28% Bachelor of Social Work Bachelor of Technology 5 0.06% 4 0.06% Bachelor of Theology 1 0.01% 1 0.01% Bachelors of Physical Therapy Certificate 136 1.65% 107 1.55% Certificate of Advanced Graduate Study 12 0.15% 8 0.12% Credential 3 0.04% 2 0.03% Diploma 54 0.66% 44 0.64% Doctor of Athletic Training Doctor of Business Administration Doctor of Chiropractic Doctor of Dental Medicine Doctor of Dental Science 2 0.02% 2 0.03% Doctor of Dental Surgery 2 0.02% 2 0.03% Doctor of Dentistry Doctor of Education Doctor of Engineering 1 0.01% 1 0.01% Doctor of Medicine 11 0.13% 8 0.12% Doctor of Ministry Doctor of Nursing Practice Doctor of Occupational Therapy Doctor of Odontology Doctor of Osteopathic Med Doctor of Pharmacy 13 0.16% 9 0.13% Doctor of Physical Therapy Doctor of Planning and Development Studies Doctor of Podiatric Medicine Doctor of Science 1 0.01% 1 0.01% Doctor of Stomatology Doctor of Theology Doctor of Veterinary Med 1 0.01% 0 0.00%

PharmCAS Applicant Data Report 2019-2020
All uses of this data should reference the American Association of Colleges of Pharmacy (AACP) as the source of the data and acknowledge that AACP bears no responsibility for interpretations presented or conclusions reached based on analysis of the data. 39
Degrees Earned All Applicants Accepted Applicants # % # %
Doctorate In Dental Medicine Doctorate of Medicine 3 0.04% 3 0.04% Doctorate of Musical Arts Doctorate of Theology Five-year Bachelor's and Master's Program (BA/MA) 1 0.01% 1 0.01% Five-year Bachelor's and Master's Program (BS/MS) 1 0.01% 1 0.01% Graduate Certificate 8 0.10% 5 0.07% Graduate Diploma 4 0.05% 3 0.04% Juris Doctorate 4 0.05% 4 0.06% Master of Accounting Master of Architecture Master of Arts 20 0.24% 15 0.22% Master of Arts In Teaching 11 0.13% 9 0.13% Master of Building Science Master of Business Administration 51 0.62% 37 0.54% Master of Business Taxation Master of Comparative Law Master of Construction Management Master of Dental Surgery Master of Divinity Master of Education 15 0.18% 12 0.17% Master of Engineering 4 0.05% 3 0.04% Master of Engineering Technology Management Master of Fine Arts Master of Health Administration 9 0.11% 5 0.07% Master of Health Care Management 1 0.01% 1 0.01% Master of Health Science 3 0.04% 2 0.03% Master of Health Sciences Administration Master of Historic Preservation Master of Journalism Master of Landscape Architecture Master of Laws Master of Liberal Arts Master of Long Term Care Administration Master of Management Master of Marriage and Family Therapy Master of Medical Management Master of Medical Science 6 0.07% 4 0.06% Master of Music 1 0.01% 1 0.01% Master of Music Education Master of Music Therapy
PharmCAS Applicant Data Report 2019-2020
All uses of this data should reference the American Association of Colleges of Pharmacy (AACP) as the source of the data and acknowledge that AACP bears no responsibility for interpretations presented or conclusions reached based on analysis of the data. 40
Degrees Earned All Applicants Accepted Applicants # % # %
Master of Occupational Therapy Master of Physician Assistant Practice 2 0.02% 2 0.03% Master of Planning Master of Planning and Development Studies Master of Professional Writing Master of Public Administration 3 0.04% 3 0.04% Master of Public Art Studies Master of Public Diplomacy Master of Public Health 48 0.58% 36 0.52% Master of Public Policy Master of Public Policy and Management Master of Real Estate Development Master of Sacred Music Master of Sacred Theology Master of Science 251 3.05% 193 2.79% Master of Science and Health Administration 3 0.04% 2 0.03% Master of Science in Athletic Training Master of Science in Bioengineering Master of Science in Civil Engineering Master of Science In Dentistry Master of Science in Education 1 0.01% 0 0.00% Master of Science in Electrical Engineering Master of Science in Environmental Engineering Master of Science in Mechanical Engineering Master of Science in Nursing 1 0.01% 0 0.00% Master of Science in Prosthetics and Orthotics Master of Social Work 2 0.02% 1 0.01% Master of Theological Studies Master of Theology Master of Tourism and Hospitality Management Masters of Industrial Distribution Masters of Physical Therapy MS in Finance MS in Management Studies MS in Mathematical Finance Non Degree 9 0.11% 8 0.12% None 8 0.10% 6 0.09% Other Bachelor 54 0.66% 40 0.58% Other Doctoral (Not Ph.D) 6 0.07% 2 0.03% Other Doctorate 1 0.01% 2 0.03% Other Master 34 0.41% 28 0.41%

PharmCAS Applicant Data Report 2019-2020
All uses of this data should reference the American Association of Colleges of Pharmacy (AACP) as the source of the data and acknowledge that AACP bears no responsibility for interpretations presented or conclusions reached based on analysis of the data. 41
Degrees Earned All Applicants Accepted Applicants # % # %
Other PT Degree or Certificate Ph.D. 16 0.19% 12 0.17% Post-baccalaureate Non-degree Teachers Cert Prog. 5 0.06% 4 0.06% Postgraduate Diploma 5 0.06% 2 0.03% Professional Science Master's 2 0.02% 1 0.01% PsyD PTA TOTAL DEGREES EARNED 8,228 100% 6,907 100%
* Percentages were calculated based on the total number of “degrees earned” for each pool (8228 for all and 6907 for accepted applicants). Applicants may have been awarded additional degrees prior to enrollment in the Pharm.D. program.
Figure 44: Summary of Degrees Earned by PharmCAS Applicants
All Applicants Accepted Applicants
Degrees Earned # % # %
Associate Degree 2,450 29.8% 2,053 29.7%
Bachelor's Degree 4,997 60.7% 4,256 61.6%
Certificate or Credential 162 2.0% 125 1.8%
Diploma 66 0.8% 52 0.8%
Master's Degree 470 5.7% 357 5.2%
Non-degree 14 0.2% 12 0.2%
None 8 0.1% 6 0.1%
Ph.D. or other Doctorate Degree 23 0.3% 16 0.2%
Professional Doctoral Degree 38 0.5% 30 0.4%
TOTAL DEGREES EARNED 8,228 100% 6,907 100%
* Percentages were calculated based on the total number of “degrees earned” for each pool (8228 for all and 6907 for accepted applicants). Applicants may have been awarded additional degrees prior to enrollment in the Pharm.D. program

PharmCAS Applicant Data Report 2019-2020
All uses of this data should reference the American Association of Colleges of Pharmacy (AACP) as the source of the data and acknowledge that AACP bears no responsibility for interpretations presented or conclusions reached based on analysis of the data. 42
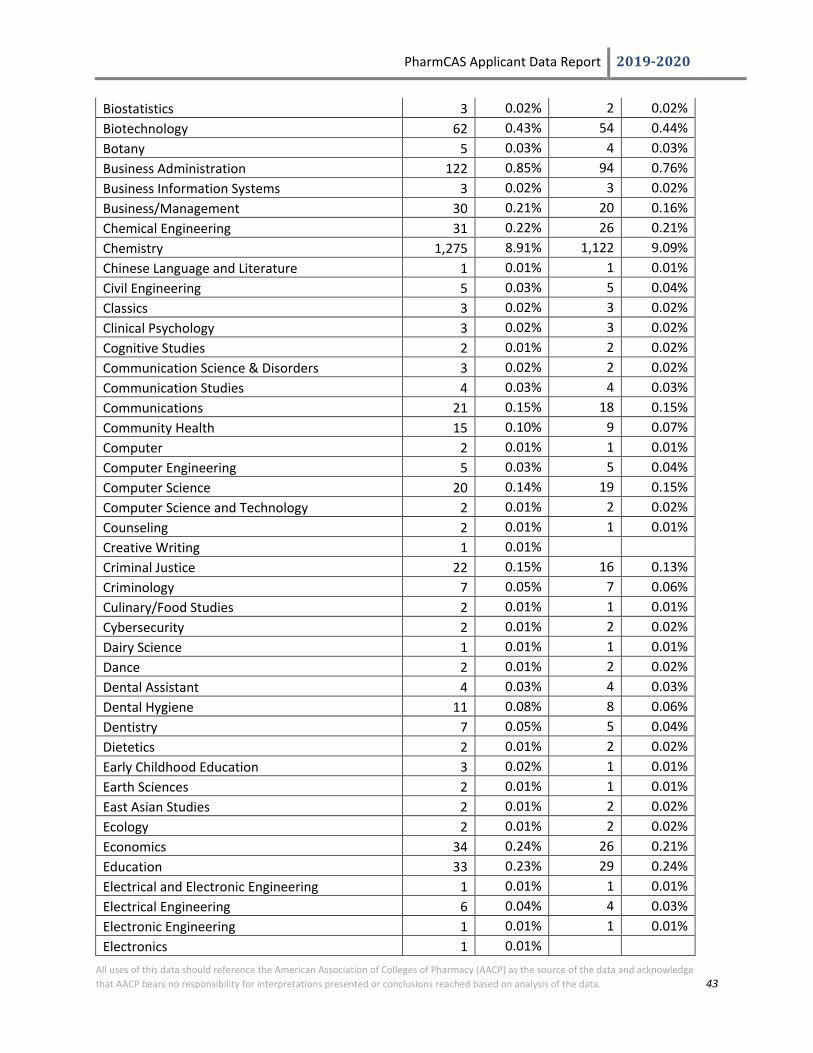
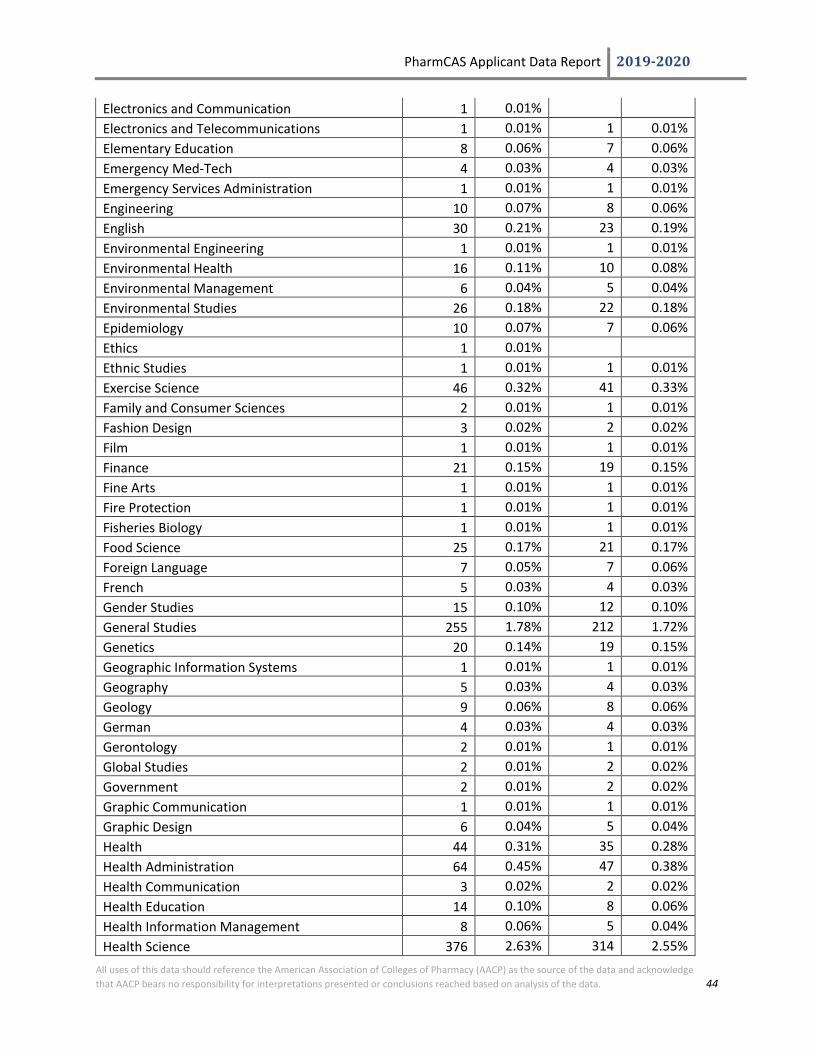
COLLEGE MAJORS Figure 45: College Majors for PharmCAS Applicants
All Applicants Accepted Applicants
College Major # % # %
Accounting/Finance 31 0.22% 24 0.19% Administration 12 0.08% 9 0.07% Advertising 2 0.01% 2 0.02% African Studies 5 0.03% 4 0.03% Agriculture 14 0.10% 12 0.10% Agronomy 1 0.01% 1 0.01% Allied Health 36 0.25% 29 0.24% American Studies 3 0.02% 2 0.02% Anatomy 11 0.08% 10 0.08% Anesthesiology 2 0.01% 2 0.02% Animal Science 41 0.29% 36 0.29% Animation and Digital Arts 1 0.01% 1 0.01% Anthropology 34 0.24% 32 0.26% Applied Mathematics 1 0.01% 1 0.01% Applied Studies 13 0.09% 10 0.08% Archaeology 1 0.01% 1 0.01% Architectural Engineering 1 0.01% Architecture 1 0.01% Art 30 0.21% 26 0.21% Art Education 1 0.01% 0.00% Art History 2 0.01% 2 0.02% Asian Studies 5 0.03% 5 0.04% Asian-American Studies 1 0.01% 1 0.01% Athletic Training 2 0.01% 1 0.01% Aviation 2 0.01% 2 0.02% Bacteriology 2 0.01% Behavioral Science 15 0.10% 12 0.10% Biochemical Engineering 2 0.01% 1 0.01% Biochemistry 869 6.07% 784 6.35% Biochemistry and Molecular Biology 96 0.67% 90 0.73% Bioengineering 8 0.06% 6 0.05% Bioinformatics 10 0.07% 8 0.06% Biological Sciences 645 4.51% 573 4.64% Biology 2,917 20.39% 2,543 20.61% Biomedical Engineering 19 0.13% 18 0.15% Biomedical Science 521 3.64% 464 3.76% Biophysics 5 0.03% 5 0.04%
PharmCAS Applicant Data Report 2019-2020
All uses of this data should reference the American Association of Colleges of Pharmacy (AACP) as the source of the data and acknowledge that AACP bears no responsibility for interpretations presented or conclusions reached based on analysis of the data. 43
Biostatistics 3 0.02% 2 0.02% Biotechnology 62 0.43% 54 0.44% Botany 5 0.03% 4 0.03% Business Administration 122 0.85% 94 0.76% Business Information Systems 3 0.02% 3 0.02% Business/Management 30 0.21% 20 0.16% Chemical Engineering 31 0.22% 26 0.21% Chemistry 1,275 8.91% 1,122 9.09% Chinese Language and Literature 1 0.01% 1 0.01% Civil Engineering 5 0.03% 5 0.04% Classics 3 0.02% 3 0.02% Clinical Psychology 3 0.02% 3 0.02% Cognitive Studies 2 0.01% 2 0.02% Communication Science & Disorders 3 0.02% 2 0.02% Communication Studies 4 0.03% 4 0.03% Communications 21 0.15% 18 0.15% Community Health 15 0.10% 9 0.07% Computer 2 0.01% 1 0.01% Computer Engineering 5 0.03% 5 0.04% Computer Science 20 0.14% 19 0.15% Computer Science and Technology 2 0.01% 2 0.02% Counseling 2 0.01% 1 0.01% Creative Writing 1 0.01% Criminal Justice 22 0.15% 16 0.13% Criminology 7 0.05% 7 0.06% Culinary/Food Studies 2 0.01% 1 0.01% Cybersecurity 2 0.01% 2 0.02% Dairy Science 1 0.01% 1 0.01% Dance 2 0.01% 2 0.02% Dental Assistant 4 0.03% 4 0.03% Dental Hygiene 11 0.08% 8 0.06% Dentistry 7 0.05% 5 0.04% Dietetics 2 0.01% 2 0.02% Early Childhood Education 3 0.02% 1 0.01% Earth Sciences 2 0.01% 1 0.01% East Asian Studies 2 0.01% 2 0.02% Ecology 2 0.01% 2 0.02% Economics 34 0.24% 26 0.21% Education 33 0.23% 29 0.24% Electrical and Electronic Engineering 1 0.01% 1 0.01% Electrical Engineering 6 0.04% 4 0.03% Electronic Engineering 1 0.01% 1 0.01% Electronics 1 0.01%
PharmCAS Applicant Data Report 2019-2020
All uses of this data should reference the American Association of Colleges of Pharmacy (AACP) as the source of the data and acknowledge that AACP bears no responsibility for interpretations presented or conclusions reached based on analysis of the data. 44
Electronics and Communication 1 0.01% Electronics and Telecommunications 1 0.01% 1 0.01% Elementary Education 8 0.06% 7 0.06% Emergency Med-Tech 4 0.03% 4 0.03% Emergency Services Administration 1 0.01% 1 0.01% Engineering 10 0.07% 8 0.06% English 30 0.21% 23 0.19% Environmental Engineering 1 0.01% 1 0.01% Environmental Health 16 0.11% 10 0.08% Environmental Management 6 0.04% 5 0.04% Environmental Studies 26 0.18% 22 0.18% Epidemiology 10 0.07% 7 0.06% Ethics 1 0.01% Ethnic Studies 1 0.01% 1 0.01% Exercise Science 46 0.32% 41 0.33% Family and Consumer Sciences 2 0.01% 1 0.01% Fashion Design 3 0.02% 2 0.02% Film 1 0.01% 1 0.01% Finance 21 0.15% 19 0.15% Fine Arts 1 0.01% 1 0.01% Fire Protection 1 0.01% 1 0.01% Fisheries Biology 1 0.01% 1 0.01% Food Science 25 0.17% 21 0.17% Foreign Language 7 0.05% 7 0.06% French 5 0.03% 4 0.03% Gender Studies 15 0.10% 12 0.10% General Studies 255 1.78% 212 1.72% Genetics 20 0.14% 19 0.15% Geographic Information Systems 1 0.01% 1 0.01% Geography 5 0.03% 4 0.03% Geology 9 0.06% 8 0.06% German 4 0.03% 4 0.03% Gerontology 2 0.01% 1 0.01% Global Studies 2 0.01% 2 0.02% Government 2 0.01% 2 0.02% Graphic Communication 1 0.01% 1 0.01% Graphic Design 6 0.04% 5 0.04% Health 44 0.31% 35 0.28% Health Administration 64 0.45% 47 0.38% Health Communication 3 0.02% 2 0.02% Health Education 14 0.10% 8 0.06% Health Information Management 8 0.06% 5 0.04% Health Science 376 2.63% 314 2.55%

PharmCAS Applicant Data Report 2019-2020
All uses of this data should reference the American Association of Colleges of Pharmacy (AACP) as the source of the data and acknowledge that AACP bears no responsibility for interpretations presented or conclusions reached based on analysis of the data. 45
Hispanic Language & Literature 1 0.01% 1 0.01% Histology 2 0.01% 1 0.01% History 18 0.13% 16 0.13% Histotechnology 1 0.01% 1 0.01% Hospitality Management 2 0.01% 2 0.02% Human Biology 87 0.61% 82 0.66% Human Development 12 0.08% 12 0.10% Human Resources 1 0.01% 1 0.01% Human Services 5 0.03% 5 0.04% Humanities 8 0.06% 7 0.06% Independent/Interdisiplinary Studies 26 0.18% 25 0.20% Industrial Engineering 1 0.01% 1 0.01% Industrial Pharmacy 3 0.02% 2 0.02% Industrial Technology 2 0.01% 1 0.01% Informatics 5 0.03% 4 0.03% Information Sciences 1 0.01% 1 0.01% Information Security 1 0.01% 1 0.01% Information Systems 4 0.03% 2 0.02% Information Technology 6 0.04% 2 0.02% Integrative Biology 16 0.11% 13 0.11% Interdisciplinary Studies 53 0.37% 43 0.35% Interior Design 1 0.01% 1 0.01% International Business 7 0.05% 6 0.05% International Health 1 0.01% 1 0.01% International Relations 5 0.03% 3 0.02% International Studies 2 0.01% 2 0.02% Japanese 2 0.01% 2 0.02% Jewish Studies 1 0.01% 1 0.01% Journalism 2 0.01% 2 0.02% Kinesiology 62 0.43% 54 0.44% Laboratory Technology 14 0.10% 12 0.10% Latin American Studies 2 0.01% 2 0.02% Law 11 0.08% 8 0.06% Liberal Arts 122 0.85% 100 0.81% Liberal Studies 24 0.17% 22 0.18% Library Science 4 0.03% 2 0.02% Linguistics 3 0.02% 3 0.02% Literature 4 0.03% 4 0.03% Magnetic Resonance Imaging 1 0.01% 1 0.01% Management 21 0.15% 18 0.15% Marine Biology 8 0.06% 7 0.06% Marine Science 1 0.01% 1 0.01% Marketing 21 0.15% 15 0.12%

PharmCAS Applicant Data Report 2019-2020
All uses of this data should reference the American Association of Colleges of Pharmacy (AACP) as the source of the data and acknowledge that AACP bears no responsibility for interpretations presented or conclusions reached based on analysis of the data. 46
Marriage and Family Therapy 1 0.01% 1 0.01% Massage Therapy 2 0.01% 2 0.02% Materials Science 1 0.01% 1 0.01% Mathematics 64 0.45% 55 0.45% Mechanical Engineering 5 0.03% 4 0.03% Media Design 2 0.01% 2 0.02% Media Technology 2 0.01% 2 0.02% Medical Assistant 15 0.10% 9 0.07% Medical Laboratory Tech 16 0.11% 14 0.11% Medical Physics 1 0.01% 1 0.01% Medical Tech 25 0.17% 22 0.18% Medicine 36 0.25% 31 0.25% Microbiology 134 0.94% 111 0.90% Military Science 1 0.01% 1 0.01% Molecular Biology 77 0.54% 70 0.57% Molecular Biology, Cell Biology & Biochemistry 64 0.45% 61 0.49% Multimedia 1 0.01% 1 0.01% Music 10 0.07% 9 0.07% Music Education 2 0.01% Music Performance 4 0.03% 4 0.03% Native American Studies 1 0.01% 1 0.01% Natural Science 97 0.68% 73 0.59% Naval Engineering 1 0.01% 1 0.01% Neurobiology 18 0.13% 16 0.13% Neuropsychology 1 0.01% 1 0.01% Neuroscience 117 0.82% 105 0.85% No Answer 216 1.51% 176 1.43% Nursing 65 0.45% 51 0.41% Nutrition 99 0.69% 90 0.73% Occupational Therapy Assistant 1 0.01% Optometry 3 0.02% 2 0.02% Organismic Biology 1 0.01% 1 0.01% Organizational Development 2 0.01% 2 0.02% Osteopathic Medicine 1 0.01% 1 0.01% Other Health Sciences Major 58 0.41% 49 0.40% Other Life Sciences Major 20 0.14% 16 0.13% Other Physical Sciences Major 5 0.03% 5 0.04% Other Social Sciences Major 3 0.02% 3 0.02% Other/Not Listed 162 1.13% 132 1.07% Parasitology 1 0.01% 1 0.01% Pathology 3 0.02% 2 0.02% Petroleum Engineering 1 0.01% 1 0.01% Pharmaceutical Sciences 658 4.60% 580 4.70%

PharmCAS Applicant Data Report 2019-2020
All uses of this data should reference the American Association of Colleges of Pharmacy (AACP) as the source of the data and acknowledge that AACP bears no responsibility for interpretations presented or conclusions reached based on analysis of the data. 47
Pharmacology 85 0.59% 70 0.57% Pharmacy 2,029 14.18% 1,717 13.92% Philosophy 16 0.11% 12 0.10% Photography 1 0.01% 1 0.01% Physical Education 4 0.03% 2 0.02% Physical Science 8 0.06% 7 0.06% Physical Therapist Assistant 4 0.03% 3 0.02% Physical Therapy 2 0.01% 2 0.02% Physical Therapy - Pre-PT 2 0.01% 2 0.02% Physician Assistant 8 0.06% 6 0.05% Physics 13 0.09% 11 0.09% Physiology 63 0.44% 59 0.48% Political Science 16 0.11% 15 0.12% Premedical 86 0.60% 76 0.62% Pre-Professional 437 3.05% 389 3.15% Psychobiology 21 0.15% 19 0.15% Psychology 293 2.05% 261 2.12% Public Administration 4 0.03% 4 0.03% Public Health 150 1.05% 129 1.05% Public Policy 6 0.04% 2 0.02% Public Relations 2 0.01% 2 0.02% Quality Assurance 3 0.02% 1 0.01% Radiography 1 0.01% 1 0.01% Radiology 9 0.06% 8 0.06% Rangeland Resource Science 1 0.01% 1 0.01% Regulatory Affairs 7 0.05% 5 0.04% Religion 2 0.01% 1 0.01% Religious Studies 3 0.02% 3 0.02% Research Methods Respiratory Therapy 13 0.09% 8 0.06% Russian and Central European Studies 1 0.01% 1 0.01% Science, Technology and Society 101 0.71% 81 0.66% Social Sciences 17 0.12% 13 0.11% Social Welfare 1 0.01% 1 0.01% Social Work 7 0.05% 5 0.04% Sociology 29 0.20% 25 0.20% Spanish 37 0.26% 35 0.28% Special Education 2 0.01% 2 0.02% Sports Medicine 2 0.01% 2 0.02% Statistics 3 0.02% 3 0.02% Sustainable Manufacturing 1 0.01% 1 0.01% Taxation 1 0.01% 1 0.01% Telecommunication Engineering 1 0.01% 1 0.01%
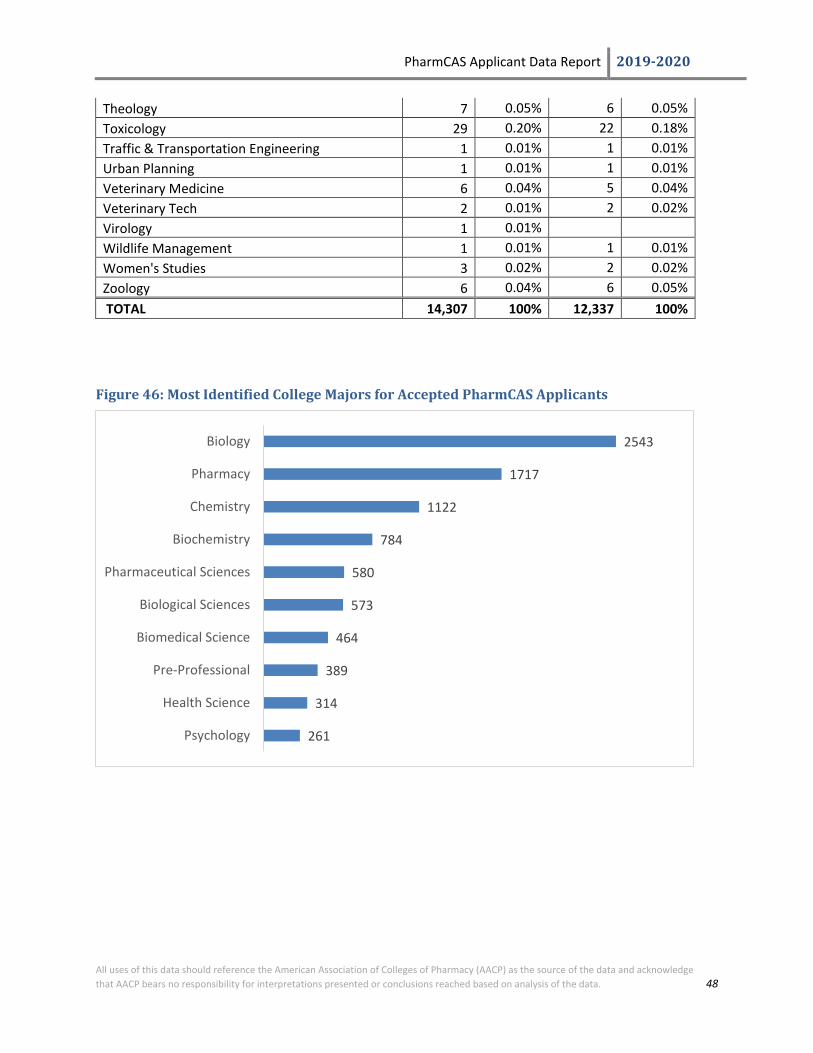
PharmCAS Applicant Data Report 2019-2020
All uses of this data should reference the American Association of Colleges of Pharmacy (AACP) as the source of the data and acknowledge that AACP bears no responsibility for interpretations presented or conclusions reached based on analysis of the data. 48
Theology 7 0.05% 6 0.05% Toxicology 29 0.20% 22 0.18% Traffic & Transportation Engineering 1 0.01% 1 0.01% Urban Planning 1 0.01% 1 0.01% Veterinary Medicine 6 0.04% 5 0.04% Veterinary Tech 2 0.01% 2 0.02% Virology 1 0.01% Wildlife Management 1 0.01% 1 0.01% Women's Studies 3 0.02% 2 0.02% Zoology 6 0.04% 6 0.05% TOTAL 14,307 100% 12,337 100%
Figure 46: Most Identified College Majors for Accepted PharmCAS Applicants
2543
1717
1122
784
580
573
464
389
314
261
Biology
Pharmacy
Chemistry
Biochemistry
Pharmaceutical Sciences
Biological Sciences
Biomedical Science
Pre-Professional
Health Science
Psychology
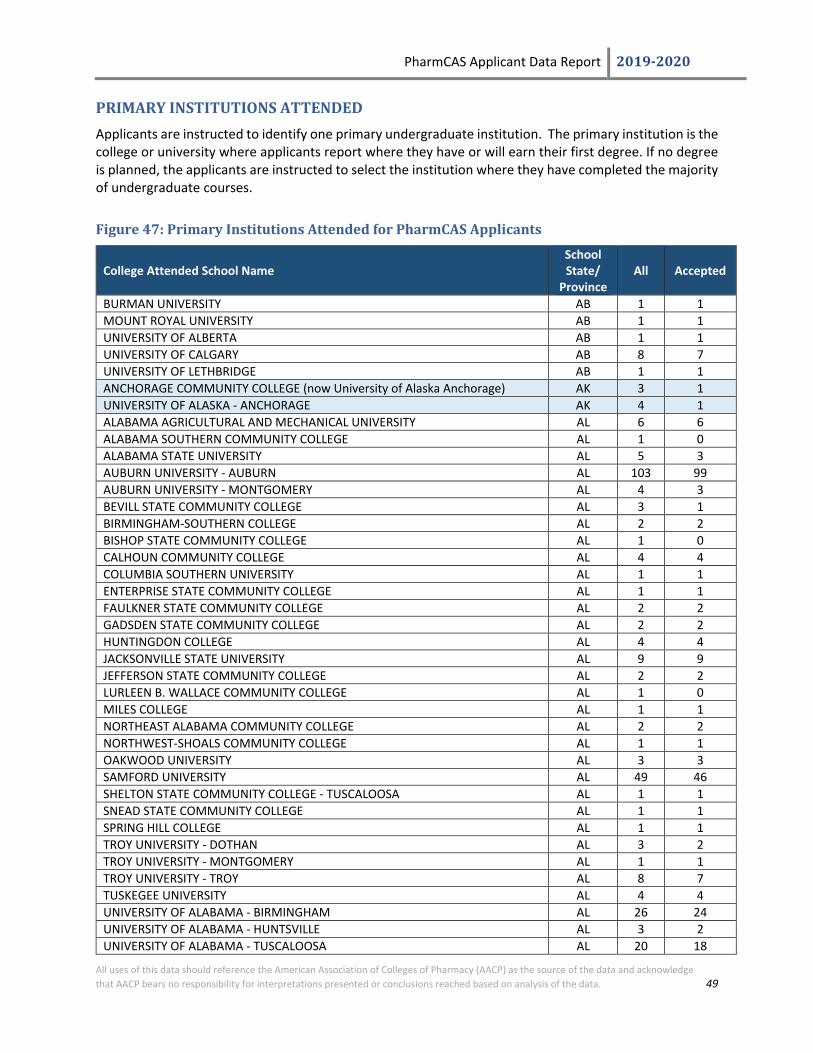
PharmCAS Applicant Data Report 2019-2020
All uses of this data should reference the American Association of Colleges of Pharmacy (AACP) as the source of the data and acknowledge that AACP bears no responsibility for interpretations presented or conclusions reached based on analysis of the data. 49
PRIMARY INSTITUTIONS ATTENDED Applicants are instructed to identify one primary undergraduate institution. The primary institution is the college or university where applicants report where they have or will earn their first degree. If no degree is planned, the applicants are instructed to select the institution where they have completed the majority of undergraduate courses.
Figure 47: Primary Institutions Attended for PharmCAS Applicants
College Attended School Name School State/
Province All Accepted
BURMAN UNIVERSITY AB 1 1 MOUNT ROYAL UNIVERSITY AB 1 1 UNIVERSITY OF ALBERTA AB 1 1 UNIVERSITY OF CALGARY AB 8 7 UNIVERSITY OF LETHBRIDGE AB 1 1 ANCHORAGE COMMUNITY COLLEGE (now University of Alaska Anchorage) AK 3 1 UNIVERSITY OF ALASKA - ANCHORAGE AK 4 1 ALABAMA AGRICULTURAL AND MECHANICAL UNIVERSITY AL 6 6 ALABAMA SOUTHERN COMMUNITY COLLEGE AL 1 0 ALABAMA STATE UNIVERSITY AL 5 3 AUBURN UNIVERSITY - AUBURN AL 103 99 AUBURN UNIVERSITY - MONTGOMERY AL 4 3 BEVILL STATE COMMUNITY COLLEGE AL 3 1 BIRMINGHAM-SOUTHERN COLLEGE AL 2 2 BISHOP STATE COMMUNITY COLLEGE AL 1 0 CALHOUN COMMUNITY COLLEGE AL 4 4 COLUMBIA SOUTHERN UNIVERSITY AL 1 1 ENTERPRISE STATE COMMUNITY COLLEGE AL 1 1 FAULKNER STATE COMMUNITY COLLEGE AL 2 2 GADSDEN STATE COMMUNITY COLLEGE AL 2 2 HUNTINGDON COLLEGE AL 4 4 JACKSONVILLE STATE UNIVERSITY AL 9 9 JEFFERSON STATE COMMUNITY COLLEGE AL 2 2 LURLEEN B. WALLACE COMMUNITY COLLEGE AL 1 0 MILES COLLEGE AL 1 1 NORTHEAST ALABAMA COMMUNITY COLLEGE AL 2 2 NORTHWEST-SHOALS COMMUNITY COLLEGE AL 1 1 OAKWOOD UNIVERSITY AL 3 3 SAMFORD UNIVERSITY AL 49 46 SHELTON STATE COMMUNITY COLLEGE - TUSCALOOSA AL 1 1 SNEAD STATE COMMUNITY COLLEGE AL 1 1 SPRING HILL COLLEGE AL 1 1 TROY UNIVERSITY - DOTHAN AL 3 2 TROY UNIVERSITY - MONTGOMERY AL 1 1 TROY UNIVERSITY - TROY AL 8 7 TUSKEGEE UNIVERSITY AL 4 4 UNIVERSITY OF ALABAMA - BIRMINGHAM AL 26 24 UNIVERSITY OF ALABAMA - HUNTSVILLE AL 3 2 UNIVERSITY OF ALABAMA - TUSCALOOSA AL 20 18
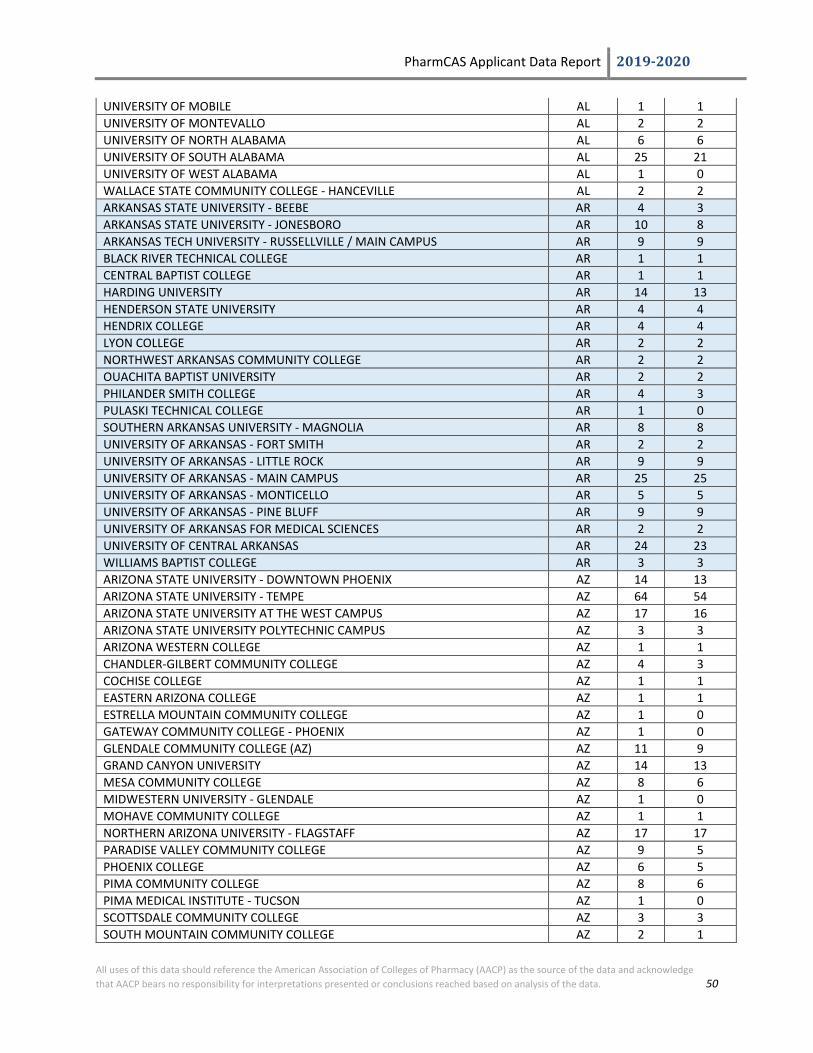
PharmCAS Applicant Data Report 2019-2020
All uses of this data should reference the American Association of Colleges of Pharmacy (AACP) as the source of the data and acknowledge that AACP bears no responsibility for interpretations presented or conclusions reached based on analysis of the data. 50
UNIVERSITY OF MOBILE AL 1 1 UNIVERSITY OF MONTEVALLO AL 2 2 UNIVERSITY OF NORTH ALABAMA AL 6 6 UNIVERSITY OF SOUTH ALABAMA AL 25 21 UNIVERSITY OF WEST ALABAMA AL 1 0 WALLACE STATE COMMUNITY COLLEGE - HANCEVILLE AL 2 2 ARKANSAS STATE UNIVERSITY - BEEBE AR 4 3 ARKANSAS STATE UNIVERSITY - JONESBORO AR 10 8 ARKANSAS TECH UNIVERSITY - RUSSELLVILLE / MAIN CAMPUS AR 9 9 BLACK RIVER TECHNICAL COLLEGE AR 1 1 CENTRAL BAPTIST COLLEGE AR 1 1 HARDING UNIVERSITY AR 14 13 HENDERSON STATE UNIVERSITY AR 4 4 HENDRIX COLLEGE AR 4 4 LYON COLLEGE AR 2 2 NORTHWEST ARKANSAS COMMUNITY COLLEGE AR 2 2 OUACHITA BAPTIST UNIVERSITY AR 2 2 PHILANDER SMITH COLLEGE AR 4 3 PULASKI TECHNICAL COLLEGE AR 1 0 SOUTHERN ARKANSAS UNIVERSITY - MAGNOLIA AR 8 8 UNIVERSITY OF ARKANSAS - FORT SMITH AR 2 2 UNIVERSITY OF ARKANSAS - LITTLE ROCK AR 9 9 UNIVERSITY OF ARKANSAS - MAIN CAMPUS AR 25 25 UNIVERSITY OF ARKANSAS - MONTICELLO AR 5 5 UNIVERSITY OF ARKANSAS - PINE BLUFF AR 9 9 UNIVERSITY OF ARKANSAS FOR MEDICAL SCIENCES AR 2 2 UNIVERSITY OF CENTRAL ARKANSAS AR 24 23 WILLIAMS BAPTIST COLLEGE AR 3 3 ARIZONA STATE UNIVERSITY - DOWNTOWN PHOENIX AZ 14 13 ARIZONA STATE UNIVERSITY - TEMPE AZ 64 54 ARIZONA STATE UNIVERSITY AT THE WEST CAMPUS AZ 17 16 ARIZONA STATE UNIVERSITY POLYTECHNIC CAMPUS AZ 3 3 ARIZONA WESTERN COLLEGE AZ 1 1 CHANDLER-GILBERT COMMUNITY COLLEGE AZ 4 3 COCHISE COLLEGE AZ 1 1 EASTERN ARIZONA COLLEGE AZ 1 1 ESTRELLA MOUNTAIN COMMUNITY COLLEGE AZ 1 0 GATEWAY COMMUNITY COLLEGE - PHOENIX AZ 1 0 GLENDALE COMMUNITY COLLEGE (AZ) AZ 11 9 GRAND CANYON UNIVERSITY AZ 14 13 MESA COMMUNITY COLLEGE AZ 8 6 MIDWESTERN UNIVERSITY - GLENDALE AZ 1 0 MOHAVE COMMUNITY COLLEGE AZ 1 1 NORTHERN ARIZONA UNIVERSITY - FLAGSTAFF AZ 17 17 PARADISE VALLEY COMMUNITY COLLEGE AZ 9 5 PHOENIX COLLEGE AZ 6 5 PIMA COMMUNITY COLLEGE AZ 8 6 PIMA MEDICAL INSTITUTE - TUCSON AZ 1 0 SCOTTSDALE COMMUNITY COLLEGE AZ 3 3 SOUTH MOUNTAIN COMMUNITY COLLEGE AZ 2 1
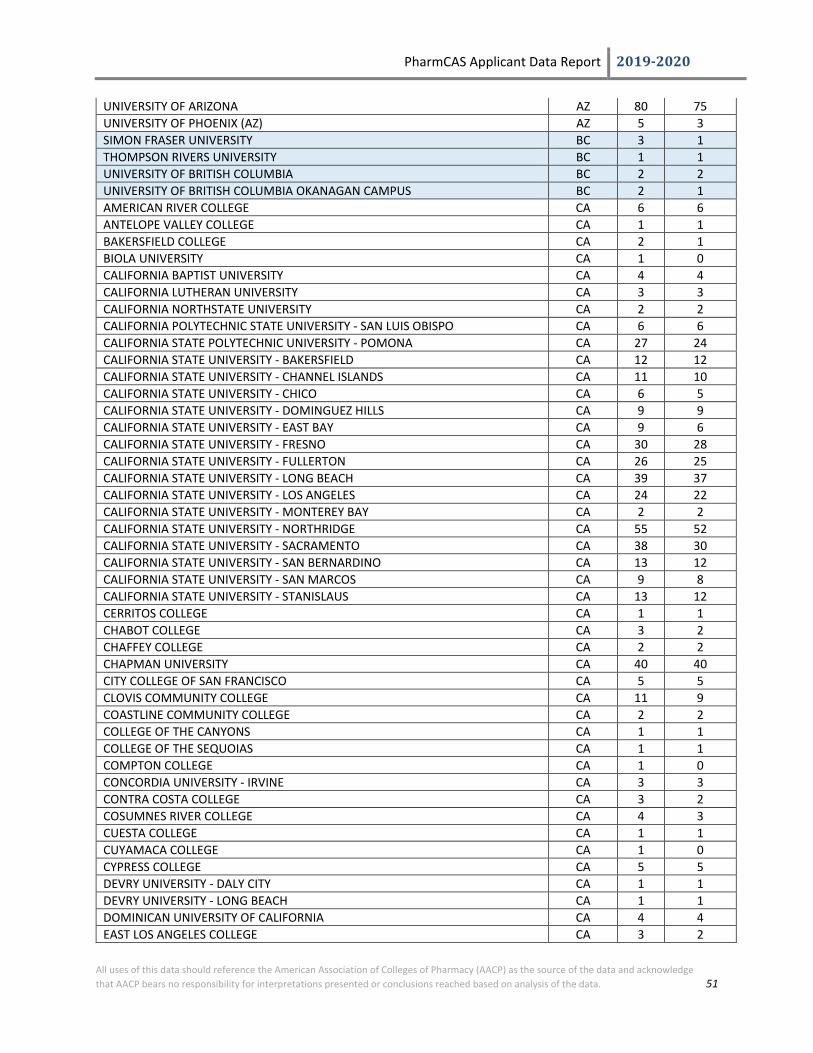
PharmCAS Applicant Data Report 2019-2020
All uses of this data should reference the American Association of Colleges of Pharmacy (AACP) as the source of the data and acknowledge that AACP bears no responsibility for interpretations presented or conclusions reached based on analysis of the data. 51
UNIVERSITY OF ARIZONA AZ 80 75 UNIVERSITY OF PHOENIX (AZ) AZ 5 3 SIMON FRASER UNIVERSITY BC 3 1 THOMPSON RIVERS UNIVERSITY BC 1 1 UNIVERSITY OF BRITISH COLUMBIA BC 2 2 UNIVERSITY OF BRITISH COLUMBIA OKANAGAN CAMPUS BC 2 1 AMERICAN RIVER COLLEGE CA 6 6 ANTELOPE VALLEY COLLEGE CA 1 1 BAKERSFIELD COLLEGE CA 2 1 BIOLA UNIVERSITY CA 1 0 CALIFORNIA BAPTIST UNIVERSITY CA 4 4 CALIFORNIA LUTHERAN UNIVERSITY CA 3 3 CALIFORNIA NORTHSTATE UNIVERSITY CA 2 2 CALIFORNIA POLYTECHNIC STATE UNIVERSITY - SAN LUIS OBISPO CA 6 6 CALIFORNIA STATE POLYTECHNIC UNIVERSITY - POMONA CA 27 24 CALIFORNIA STATE UNIVERSITY - BAKERSFIELD CA 12 12 CALIFORNIA STATE UNIVERSITY - CHANNEL ISLANDS CA 11 10 CALIFORNIA STATE UNIVERSITY - CHICO CA 6 5 CALIFORNIA STATE UNIVERSITY - DOMINGUEZ HILLS CA 9 9 CALIFORNIA STATE UNIVERSITY - EAST BAY CA 9 6 CALIFORNIA STATE UNIVERSITY - FRESNO CA 30 28 CALIFORNIA STATE UNIVERSITY - FULLERTON CA 26 25 CALIFORNIA STATE UNIVERSITY - LONG BEACH CA 39 37 CALIFORNIA STATE UNIVERSITY - LOS ANGELES CA 24 22 CALIFORNIA STATE UNIVERSITY - MONTEREY BAY CA 2 2 CALIFORNIA STATE UNIVERSITY - NORTHRIDGE CA 55 52 CALIFORNIA STATE UNIVERSITY - SACRAMENTO CA 38 30 CALIFORNIA STATE UNIVERSITY - SAN BERNARDINO CA 13 12 CALIFORNIA STATE UNIVERSITY - SAN MARCOS CA 9 8 CALIFORNIA STATE UNIVERSITY - STANISLAUS CA 13 12 CERRITOS COLLEGE CA 1 1 CHABOT COLLEGE CA 3 2 CHAFFEY COLLEGE CA 2 2 CHAPMAN UNIVERSITY CA 40 40 CITY COLLEGE OF SAN FRANCISCO CA 5 5 CLOVIS COMMUNITY COLLEGE CA 11 9 COASTLINE COMMUNITY COLLEGE CA 2 2 COLLEGE OF THE CANYONS CA 1 1 COLLEGE OF THE SEQUOIAS CA 1 1 COMPTON COLLEGE CA 1 0 CONCORDIA UNIVERSITY - IRVINE CA 3 3 CONTRA COSTA COLLEGE CA 3 2 COSUMNES RIVER COLLEGE CA 4 3 CUESTA COLLEGE CA 1 1 CUYAMACA COLLEGE CA 1 0 CYPRESS COLLEGE CA 5 5 DEVRY UNIVERSITY - DALY CITY CA 1 1 DEVRY UNIVERSITY - LONG BEACH CA 1 1 DOMINICAN UNIVERSITY OF CALIFORNIA CA 4 4 EAST LOS ANGELES COLLEGE CA 3 2

PharmCAS Applicant Data Report 2019-2020
All uses of this data should reference the American Association of Colleges of Pharmacy (AACP) as the source of the data and acknowledge that AACP bears no responsibility for interpretations presented or conclusions reached based on analysis of the data. 52
EL CAMINO COLLEGE CA 2 2 EVERGREEN VALLEY COLLEGE CA 3 3 FOLSOM LAKE COLLEGE CA 1 1 FOOTHILL COLLEGE CA 1 0 FRESNO CITY COLLEGE CA 2 2 FRESNO PACIFIC UNIVERSITY CA 2 2 FULLERTON COLLEGE CA 2 2 GLENDALE COMMUNITY COLLEGE (CA) CA 2 1 GOLDEN WEST COLLEGE CA 4 2 GROSSMONT COLLEGE CA 2 1 HARTNELL COLLEGE CA 1 0 HUMBOLDT STATE UNIVERSITY CA 1 1 IRVINE VALLEY COLLEGE CA 3 2 LA SIERRA UNIVERSITY CA 7 6 LANEY COLLEGE CA 1 1 LAS POSITAS COLLEGE CA 1 1 LONG BEACH CITY COLLEGE CA 3 3 LOS ANGELES CITY COLLEGE CA 1 1 LOS ANGELES HARBOR COLLEGE CA 1 1 LOS ANGELES MISSION COLLEGE CA 1 1 LOS ANGELES PIERCE COLLEGE CA 3 3 LOS ANGELES SOUTHWEST COLLEGE CA 2 2 LOS ANGELES TRADE TECHNICAL COLLEGE CA 2 2 LOS ANGELES VALLEY COLLEGE CA 4 3 LOS MEDANOS COLLEGE CA 1 1 LOYOLA MARYMOUNT UNIVERSITY CA 2 1 MARYMOUNT CALIFORNIA UNIVERSITY CA 1 1 MENDOCINO COLLEGE CA 1 0 MERCED COLLEGE CA 4 4 MILLS COLLEGE CA 1 1 MISSION COLLEGE CA 2 1 MODESTO JUNIOR COLLEGE CA 2 0 MONTEREY PENINSULA COLLEGE CA 1 1 MORENO VALLEY COLLEGE CA 1 1 MOUNT SAINT MARY'S COLLEGE CA 3 2 MOUNT SAN ANTONIO COLLEGE CA 4 4 MOUNT SAN JACINTO COLLEGE CA 1 1 NATIONAL UNIVERSITY CA 1 1 NOTRE DAME DE NAMUR UNIVERSITY CA 1 1 OHLONE COLLEGE CA 1 1 ORANGE COAST COLLEGE CA 5 5 OXNARD COLLEGE CA 1 1 PACIFIC UNION COLLEGE CA 5 5 PALOMAR COLLEGE CA 1 0 PASADENA CITY COLLEGE CA 4 3 PEPPERDINE UNIVERSITY CA 1 0 PITZER COLLEGE CA 2 1 POINT LOMA NAZARENE UNIVERSITY CA 1 1 POMONA COLLEGE CA 1 1 RIVERSIDE CITY COLLEGE CA 2 0

PharmCAS Applicant Data Report 2019-2020
All uses of this data should reference the American Association of Colleges of Pharmacy (AACP) as the source of the data and acknowledge that AACP bears no responsibility for interpretations presented or conclusions reached based on analysis of the data. 53
SACRAMENTO CITY COLLEGE CA 1 1 SADDLEBACK COLLEGE CA 2 1 SAINT MARY'S COLLEGE OF CALIFORNIA CA 4 3 SAN BERNARDINO VALLEY COLLEGE CA 3 2 SAN DIEGO CHRISTIAN COLLEGE CA 1 0 SAN DIEGO MESA COLLEGE CA 1 1 SAN DIEGO MIRAMAR COLLEGE CA 3 2 SAN DIEGO STATE UNIVERSITY CA 22 22 SAN FRANCISCO STATE UNIVERSITY CA 20 17 SAN JOAQUIN DELTA COLLEGE CA 2 1 SAN JOAQUIN VALLEY COLLEGE CA 1 1 SAN JOSE CITY COLLEGE CA 1 1 SAN JOSE STATE UNIVERSITY CA 30 27 SANTA ANA COLLEGE CA 5 4 SANTA BARBARA CITY COLLEGE CA 1 1 SANTA CLARA UNIVERSITY CA 3 3 SANTA MONICA COLLEGE CA 4 4 SANTA ROSA JUNIOR COLLEGE CA 1 0 SANTIAGO CANYON COLLEGE CA 2 2 SHASTA COLLEGE CA 2 2 SIERRA COLLEGE CA 3 3 SOLANO COMMUNITY COLLEGE CA 3 2 SONOMA STATE UNIVERSITY CA 8 6 SOUTHERN CALIFORNIA UNIVERSITY OF HEALTH SCIENCES CA 3 3 SOUTHWESTERN COLLEGE (CA) CA 1 1 STANFORD UNIVERSITY CA 2 2 TRIDENT UNIVERSITY INTERNATIONAL (TUI) CA 1 1 UNIVERSITY OF CALIFORNIA - BERKELEY CA 35 33 UNIVERSITY OF CALIFORNIA - BERKELEY (EXTENSION) CA 1 1 UNIVERSITY OF CALIFORNIA - DAVIS CA 110 101 UNIVERSITY OF CALIFORNIA - IRVINE CA 137 133 UNIVERSITY OF CALIFORNIA - LOS ANGELES CA 92 88 UNIVERSITY OF CALIFORNIA - LOS ANGELES (EXTENSION) CA 2 2 UNIVERSITY OF CALIFORNIA - MERCED CA 25 23 UNIVERSITY OF CALIFORNIA - RIVERSIDE CA 87 81 UNIVERSITY OF CALIFORNIA - SAN DIEGO CA 109 98 UNIVERSITY OF CALIFORNIA - SANTA BARBARA CA 39 38 UNIVERSITY OF CALIFORNIA - SANTA CRUZ CA 27 24 UNIVERSITY OF LA VERNE CA 6 6 UNIVERSITY OF PHOENIX (CA) CA 0 0 UNIVERSITY OF REDLANDS CA 2 1 UNIVERSITY OF SAINT KATHERINE CA 1 1 UNIVERSITY OF SAN DIEGO CA 3 3 UNIVERSITY OF SAN FRANCISCO CA 5 3 UNIVERSITY OF SOUTHERN CALIFORNIA CA 22 22 UNIVERSITY OF THE PACIFIC CA 134 108 VANGUARD UNIVERSITY OF SOUTHERN CALIFORNIA CA 1 1 VENTURA COLLEGE CA 2 2 VICTOR VALLEY COLLEGE CA 1 1 WESTERN UNIVERSITY OF HEALTH SCIENCES CA 1 1
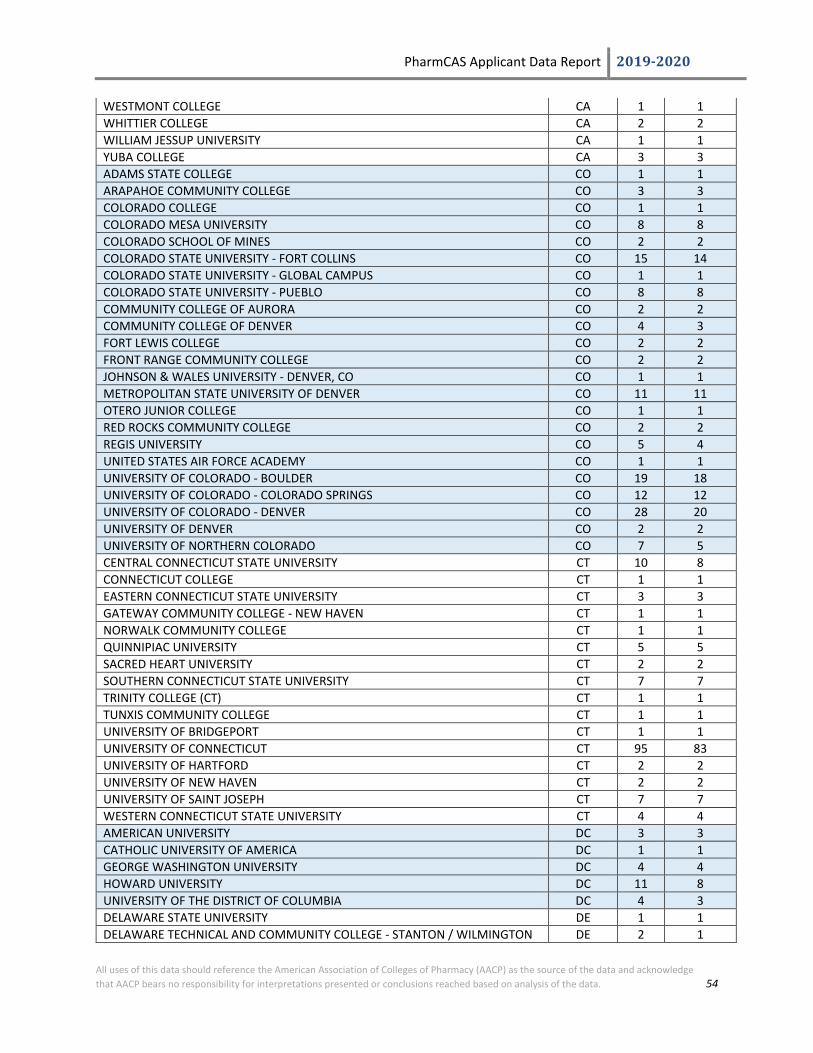
PharmCAS Applicant Data Report 2019-2020
All uses of this data should reference the American Association of Colleges of Pharmacy (AACP) as the source of the data and acknowledge that AACP bears no responsibility for interpretations presented or conclusions reached based on analysis of the data. 54
WESTMONT COLLEGE CA 1 1 WHITTIER COLLEGE CA 2 2 WILLIAM JESSUP UNIVERSITY CA 1 1 YUBA COLLEGE CA 3 3 ADAMS STATE COLLEGE CO 1 1 ARAPAHOE COMMUNITY COLLEGE CO 3 3 COLORADO COLLEGE CO 1 1 COLORADO MESA UNIVERSITY CO 8 8 COLORADO SCHOOL OF MINES CO 2 2 COLORADO STATE UNIVERSITY - FORT COLLINS CO 15 14 COLORADO STATE UNIVERSITY - GLOBAL CAMPUS CO 1 1 COLORADO STATE UNIVERSITY - PUEBLO CO 8 8 COMMUNITY COLLEGE OF AURORA CO 2 2 COMMUNITY COLLEGE OF DENVER CO 4 3 FORT LEWIS COLLEGE CO 2 2 FRONT RANGE COMMUNITY COLLEGE CO 2 2 JOHNSON & WALES UNIVERSITY - DENVER, CO CO 1 1 METROPOLITAN STATE UNIVERSITY OF DENVER CO 11 11 OTERO JUNIOR COLLEGE CO 1 1 RED ROCKS COMMUNITY COLLEGE CO 2 2 REGIS UNIVERSITY CO 5 4 UNITED STATES AIR FORCE ACADEMY CO 1 1 UNIVERSITY OF COLORADO - BOULDER CO 19 18 UNIVERSITY OF COLORADO - COLORADO SPRINGS CO 12 12 UNIVERSITY OF COLORADO - DENVER CO 28 20 UNIVERSITY OF DENVER CO 2 2 UNIVERSITY OF NORTHERN COLORADO CO 7 5 CENTRAL CONNECTICUT STATE UNIVERSITY CT 10 8 CONNECTICUT COLLEGE CT 1 1 EASTERN CONNECTICUT STATE UNIVERSITY CT 3 3 GATEWAY COMMUNITY COLLEGE - NEW HAVEN CT 1 1 NORWALK COMMUNITY COLLEGE CT 1 1 QUINNIPIAC UNIVERSITY CT 5 5 SACRED HEART UNIVERSITY CT 2 2 SOUTHERN CONNECTICUT STATE UNIVERSITY CT 7 7 TRINITY COLLEGE (CT) CT 1 1 TUNXIS COMMUNITY COLLEGE CT 1 1 UNIVERSITY OF BRIDGEPORT CT 1 1 UNIVERSITY OF CONNECTICUT CT 95 83 UNIVERSITY OF HARTFORD CT 2 2 UNIVERSITY OF NEW HAVEN CT 2 2 UNIVERSITY OF SAINT JOSEPH CT 7 7 WESTERN CONNECTICUT STATE UNIVERSITY CT 4 4 AMERICAN UNIVERSITY DC 3 3 CATHOLIC UNIVERSITY OF AMERICA DC 1 1 GEORGE WASHINGTON UNIVERSITY DC 4 4 HOWARD UNIVERSITY DC 11 8 UNIVERSITY OF THE DISTRICT OF COLUMBIA DC 4 3 DELAWARE STATE UNIVERSITY DE 1 1 DELAWARE TECHNICAL AND COMMUNITY COLLEGE - STANTON / WILMINGTON DE 2 1

PharmCAS Applicant Data Report 2019-2020
All uses of this data should reference the American Association of Colleges of Pharmacy (AACP) as the source of the data and acknowledge that AACP bears no responsibility for interpretations presented or conclusions reached based on analysis of the data. 55
UNIVERSITY OF DELAWARE - NEWARK DE 11 11 ADVENTIST UNIVERSITY OF THE HEALTH SCIENCES FL 2 2 AVE MARIA UNIVERSITY FL 1 1 BARRY UNIVERSITY FL 4 3 BETHUNE-COOKMAN UNIVERSITY FL 5 4 BROWARD COLLEGE FL 26 17 CHIPOLA COLLEGE FL 4 3 CITY COLLEGE - FORT LAUDERDALE FL 1 1 CLEARWATER CHRISTIAN COLLEGE FL 1 1 COLLEGE OF CENTRAL FLORIDA FL 2 2 DAYTONA STATE COLLEGE FL 3 1 EASTERN FLORIDA STATE COLLEGE FL 1 1 ECKERD COLLEGE FL 1 0 EDWARD WATERS COLLEGE FL 3 3 FLAGLER COLLEGE FL 1 1 FLORIDA AGRICULTURAL AND MECHANICAL UNIVERSITY FL 72 55 FLORIDA ATLANTIC UNIVERSITY FL 48 44 FLORIDA COLLEGE FL 1 1 FLORIDA GATEWAY COLLEGE FL 1 0 FLORIDA GULF COAST UNIVERSITY FL 21 17 FLORIDA INSTITUTE OF TECHNOLOGY FL 1 1 FLORIDA INTERNATIONAL UNIVERSITY FL 94 86 FLORIDA MEMORIAL UNIVERSITY FL 1 1 FLORIDA NATIONAL COLLEGE - HIALEAH/BIRD ROAD CAMPUS/FLAGLER CAMPUS FL 2 2 FLORIDA NATIONAL UNIVERSITY FL 2 2 FLORIDA SOUTHERN COLLEGE FL 1 1 FLORIDA SOUTHWESTERN STATE COLLEGE FL 7 3 FLORIDA STATE COLLEGE - JACKSONVILLE FL 18 14 FLORIDA STATE UNIVERSITY FL 34 29 GULF COAST STATE COLLEGE FL 1 1 HILLSBOROUGH COMMUNITY COLLEGE FL 6 4 INDIAN RIVER STATE COLLEGE FL 6 6 JOHNSON & WALES UNIVERSITY - NORTH MIAMI, FL FL 1 0 KEISER UNIVERSITY FL 5 5 LAKE-SUMTER STATE COLLEGE FL 1 1 LARKIN UNIVERSITY, FORMERLY KNOWN AS LARKIN HEALTH AND SCIENCE FL 2 2 MIAMI DADE COLLEGE FL 81 74 NEW COLLEGE OF FLORIDA FL 1 1 NORTH FLORIDA COMMUNITY COLLEGE FL 1 1 NORTHWEST FLORIDA STATE COLLEGE FL 1 1 NOVA SOUTHEASTERN UNIVERSITY FL 20 16 PALM BEACH ATLANTIC UNIVERSITY FL 7 7 PALM BEACH STATE COLLEGE FL 18 16 PENSACOLA CHRISTIAN COLLEGE FL 1 1 PENSACOLA STATE COLLEGE FL 2 2 POLK STATE COLLEGE FL 2 2 ROLLINS COLLEGE FL 1 1 SAINT LEO UNIVERSITY (FL) FL 1 1 SAINT PETERSBURG COLLEGE FL 7 4 SAINT THOMAS UNIVERSITY (FL) FL 5 4
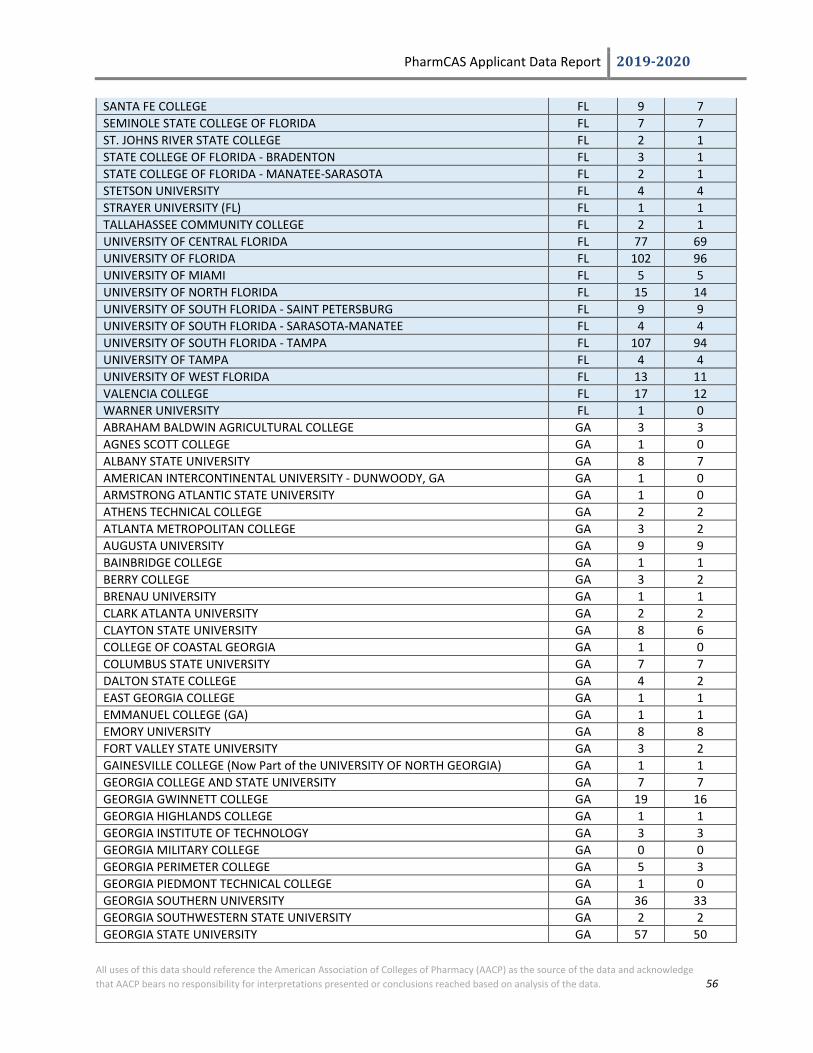
PharmCAS Applicant Data Report 2019-2020
All uses of this data should reference the American Association of Colleges of Pharmacy (AACP) as the source of the data and acknowledge that AACP bears no responsibility for interpretations presented or conclusions reached based on analysis of the data. 56
SANTA FE COLLEGE FL 9 7 SEMINOLE STATE COLLEGE OF FLORIDA FL 7 7 ST. JOHNS RIVER STATE COLLEGE FL 2 1 STATE COLLEGE OF FLORIDA - BRADENTON FL 3 1 STATE COLLEGE OF FLORIDA - MANATEE-SARASOTA FL 2 1 STETSON UNIVERSITY FL 4 4 STRAYER UNIVERSITY (FL) FL 1 1 TALLAHASSEE COMMUNITY COLLEGE FL 2 1 UNIVERSITY OF CENTRAL FLORIDA FL 77 69 UNIVERSITY OF FLORIDA FL 102 96 UNIVERSITY OF MIAMI FL 5 5 UNIVERSITY OF NORTH FLORIDA FL 15 14 UNIVERSITY OF SOUTH FLORIDA - SAINT PETERSBURG FL 9 9 UNIVERSITY OF SOUTH FLORIDA - SARASOTA-MANATEE FL 4 4 UNIVERSITY OF SOUTH FLORIDA - TAMPA FL 107 94 UNIVERSITY OF TAMPA FL 4 4 UNIVERSITY OF WEST FLORIDA FL 13 11 VALENCIA COLLEGE FL 17 12 WARNER UNIVERSITY FL 1 0 ABRAHAM BALDWIN AGRICULTURAL COLLEGE GA 3 3 AGNES SCOTT COLLEGE GA 1 0 ALBANY STATE UNIVERSITY GA 8 7 AMERICAN INTERCONTINENTAL UNIVERSITY - DUNWOODY, GA GA 1 0 ARMSTRONG ATLANTIC STATE UNIVERSITY GA 1 0 ATHENS TECHNICAL COLLEGE GA 2 2 ATLANTA METROPOLITAN COLLEGE GA 3 2 AUGUSTA UNIVERSITY GA 9 9 BAINBRIDGE COLLEGE GA 1 1 BERRY COLLEGE GA 3 2 BRENAU UNIVERSITY GA 1 1 CLARK ATLANTA UNIVERSITY GA 2 2 CLAYTON STATE UNIVERSITY GA 8 6 COLLEGE OF COASTAL GEORGIA GA 1 0 COLUMBUS STATE UNIVERSITY GA 7 7 DALTON STATE COLLEGE GA 4 2 EAST GEORGIA COLLEGE GA 1 1 EMMANUEL COLLEGE (GA) GA 1 1 EMORY UNIVERSITY GA 8 8 FORT VALLEY STATE UNIVERSITY GA 3 2 GAINESVILLE COLLEGE (Now Part of the UNIVERSITY OF NORTH GEORGIA) GA 1 1 GEORGIA COLLEGE AND STATE UNIVERSITY GA 7 7 GEORGIA GWINNETT COLLEGE GA 19 16 GEORGIA HIGHLANDS COLLEGE GA 1 1 GEORGIA INSTITUTE OF TECHNOLOGY GA 3 3 GEORGIA MILITARY COLLEGE GA 0 0 GEORGIA PERIMETER COLLEGE GA 5 3 GEORGIA PIEDMONT TECHNICAL COLLEGE GA 1 0 GEORGIA SOUTHERN UNIVERSITY GA 36 33 GEORGIA SOUTHWESTERN STATE UNIVERSITY GA 2 2 GEORGIA STATE UNIVERSITY GA 57 50

PharmCAS Applicant Data Report 2019-2020
All uses of this data should reference the American Association of Colleges of Pharmacy (AACP) as the source of the data and acknowledge that AACP bears no responsibility for interpretations presented or conclusions reached based on analysis of the data. 57
GORDON STATE COLLEGE GA 8 5 KENNESAW STATE UNIVERSITY GA 33 25 LAGRANGE COLLEGE GA 2 1 LIFE UNIVERSITY GA 2 2 MACON STATE COLLEGE (Now Part of MIDDLE GEORGIA STATE COLLEGE) GA 1 0 MERCER UNIVERSITY - ATLANTA GA 4 3 MERCER UNIVERSITY - MACON GA 18 18 MIDDLE GEORGIA COLLEGE (Now Part of MIDDLE GEORGIA STATE COLLEGE) GA 1 1 MIDDLE GEORGIA STATE COLLEGE GA 2 2 MOREHOUSE COLLEGE GA 1 0 OGLETHORPE UNIVERSITY GA 1 1 OXFORD COLLEGE OF EMORY UNIVERSITY GA 1 1 PIEDMONT COLLEGE GA 1 1 REINHARDT COLLEGE GA 2 2 SAVANNAH STATE UNIVERSITY GA 5 4 SOUTH GEORGIA COLLEGE GA 4 3 SOUTH UNIVERSITY - SAVANNAH GA 2 2 SPELMAN COLLEGE GA 3 3 THOMAS UNIVERSITY GA 1 1 UNIVERSITY OF GEORGIA GA 122 109 UNIVERSITY OF NORTH GEORGIA GA 20 18 UNIVERSITY OF WEST GEORGIA GA 10 10 VALDOSTA STATE UNIVERSITY GA 11 11 WESLEYAN COLLEGE GA 2 2 WIREGRASS GEORGIA TECHNICAL COLLEGE GA 1 1 YOUNG HARRIS COLLEGE GA 4 3 UNIVERSITY OF GUAM GU 5 5 BRIGHAM YOUNG UNIVERSITY - HAWAII HI 2 1 CHAMINADE UNIVERSITY OF HONOLULU HI 3 3 HAWAII PACIFIC UNIVERSITY HI 4 4 KAPIOLANI COMMUNITY COLLEGE HI 1 1 LEEWARD COMMUNITY COLLEGE HI 2 2 UNIVERSITY OF HAWAII - HILO HI 16 16 UNIVERSITY OF HAWAII - MANOA HI 20 20 ASHFORD UNIVERSITY IA 1 0 CENTRAL COLLEGE IA 2 2 CLARKE UNIVERSITY IA 1 1 CORNELL COLLEGE IA 1 1 DES MOINES AREA COMMUNITY COLLEGE IA 3 2 DIVINE WORD COLLEGE IA 1 0 DORDT COLLEGE IA 2 2 DRAKE UNIVERSITY IA 72 66 GRACELAND UNIVERSITY (IOWA) IA 1 1 GRAND VIEW UNIVERSITY IA 1 1 GRINNELL COLLEGE IA 2 2 IOWA STATE UNIVERSITY IA 16 16 IOWA WESTERN COMMUNITY COLLEGE IA 0 0 KAPLAN UNIVERSITY (IA) (now Purdue University Global) IA 3 3 KIRKWOOD COMMUNITY COLLEGE IA 4 3 MERCY COLLEGE OF HEALTH SCIENCES IA 1 1
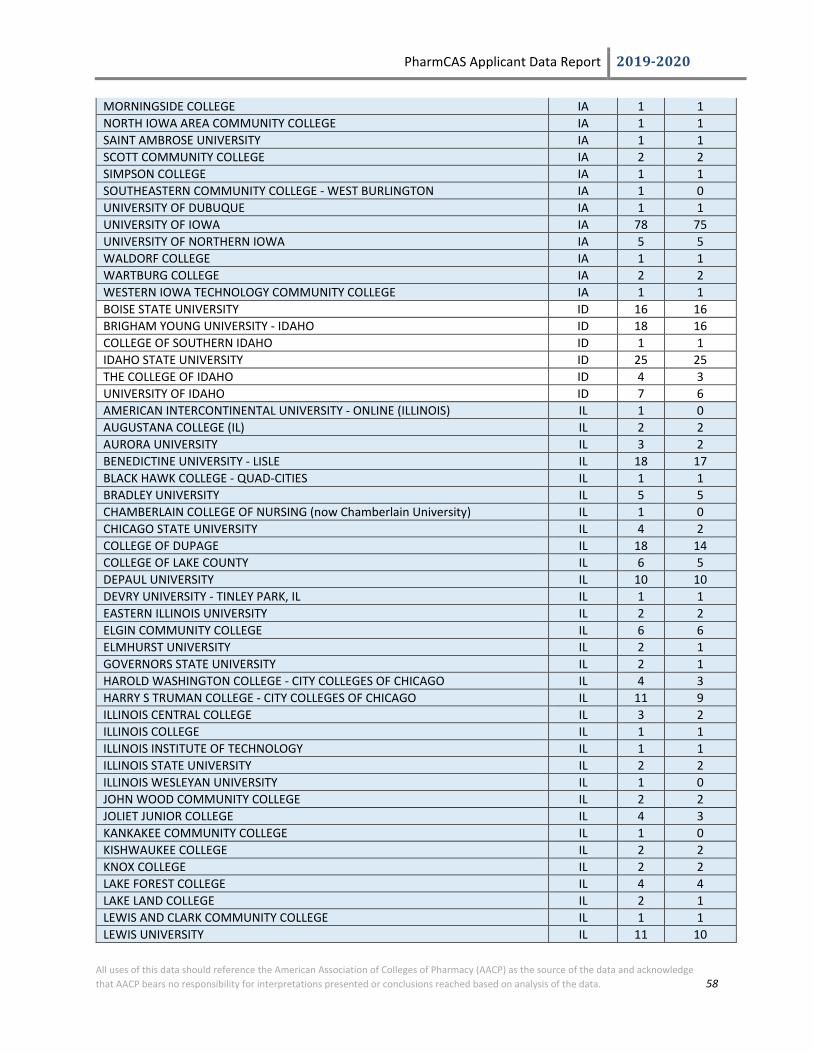
PharmCAS Applicant Data Report 2019-2020
All uses of this data should reference the American Association of Colleges of Pharmacy (AACP) as the source of the data and acknowledge that AACP bears no responsibility for interpretations presented or conclusions reached based on analysis of the data. 58
MORNINGSIDE COLLEGE IA 1 1 NORTH IOWA AREA COMMUNITY COLLEGE IA 1 1 SAINT AMBROSE UNIVERSITY IA 1 1 SCOTT COMMUNITY COLLEGE IA 2 2 SIMPSON COLLEGE IA 1 1 SOUTHEASTERN COMMUNITY COLLEGE - WEST BURLINGTON IA 1 0 UNIVERSITY OF DUBUQUE IA 1 1 UNIVERSITY OF IOWA IA 78 75 UNIVERSITY OF NORTHERN IOWA IA 5 5 WALDORF COLLEGE IA 1 1 WARTBURG COLLEGE IA 2 2 WESTERN IOWA TECHNOLOGY COMMUNITY COLLEGE IA 1 1 BOISE STATE UNIVERSITY ID 16 16 BRIGHAM YOUNG UNIVERSITY - IDAHO ID 18 16 COLLEGE OF SOUTHERN IDAHO ID 1 1 IDAHO STATE UNIVERSITY ID 25 25 THE COLLEGE OF IDAHO ID 4 3 UNIVERSITY OF IDAHO ID 7 6 AMERICAN INTERCONTINENTAL UNIVERSITY - ONLINE (ILLINOIS) IL 1 0 AUGUSTANA COLLEGE (IL) IL 2 2 AURORA UNIVERSITY IL 3 2 BENEDICTINE UNIVERSITY - LISLE IL 18 17 BLACK HAWK COLLEGE - QUAD-CITIES IL 1 1 BRADLEY UNIVERSITY IL 5 5 CHAMBERLAIN COLLEGE OF NURSING (now Chamberlain University) IL 1 0 CHICAGO STATE UNIVERSITY IL 4 2 COLLEGE OF DUPAGE IL 18 14 COLLEGE OF LAKE COUNTY IL 6 5 DEPAUL UNIVERSITY IL 10 10 DEVRY UNIVERSITY - TINLEY PARK, IL IL 1 1 EASTERN ILLINOIS UNIVERSITY IL 2 2 ELGIN COMMUNITY COLLEGE IL 6 6 ELMHURST UNIVERSITY IL 2 1 GOVERNORS STATE UNIVERSITY IL 2 1 HAROLD WASHINGTON COLLEGE - CITY COLLEGES OF CHICAGO IL 4 3 HARRY S TRUMAN COLLEGE - CITY COLLEGES OF CHICAGO IL 11 9 ILLINOIS CENTRAL COLLEGE IL 3 2 ILLINOIS COLLEGE IL 1 1 ILLINOIS INSTITUTE OF TECHNOLOGY IL 1 1 ILLINOIS STATE UNIVERSITY IL 2 2 ILLINOIS WESLEYAN UNIVERSITY IL 1 0 JOHN WOOD COMMUNITY COLLEGE IL 2 2 JOLIET JUNIOR COLLEGE IL 4 3 KANKAKEE COMMUNITY COLLEGE IL 1 0 KISHWAUKEE COLLEGE IL 2 2 KNOX COLLEGE IL 2 2 LAKE FOREST COLLEGE IL 4 4 LAKE LAND COLLEGE IL 2 1 LEWIS AND CLARK COMMUNITY COLLEGE IL 1 1 LEWIS UNIVERSITY IL 11 10
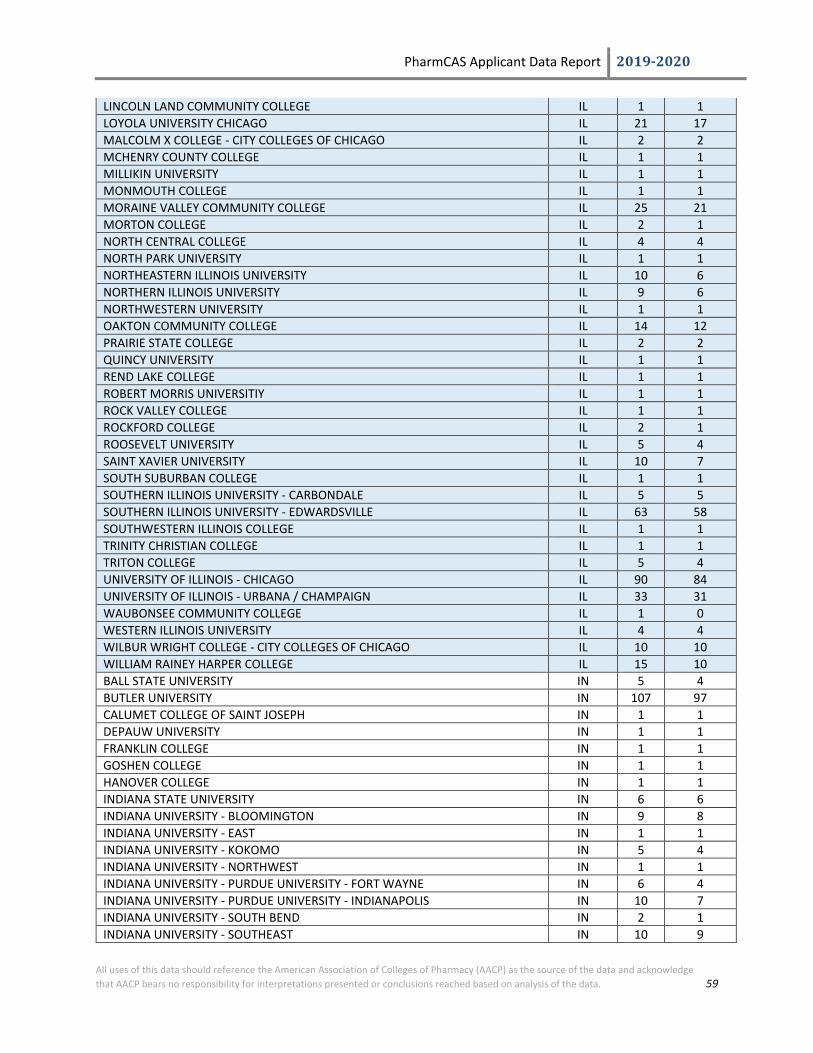
PharmCAS Applicant Data Report 2019-2020
All uses of this data should reference the American Association of Colleges of Pharmacy (AACP) as the source of the data and acknowledge that AACP bears no responsibility for interpretations presented or conclusions reached based on analysis of the data. 59
LINCOLN LAND COMMUNITY COLLEGE IL 1 1 LOYOLA UNIVERSITY CHICAGO IL 21 17 MALCOLM X COLLEGE - CITY COLLEGES OF CHICAGO IL 2 2 MCHENRY COUNTY COLLEGE IL 1 1 MILLIKIN UNIVERSITY IL 1 1 MONMOUTH COLLEGE IL 1 1 MORAINE VALLEY COMMUNITY COLLEGE IL 25 21 MORTON COLLEGE IL 2 1 NORTH CENTRAL COLLEGE IL 4 4 NORTH PARK UNIVERSITY IL 1 1 NORTHEASTERN ILLINOIS UNIVERSITY IL 10 6 NORTHERN ILLINOIS UNIVERSITY IL 9 6 NORTHWESTERN UNIVERSITY IL 1 1 OAKTON COMMUNITY COLLEGE IL 14 12 PRAIRIE STATE COLLEGE IL 2 2 QUINCY UNIVERSITY IL 1 1 REND LAKE COLLEGE IL 1 1 ROBERT MORRIS UNIVERSITIY IL 1 1 ROCK VALLEY COLLEGE IL 1 1 ROCKFORD COLLEGE IL 2 1 ROOSEVELT UNIVERSITY IL 5 4 SAINT XAVIER UNIVERSITY IL 10 7 SOUTH SUBURBAN COLLEGE IL 1 1 SOUTHERN ILLINOIS UNIVERSITY - CARBONDALE IL 5 5 SOUTHERN ILLINOIS UNIVERSITY - EDWARDSVILLE IL 63 58 SOUTHWESTERN ILLINOIS COLLEGE IL 1 1 TRINITY CHRISTIAN COLLEGE IL 1 1 TRITON COLLEGE IL 5 4 UNIVERSITY OF ILLINOIS - CHICAGO IL 90 84 UNIVERSITY OF ILLINOIS - URBANA / CHAMPAIGN IL 33 31 WAUBONSEE COMMUNITY COLLEGE IL 1 0 WESTERN ILLINOIS UNIVERSITY IL 4 4 WILBUR WRIGHT COLLEGE - CITY COLLEGES OF CHICAGO IL 10 10 WILLIAM RAINEY HARPER COLLEGE IL 15 10 BALL STATE UNIVERSITY IN 5 4 BUTLER UNIVERSITY IN 107 97 CALUMET COLLEGE OF SAINT JOSEPH IN 1 1 DEPAUW UNIVERSITY IN 1 1 FRANKLIN COLLEGE IN 1 1 GOSHEN COLLEGE IN 1 1 HANOVER COLLEGE IN 1 1 INDIANA STATE UNIVERSITY IN 6 6 INDIANA UNIVERSITY - BLOOMINGTON IN 9 8 INDIANA UNIVERSITY - EAST IN 1 1 INDIANA UNIVERSITY - KOKOMO IN 5 4 INDIANA UNIVERSITY - NORTHWEST IN 1 1 INDIANA UNIVERSITY - PURDUE UNIVERSITY - FORT WAYNE IN 6 4 INDIANA UNIVERSITY - PURDUE UNIVERSITY - INDIANAPOLIS IN 10 7 INDIANA UNIVERSITY - SOUTH BEND IN 2 1 INDIANA UNIVERSITY - SOUTHEAST IN 10 9
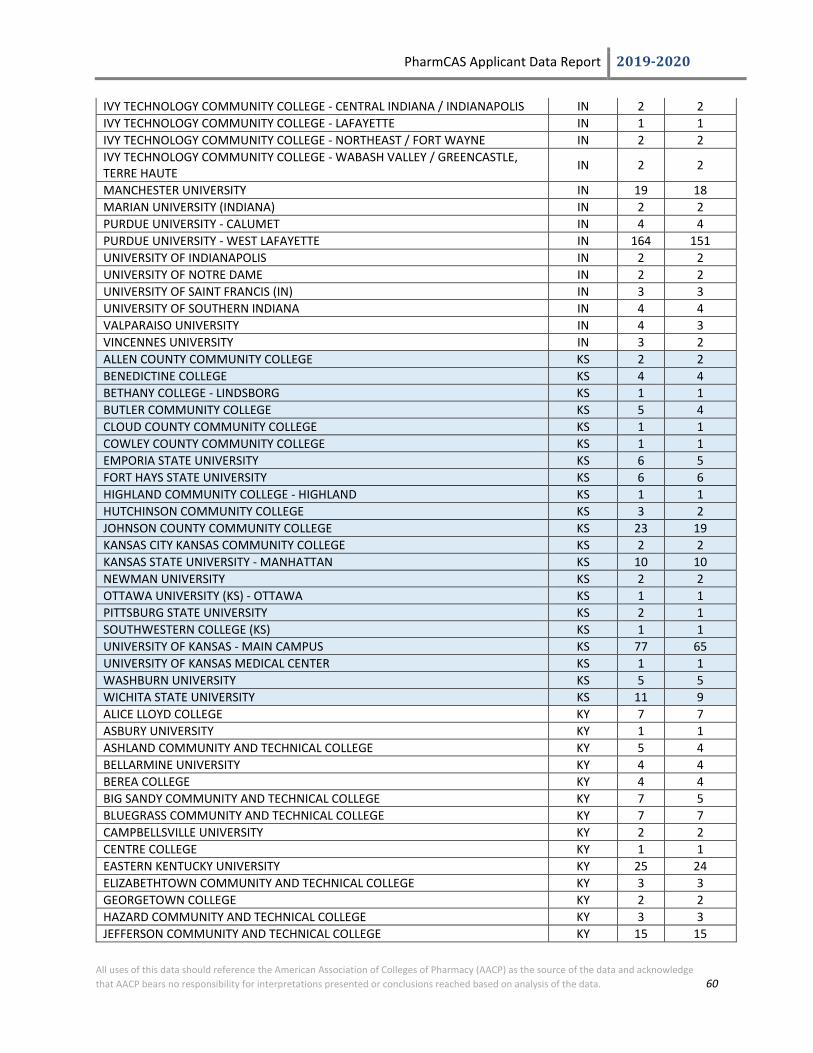
PharmCAS Applicant Data Report 2019-2020
All uses of this data should reference the American Association of Colleges of Pharmacy (AACP) as the source of the data and acknowledge that AACP bears no responsibility for interpretations presented or conclusions reached based on analysis of the data. 60
IVY TECHNOLOGY COMMUNITY COLLEGE - CENTRAL INDIANA / INDIANAPOLIS IN 2 2 IVY TECHNOLOGY COMMUNITY COLLEGE - LAFAYETTE IN 1 1 IVY TECHNOLOGY COMMUNITY COLLEGE - NORTHEAST / FORT WAYNE IN 2 2 IVY TECHNOLOGY COMMUNITY COLLEGE - WABASH VALLEY / GREENCASTLE, TERRE HAUTE IN 2 2
MANCHESTER UNIVERSITY IN 19 18 MARIAN UNIVERSITY (INDIANA) IN 2 2 PURDUE UNIVERSITY - CALUMET IN 4 4 PURDUE UNIVERSITY - WEST LAFAYETTE IN 164 151 UNIVERSITY OF INDIANAPOLIS IN 2 2 UNIVERSITY OF NOTRE DAME IN 2 2 UNIVERSITY OF SAINT FRANCIS (IN) IN 3 3 UNIVERSITY OF SOUTHERN INDIANA IN 4 4 VALPARAISO UNIVERSITY IN 4 3 VINCENNES UNIVERSITY IN 3 2 ALLEN COUNTY COMMUNITY COLLEGE KS 2 2 BENEDICTINE COLLEGE KS 4 4 BETHANY COLLEGE - LINDSBORG KS 1 1 BUTLER COMMUNITY COLLEGE KS 5 4 CLOUD COUNTY COMMUNITY COLLEGE KS 1 1 COWLEY COUNTY COMMUNITY COLLEGE KS 1 1 EMPORIA STATE UNIVERSITY KS 6 5 FORT HAYS STATE UNIVERSITY KS 6 6 HIGHLAND COMMUNITY COLLEGE - HIGHLAND KS 1 1 HUTCHINSON COMMUNITY COLLEGE KS 3 2 JOHNSON COUNTY COMMUNITY COLLEGE KS 23 19 KANSAS CITY KANSAS COMMUNITY COLLEGE KS 2 2 KANSAS STATE UNIVERSITY - MANHATTAN KS 10 10 NEWMAN UNIVERSITY KS 2 2 OTTAWA UNIVERSITY (KS) - OTTAWA KS 1 1 PITTSBURG STATE UNIVERSITY KS 2 1 SOUTHWESTERN COLLEGE (KS) KS 1 1 UNIVERSITY OF KANSAS - MAIN CAMPUS KS 77 65 UNIVERSITY OF KANSAS MEDICAL CENTER KS 1 1 WASHBURN UNIVERSITY KS 5 5 WICHITA STATE UNIVERSITY KS 11 9 ALICE LLOYD COLLEGE KY 7 7 ASBURY UNIVERSITY KY 1 1 ASHLAND COMMUNITY AND TECHNICAL COLLEGE KY 5 4 BELLARMINE UNIVERSITY KY 4 4 BEREA COLLEGE KY 4 4 BIG SANDY COMMUNITY AND TECHNICAL COLLEGE KY 7 5 BLUEGRASS COMMUNITY AND TECHNICAL COLLEGE KY 7 7 CAMPBELLSVILLE UNIVERSITY KY 2 2 CENTRE COLLEGE KY 1 1 EASTERN KENTUCKY UNIVERSITY KY 25 24 ELIZABETHTOWN COMMUNITY AND TECHNICAL COLLEGE KY 3 3 GEORGETOWN COLLEGE KY 2 2 HAZARD COMMUNITY AND TECHNICAL COLLEGE KY 3 3 JEFFERSON COMMUNITY AND TECHNICAL COLLEGE KY 15 15

PharmCAS Applicant Data Report 2019-2020
All uses of this data should reference the American Association of Colleges of Pharmacy (AACP) as the source of the data and acknowledge that AACP bears no responsibility for interpretations presented or conclusions reached based on analysis of the data. 61
KENTUCKY STATE UNIVERSITY KY 2 2 KENTUCKY WESLEYAN COLLEGE KY 1 1 LINDSEY WILSON COLLEGE KY 1 1 MADISONVILLE COMMUNITY COLLEGE KY 1 1 MIDWAY COLLEGE KY 1 1 MOREHEAD STATE UNIVERSITY KY 22 22 MURRAY STATE UNIVERSITY KY 6 5 NORTHERN KENTUCKY UNIVERSITY KY 12 12 SOMERSET COMMUNITY COLLEGE KY 2 2 SPALDING UNIVERSITY KY 3 3 THOMAS MORE COLLEGE KY 1 1 TRANSYLVANIA UNIVERSITY KY 2 2 UNION COLLEGE (KY) KY 1 1 UNIVERSITY OF KENTUCKY KY 82 77 UNIVERSITY OF LOUISVILLE KY 17 16 UNIVERSITY OF PIKEVILLE KY 5 5 UNIVERSITY OF THE CUMBERLANDS KY 6 6 WESTERN KENTUCKY UNIVERSITY KY 18 16 BATON ROUGE COMMUNITY COLLEGE LA 2 1 DELGADO COMMUNITY COLLEGE LA 1 0 DILLARD UNIVERSITY LA 8 7 GRAMBLING STATE UNIVERSITY LA 1 0 LOUISIANA COLLEGE LA 2 1 LOUISIANA STATE UNIVERSITY - A & M COLLEGE - BATON ROUGE LA 34 32 LOUISIANA STATE UNIVERSITY - ALEXANDRIA LA 2 2 LOUISIANA STATE UNIVERSITY - BATON ROUGE LA 6 6 LOUISIANA STATE UNIVERSITY - SHREVEPORT LA 3 2 LOUISIANA TECH UNIVERSITY LA 13 13 LOYOLA UNIVERSITY NEW ORLEANS LA 3 2 MCNEESE STATE UNIVERSITY LA 3 3 NICHOLLS STATE UNIVERSITY LA 2 1 NORTHWESTERN STATE UNIVERSITY LA 1 1 SOUTHEASTERN LOUISIANA UNIVERSITY LA 10 9 SOUTHERN UNIVERSITY - NEW ORLEANS LA 5 3 SOUTHERN UNIVERSITY - SHREVEPORT LA 1 1 SOUTHERN UNIVERSITY AND A&M COLLEGE LA 3 0 TULANE UNIVERSITY LA 1 1 UNIVERSITY OF HOLY CROSS LA 1 1 UNIVERSITY OF LOUISIANA - LAFAYETTE LA 12 9 UNIVERSITY OF LOUISIANA - MONROE LA 74 68 UNIVERSITY OF NEW ORLEANS LA 12 11 XAVIER UNIVERSITY OF LOUISIANA LA 102 88 AMHERST COLLEGE MA 1 1 ASSUMPTION COLLEGE MA 2 2 BOSTON COLLEGE MA 1 1 BOSTON UNIVERSITY MA 3 3 BOSTON UNIVERSITY - SARGENT COLLEGE MA 1 1 BRANDEIS UNIVERSITY MA 4 4 BRIDGEWATER STATE UNIVERSITY MA 2 1 BUNKER HILL COMMUNITY COLLEGE MA 3 2

PharmCAS Applicant Data Report 2019-2020
All uses of this data should reference the American Association of Colleges of Pharmacy (AACP) as the source of the data and acknowledge that AACP bears no responsibility for interpretations presented or conclusions reached based on analysis of the data. 62
CLARK UNIVERSITY MA 1 1 COLLEGE OF THE HOLY CROSS MA 2 2 ELMS COLLEGE MA 1 1 EMMANUEL COLLEGE (MA) MA 1 1 ENDICOTT COLLEGE MA 1 1 FRAMINGHAM STATE UNIVERSITY MA 1 1 GORDON COLLEGE MA 1 1 HAMPSHIRE COLLEGE MA 1 1 HARVARD UNIVERSITY EXTENSION MA 1 1 HOLYOKE COMMUNITY COLLEGE MA 1 1 MASSACHUSETTS BAY COMMUNITY COLLEGE MA 2 1 MASSACHUSETTS COLLEGE OF LIBERAL ARTS MA 1 1 MASSACHUSETTS COLLEGE OF PHARMACY AND HEALTH SCIENCE MA 54 40 MERRIMACK COLLEGE MA 2 2 MIDDLESEX COMMUNITY COLLEGE - BEDFORD MA 1 1 MIDDLESEX COMMUNITY COLLEGE - LOWELL MA 4 3 MOUNT HOLYOKE COLLEGE MA 1 1 MOUNT WACHUSETT COMMUNITY COLLEGE MA 2 1 NEW ENGLAND CONSERVATORY OF MUSIC MA 1 1 NORTH SHORE COMMUNITY COLLEGE MA 2 2 NORTHEASTERN UNIVERSITY MA 5 3 QUINCY COLLEGE MA 1 0 QUINSIGAMOND COMMUNITY COLLEGE MA 16 11 REGIS COLLEGE MA 2 1 ROXBURY COMMUNITY COLLEGE MA 1 0 SALEM STATE COLLEGE MA 4 4 SMITH COLLEGE MA 2 1 SPRINGFIELD COLLEGE MA 2 2 SPRINGFIELD TECHNICAL COMMUNITY COLLEGE MA 2 1 SUFFOLK UNIVERSITY MA 2 2 UNIVERSITY OF MASSACHUSETTS - AMHERST MA 14 12 UNIVERSITY OF MASSACHUSETTS - BOSTON MA 7 5 UNIVERSITY OF MASSACHUSETTS - DARTMOUTH MA 1 1 UNIVERSITY OF MASSACHUSETTS - LOWELL MA 6 4 WELLESLEY COLLEGE MA 1 1 WESTERN NEW ENGLAND UNIVERSITY MA 37 37 WESTFIELD STATE COLLEGE MA 1 1 WHEATON COLLEGE (MA) MA 2 2 WORCESTER POLYTECHNIC INSTITUTE MA 2 2 WORCESTER STATE UNIVERSITY MA 7 6 ALLEGANY COLLEGE OF MARYLAND MD 1 1 ANNE ARUNDEL COMMUNITY COLLEGE MD 4 4 BALTIMORE CITY COMMUNITY COLLEGE MD 8 6 BOWIE STATE UNIVERSITY MD 4 3 COLLEGE OF SOUTHERN MARYLAND MD 4 4 COMMUNITY COLLEGE OF BALTIMORE COUNTY MD 10 6 COPPIN STATE UNIVERSITY MD 2 2 FROSTBURG STATE UNIVERSITY MD 3 3 GOUCHER COLLEGE MD 1 1 HAGERSTOWN BUSINESS COLLEGE (Kaplan C) (now Purdue University Global) MD 2 2

PharmCAS Applicant Data Report 2019-2020
All uses of this data should reference the American Association of Colleges of Pharmacy (AACP) as the source of the data and acknowledge that AACP bears no responsibility for interpretations presented or conclusions reached based on analysis of the data. 63
HAGERSTOWN COMMUNITY COLLEGE MD 3 3 HARFORD COMMUNITY COLLEGE MD 3 2 HOOD COLLEGE MD 1 1 HOWARD COMMUNITY COLLEGE MD 15 13 JOHNS HOPKINS UNIVERSITY MD 2 2 LOYOLA UNIVERSITY MARYLAND MD 3 3 MCDANIEL COLLEGE (MARYLAND) MD 3 2 MONTGOMERY COLLEGE - GERMANTOWN MD 1 1 MONTGOMERY COLLEGE - ROCKVILLE MD 12 8 MONTGOMERY COLLEGE - TAKOMA PARK / SILVER SPRINGS MD 13 10 MORGAN STATE UNIVERSITY MD 4 3 NOTRE DAME OF MARYLAND UNIVERSITY MD 2 2 PRINCE GEORGE'S COMMUNITY COLLEGE MD 20 17 SALISBURY UNIVERSITY MD 8 7 STEVENSON UNIVERSITY MD 2 2 STRAYER UNIVERSITY (MD) MD 1 0 TOWSON UNIVERSITY MD 14 11 UNITED STATES NAVAL ACADEMY MD 1 1 UNIVERSITY OF MARYLAND - BALTIMORE COUNTY MD 33 31 UNIVERSITY OF MARYLAND - COLLEGE PARK MD 29 28 UNIVERSITY OF MARYLAND - EASTERN SHORE MD 20 17 UNIVERSITY OF MARYLAND - UNIVERSITY COLLEGE MD 3 2 WASHINGTON ADVENTIST UNIVERSITY MD 2 1 WASHINGTON COLLEGE MD 2 2 BATES COLLEGE ME 2 1 HUSSON UNIVERSITY ME 6 6 KENNEBEC VALLEY COMMUNITY COLLEGE ME 1 1 SAINT JOSEPH'S COLLEGE OF MAINE ME 1 1 UNIVERSITY OF MAINE - AUGUSTA ME 1 1 UNIVERSITY OF MAINE - ORONO ME 3 2 UNIVERSITY OF NEW ENGLAND ME 35 29 YORK COUNTY COMMUNITY COLLEGE ME 1 1 ALBION COLLEGE MI 1 1 ALMA COLLEGE MI 3 3 ALPENA COMMUNITY COLLEGE MI 1 1 ANDREWS UNIVERSITY MI 1 1 CALVIN COLLEGE MI 2 1 CENTRAL MICHIGAN UNIVERSITY MI 12 10 CONCORDIA UNIVERSITY - ANN ARBOR MI 1 1 CORNERSTONE UNIVERSITY MI 1 1 DAVENPORT UNIVERSITY - CENTRAL REGION MI 1 1 DELTA COLLEGE MI 5 5 EASTERN MICHIGAN UNIVERSITY MI 12 9 FERRIS STATE UNIVERSITY MI 59 54 GRAND RAPIDS COMMUNITY COLLEGE MI 6 5 GRAND VALLEY STATE UNIVERSITY MI 10 9 HENRY FORD COMMUNITY COLLEGE MI 38 32 HILLSDALE COLLEGE MI 2 2 HOPE COLLEGE MI 1 1 KALAMAZOO COLLEGE MI 1 0
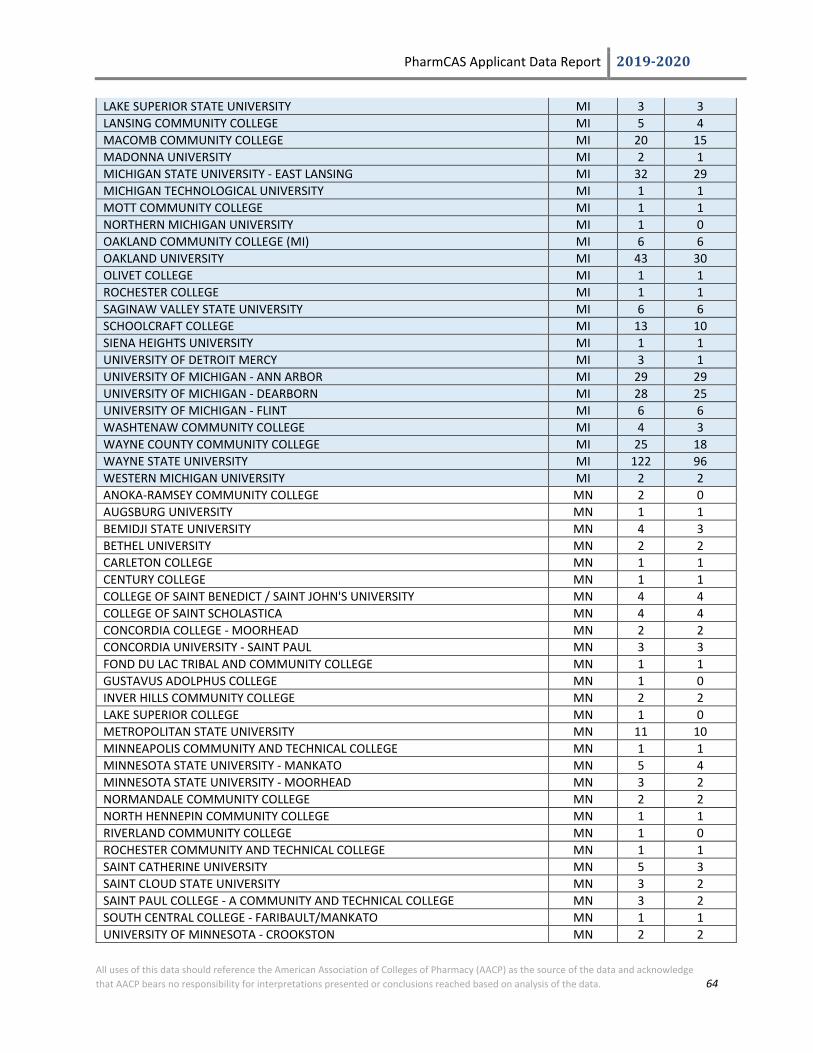
PharmCAS Applicant Data Report 2019-2020
All uses of this data should reference the American Association of Colleges of Pharmacy (AACP) as the source of the data and acknowledge that AACP bears no responsibility for interpretations presented or conclusions reached based on analysis of the data. 64
LAKE SUPERIOR STATE UNIVERSITY MI 3 3 LANSING COMMUNITY COLLEGE MI 5 4 MACOMB COMMUNITY COLLEGE MI 20 15 MADONNA UNIVERSITY MI 2 1 MICHIGAN STATE UNIVERSITY - EAST LANSING MI 32 29 MICHIGAN TECHNOLOGICAL UNIVERSITY MI 1 1 MOTT COMMUNITY COLLEGE MI 1 1 NORTHERN MICHIGAN UNIVERSITY MI 1 0 OAKLAND COMMUNITY COLLEGE (MI) MI 6 6 OAKLAND UNIVERSITY MI 43 30 OLIVET COLLEGE MI 1 1 ROCHESTER COLLEGE MI 1 1 SAGINAW VALLEY STATE UNIVERSITY MI 6 6 SCHOOLCRAFT COLLEGE MI 13 10 SIENA HEIGHTS UNIVERSITY MI 1 1 UNIVERSITY OF DETROIT MERCY MI 3 1 UNIVERSITY OF MICHIGAN - ANN ARBOR MI 29 29 UNIVERSITY OF MICHIGAN - DEARBORN MI 28 25 UNIVERSITY OF MICHIGAN - FLINT MI 6 6 WASHTENAW COMMUNITY COLLEGE MI 4 3 WAYNE COUNTY COMMUNITY COLLEGE MI 25 18 WAYNE STATE UNIVERSITY MI 122 96 WESTERN MICHIGAN UNIVERSITY MI 2 2 ANOKA-RAMSEY COMMUNITY COLLEGE MN 2 0 AUGSBURG UNIVERSITY MN 1 1 BEMIDJI STATE UNIVERSITY MN 4 3 BETHEL UNIVERSITY MN 2 2 CARLETON COLLEGE MN 1 1 CENTURY COLLEGE MN 1 1 COLLEGE OF SAINT BENEDICT / SAINT JOHN'S UNIVERSITY MN 4 4 COLLEGE OF SAINT SCHOLASTICA MN 4 4 CONCORDIA COLLEGE - MOORHEAD MN 2 2 CONCORDIA UNIVERSITY - SAINT PAUL MN 3 3 FOND DU LAC TRIBAL AND COMMUNITY COLLEGE MN 1 1 GUSTAVUS ADOLPHUS COLLEGE MN 1 0 INVER HILLS COMMUNITY COLLEGE MN 2 2 LAKE SUPERIOR COLLEGE MN 1 0 METROPOLITAN STATE UNIVERSITY MN 11 10 MINNEAPOLIS COMMUNITY AND TECHNICAL COLLEGE MN 1 1 MINNESOTA STATE UNIVERSITY - MANKATO MN 5 4 MINNESOTA STATE UNIVERSITY - MOORHEAD MN 3 2 NORMANDALE COMMUNITY COLLEGE MN 2 2 NORTH HENNEPIN COMMUNITY COLLEGE MN 1 1 RIVERLAND COMMUNITY COLLEGE MN 1 0 ROCHESTER COMMUNITY AND TECHNICAL COLLEGE MN 1 1 SAINT CATHERINE UNIVERSITY MN 5 3 SAINT CLOUD STATE UNIVERSITY MN 3 2 SAINT PAUL COLLEGE - A COMMUNITY AND TECHNICAL COLLEGE MN 3 2 SOUTH CENTRAL COLLEGE - FARIBAULT/MANKATO MN 1 1 UNIVERSITY OF MINNESOTA - CROOKSTON MN 2 2
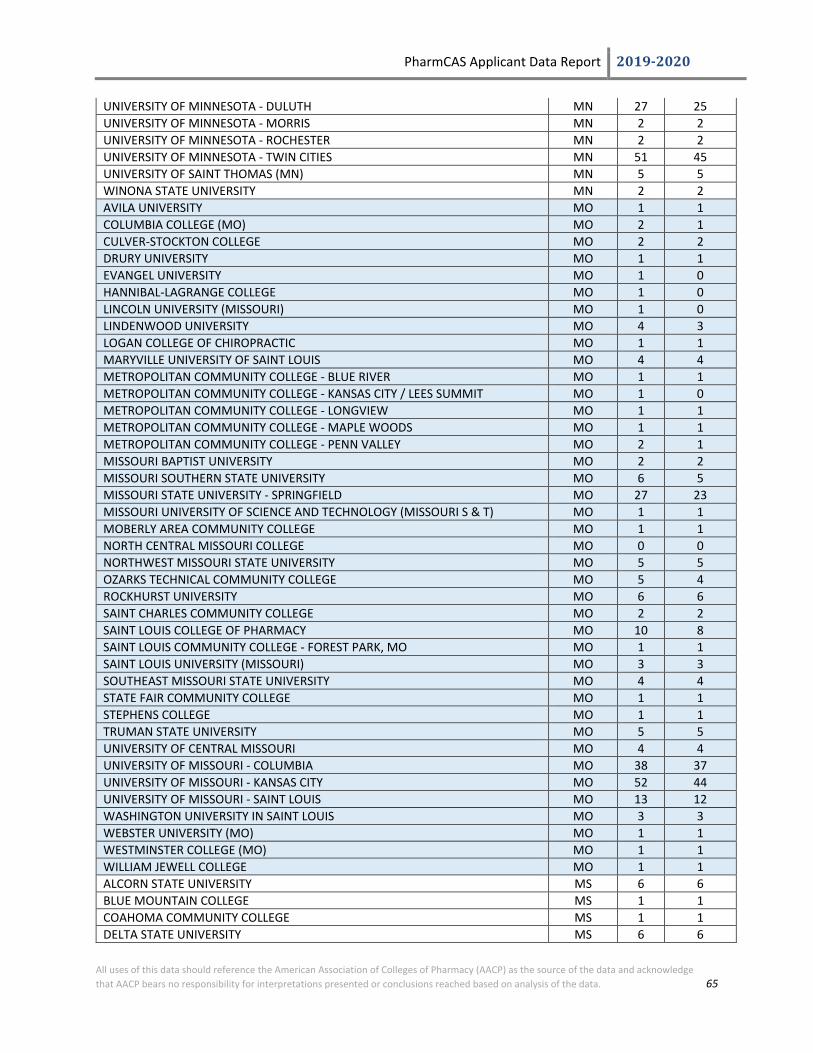
PharmCAS Applicant Data Report 2019-2020
All uses of this data should reference the American Association of Colleges of Pharmacy (AACP) as the source of the data and acknowledge that AACP bears no responsibility for interpretations presented or conclusions reached based on analysis of the data. 65
UNIVERSITY OF MINNESOTA - DULUTH MN 27 25 UNIVERSITY OF MINNESOTA - MORRIS MN 2 2 UNIVERSITY OF MINNESOTA - ROCHESTER MN 2 2 UNIVERSITY OF MINNESOTA - TWIN CITIES MN 51 45 UNIVERSITY OF SAINT THOMAS (MN) MN 5 5 WINONA STATE UNIVERSITY MN 2 2 AVILA UNIVERSITY MO 1 1 COLUMBIA COLLEGE (MO) MO 2 1 CULVER-STOCKTON COLLEGE MO 2 2 DRURY UNIVERSITY MO 1 1 EVANGEL UNIVERSITY MO 1 0 HANNIBAL-LAGRANGE COLLEGE MO 1 0 LINCOLN UNIVERSITY (MISSOURI) MO 1 0 LINDENWOOD UNIVERSITY MO 4 3 LOGAN COLLEGE OF CHIROPRACTIC MO 1 1 MARYVILLE UNIVERSITY OF SAINT LOUIS MO 4 4 METROPOLITAN COMMUNITY COLLEGE - BLUE RIVER MO 1 1 METROPOLITAN COMMUNITY COLLEGE - KANSAS CITY / LEES SUMMIT MO 1 0 METROPOLITAN COMMUNITY COLLEGE - LONGVIEW MO 1 1 METROPOLITAN COMMUNITY COLLEGE - MAPLE WOODS MO 1 1 METROPOLITAN COMMUNITY COLLEGE - PENN VALLEY MO 2 1 MISSOURI BAPTIST UNIVERSITY MO 2 2 MISSOURI SOUTHERN STATE UNIVERSITY MO 6 5 MISSOURI STATE UNIVERSITY - SPRINGFIELD MO 27 23 MISSOURI UNIVERSITY OF SCIENCE AND TECHNOLOGY (MISSOURI S & T) MO 1 1 MOBERLY AREA COMMUNITY COLLEGE MO 1 1 NORTH CENTRAL MISSOURI COLLEGE MO 0 0 NORTHWEST MISSOURI STATE UNIVERSITY MO 5 5 OZARKS TECHNICAL COMMUNITY COLLEGE MO 5 4 ROCKHURST UNIVERSITY MO 6 6 SAINT CHARLES COMMUNITY COLLEGE MO 2 2 SAINT LOUIS COLLEGE OF PHARMACY MO 10 8 SAINT LOUIS COMMUNITY COLLEGE - FOREST PARK, MO MO 1 1 SAINT LOUIS UNIVERSITY (MISSOURI) MO 3 3 SOUTHEAST MISSOURI STATE UNIVERSITY MO 4 4 STATE FAIR COMMUNITY COLLEGE MO 1 1 STEPHENS COLLEGE MO 1 1 TRUMAN STATE UNIVERSITY MO 5 5 UNIVERSITY OF CENTRAL MISSOURI MO 4 4 UNIVERSITY OF MISSOURI - COLUMBIA MO 38 37 UNIVERSITY OF MISSOURI - KANSAS CITY MO 52 44 UNIVERSITY OF MISSOURI - SAINT LOUIS MO 13 12 WASHINGTON UNIVERSITY IN SAINT LOUIS MO 3 3 WEBSTER UNIVERSITY (MO) MO 1 1 WESTMINSTER COLLEGE (MO) MO 1 1 WILLIAM JEWELL COLLEGE MO 1 1 ALCORN STATE UNIVERSITY MS 6 6 BLUE MOUNTAIN COLLEGE MS 1 1 COAHOMA COMMUNITY COLLEGE MS 1 1 DELTA STATE UNIVERSITY MS 6 6
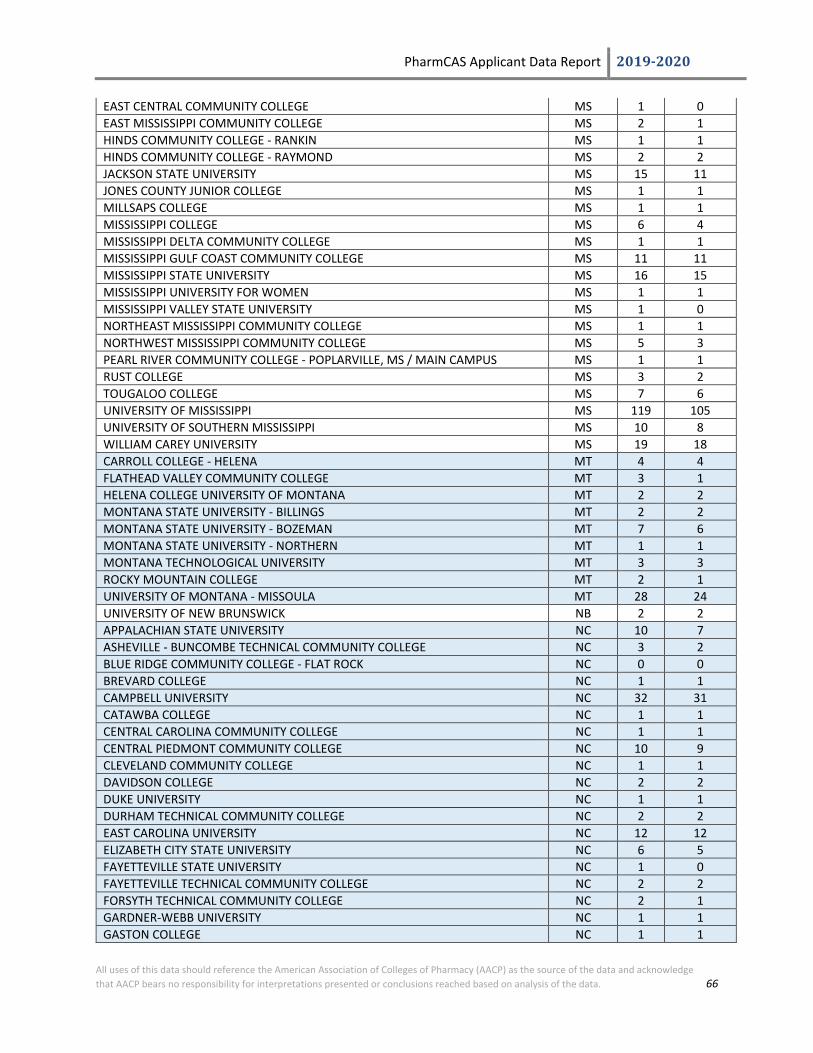
PharmCAS Applicant Data Report 2019-2020
All uses of this data should reference the American Association of Colleges of Pharmacy (AACP) as the source of the data and acknowledge that AACP bears no responsibility for interpretations presented or conclusions reached based on analysis of the data. 66
EAST CENTRAL COMMUNITY COLLEGE MS 1 0 EAST MISSISSIPPI COMMUNITY COLLEGE MS 2 1 HINDS COMMUNITY COLLEGE - RANKIN MS 1 1 HINDS COMMUNITY COLLEGE - RAYMOND MS 2 2 JACKSON STATE UNIVERSITY MS 15 11 JONES COUNTY JUNIOR COLLEGE MS 1 1 MILLSAPS COLLEGE MS 1 1 MISSISSIPPI COLLEGE MS 6 4 MISSISSIPPI DELTA COMMUNITY COLLEGE MS 1 1 MISSISSIPPI GULF COAST COMMUNITY COLLEGE MS 11 11 MISSISSIPPI STATE UNIVERSITY MS 16 15 MISSISSIPPI UNIVERSITY FOR WOMEN MS 1 1 MISSISSIPPI VALLEY STATE UNIVERSITY MS 1 0 NORTHEAST MISSISSIPPI COMMUNITY COLLEGE MS 1 1 NORTHWEST MISSISSIPPI COMMUNITY COLLEGE MS 5 3 PEARL RIVER COMMUNITY COLLEGE - POPLARVILLE, MS / MAIN CAMPUS MS 1 1 RUST COLLEGE MS 3 2 TOUGALOO COLLEGE MS 7 6 UNIVERSITY OF MISSISSIPPI MS 119 105 UNIVERSITY OF SOUTHERN MISSISSIPPI MS 10 8 WILLIAM CAREY UNIVERSITY MS 19 18 CARROLL COLLEGE - HELENA MT 4 4 FLATHEAD VALLEY COMMUNITY COLLEGE MT 3 1 HELENA COLLEGE UNIVERSITY OF MONTANA MT 2 2 MONTANA STATE UNIVERSITY - BILLINGS MT 2 2 MONTANA STATE UNIVERSITY - BOZEMAN MT 7 6 MONTANA STATE UNIVERSITY - NORTHERN MT 1 1 MONTANA TECHNOLOGICAL UNIVERSITY MT 3 3 ROCKY MOUNTAIN COLLEGE MT 2 1 UNIVERSITY OF MONTANA - MISSOULA MT 28 24 UNIVERSITY OF NEW BRUNSWICK NB 2 2 APPALACHIAN STATE UNIVERSITY NC 10 7 ASHEVILLE - BUNCOMBE TECHNICAL COMMUNITY COLLEGE NC 3 2 BLUE RIDGE COMMUNITY COLLEGE - FLAT ROCK NC 0 0 BREVARD COLLEGE NC 1 1 CAMPBELL UNIVERSITY NC 32 31 CATAWBA COLLEGE NC 1 1 CENTRAL CAROLINA COMMUNITY COLLEGE NC 1 1 CENTRAL PIEDMONT COMMUNITY COLLEGE NC 10 9 CLEVELAND COMMUNITY COLLEGE NC 1 1 DAVIDSON COLLEGE NC 2 2 DUKE UNIVERSITY NC 1 1 DURHAM TECHNICAL COMMUNITY COLLEGE NC 2 2 EAST CAROLINA UNIVERSITY NC 12 12 ELIZABETH CITY STATE UNIVERSITY NC 6 5 FAYETTEVILLE STATE UNIVERSITY NC 1 0 FAYETTEVILLE TECHNICAL COMMUNITY COLLEGE NC 2 2 FORSYTH TECHNICAL COMMUNITY COLLEGE NC 2 1 GARDNER-WEBB UNIVERSITY NC 1 1 GASTON COLLEGE NC 1 1
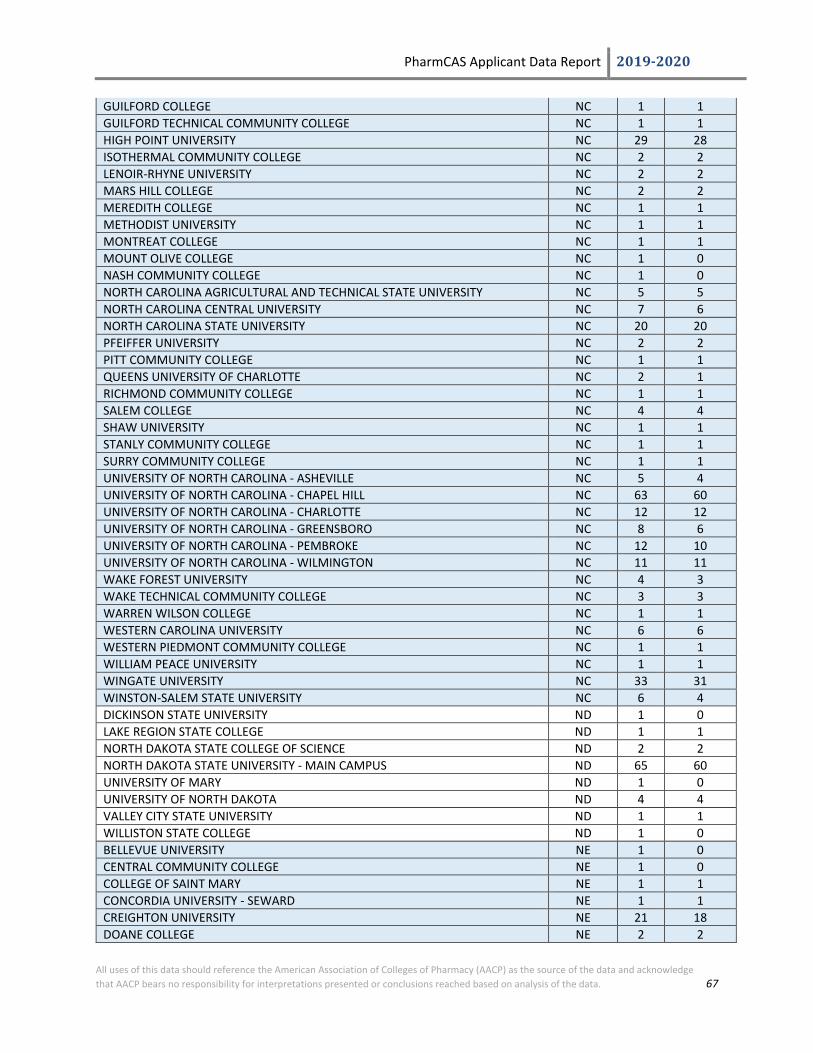
PharmCAS Applicant Data Report 2019-2020
All uses of this data should reference the American Association of Colleges of Pharmacy (AACP) as the source of the data and acknowledge that AACP bears no responsibility for interpretations presented or conclusions reached based on analysis of the data. 67
GUILFORD COLLEGE NC 1 1 GUILFORD TECHNICAL COMMUNITY COLLEGE NC 1 1 HIGH POINT UNIVERSITY NC 29 28 ISOTHERMAL COMMUNITY COLLEGE NC 2 2 LENOIR-RHYNE UNIVERSITY NC 2 2 MARS HILL COLLEGE NC 2 2 MEREDITH COLLEGE NC 1 1 METHODIST UNIVERSITY NC 1 1 MONTREAT COLLEGE NC 1 1 MOUNT OLIVE COLLEGE NC 1 0 NASH COMMUNITY COLLEGE NC 1 0 NORTH CAROLINA AGRICULTURAL AND TECHNICAL STATE UNIVERSITY NC 5 5 NORTH CAROLINA CENTRAL UNIVERSITY NC 7 6 NORTH CAROLINA STATE UNIVERSITY NC 20 20 PFEIFFER UNIVERSITY NC 2 2 PITT COMMUNITY COLLEGE NC 1 1 QUEENS UNIVERSITY OF CHARLOTTE NC 2 1 RICHMOND COMMUNITY COLLEGE NC 1 1 SALEM COLLEGE NC 4 4 SHAW UNIVERSITY NC 1 1 STANLY COMMUNITY COLLEGE NC 1 1 SURRY COMMUNITY COLLEGE NC 1 1 UNIVERSITY OF NORTH CAROLINA - ASHEVILLE NC 5 4 UNIVERSITY OF NORTH CAROLINA - CHAPEL HILL NC 63 60 UNIVERSITY OF NORTH CAROLINA - CHARLOTTE NC 12 12 UNIVERSITY OF NORTH CAROLINA - GREENSBORO NC 8 6 UNIVERSITY OF NORTH CAROLINA - PEMBROKE NC 12 10 UNIVERSITY OF NORTH CAROLINA - WILMINGTON NC 11 11 WAKE FOREST UNIVERSITY NC 4 3 WAKE TECHNICAL COMMUNITY COLLEGE NC 3 3 WARREN WILSON COLLEGE NC 1 1 WESTERN CAROLINA UNIVERSITY NC 6 6 WESTERN PIEDMONT COMMUNITY COLLEGE NC 1 1 WILLIAM PEACE UNIVERSITY NC 1 1 WINGATE UNIVERSITY NC 33 31 WINSTON-SALEM STATE UNIVERSITY NC 6 4 DICKINSON STATE UNIVERSITY ND 1 0 LAKE REGION STATE COLLEGE ND 1 1 NORTH DAKOTA STATE COLLEGE OF SCIENCE ND 2 2 NORTH DAKOTA STATE UNIVERSITY - MAIN CAMPUS ND 65 60 UNIVERSITY OF MARY ND 1 0 UNIVERSITY OF NORTH DAKOTA ND 4 4 VALLEY CITY STATE UNIVERSITY ND 1 1 WILLISTON STATE COLLEGE ND 1 0 BELLEVUE UNIVERSITY NE 1 0 CENTRAL COMMUNITY COLLEGE NE 1 0 COLLEGE OF SAINT MARY NE 1 1 CONCORDIA UNIVERSITY - SEWARD NE 1 1 CREIGHTON UNIVERSITY NE 21 18 DOANE COLLEGE NE 2 2

PharmCAS Applicant Data Report 2019-2020
All uses of this data should reference the American Association of Colleges of Pharmacy (AACP) as the source of the data and acknowledge that AACP bears no responsibility for interpretations presented or conclusions reached based on analysis of the data. 68
HASTINGS COLLEGE NE 2 2 METROPOLITAN COMMUNITY COLLEGE (NEBRASKA) NE 1 1 MIDLAND LUTHERAN COLLEGE NE 1 1 NEBRASKA WESLEYAN UNIVERSITY NE 6 6 NORTHEAST COMMUNITY COLLEGE NE 2 1 PERU STATE COLLEGE NE 4 4 SOUTHEAST COMMUNITY COLLEGE - LINCOLN NE 1 1 UNION COLLEGE (NE) NE 1 1 UNIVERSITY OF NEBRASKA - KEARNEY NE 9 9 UNIVERSITY OF NEBRASKA - LINCOLN NE 24 21 UNIVERSITY OF NEBRASKA - OMAHA NE 16 13 WAYNE STATE COLLEGE NE 11 11 DARTMOUTH COLLEGE NH 1 1 FRANKLIN PIERCE UNIVERSITY - RINDGE, NH (MAIN CAMPUS) NH 3 3 MANCHESTER COMMUNITY COLLEGE (NEW HAMPSHIRE) NH 1 1 NEW ENGLAND COLLEGE NH 1 1 NHTI-CONCORD COMMUNITY COLLEGE NH 2 1 PLYMOUTH STATE UNIVERSITY NH 1 1 SAINT ANSELM COLLEGE NH 2 2 SOUTHERN NEW HAMPSHIRE UNIVERSITY NH 1 1 UNIVERSITY OF NEW HAMPSHIRE - DURHAM NH 6 6 UNIVERSITY OF NEW HAMPSHIRE - MANCHESTER NH 3 3 ATLANTIC CAPE COMMUNITY COLLEGE NJ 1 1 BERGEN COMMUNITY COLLEGE NJ 3 2 BROOKDALE COMMUNITY COLLEGE NJ 3 3 CAMDEN COUNTY COLLEGE NJ 12 8 COLLEGE OF NEW JERSEY NJ 1 1 COLLEGE OF SAINT ELIZABETH NJ 1 1 COUNTY COLLEGE OF MORRIS NJ 2 1 CUMBERLAND COUNTY COLLEGE NJ 1 1 DREW UNIVERSITY NJ 2 2 EASTWICK COLLEGE NJ 1 0 ESSEX COUNTY COLLEGE NJ 6 5 FAIRLEIGH DICKINSON UNIVERSITY - COLLEGE AT FLORHAM NJ 13 13 FAIRLEIGH DICKINSON UNIVERSITY - METROPOLITAN CAMPUS NJ 14 13 FELICIAN COLLEGE (NEW JERSEY) (now Felician University) NJ 2 1 HUDSON COUNTY COMMUNITY COLLEGE NJ 4 4 KEAN UNIVERSITY NJ 10 9 MIDDLESEX COUNTY COLLEGE NJ 13 8 MONMOUTH UNIVERSITY NJ 1 1 MONTCLAIR STATE UNIVERSITY NJ 16 13 NEW JERSEY CITY UNIVERSITY NJ 5 3 NEW JERSEY INSTITUTE OF TECHNOLOGY NJ 7 6 OCEAN COUNTY COLLEGE NJ 2 2 PASSAIC COUNTY COMMUNITY COLLEGE NJ 1 1 RAMAPO COLLEGE OF NEW JERSEY NJ 6 5 RARITAN VALLEY COMMUNITY COLLEGE NJ 7 5 RICHARD STOCKTON COLLEGE OF NEW JERSEY NJ 4 2 RIDER UNIVERSITY NJ 1 1 ROWAN COLLEGE AT BURLINGTON COUNTY NJ 3 3
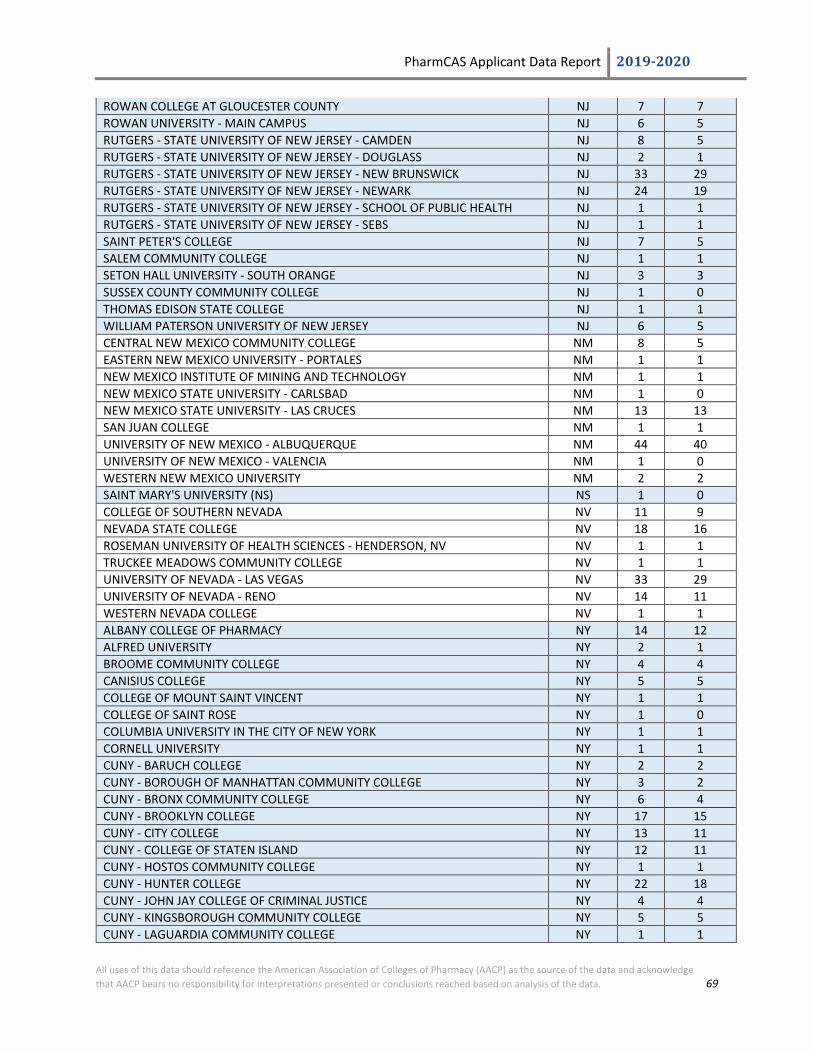
PharmCAS Applicant Data Report 2019-2020
All uses of this data should reference the American Association of Colleges of Pharmacy (AACP) as the source of the data and acknowledge that AACP bears no responsibility for interpretations presented or conclusions reached based on analysis of the data. 69
ROWAN COLLEGE AT GLOUCESTER COUNTY NJ 7 7 ROWAN UNIVERSITY - MAIN CAMPUS NJ 6 5 RUTGERS - STATE UNIVERSITY OF NEW JERSEY - CAMDEN NJ 8 5 RUTGERS - STATE UNIVERSITY OF NEW JERSEY - DOUGLASS NJ 2 1 RUTGERS - STATE UNIVERSITY OF NEW JERSEY - NEW BRUNSWICK NJ 33 29 RUTGERS - STATE UNIVERSITY OF NEW JERSEY - NEWARK NJ 24 19 RUTGERS - STATE UNIVERSITY OF NEW JERSEY - SCHOOL OF PUBLIC HEALTH NJ 1 1 RUTGERS - STATE UNIVERSITY OF NEW JERSEY - SEBS NJ 1 1 SAINT PETER'S COLLEGE NJ 7 5 SALEM COMMUNITY COLLEGE NJ 1 1 SETON HALL UNIVERSITY - SOUTH ORANGE NJ 3 3 SUSSEX COUNTY COMMUNITY COLLEGE NJ 1 0 THOMAS EDISON STATE COLLEGE NJ 1 1 WILLIAM PATERSON UNIVERSITY OF NEW JERSEY NJ 6 5 CENTRAL NEW MEXICO COMMUNITY COLLEGE NM 8 5 EASTERN NEW MEXICO UNIVERSITY - PORTALES NM 1 1 NEW MEXICO INSTITUTE OF MINING AND TECHNOLOGY NM 1 1 NEW MEXICO STATE UNIVERSITY - CARLSBAD NM 1 0 NEW MEXICO STATE UNIVERSITY - LAS CRUCES NM 13 13 SAN JUAN COLLEGE NM 1 1 UNIVERSITY OF NEW MEXICO - ALBUQUERQUE NM 44 40 UNIVERSITY OF NEW MEXICO - VALENCIA NM 1 0 WESTERN NEW MEXICO UNIVERSITY NM 2 2 SAINT MARY'S UNIVERSITY (NS) NS 1 0 COLLEGE OF SOUTHERN NEVADA NV 11 9 NEVADA STATE COLLEGE NV 18 16 ROSEMAN UNIVERSITY OF HEALTH SCIENCES - HENDERSON, NV NV 1 1 TRUCKEE MEADOWS COMMUNITY COLLEGE NV 1 1 UNIVERSITY OF NEVADA - LAS VEGAS NV 33 29 UNIVERSITY OF NEVADA - RENO NV 14 11 WESTERN NEVADA COLLEGE NV 1 1 ALBANY COLLEGE OF PHARMACY NY 14 12 ALFRED UNIVERSITY NY 2 1 BROOME COMMUNITY COLLEGE NY 4 4 CANISIUS COLLEGE NY 5 5 COLLEGE OF MOUNT SAINT VINCENT NY 1 1 COLLEGE OF SAINT ROSE NY 1 0 COLUMBIA UNIVERSITY IN THE CITY OF NEW YORK NY 1 1 CORNELL UNIVERSITY NY 1 1 CUNY - BARUCH COLLEGE NY 2 2 CUNY - BOROUGH OF MANHATTAN COMMUNITY COLLEGE NY 3 2 CUNY - BRONX COMMUNITY COLLEGE NY 6 4 CUNY - BROOKLYN COLLEGE NY 17 15 CUNY - CITY COLLEGE NY 13 11 CUNY - COLLEGE OF STATEN ISLAND NY 12 11 CUNY - HOSTOS COMMUNITY COLLEGE NY 1 1 CUNY - HUNTER COLLEGE NY 22 18 CUNY - JOHN JAY COLLEGE OF CRIMINAL JUSTICE NY 4 4 CUNY - KINGSBOROUGH COMMUNITY COLLEGE NY 5 5 CUNY - LAGUARDIA COMMUNITY COLLEGE NY 1 1

PharmCAS Applicant Data Report 2019-2020
All uses of this data should reference the American Association of Colleges of Pharmacy (AACP) as the source of the data and acknowledge that AACP bears no responsibility for interpretations presented or conclusions reached based on analysis of the data. 70
CUNY - LEHMAN COLLEGE NY 13 12 CUNY - MEDGAR EVERS COLLEGE NY 3 2 CUNY - NEW YORK CITY COLLEGE OF TECHNOLOGY NY 3 3 CUNY - QUEENS COLLEGE NY 7 6 CUNY - QUEENSBOROUGH COMMUNITY COLLEGE NY 1 0 CUNY - YORK COLLEGE NY 9 8 DOMINICAN COLLEGE NY 1 1 D'YOUVILLE COLLEGE NY 22 20 ELMIRA COLLEGE NY 1 1 ERIE COMMUNITY COLLEGE - CENTER REPORT NY 1 0 ERIE COMMUNITY COLLEGE - CITY CAMPUS NY 1 1 ERIE COMMUNITY COLLEGE - NORTH CAMPUS NY 2 0 EXCELSIOR COLLEGE NY 1 1 FINGER LAKES COMMUNITY COLLEGE NY 2 2 FORDHAM UNIVERSITY - LINCOLN CENTER NY 1 1 FORDHAM UNIVERSITY - ROSE HILL NY 1 1 HARTWICK COLLEGE NY 2 2 HOBART AND WILLIAM SMITH COLLEGES NY 2 2 HOFSTRA UNIVERSITY NY 4 3 HOUGHTON COLLEGE NY 1 1 HUDSON VALLEY COMMUNITY COLLEGE NY 5 4 ITHACA COLLEGE NY 1 1 JAMESTOWN COMMUNITY COLLEGE NY 1 1 LONG ISLAND UNIVERSITY - BROOKLYN CAMPUS NY 166 150 LONG ISLAND UNIVERSITY - C.W. POST CAMPUS NY 10 10 MANHATTAN COLLEGE NY 1 1 MANHATTANVILLE COLLEGE NY 1 1 MARIST COLLEGE NY 2 2 MERCY COLLEGE NY 1 1 MOHAWK VALLEY COMMUNITY COLLEGE NY 3 3 MONROE COMMUNITY COLLEGE - ROCHESTER NY 8 6 NASSAU COMMUNITY COLLEGE NY 2 2 NAZARETH COLLEGE (NY) NY 3 3 NEW YORK INSTITUTE OF TECHNOLOGY - CENTRAL ISLIP NY 1 1 NEW YORK INSTITUTE OF TECHNOLOGY - OLD WESTBURY NY 3 2 NEW YORK UNIVERSITY NY 3 3 NIAGARA COUNTY COMMUNITY COLLEGE NY 2 2 NIAGARA UNIVERSITY NY 2 2 ONONDAGA COMMUNITY COLLEGE NY 2 2 PACE UNIVERSITY - PLEASANTVILLE / BRIARCLIFF NY 2 1 RENSSELAER POLYTECHNIC INSTITUTE NY 1 1 ROBERTS WESLEYAN COLLEGE NY 1 1 ROCHESTER INSTITUTE OF TECHNOLOGY NY 3 2 SAINT BONAVENTURE UNIVERSITY NY 1 1 SAINT FRANCIS COLLEGE (NEW YORK) NY 1 1 SAINT JOHN FISHER COLLEGE NY 38 33 SAINT JOHN'S UNIVERSITY (NY) NY 11 9 SAINT LAWRENCE UNIVERSITY NY 1 1 SCHENECTADY COUNTY COMMUNITY COLLEGE NY 2 2 SIENA COLLEGE NY 2 2
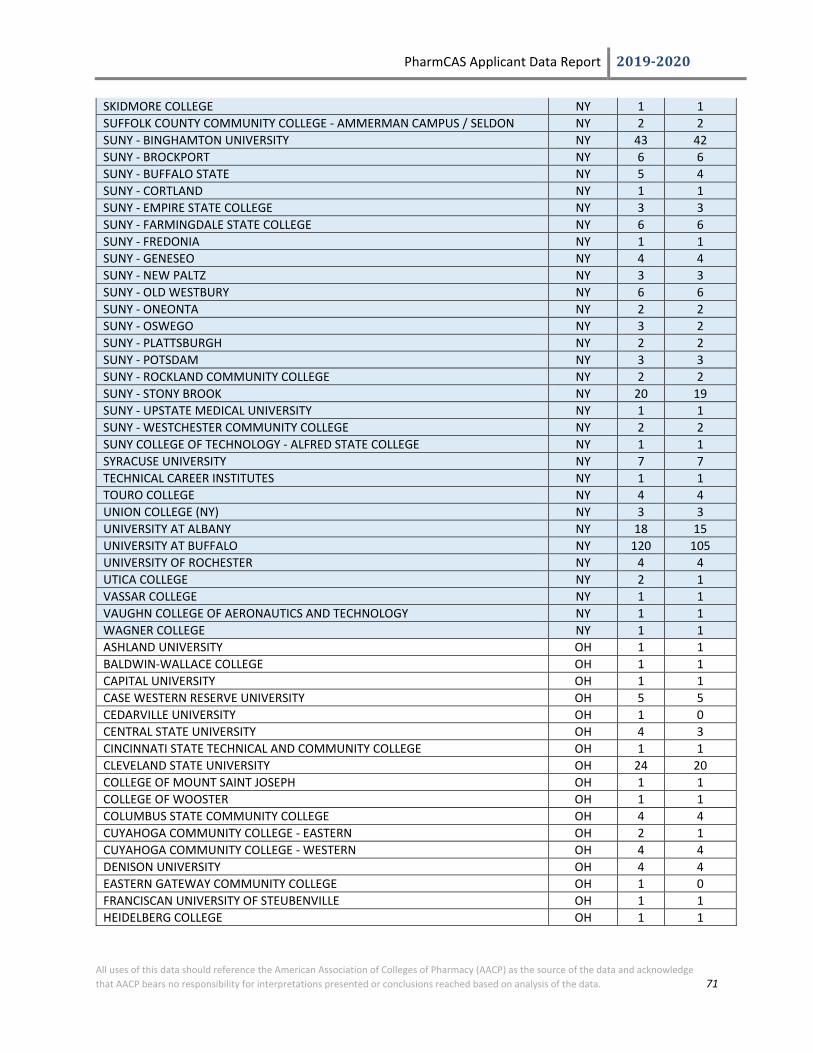
PharmCAS Applicant Data Report 2019-2020
All uses of this data should reference the American Association of Colleges of Pharmacy (AACP) as the source of the data and acknowledge that AACP bears no responsibility for interpretations presented or conclusions reached based on analysis of the data. 71
SKIDMORE COLLEGE NY 1 1 SUFFOLK COUNTY COMMUNITY COLLEGE - AMMERMAN CAMPUS / SELDON NY 2 2 SUNY - BINGHAMTON UNIVERSITY NY 43 42 SUNY - BROCKPORT NY 6 6 SUNY - BUFFALO STATE NY 5 4 SUNY - CORTLAND NY 1 1 SUNY - EMPIRE STATE COLLEGE NY 3 3 SUNY - FARMINGDALE STATE COLLEGE NY 6 6 SUNY - FREDONIA NY 1 1 SUNY - GENESEO NY 4 4 SUNY - NEW PALTZ NY 3 3 SUNY - OLD WESTBURY NY 6 6 SUNY - ONEONTA NY 2 2 SUNY - OSWEGO NY 3 2 SUNY - PLATTSBURGH NY 2 2 SUNY - POTSDAM NY 3 3 SUNY - ROCKLAND COMMUNITY COLLEGE NY 2 2 SUNY - STONY BROOK NY 20 19 SUNY - UPSTATE MEDICAL UNIVERSITY NY 1 1 SUNY - WESTCHESTER COMMUNITY COLLEGE NY 2 2 SUNY COLLEGE OF TECHNOLOGY - ALFRED STATE COLLEGE NY 1 1 SYRACUSE UNIVERSITY NY 7 7 TECHNICAL CAREER INSTITUTES NY 1 1 TOURO COLLEGE NY 4 4 UNION COLLEGE (NY) NY 3 3 UNIVERSITY AT ALBANY NY 18 15 UNIVERSITY AT BUFFALO NY 120 105 UNIVERSITY OF ROCHESTER NY 4 4 UTICA COLLEGE NY 2 1 VASSAR COLLEGE NY 1 1 VAUGHN COLLEGE OF AERONAUTICS AND TECHNOLOGY NY 1 1 WAGNER COLLEGE NY 1 1 ASHLAND UNIVERSITY OH 1 1 BALDWIN-WALLACE COLLEGE OH 1 1 CAPITAL UNIVERSITY OH 1 1 CASE WESTERN RESERVE UNIVERSITY OH 5 5 CEDARVILLE UNIVERSITY OH 1 0 CENTRAL STATE UNIVERSITY OH 4 3 CINCINNATI STATE TECHNICAL AND COMMUNITY COLLEGE OH 1 1 CLEVELAND STATE UNIVERSITY OH 24 20 COLLEGE OF MOUNT SAINT JOSEPH OH 1 1 COLLEGE OF WOOSTER OH 1 1 COLUMBUS STATE COMMUNITY COLLEGE OH 4 4 CUYAHOGA COMMUNITY COLLEGE - EASTERN OH 2 1 CUYAHOGA COMMUNITY COLLEGE - WESTERN OH 4 4 DENISON UNIVERSITY OH 4 4 EASTERN GATEWAY COMMUNITY COLLEGE OH 1 0 FRANCISCAN UNIVERSITY OF STEUBENVILLE OH 1 1 HEIDELBERG COLLEGE OH 1 1

PharmCAS Applicant Data Report 2019-2020
All uses of this data should reference the American Association of Colleges of Pharmacy (AACP) as the source of the data and acknowledge that AACP bears no responsibility for interpretations presented or conclusions reached based on analysis of the data. 72
KENT STATE UNIVERSITY - ASHTABULA/EAST LIVERPOOL/GEAUGA/KENT/SALEM/STARK/TRUMBULL/TUSCARAWAS, OH OH 24 21
KENYON COLLEGE OH 2 2 LAKE ERIE COLLEGE OH 2 2 LORAIN COUNTY COMMUNITY COLLEGE OH 2 2 LOURDES COLLEGE OH 2 2 MIAMI UNIVERSITY - OXFORD OH 1 1 MUSKINGUM UNIVERSITY OH 1 1 NOTRE DAME COLLEGE (OH) OH 2 2 OHIO DOMINICAN UNIVERSITY OH 1 1 OHIO NORTHERN UNIVERSITY OH 3 2 OHIO STATE UNIVERSITY OH 98 88 OHIO UNIVERSITY - ATHENS OH 8 7 OHIO WESLEYAN UNIVERSITY OH 1 0 OTTERBEIN COLLEGE OH 1 1 OWENS COMMUNITY COLLEGE - TOLEDO CAMPUS OH 1 1 SHAWNEE STATE UNIVERSITY OH 3 3 SINCLAIR COMMUNITY COLLEGE OH 1 0 SOUTHERN STATE COMMUNITY COLLEGE OH 1 1 STARK STATE COLLEGE OH 2 2 UNIVERSITY OF AKRON - AKRON CAMPUS OH 9 8 UNIVERSITY OF AKRON - WAYNE COLLEGE OH 1 1 UNIVERSITY OF CINCINNATI - BLUE ASH COLLEGE OH 11 9 UNIVERSITY OF CINCINNATI - CLERMONT COLLEGE OH 2 2 UNIVERSITY OF CINCINNATI - MAIN CAMPUS OH 48 45 UNIVERSITY OF DAYTON OH 3 3 UNIVERSITY OF FINDLAY OH 1 0 UNIVERSITY OF MOUNT UNION OH 1 1 UNIVERSITY OF PHOENIX (OH) OH 1 1 UNIVERSITY OF TOLEDO OH 115 101 UNIVERSITY OF TOLEDO - HEALTH SCIENCE CAMPUS OH 2 0 URSULINE COLLEGE OH 1 1 WITTENBERG UNIVERSITY OH 2 0 WRIGHT STATE UNIVERSITY - DAYTON CAMPUS OH 8 8 XAVIER UNIVERSITY OH 3 3 YOUNGSTOWN STATE UNIVERSITY OH 11 8 CAMERON UNIVERSITY OK 3 2 EAST CENTRAL UNIVERSITY OK 1 1 NORTHEASTERN STATE UNIVERSITY OK 4 4 OKLAHOMA CITY COMMUNITY COLLEGE OK 3 2 OKLAHOMA STATE UNIVERSITY - STILLWATER OK 9 8 ORAL ROBERTS UNIVERSITY OK 1 1 ROSE STATE COLLEGE OK 5 4 SEMINOLE STATE COLLEGE (OKLAHOMA) OK 1 1 SOUTHEASTERN OKLAHOMA STATE UNIVERSITY OK 1 1 SOUTHERN NAZARENE UNIVERSITY OK 1 1 SOUTHWESTERN OKLAHOMA STATE UNIVERSITY OK 2 2 TULSA COMMUNITY COLLEGE OK 10 6 UNIVERSITY OF CENTRAL OKLAHOMA OK 10 6 UNIVERSITY OF OKLAHOMA - NORMAN CAMPUS OK 39 36
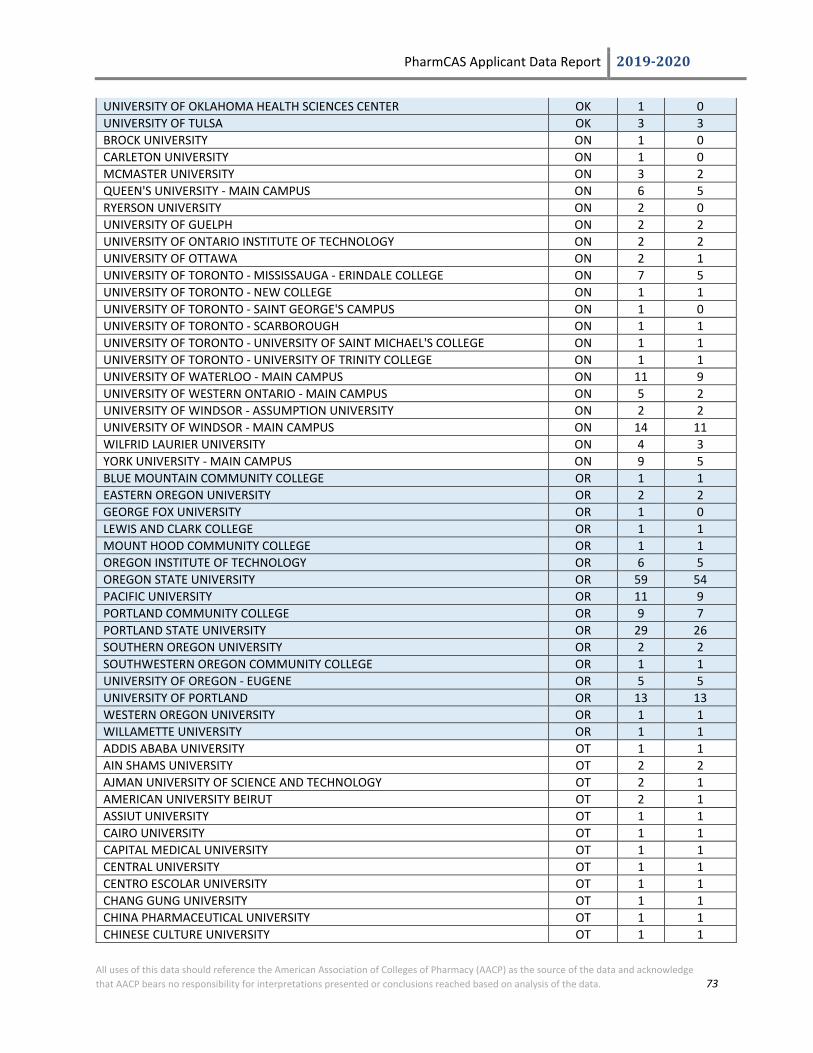
PharmCAS Applicant Data Report 2019-2020
All uses of this data should reference the American Association of Colleges of Pharmacy (AACP) as the source of the data and acknowledge that AACP bears no responsibility for interpretations presented or conclusions reached based on analysis of the data. 73
UNIVERSITY OF OKLAHOMA HEALTH SCIENCES CENTER OK 1 0 UNIVERSITY OF TULSA OK 3 3 BROCK UNIVERSITY ON 1 0 CARLETON UNIVERSITY ON 1 0 MCMASTER UNIVERSITY ON 3 2 QUEEN'S UNIVERSITY - MAIN CAMPUS ON 6 5 RYERSON UNIVERSITY ON 2 0 UNIVERSITY OF GUELPH ON 2 2 UNIVERSITY OF ONTARIO INSTITUTE OF TECHNOLOGY ON 2 2 UNIVERSITY OF OTTAWA ON 2 1 UNIVERSITY OF TORONTO - MISSISSAUGA - ERINDALE COLLEGE ON 7 5 UNIVERSITY OF TORONTO - NEW COLLEGE ON 1 1 UNIVERSITY OF TORONTO - SAINT GEORGE'S CAMPUS ON 1 0 UNIVERSITY OF TORONTO - SCARBOROUGH ON 1 1 UNIVERSITY OF TORONTO - UNIVERSITY OF SAINT MICHAEL'S COLLEGE ON 1 1 UNIVERSITY OF TORONTO - UNIVERSITY OF TRINITY COLLEGE ON 1 1 UNIVERSITY OF WATERLOO - MAIN CAMPUS ON 11 9 UNIVERSITY OF WESTERN ONTARIO - MAIN CAMPUS ON 5 2 UNIVERSITY OF WINDSOR - ASSUMPTION UNIVERSITY ON 2 2 UNIVERSITY OF WINDSOR - MAIN CAMPUS ON 14 11 WILFRID LAURIER UNIVERSITY ON 4 3 YORK UNIVERSITY - MAIN CAMPUS ON 9 5 BLUE MOUNTAIN COMMUNITY COLLEGE OR 1 1 EASTERN OREGON UNIVERSITY OR 2 2 GEORGE FOX UNIVERSITY OR 1 0 LEWIS AND CLARK COLLEGE OR 1 1 MOUNT HOOD COMMUNITY COLLEGE OR 1 1 OREGON INSTITUTE OF TECHNOLOGY OR 6 5 OREGON STATE UNIVERSITY OR 59 54 PACIFIC UNIVERSITY OR 11 9 PORTLAND COMMUNITY COLLEGE OR 9 7 PORTLAND STATE UNIVERSITY OR 29 26 SOUTHERN OREGON UNIVERSITY OR 2 2 SOUTHWESTERN OREGON COMMUNITY COLLEGE OR 1 1 UNIVERSITY OF OREGON - EUGENE OR 5 5 UNIVERSITY OF PORTLAND OR 13 13 WESTERN OREGON UNIVERSITY OR 1 1 WILLAMETTE UNIVERSITY OR 1 1 ADDIS ABABA UNIVERSITY OT 1 1 AIN SHAMS UNIVERSITY OT 2 2 AJMAN UNIVERSITY OF SCIENCE AND TECHNOLOGY OT 2 1 AMERICAN UNIVERSITY BEIRUT OT 2 1 ASSIUT UNIVERSITY OT 1 1 CAIRO UNIVERSITY OT 1 1 CAPITAL MEDICAL UNIVERSITY OT 1 1 CENTRAL UNIVERSITY OT 1 1 CENTRO ESCOLAR UNIVERSITY OT 1 1 CHANG GUNG UNIVERSITY OT 1 1 CHINA PHARMACEUTICAL UNIVERSITY OT 1 1 CHINESE CULTURE UNIVERSITY OT 1 1

PharmCAS Applicant Data Report 2019-2020
All uses of this data should reference the American Association of Colleges of Pharmacy (AACP) as the source of the data and acknowledge that AACP bears no responsibility for interpretations presented or conclusions reached based on analysis of the data. 74
CHUNG-ANG UNIVERSITY OT 1 0 COLLEGE OF MEDICINE - CITY OF LAGOS OT 1 1 CUTTINGTON UNIVERSITY COLLEGE OT 1 0 DEVI AHILYA UNIVERSITY OT 1 0 DONGGUK UNIVERSITY OT 1 1 EWHA WOMANS UNIVERSITY OT 1 0 GUJARAT TECHNOLOGICAL UNIVERSITY OT 6 4 GURU NANAK DEV UNIVERSITY OT 1 1 HANDONG UNIVERSITY OT 2 0 HENAN UNIVERSITY TRADITIONAL CHINESE MEDICINE OT 1 1 INHA UNIVERSITY OT 1 1 INJE UNIVERSITY OT 1 1 ISFAHAN UNIVERSITY TECHNOLOGY OT 1 1 ISLAMIC AZAD UNIVERSITY OT 6 4 JAWAHARLAL NEHRU UNIVERSITY OT 1 1 KAOHSIUNG MEDICAL UNIVERSITY OT 1 1 KARNATAK UNIVERSITY OT 1 0 KEELE UNIVERSITY OT 1 1 KOREA UNIVERSITY OT 2 1 KWAME NKRUMAH UNIVERSITY OF SCIENCE AND TECHNOLOGY OT 7 6 KYUNGHEE UNIVERSITY OT 1 1 LAGOS UNIVERSITY TEACHING HOSPITAL OT 1 1 MAHIDOL UNIVERSITY OT 1 1 MASHHAD UNIVERSITY OF MEDICAL SCIENCES OT 1 1 NANJING UNIVERSITY SCIENCE AND TECHNOLOGY OT 1 1 NATIONAL UNIVERSITY OF HO CHI MINH CITY OT 1 1 NIRMA UNIVERSITY OT 1 0 NNAMDI AZIKIWE UNIVERSITY OT 2 2 OBAFEMI AWOLOWO UNIVERSITY OT 1 1 OSMANIA UNIVERSITY OT 0 0 PANJAB UNIVERSITY OT 2 2 PUSAN NATIONAL UNIVERSITY OT 2 2 RAJIV GHANDI UNIVERSITY OF HEALTH SCIENCES OT 5 3 ROEHAMPTON INSTITUTE OT 1 0 ROSS UNIVERSITY SCHOOL OF MEDICINE OT 1 1 SAVITRIBAI PHULE PUNE UNIVERSITY OT 1 1 SEOUL NATIONAL UNIVERSITY OT 2 2 SHAHID BEHESHTI UNIVERSITY OT 1 1 SHARIF UNIVERSITY OF TECHNOLOGY IRAN OT 2 1 SHIRAZ UNIVERSITY OF MED. SCIENCE OT 1 1 SOOKMYUNG WOMEN'S UNIVERSITY OT 1 1 TAIPEI MEDICAL COLLEGE OT 1 1 TIRANA UNIVERSITY OT 1 0 TUNGHAI UNIVERSITY OT 1 1 TZU CHI UNIVERSITY OT 1 1 UNIVERSIDAD DE GUANAJUATO OT 1 1 UNIVERSIDAD DE ORIENTE - FACULTAD DE ESTOMATOLOGIA DEL ISCM OT 1 1 UNIVERSITY OF ASMARA OT 2 2 UNIVERSITY OF BAGHDAD OT 1 1 UNIVERSITY OF BENIN OT 1 0

PharmCAS Applicant Data Report 2019-2020
All uses of this data should reference the American Association of Colleges of Pharmacy (AACP) as the source of the data and acknowledge that AACP bears no responsibility for interpretations presented or conclusions reached based on analysis of the data. 75
UNIVERSITY OF CAIRO - FACULTY OF ORAL AND DENTAL MEDICINE OT 1 1 UNIVERSITY OF CAPE COAST OT 2 2 UNIVERSITY OF DHAKA OT 1 1 UNIVERSITY OF GHANA, OT 1 1 UNIVERSITY OF GUYANA OT 1 1 UNIVERSITY OF ILORIN OT 1 0 UNIVERSITY OF KERALA OT 1 1 UNIVERSITY OF KHARTOUM OT 1 1 UNIVERSITY OF LAGOS OT 4 2 UNIVERSITY OF LIBERIA OT 1 0 UNIVERSITY OF NIS - CLINIC OF STOMATOLOGY OT 0 0 UNIVERSITY OF PORT HARCOURT OT 1 1 UNIVERSITY OF TEHRAN OT 2 1 UNIVERSITY OF UYO OT 1 1 UNIVERSITY OF YAOUNDE OT 2 2 VEER NARMAD SOUTH GUJARAT UNIVERSITY OT 2 2 WONKWANG UNIVERSITY OT 1 1 YONSEI UNIVERSITY OT 1 1 ALLEGHENY COLLEGE PA 1 1 ARCADIA UNIVERSITY PA 1 1 BUCKNELL UNIVERSITY PA 1 1 BUCKS COUNTY COMMUNITY COLLEGE PA 4 4 BUTLER COUNTY COMMUNITY COLLEGE PA 1 1 CEDAR CREST COLLEGE PA 1 1 CHATHAM UNIVERSITY PA 1 0 CHESTNUT HILL COLLEGE PA 1 1 CHEYNEY UNIVERSITY OF PENNSYLVANIA PA 2 2 CLARION UNIVERSITY OF PENNSYLVANIA PA 5 5 COMMUNITY COLLEGE OF ALLEGHENY COUNTY - ALLEGHENY PA 2 1 COMMUNITY COLLEGE OF ALLEGHENY COUNTY - BOYCE PA 3 1 COMMUNITY COLLEGE OF PHILADELPHIA PA 23 15 DELAWARE COUNTY COMMUNITY COLLEGE PA 5 4 DICKINSON COLLEGE PA 2 2 DREXEL UNIVERSITY PA 4 3 DUQUESNE UNIVERSITY PA 7 6 EAST STROUDSBURG UNIVERSITY OF PENNSYLVANIA PA 2 2 EDINBORO UNIVERSITY OF PENNSYLVANIA PA 9 6 FRANKLIN AND MARSHALL COLLEGE PA 2 2 GANNON UNIVERSITY PA 8 7 GENEVA COLLEGE PA 1 1 GROVE CITY COLLEGE PA 1 1 HARRISBURG AREA COMMUNITY COLLEGE - GETTYSBURG PA 1 1 HARRISBURG AREA COMMUNITY COLLEGE - HARRISBURG / MAIN CAMPUS PA 3 2 HARRISBURG UNIVERSITY OF SCIENCE AND TECHNOLOGY PA 2 2 HOLY FAMILY UNIVERSITY PA 1 1 IMMACULATA UNIVERSITY PA 3 3 INDIANA UNIVERSITY OF PENNSYLVANIA - ARMSTRONG COUNTY PA 1 1 INDIANA UNIVERSITY OF PENNSYLVANIA - SUTTON HALL PA 7 7 KEYSTONE COLLEGE PA 1 1 KING'S COLLEGE (PENNSYLVANIA) PA 2 1

PharmCAS Applicant Data Report 2019-2020
All uses of this data should reference the American Association of Colleges of Pharmacy (AACP) as the source of the data and acknowledge that AACP bears no responsibility for interpretations presented or conclusions reached based on analysis of the data. 76
KUTZTOWN UNIVERSITY OF PENNSYLVANIA PA 3 1 LA ROCHE COLLEGE PA 1 1 LA SALLE UNIVERSITY PA 4 4 LEBANON VALLEY COLLEGE PA 2 1 LECOM - LAKE ERIE COLLEGE OF OSTEOPATHIC MEDICINE AND SCHOOL OF PHARMACY - ERIE, PA PA 2 1
LINCOLN UNIVERSITY (PENNSYLVANIA) PA 2 2 LOCK HAVEN UNIVERSITY OF PENNSYLVANIA - LOCK HAVEN PA 5 4 LUZERNE COUNTY COMMUNITY COLLEGE PA 1 1 MANSFIELD UNIVERSITY PA 1 1 MARYWOOD UNIVERSITY PA 1 1 MERCYHURST UNIVERSITY PA 5 5 MESSIAH COLLEGE PA 0 0 MILLERSVILLE UNIVERSITY OF PENNSYLVANIA PA 6 5 MISERICORDIA UNIVERSITY PA 1 0 MONTGOMERY COUNTY COMMUNITY COLLEGE PA 4 4 MORAVIAN COLLEGE PA 1 1 MOUNT ALOYSIUS COLLEGE PA 2 2 MUHLENBERG COLLEGE PA 1 1 NEUMANN UNIVERSITY PA 2 1 NORTHAMPTON COUNTY AREA COMMUNITY COLLEGE - BETHLEHEM/MONROE PA 2 1 PENNSYLVANIA STATE UNIVERSITY PA 31 27 PHILADELPHIA UNIVERSITY PA 1 1 READING AREA COMMUNITY COLLEGE PA 3 2 ROBERT MORRIS UNIVERSITY PA 4 3 SAINT FRANCIS UNIVERSITY PA 1 1 SAINT JOSEPH'S UNIVERSITY PA 3 3 SETON HILL UNIVERSITY PA 3 3 SHIPPENSBURG UNIVERSITY OF PENNSYLVANIA PA 1 1 SLIPPERY ROCK UNIVERSITY OF PENNSYLVANIA PA 7 7 STRAYER UNIVERSITY (PA) PA 1 0 SWARTHMORE COLLEGE PA 1 1 TEMPLE UNIVERSITY PA 90 77 THIEL COLLEGE PA 1 0 THOMAS JEFFERSON UNIVERSITY PA 11 10 UNIVERSITY OF PENNSYLVANIA PA 1 1 UNIVERSITY OF PITTSBURGH - GREENSBURG PA 8 5 UNIVERSITY OF PITTSBURGH - JOHNSTOWN PA 4 4 UNIVERSITY OF PITTSBURGH - PITTSBURGH PA 137 120 UNIVERSITY OF PITTSBURGH - TITUSVILLE PA 3 3 UNIVERSITY OF SCRANTON PA 1 1 UNIVERSITY OF THE SCIENCES IN PHILADELPHIA PA 6 4 URSINUS COLLEGE PA 1 1 VILLANOVA UNIVERSITY PA 3 2 WASHINGTON AND JEFFERSON COLLEGE PA 2 1 WEST CHESTER UNIVERSITY OF PENNSYLVANIA PA 4 4 WESTMINSTER COLLEGE (PA) PA 1 1 WIDENER UNIVERSITY - CHESTER, PA PA 1 1 WILKES UNIVERSITY PA 1 1 BAYAMON CENTRAL UNIVERSITY PR 2 1
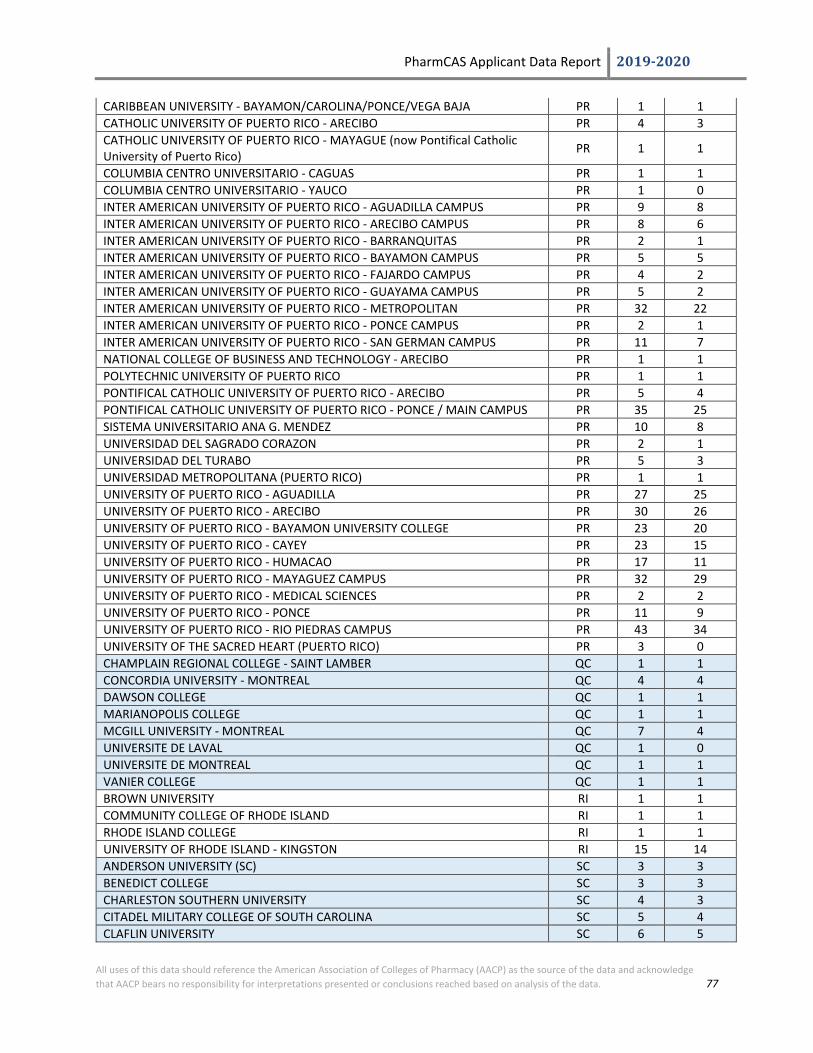
PharmCAS Applicant Data Report 2019-2020
All uses of this data should reference the American Association of Colleges of Pharmacy (AACP) as the source of the data and acknowledge that AACP bears no responsibility for interpretations presented or conclusions reached based on analysis of the data. 77
CARIBBEAN UNIVERSITY - BAYAMON/CAROLINA/PONCE/VEGA BAJA PR 1 1 CATHOLIC UNIVERSITY OF PUERTO RICO - ARECIBO PR 4 3 CATHOLIC UNIVERSITY OF PUERTO RICO - MAYAGUE (now Pontifical Catholic University of Puerto Rico) PR 1 1
COLUMBIA CENTRO UNIVERSITARIO - CAGUAS PR 1 1 COLUMBIA CENTRO UNIVERSITARIO - YAUCO PR 1 0 INTER AMERICAN UNIVERSITY OF PUERTO RICO - AGUADILLA CAMPUS PR 9 8 INTER AMERICAN UNIVERSITY OF PUERTO RICO - ARECIBO CAMPUS PR 8 6 INTER AMERICAN UNIVERSITY OF PUERTO RICO - BARRANQUITAS PR 2 1 INTER AMERICAN UNIVERSITY OF PUERTO RICO - BAYAMON CAMPUS PR 5 5 INTER AMERICAN UNIVERSITY OF PUERTO RICO - FAJARDO CAMPUS PR 4 2 INTER AMERICAN UNIVERSITY OF PUERTO RICO - GUAYAMA CAMPUS PR 5 2 INTER AMERICAN UNIVERSITY OF PUERTO RICO - METROPOLITAN PR 32 22 INTER AMERICAN UNIVERSITY OF PUERTO RICO - PONCE CAMPUS PR 2 1 INTER AMERICAN UNIVERSITY OF PUERTO RICO - SAN GERMAN CAMPUS PR 11 7 NATIONAL COLLEGE OF BUSINESS AND TECHNOLOGY - ARECIBO PR 1 1 POLYTECHNIC UNIVERSITY OF PUERTO RICO PR 1 1 PONTIFICAL CATHOLIC UNIVERSITY OF PUERTO RICO - ARECIBO PR 5 4 PONTIFICAL CATHOLIC UNIVERSITY OF PUERTO RICO - PONCE / MAIN CAMPUS PR 35 25 SISTEMA UNIVERSITARIO ANA G. MENDEZ PR 10 8 UNIVERSIDAD DEL SAGRADO CORAZON PR 2 1 UNIVERSIDAD DEL TURABO PR 5 3 UNIVERSIDAD METROPOLITANA (PUERTO RICO) PR 1 1 UNIVERSITY OF PUERTO RICO - AGUADILLA PR 27 25 UNIVERSITY OF PUERTO RICO - ARECIBO PR 30 26 UNIVERSITY OF PUERTO RICO - BAYAMON UNIVERSITY COLLEGE PR 23 20 UNIVERSITY OF PUERTO RICO - CAYEY PR 23 15 UNIVERSITY OF PUERTO RICO - HUMACAO PR 17 11 UNIVERSITY OF PUERTO RICO - MAYAGUEZ CAMPUS PR 32 29 UNIVERSITY OF PUERTO RICO - MEDICAL SCIENCES PR 2 2 UNIVERSITY OF PUERTO RICO - PONCE PR 11 9 UNIVERSITY OF PUERTO RICO - RIO PIEDRAS CAMPUS PR 43 34 UNIVERSITY OF THE SACRED HEART (PUERTO RICO) PR 3 0 CHAMPLAIN REGIONAL COLLEGE - SAINT LAMBER QC 1 1 CONCORDIA UNIVERSITY - MONTREAL QC 4 4 DAWSON COLLEGE QC 1 1 MARIANOPOLIS COLLEGE QC 1 1 MCGILL UNIVERSITY - MONTREAL QC 7 4 UNIVERSITE DE LAVAL QC 1 0 UNIVERSITE DE MONTREAL QC 1 1 VANIER COLLEGE QC 1 1 BROWN UNIVERSITY RI 1 1 COMMUNITY COLLEGE OF RHODE ISLAND RI 1 1 RHODE ISLAND COLLEGE RI 1 1 UNIVERSITY OF RHODE ISLAND - KINGSTON RI 15 14 ANDERSON UNIVERSITY (SC) SC 3 3 BENEDICT COLLEGE SC 3 3 CHARLESTON SOUTHERN UNIVERSITY SC 4 3 CITADEL MILITARY COLLEGE OF SOUTH CAROLINA SC 5 4 CLAFLIN UNIVERSITY SC 6 5
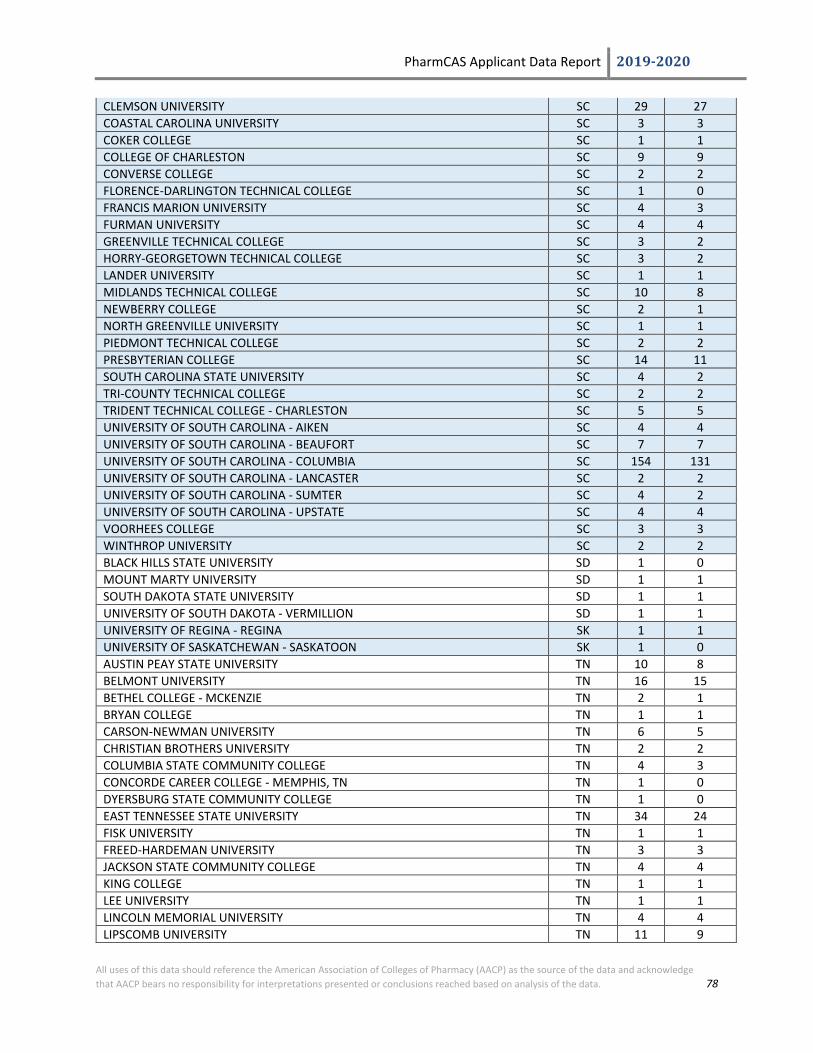
PharmCAS Applicant Data Report 2019-2020
All uses of this data should reference the American Association of Colleges of Pharmacy (AACP) as the source of the data and acknowledge that AACP bears no responsibility for interpretations presented or conclusions reached based on analysis of the data. 78
CLEMSON UNIVERSITY SC 29 27 COASTAL CAROLINA UNIVERSITY SC 3 3 COKER COLLEGE SC 1 1 COLLEGE OF CHARLESTON SC 9 9 CONVERSE COLLEGE SC 2 2 FLORENCE-DARLINGTON TECHNICAL COLLEGE SC 1 0 FRANCIS MARION UNIVERSITY SC 4 3 FURMAN UNIVERSITY SC 4 4 GREENVILLE TECHNICAL COLLEGE SC 3 2 HORRY-GEORGETOWN TECHNICAL COLLEGE SC 3 2 LANDER UNIVERSITY SC 1 1 MIDLANDS TECHNICAL COLLEGE SC 10 8 NEWBERRY COLLEGE SC 2 1 NORTH GREENVILLE UNIVERSITY SC 1 1 PIEDMONT TECHNICAL COLLEGE SC 2 2 PRESBYTERIAN COLLEGE SC 14 11 SOUTH CAROLINA STATE UNIVERSITY SC 4 2 TRI-COUNTY TECHNICAL COLLEGE SC 2 2 TRIDENT TECHNICAL COLLEGE - CHARLESTON SC 5 5 UNIVERSITY OF SOUTH CAROLINA - AIKEN SC 4 4 UNIVERSITY OF SOUTH CAROLINA - BEAUFORT SC 7 7 UNIVERSITY OF SOUTH CAROLINA - COLUMBIA SC 154 131 UNIVERSITY OF SOUTH CAROLINA - LANCASTER SC 2 2 UNIVERSITY OF SOUTH CAROLINA - SUMTER SC 4 2 UNIVERSITY OF SOUTH CAROLINA - UPSTATE SC 4 4 VOORHEES COLLEGE SC 3 3 WINTHROP UNIVERSITY SC 2 2 BLACK HILLS STATE UNIVERSITY SD 1 0 MOUNT MARTY UNIVERSITY SD 1 1 SOUTH DAKOTA STATE UNIVERSITY SD 1 1 UNIVERSITY OF SOUTH DAKOTA - VERMILLION SD 1 1 UNIVERSITY OF REGINA - REGINA SK 1 1 UNIVERSITY OF SASKATCHEWAN - SASKATOON SK 1 0 AUSTIN PEAY STATE UNIVERSITY TN 10 8 BELMONT UNIVERSITY TN 16 15 BETHEL COLLEGE - MCKENZIE TN 2 1 BRYAN COLLEGE TN 1 1 CARSON-NEWMAN UNIVERSITY TN 6 5 CHRISTIAN BROTHERS UNIVERSITY TN 2 2 COLUMBIA STATE COMMUNITY COLLEGE TN 4 3 CONCORDE CAREER COLLEGE - MEMPHIS, TN TN 1 0 DYERSBURG STATE COMMUNITY COLLEGE TN 1 0 EAST TENNESSEE STATE UNIVERSITY TN 34 24 FISK UNIVERSITY TN 1 1 FREED-HARDEMAN UNIVERSITY TN 3 3 JACKSON STATE COMMUNITY COLLEGE TN 4 4 KING COLLEGE TN 1 1 LEE UNIVERSITY TN 1 1 LINCOLN MEMORIAL UNIVERSITY TN 4 4 LIPSCOMB UNIVERSITY TN 11 9

PharmCAS Applicant Data Report 2019-2020
All uses of this data should reference the American Association of Colleges of Pharmacy (AACP) as the source of the data and acknowledge that AACP bears no responsibility for interpretations presented or conclusions reached based on analysis of the data. 79
MARYVILLE COLLEGE TN 1 1 MIDDLE TENNESSEE STATE UNIVERSITY TN 26 21 MILLIGAN UNIVERSITY TN 1 1 MOTLOW STATE COMMUNITY COLLEGE TN 1 0 NASHVILLE STATE COMMUNITY COLLEGE TN 17 9 NORTHEAST STATE TECHNICAL COMMUNITY COLLEGE TN 3 2 PELLISSIPPI STATE TECHNICAL COMMUNITY COLLEGE TN 7 6 RHODES COLLEGE TN 3 3 SOUTH COLLEGE - KNOXVILLE TN 16 13 SOUTHERN ADVENTIST UNIVERSITY TN 5 5 SOUTHWEST TENNESSEE COMMUNITY COLLEGE - MACON CAMPUS TN 1 1 SOUTHWEST TENNESSEE COMMUNITY COLLEGE - UNION CAMPUS TN 1 0 TENNESSEE STATE UNIVERSITY TN 19 13 TENNESSEE TECHNOLOGICAL UNIVERSITY TN 13 13 TENNESSEE WESLEYAN COLLEGE TN 3 3 UNION UNIVERSITY TN 15 15 UNIVERSITY OF MEMPHIS TN 29 22 UNIVERSITY OF TENNESSEE - CHATTANOOGA TN 14 13 UNIVERSITY OF TENNESSEE - KNOXVILLE TN 49 47 UNIVERSITY OF TENNESSEE - MARTIN TN 8 7 VANDERBILT UNIVERSITY TN 2 2 VOLUNTEER STATE COMMUNITY COLLEGE TN 2 2 WALTERS STATE COMMUNITY COLLEGE TN 4 3 ABILENE CHRISTIAN UNIVERSITY TX 2 1 AMARILLO COLLEGE TX 6 5 ANGELO STATE UNIVERSITY TX 2 2 AUSTIN COLLEGE TX 3 1 AUSTIN COMMUNITY COLLEGE TX 6 5 BAYLOR UNIVERSITY TX 19 17 BLINN COLLEGE TX 2 2 BROOKHAVEN COLLEGE TX 2 1 CEDAR VALLEY COLLEGE TX 2 2 CENTRAL TEXAS COLLEGE TX 1 1 CHAMBERLAIN COLLEGE OF NURSING - HOUSTON (now Chamberlain University) TX 1 1 CLARENDON COLLEGE TX 1 1 COLLIN COUNTY COMMUNITY COLLEGE TX 16 14 CONCORDIA UNIVERSITY - AUSTIN TX 1 1 DEL MAR COLLEGE TX 3 3 DEVRY UNIVERSITY - HOUSTON, TX TX 1 1 EL CENTRO COLLEGE TX 1 1 EL PASO COMMUNITY COLLEGE TX 3 1 GALVESTON COLLEGE TX 1 0 GRAYSON COUNTY COLLEGE TX 1 1 HARDIN-SIMMONS UNIVERSITY TX 2 2 HILL COLLEGE TX 1 1 HOUSTON BAPTIST UNIVERSITY TX 1 1 HOUSTON COMMUNITY COLLEGE TX 45 36 HOWARD PAYNE UNIVERSITY TX 1 1 HUSTON-TILLOTSON UNIVERSITY TX 1 1 JACKSONVILLE COLLEGE TX 0 0

PharmCAS Applicant Data Report 2019-2020
All uses of this data should reference the American Association of Colleges of Pharmacy (AACP) as the source of the data and acknowledge that AACP bears no responsibility for interpretations presented or conclusions reached based on analysis of the data. 80
JARVIS CHRISTIAN COLLEGE TX 1 0 LAMAR STATE COLLEGE - ORANGE TX 1 0 LAMAR STATE COLLEGE - PORT ARTHUR TX 1 1 LAMAR UNIVERSITY TX 7 6 LEE COLLEGE TX 1 1 LONE STAR COLLEGE - CYFAIR TX 5 4 LONE STAR COLLEGE - KINGWOOD TX 2 1 LONE STAR COLLEGE - MONTGOMERY TX 1 1 LONE STAR COLLEGE - NORTH HARRIS TX 3 2 LONE STAR COLLEGE - TOMBALL TX 1 1 LONE STAR COLLEGE - UNIVERSITY PARK TX 3 3 LUBBOCK CHRISTIAN UNIVERSITY TX 1 1 MCLENNAN COMMUNITY COLLEGE TX 2 2 MIDWESTERN STATE UNIVERSITY TX 1 1 MOUNTAIN VIEW COLLEGE TX 1 0 NORTH CENTRAL TEXAS COLLEGE TX 2 1 NORTH LAKE COLLEGE TX 9 7 NORTHEAST TEXAS COMMUNITY COLLEGE TX 3 1 NORTHWEST VISTA COLLEGE - MAIN CAMPUS TX 1 1 NORTHWEST VISTA COLLEGE - SAN ANTONIO TX 4 2 ODESSA COLLEGE TX 1 1 OUR LADY OF THE LAKE UNIVERSITY TX 2 2 PALO ALTO COLLEGE TX 3 3 PAUL QUINN COLLEGE TX 1 0 PRAIRIE VIEW A&M UNIVERSITY TX 8 7 RICE UNIVERSITY TX 2 2 RICHLAND COLLEGE TX 13 8 SAINT EDWARD'S UNIVERSITY TX 1 1 SAINT MARY'S UNIVERSITY (TX) TX 4 4 SAINT PHILIP'S COLLEGE TX 4 3 SAM HOUSTON STATE UNIVERSITY TX 2 1 SAN ANTONIO COLLEGE TX 4 1 SAN JACINTO COLLEGE TX 10 7 SCHREINER UNIVERSITY TX 1 1 SOUTH PLAINS COLLEGE TX 3 2 SOUTH TEXAS COLLEGE TX 7 6 SOUTHERN METHODIST UNIVERSITY TX 1 1 SOUTHWESTERN UNIVERSITY TX 4 3 STEPHEN F. AUSTIN STATE UNIVERSITY TX 3 2 TARLETON STATE UNIVERSITY TX 4 4 TARRANT COUNTY COLLEGE - NORTHEAST TX 5 4 TARRANT COUNTY COLLEGE - NORTHWEST TX 3 1 TARRANT COUNTY COLLEGE - SOUTH TX 2 2 TARRANT COUNTY COLLEGE - SOUTHEAST TX 8 6 TARRANT COUNTY COLLEGE - TRINITY RIVER TX 1 1 TEXAS A&M INTERNATIONAL UNIVERSITY TX 4 4 TEXAS A&M UNIVERSITY - COLLEGE STATION (Main Campus) TX 58 56 TEXAS A&M UNIVERSITY - COMMERCE TX 3 3 TEXAS A&M UNIVERSITY - CORPUS CHRISTI TX 13 10 TEXAS A&M UNIVERSITY - KINGSVILLE TX 31 25
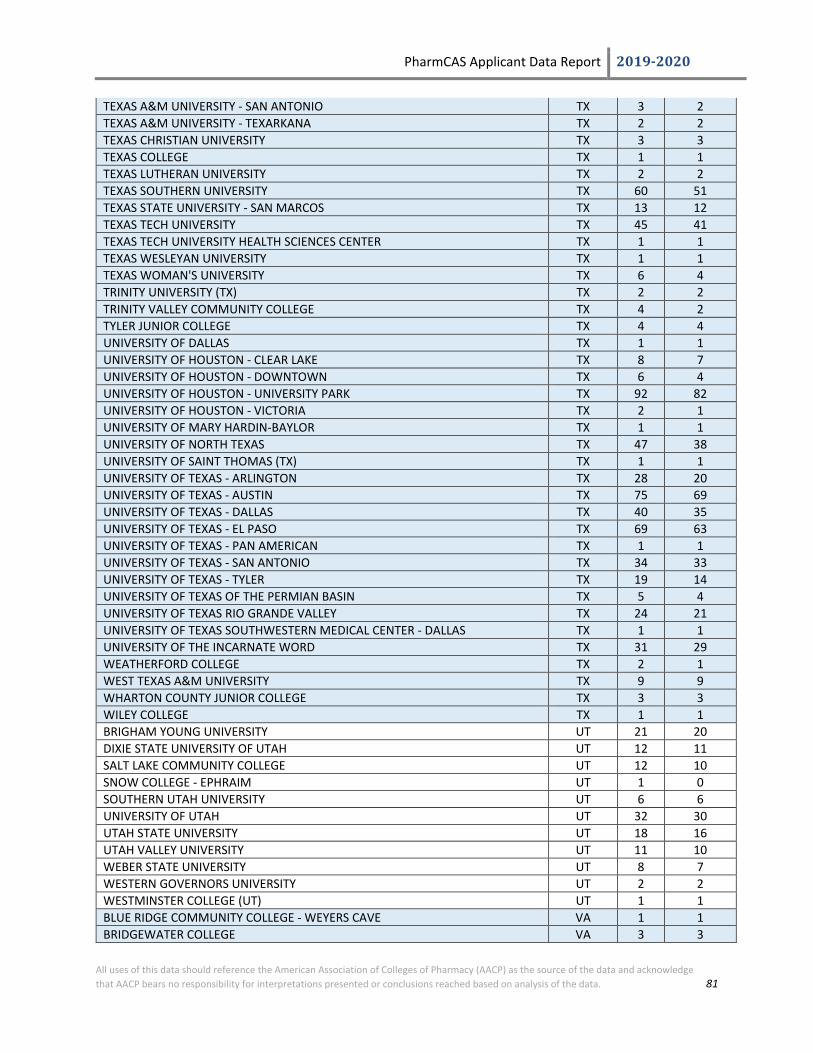
PharmCAS Applicant Data Report 2019-2020
All uses of this data should reference the American Association of Colleges of Pharmacy (AACP) as the source of the data and acknowledge that AACP bears no responsibility for interpretations presented or conclusions reached based on analysis of the data. 81
TEXAS A&M UNIVERSITY - SAN ANTONIO TX 3 2 TEXAS A&M UNIVERSITY - TEXARKANA TX 2 2 TEXAS CHRISTIAN UNIVERSITY TX 3 3 TEXAS COLLEGE TX 1 1 TEXAS LUTHERAN UNIVERSITY TX 2 2 TEXAS SOUTHERN UNIVERSITY TX 60 51 TEXAS STATE UNIVERSITY - SAN MARCOS TX 13 12 TEXAS TECH UNIVERSITY TX 45 41 TEXAS TECH UNIVERSITY HEALTH SCIENCES CENTER TX 1 1 TEXAS WESLEYAN UNIVERSITY TX 1 1 TEXAS WOMAN'S UNIVERSITY TX 6 4 TRINITY UNIVERSITY (TX) TX 2 2 TRINITY VALLEY COMMUNITY COLLEGE TX 4 2 TYLER JUNIOR COLLEGE TX 4 4 UNIVERSITY OF DALLAS TX 1 1 UNIVERSITY OF HOUSTON - CLEAR LAKE TX 8 7 UNIVERSITY OF HOUSTON - DOWNTOWN TX 6 4 UNIVERSITY OF HOUSTON - UNIVERSITY PARK TX 92 82 UNIVERSITY OF HOUSTON - VICTORIA TX 2 1 UNIVERSITY OF MARY HARDIN-BAYLOR TX 1 1 UNIVERSITY OF NORTH TEXAS TX 47 38 UNIVERSITY OF SAINT THOMAS (TX) TX 1 1 UNIVERSITY OF TEXAS - ARLINGTON TX 28 20 UNIVERSITY OF TEXAS - AUSTIN TX 75 69 UNIVERSITY OF TEXAS - DALLAS TX 40 35 UNIVERSITY OF TEXAS - EL PASO TX 69 63 UNIVERSITY OF TEXAS - PAN AMERICAN TX 1 1 UNIVERSITY OF TEXAS - SAN ANTONIO TX 34 33 UNIVERSITY OF TEXAS - TYLER TX 19 14 UNIVERSITY OF TEXAS OF THE PERMIAN BASIN TX 5 4 UNIVERSITY OF TEXAS RIO GRANDE VALLEY TX 24 21 UNIVERSITY OF TEXAS SOUTHWESTERN MEDICAL CENTER - DALLAS TX 1 1 UNIVERSITY OF THE INCARNATE WORD TX 31 29 WEATHERFORD COLLEGE TX 2 1 WEST TEXAS A&M UNIVERSITY TX 9 9 WHARTON COUNTY JUNIOR COLLEGE TX 3 3 WILEY COLLEGE TX 1 1 BRIGHAM YOUNG UNIVERSITY UT 21 20 DIXIE STATE UNIVERSITY OF UTAH UT 12 11 SALT LAKE COMMUNITY COLLEGE UT 12 10 SNOW COLLEGE - EPHRAIM UT 1 0 SOUTHERN UTAH UNIVERSITY UT 6 6 UNIVERSITY OF UTAH UT 32 30 UTAH STATE UNIVERSITY UT 18 16 UTAH VALLEY UNIVERSITY UT 11 10 WEBER STATE UNIVERSITY UT 8 7 WESTERN GOVERNORS UNIVERSITY UT 2 2 WESTMINSTER COLLEGE (UT) UT 1 1 BLUE RIDGE COMMUNITY COLLEGE - WEYERS CAVE VA 1 1 BRIDGEWATER COLLEGE VA 3 3
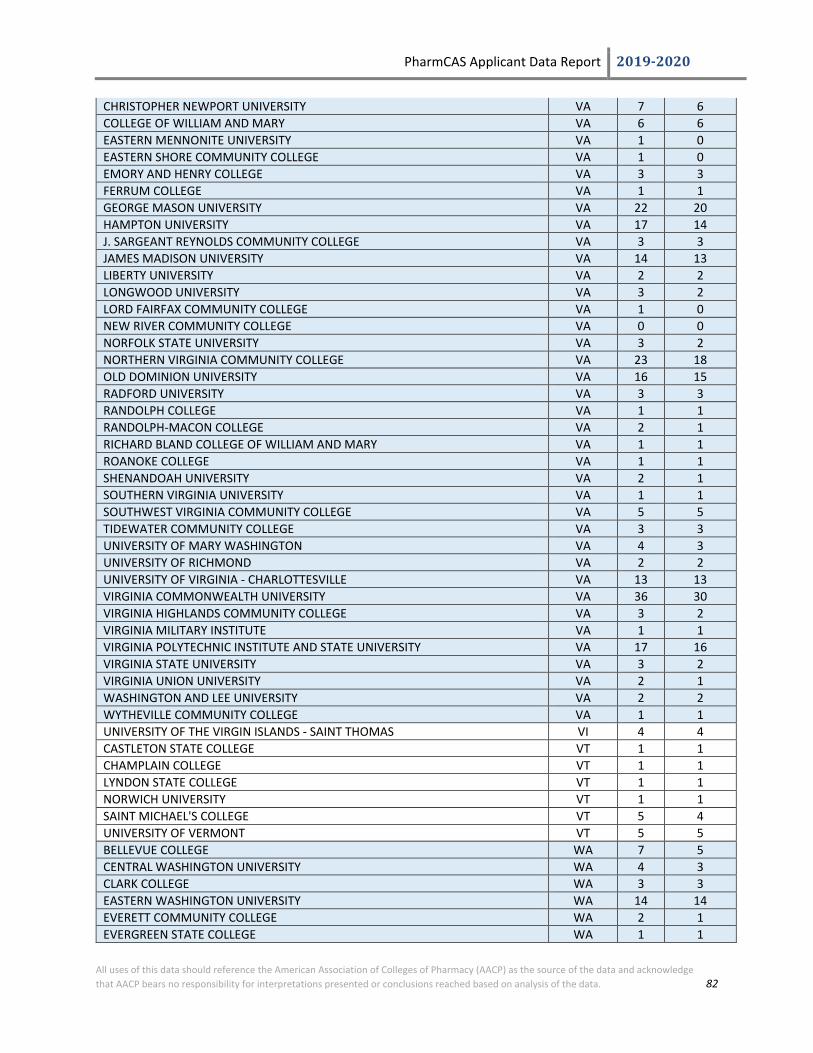
PharmCAS Applicant Data Report 2019-2020
All uses of this data should reference the American Association of Colleges of Pharmacy (AACP) as the source of the data and acknowledge that AACP bears no responsibility for interpretations presented or conclusions reached based on analysis of the data. 82
CHRISTOPHER NEWPORT UNIVERSITY VA 7 6 COLLEGE OF WILLIAM AND MARY VA 6 6 EASTERN MENNONITE UNIVERSITY VA 1 0 EASTERN SHORE COMMUNITY COLLEGE VA 1 0 EMORY AND HENRY COLLEGE VA 3 3 FERRUM COLLEGE VA 1 1 GEORGE MASON UNIVERSITY VA 22 20 HAMPTON UNIVERSITY VA 17 14 J. SARGEANT REYNOLDS COMMUNITY COLLEGE VA 3 3 JAMES MADISON UNIVERSITY VA 14 13 LIBERTY UNIVERSITY VA 2 2 LONGWOOD UNIVERSITY VA 3 2 LORD FAIRFAX COMMUNITY COLLEGE VA 1 0 NEW RIVER COMMUNITY COLLEGE VA 0 0 NORFOLK STATE UNIVERSITY VA 3 2 NORTHERN VIRGINIA COMMUNITY COLLEGE VA 23 18 OLD DOMINION UNIVERSITY VA 16 15 RADFORD UNIVERSITY VA 3 3 RANDOLPH COLLEGE VA 1 1 RANDOLPH-MACON COLLEGE VA 2 1 RICHARD BLAND COLLEGE OF WILLIAM AND MARY VA 1 1 ROANOKE COLLEGE VA 1 1 SHENANDOAH UNIVERSITY VA 2 1 SOUTHERN VIRGINIA UNIVERSITY VA 1 1 SOUTHWEST VIRGINIA COMMUNITY COLLEGE VA 5 5 TIDEWATER COMMUNITY COLLEGE VA 3 3 UNIVERSITY OF MARY WASHINGTON VA 4 3 UNIVERSITY OF RICHMOND VA 2 2 UNIVERSITY OF VIRGINIA - CHARLOTTESVILLE VA 13 13 VIRGINIA COMMONWEALTH UNIVERSITY VA 36 30 VIRGINIA HIGHLANDS COMMUNITY COLLEGE VA 3 2 VIRGINIA MILITARY INSTITUTE VA 1 1 VIRGINIA POLYTECHNIC INSTITUTE AND STATE UNIVERSITY VA 17 16 VIRGINIA STATE UNIVERSITY VA 3 2 VIRGINIA UNION UNIVERSITY VA 2 1 WASHINGTON AND LEE UNIVERSITY VA 2 2 WYTHEVILLE COMMUNITY COLLEGE VA 1 1 UNIVERSITY OF THE VIRGIN ISLANDS - SAINT THOMAS VI 4 4 CASTLETON STATE COLLEGE VT 1 1 CHAMPLAIN COLLEGE VT 1 1 LYNDON STATE COLLEGE VT 1 1 NORWICH UNIVERSITY VT 1 1 SAINT MICHAEL'S COLLEGE VT 5 4 UNIVERSITY OF VERMONT VT 5 5 BELLEVUE COLLEGE WA 7 5 CENTRAL WASHINGTON UNIVERSITY WA 4 3 CLARK COLLEGE WA 3 3 EASTERN WASHINGTON UNIVERSITY WA 14 14 EVERETT COMMUNITY COLLEGE WA 2 1 EVERGREEN STATE COLLEGE WA 1 1

PharmCAS Applicant Data Report 2019-2020
All uses of this data should reference the American Association of Colleges of Pharmacy (AACP) as the source of the data and acknowledge that AACP bears no responsibility for interpretations presented or conclusions reached based on analysis of the data. 83
GONZAGA UNIVERSITY WA 1 1 GREEN RIVER COMMUNITY COLLEGE WA 1 1 HERITAGE UNIVERSITY WA 1 1 HIGHLINE COMMUNITY COLLEGE WA 5 5 LOWER COLUMBIA COLLEGE WA 1 1 NORTH SEATTLE COMMUNITY COLLEGE WA 2 2 OLYMPIC COLLEGE WA 6 5 PACIFIC LUTHERAN UNIVERSITY WA 6 6 PIERCE COLLEGE - LAKEWOOD WA 4 4 SEATTLE CENTRAL COMMUNITY COLLEGE WA 1 1 SEATTLE PACIFIC UNIVERSITY WA 4 4 SEATTLE UNIVERSITY WA 2 2 SHORELINE COMMUNITY COLLEGE WA 1 1 SOUTH SEATTLE COMMUNITY COLLEGE WA 2 1 SPOKANE COMMUNITY COLLEGE WA 6 6 SPOKANE FALLS COMMUNITY COLLEGE WA 1 1 TACOMA COMMUNITY COLLEGE WA 2 2 UNIVERSITY OF WASHINGTON - BOTHELL /SEATTLE /TACOMA WA 106 93 WALLA WALLA UNIVERSITY WA 2 2 WASHINGTON STATE UNIVERSITY - PULLMAN/SPOKANE/TRI CITIES/VANCOUVER WA 42 38 WESTERN WASHINGTON UNIVERSITY WA 9 9 WHATCOM COMMUNITY COLLEGE WA 2 1 WHITMAN COLLEGE WA 1 1 WHITWORTH UNIVERSITY WA 3 3 YAKIMA VALLEY COMMUNITY COLLEGE WA 1 1 ALVERNO COLLEGE WI 1 1 BELOIT COLLEGE WI 1 1 CARDINAL STRITCH UNIVERSITY WI 2 1 CARROLL UNIVERSITY - WAUKESHA WI 4 4 CARTHAGE COLLEGE WI 3 3 CONCORDIA UNIVERSITY - WISCONSIN WI 25 23 EDGEWOOD COLLEGE WI 2 2 MADISON AREA TECHNICAL COLLEGE WI 1 1 MADISON COLLEGE WI 1 1 MARANATHA BAPTIST BIBLE COLLEGE WI 1 1 MARQUETTE UNIVERSITY WI 10 7 MILWAUKEE AREA TECHNICAL COLLEGE WI 2 2 SAINT NORBERT COLLEGE WI 2 2 UNIVERSITY OF WISCONSIN - EAU CLAIRE WI 11 11 UNIVERSITY OF WISCONSIN - GREEN BAY WI 3 3 UNIVERSITY OF WISCONSIN - LA CROSSE WI 6 6 UNIVERSITY OF WISCONSIN - MADISON WI 84 76 UNIVERSITY OF WISCONSIN - MILWAUKEE WI 18 17 UNIVERSITY OF WISCONSIN - OSHKOSH WI 8 6 UNIVERSITY OF WISCONSIN - PARKSIDE WI 10 9 UNIVERSITY OF WISCONSIN - PLATTEVILLE WI 4 3 UNIVERSITY OF WISCONSIN - RIVER FALLS WI 4 4 UNIVERSITY OF WISCONSIN - STEVENS POINT WI 6 6 UNIVERSITY OF WISCONSIN - WASHINGTON COUNTY WI 1 1 UNIVERSITY OF WISCONSIN - WHITEWATER WI 4 4

PharmCAS Applicant Data Report 2019-2020
All uses of this data should reference the American Association of Colleges of Pharmacy (AACP) as the source of the data and acknowledge that AACP bears no responsibility for interpretations presented or conclusions reached based on analysis of the data. 84
WISCONSIN LUTHERAN COLLEGE WI 1 0 ALDERSON-BROADDUS COLLEGE WV 1 1 BLUEFIELD STATE COLLEGE WV 2 2 CONCORD UNIVERSITY WV 5 4 FAIRMONT STATE UNIVERSITY WV 3 1 GLENVILLE STATE COLLEGE WV 1 0 MARSHALL UNIVERSITY WV 44 41 PIERPONT COMMUNITY AND TECHNICAL COLLEGE WV 1 1 POTOMAC STATE COLLEGE OF WEST VIRGINIA UNIVERSITY WV 1 1 SHEPHERD UNIVERSITY WV 6 6 UNIVERSITY OF CHARLESTON WV 12 12 WEST VIRGINIA UNIVERSITY - MORGANTOWN WV 50 50 WEST VIRGINIA UNIVERSITY INSTITUTE OF TECHNOLOGY WV 4 4 WEST VIRGINIA WESLEYAN COLLEGE WV 2 1 UNIVERSITY OF WYOMING WY 32 31 NON-US/CANADIAN (FOREIGN) INSTITUTION 87 67 NOT LISTED US INSTITUTION 38 33
*OT refers to “Other” in table.
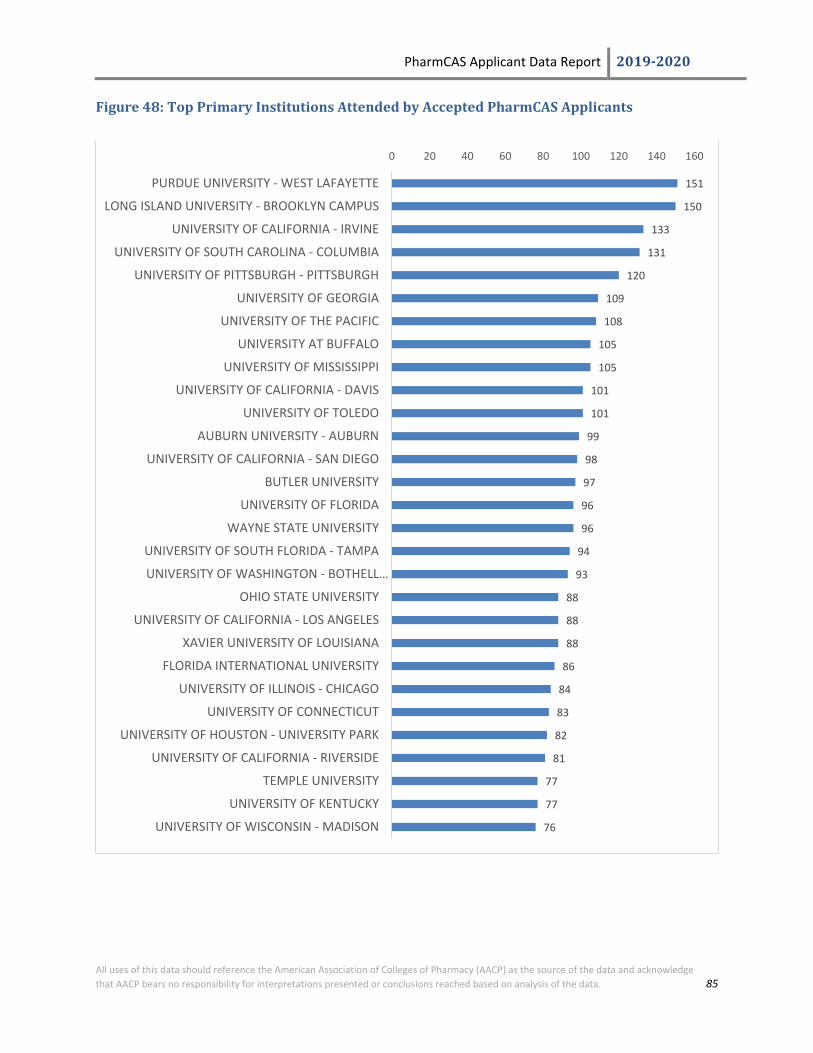
PharmCAS Applicant Data Report 2019-2020
All uses of this data should reference the American Association of Colleges of Pharmacy (AACP) as the source of the data and acknowledge that AACP bears no responsibility for interpretations presented or conclusions reached based on analysis of the data. 85
Figure 48: Top Primary Institutions Attended by Accepted PharmCAS Applicants
151
150
133
131
120
109
108
105
105
101
101
99
98
97
96
96
94
93
88
88
88
86
84
83
82
81
77
77
76
0 20 40 60 80 100 120 140 160
PURDUE UNIVERSITY - WEST LAFAYETTE
LONG ISLAND UNIVERSITY - BROOKLYN CAMPUS
UNIVERSITY OF CALIFORNIA - IRVINE
UNIVERSITY OF SOUTH CAROLINA - COLUMBIA
UNIVERSITY OF PITTSBURGH - PITTSBURGH
UNIVERSITY OF GEORGIA
UNIVERSITY OF THE PACIFIC
UNIVERSITY AT BUFFALO
UNIVERSITY OF MISSISSIPPI
UNIVERSITY OF CALIFORNIA - DAVIS
UNIVERSITY OF TOLEDO
AUBURN UNIVERSITY - AUBURN
UNIVERSITY OF CALIFORNIA - SAN DIEGO
BUTLER UNIVERSITY
UNIVERSITY OF FLORIDA
WAYNE STATE UNIVERSITY
UNIVERSITY OF SOUTH FLORIDA - TAMPA
UNIVERSITY OF WASHINGTON - BOTHELL…
OHIO STATE UNIVERSITY
UNIVERSITY OF CALIFORNIA - LOS ANGELES
XAVIER UNIVERSITY OF LOUISIANA
FLORIDA INTERNATIONAL UNIVERSITY
UNIVERSITY OF ILLINOIS - CHICAGO
UNIVERSITY OF CONNECTICUT
UNIVERSITY OF HOUSTON - UNIVERSITY PARK
UNIVERSITY OF CALIFORNIA - RIVERSIDE
TEMPLE UNIVERSITY
UNIVERSITY OF KENTUCKY
UNIVERSITY OF WISCONSIN - MADISON

PharmCAS Applicant Data Report 2019-2020
All uses of this data should reference the American Association of Colleges of Pharmacy (AACP) as the source of the data and acknowledge that AACP bears no responsibility for interpretations presented or conclusions reached based on analysis of the data. 86
PHARMCAS FEE WAIVERS PharmCAS offers a limited number of application fee waivers to financially disadvantaged applicants. The annual AACP fee waiver fund was $79,000 in the 2019-2020 admissions cycle. AACP could support a maximum of 451 financially disadvantaged applicants.
PharmCAS grants application fee waivers to financially disadvantaged applicants on a first-come, first-serve basis. Fee waiver decisions are based on the applicant's income, or parent's income if claimed as a dependent, as reported on the most recent tax return. PharmCAS grants waivers to those applicants with earnings that are at or below the U.S. Department of Health and Human Services poverty guidelines. Applicants with approved waivers may apply to a maximum of one PharmCAS program for free, and may choose to apply to additional program for an incremental fee of $55 for each. A fee waiver was denied or voided if the applicant did not follow the fee waiver instructions, exceeded the income threshold, or did not submit the application within 14 days after the waiver was approved.
Fee Waiver Statuses:
• Requested: Fee waiver request was received after the review process had closed. • Declined: Fee waiver request was declined because applicant was ineligible based on income. • Redeemed/Awarded: Fee waiver was approved and processed. • Expired/Not Redeemed: Fee waiver was approved but not redeemed within 14 days.
Figure 49: PharmCAS Fee Waiver Summary
REQUESTED DECLINED APPROVED Total # of Fee Waiver
Requests RECEIVED Redeemed/Awarded Expired/Not Redeemed 9 72 441 34 556
Figure 50: PharmCAS Fee Waiver Requests and Actions
9
441
34
72
0 50 100 150 200 250 300 350 400 450 500
Requested
Redeemed/Awarded
Expired
Declined

PharmCAS Applicant Data Report 2019-2020
All uses of this data should reference the American Association of Colleges of Pharmacy (AACP) as the source of the data and acknowledge that AACP bears no responsibility for interpretations presented or conclusions reached based on analysis of the data. 87
Figure 51: PharmCAS Fee Waiver and Early Decision Status
Fee Waiver Status
Applied Early Decision
Applied Early Decision but Returned to Regular Pool Not Early Decision
Granted 111 45 285
Not Granted 16 6 93
TOTAL 127 51 378
*Granted includes all fee waivers that were redeemed/awarded. Not granted includes all fee waivers that were declined, requested, and expired.
Figure 52: PharmCAS Fee Waiver Status by Race and Ethnicity Designations
*PharmCAS applicants were able to select one or more racial and ethnicity categories. Applicants with more than one race/ethnicity are reflected in more than one category above. Granted includes all fee waivers that were redeemed/awarded. Not granted includes all fee waivers that were declined, requested, and expired.
153
158
41
110
8
1
36
39
10
30
2
0
White
Asian
Hispanic/Latino
Black or African American
American Indian/Alaskan Native
Hawaiian/Pacific Islander
Not Granted Granted

PharmCAS Applicant Data Report 2019-2020
All uses of this data should reference the American Association of Colleges of Pharmacy (AACP) as the source of the data and acknowledge that AACP bears no responsibility for interpretations presented or conclusions reached based on analysis of the data. 88
Figure 53: PharmCAS Fee Waiver Status by Sex
*Granted includes all fee waivers that were redeemed/awarded. Not granted includes all fee waivers that were declined, requested, and expired.
Figure 54: PharmCAS Fee Waiver Status by Disadvantaged Status
Fee Waiver Status
Environmentally Disadvantaged
Economically Disadvantaged
Both Environmentally and Economically
Disadvantaged
Not Disadvantaged
Granted 91 20 294 36
Not Granted 26 6 58 25
TOTAL 117 26 352 61
*Disadvantaged categories in this figure are mutually exclusive. Disadvantaged status is applicant-reported and not verified, nor considered in the fee waiver review process. Education Occupation (EO) indicator scores are not reflected in this table, nor considered in the fee waiver review process. Granted includes all fee waivers that were redeemed/awarded. Not granted includes all fee waivers that were declined, requested, and expired.
116
325
0
35
79
1
0 50 100 150 200 250 300 350
Male
Female
Declined to State
Not Granted Granted

PharmCAS Applicant Data Report 2019-2020
All uses of this data should reference the American Association of Colleges of Pharmacy (AACP) as the source of the data and acknowledge that AACP bears no responsibility for interpretations presented or conclusions reached based on analysis of the data. 89
OFFICIAL PCAT SCORES The following figures represent the official PCAT scores reported by Pearson to PharmCAS. If multiple PCAT scores were reported, only the data from the highest scores were included in the mean calculations for this report.
Figure 55: Mean Official PCAT Scores and Percentiles for PharmCAS Applicants
Highest PCAT Scores All Applicants Accepted Applicants Biological Processes 411.67 413.24 Biological Processes Percentile 55.09 57.26 Chemical Processes 413.43 415.03 Chemical Processes Percentile 57.46 59.54 Quantitative Reasoning 406.46 407.62 Quantitative Reasoning Percentile 56.47 58.16 Composite Score 407.01 408.42 Composite Score Percentile 55.11 57.43 Writing 2.79 2.83
Figure 56: PCAT Composite Percentiles for Accepted PharmCAS Applicants (2014-2020)
63.3262.30 61.80
59.59 59.14 58.5057.43
45.00
47.00
49.00
51.00
53.00
55.00
57.00
59.00
61.00
63.00
65.00
2013-14 2014-15 2015-16 2016-17 2017-18 2018-19 2019-20

PharmCAS Applicant Data Report 2019-2020
All uses of this data should reference the American Association of Colleges of Pharmacy (AACP) as the source of the data and acknowledge that AACP bears no responsibility for interpretations presented or conclusions reached based on analysis of the data. 90
Figure 57: PCAT Test Takers by Cycle (2004-2020)
PCAT Testing Cycle # of PCAT Test Takers
Year 2003-04 25,036
Year 2004-05 25,340
Year 2005-06 27,844
Year 2006-07 30,140
Year 2007-08 32,958
Year 2008-09 33,684
Year 2009-10 35,352
Year 2010-11 33,873
Year 2011-12 29,001
Year 2012-13 23,488
Year 2013-14 26,410
Year 2014-15 18,768
Year 2015-16 23,156
Year 2016-17 21,448
Year 2017-18 19,229
Year 2018-19 16,092
Year 2019-20 9,890
Figure 58: Number of Schools with PCAT Requirement (2008-2020)
Year Total # of Pharmacy
Schools # of Schools with
PCAT Requirement 2007-2008 111 65 2008-2009 116 73 2009-2010 120 85 2010-2011 124 91 2011-2012 129 95 2012-2013 130 100 2013-2014 133 99 2014-2015 135 105 2015-2016 138 107 2016-2017 142 108 2017-2018 143 109 2018-2019 143 95 2019-2020 144 77
* 2013-14: 3 Schools did not report. 2014-15 and 2015-16: 1 school did not report.
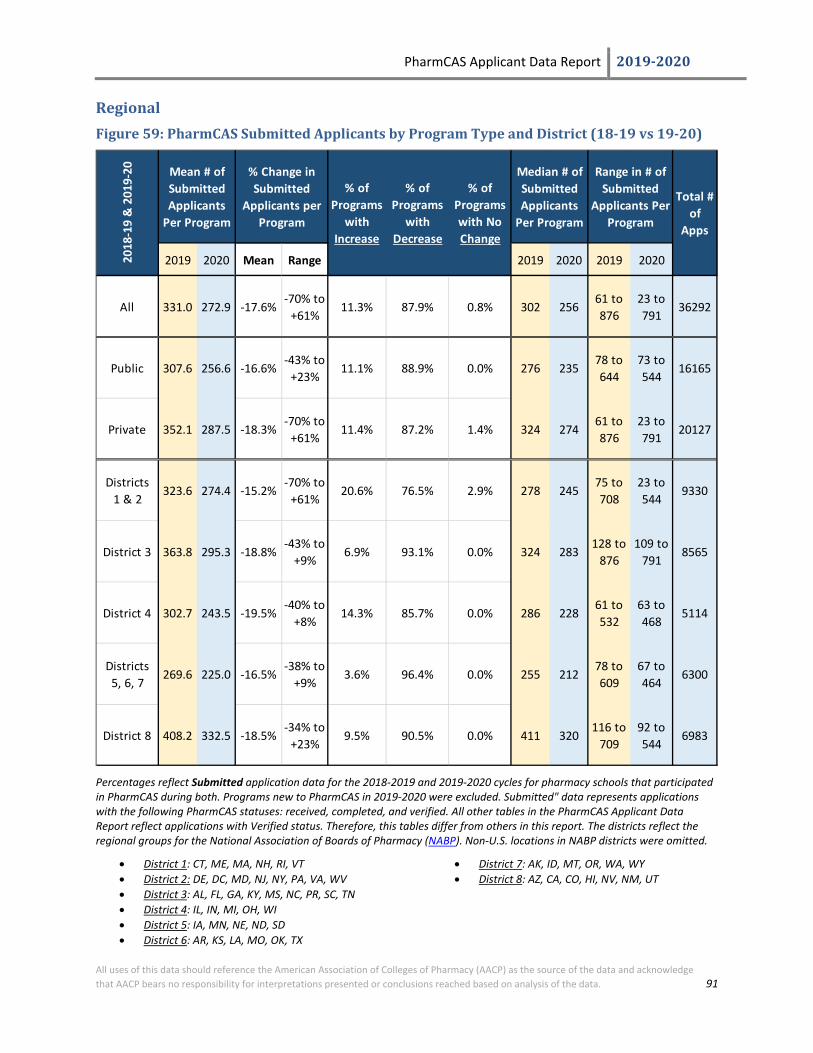
PharmCAS Applicant Data Report 2019-2020
All uses of this data should reference the American Association of Colleges of Pharmacy (AACP) as the source of the data and acknowledge that AACP bears no responsibility for interpretations presented or conclusions reached based on analysis of the data. 91
Regional Figure 59: PharmCAS Submitted Applicants by Program Type and District (18-19 vs 19-20)
Percentages reflect Submitted application data for the 2018-2019 and 2019-2020 cycles for pharmacy schools that participated in PharmCAS during both. Programs new to PharmCAS in 2019-2020 were excluded. Submitted" data represents applications with the following PharmCAS statuses: received, completed, and verified. All other tables in the PharmCAS Applicant Data Report reflect applications with Verified status. Therefore, this tables differ from others in this report. The districts reflect the regional groups for the National Association of Boards of Pharmacy (NABP). Non-U.S. locations in NABP districts were omitted.
• District 1: CT, ME, MA, NH, RI, VT • District 2: DE, DC, MD, NJ, NY, PA, VA, WV • District 3: AL, FL, GA, KY, MS, NC, PR, SC, TN • District 4: IL, IN, MI, OH, WI • District 5: IA, MN, NE, ND, SD • District 6: AR, KS, LA, MO, OK, TX
• District 7: AK, ID, MT, OR, WA, WY • District 8: AZ, CA, CO, HI, NV, NM, UT
2019 2020 Mean Range 2019 2020 2019 2020
All 331.0 272.9 -17.6%-70% to
+61%11.3% 87.9% 0.8% 302 256
61 to 876
23 to 791
36292
Public 307.6 256.6 -16.6%-43% to
+23%11.1% 88.9% 0.0% 276 235
78 to 644
73 to 544
16165
Private 352.1 287.5 -18.3%-70% to
+61%11.4% 87.2% 1.4% 324 274
61 to 876
23 to 791
20127
Districts 1 & 2
323.6 274.4 -15.2%-70% to
+61%20.6% 76.5% 2.9% 278 245
75 to 708
23 to 544
9330
District 3 363.8 295.3 -18.8%-43% to
+9%6.9% 93.1% 0.0% 324 283
128 to 876
109 to 791
8565
District 4 302.7 243.5 -19.5%-40% to
+8%14.3% 85.7% 0.0% 286 228
61 to 532
63 to 468
5114
Districts 5, 6, 7
269.6 225.0 -16.5%-38% to
+9%3.6% 96.4% 0.0% 255 212
78 to 609
67 to 464
6300
District 8 408.2 332.5 -18.5%-34% to
+23%9.5% 90.5% 0.0% 411 320
116 to 709
92 to 544
6983
2018
-19
& 2
019-
20
Total # of
Apps
Mean # of Submitted Applicants
Per Program
% Change in Submitted
Applicants per Program
% of Programs
with Increase
Median # of Submitted Applicants
Per Program
Range in # of Submitted
Applicants Per Program
% of Programs
with Decrease
% of Programs with No Change


