Abstract: We investigate the phase noise performance of optoelectronic oscillators when the optical energy storage elements are in the following three configurations: a high-Q whispering gallery mode resonator, an optical delay-line and a combination of both elements. The stability properties of these various optical elements are first characterized, and then systematically compared in the optical and in the microwave frequency domains. Subsequently, the spectral purity of the oscillator is theoretically and experimentally examined for each case. When the resonator is used as both delay and filtering element inside the delay-line based oscillator, the generated spurious modes are highly rejected. A spur rejection by more than 53 dB has been demonstrated for the first-neighboring spur.
OCIS codes: (140.4780) Optical resonators; (060.2310) Fiber optics; (230.0250) Optoelectronics; (350.4010) Microwaves; (060.5625) Radio frequency photonics; (230.4910) Oscillators.
References and links 1. G. Cibiel, M. Régis, O. Llopis, A. Rennane, L. Bary, R. Plana, Y. Kersalé, and V. Giordano, “Optimization of an
ultra low-phase noise sapphire-SiGe HBT oscillator using nonlinear CAD,” IEEE Trans. Ultrason. Ferroelectr. Freq. Control 51(1), 33–41 (2004).
2. R. T. Logan, L. Maleki, and M. Shadaram, “Stabilization of oscillator phase using a fiber-optic delayline,” in Proceedings of the 45th Annual Symposium on Frequency Control (IEEE, 1991), pp.508–512.
3. L. Maleki, “Sources: the optoelectronic oscillator,” Nat. Photonics 5(12), 728–730 (2011). 4. X. S. Yao and L. Maleki, “High frequency optical subcarrier generator,” Electron. Lett. 30(18), 1525–1526
(1994). 5. L. Maleki, “The opto-electronic oscillator (OEO): review and recent progress,” in Proceedings of the IEEE
European Frequency and Time Forum (IEEE, 2012), pp. 497–500. 6. D. Eliyahu, D. Seidel, and L. Maleki, “RF amplitude and phase-noise reduction of an optical link and an opto
electronic oscillator,” IEEE Trans. Microw. Theory Tech. 56(2), 449–456 (2008). 7. O. Okusaga, E. J. Adles, E. C. Levy, W. Zhou, G. M. Carter, C. R. Menyuk, and M. Horowitz, “Spurious mode
reduction in dual injection-locked optoelectronic oscillators,” Opt. Express 19(7), 5839–5854 (2011). 8. R. M. Nguimdo, Y. K. Chembo, P. Colet, and L. Larger, “On the phase noise performance of nonlinear double-
loop optoelectronic microwave oscillators,” IEEE J. Quantum Electron. 48(11), 1415–1423 (2012). 9. D. Eliyahu and L. Maleki, “Low phase noise and spurious level in multi-loop optoelectronic oscillators,” in
Proceedings of the IEEE International Frequency Control Symposium (IEEE, 2003), pp. 405–410. 10. K. Saleh, O. Llopis, and G. Cibiel, “Optical scattering induced noise in fiber ring resonators and optoelectronic
oscillators,” J. Lightwave Technol. 31(9), 1433–1446 (2013). 11. A. A. Savchenkov, A. B. Matsko, V. S. Ilchenko, and L. Maleki, “Optical resonators with ten million finesse,”
Opt. Express 15(11), 6768–6773 (2007). 12. K. Volyanskiy, Y. K. Chembo, L. Larger, and E. Rubiola, “Contribution of laser frequency and power
fluctuations to the microwave phase noise of optoelectronic oscillators,” J. Lightwave Technol. 28(18), 2730–2735 (2010).
13. A. Coillet, R. Henriet, P. Salzenstein, K. Phan Huy, L. Larger, and Y. K. Chembo, “Time-domain dynamics and stability analysis of optoelectronic oscillators based on whispering-gallery mode resonators,” IEEE J. Sel. Top. Quantum Electron. 19(5), 6000112 (2013).
#225242 - $15.00 USD Received 20 Oct 2014; revised 12 Dec 2014; accepted 13 Dec 2014; published 19 Dec 2014 (C) 2014 OSA 29 Dec 2014 | Vol. 22, No. 26 | DOI:10.1364/OE.22.032158 | OPTICS EXPRESS 32158
14. R. Henriet, A. Coillet, P. Salzenstein, K. Saleh, L. Larger, and Y. K. Chembo, “Experimental characterization of optoelectronic oscillators based on optical mini-resonators,” in Proceedings of the IEEE International Frequency Control Symposium European Frequency and Time Forum (IEEE, 2013), pp.37–39.
15. K. Saleh, A. Coillet, R. Henriet, P. Salzenstein, L. Larger, and Y. K. Chembo, “On the metrological performances of optoelectronic oscillators based on whispering gallery mode resonators,” Proc. SPIE 8985, 1–6 (2014).
16. A. Coillet, R. Henriet, K. Phan Huy, M. Jacquot, L. Furfaro, I. Balakireva, L. Larger, and Y. K. Chembo, “Microwave photonics systems based on whispering-gallery-mode resonators,” J. Vis. Exp. 78(78), e50423 (2013).
17. Y. Dumeige, S. Trebaol, L. Ghisa, T. K. N. Nguyen, H. Tavernier, and P. Feron, “Determination of coupling regime of high-Q resonators and optical gain of highly selective amplifiers,” J. Opt. Soc. Am. B 25(12), 2073–2080 (2008).
18. E. Black, “An introduction to Pound-Drever-Hall laser frequency stabilization,” Am. J. Phys. 69(1), 79–87 (2001).
19. A. Bouchier, K. Saleh, P. H. Merrer, O. Llopis, and G. Cibiel, “Theoretical and experimental study of the phase noise of opto-electronic oscillators based on high quality factor optical resonators,” in Proceedings of the IEEE International Frequency Control Symposium (IEEE, 2010), pp. 544–548.
20. P. H. Merrer, K. Saleh, O. Llopis, S. Berneschi, F. Cosi, and G. N. Conti, “Characterization technique of optical whispering gallery mode resonators in the microwave frequency domain for optoelectronic oscillators,” Appl. Opt. 51(20), 4742–4748 (2012).
21. D. B. Leeson, “A simple model of feedback oscillator noise spectrum,” IEEE Proc. 54(2), 329–330 (1966). 22. Y. Takushima and T. Okoshi, “Suppression of stimulated Brillouin scattering using optical isolators,” Electron.
Lett. 28(12), 1155–1157 (1992). 23. O. Okusaga, J. Cahill, W. Zhou, A. Docherty, G. M. Carter, and C. R. Menyuk, “Optical scattering induced noise
in RF-photonic systems,” in Proceedings of the IEEE International Frequency Control and the European Frequency and Time Forum (IEEE, 2011), pp.1–6.
24. K. Saleh, P. H. Merrer, O. Llopis, and G. Cibiel, “Optoelectronic oscillator based on fiber ring resonator: overall system optimization and phase noise reduction,” in Proceedings of the IEEE International Frequency Control Symposium (IEEE, 2012), pp.1–6.
25. A. Docherty, C. R. Menyuk, O. Okusaga, and Z. Weimin, “Stimulated Rayleigh scattering and amplitude-to-phase conversion as a source of length-dependent phase noise in OEOs,” in Proceedings of the IEEE International Frequency Control Symposium (IEEE, 2012), pp.1–5.
26. O. Okusaga, Z. Weimin, J. Cahill, A. Docherty, and C. R. Menyuk, “Fiber-induced degradation in RF-over-fiber links,” in Proceedings of the IEEE International Frequency Control Symposium (IEEE, 2012), pp.1–5.
27. K. Saleh, Paul Sabatier university, 118 Route de Narbonne, 31062 Toulouse, France, “High spectral purity microwave sources based on optical resonators,” (personal communication, 2012).
28. Y. Kouomou Chembo, L. Larger, H. Tavernier, R. Bendoula, E. Rubiola, and P. Colet, “Dynamic instabilities of microwaves generated with optoelectronic oscillators,” Opt. Lett. 32(17), 2571–2573 (2007).
29. Y. K. Chembo, L. Larger, and P. Colet, “Nonlinear dynamics and spectral stability of optoelectronic microwave oscillators,” IEEE J. Quantum Electron. 44(9), 858–866 (2008).
30. Y. K. Chembo, K. Volyanskiy, L. Larger, E. Rubiola, and P. Colet, “Determination of phase noise spectra in optoelectronic microwave oscillators: a Langevin approach,” IEEE J. Quantum Electron. 45(2), 178–186 (2009).
1. Introduction
Microwave sources with high spectral purity are currently becoming increasingly important for various applications. It is particularly the case in aerospace and communication engineering applications, but also in many others such as time and frequency metrology, and sensing, for example. The microwave sources that are able to provide super-high frequencies and low phase noise signals are mainly based on two conventional approaches. The first approach relies on the frequency multiplication of signals generated by low frequency and low noise quartz or surface acoustic wave oscillators, up to the desired frequency. This however causes the degradation of the phase noise of the multiplied signal by 20 × log N, with N being the multiplication factor. The second approach is based on the use of dielectric resonator oscillators (e.g. oscillators based on sapphire resonators [1]). Such oscillators are able to generate high spectral purity microwave signals up to 10 GHz. Yet, these systems are bulky and very sensitive to external perturbations. Furthermore, generated signals’ spectral purity is generally degraded at higher frequencies. Indeed, the quality factor of the microwave dielectric resonators is inversely proportional to the nominal frequency at which they are used. Therefore, other alternatives must be considered when the goal is to generate microwave signals at super-high frequencies featuring low phase noise levels.
A major technological breakthrough has been achieved in the early 1990s when optical systems have been introduced as an alternative stability element in microwave sources [2]. It
#225242 - $15.00 USD Received 20 Oct 2014; revised 12 Dec 2014; accepted 13 Dec 2014; published 19 Dec 2014 (C) 2014 OSA 29 Dec 2014 | Vol. 22, No. 26 | DOI:10.1364/OE.22.032158 | OPTICS EXPRESS 32159
has been proven then that optics can represent an elegant and reliable solution to generate high spectral purity microwave signals at high frequencies, especially the approach using the so-called optoelectronic oscillator (OEO) [3]. The first OEO, proposed in 1994 [4], was based on an optical delay-line (DL; a long, low-loss optical fiber) and features today ultra-low phase noise performance (e.g. a 16km long optical DL based OEO was used to obtain the highest achieved spectral purity: −163 dBc/Hz at 7 kHz from a 10 GHz carrier, [5,6]). In such case, the microwave signal is carried to the optical domain using a laser lightwave (e.g. λlaser ~1559nm) via optical modulation. Consequently, the carried microwave signal takes benefit of the large optical delay obtained by traveling through the long DL while experiencing extremely low optical loss. On the other hand, the main problem in using DL-based OEOs is the presence of spurious modes in the generated signal’s spectrum, whereas these modes need bulky and/or complex configurations to be reduced [7-9].
Another alternative optical stability element that can be used in OEOs is an optical resonator featuring ultra-high optical quality factor (QOpt > 109) within relatively small dimensions. Optical resonances in fibered resonators (few meters long) or whispering gallery mode resonators (WGMRs; diameters in the range of few millimeters or less) may feature such QOpt factors [10,11]. As in DL-based OEOs, the microwave signal is carried to the optical domain to take benefit of the resonator’s ultra-high QOpt. However, in that case, the laser must be stabilized onto one of the resonator’s optical resonances. On the other hand, it is noteworthy that, besides the large energy storage capacity provided by optical delay, the optical resonator also acts like a high selectivity band-pass optical filter.
In this article, we present different studies performed on an OEO based on two different optical stability elements, first considered individually, and later on conjointly: a magnesium fluoride (MgF2) crystalline disk-shaped WGMR and a 4km long optical DL. These studies are in the continuity of our previous theoretical and experimental investigations performed in our laboratory on OEOs [12-15]. The different characterization techniques of the WGMR in the optical domain are described. We present the followed procedure to firstly identify a useful optical mode of the MgF2 WGMR for our OEO application, then to characterize this mode, and finally, to stabilize the laser wavelength onto this optical mode by using a low frequency Pound-Drever-Hall (PDH) laser stabilization loop. This allows us later on to characterize the WGMR in the microwave frequency domain and then to set up an oscillation loop. Correspondingly, the characteristics of the optical DL, and later on the combination of both DL and WGMR, have been evaluated in the microwave frequency domain when they are included in the OEO loop. We have then set up different OEOs based on the stability properties of the aforementioned configurations. The measured optical, RF and phase noise spectra of the various signals are also presented and discussed in detail.
In our laboratory, different WGMRs with different sizes and materials (MgF2, CaF2, BaF2, etc.) are fabricated [16]. Among them, a 12 millimeters diameter MgF2 disk-shaped WGMR has been chosen to be used as the stability element for the OEO presented in this work (the 12 mm diameter is the raw disk’s diameter before the fabrication process, which consists in grinding and polishing). For this purpose, the WGMR must first be characterized in the optical domain in order to identify a useful optical mode amongst the different eigenmodes of the resonator. Thereafter, the identified optical mode’s family (i.e. the resonance comb/family to which the optical mode belongs to) is accurately characterized in the microwave frequency domain. This is done in order to measure three of its main features: the mode’s QOpt, which is directly linked to the photon’s lifetime τp, the optical insertion loss and the resonance comb’s free spectral range (FSR).
The FSR mainly depends on the WGMR’s geometry and particularly on its circumference, since the resonant lightwave orbits just beneath the surface in such structures. By analogy with a Fabry-Perot interferometer, the FSR is therefore given by:
#225242 - $15.00 USD Received 20 Oct 2014; revised 12 Dec 2014; accepted 13 Dec 2014; published 19 Dec 2014 (C) 2014 OSA 29 Dec 2014 | Vol. 22, No. 26 | DOI:10.1364/OE.22.032158 | OPTICS EXPRESS 32160
2 r
cFSR
n rπ= (1)
where c is the speed of light, r is the radius of the WGMR and nr is the group velocity dispersion index of the MgF2 disk (nr = 1.37 at a wavelength λ = 1559 nm). Assuming a perfectly circular MgF2 disk with 12 mm diameter, the FSR of its fundamental mode’s family should be equal to 5.8 GHz.
In order to characterize a WGMR, the laser lightwave must be first coupled into the resonator. This is done using a tapered optical microfiber. This enables the WGMs to be efficiently excited. The optical microfibers we are using are also fabricated in our laboratory [16]. The tapered part of the fabricated microfibers is usually few millimeters long and has a 1 µm waist diameter. These microfibers typically have less than 0.22 dB transmission loss.
2.1 WGMR characterization in the optical domain
In the optical domain, two characterization techniques have been used to characterize the WGMR and identify a useful optical mode for the OEO application.
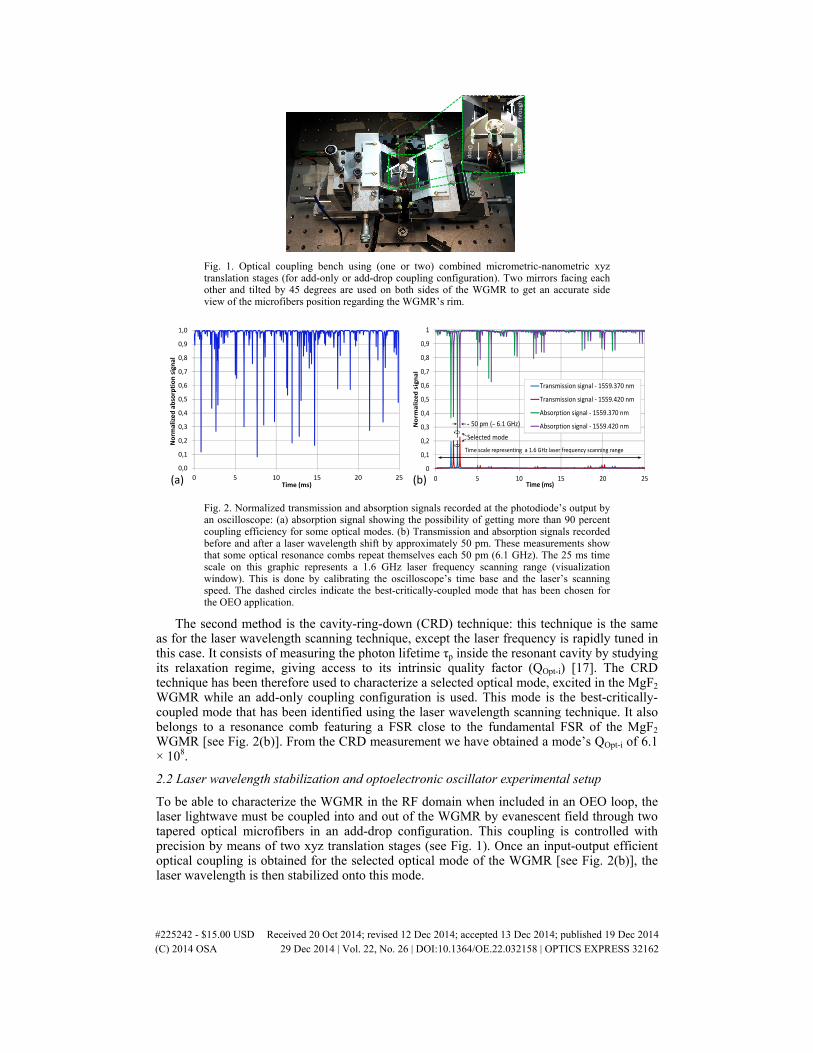
The first one is the laser wavelength scanning technique: this technique consists of a frequency fine-tuning of a narrow linewidth laser (Koheras fiber laser with sub-kHz linewidth) coupled to the WGMR in an add-only configuration via an optical microfiber. The microfiber is clamped on a combined micrometric-nanometric xyz translation stage (see Fig. 1). The coupling is therefore controlled with high precision. The laser is tunable on approximately a 130 GHz (~1nm) range thanks to a thermal control (tunability) or on a 2.2 GHz range thanks to a more accurate piezoelectric control. This method allows a good visualization of the WGMR’s different optical resonance combs (families) by recording the WGMR’s response on a photodiode followed by an oscilloscope. Indeed, multiple optical resonance combs are generated in WGMRs for both transverse electric (TE) and transverse magnetic (TM) modes because of the WGMRs’ tridimensional shapes. Figure 2(a) shows different resonance combs obtained in the MgF2 WGMR and it also shows that a coupling efficiency higher than 90 percent can be achieved for some optical modes by using the optical microfiber to couple the laser lightwave into the WGMR. Moreover, using this characterization technique, we can get an estimation of the FSRs of some optical combs. This is done by using both thermal and piezoelectric controls for the laser wavelength. We use the piezoelectric control to record the WGMR’s response over a 1.6 GHz laser frequency scanning range (visualization window). Afterwards, this visualization window is shifted to record the other combs of the WGMR by using the thermal control of the laser wavelength while monitoring the laser wavelength shift. Figure 2(b) presents the normalized transmission and absorption signals recorded at the photodiode’s output by an oscilloscope, before and after a laser wavelength shift by approximately 50 pm. These measurements show that, in given lightwave’s polarization and coupling states, some excited optical resonance combs repeat themselves each 50 pm (6.1 GHz) in our WGMR. Therefore, the FSRs of most of these combs are close to 6.1 GHz, thus close to the calculated fundamental FSR of the MgF2 WGMR (assuming a linear tunability of the laser wavelength). Also, one has to take into account the fact that, after all the fabrication steps, the WGMR’s diameter is slightly less than 12 millimeters leading to a higher FSR than the above calculated one.
Despite the aforementioned advantages of this method, it is still very limited to accurately characterize such high-Q optical resonators. Indeed, because of the thermal heat caused by the high intra-cavity circulating optical power, the optical resonances and the optical combs undergo frequency shifts. Therefore, it is particularly difficult to accurately measure the quality factor of a given optical resonance using this technique.
#225242 - $15.00 USD Received 20 Oct 2014; revised 12 Dec 2014; accepted 13 Dec 2014; published 19 Dec 2014 (C) 2014 OSA 29 Dec 2014 | Vol. 22, No. 26 | DOI:10.1364/OE.22.032158 | OPTICS EXPRESS 32161
Inpu
tTh
roug
h
Drop
Fig. 1. Optical coupling bench using (one or two) combined micrometric-nanometric xyz translation stages (for add-only or add-drop coupling configuration). Two mirrors facing each other and tilted by 45 degrees are used on both sides of the WGMR to get an accurate side view of the microfibers position regarding the WGMR’s rim.
Time scale representing a 1.6 GHz laser frequency scanning range
Selected mode
0,0
0,1
0,2
0,3
0,4
0,5
0,6
0,7
0,8
0,9
1,0
0 5 10 15 20 25
Nor
mal
ized
abso
rptio
n si
gnal
Time (ms)(a) (b)
Fig. 2. Normalized transmission and absorption signals recorded at the photodiode’s output by an oscilloscope: (a) absorption signal showing the possibility of getting more than 90 percent coupling efficiency for some optical modes. (b) Transmission and absorption signals recorded before and after a laser wavelength shift by approximately 50 pm. These measurements show that some optical resonance combs repeat themselves each 50 pm (6.1 GHz). The 25 ms time scale on this graphic represents a 1.6 GHz laser frequency scanning range (visualization window). This is done by calibrating the oscilloscope’s time base and the laser’s scanning speed. The dashed circles indicate the best-critically-coupled mode that has been chosen for the OEO application.
The second method is the cavity-ring-down (CRD) technique: this technique is the same as for the laser wavelength scanning technique, except the laser frequency is rapidly tuned in this case. It consists of measuring the photon lifetime τp inside the resonant cavity by studying its relaxation regime, giving access to its intrinsic quality factor (QOpt-i) [17]. The CRD technique has been therefore used to characterize a selected optical mode, excited in the MgF2 WGMR while an add-only coupling configuration is used. This mode is the best-critically-coupled mode that has been identified using the laser wavelength scanning technique. It also belongs to a resonance comb featuring a FSR close to the fundamental FSR of the MgF2 WGMR [see Fig. 2(b)]. From the CRD measurement we have obtained a mode’s QOpt-i of 6.1 × 10⁸.
2.2 Laser wavelength stabilization and optoelectronic oscillator experimental setup
To be able to characterize the WGMR in the RF domain when included in an OEO loop, the laser lightwave must be coupled into and out of the WGMR by evanescent field through two tapered optical microfibers in an add-drop configuration. This coupling is controlled with precision by means of two xyz translation stages (see Fig. 1). Once an input-output efficient optical coupling is obtained for the selected optical mode of the WGMR [see Fig. 2(b)], the laser wavelength is then stabilized onto this mode.
#225242 - $15.00 USD Received 20 Oct 2014; revised 12 Dec 2014; accepted 13 Dec 2014; published 19 Dec 2014 (C) 2014 OSA 29 Dec 2014 | Vol. 22, No. 26 | DOI:10.1364/OE.22.032158 | OPTICS EXPRESS 32162
Laser EOM
Signalgenerator
(fG)
PID ARF amplifier
LPF(fc ~ 2fG)
RF mixer
DC
MZM
ϕRFcharacterization
Opticalcharacterization
Phase shifter
RF
Laserpiezoelectric driver
LPFScope
WGMR
ARF amplifier
RF coupler
Vector Network Analyzer
RF switch:║OEO═ RF spectroscopy
Port 1
Port 2
High voltage amplifier
PD2
PD1
A
DL
Backscattered signalcharacterization
PC
WGMR
Add-drop coupling
Fig. 3. PDH loop (in blue) combined to the OEO experimental setup. In red: optical path; in green: RF path; EOM: electro optic modulator; MZM: Mach Zehnder modulator; DL: 4km long delay line; PC: polarization controller; PD1: fast photodiode; PD2: slow photodiode; LPF: low pass filter.
The laser wavelength stabilization is achieved by means of a PDH laser stabilization technique which has been optimized for laser-WGMR stabilization and specifically for the selected optical mode. The architecture of the PDH stabilization loop is shown (in blue) in Fig. 3, where it has been combined to the OEO experimental setup. Details on this laser stabilization technique can be found in [18].
In the case of a WGMR based OEO, it is noteworthy that the noise performance is not only dependent on the WGMR’s QOpt-i. Indeed, many optical and microwave elements in the OEO setup have to be thoroughly studied and optimized in order to fully benefit from the WGMR’s high QOpt-i: the laser-WGMR optimal coupling in order to obtain a high loaded QOpt (QOpt-WGMR), the laser stabilization onto the selected optical mode, the WGMR’s nonlinearity and its thermal stability, the photodiode’s noise and its nonlinearity, and finally the noise in the active and passive components of the oscillator [10].
In this work, we have focused our studies on the laser lightwave optimal coupling and the laser stabilization onto the selected optical mode in the WGMR. Indeed, beside its suitable FSR (around 6 GHz in our case), the optical mode has to feature a low insertion loss and a high QOpt-WGMR at the same time. The high QOpt-WGMR will increase the stability of the OEO but having a low insertion loss is also important in an OEO setup [19]. This is crucial in order to reduce the noise-to-carrier ratio (NCR) of the OEO’s optoelectronic loop including the WGMR. In our case, a 6 dB insertion loss has been measured when the laser wavelength was stabilized onto the center of the selected optical mode.
2.3 WGMR characterization in the microwave frequency domain
After its characterization in the optical domain, it is important to characterize the WGMR in the microwave frequency domain in a configuration which is as close as possible to the OEO setup. Therefore, the microwave test bench configuration that has been developed in our laboratory is the same as the one dedicated to the final OEO setup (see Fig. 3). The only difference here is that we have introduced a vector network analyzer (VNA) inside the OEO’s optoelectronic loop just before the Mach Zehnder modulator (MZM). This is done in order to measure the magnitude and phase of the S21 transmission coefficient of the optical stability element when it is included inside the OEO’s optoelectronic loop [20]. The VNA used in our experiments is an ANRITSU 37369A with 1 kHz frequency resolution. A four ports RF switch is also used to allow us to easily choose between the S21 transmission coefficient measurement configuration and the OEO oscillation configuration.
In the S21 transmission coefficient measurement configuration, a scanning RF signal comes out from port 1 of the VNA, feeds the MZM and linearly modulates the laser carrier. In the case of a WGMR, a given optical resonance comb can then be fully characterized as the laser carrier is locked onto the center of one of its optical modes while the modulation sidebands are scanning the other modes of this resonance comb.
#225242 - $15.00 USD Received 20 Oct 2014; revised 12 Dec 2014; accepted 13 Dec 2014; published 19 Dec 2014 (C) 2014 OSA 29 Dec 2014 | Vol. 22, No. 26 | DOI:10.1364/OE.22.032158 | OPTICS EXPRESS 32163
Fig. 4. S21 transmission coefficient’s magnitude measurements performed on the MgF2 WGMR for different bandwidths and resolutions, after VNA calibration and OEO optoelectronic loop’s gain adjustment: (a) large scan bandwidth measurement and (b) a focus on the mode at 6.07 GHz from the laser carrier.
The modulation sidebands are finally recovered with the optical carrier on a fast photodiode and analyzed with high precision on port 2 of the VNA by measuring the S21 coefficient’s magnitude and phase for the optical resonance comb under-test. It is noteworthy that the measurement precision here depends on the laser linewidth, the MZM characteristics (linearity) and the VNA resolution. Also, the measurement bandwidth is related to the bandwidth of the OEO’s optoelectronic loop. In our case, it lies between 6 and 12 GHz. This bandwidth is however suitable for our experiments, when one considers the FSR of the optical resonance comb under-test of the MgF2 WGMR [FSR ≈6.1 GHz; see Fig. 2(b)].
Figure 4 shows the S21 coefficient’s magnitude measurement performed on the MgF2 disk for different scanning bandwidths and resolutions. A focus on a given optical mode gives the information on its full width at half maximum (FWHM) and therefore on its loaded optical Q. On the other hand, this QOpt-WGMR has an equivalent loaded microwave Q (QRF-WGMR) in the microwave domain. This is because the FWHM of the optical resonance is preserved in the microwave domain. Therefore, the QRF-WGMR is linked to QOpt-WGMR by the following relation:
RFRF WGMR Opt WGMR
Opt
fQ Q
f− −= × (2)
where fOpt is the laser frequency (fOpt ≈192 THz in our case). From the above relation, we can see that the equivalent QRF of an optical resonator is
directly proportional to the microwave application frequency fRF. Unlike microwave resonators, this relations shows that higher equivalent QRF of an optical resonator can be obtained at higher application frequencies. This therefore confirms the great advantage of the use of optical stability elements versus microwave resonators.
In Fig. 4(a), the large scan bandwidth measurement, limited by the OEO’s optoelectronic loop bandwidth, shows numerous optical modes related to the different optical resonance families generated in this WGMR. Two modes, at 6.07 GHz from the laser carrier and its multiple at 12.14 GHz, are particularly interesting. These two optical modes seem to belong to the same optical resonance comb. A focus on the optical mode at 6.07 GHz [Fig. 4(b)] gives a FWHM of 1.15 MHz and therefore a WGMR’s QOpt-WGMR of 1.68 × 10⁸ and a QRF-
WGMR of 0.53 × 10⁴ following Eq. (2). This analysis also shows that the worst-case sideband rejection of this optical mode regarding its selectivity as a band-pass optical filter is equal to 23 dB. The difference between QOpt-i and QOpt-WGMR, i.e. the QOpt-i degradation by about 4 times, is caused by the add-drop coupling and therefore by the fact that the WGMR is loaded and no more isolated.
#225242 - $15.00 USD Received 20 Oct 2014; revised 12 Dec 2014; accepted 13 Dec 2014; published 19 Dec 2014 (C) 2014 OSA 29 Dec 2014 | Vol. 22, No. 26 | DOI:10.1364/OE.22.032158 | OPTICS EXPRESS 32164
-200
-150
-100
-50
0
50
100
150
200
6.061 6.063 6.065 6.067 6.069 6.071 6.073 6.075
S 21
phas
e (°
)
Frequency (GHz)
Span=14 MHzStep= 6.25 kHz
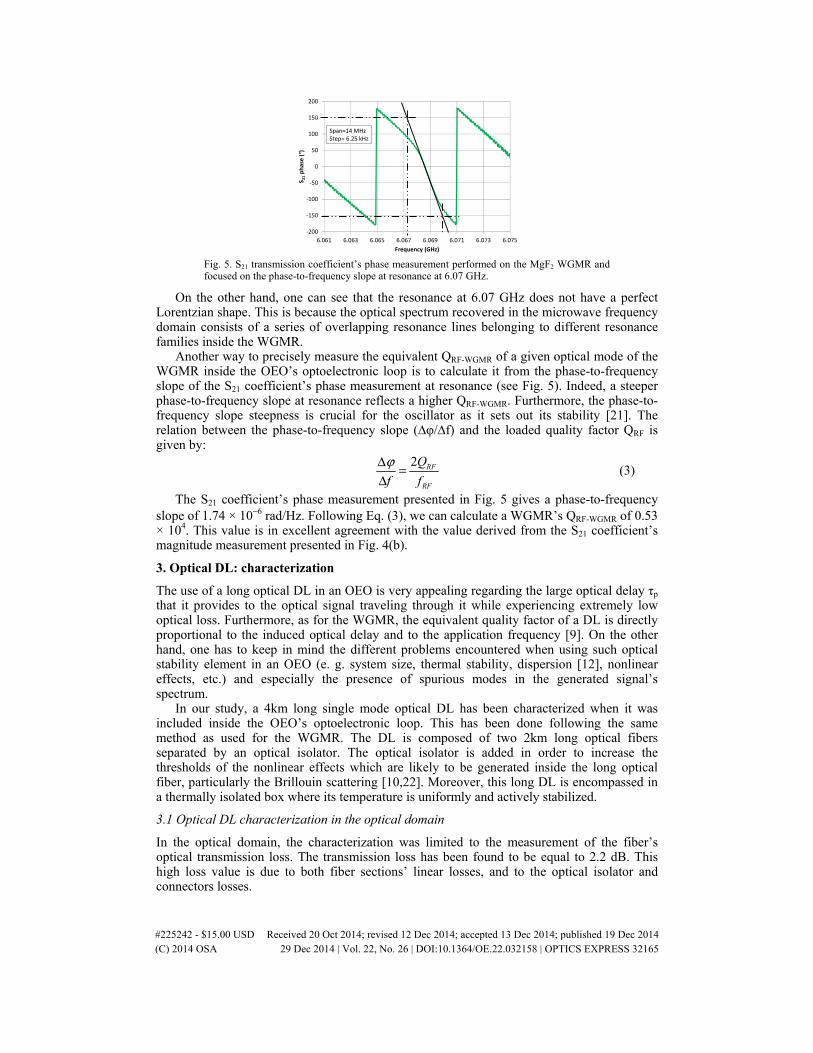
Fig. 5. S21 transmission coefficient’s phase measurement performed on the MgF2 WGMR and focused on the phase-to-frequency slope at resonance at 6.07 GHz.
On the other hand, one can see that the resonance at 6.07 GHz does not have a perfect Lorentzian shape. This is because the optical spectrum recovered in the microwave frequency domain consists of a series of overlapping resonance lines belonging to different resonance families inside the WGMR.
Another way to precisely measure the equivalent QRF-WGMR of a given optical mode of the WGMR inside the OEO’s optoelectronic loop is to calculate it from the phase-to-frequency slope of the S21 coefficient’s phase measurement at resonance (see Fig. 5). Indeed, a steeper phase-to-frequency slope at resonance reflects a higher QRF-WGMR. Furthermore, the phase-to-frequency slope steepness is crucial for the oscillator as it sets out its stability [21]. The relation between the phase-to-frequency slope (∆φ/∆f) and the loaded quality factor QRF is given by:
2 RF
RF
Q
f f
ϕΔ =Δ
(3)
The S21 coefficient’s phase measurement presented in Fig. 5 gives a phase-to-frequency slope of 1.74 × 10⁻⁶ rad/Hz. Following Eq. (3), we can calculate a WGMR’s QRF-WGMR of 0.53 × 10⁴. This value is in excellent agreement with the value derived from the S21 coefficient’s magnitude measurement presented in Fig. 4(b).
3. Optical DL: characterization
The use of a long optical DL in an OEO is very appealing regarding the large optical delay τp that it provides to the optical signal traveling through it while experiencing extremely low optical loss. Furthermore, as for the WGMR, the equivalent quality factor of a DL is directly proportional to the induced optical delay and to the application frequency [9]. On the other hand, one has to keep in mind the different problems encountered when using such optical stability element in an OEO (e. g. system size, thermal stability, dispersion [12], nonlinear effects, etc.) and especially the presence of spurious modes in the generated signal’s spectrum.
In our study, a 4km long single mode optical DL has been characterized when it was included inside the OEO’s optoelectronic loop. This has been done following the same method as used for the WGMR. The DL is composed of two 2km long optical fibers separated by an optical isolator. The optical isolator is added in order to increase the thresholds of the nonlinear effects which are likely to be generated inside the long optical fiber, particularly the Brillouin scattering [10,22]. Moreover, this long DL is encompassed in a thermally isolated box where its temperature is uniformly and actively stabilized.
3.1 Optical DL characterization in the optical domain
In the optical domain, the characterization was limited to the measurement of the fiber’s optical transmission loss. The transmission loss has been found to be equal to 2.2 dB. This high loss value is due to both fiber sections’ linear losses, and to the optical isolator and connectors losses.
#225242 - $15.00 USD Received 20 Oct 2014; revised 12 Dec 2014; accepted 13 Dec 2014; published 19 Dec 2014 (C) 2014 OSA 29 Dec 2014 | Vol. 22, No. 26 | DOI:10.1364/OE.22.032158 | OPTICS EXPRESS 32165
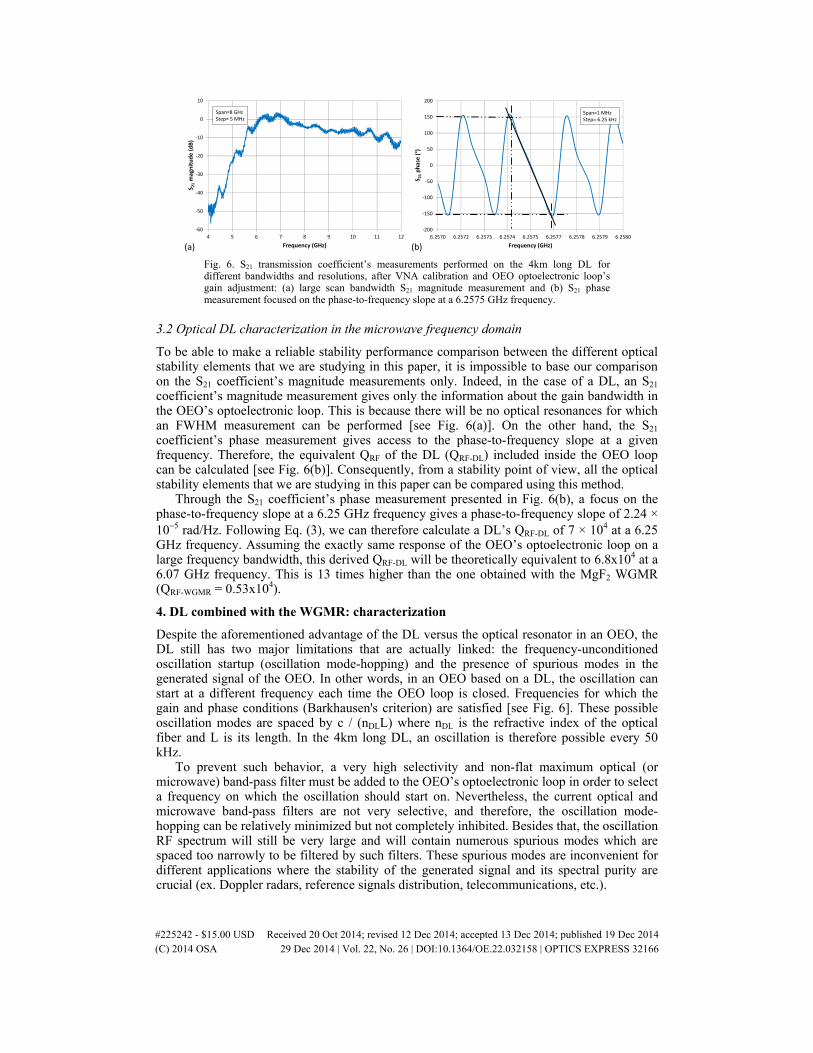
Fig. 6. S21 transmission coefficient’s measurements performed on the 4km long DL for different bandwidths and resolutions, after VNA calibration and OEO optoelectronic loop’s gain adjustment: (a) large scan bandwidth S21 magnitude measurement and (b) S21 phase measurement focused on the phase-to-frequency slope at a 6.2575 GHz frequency.
3.2 Optical DL characterization in the microwave frequency domain
To be able to make a reliable stability performance comparison between the different optical stability elements that we are studying in this paper, it is impossible to base our comparison on the S21 coefficient’s magnitude measurements only. Indeed, in the case of a DL, an S21 coefficient’s magnitude measurement gives only the information about the gain bandwidth in the OEO’s optoelectronic loop. This is because there will be no optical resonances for which an FWHM measurement can be performed [see Fig. 6(a)]. On the other hand, the S21 coefficient’s phase measurement gives access to the phase-to-frequency slope at a given frequency. Therefore, the equivalent QRF of the DL (QRF-DL) included inside the OEO loop can be calculated [see Fig. 6(b)]. Consequently, from a stability point of view, all the optical stability elements that we are studying in this paper can be compared using this method.
Through the S21 coefficient’s phase measurement presented in Fig. 6(b), a focus on the phase-to-frequency slope at a 6.25 GHz frequency gives a phase-to-frequency slope of 2.24 × 10⁻⁵ rad/Hz. Following Eq. (3), we can therefore calculate a DL’s QRF-DL of 7 × 10⁴ at a 6.25 GHz frequency. Assuming the exactly same response of the OEO’s optoelectronic loop on a large frequency bandwidth, this derived QRF-DL will be theoretically equivalent to 6.8x10⁴ at a 6.07 GHz frequency. This is 13 times higher than the one obtained with the MgF2 WGMR (QRF-WGMR = 0.53x10⁴).
4. DL combined with the WGMR: characterization
Despite the aforementioned advantage of the DL versus the optical resonator in an OEO, the DL still has two major limitations that are actually linked: the frequency-unconditioned oscillation startup (oscillation mode-hopping) and the presence of spurious modes in the generated signal of the OEO. In other words, in an OEO based on a DL, the oscillation can start at a different frequency each time the OEO loop is closed. Frequencies for which the gain and phase conditions (Barkhausen's criterion) are satisfied [see Fig. 6]. These possible oscillation modes are spaced by c / (nDLL) where nDL is the refractive index of the optical fiber and L is its length. In the 4km long DL, an oscillation is therefore possible every 50 kHz.
To prevent such behavior, a very high selectivity and non-flat maximum optical (or microwave) band-pass filter must be added to the OEO’s optoelectronic loop in order to select a frequency on which the oscillation should start on. Nevertheless, the current optical and microwave band-pass filters are not very selective, and therefore, the oscillation mode-hopping can be relatively minimized but not completely inhibited. Besides that, the oscillation RF spectrum will still be very large and will contain numerous spurious modes which are spaced too narrowly to be filtered by such filters. These spurious modes are inconvenient for different applications where the stability of the generated signal and its spectral purity are crucial (ex. Doppler radars, reference signals distribution, telecommunications, etc.).
#225242 - $15.00 USD Received 20 Oct 2014; revised 12 Dec 2014; accepted 13 Dec 2014; published 19 Dec 2014 (C) 2014 OSA 29 Dec 2014 | Vol. 22, No. 26 | DOI:10.1364/OE.22.032158 | OPTICS EXPRESS 32166
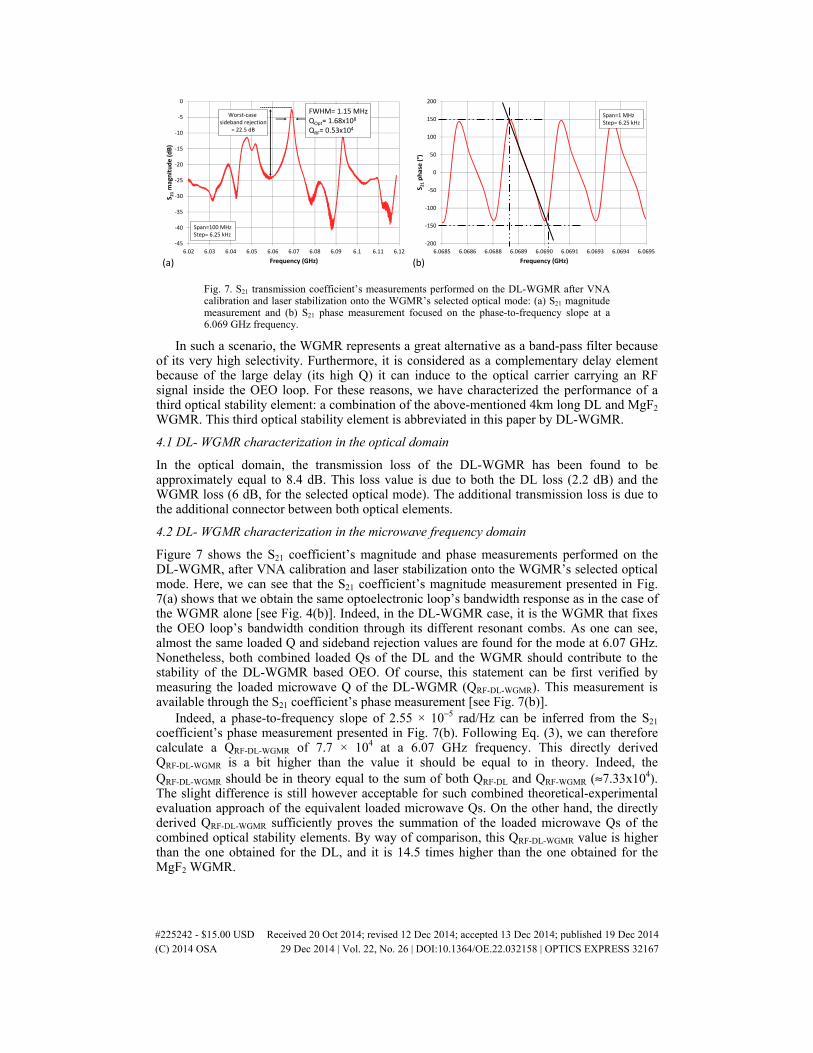
Fig. 7. S21 transmission coefficient’s measurements performed on the DL-WGMR after VNA calibration and laser stabilization onto the WGMR’s selected optical mode: (a) S21 magnitude measurement and (b) S21 phase measurement focused on the phase-to-frequency slope at a 6.069 GHz frequency.
In such a scenario, the WGMR represents a great alternative as a band-pass filter because of its very high selectivity. Furthermore, it is considered as a complementary delay element because of the large delay (its high Q) it can induce to the optical carrier carrying an RF signal inside the OEO loop. For these reasons, we have characterized the performance of a third optical stability element: a combination of the above-mentioned 4km long DL and MgF2 WGMR. This third optical stability element is abbreviated in this paper by DL-WGMR.
4.1 DL- WGMR characterization in the optical domain
In the optical domain, the transmission loss of the DL-WGMR has been found to be approximately equal to 8.4 dB. This loss value is due to both the DL loss (2.2 dB) and the WGMR loss (6 dB, for the selected optical mode). The additional transmission loss is due to the additional connector between both optical elements.
4.2 DL- WGMR characterization in the microwave frequency domain
Figure 7 shows the S21 coefficient’s magnitude and phase measurements performed on the DL-WGMR, after VNA calibration and laser stabilization onto the WGMR’s selected optical mode. Here, we can see that the S21 coefficient’s magnitude measurement presented in Fig. 7(a) shows that we obtain the same optoelectronic loop’s bandwidth response as in the case of the WGMR alone [see Fig. 4(b)]. Indeed, in the DL-WGMR case, it is the WGMR that fixes the OEO loop’s bandwidth condition through its different resonant combs. As one can see, almost the same loaded Q and sideband rejection values are found for the mode at 6.07 GHz. Nonetheless, both combined loaded Qs of the DL and the WGMR should contribute to the stability of the DL-WGMR based OEO. Of course, this statement can be first verified by measuring the loaded microwave Q of the DL-WGMR (QRF-DL-WGMR). This measurement is available through the S21 coefficient’s phase measurement [see Fig. 7(b)].
Indeed, a phase-to-frequency slope of 2.55 × 10⁻⁵ rad/Hz can be inferred from the S21 coefficient’s phase measurement presented in Fig. 7(b). Following Eq. (3), we can therefore calculate a QRF-DL-WGMR of 7.7 × 10⁴ at a 6.07 GHz frequency. This directly derived QRF-DL-WGMR is a bit higher than the value it should be equal to in theory. Indeed, the QRF-DL-WGMR should be in theory equal to the sum of both QRF-DL and QRF-WGMR (≈7.33x10⁴). The slight difference is still however acceptable for such combined theoretical-experimental evaluation approach of the equivalent loaded microwave Qs. On the other hand, the directly derived QRF-DL-WGMR sufficiently proves the summation of the loaded microwave Qs of the combined optical stability elements. By way of comparison, this QRF-DL-WGMR value is higher than the one obtained for the DL, and it is 14.5 times higher than the one obtained for the MgF2 WGMR.
#225242 - $15.00 USD Received 20 Oct 2014; revised 12 Dec 2014; accepted 13 Dec 2014; published 19 Dec 2014 (C) 2014 OSA 29 Dec 2014 | Vol. 22, No. 26 | DOI:10.1364/OE.22.032158 | OPTICS EXPRESS 32167
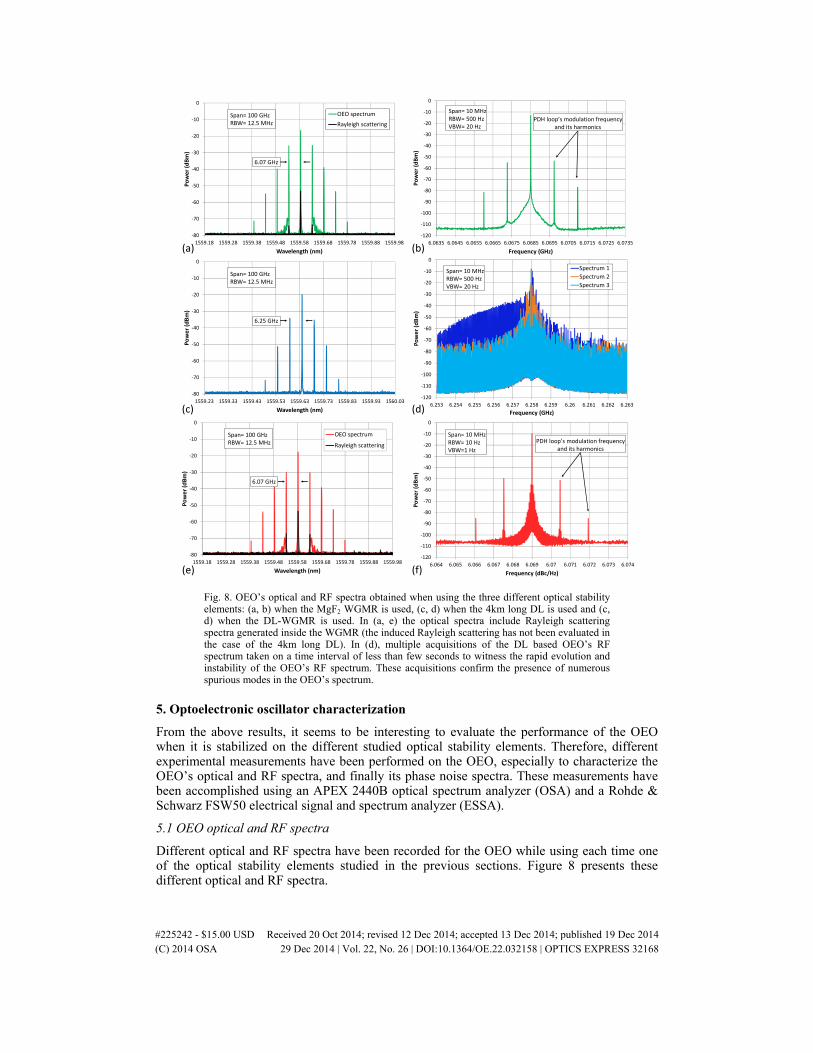
Fig. 8. OEO’s optical and RF spectra obtained when using the three different optical stability elements: (a, b) when the MgF2 WGMR is used, (c, d) when the 4km long DL is used and (c, d) when the DL-WGMR is used. In (a, e) the optical spectra include Rayleigh scattering spectra generated inside the WGMR (the induced Rayleigh scattering has not been evaluated in the case of the 4km long DL). In (d), multiple acquisitions of the DL based OEO’s RF spectrum taken on a time interval of less than few seconds to witness the rapid evolution and instability of the OEO’s RF spectrum. These acquisitions confirm the presence of numerous spurious modes in the OEO’s spectrum.
5. Optoelectronic oscillator characterization
From the above results, it seems to be interesting to evaluate the performance of the OEO when it is stabilized on the different studied optical stability elements. Therefore, different experimental measurements have been performed on the OEO, especially to characterize the OEO’s optical and RF spectra, and finally its phase noise spectra. These measurements have been accomplished using an APEX 2440B optical spectrum analyzer (OSA) and a Rohde & Schwarz FSW50 electrical signal and spectrum analyzer (ESSA).
5.1 OEO optical and RF spectra
Different optical and RF spectra have been recorded for the OEO while using each time one of the optical stability elements studied in the previous sections. Figure 8 presents these different optical and RF spectra.
#225242 - $15.00 USD Received 20 Oct 2014; revised 12 Dec 2014; accepted 13 Dec 2014; published 19 Dec 2014 (C) 2014 OSA 29 Dec 2014 | Vol. 22, No. 26 | DOI:10.1364/OE.22.032158 | OPTICS EXPRESS 32168
-120
-110
-100
-90
-80
-70
-60
-50
-40
-30
-20
-10
0
-5 -4 -3 -2 -1 0 1 2 3 4 5
Pow
er (d
Bm)
Offset frequency (MHz)
DL-OEODL-WGMR-OEOWGMR-OEO
Span= 10 MHzRBW≤ 500 HzVBW≤ 20 Hz
PDH loop’s modulationfrequency and its harmonics
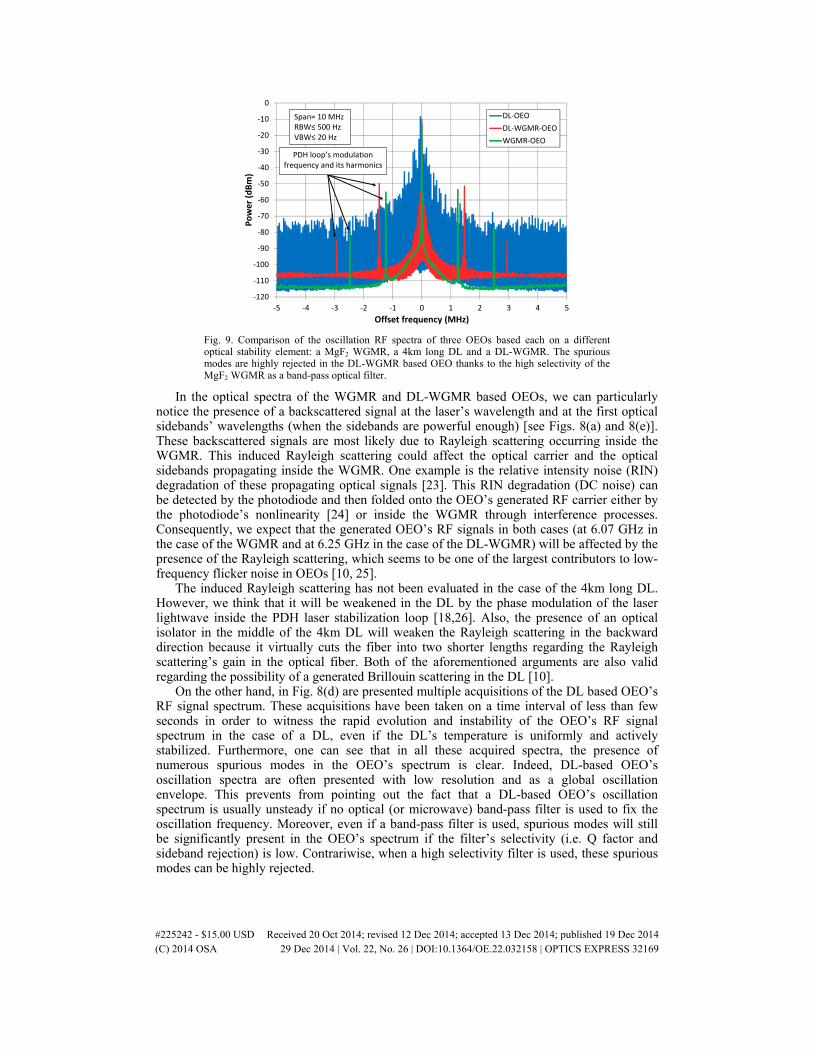
Fig. 9. Comparison of the oscillation RF spectra of three OEOs based each on a different optical stability element: a MgF2 WGMR, a 4km long DL and a DL-WGMR. The spurious modes are highly rejected in the DL-WGMR based OEO thanks to the high selectivity of the MgF2 WGMR as a band-pass optical filter.
In the optical spectra of the WGMR and DL-WGMR based OEOs, we can particularly notice the presence of a backscattered signal at the laser’s wavelength and at the first optical sidebands’ wavelengths (when the sidebands are powerful enough) [see Figs. 8(a) and 8(e)]. These backscattered signals are most likely due to Rayleigh scattering occurring inside the WGMR. This induced Rayleigh scattering could affect the optical carrier and the optical sidebands propagating inside the WGMR. One example is the relative intensity noise (RIN) degradation of these propagating optical signals [23]. This RIN degradation (DC noise) can be detected by the photodiode and then folded onto the OEO’s generated RF carrier either by the photodiode’s nonlinearity [24] or inside the WGMR through interference processes. Consequently, we expect that the generated OEO’s RF signals in both cases (at 6.07 GHz in the case of the WGMR and at 6.25 GHz in the case of the DL-WGMR) will be affected by the presence of the Rayleigh scattering, which seems to be one of the largest contributors to low-frequency flicker noise in OEOs [10, 25].
The induced Rayleigh scattering has not been evaluated in the case of the 4km long DL. However, we think that it will be weakened in the DL by the phase modulation of the laser lightwave inside the PDH laser stabilization loop [18,26]. Also, the presence of an optical isolator in the middle of the 4km DL will weaken the Rayleigh scattering in the backward direction because it virtually cuts the fiber into two shorter lengths regarding the Rayleigh scattering’s gain in the optical fiber. Both of the aforementioned arguments are also valid regarding the possibility of a generated Brillouin scattering in the DL [10].
On the other hand, in Fig. 8(d) are presented multiple acquisitions of the DL based OEO’s RF signal spectrum. These acquisitions have been taken on a time interval of less than few seconds in order to witness the rapid evolution and instability of the OEO’s RF signal spectrum in the case of a DL, even if the DL’s temperature is uniformly and actively stabilized. Furthermore, one can see that in all these acquired spectra, the presence of numerous spurious modes in the OEO’s spectrum is clear. Indeed, DL-based OEO’s oscillation spectra are often presented with low resolution and as a global oscillation envelope. This prevents from pointing out the fact that a DL-based OEO’s oscillation spectrum is usually unsteady if no optical (or microwave) band-pass filter is used to fix the oscillation frequency. Moreover, even if a band-pass filter is used, spurious modes will still be significantly present in the OEO’s spectrum if the filter’s selectivity (i.e. Q factor and sideband rejection) is low. Contrariwise, when a high selectivity filter is used, these spurious modes can be highly rejected.
#225242 - $15.00 USD Received 20 Oct 2014; revised 12 Dec 2014; accepted 13 Dec 2014; published 19 Dec 2014 (C) 2014 OSA 29 Dec 2014 | Vol. 22, No. 26 | DOI:10.1364/OE.22.032158 | OPTICS EXPRESS 32169
-140
-130
-120
-110
-100
-90
-80
-70
-60
-50
-40
-30
-20
-10
0
1000 10000 100000 1000000 10000000 100000000
Phas
e no
ise
(dBc
/Hz)
Offset frequency (Hz)
WGMR-OEO (measured phase noise)
WGMR-OEO (calculated WFN contribution)
DL-OEO (measured phase noise)
DL-OEO (calculated WFN contribution)
DL-WGMR-OEO (measured phase noise)
DL-WGMR-OEO (calculated WFN contribution)
PDH loop’s modulationfrequency and its harmonics
F=6.25 GHz
F=6.07 GHz
F=6.07 GHz
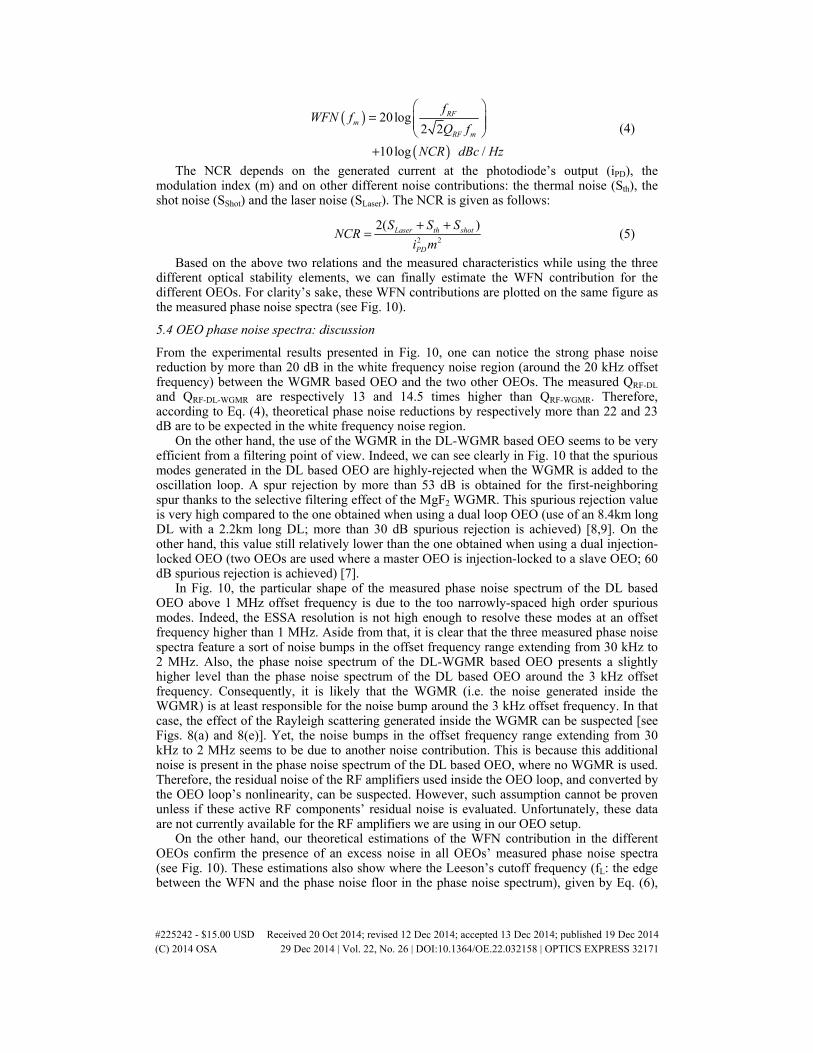
Fig. 10. Comparison of the oscillation phase noise spectra of three OEOs based each on a different optical stability element: a MgF2 WGMR, a 4km long DL and a 4km long DL combined with a MgF2 WGMR. The spurious modes are highly rejected in the DL-WGMR based OEO thanks to the high selectivity of the MgF2 WGMR as a band-pass optical filter.
An example on the high selectivity filter case is presented in Fig. 8(f) where the MgF2 WGMR has been used as both delay and filtering element in the OEO based on the DL-WGMR. For more clarity, a comparison is given in Fig. 9 for the different OEO’s RF spectra obtained when using the three different optical stability elements studied in this article.
5.2 OEO phase noise spectra: measurement
Besides the characterization of the optical and RF spectra of the different OEOs, the phase noise is the most important parameter to be characterized and considered in order to evaluate the short term stability of an oscillator. Consequently, different phase noise spectra have been recorded for the OEO while using each time one of the studied optical stability elements. These measurements are depicted in Fig. 10.
The presented phase noise measurements give the single sideband phase noise levels, at 10 kHz offset frequency from the different generated carriers, as follows: below −97 dBc/Hz for the 6.07 GHz carrier generated by the WGMR based OEO and below −124 dBc/Hz for both the 6.25 GHz carrier generated by the DL based OEO and the 6.07 GHz carrier generated by the DL-WGMR based OEO.
In order to get a theoretical estimation of the achievable phase noise levels in the OEO while using the different optical stability elements, the various noise contributions to the phase noise must be computed, particularly the flicker (1/f) noise and the white frequency noise (WFN). In this paper, the WFN contribution inside the OEO loop has been computed using Leeson’s approach [19, 21]. The details on this approach can be found in [27]. This computation only takes into account the offset frequency range on which the phase noise is dominated by the WFN and the noise floor. Therefore, the flicker noise contribution, which is mainly due to the active elements inside the OEO loop, is excluded from this model. In order to get an accurate estimation of the phase noise, RF amplifiers’ residual phase noise must be particularly measured and then included in the model [27]. Other interesting noise modeling approaches for OEOs can also be found in the literature [28–30].
The WFN contribution depends on the microwave application frequency fRF, the offset frequency from the carrier (fm), the loaded QRF of the stability element and the noise-to-carrier ratio NCR. It is given by the following relation:
#225242 - $15.00 USD Received 20 Oct 2014; revised 12 Dec 2014; accepted 13 Dec 2014; published 19 Dec 2014 (C) 2014 OSA 29 Dec 2014 | Vol. 22, No. 26 | DOI:10.1364/OE.22.032158 | OPTICS EXPRESS 32170
( )
( )
20log2 2
10log /
RFm
RF m
fWFN f
Q f
NCR dBc Hz
=
+
(4)
The NCR depends on the generated current at the photodiode’s output (iPD), the modulation index (m) and on other different noise contributions: the thermal noise (Sth), the shot noise (SShot) and the laser noise (SLaser). The NCR is given as follows:
2 2
2( )Laser th shot
PD
S S SNCR
i m
+ += (5)
Based on the above two relations and the measured characteristics while using the three different optical stability elements, we can finally estimate the WFN contribution for the different OEOs. For clarity’s sake, these WFN contributions are plotted on the same figure as the measured phase noise spectra (see Fig. 10).
5.4 OEO phase noise spectra: discussion
From the experimental results presented in Fig. 10, one can notice the strong phase noise reduction by more than 20 dB in the white frequency noise region (around the 20 kHz offset frequency) between the WGMR based OEO and the two other OEOs. The measured QRF-DL and QRF-DL-WGMR are respectively 13 and 14.5 times higher than QRF-WGMR. Therefore, according to Eq. (4), theoretical phase noise reductions by respectively more than 22 and 23 dB are to be expected in the white frequency noise region.
On the other hand, the use of the WGMR in the DL-WGMR based OEO seems to be very efficient from a filtering point of view. Indeed, we can see clearly in Fig. 10 that the spurious modes generated in the DL based OEO are highly-rejected when the WGMR is added to the oscillation loop. A spur rejection by more than 53 dB is obtained for the first-neighboring spur thanks to the selective filtering effect of the MgF2 WGMR. This spurious rejection value is very high compared to the one obtained when using a dual loop OEO (use of an 8.4km long DL with a 2.2km long DL; more than 30 dB spurious rejection is achieved) [8,9]. On the other hand, this value still relatively lower than the one obtained when using a dual injection-locked OEO (two OEOs are used where a master OEO is injection-locked to a slave OEO; 60 dB spurious rejection is achieved) [7].
In Fig. 10, the particular shape of the measured phase noise spectrum of the DL based OEO above 1 MHz offset frequency is due to the too narrowly-spaced high order spurious modes. Indeed, the ESSA resolution is not high enough to resolve these modes at an offset frequency higher than 1 MHz. Aside from that, it is clear that the three measured phase noise spectra feature a sort of noise bumps in the offset frequency range extending from 30 kHz to 2 MHz. Also, the phase noise spectrum of the DL-WGMR based OEO presents a slightly higher level than the phase noise spectrum of the DL based OEO around the 3 kHz offset frequency. Consequently, it is likely that the WGMR (i.e. the noise generated inside the WGMR) is at least responsible for the noise bump around the 3 kHz offset frequency. In that case, the effect of the Rayleigh scattering generated inside the WGMR can be suspected [see Figs. 8(a) and 8(e)]. Yet, the noise bumps in the offset frequency range extending from 30 kHz to 2 MHz seems to be due to another noise contribution. This is because this additional noise is present in the phase noise spectrum of the DL based OEO, where no WGMR is used. Therefore, the residual noise of the RF amplifiers used inside the OEO loop, and converted by the OEO loop’s nonlinearity, can be suspected. However, such assumption cannot be proven unless if these active RF components’ residual noise is evaluated. Unfortunately, these data are not currently available for the RF amplifiers we are using in our OEO setup.
On the other hand, our theoretical estimations of the WFN contribution in the different OEOs confirm the presence of an excess noise in all OEOs’ measured phase noise spectra (see Fig. 10). These estimations also show where the Leeson’s cutoff frequency (fL: the edge between the WFN and the phase noise floor in the phase noise spectrum), given by Eq. (6),
#225242 - $15.00 USD Received 20 Oct 2014; revised 12 Dec 2014; accepted 13 Dec 2014; published 19 Dec 2014 (C) 2014 OSA 29 Dec 2014 | Vol. 22, No. 26 | DOI:10.1364/OE.22.032158 | OPTICS EXPRESS 32171
should theoretically figure in the different measured phase noise spectra. Depending on the different measured equivalent loaded microwave Qs of the three stability elements, fL should figure at 570 kHz for the WGMR based OEO, 44 kHz for the DL based OEO and 39 kHz for the DL-WGMR based OEO.
2
RFL
RF
ff
Q= (6)
Here, it is noteworthy that while the QRF-DL-WGMR is higher than the QRF-DL, which is also higher than the QRF-WGMR, the NCRDL-WGMR is however higher than the NCRWGMR, which is also higher than the NCRDL (NCRDL-WGMR, NCRWGMR and NCRDL are respectively the OEO loop’s NCRs obtained when the DL-WGMR, the WGMR and the DL are used). These NCRs’ values are related to the different transmission losses’ values obtained in the different studied cases. They therefore explain the difference in the diverse estimated WFN contributions [19].
Finally, one can expect much better phase noise results for the different OEOs if the different optical and RF additive and multiplicative noise contributions are identified and lowered, especially those related to the RF amplifiers used in the optoelectronic loop. From our theoretical estimations (see Fig. 10), the reduction in the phase noise at a 125 kHz offset frequency from the RF carrier (spurious modes excluded) can be as high as: 12 dB for the WGMR based OEO, 15 dB for the DL based OEO and 13 dB for the DL-WGMR based OEO. In addition, it is noteworthy that our different experimental studies were performed on a laboratory OEO setup which is exposed to external thermal and mechanical perturbations in the experimentation room. Moreover, besides the fact that the identification and reduction of the different optical and RF noise contributions in the WGMR based OEO and the DL-WGMR based OEO should lead to reduce their phase noise levels, further optimization of the laser-WGMR add-drop light coupling configuration could also lead to an improvement in QOpt-WGMR and therefore to a higher QRF-WGMR and QRF-DL-WGMR. As a result, a further reduction in the phase noise of an OEO completely (or partially) based on a WGMR can be expected.
6. Summary
The performance of an optoelectronic oscillator based on different optical stability elements has been investigated. These stability elements are: a magnesium fluoride whispering gallery mode resonator (MgF2 WGMR), a 4km long optical delay-line and a combination of both optical stability elements. The WGMR features an intrinsic quality factor of 6.1 × 10⁸ and a loaded optical quality factor of 1.68 × 10⁸. This relatively low difference is obtained thanks to a relatively optimized laser-WGMR add-drop lightwave coupling configuration. In order to compare the performance of the different stability elements once they are used to stabilize the optoelectronic oscillator, their microwave equivalent loaded quality factors have been measured by including a vector network analyzer into the oscillator loop. Besides its use as a stability element, the high selectivity of the WGMR as a band-pass filter has led us to reduce the spurious modes generated in a delay-line based oscillator by more than 53 dB for the first-neighboring spur. Finally, the obtained phase noise results for the three oscillators have been found to be higher that what we can expect theoretically regarding their high microwave equivalent loaded quality factors. This is probably due to different, yet unidentified, optical and RF noise contributions. Moreover, further optimization of the laser-WGMR add-drop light coupling configuration could also lead to an improvement in the resonator’s loaded optical quality factor and therefore to a further reduction in the phase noise of an OEO completely (or partially) based on a WGMR.
Acknowledgments
This work has received financial support from the European Research Council through the projects NextPhase and Versyt, from the Centre National d’Etudes Spatiales (CNES) through the project SHYRO, from the French National Research Agency (ANR) through the grant
#225242 - $15.00 USD Received 20 Oct 2014; revised 12 Dec 2014; accepted 13 Dec 2014; published 19 Dec 2014 (C) 2014 OSA 29 Dec 2014 | Vol. 22, No. 26 | DOI:10.1364/OE.22.032158 | OPTICS EXPRESS 32172
“ANR 2010 BLAN 0312”, from the Région de Franche-Comté, and from the Labex ACTION.
#225242 - $15.00 USD Received 20 Oct 2014; revised 12 Dec 2014; accepted 13 Dec 2014; published 19 Dec 2014 (C) 2014 OSA 29 Dec 2014 | Vol. 22, No. 26 | DOI:10.1364/OE.22.032158 | OPTICS EXPRESS 32173