Center for Economic Forecasting and Analysis Florida State University 3200 Commonwealth Blvd. Suite 137 Tallahassee, Florida 32303-2770 Final Report Phase Two: The Economic Impact of Aerospace in Florida -Florida Aerospace Inventory and Economic Analysis Prepared for: Space Florida PO Box 656 Cape Canaveral, FL. 32920 321-730-5301 Phone http://www.spaceflorida.gov/ Prepared by: Center for Economic Forecasting and Analysis, The Florida State University 3200 Commonwealth Blvd. Tallahassee, FL. 32303-2770 850-644-7357 http://www.cefa.fsu.edu March 31, 2012
Transcript
Center for Economic Forecasting and Analysis Florida State University
3200 Commonwealth Blvd. Suite 137 Tallahassee, Florida 32303-2770
Final Report
Phase Two: The Economic Impact of Aerospace in
Florida
-Florida Aerospace Inventory and Economic Analysis
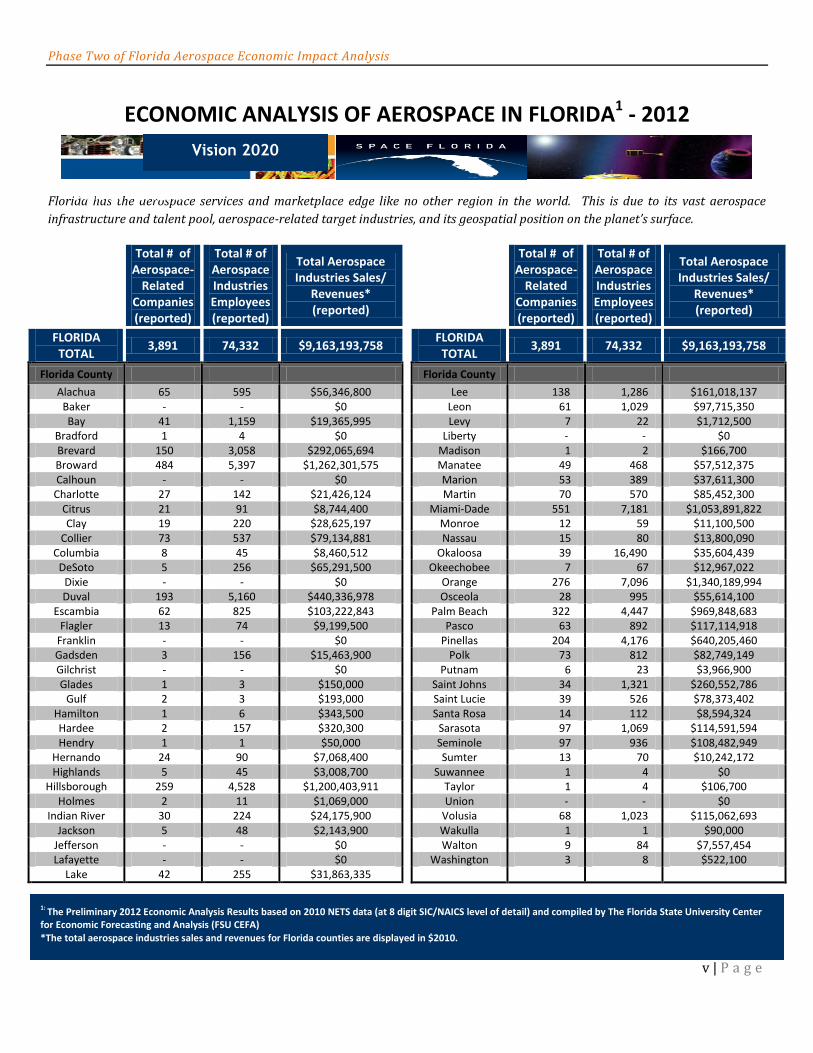
1: The Preliminary 2012 Economic Analysis Results based on 2010 NETS data (at 8 digit SIC/NAICS level of detail) and compiled by The Florida State University Center for Economic Forecasting and Analysis (FSU CEFA) *The total aerospace industries sales and revenues for Florida counties are displayed in $2010.
Phase Two of Florida Aerospace Economic Impact Analysis
Table of Contents
AUTHORS ................................................................................................................................................... I
ACKNOWLEDGEMENTS ........................................................................................................................ II
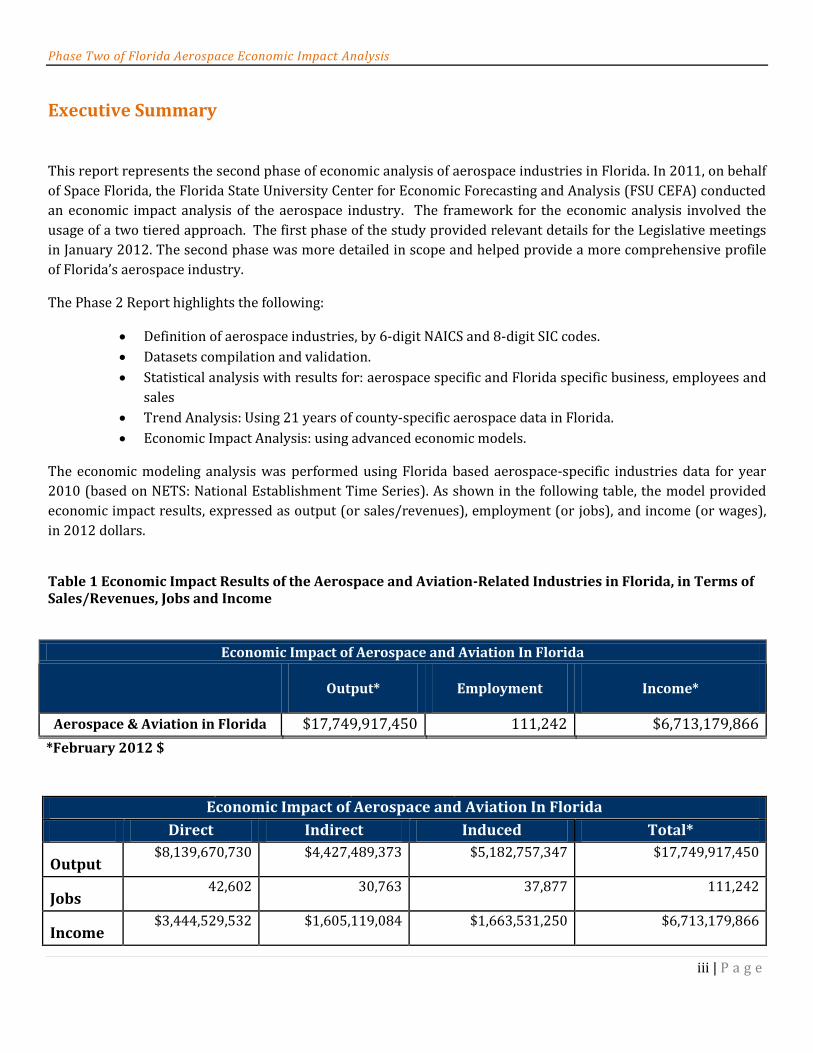
EXECUTIVE SUMMARY ....................................................................................................................... III
KEY FINDINGS ........................................................................................................................................ IV
TABLE OF CONTENTS .......................................................................................................................... VI
LIST OF TABLES .................................................................................................................................. VIII
LIST OF FIGURES ................................................................................................................................... IX
I. INTRODUCTION .................................................................................................................................. 1
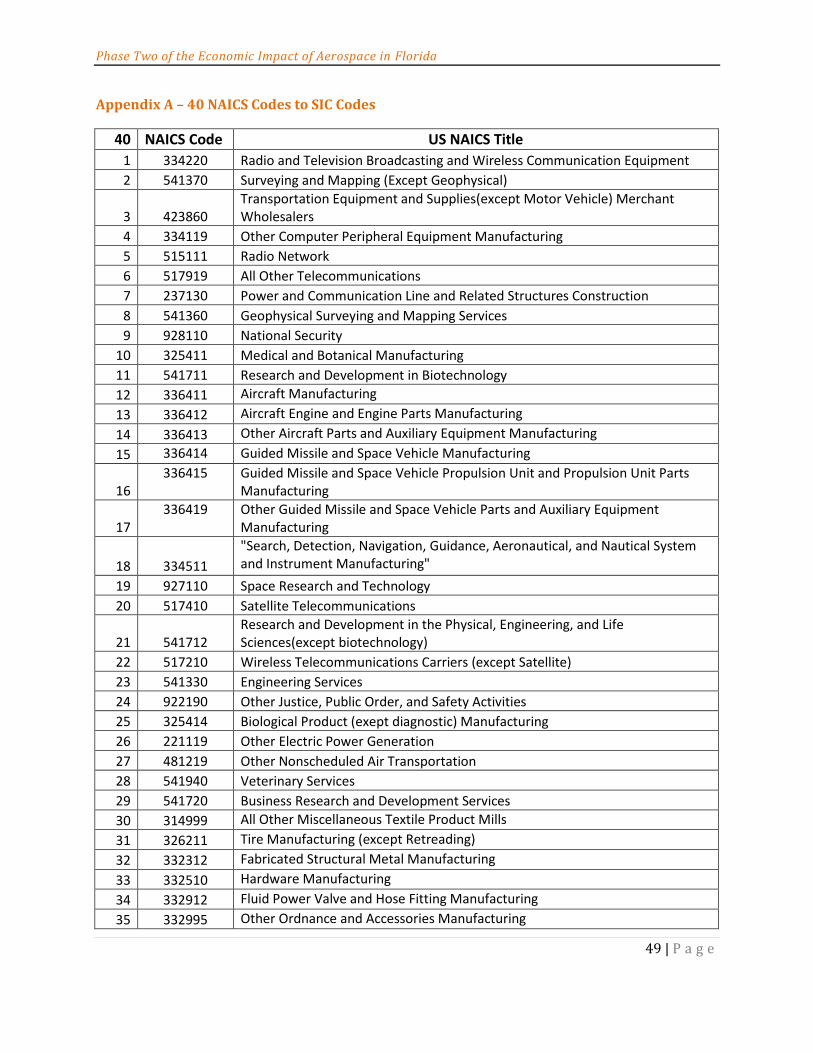
APPENDIX A – 40 NAICS CODES TO SIC CODES .......................................................................... 49
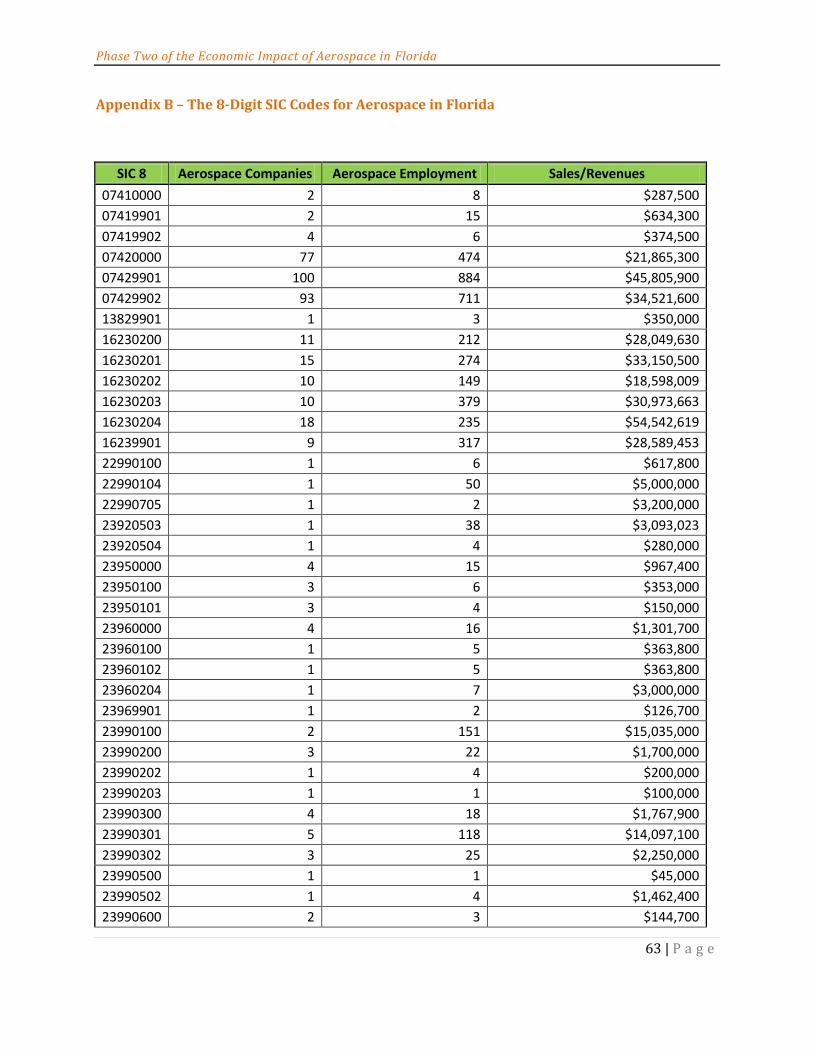
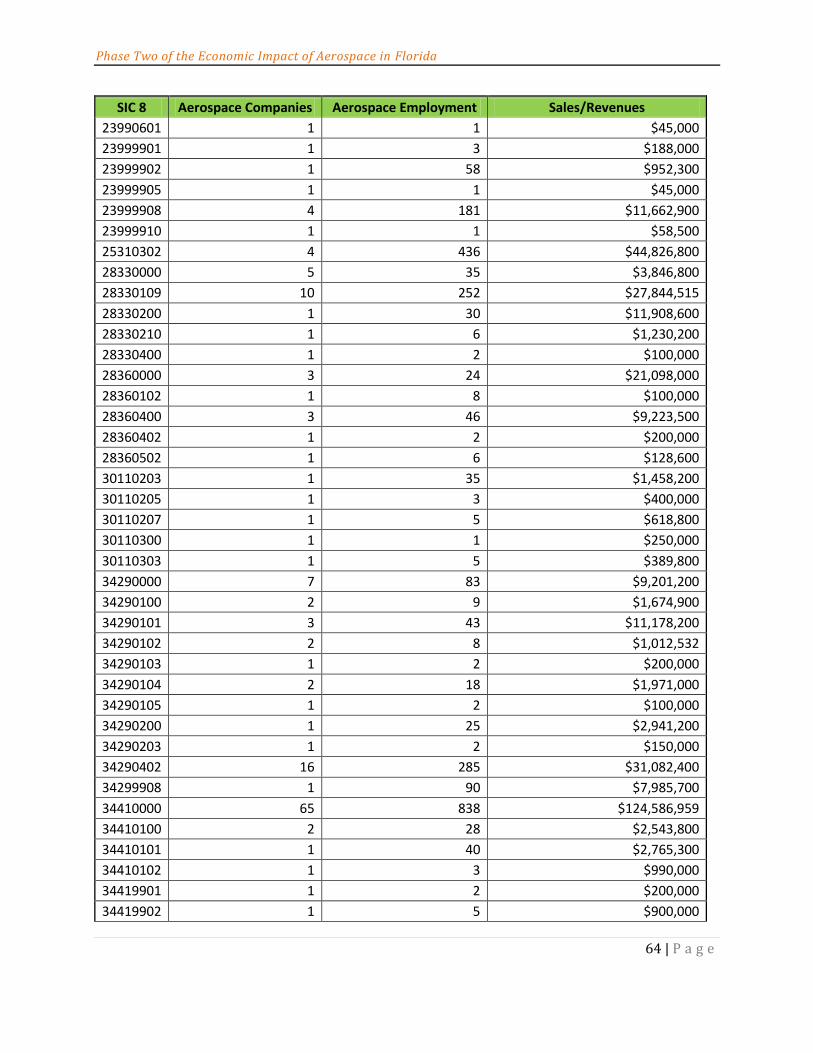
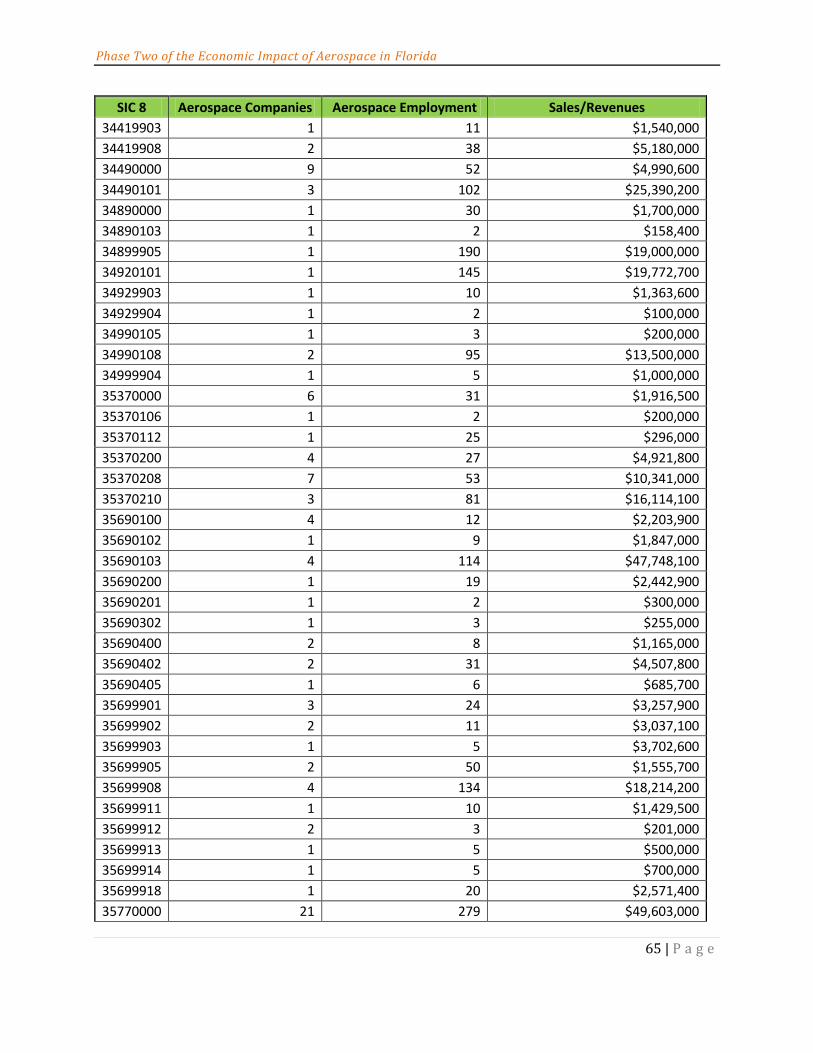
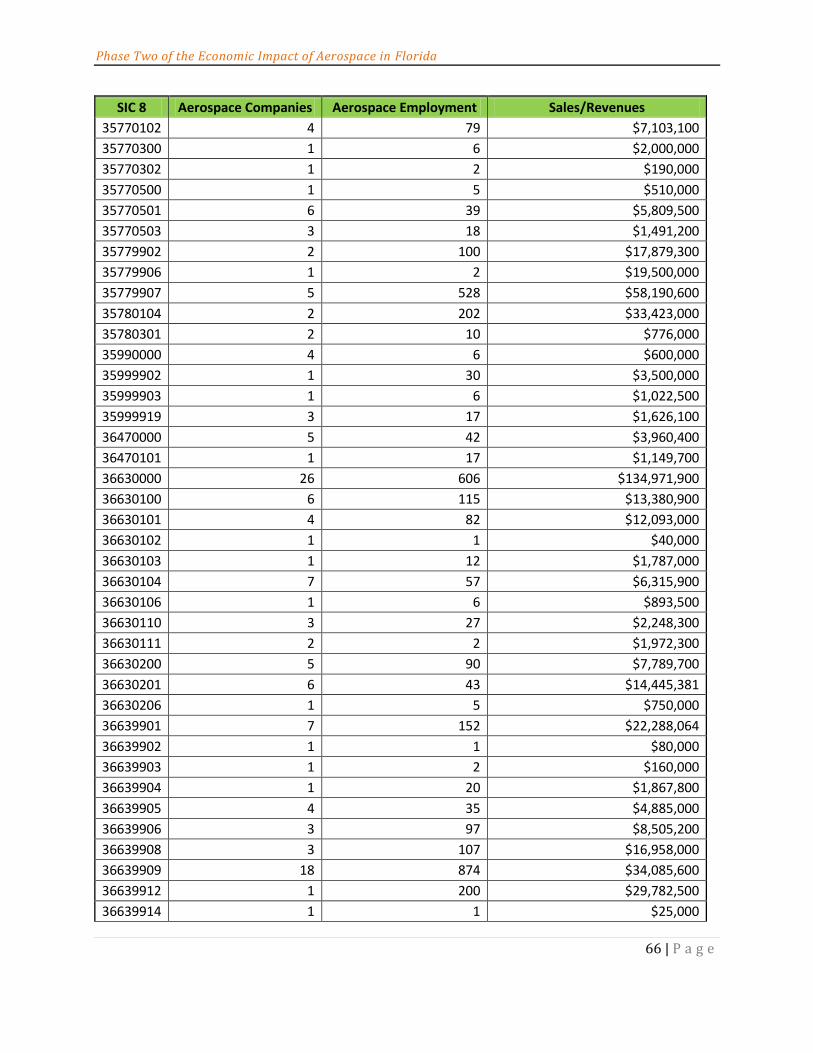
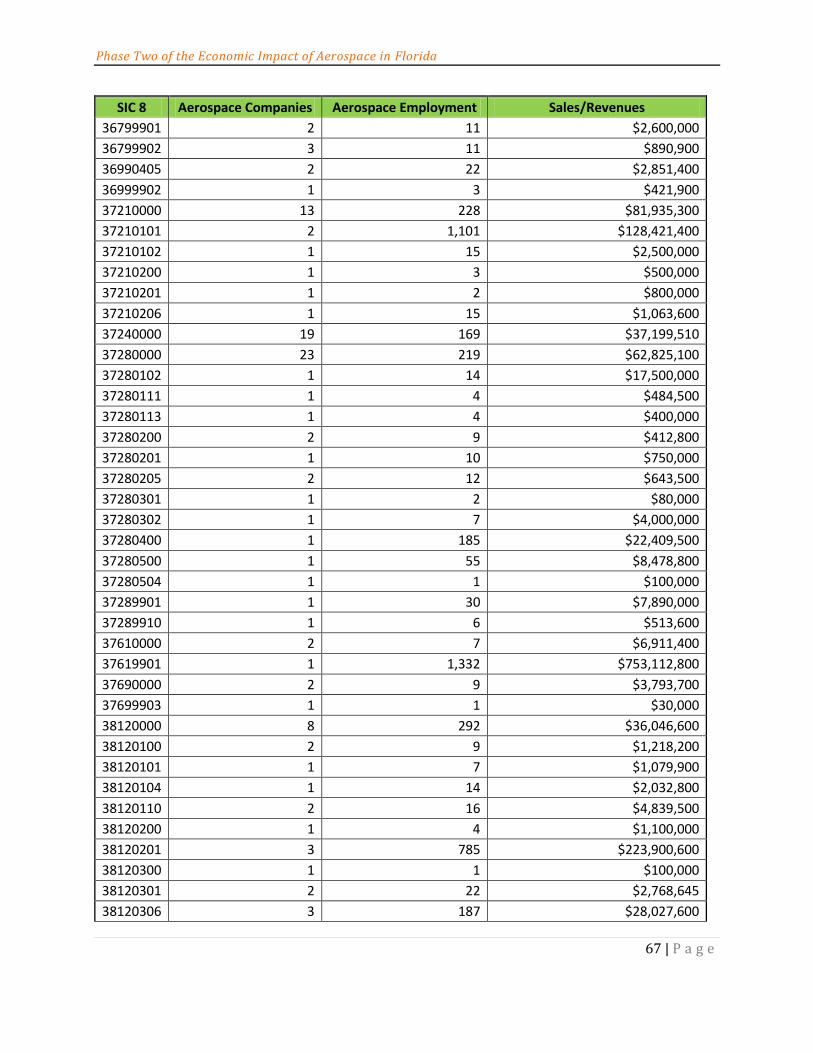
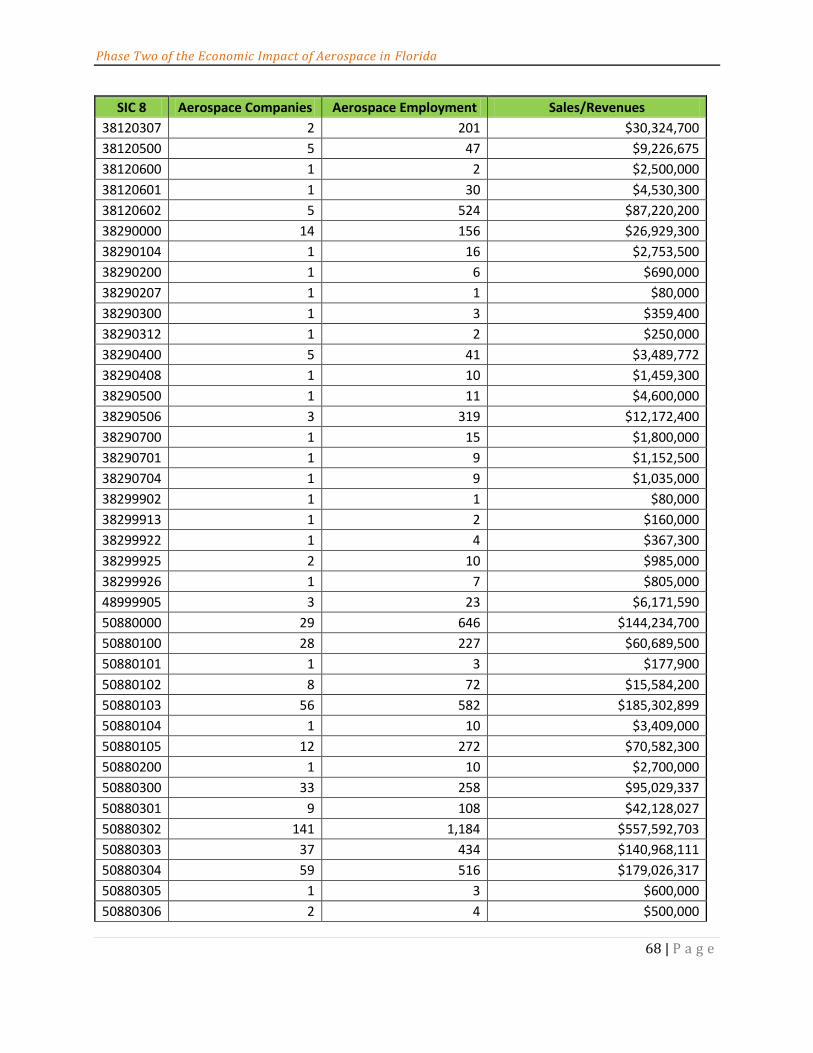
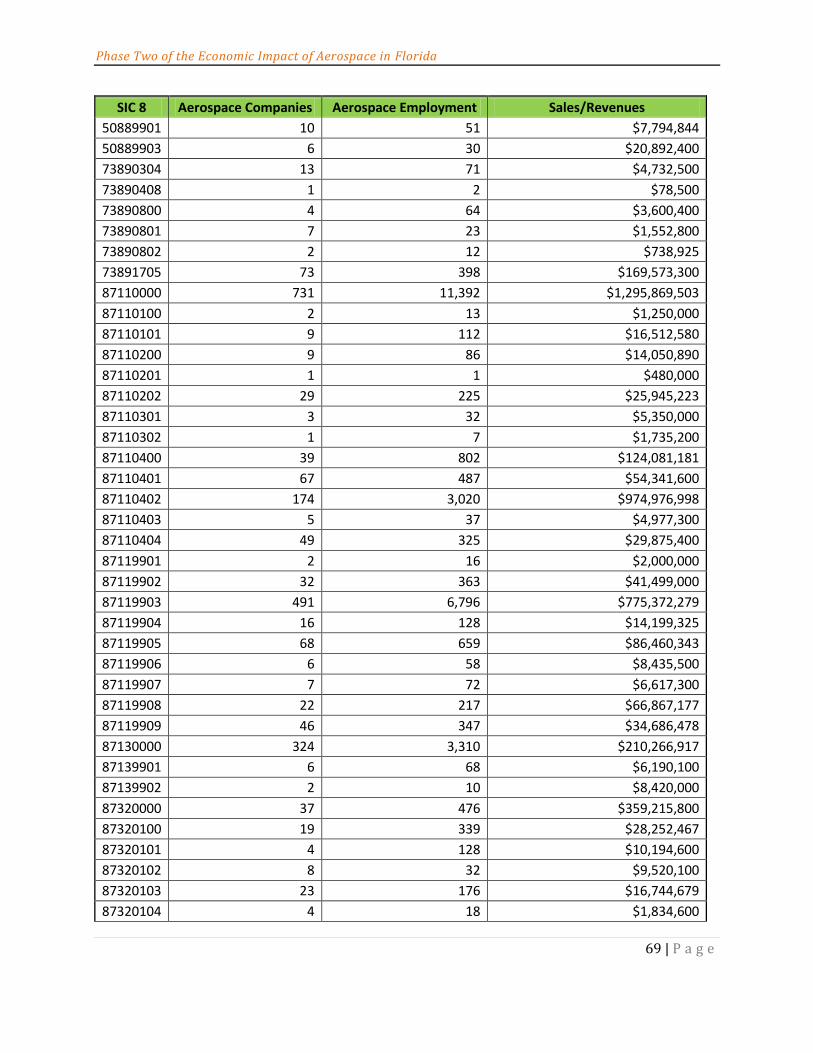
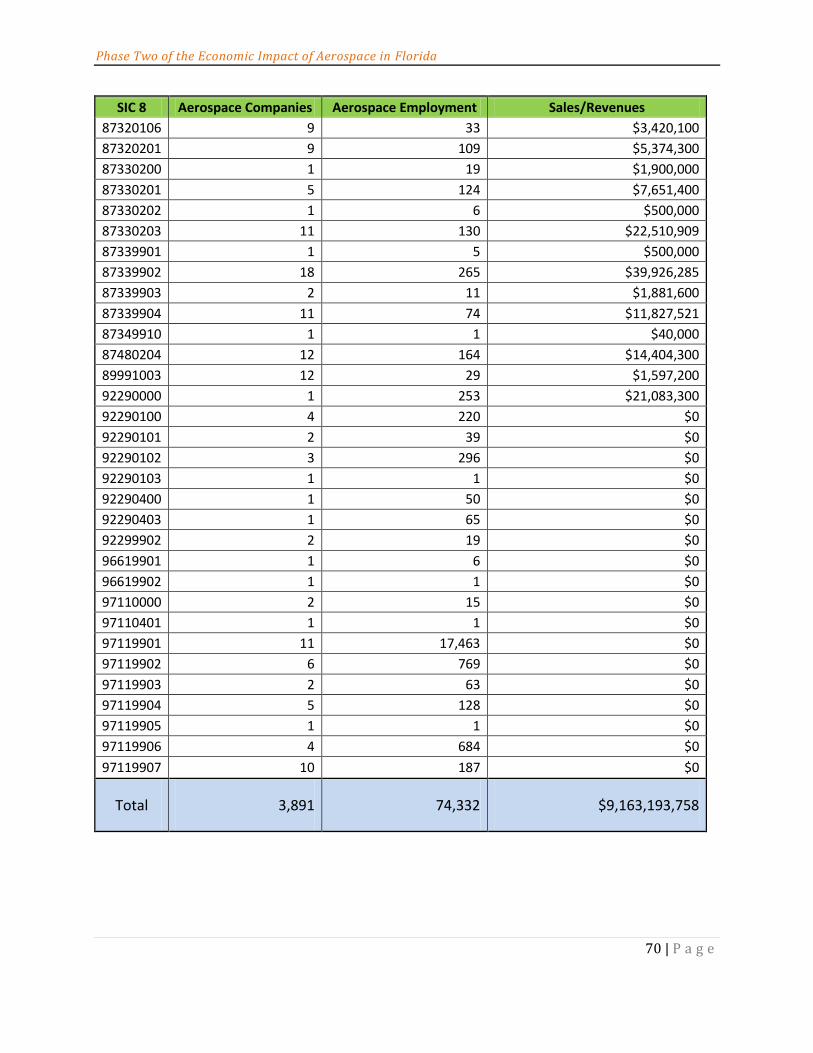
APPENDIX B – THE 8-DIGIT SIC CODES FOR AEROSPACE IN FLORIDA ............................. 63
Phase Two of Florida Aerospace Economic Impact Analysis
viii | P a g e
List of Tables
Table 1 Economic Impact Results of the Aerospace and Aviation-Related Industries in Florida, in Terms of Sales/Revenues, Jobs and Income ......................................................... iii
Table 2 Global Space Industry Revenues from Years 2005 to 2010 ................................... 3
Table 3 U.S. Government Agency Space Budgets in 2009 ....................................................... 5
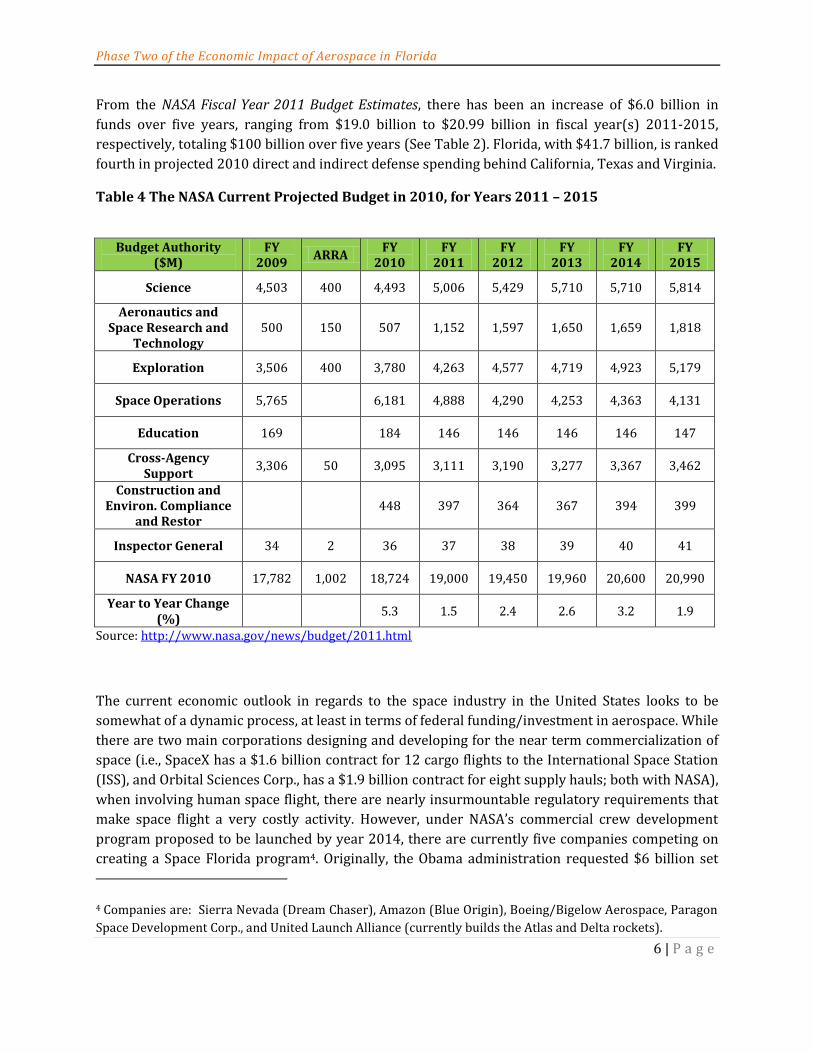
Table 4 The NASA Current Projected Budget in 2010, for Years 2011 – 2015 ............... 6
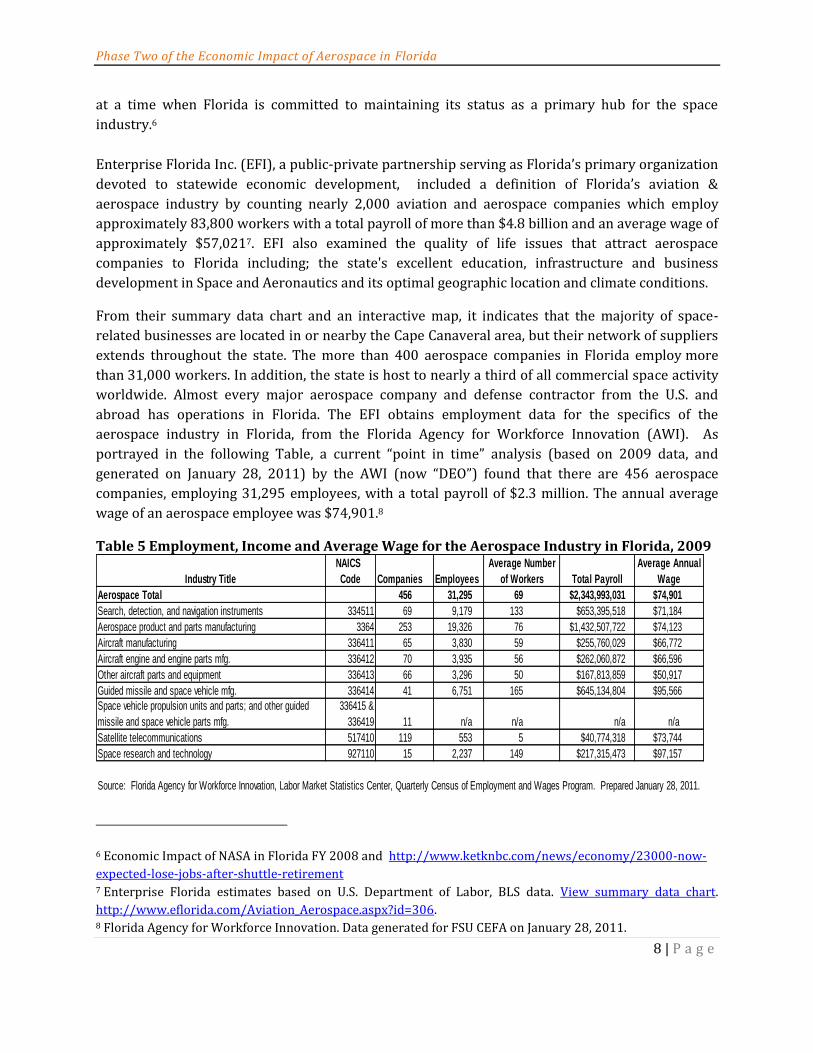
Table 5 Employment, Income and Average Wage for the Aerospace Industry in Florida, 2009 ............................................................................................................................................................. 8
Table 6 Employment, Income and Average Wage for the Aerospace Industry in Florida, 2011 ............................................................................................................................................................. 9
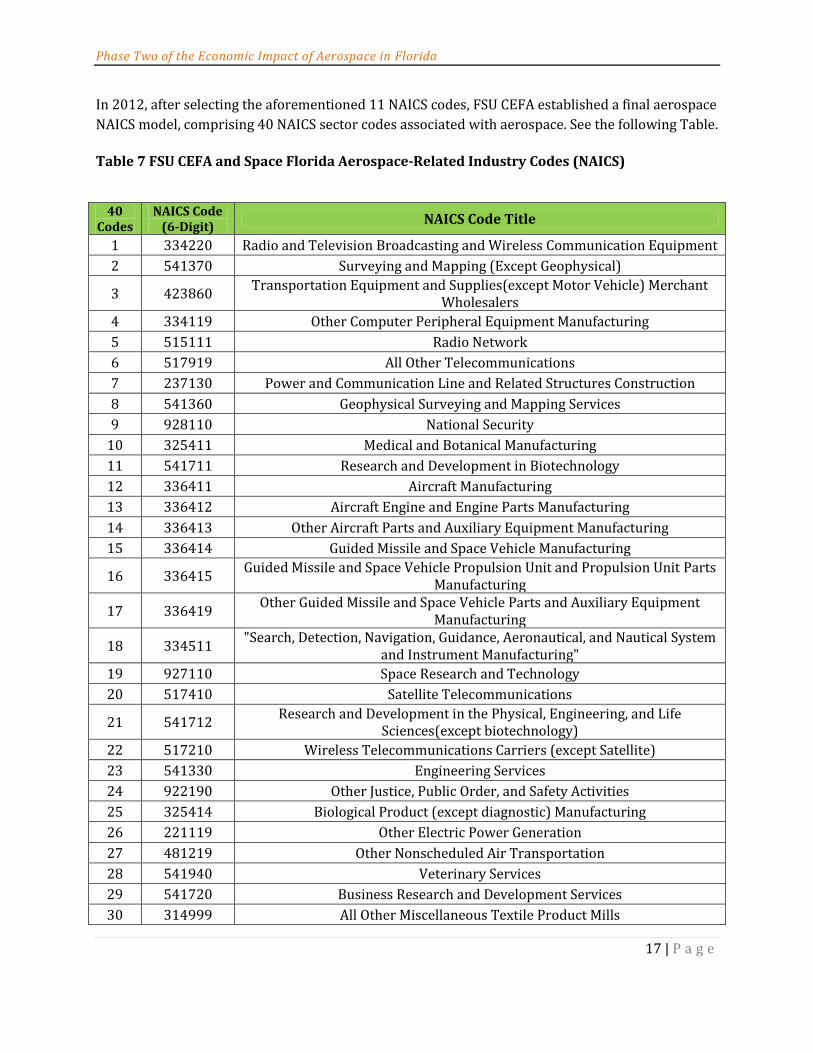
Table 7 FSU CEFA and Space Florida Aerospace-Related Industry Codes (NAICS) ... 17
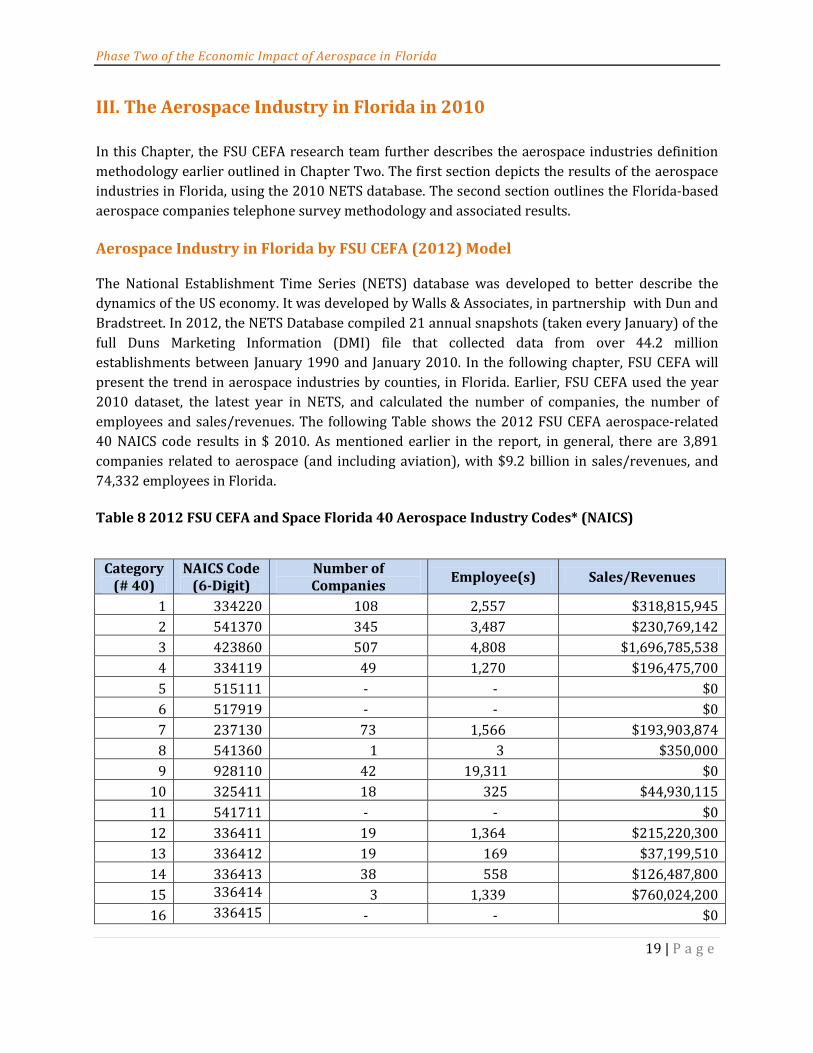
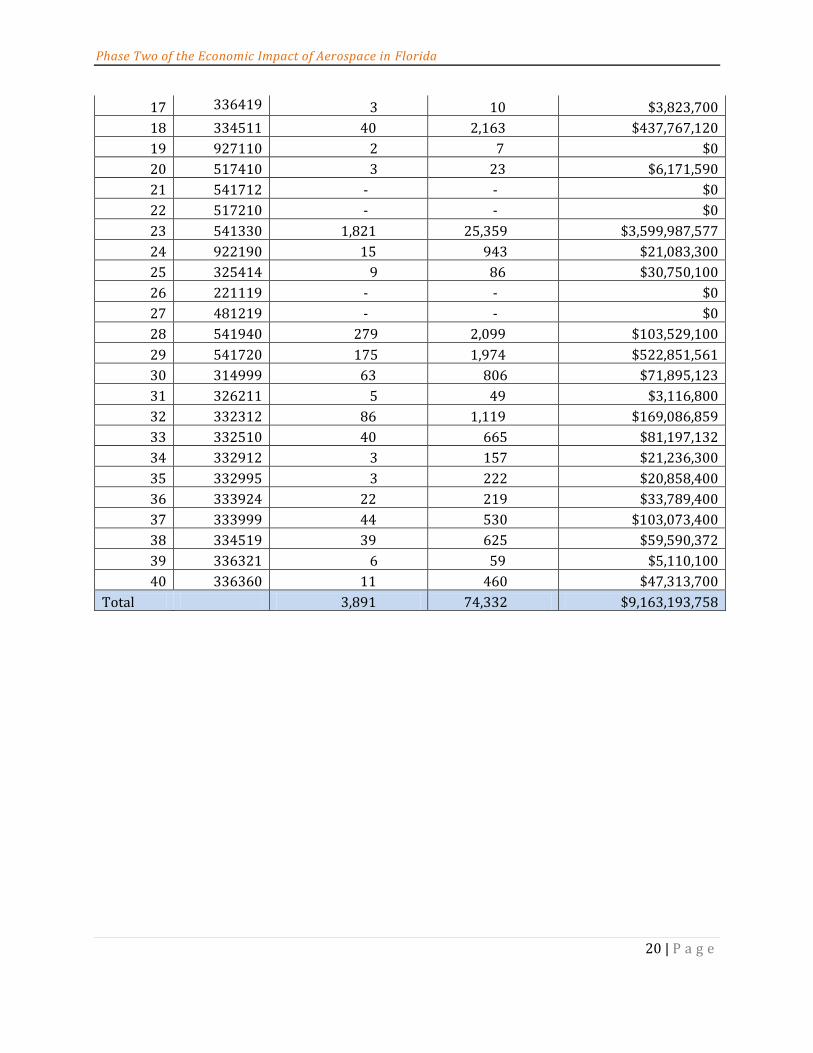
Table 8 2012 FSU CEFA and Space Florida 40 Aerospace Industry Codes* (NAICS) 19
Table 9 NETS Input Data for Year 2010 by Space Florida Aerospace-Related Industries ..................................................................................................................................................................... 43
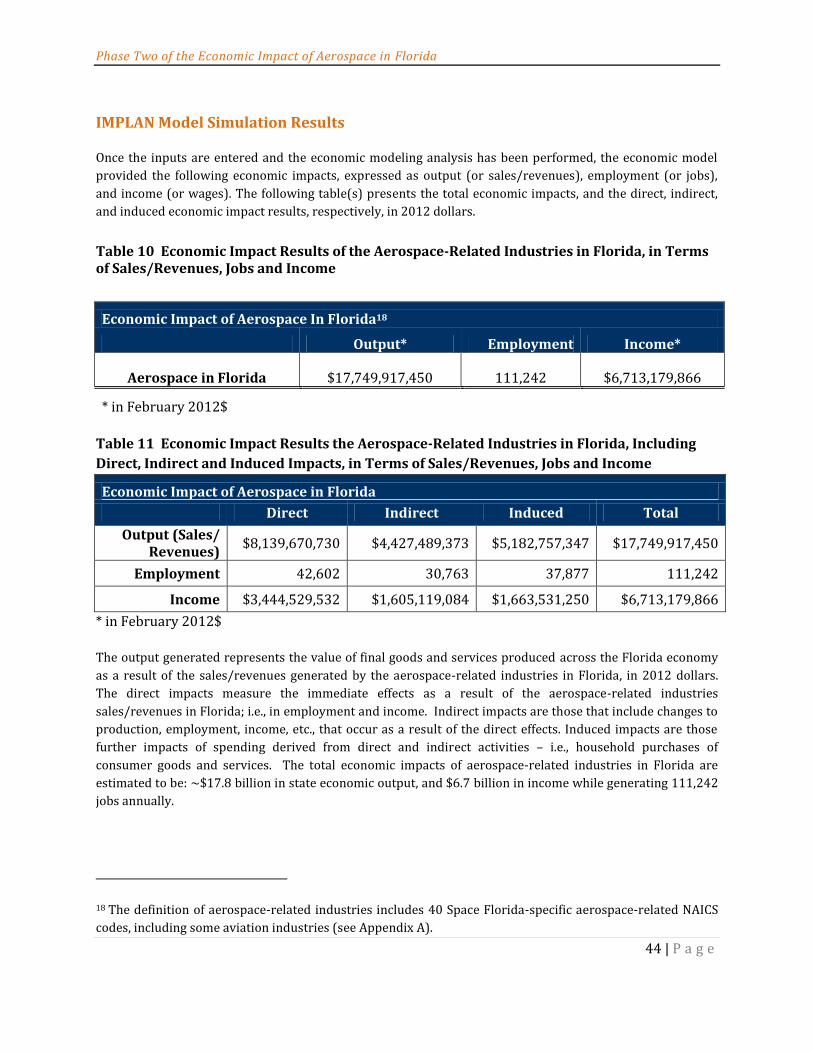
Table 10 Economic Impact Results of the Aerospace-Related Industries in Florida, in Terms of Sales/Revenues, Jobs and Income ............................................................................................ 44
Table 11 Economic Impact Results the Aerospace-Related Industries in Florida, Including Direct, Indirect and Induced Impacts, in Terms of Sales/Revenues, Jobs and Income44
Phase Two of Florida Aerospace Economic Impact Analysis
ix | P a g e
List of Figures
Figure 1 Space Budgets of G20 countries Estimates in 2010(Current US $ Million) .... 1
Figure 2 Countries with Spaceflight Capabilities in 2010 ....................................................... 2
Figure 3 Global Space Activity in 2010 ........................................................................................... 4
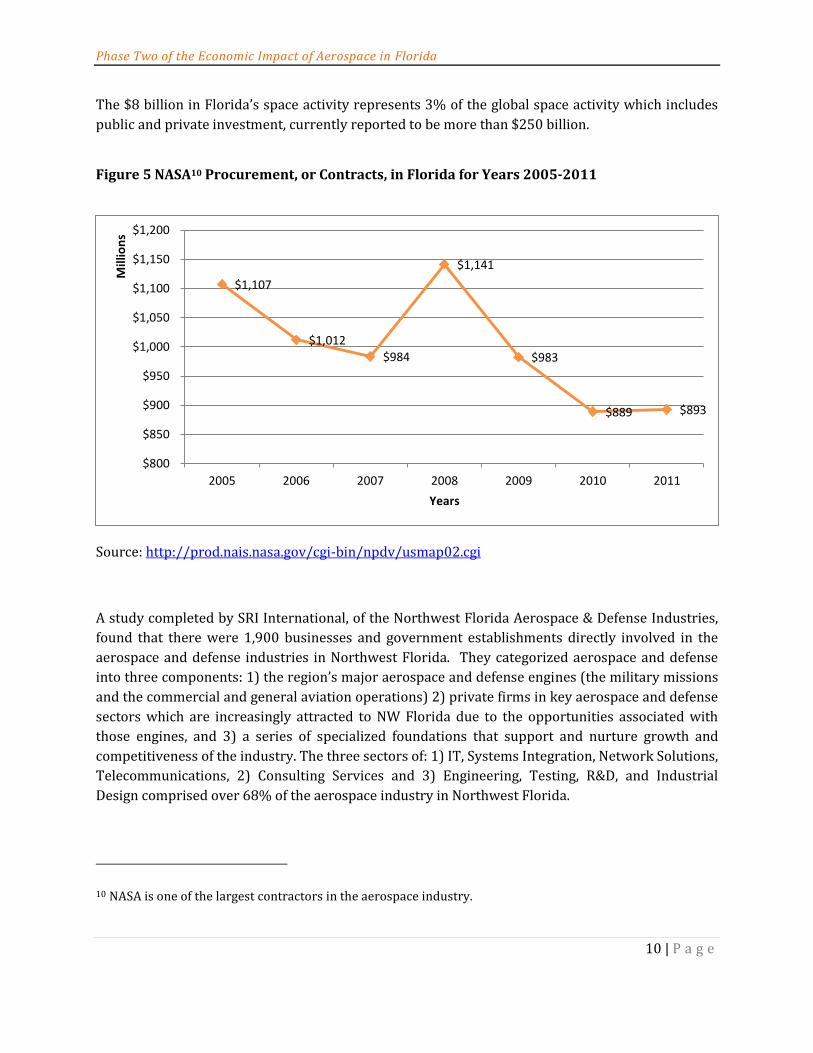
Figure 5 NASA Procurement, or Contracts, in Florida for Years 2005-2011 ................ 10
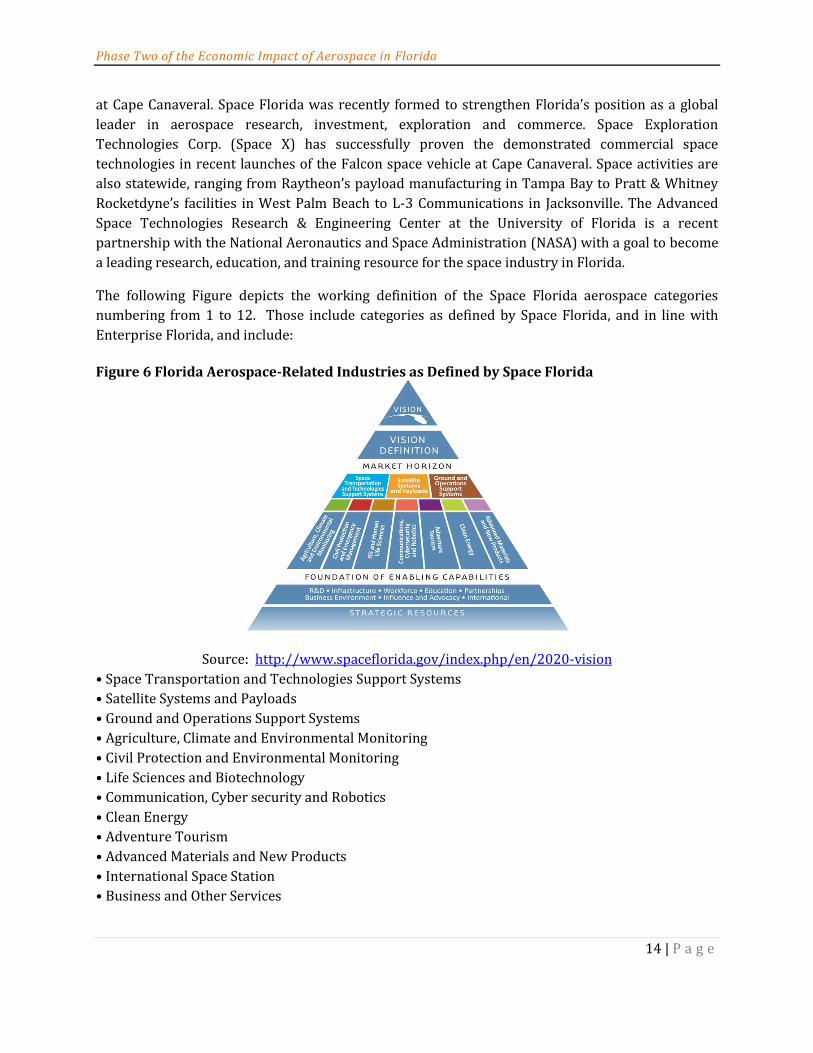
Figure 6 Florida Aerospace-Related Industries as Defined by Space Florida .............. 14
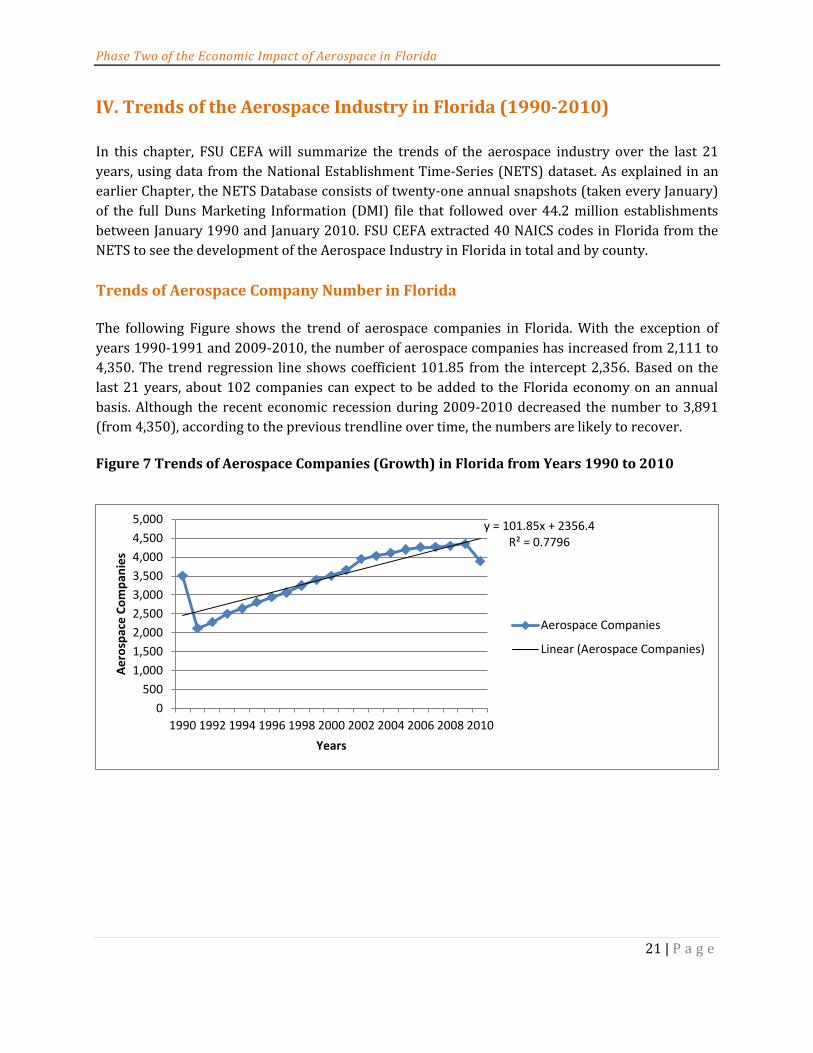
Figure 7 Trends of Aerospace Companies (Growth) in Florida from Years 1990 to 2010 ..................................................................................................................................................................... 21
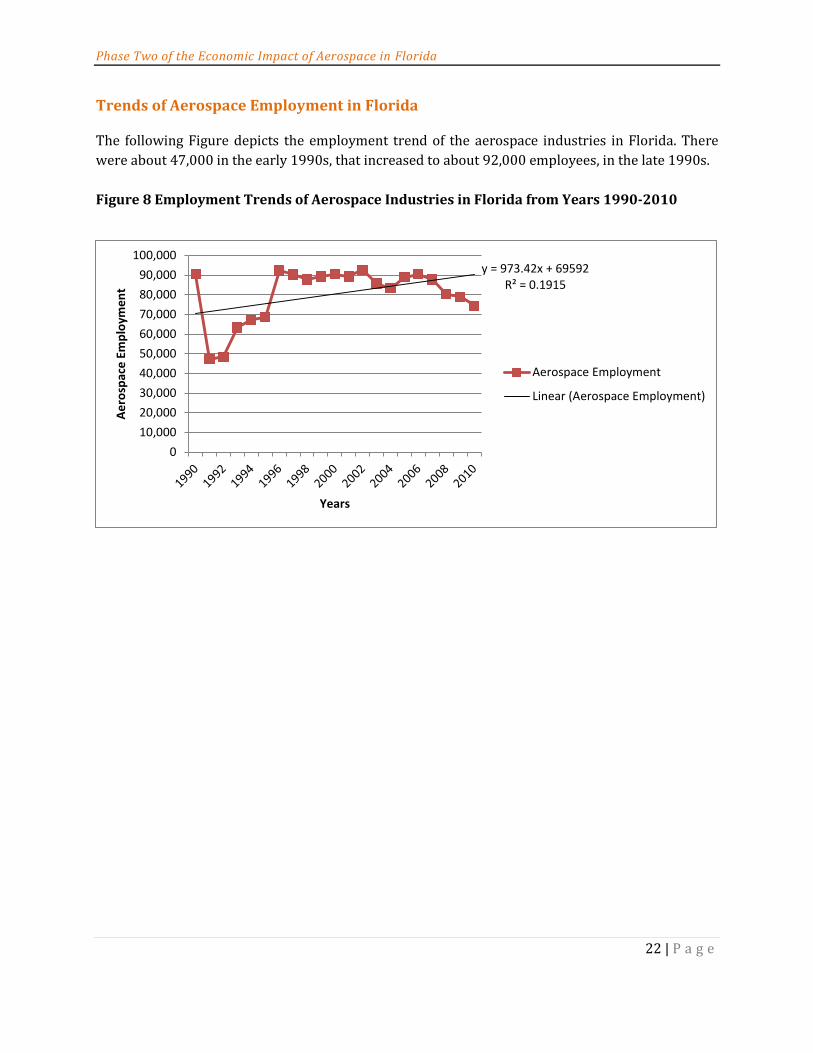
Figure 8 Employment Trends of Aerospace Industries in Florida from Years 1990-2010 ..................................................................................................................................................................... 22
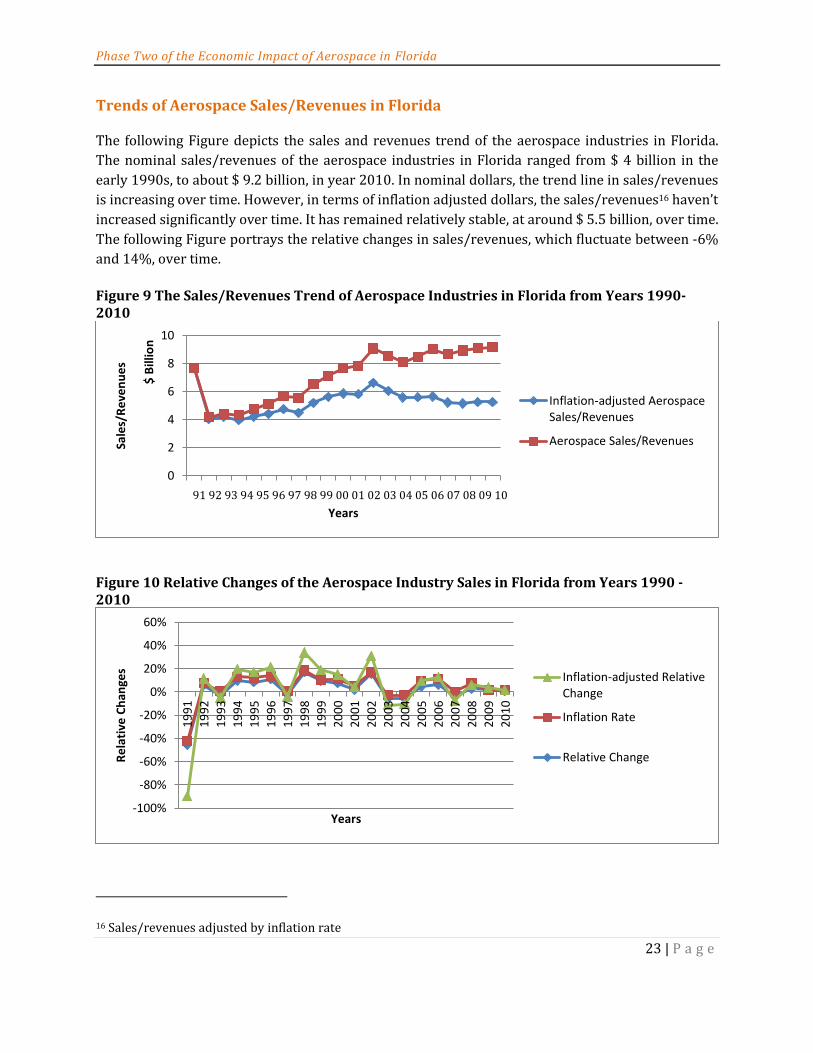
Figure 9 The Sales/Revenues Trend of Aerospace Industries in Florida from Years 1990-2010 .......................................................................................................................................................... 23
Figure 11 Relative Changes of the Aerospace Industry Sales in Florida from Years 1990 - 2010 .......................................................................................................................................................... 23
Figure 12 Aerospace Companies by Counties in Florida ...................................................... 24
Figure 13 Aerospace Companies by Counties in Florida ...................................................... 24
Figure 14 Aerospace Companies by Counties in Florida ...................................................... 25
Figure 15 Aerospace Companies by Counties in Florida ...................................................... 25
Figure 16 Aerospace Companies by Counties in Florida ...................................................... 26
Figure 17 Aerospace Companies by Counties in Florida ...................................................... 26
Figure 18 Aerospace Companies by Counties in Florida ...................................................... 27
Figure 19 Aerospace Companies by Counties in Florida ...................................................... 27
Figure 20 Aerospace Companies by Counties in Florida ...................................................... 28
Figure 21 Aerospace Companies by Counties in Florida ...................................................... 28
Figure 22 Aerospace Companies by Counties in Florida ...................................................... 29
Figure 23 Aerospace Employment by Counties in Florida .................................................. 30
Phase Two of Florida Aerospace Economic Impact Analysis
x | P a g e
Figure 24 Aerospace Employment by Counties in Florida .................................................. 30
Figure 25 Aerospace Employment by Counties in Florida .................................................. 31
Figure 26 Aerospace Employment by Counties in Florida .................................................. 31
Figure 27 Aerospace Employment by Counties in Florida .................................................. 32
Figure 28 Aerospace Employment by Counties in Florida .................................................. 32
Figure 29 Aerospace Employment by Counties in Florida .................................................. 33
Figure 30 Aerospace Employment by Counties in Florida .................................................. 33
Figure 31 Aerospace Employment by Counties in Florida .................................................. 34
Figure 32 Aerospace Employment by Counties in Florida .................................................. 34
Figure 33 Aerospace Employment by Counties in Florida .................................................. 35
Figure 34 Aerospace Sales/Revenues by Counties in Florida ............................................ 36
Figure 35 Aerospace Sales/Revenues by Counties in Florida ............................................ 36
Figure 36 Aerospace Sales/Revenues by Counties in Florida ............................................ 37
Figure 37 Aerospace Sales/Revenues by Counties in Florida ............................................ 37
Figure 38 Aerospace Sales/Revenues by Counties in Florida ............................................ 38
Figure 39 Aerospace Sales/Revenues by Counties in Florida ............................................ 38
Figure 40 Aerospace Sales/Revenues by Counties in Florida ............................................ 39
Figure 41 Aerospace Sales/Revenues by Counties in Florida ............................................ 39
Figure 42 Aerospace Sales/Revenues by Counties in Florida ............................................ 40
Figure 43 Aerospace Sales/Revenues by Counties in Florida ............................................ 40
Figure 44 Aerospace Sales/Revenues by Counties in Florida ............................................ 41
Phase Two of the Economic Impact of Aerospace in Florida
1 | P a g e
I. Introduction
Background
The aerospace economy in Florida and throughout the US has shifted from a traditional federal
(government) funding program, towards commercialization. The advancement of the US as a
revitalized worldwide leader in space exploration performing earth-benefiting research, technology
advancement and operating new space-ports, is heavily dependent upon making commercial space
travel a reality. The ‘new’ space program has finally driven home the message that it’s not just
about the 7 astronauts who fly on board the International Space Station, but the 7 billion or so who
inhabit planet earth. Competition has become ubiquitous, space flights are scarce! Florida, Virginia,
New Mexico, other US states, and indeed other countries, all seek their share of a competitive and
mixed market. That market encompasses suborbital and orbital activities, space tourism, orbital
research and habitable space stations, production of advanced materials as well as the development
of traffic at commercial space-ports. All of the above are globally competitive. However,
researchers, visionaries and realists are saying; “it’s time to fly”!
Public and private entities have responded and are investing. Elon Musk (Space-X & PayPal), Bezos
(Blue Origin & Amazon), Allen (StraoLaunch & Microsoft), Branson (Virgin & Virgin Galactic), and
Bigelow (Bigelow Aerospace & Budget Suites), are investing heavily and making their mark. Others
are in hot pursuit. Although the budget for NASA’s 2012 space operations has been cut by nearly $2
billion, many corporations such as Boeing and Lockheed Martin continue to allocate a large portion
of their R&D efforts towards continued development of the aerospace industry and more
specifically, that of future commercial space flight.
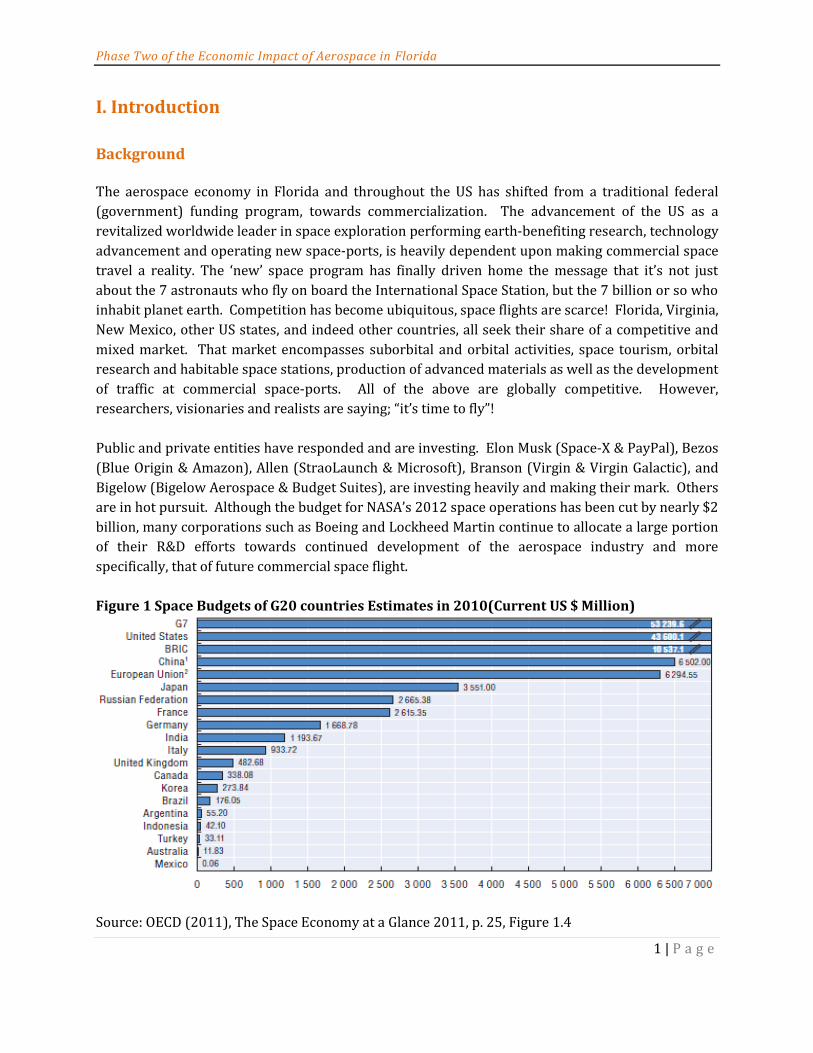
Figure 1 Space Budgets of G20 countries Estimates in 2010(Current US $ Million)
Source: OECD (2011), The Space Economy at a Glance 2011, p. 25, Figure 1.4
Phase Two of the Economic Impact of Aerospace in Florida
2 | P a g e
The aerospace sector plays an important role in the national economy; however, the aerospace
sector has high overhead costs. Historically, the government has provided considerable financial
support for aerospace R&D. On a global scale, many countries are currently directing investment to
bolstering their aerospace industries. According to the OECD (2011), the total space budget of the
35 countries examined in the report represented ~US $ 64.4 billion in 2009 and an estimated US
$ 65.3 billion in 2010. All G20 countries currently have space programs. Five countries, which
include the United States, China, Japan, France and the Russian Federation have invested more than
US $ 2 billion in both 2009 and 20101, as shown in Figure 1. According to the OECD (2011), until
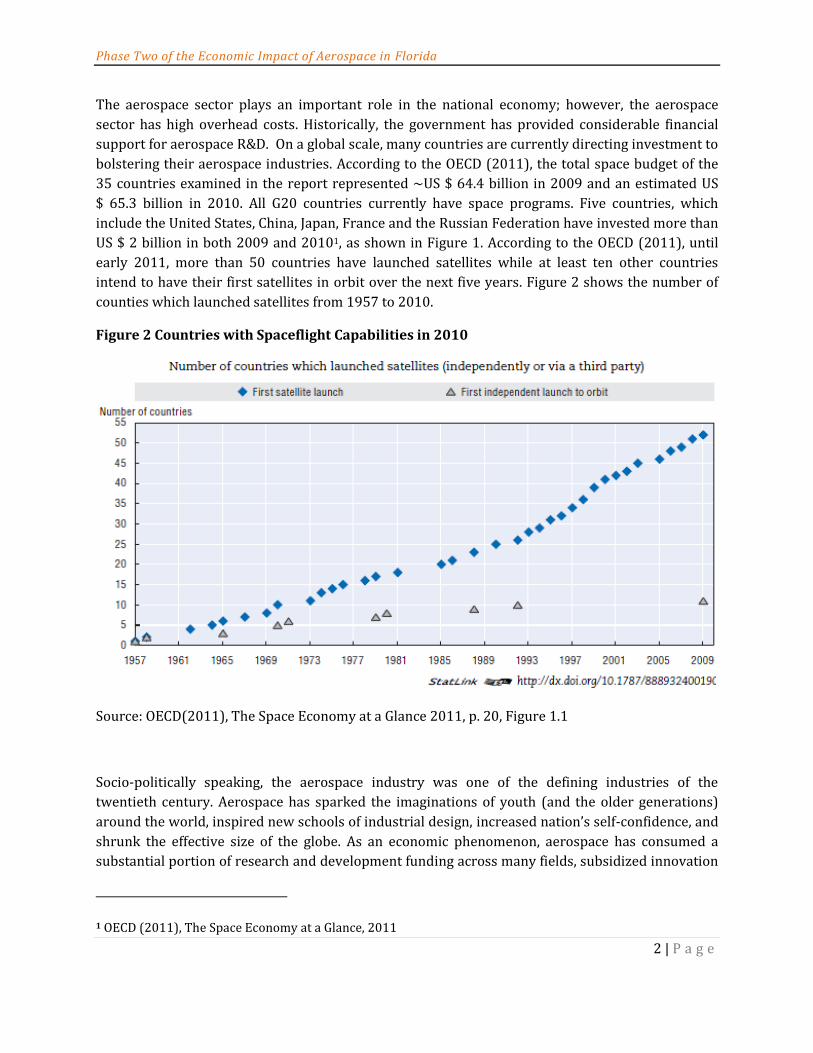
early 2011, more than 50 countries have launched satellites while at least ten other countries
intend to have their first satellites in orbit over the next five years. Figure 2 shows the number of
counties which launched satellites from 1957 to 2010.
Figure 2 Countries with Spaceflight Capabilities in 2010
Source: OECD(2011), The Space Economy at a Glance 2011, p. 20, Figure 1.1
Socio-politically speaking, the aerospace industry was one of the defining industries of the
twentieth century. Aerospace has sparked the imaginations of youth (and the older generations)
around the world, inspired new schools of industrial design, increased nation’s self-confidence, and
shrunk the effective size of the globe. As an economic phenomenon, aerospace has consumed a
substantial portion of research and development funding across many fields, subsidized innovation
1 OECD (2011), The Space Economy at a Glance, 2011
Phase Two of the Economic Impact of Aerospace in Florida
3 | P a g e
in a vast array of component technologies, evoked new forms of production, spurred construction
of large manufacturing complexes, inspired technology-sensitive managerial techniques, supported
dependent regional economies and fostered global trade.
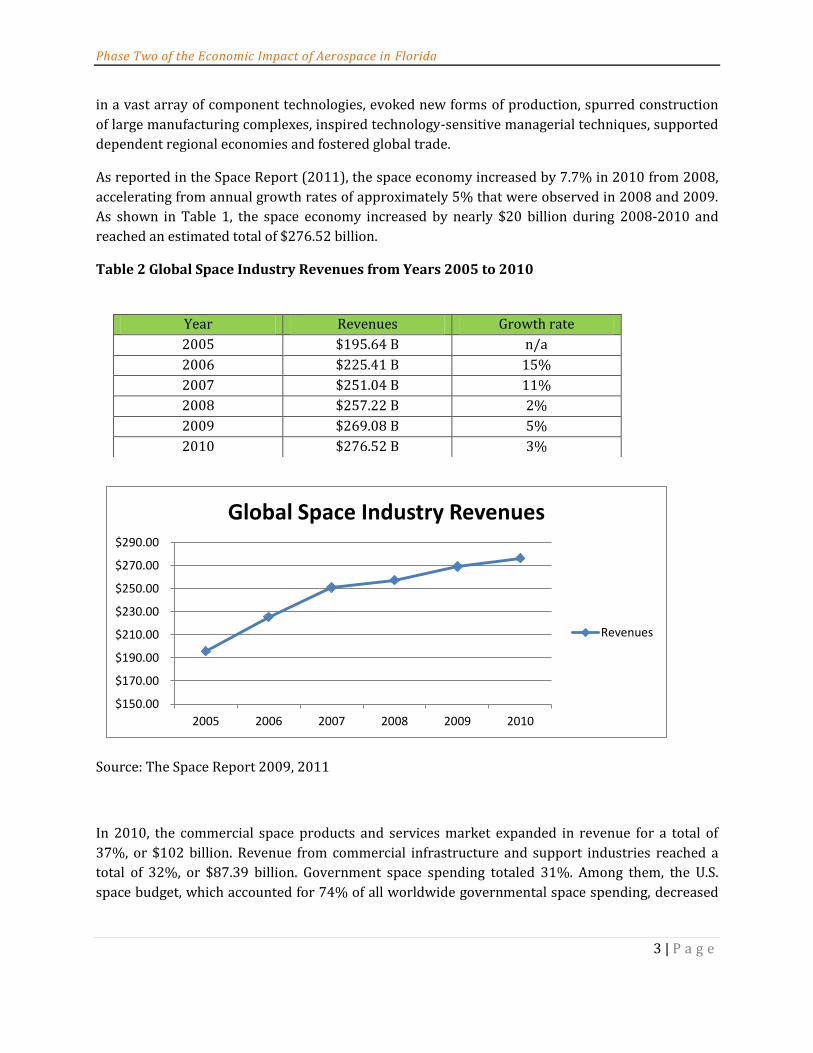
As reported in the Space Report (2011), the space economy increased by 7.7% in 2010 from 2008,
accelerating from annual growth rates of approximately 5% that were observed in 2008 and 2009.
As shown in Table 1, the space economy increased by nearly $20 billion during 2008-2010 and
reached an estimated total of $276.52 billion.
Table 2 Global Space Industry Revenues from Years 2005 to 2010
Source: The Space Report 2009, 2011
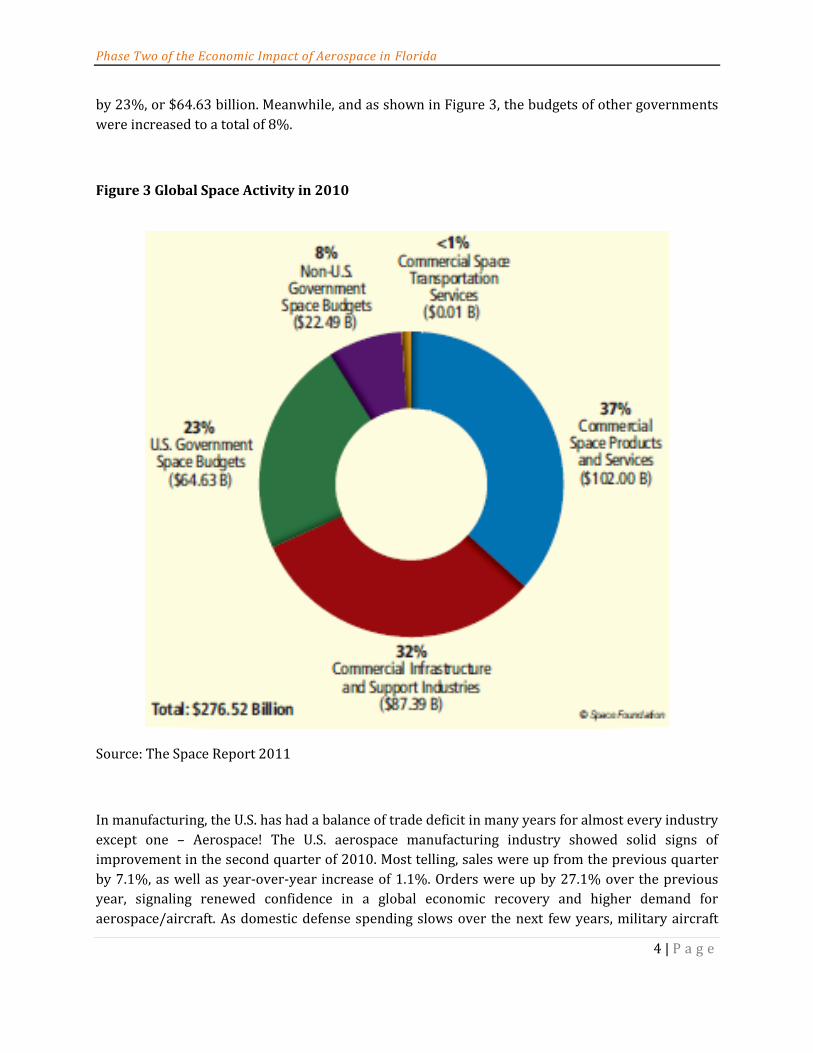
In 2010, the commercial space products and services market expanded in revenue for a total of
37%, or $102 billion. Revenue from commercial infrastructure and support industries reached a
total of 32%, or $87.39 billion. Government space spending totaled 31%. Among them, the U.S.
space budget, which accounted for 74% of all worldwide governmental space spending, decreased
Year Revenues Growth rate
2005 $195.64 B n/a
2006 $225.41 B 15%
2007 $251.04 B 11%
2008 $257.22 B 2%
2009 $269.08 B 5%
2010 $276.52 B 3%
$150.00
$170.00
$190.00
$210.00
$230.00
$250.00
$270.00
$290.00
2005 2006 2007 2008 2009 2010
Global Space Industry Revenues
Revenues
Phase Two of the Economic Impact of Aerospace in Florida
4 | P a g e
by 23%, or $64.63 billion. Meanwhile, and as shown in Figure 3, the budgets of other governments
were increased to a total of 8%.
Figure 3 Global Space Activity in 2010
Source: The Space Report 2011
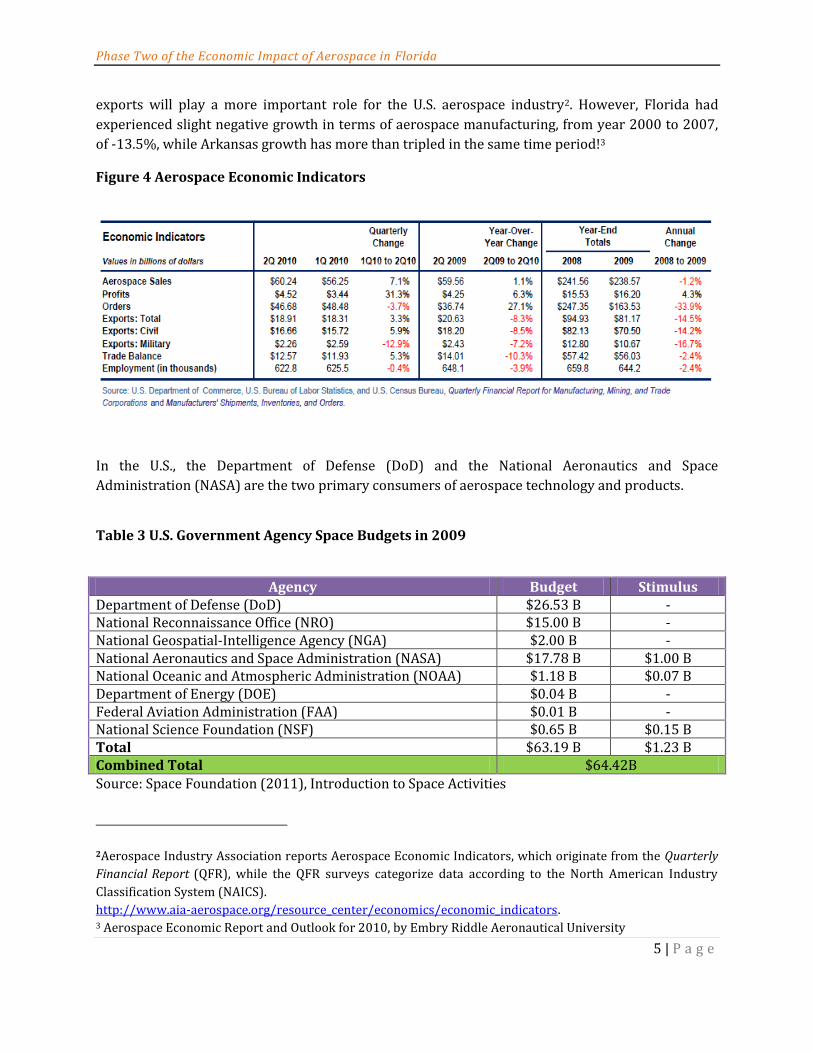
In manufacturing, the U.S. has had a balance of trade deficit in many years for almost every industry
except one – Aerospace! The U.S. aerospace manufacturing industry showed solid signs of
improvement in the second quarter of 2010. Most telling, sales were up from the previous quarter
by 7.1%, as well as year-over-year increase of 1.1%. Orders were up by 27.1% over the previous
year, signaling renewed confidence in a global economic recovery and higher demand for
aerospace/aircraft. As domestic defense spending slows over the next few years, military aircraft
Phase Two of the Economic Impact of Aerospace in Florida
5 | P a g e
exports will play a more important role for the U.S. aerospace industry2. However, Florida had
experienced slight negative growth in terms of aerospace manufacturing, from year 2000 to 2007,
of -13.5%, while Arkansas growth has more than tripled in the same time period!3
Figure 4 Aerospace Economic Indicators
In the U.S., the Department of Defense (DoD) and the National Aeronautics and Space
Administration (NASA) are the two primary consumers of aerospace technology and products.
Table 3 U.S. Government Agency Space Budgets in 2009
Agency Budget Stimulus Department of Defense (DoD) $26.53 B - National Reconnaissance Office (NRO) $15.00 B - National Geospatial-Intelligence Agency (NGA) $2.00 B - National Aeronautics and Space Administration (NASA) $17.78 B $1.00 B National Oceanic and Atmospheric Administration (NOAA) $1.18 B $0.07 B Department of Energy (DOE) $0.04 B - Federal Aviation Administration (FAA) $0.01 B - National Science Foundation (NSF) $0.65 B $0.15 B Total $63.19 B $1.23 B Combined Total $64.42B Source: Space Foundation (2011), Introduction to Space Activities
2Aerospace Industry Association reports Aerospace Economic Indicators, which originate from the Quarterly
Financial Report (QFR), while the QFR surveys categorize data according to the North American Industry
Classification System (NAICS).
http://www.aia-aerospace.org/resource_center/economics/economic_indicators. 3 Aerospace Economic Report and Outlook for 2010, by Embry Riddle Aeronautical University
Space research and technology 927110 15 2,237 149 $217,315,473 $97,157
Source: Florida Agency for Workforce Innovation, Labor Market Statistics Center, Quarterly Census of Employment and Wages Program. Prepared January 28, 2011.
Phase Two of the Economic Impact of Aerospace in Florida
24 | P a g e
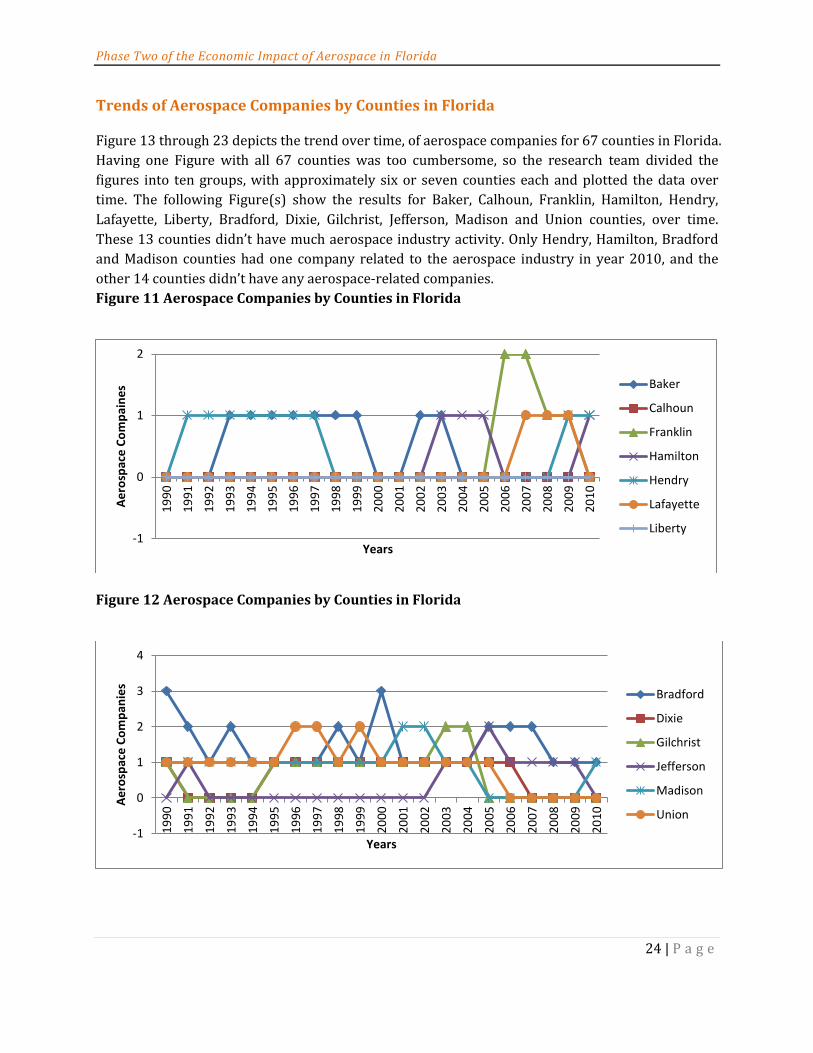
Trends of Aerospace Companies by Counties in Florida Figure 13 through 23 depicts the trend over time, of aerospace companies for 67 counties in Florida.
Having one Figure with all 67 counties was too cumbersome, so the research team divided the
figures into ten groups, with approximately six or seven counties each and plotted the data over
time. The following Figure(s) show the results for Baker, Calhoun, Franklin, Hamilton, Hendry,
Lafayette, Liberty, Bradford, Dixie, Gilchrist, Jefferson, Madison and Union counties, over time.
These 13 counties didn’t have much aerospace industry activity. Only Hendry, Hamilton, Bradford
and Madison counties had one company related to the aerospace industry in year 2010, and the
other 14 counties didn’t have any aerospace-related companies.
Figure 11 Aerospace Companies by Counties in Florida
Figure 12 Aerospace Companies by Counties in Florida
-1
0
1
2
19
90
19
91
19
92
19
93
19
94
19
95
19
96
19
97
19
98
19
99
20
00
20
01
20
02
20
03
20
04
20
05
20
06
20
07
20
08
20
09
20
10
Ae
rosp
ace
Co
mp
ain
es
Years
Baker
Calhoun
Franklin
Hamilton
Hendry
Lafayette
Liberty
-1
0
1
2
3
4
19
90
19
91
19
92
19
93
19
94
19
95
19
96
19
97
19
98
19
99
20
00
20
01
20
02
20
03
20
04
20
05
20
06
20
07
20
08
20
09
20
10
Ae
rosp
ace
Co
mp
anie
s
Years
Bradford
Dixie
Gilchrist
Jefferson
Madison
Union
Phase Two of the Economic Impact of Aerospace in Florida
25 | P a g e
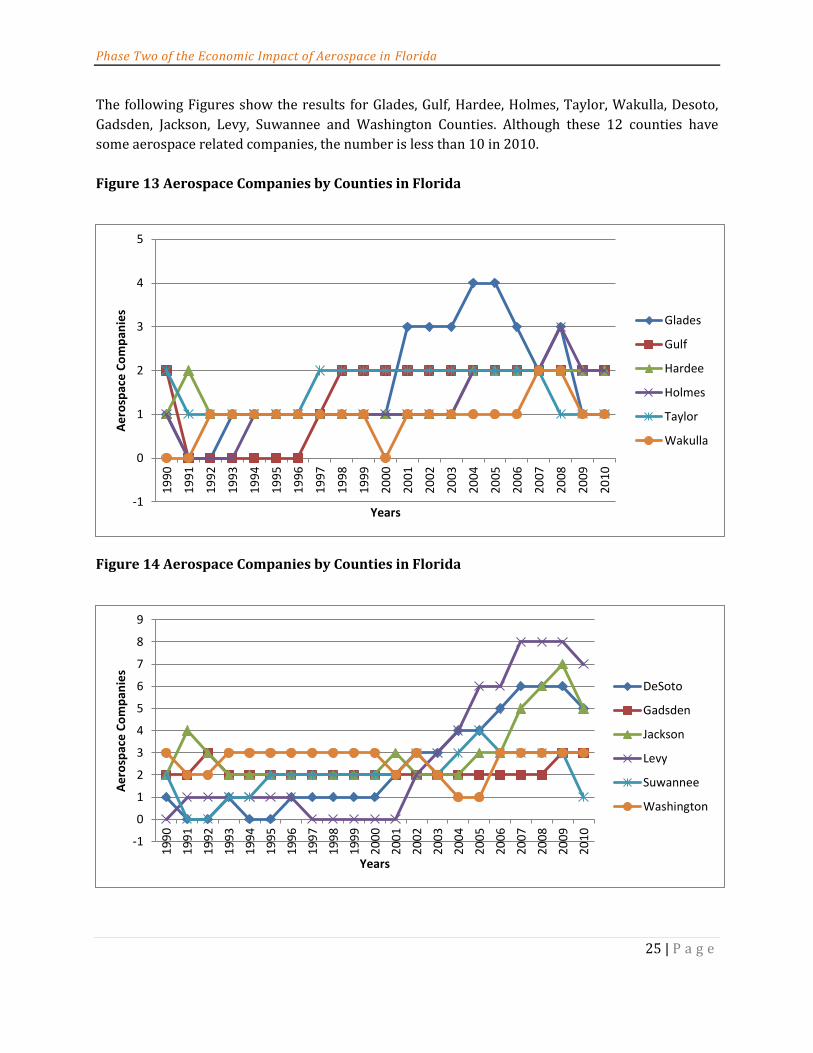
The following Figures show the results for Glades, Gulf, Hardee, Holmes, Taylor, Wakulla, Desoto,
Gadsden, Jackson, Levy, Suwannee and Washington Counties. Although these 12 counties have
some aerospace related companies, the number is less than 10 in 2010.
Figure 13 Aerospace Companies by Counties in Florida
Figure 14 Aerospace Companies by Counties in Florida
-1
0
1
2
3
4
5
19
90
19
91
19
92
19
93
19
94
19
95
19
96
19
97
19
98
19
99
20
00
20
01
20
02
20
03
20
04
20
05
20
06
20
07
20
08
20
09
20
10
Ae
rosp
ace
Co
mp
anie
s
Years
Glades
Gulf
Hardee
Holmes
Taylor
Wakulla
-1
0
1
2
3
4
5
6
7
8
9
19
90
19
91
19
92
19
93
19
94
19
95
19
96
19
97
19
98
19
99
20
00
20
01
20
02
20
03
20
04
20
05
20
06
20
07
20
08
20
09
20
10
Ae
rosp
ace
Co
mp
anie
s
Years
DeSoto
Gadsden
Jackson
Levy
Suwannee
Washington
Phase Two of the Economic Impact of Aerospace in Florida
26 | P a g e
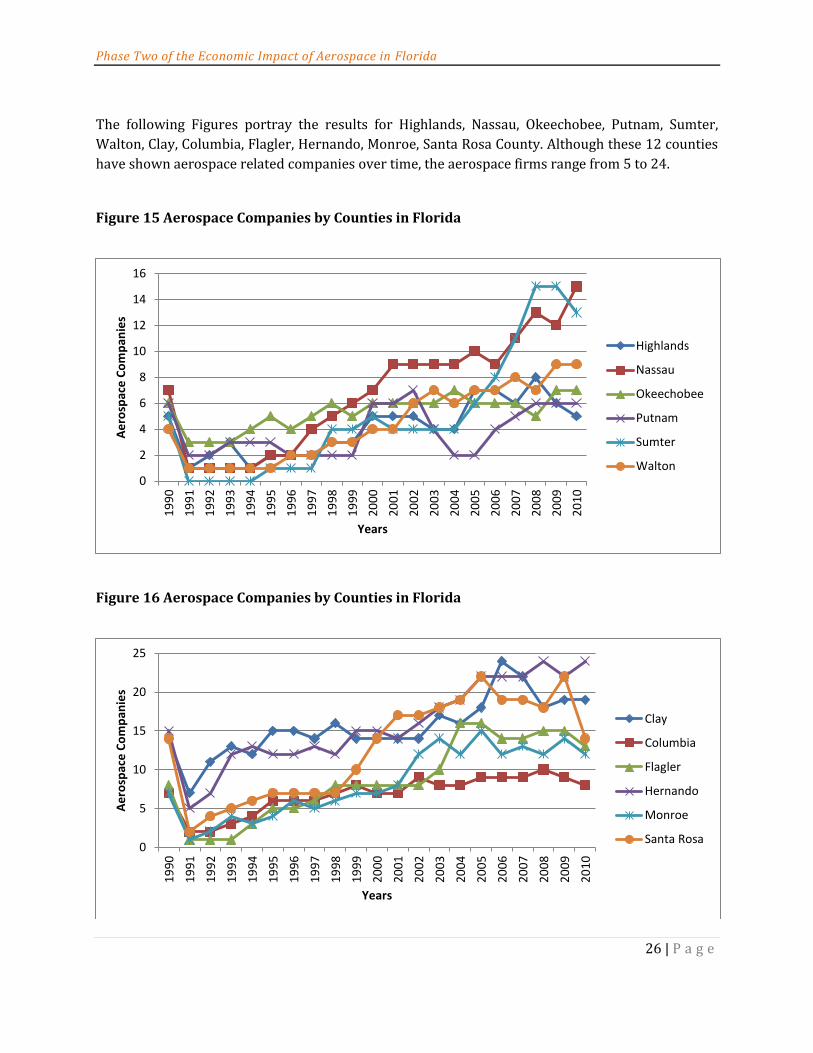
The following Figures portray the results for Highlands, Nassau, Okeechobee, Putnam, Sumter,
Walton, Clay, Columbia, Flagler, Hernando, Monroe, Santa Rosa County. Although these 12 counties
have shown aerospace related companies over time, the aerospace firms range from 5 to 24.
Figure 15 Aerospace Companies by Counties in Florida
Figure 16 Aerospace Companies by Counties in Florida
0
2
4
6
8
10
12
14
16
19
90
19
91
19
92
19
93
19
94
19
95
19
96
19
97
19
98
19
99
20
00
20
01
20
02
20
03
20
04
20
05
20
06
20
07
20
08
20
09
20
10
Ae
rosp
ace
Co
mp
anie
s
Years
Highlands
Nassau
Okeechobee
Putnam
Sumter
Walton
0
5
10
15
20
25
19
90
19
91
19
92
19
93
19
94
19
95
19
96
19
97
19
98
19
99
20
00
20
01
20
02
20
03
20
04
20
05
20
06
20
07
20
08
20
09
20
10
Ae
rosp
ace
Co
mp
anie
s
Years
Clay
Columbia
Flagler
Hernando
Monroe
Santa Rosa
Phase Two of the Economic Impact of Aerospace in Florida
27 | P a g e
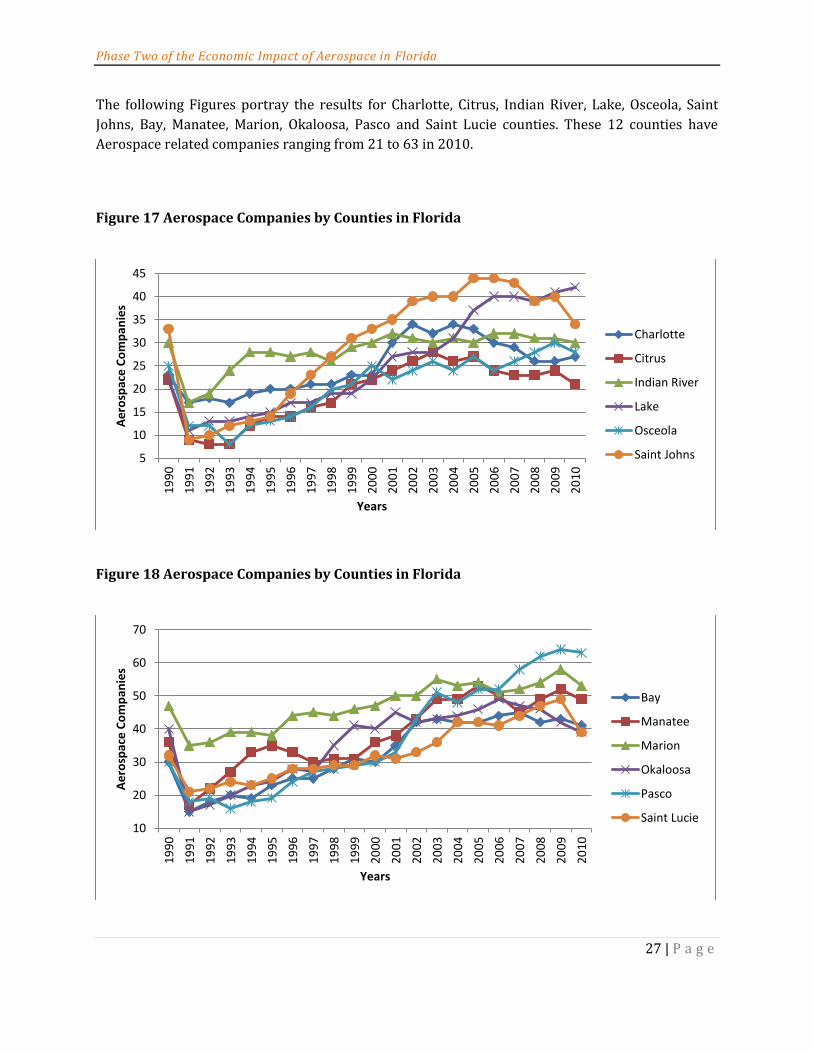
The following Figures portray the results for Charlotte, Citrus, Indian River, Lake, Osceola, Saint
Johns, Bay, Manatee, Marion, Okaloosa, Pasco and Saint Lucie counties. These 12 counties have
Aerospace related companies ranging from 21 to 63 in 2010.
Figure 17 Aerospace Companies by Counties in Florida
Figure 18 Aerospace Companies by Counties in Florida
5
10
15
20
25
30
35
40
45
19
90
19
91
19
92
19
93
19
94
19
95
19
96
19
97
19
98
19
99
20
00
20
01
20
02
20
03
20
04
20
05
20
06
20
07
20
08
20
09
20
10
Ae
rosp
ace
Co
mp
anie
s
Years
Charlotte
Citrus
Indian River
Lake
Osceola
Saint Johns
10
20
30
40
50
60
70
19
90
19
91
19
92
19
93
19
94
19
95
19
96
19
97
19
98
19
99
20
00
20
01
20
02
20
03
20
04
20
05
20
06
20
07
20
08
20
09
20
10
Ae
rosp
ace
Co
mp
anie
s
Years
Bay
Manatee
Marion
Okaloosa
Pasco
Saint Lucie
Phase Two of the Economic Impact of Aerospace in Florida
28 | P a g e
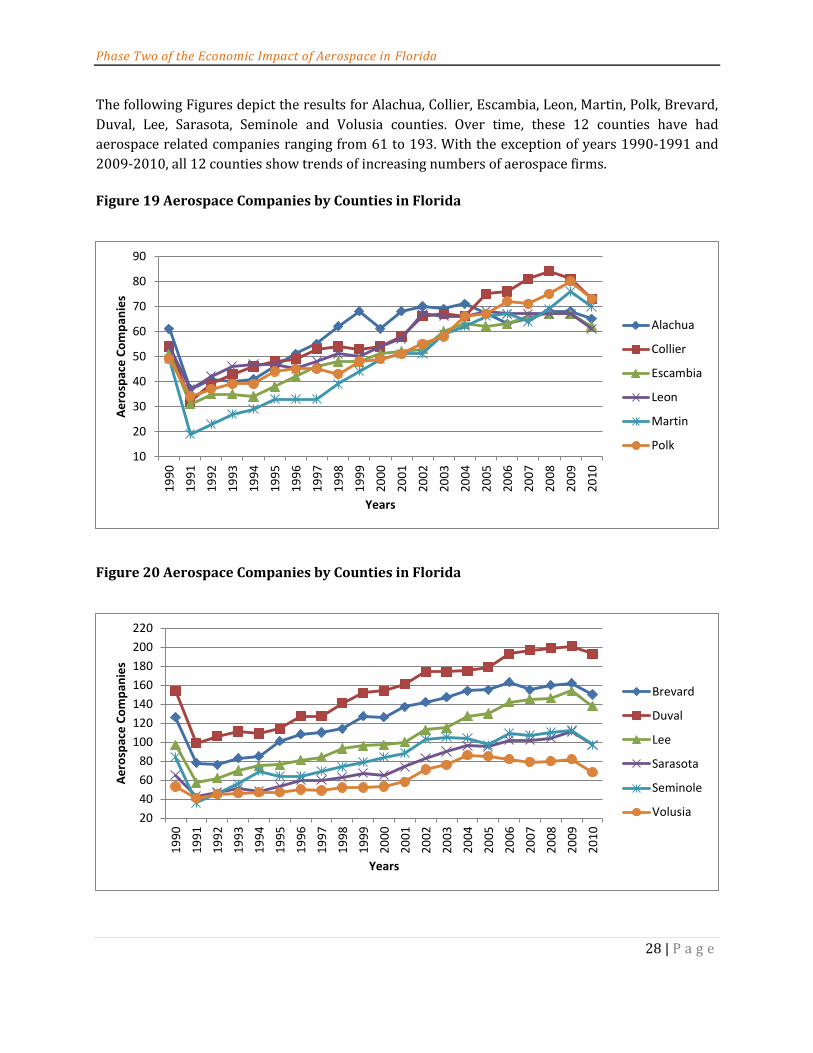
The following Figures depict the results for Alachua, Collier, Escambia, Leon, Martin, Polk, Brevard,
Duval, Lee, Sarasota, Seminole and Volusia counties. Over time, these 12 counties have had
aerospace related companies ranging from 61 to 193. With the exception of years 1990-1991 and
2009-2010, all 12 counties show trends of increasing numbers of aerospace firms.
Figure 19 Aerospace Companies by Counties in Florida
Figure 20 Aerospace Companies by Counties in Florida
10
20
30
40
50
60
70
80
90
19
90
19
91
19
92
19
93
19
94
19
95
19
96
19
97
19
98
19
99
20
00
20
01
20
02
20
03
20
04
20
05
20
06
20
07
20
08
20
09
20
10
Ae
rosp
ace
Co
mp
anie
s
Years
Alachua
Collier
Escambia
Leon
Martin
Polk
20
40
60
80
100
120
140
160
180
200
220
19
90
19
91
19
92
19
93
19
94
19
95
19
96
19
97
19
98
19
99
20
00
20
01
20
02
20
03
20
04
20
05
20
06
20
07
20
08
20
09
20
10
Ae
rosp
ace
Co
mp
anie
s
Years
Brevard
Duval
Lee
Sarasota
Seminole
Volusia
Phase Two of the Economic Impact of Aerospace in Florida
29 | P a g e
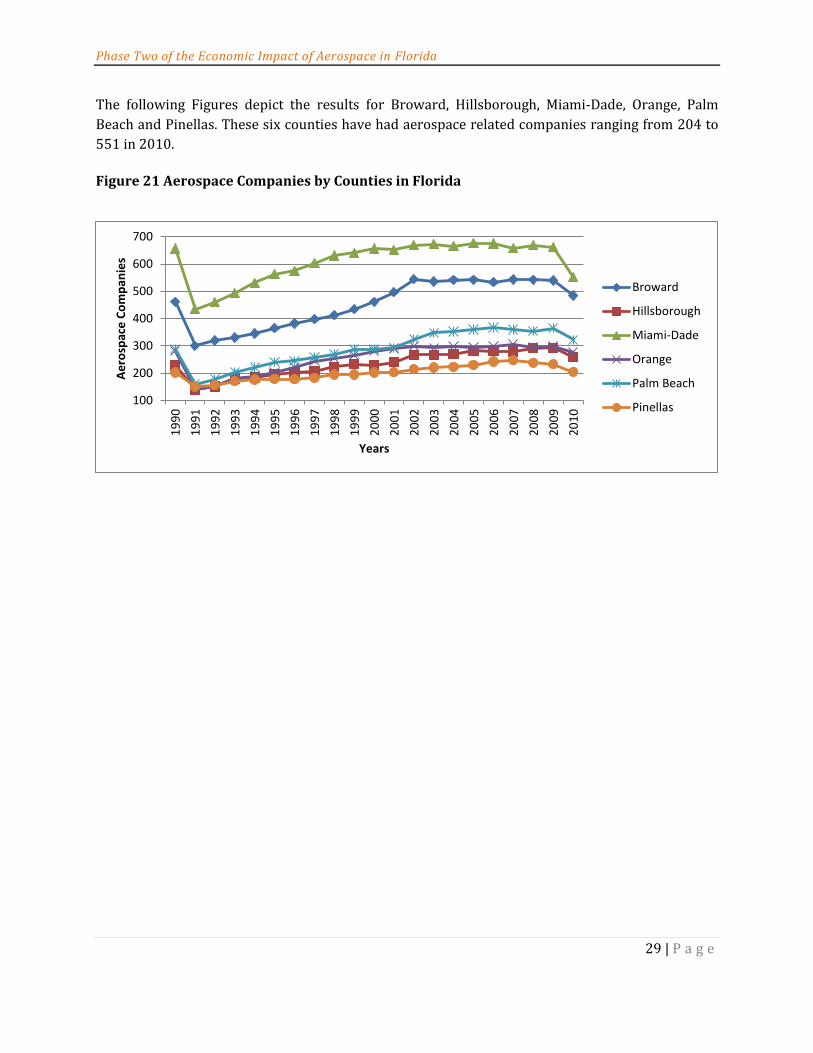
The following Figures depict the results for Broward, Hillsborough, Miami-Dade, Orange, Palm
Beach and Pinellas. These six counties have had aerospace related companies ranging from 204 to
551 in 2010.
Figure 21 Aerospace Companies by Counties in Florida
100
200
300
400
500
600
700
19
90
19
91
19
92
19
93
19
94
19
95
19
96
19
97
19
98
19
99
20
00
20
01
20
02
20
03
20
04
20
05
20
06
20
07
20
08
20
09
20
10
Ae
rosp
ace
Co
mp
anie
s
Years
Broward
Hillsborough
Miami-Dade
Orange
Palm Beach
Pinellas
Phase Two of the Economic Impact of Aerospace in Florida
30 | P a g e
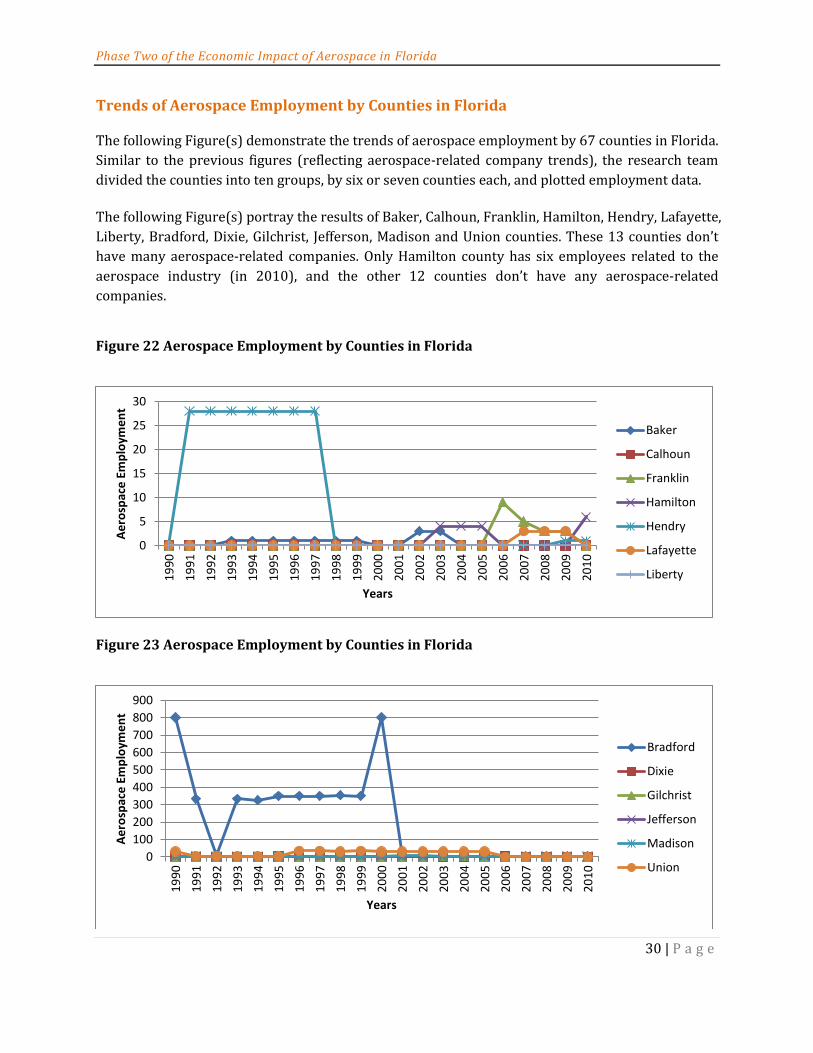
Trends of Aerospace Employment by Counties in Florida The following Figure(s) demonstrate the trends of aerospace employment by 67 counties in Florida.
Similar to the previous figures (reflecting aerospace-related company trends), the research team
divided the counties into ten groups, by six or seven counties each, and plotted employment data.
The following Figure(s) portray the results of Baker, Calhoun, Franklin, Hamilton, Hendry, Lafayette,
Liberty, Bradford, Dixie, Gilchrist, Jefferson, Madison and Union counties. These 13 counties don’t
have many aerospace-related companies. Only Hamilton county has six employees related to the
aerospace industry (in 2010), and the other 12 counties don’t have any aerospace-related
companies.
Figure 22 Aerospace Employment by Counties in Florida
Figure 23 Aerospace Employment by Counties in Florida
0
5
10
15
20
25
30
19
90
19
91
19
92
19
93
19
94
19
95
19
96
19
97
19
98
19
99
20
00
20
01
20
02
20
03
20
04
20
05
20
06
20
07
20
08
20
09
20
10
Ae
rosp
ace
Em
plo
yme
nt
Years
Baker
Calhoun
Franklin
Hamilton
Hendry
Lafayette
Liberty
0
100
200
300
400
500
600
700
800
900
19
90
19
91
19
92
19
93
19
94
19
95
19
96
19
97
19
98
19
99
20
00
20
01
20
02
20
03
20
04
20
05
20
06
20
07
20
08
20
09
20
10
Ae
rosp
ace
Em
plo
yme
nt
Years
Bradford
Dixie
Gilchrist
Jefferson
Madison
Union
Phase Two of the Economic Impact of Aerospace in Florida
31 | P a g e
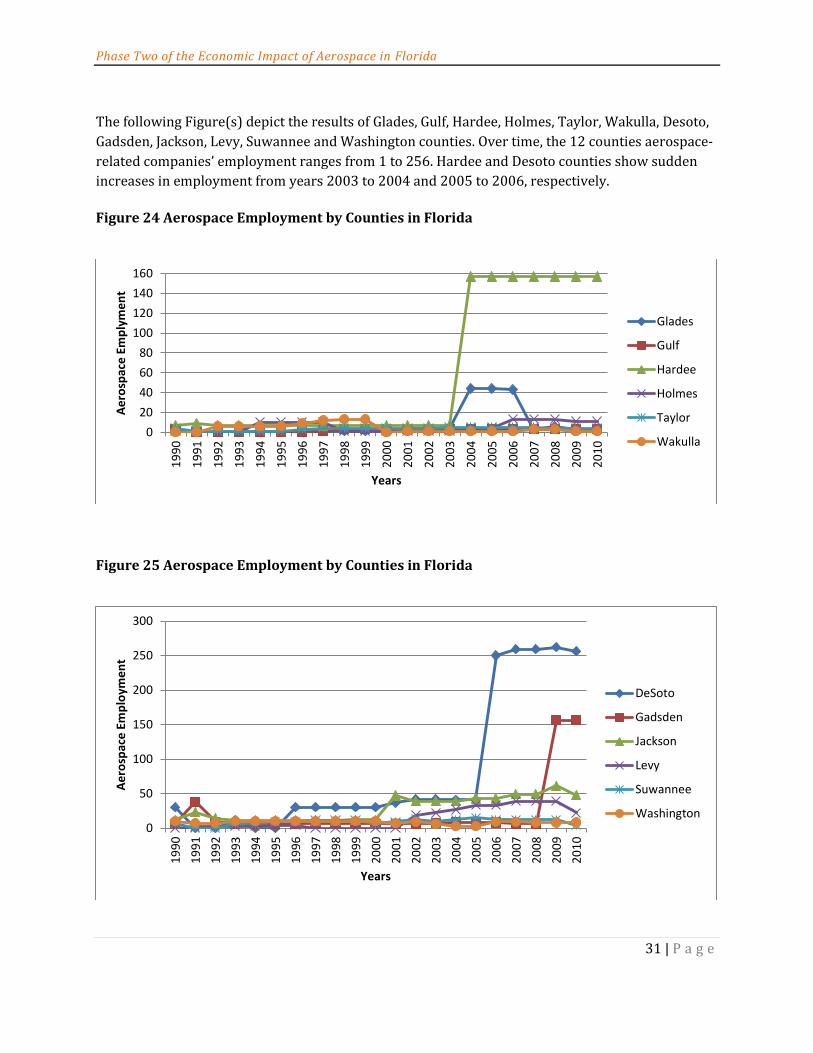
The following Figure(s) depict the results of Glades, Gulf, Hardee, Holmes, Taylor, Wakulla, Desoto,
Gadsden, Jackson, Levy, Suwannee and Washington counties. Over time, the 12 counties aerospace-
related companies’ employment ranges from 1 to 256. Hardee and Desoto counties show sudden
increases in employment from years 2003 to 2004 and 2005 to 2006, respectively.
Figure 24 Aerospace Employment by Counties in Florida
Figure 25 Aerospace Employment by Counties in Florida
0
20
40
60
80
100
120
140
160
19
90
19
91
19
92
19
93
19
94
19
95
19
96
19
97
19
98
19
99
20
00
20
01
20
02
20
03
20
04
20
05
20
06
20
07
20
08
20
09
20
10
Ae
rosp
ace
Em
ply
me
nt
Years
Glades
Gulf
Hardee
Holmes
Taylor
Wakulla
0
50
100
150
200
250
300
19
90
19
91
19
92
19
93
19
94
19
95
19
96
19
97
19
98
19
99
20
00
20
01
20
02
20
03
20
04
20
05
20
06
20
07
20
08
20
09
20
10
Ae
rosp
ace
Em
plo
yme
nt
Years
DeSoto
Gadsden
Jackson
Levy
Suwannee
Washington
Phase Two of the Economic Impact of Aerospace in Florida
32 | P a g e
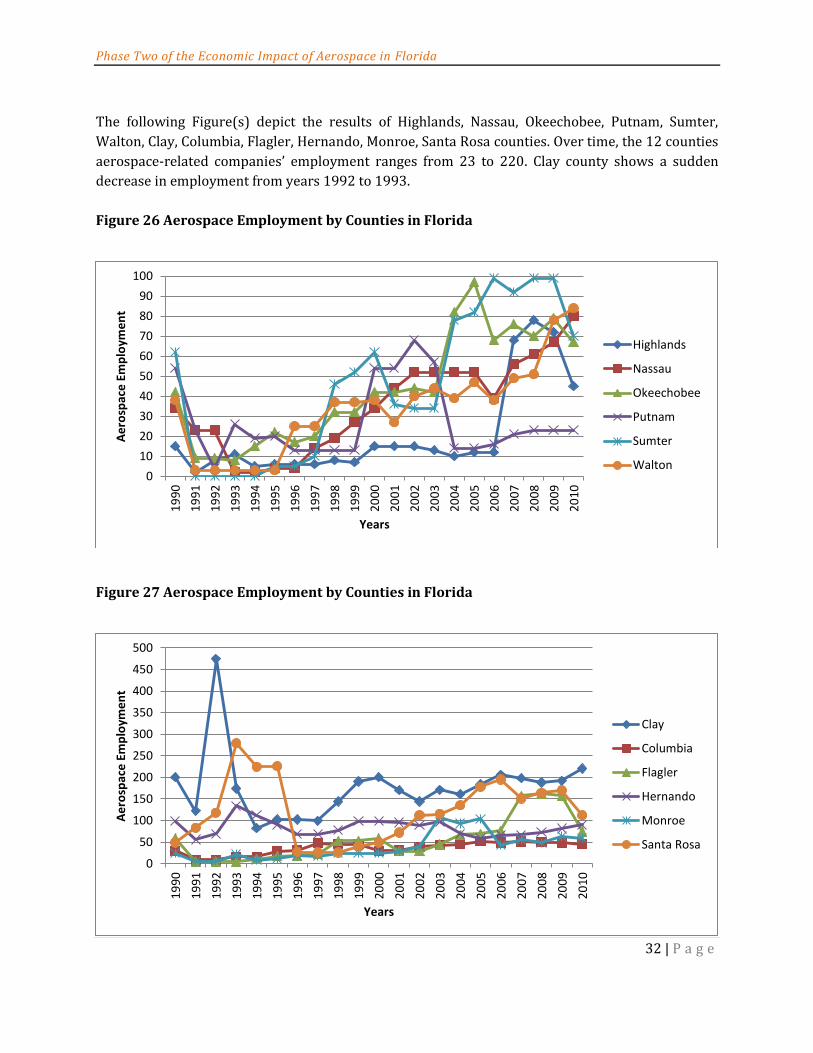
The following Figure(s) depict the results of Highlands, Nassau, Okeechobee, Putnam, Sumter,
Walton, Clay, Columbia, Flagler, Hernando, Monroe, Santa Rosa counties. Over time, the 12 counties
aerospace-related companies’ employment ranges from 23 to 220. Clay county shows a sudden
decrease in employment from years 1992 to 1993.
Figure 26 Aerospace Employment by Counties in Florida
Figure 27 Aerospace Employment by Counties in Florida
0
10
20
30
40
50
60
70
80
90
100
19
90
19
91
19
92
19
93
19
94
19
95
19
96
19
97
19
98
19
99
20
00
20
01
20
02
20
03
20
04
20
05
20
06
20
07
20
08
20
09
20
10
Ae
rosp
ace
Em
plo
yme
nt
Years
Highlands
Nassau
Okeechobee
Putnam
Sumter
Walton
0
50
100
150
200
250
300
350
400
450
500
19
90
19
91
19
92
19
93
19
94
19
95
19
96
19
97
19
98
19
99
20
00
20
01
20
02
20
03
20
04
20
05
20
06
20
07
20
08
20
09
20
10
Ae
rosp
ace
Em
plo
yme
nt
Years
Clay
Columbia
Flagler
Hernando
Monroe
Santa Rosa
Phase Two of the Economic Impact of Aerospace in Florida
33 | P a g e
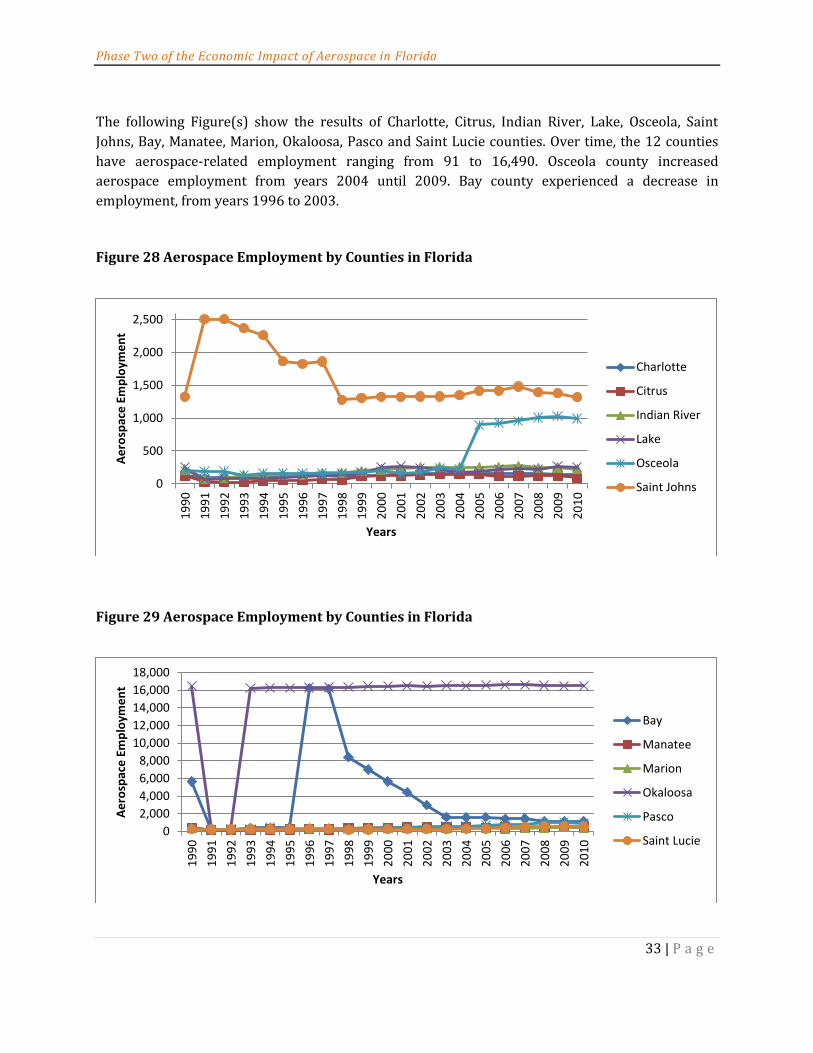
The following Figure(s) show the results of Charlotte, Citrus, Indian River, Lake, Osceola, Saint
Johns, Bay, Manatee, Marion, Okaloosa, Pasco and Saint Lucie counties. Over time, the 12 counties
have aerospace-related employment ranging from 91 to 16,490. Osceola county increased
aerospace employment from years 2004 until 2009. Bay county experienced a decrease in
employment, from years 1996 to 2003.
Figure 28 Aerospace Employment by Counties in Florida
Figure 29 Aerospace Employment by Counties in Florida
0
500
1,000
1,500
2,000
2,500
19
90
19
91
19
92
19
93
19
94
19
95
19
96
19
97
19
98
19
99
20
00
20
01
20
02
20
03
20
04
20
05
20
06
20
07
20
08
20
09
20
10
Ae
rosp
ace
Em
plo
yme
nt
Years
Charlotte
Citrus
Indian River
Lake
Osceola
Saint Johns
0
2,000
4,000
6,000
8,000
10,000
12,000
14,000
16,000
18,000
19
90
19
91
19
92
19
93
19
94
19
95
19
96
19
97
19
98
19
99
20
00
20
01
20
02
20
03
20
04
20
05
20
06
20
07
20
08
20
09
20
10
Ae
rosp
ace
Em
plo
yme
nt
Years
Bay
Manatee
Marion
Okaloosa
Pasco
Saint Lucie
Phase Two of the Economic Impact of Aerospace in Florida
34 | P a g e
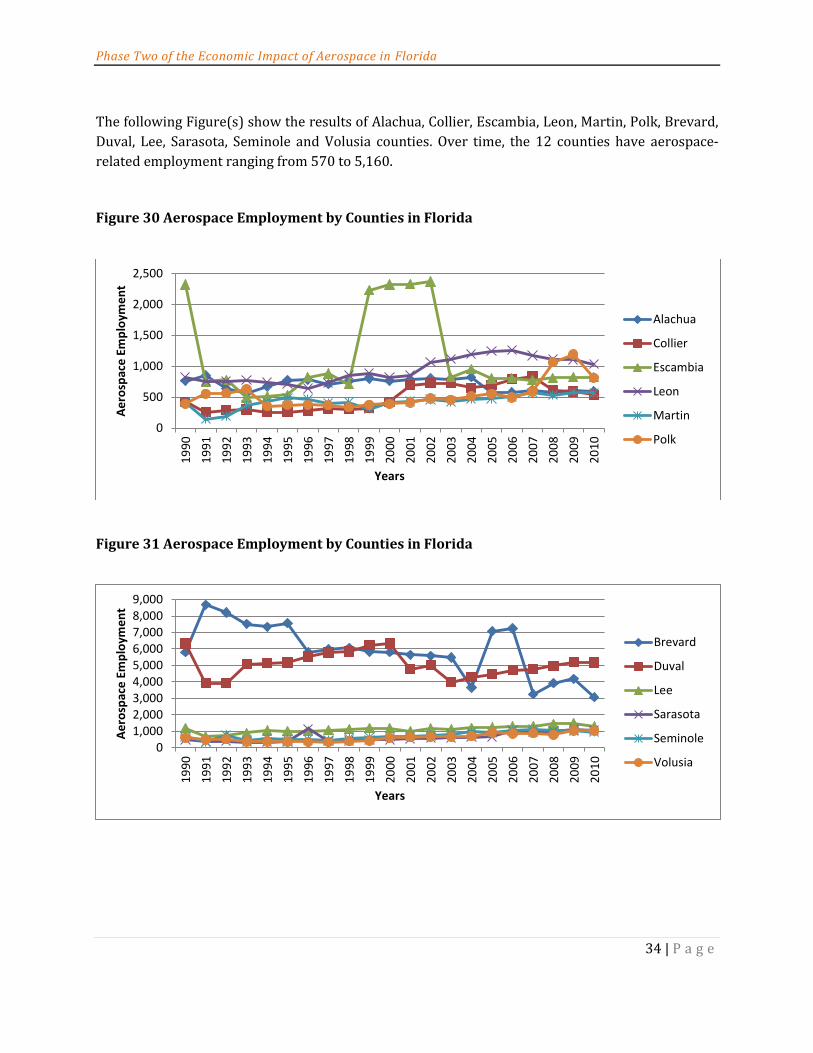
The following Figure(s) show the results of Alachua, Collier, Escambia, Leon, Martin, Polk, Brevard,
Duval, Lee, Sarasota, Seminole and Volusia counties. Over time, the 12 counties have aerospace-
related employment ranging from 570 to 5,160.
Figure 30 Aerospace Employment by Counties in Florida
Figure 31 Aerospace Employment by Counties in Florida
0
500
1,000
1,500
2,000
2,500
19
90
19
91
19
92
19
93
19
94
19
95
19
96
19
97
19
98
19
99
20
00
20
01
20
02
20
03
20
04
20
05
20
06
20
07
20
08
20
09
20
10
Ae
rosp
ace
Em
plo
yme
nt
Years
Alachua
Collier
Escambia
Leon
Martin
Polk
01,0002,0003,0004,0005,0006,0007,0008,0009,000
19
90
19
91
19
92
19
93
19
94
19
95
19
96
19
97
19
98
19
99
20
00
20
01
20
02
20
03
20
04
20
05
20
06
20
07
20
08
20
09
20
10
Ae
rosp
ace
Em
plo
yme
nt
Years
Brevard
Duval
Lee
Sarasota
Seminole
Volusia
Phase Two of the Economic Impact of Aerospace in Florida
35 | P a g e
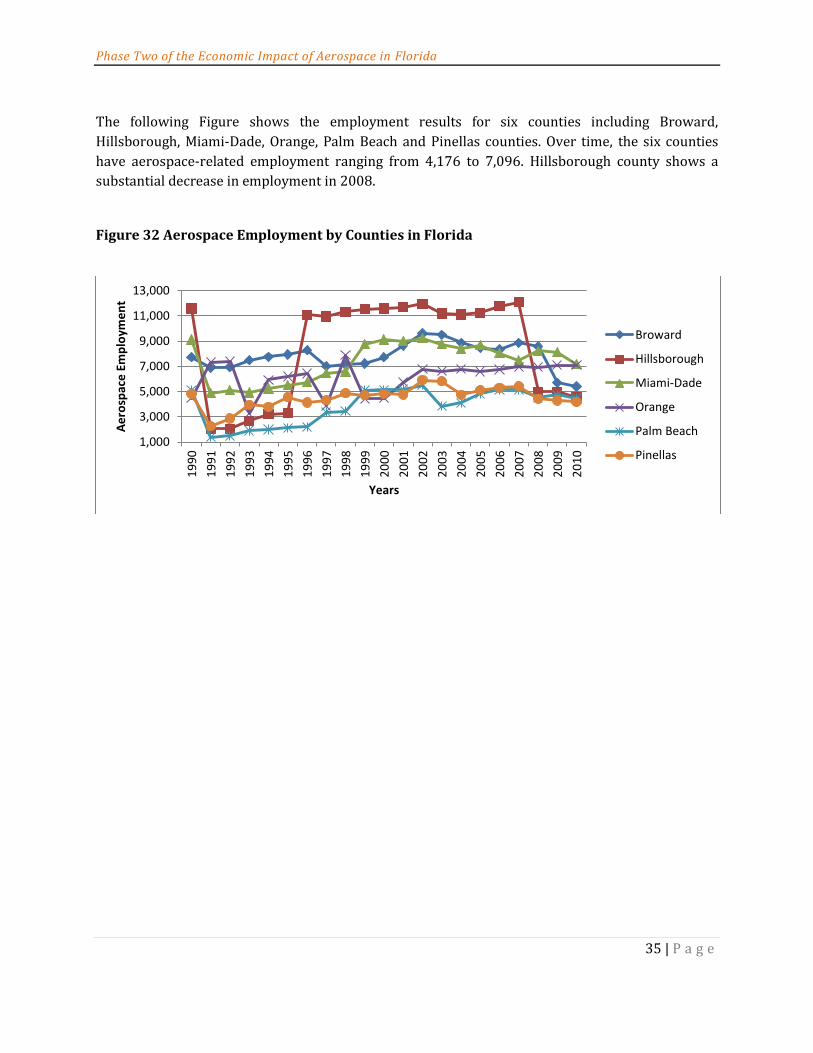
The following Figure shows the employment results for six counties including Broward,
Hillsborough, Miami-Dade, Orange, Palm Beach and Pinellas counties. Over time, the six counties
have aerospace-related employment ranging from 4,176 to 7,096. Hillsborough county shows a
substantial decrease in employment in 2008.
Figure 32 Aerospace Employment by Counties in Florida
1,000
3,000
5,000
7,000
9,000
11,000
13,000
19
90
19
91
19
92
19
93
19
94
19
95
19
96
19
97
19
98
19
99
20
00
20
01
20
02
20
03
20
04
20
05
20
06
20
07
20
08
20
09
20
10
Ae
rosp
ace
Em
plo
yme
nt
Years
Broward
Hillsborough
Miami-Dade
Orange
Palm Beach
Pinellas
Phase Two of the Economic Impact of Aerospace in Florida
36 | P a g e
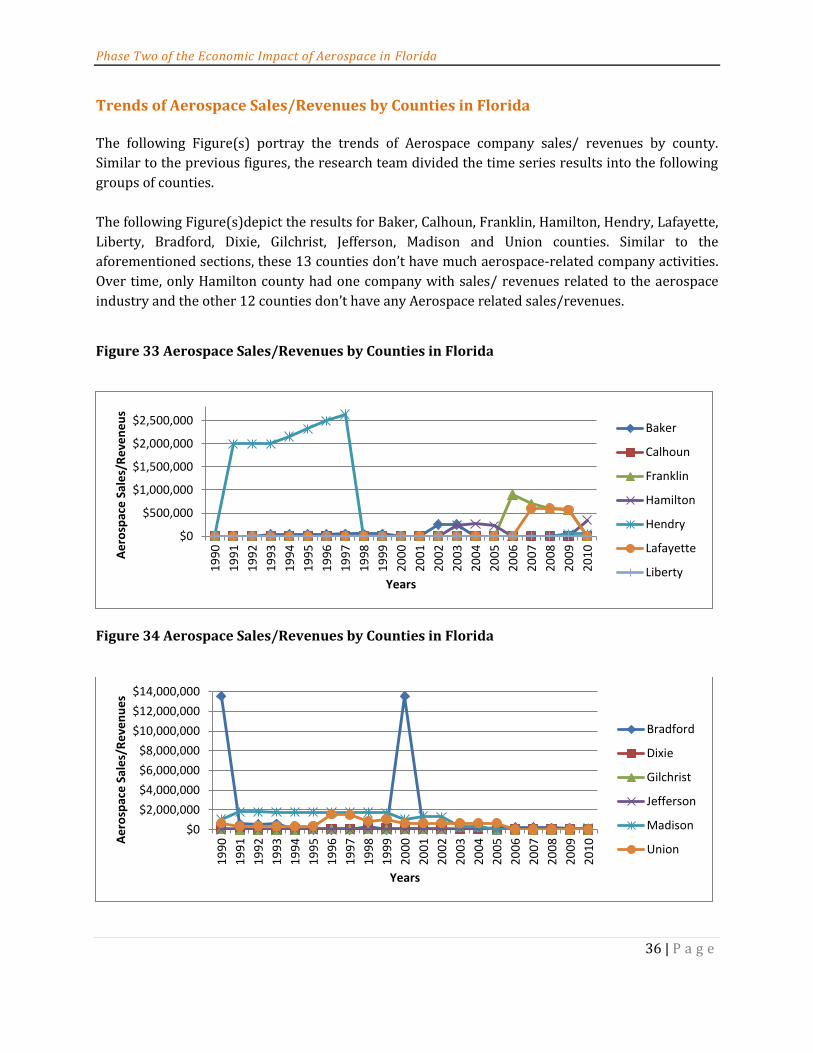
Trends of Aerospace Sales/Revenues by Counties in Florida
The following Figure(s) portray the trends of Aerospace company sales/ revenues by county.
Similar to the previous figures, the research team divided the time series results into the following
groups of counties.
The following Figure(s)depict the results for Baker, Calhoun, Franklin, Hamilton, Hendry, Lafayette,
Liberty, Bradford, Dixie, Gilchrist, Jefferson, Madison and Union counties. Similar to the
aforementioned sections, these 13 counties don’t have much aerospace-related company activities.
Over time, only Hamilton county had one company with sales/ revenues related to the aerospace
industry and the other 12 counties don’t have any Aerospace related sales/revenues.
Figure 33 Aerospace Sales/Revenues by Counties in Florida
Figure 34 Aerospace Sales/Revenues by Counties in Florida
$0
$500,000
$1,000,000
$1,500,000
$2,000,000
$2,500,000
19
90
19
91
19
92
19
93
19
94
19
95
19
96
19
97
19
98
19
99
20
00
20
01
20
02
20
03
20
04
20
05
20
06
20
07
20
08
20
09
20
10
Ae
rosp
ace
Sal
es/
Re
ven
eu
s
Years
Baker
Calhoun
Franklin
Hamilton
Hendry
Lafayette
Liberty
$0
$2,000,000
$4,000,000
$6,000,000
$8,000,000
$10,000,000
$12,000,000
$14,000,000
19
90
19
91
19
92
19
93
19
94
19
95
19
96
19
97
19
98
19
99
20
00
20
01
20
02
20
03
20
04
20
05
20
06
20
07
20
08
20
09
20
10A
ero
spac
e S
ale
s/R
eve
nu
es
Years
Bradford
Dixie
Gilchrist
Jefferson
Madison
Union
Phase Two of the Economic Impact of Aerospace in Florida
37 | P a g e
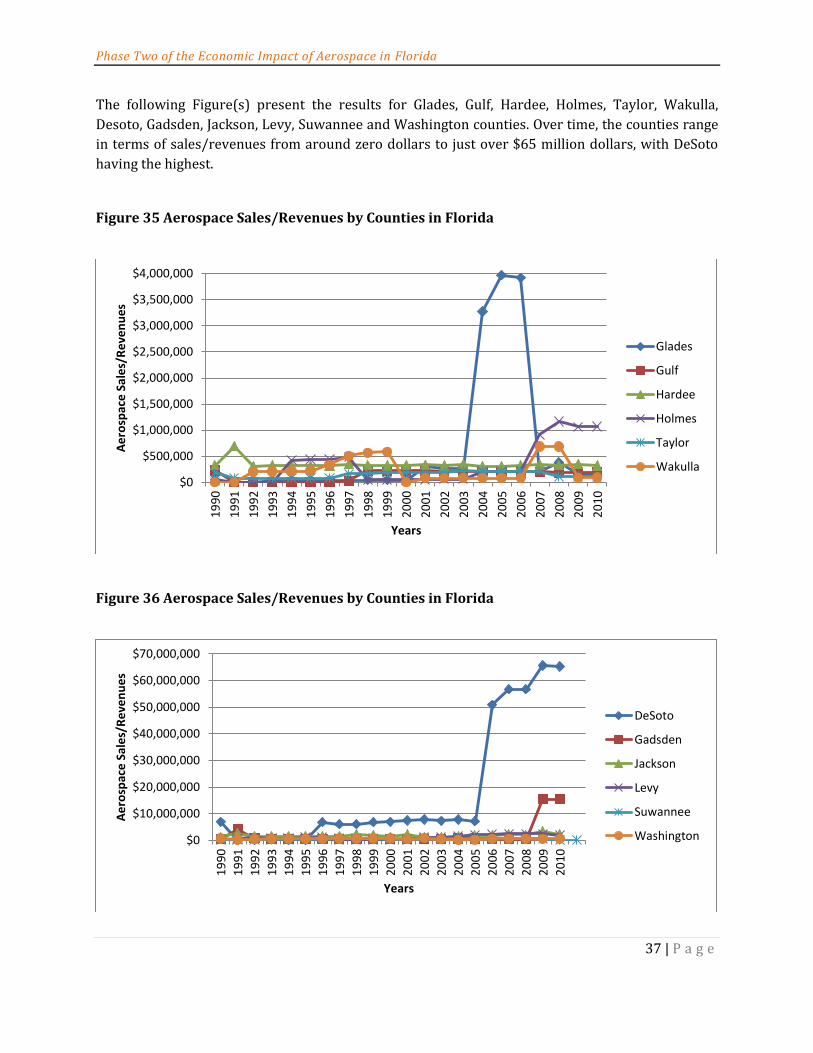
The following Figure(s) present the results for Glades, Gulf, Hardee, Holmes, Taylor, Wakulla,
Desoto, Gadsden, Jackson, Levy, Suwannee and Washington counties. Over time, the counties range
in terms of sales/revenues from around zero dollars to just over $65 million dollars, with DeSoto
having the highest.
Figure 35 Aerospace Sales/Revenues by Counties in Florida
Figure 36 Aerospace Sales/Revenues by Counties in Florida
$0
$500,000
$1,000,000
$1,500,000
$2,000,000
$2,500,000
$3,000,000
$3,500,000
$4,000,000
19
90
19
91
19
92
19
93
19
94
19
95
19
96
19
97
19
98
19
99
20
00
20
01
20
02
20
03
20
04
20
05
20
06
20
07
20
08
20
09
20
10
Ae
rosp
ace
Sal
es/
Re
ven
ue
s
Years
Glades
Gulf
Hardee
Holmes
Taylor
Wakulla
$0
$10,000,000
$20,000,000
$30,000,000
$40,000,000
$50,000,000
$60,000,000
$70,000,000
19
90
19
91
19
92
19
93
19
94
19
95
19
96
19
97
19
98
19
99
20
00
20
01
20
02
20
03
20
04
20
05
20
06
20
07
20
08
20
09
20
10
Ae
rosp
ace
Sal
es/
Re
ven
ue
s
Years
DeSoto
Gadsden
Jackson
Levy
Suwannee
Washington
Phase Two of the Economic Impact of Aerospace in Florida
38 | P a g e
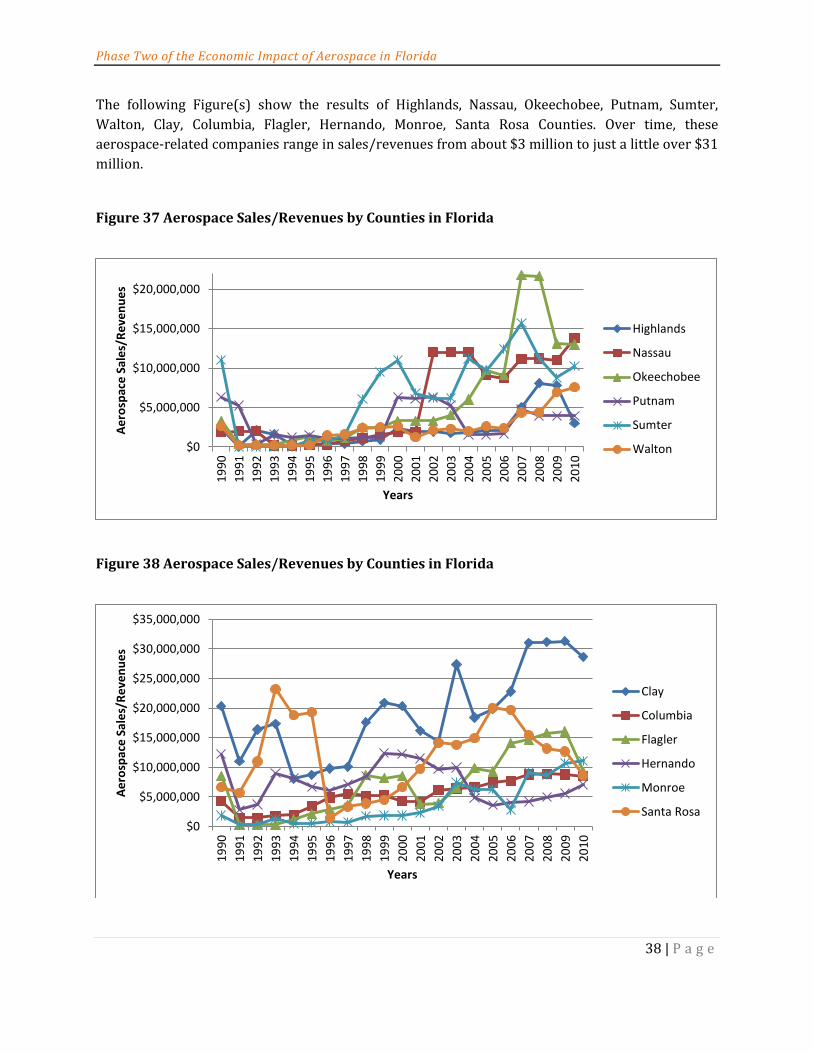
The following Figure(s) show the results of Highlands, Nassau, Okeechobee, Putnam, Sumter,
Walton, Clay, Columbia, Flagler, Hernando, Monroe, Santa Rosa Counties. Over time, these
aerospace-related companies range in sales/revenues from about $3 million to just a little over $31
million.
Figure 37 Aerospace Sales/Revenues by Counties in Florida
Figure 38 Aerospace Sales/Revenues by Counties in Florida
$0
$5,000,000
$10,000,000
$15,000,000
$20,000,000
19
90
19
91
19
92
19
93
19
94
19
95
19
96
19
97
19
98
19
99
20
00
20
01
20
02
20
03
20
04
20
05
20
06
20
07
20
08
20
09
20
10
Ae
rosp
ace
Sal
es/
Re
ven
ue
s
Years
Highlands
Nassau
Okeechobee
Putnam
Sumter
Walton
$0
$5,000,000
$10,000,000
$15,000,000
$20,000,000
$25,000,000
$30,000,000
$35,000,000
19
90
19
91
19
92
19
93
19
94
19
95
19
96
19
97
19
98
19
99
20
00
20
01
20
02
20
03
20
04
20
05
20
06
20
07
20
08
20
09
20
10
Ae
rosp
ace
Sal
es/
Re
ven
ue
s
Years
Clay
Columbia
Flagler
Hernando
Monroe
Santa Rosa
Phase Two of the Economic Impact of Aerospace in Florida
39 | P a g e
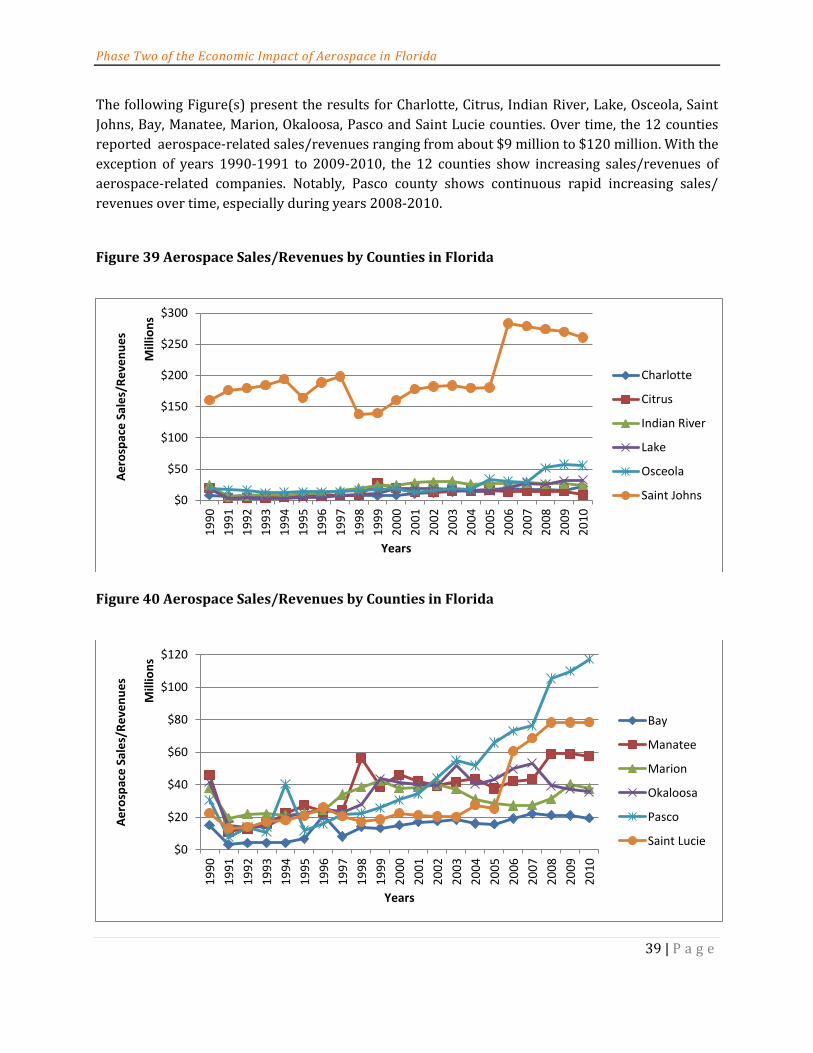
The following Figure(s) present the results for Charlotte, Citrus, Indian River, Lake, Osceola, Saint
Johns, Bay, Manatee, Marion, Okaloosa, Pasco and Saint Lucie counties. Over time, the 12 counties
reported aerospace-related sales/revenues ranging from about $9 million to $120 million. With the
exception of years 1990-1991 to 2009-2010, the 12 counties show increasing sales/revenues of
aerospace-related companies. Notably, Pasco county shows continuous rapid increasing sales/
revenues over time, especially during years 2008-2010.
Figure 39 Aerospace Sales/Revenues by Counties in Florida
Figure 40 Aerospace Sales/Revenues by Counties in Florida
$0
$50
$100
$150
$200
$250
$300
19
90
19
91
19
92
19
93
19
94
19
95
19
96
19
97
19
98
19
99
20
00
20
01
20
02
20
03
20
04
20
05
20
06
20
07
20
08
20
09
20
10
Ae
rosp
ace
Sal
es/
Re
ven
ue
s
Mill
ion
s
Years
Charlotte
Citrus
Indian River
Lake
Osceola
Saint Johns
$0
$20
$40
$60
$80
$100
$120
19
90
19
91
19
92
19
93
19
94
19
95
19
96
19
97
19
98
19
99
20
00
20
01
20
02
20
03
20
04
20
05
20
06
20
07
20
08
20
09
20
10
Ae
rosp
ace
Sal
es/
Re
ven
ue
s
Mill
ion
s
Years
Bay
Manatee
Marion
Okaloosa
Pasco
Saint Lucie
Phase Two of the Economic Impact of Aerospace in Florida
40 | P a g e
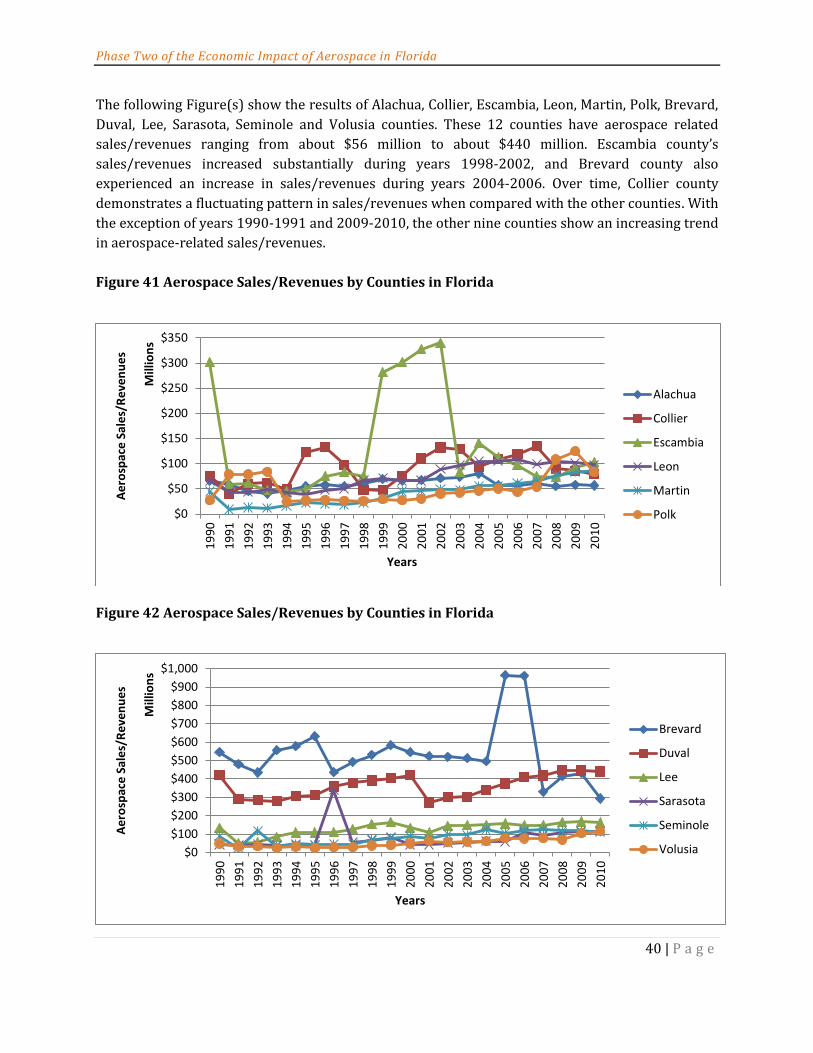
The following Figure(s) show the results of Alachua, Collier, Escambia, Leon, Martin, Polk, Brevard,
Duval, Lee, Sarasota, Seminole and Volusia counties. These 12 counties have aerospace related
sales/revenues ranging from about $56 million to about $440 million. Escambia county’s
sales/revenues increased substantially during years 1998-2002, and Brevard county also
experienced an increase in sales/revenues during years 2004-2006. Over time, Collier county
demonstrates a fluctuating pattern in sales/revenues when compared with the other counties. With
the exception of years 1990-1991 and 2009-2010, the other nine counties show an increasing trend
in aerospace-related sales/revenues.
Figure 41 Aerospace Sales/Revenues by Counties in Florida
Figure 42 Aerospace Sales/Revenues by Counties in Florida
$0
$50
$100
$150
$200
$250
$300
$350
19
90
19
91
19
92
19
93
19
94
19
95
19
96
19
97
19
98
19
99
20
00
20
01
20
02
20
03
20
04
20
05
20
06
20
07
20
08
20
09
20
10
Ae
rosp
ace
Sal
es/
Re
ven
ue
s
Mill
ion
s
Years
Alachua
Collier
Escambia
Leon
Martin
Polk
$0
$100
$200
$300
$400
$500
$600
$700
$800
$900
$1,000
19
90
19
91
19
92
19
93
19
94
19
95
19
96
19
97
19
98
19
99
20
00
20
01
20
02
20
03
20
04
20
05
20
06
20
07
20
08
20
09
20
10
Ae
rosp
ace
Sal
es/
Re
ven
ue
s
Mill
ion
s
Years
Brevard
Duval
Lee
Sarasota
Seminole
Volusia
Phase Two of the Economic Impact of Aerospace in Florida
41 | P a g e
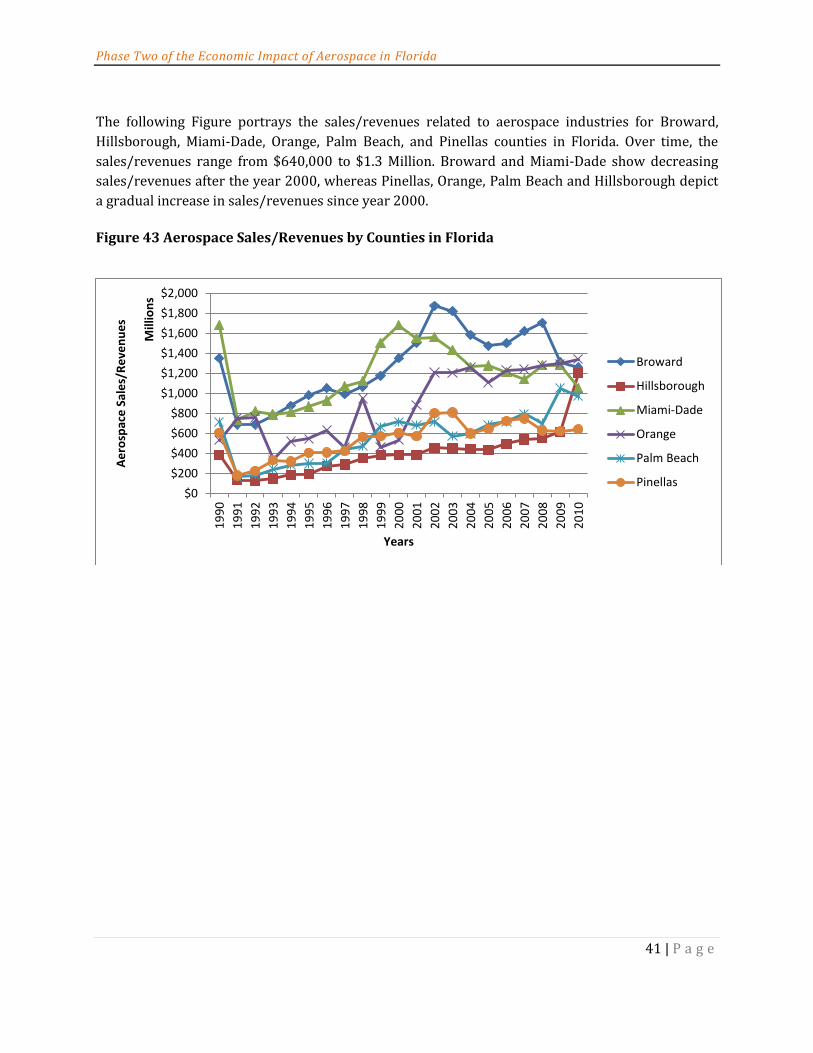
The following Figure portrays the sales/revenues related to aerospace industries for Broward,
Hillsborough, Miami-Dade, Orange, Palm Beach, and Pinellas counties in Florida. Over time, the
sales/revenues range from $640,000 to $1.3 Million. Broward and Miami-Dade show decreasing
sales/revenues after the year 2000, whereas Pinellas, Orange, Palm Beach and Hillsborough depict
a gradual increase in sales/revenues since year 2000.
Figure 43 Aerospace Sales/Revenues by Counties in Florida
$0
$200
$400
$600
$800
$1,000
$1,200
$1,400
$1,600
$1,800
$2,000
19
90
19
91
19
92
19
93
19
94
19
95
19
96
19
97
19
98
19
99
20
00
20
01
20
02
20
03
20
04
20
05
20
06
20
07
20
08
20
09
20
10
Ae
rosp
ace
Sal
es/
Re
ven
ue
s
Mill
ion
s
Years
Broward
Hillsborough
Miami-Dade
Orange
Palm Beach
Pinellas
Phase Two of the Economic Impact of Aerospace in Florida
42 | P a g e
V. Economic Impact Analysis
The IMPLAN Economic Impact Model Methodology
The county-specific economic impact analysis was performed using the state of Florida Impact
Analysis for Planning, or IMPLAN, model, a widely accepted and used integrated input-output
model. IMPLAN is used extensively by state and local government agencies to measure proposed
legislative and other program and policy economic impacts across the private and public sectors. In
addition, it is the tool of choice to measure these impacts by a number of universities and private
research groups that evaluate economic impacts across the state and nation. There are several
advantages to using IMPLAN:
It is calibrated to local conditions using a relatively large amount of local county level and
state of Florida specific data;
It is based on a strong theoretical foundation
It uses a well-researched and accepted applied economics impact assessment
methodology supported by many years of use across all regions of the U.S.
The IMPLAN model used for this analysis was specifically developed for the counties of Florida, and
includes 440 sectors, and latest dataset – year 2010 data. IMPLAN’s principal advantage is that it
may be used to forecast direct, indirect and induced economic effects for an initial economic
stimulus.
Primary Input Data for Economic Impact Model(s)
The following table presents the primary input data for the economic impact model for the Phase
One economic analysis.
National Establishment Time Series (NETS) dataset 17 for Florida aerospace-related
businesses, based on 6-digit NAICS codes and 8-digit SIC codes associated with the Space
Florida categories (see Appendix A for a listing of “aerospace” industries and other standard
definition/NAICS).
17 National Establishment Time Series (NETS) dataset was developed to better describe the dynamics of the
US economy by Walls & Associates teaming up with Dun and Bradstreet. Presently In 2012, the NETS
Database has taken twenty-one annual snapshots (taken every January) of the full Duns Marketing
Information (DMI) file that followed over 44.2 million establishments between January 1990 and January
2010.
Phase Two of the Economic Impact of Aerospace in Florida
43 | P a g e
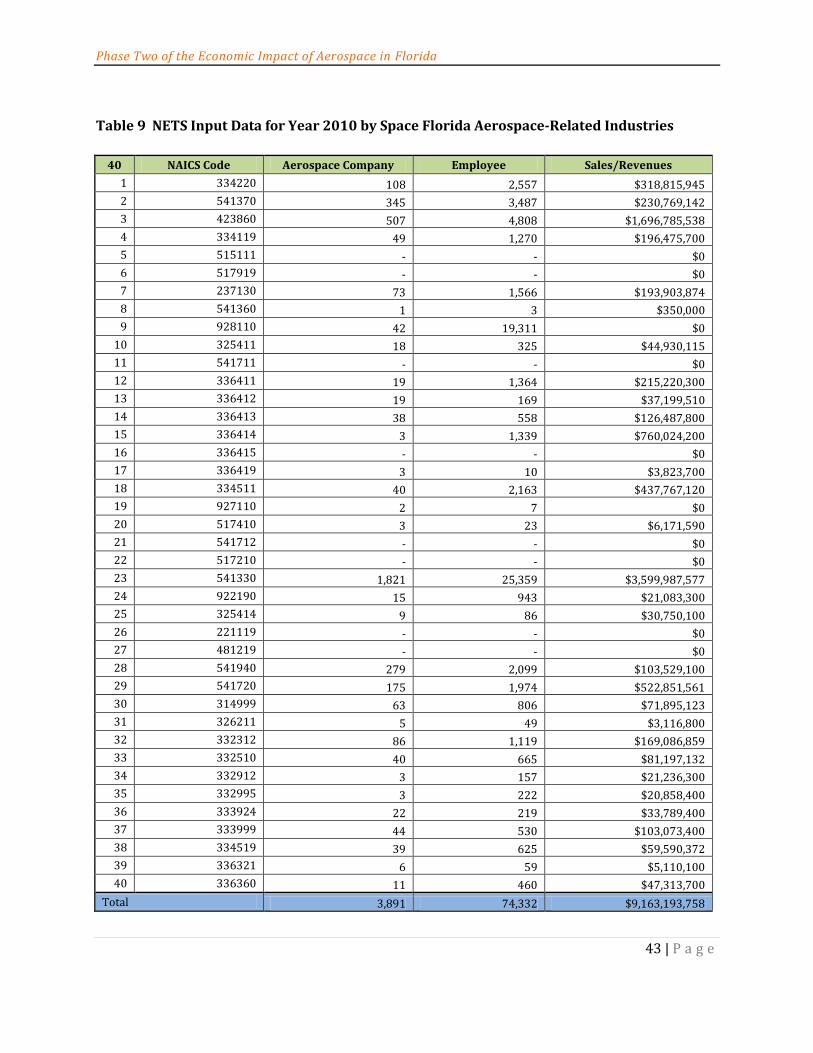
Table 9 NETS Input Data for Year 2010 by Space Florida Aerospace-Related Industries
40 NAICS Code Aerospace Company Employee Sales/Revenues