294
Ph.D. Thesis: Economic Growth and Inequality: The Colombian Experience 1930-1990 Simon G. Ford London School o f Economics and Political Science (4293) i W l

Ph.D. Thesis:
Economic Growth and Inequality: The Colombian Experience
1930-1990
Simon G. Ford
London School of Economics and Political Science (4293) iW l

UMI Number: U615797
All rights reserved
INFORMATION TO ALL USERS The quality of this reproduction is dependent upon the quality of the copy submitted.
In the unlikely event that the author did not send a complete manuscript and there are missing pages, these will be noted. Also, if material had to be removed,
a note will indicate the deletion.
Dissertation Publishing
UMI U615797Published by ProQuest LLC 2014. Copyright in the Dissertation held by the Author.
Microform Edition © ProQuest LLC.All rights reserved. This work is protected against
unauthorized copying under Title 17, United States Code.
ProQuest LLC 789 East Eisenhower Parkway
P.O. Box 1346 Ann Arbor, Ml 48106-1346

P73 7S
pOUTlCM-
J'gi+l+OS

Poverty makes a mockery o f what
human life should be.
Bertrand Russell
Abstract
The thesis is concerned with the relationship between economic growth, defined by GNP per capita, and inequality. The latter is discussed with reference to income distribution and poverty.Firstly, the theoretical background to the debate is outlined. While
considering a wide array of positions, it focuses particularly on the influential thesis of Simon Kuznets (1955), which posits a relationship between a country's economic growth and its income distribution profile. Kuznets' thesis is discussed at length and compared to other interpretations of the relationship.
The Colombian experience is then brought in, as a case study with which to test Kuznets' proposition. Published research and other available data, covering the period up to 1978, is then reviewed, before the latest available data - official statistics and other sources, supplemented by interviews carried out by the author - covering the 1978-1990 period, is presented and discussed in detail. A comparison of the inequality profile in the period up to 1978 with that between 1978- 1990 is then presented.
Following this, some possible determinants - both economic and sociological - of the income distribution and poverty trends between 1978 and 1990 are discussed. These include those related to the economy, the government, education, the drug-trade, and the ' culture of violence'. Conclusions are arrived at as to the influence of each.
An overall conclusion is then drawn, which attempts to highlight the links between the Kuznets thesis and the Colombian experience. The problems of a thesis such as Kuznets', arrived at with cross-sectional data, are discussed, as are those associated with using a case study approach to 'test' an hypothesis.
Finally, the thesis includes two appendices, the first discussing the data used to assess the income distribution and poverty profiles in the period 1978-1990, the second outlining the advantages and disadvantages of the various measures of inequality employed in the study.
Contents
Chapter 1 The Theoretical Debate (p.l)
1 - 4 (1) Introduction
4 - 1 4 (2) Inequality and Economic Development - InitialInterest and the Ideas of Simon Kuznets
14 - 23 (3) Responses to Kuznets (i)
24 - 38 (4) Responses to Kuznets (ii)
38 - 39 (5) Concluding Thoughts
40 - 44 Notes
Chapter 2 Inequality and Poverty in Colombia to the End of the 1970's (p.45)
45 - 48 (1) Introduction and Methodological Approach
48 - 65 (2) Income Distribution
66 - 75 (3) Poverty
75 - 79 (4) Two Further Aspects of Inequality: Regional Inequality and Social Mobility.
80 - 82 (5) Concluding Thoughts
82 - 87 Notes
Chapter 3 Income Distribution Trends in Colombia/ 1978 - 1990 (p.88)
89 - 105 (1) Urban Income Distribution:
i) Household distribution of income (94 - 97)ii) Household income per capita (97 - 100)
iii) Income distribution among receivers of income (100 - 102) iv) Labour incomes (102 - 105)
106 - 115 (2) Rural Income Distribution:
i) Per capita income distribution (106 - 109)ii) Household distribution of income (109 - 112)iii) Household income per capita (112 - 115)
115 - 117 (3) Wages During the 1980's
117 - 118 (4) Unemployment
119 - 120 (5) Summary
121 - 123 Notes
Chapter 4 Poverty Trends in Colombia, 1978-1990 (p.124)
124 - 131 (1) Two Methods of Estimating Poverty
131 - 144 (2) 1985 Census and 1984/5 Survey of Incomes andExpenditures
144 - 148 (3) Other Poverty Estimates for the 1980's
14 8 - 154 (4) Who Are the Poor?
154 - 156 (5) Summary
157 - 160 Notes
Chapter 5 Comparison of Pre-1978 Trends with 1978-1990Trends (p.161)
161 - 168 (1) Overall Changes in Inequality
168 - 172 (2) Changes in Rural Inequality:
i) Income Distribution (168 - 170)ii) Poverty (171 - 172)
173 - 175 (3) Changes in Urban Inequality:
i) Income Distribution (173 - 174)ii) Poverty (174 - 175)
175 - 180 (4) Changes to the Functional Distribution ofIncome
180 - 181 (5) Summary
182 Notes
Chapter 6 Determinants (p. 183)
183 - 187 Introduction
187 - 197 i) Economic Determinants
197 - 218 ii) Government-Driven Determinants:
a)b)
Government Social Programmes (198 - Taxation and Subsidies (211 - 218)
211)
218 - 225 iii) Education-Related Determinants:
a)b)
Level of Educational Provision (218 Social Mobility (223 - 225)
- 223)
226 - 234 iv) Drug-Related Determinants
234 - 238 v) 'Culture of Violence1 Related Determinants
239 - 253 vi) Conclusions: Substantive and Methodological
a)b)
Substantive (239 - 248) Methodological (248 - 251)
252 - 253 Notes
Appendix 1 Fieldwork and Data (p.254)
254 - 262 Fieldwork
262 - 266 The Data

Appendix 2 Measures of Inequality (267 - 269)
Bibliography (270 - 283)

LIST OF TABLES
Table Number
1
2
3
4
5
6
7
8
9
10
11
12
13
14
15
Title
Gini Coefficients for Different Countries (p. 35).
Distribution of Household Income in Countries of Different Income (GNP Per Capita) Levels (pp 37-38).
Percentage of Income Received by the Lowest Two-Thirds and the Top 10% (p. 53).
Percentage Shares of Total Monthly Income (p. 64).
Urban (Household) Income Distribution, 1984-1985 (p. 90).
Distribution of (Household) Expenditures, 1984-1985 (p. 91).
Household Income Distribution (13 Cities), 1984/1985 (p. 94).
Household Income Per Capita (13 Cities), 1984/85 (p. 98).
Income Distribution of Income Receivers (13 Cities), 1984/85 (p. 101).
Distribution of Labour Incomes (13 Cities) 1984/85 (p. 103).
Distribution of Rural (Individual) Income, 1988 (p. 107).
Rural Income Distribution (Households), 1988 (p. 110).
Distribution of Total Rural (Household) Income, 1988 (p. Ill).
Distribution of Rural (Household Per Capita) Income, 1988 (p. 113).
Households with NBI in the Urban Areas of each Department, 1985 (p. 133).

Households with NBI in the Rural Areas of each Department, 1985 (p. 134).
Households with NBI by Departments, 1985 (p. 136).
Income-Related Poverty in Rural Areas,1988 (p. 138).
Individuals Below the Poverty and Destitution Lines, 1984/85 (13 Cities),(p. 139).
Households Below the Poverty and Destitution Lines, 1984/85 (13 Cities),(p. 140).
Magnitude of Poverty, According to the Line of Poverty (LP) and Unsatisfied Basic Needs (NBI) Measures - 13 Cities (p. 142).
Numbers of Rural Poor According to NBI and LP, 1988 (p. 143).
'Crossing' NBI and LP, According to Households, 1986 - 1990 (7 Cities)(p. 146).
Income-Related Poverty in Colombia, 1970 - 1986 (p. 162).
Indicators of Inequality, 1938 - 1988 (p. 165).
Winners and Losers, 1982 - 1986 (p. 177) .

Chapter 1 The Theoretical Debate
1) Introduction
This study takes another look at a debate as old, probably, as any in
social science: the question of the interrelationships between three
variables: economic growth, income distribution and poverty.
Specifically, it looks at Colombia as a case study. In this way it is
hoped that untangling the webs woven by each variable in a single
country will give us a greater understanding of the strengths and
weaknesses of sociological and economic theory - which come together in
"economic sociology" - in this area.
Economic sociology, like political sociology, is one of those
boundary areas within social science, dealt with by specialists from
both economics and sociology. Its basic approach is to include a
genuinely social perspective in analyses of the economy, eschewing the
artificial division of labour between economics and sociology. The
1950's saw the first attempts at such fusion, with researchers like Gary
Becker and Anthony Downs contending that political and sociological
topics could be analysed with economic models (see Swedberg 1987; 1990a;
1990b; and Stinchcombe 1990, for a discussion of these arguments). In
the same decade, Parsons and Smelser (1956) suggested that "the degree
of separation between [economics and sociology] arbitrarily conceals a
degree of intrinsic intimacy between them.” (p xvii). They concluded, in
similar vein to this study, that:
Concrete economic processes are always conditioned by
non-economic factors which are most clearly apparent
in the parametric characteristics of the non-economic
sub-systems of the society. (p307).
More recently, Granovetter (1992a) has noted that scholars such as
Becker and Downs "showed that one should not assume that topics are
inherently 'economic' (as in: Why does something cost as much as it
does?) while others are 'social' (as in: Why do people vote as they
do?)." (p2). Rather, the 'economic' and the 'social' should be
synthesized: "closer attention to social structure would provide a more
satisfactory account of how economic patterns arise." (Granovetter
1992b, p 256) .
Broadly, the theoretical debate surrounding this study is about what
happens to societies as they grow. We are interested here in the
influences economic development, defined by GNP per capita levels, or
the lack of it, has upon inequality and vice versa. This debate began
some years ago with discussions and papers on the income distribution
profiles of England, the United States, Prussia, Saxony, Denmark and
Germany from the 18th century through the early 20th century. These
income distribution profiles were then superimposed upon each country's
level of economic development - size of GNP and speed of growth mainly -

and conclusions drawn as to the relations between the two. Specifically,
interest, focused on whether the level of a country's economic
development was associated with, or related to, its income distribution
profile: did concentration increase or decrease with economic
development?
More recently, the debate has turned to the developing world - Asia
and Latin America mainly - for its raw material. The starker
inequalities and often wildly fluctuating economic growth rates in these
countries are what probably attract the researcher, who goes in hope of
finding definite trends. More specifically, during the last three
decades much faith has been lost in the redistribution-with-growth
thesis associated with W.A. Lewis's (1954) model, especially among those
concerned with Latin America. The feeling has been that economic growth
is strongly biased toward income concentration and minimal rates of
improvement in the quality of life of the lowest 60 percent. After
surveying trends in the 1960's and 1970's, many commentators
especially those working in the international agencies - were unable to
see clear prospects of a significant and lasting reduction in the
inequalities existing between the base and the rest of the pyramid (the
Robert McNamara speech in Nairobi in 1973 - in McNamara, 1981 - is
probably the most famous exposition of such a view) . This has led to a
concern to redefine the whole purpose of development, with many
rejecting the idea of 'growth first, distributional justice later'. In
such a climate, it seems appropriate to take stock and look closely at
theory and empirical research on the subject. Thus the main purpose of
this chapter is to outline a hugely influential hypothesis on the
relation between economic growth/development and income distribution -

4
the Kuznets hypothesis - and then to discuss the responses it has
provoked.
2) Inequality and Economic Development - Initial Interest
and the Ideas of Simon Kuznets
Two thousand five hundred years ago Confucius thought that inequality
was to be lamented more than scarcity. Around the same time, in
Periclean Athens, the notion of human equality was evident. More
recently, the ideal of inequality came to mean, for many, economic
inequality. George Bernard Shaw remarked, in 1913, that: "When I speak
of the Case for Equality I mean human equality; and that, of course, can
only mean one thing: it means equality of income". Tawney (1931) called
for the equalising of opportunities, especially educational
opportunities, for all, in order to correct income and wealth
disparities. Sir Isaiah Berlin (1961) spoke of the need to make the case
for inequality rather than equality:
If I have a cake and there are ten persons among whom I
wish to divide it, then if I give exactly one tenth to
each, this will not, at any rate automatically, call for
justification; whereas if I depart from this principle

of equal division I am expected to produce a special
reason. (pl31).
A little later John Rawls (1971) gave us his principle of
(distributive) social justice, in which society should give priority to
improving the position of the least advantaged person. No inequality is
just, he alleges, unless it may be reasonably expected to benefit the
poorest. This theme has been flirted with since by moralists and social
scientists alike. The common refrain is that the aim of a society should
be to increase the income of the poor faster than that of the rich. The
economists' concept of 'marginal utility' is equally often invoked as
akin to "supporting evidence" on this. It states that an extra unit of
income is of more 'utility' (usefulness) to the less well-off than it is
to high income groups, as for the latter an extra unit of income, though
it might be welcomed, is not such a pressing need.
Among sociologists and economists, the issue of the contribution of
economic growth to the welfare of a country's inhabitants has a long
history, too. Down the years many have seen it as a type of social
scorecard; the resolution of claims by competing groups for the
economy's output. The appropriation of income has also been seen as one
of the main targets for political action and struggle. Money per se is
often included in this: "money is the object of intense competition in
every society where it is found".(1). Ricardo comments in a letter to
Malthus: "Political economy, you think, is an enquiry into the nature
and causes of wealth - I think it should be called an enquiry into the
laws which determine the division of the produce of industries amongst
the classes who concur in its formation". This statement, along with the

generalisations of the classical and Marxian schools about long term
trends in the distribution of the national product and the thesis of
increasing misery, together with the concern for low income groups who
may not be sharing in the country's economic growth, ushered in the
social problem of income distribution.
Weber touched upon it, without calling it by name, in his discussions
of 'market situations', which were tied up with one's material standard
of existence.(2). And Durkheim wrote of "an unjust advantage" existing
should one class in society be obliged to take any price for its
services while another could "abstain from such action thanks to
resources at his disposal".(3). Marx's theory of capitalist development
posits a forever worsening income distribution profile. This is no
surprise, considering his view that the goal of capitalism is to produce
profit and not to minister to the needs of the majority of the
population. Specifically, he alleges that a considerable segment of the
working class under capitalism is condemned to exist in a state of
physical poverty (the 'pauperisation'/'immiseration' thesis). Capitalism
is further characterised by increasing relative disparities between the
earnings of the working class and the income of the capitalist class.
Wages do not rise much above their subsistence value due to the
existence of the relative surplus population. (4).
The above writers, though, produced no theory of income distribution
nor indeed of how it might interplay with economic growth. This changed
in the first half of the 1950's. W.A. Lewis (1954) developed a model of
capitalist economic development under labour surplus conditions.
Inequality is reduced, Lewis contends, via an (unending) upward
differentiation of the labour force into skilled workers, supervisors,

and lower and middle professional classes. This occurs predominantly
within the enclave economy, but at the same time acute shortages of
unskilled labour are created which are filled by those from the
traditional sector.
Lewis's work was followed in 1955 by a Presidential Address to the
American Economic Association from Simon Kuznets on his research into
the subject, which, along with other studies of his, has since become
seminal. Later, in the 1960's and 1970's, more sociological accounts of
social change and inequality were published, including those by Lipset
(1963; 1966; 1978), Lenski (1966; see below) and Sombart (1976). These
were concerned with social change, social structure and inequality in a
comparative perspective. Lipset, for example, discussed the relationship
between income inequality and increased mechanisation:
It should be evident that those who foresee or advocate
no growth, who oppose technological expansion either
because they do not believe available resources will
sustain it or because they feel that a more-mechanised
system will be a dirtier society in a variety of
meanings of that term, must anticipate a future in
which the possibilities for progress toward greater
inequality will also decline. (1978 p94).
In an earlier work he discussed the links between democracy and
inequality, concluding that, in poorer countries at least: "The upper
strata not only resist democracy themselves; their often arrogant
political behaviour serves to intensify extremist reactions on the part

8
of the lower classes." (Lipset 1963 p52).
Kuznets' research, in that it analyses the relationship between
economic growth per se and inequality, represents a special case within
such general theorizing about inequality: apart from being the first
series of studies to look at the relationship over time and across
countries, Kuznets1 work was innovative in its attempt to embrace both
economic and social phenomena.
Kuznets begins by asking the two central questions in the debate.
Firstly: "Does inequality in the distribution of income increase or
decrease in the course of a country's economic growth?" Secondly: "What
factors determine the secular level and trends of income inequalities?".
He goes on to suggest the thesis that the trend (in the United
States, England and Germany) has been towards greater equality. This
reduction in inequality was accompanied by significant rises in real per
capita income in each of the three countries. However, in the early
stages of industrialisation the increasing weight of the urban
population meant an increasing share for this more unequal of the two
component distributions (i.e. the urban and rural distributions). Also
at this early stage - broadly, between 1870 and 1920 - the rural-urban
difference in per capita income tended to widen because per capita
productivity in urban pursuits increased more rapidly than in
agriculture. Therefore, inequality in the total income distribution
increased. At the same time, the cumulative effect of inequality in
savings increased the proportion of income-yielding assets among the
upper-income groups.
Inequality then narrowed in these now developed countries, according
9
to Kuznets, in the last four decades before the 1950's.. The shares of
the lower income groups increased also. But such changes probably only
occurred within the urban income distribution profile, as in the
agricultural sector the introduction of a higher level of technology
most likely increased rural inequality. For example, in the United
States more advanced technology permitted larger scale units which would
have "sharpened the contrast between the large and successful business
farmers and the subsistence share-croppers of the south." (Kuznets 1955
p7) . The overall distribution of income, though, improved with the
reallocation of the majority of the labour force (through migration to
the cities) into the high productivity sector (the urban areas). Thus,
Kuznets' interim conclusion was that:
Much is to be said for the notion that once the early
turbulent phases of industrialisation and urbanisation
had passed, a variety of forces converged to bolster the
economic position of the lower income groups within the
urban population. (Kuznets 1955 pl7.).
The "variety of forces" seems to refer to the appearance of an
increasing proportion of (more efficient) urban 'natives' and to the
introduction of protective and supportive government legislation in the
three countries.
Why then, in Kuznets' schema, does the narrowing of inequality come
in the later stages of industrial growth and not in its earlier stages?
In the earlier stages, the 'swarming' of population incident upon a
rapid decline in death rates and the maintenance, or even rise, of birth

rates, is unfavourable to the relative economic position.of lower income
groups. Added to this are the various factors which maintain or increase
the shares of the top income groups: gains arising out of new industries
and from an unusually rapid rate of the creation of new fortunes
connected with the faster pace of early industrial growth. In the later
stages, apart from the 'natives' and government legislation ideas
already mentioned, Kuznets emphasises the role of "factors counteracting
the cumulative effect of concentration of savings upon upper-income
shares".(1955, p8). These include the general "view of society” (Kuznets
1955 p8) - expressed through legal and political decisions - that the
maintenance of wide income inequalities on a long-term basis is not to
be tolerated.
Secondly, there is the demographic effect. This is that over time,
because of differential rates of increase between the rich and the poor,
the top x percent in x year would account for a significantly smaller
percentage of the population in, say, fifty years time (immigation,
important notably in the United States, would excacerbate this trend).
This means that the top 5 or 10 percent of the population in 1920, for
example, would not hold only those it held in 1870; because birth
control and family planning spread first to the rich, a fraction must
have originated in the lower-to-middle income brackets of 1870. Thirdly,
the essence of the adage 'from shirt-sleeves to shirt-sleeves in three
generations' acts as a break on the concentration of savings among
upper-income groups in dynamic capitalist economies. This is due to the
difficulty in societies undergoing rampant technological change, in
which property assets that originate in older industries almost
inevitably have a diminishing proportional weight in the total because

of the more rapid growth of younger industries and of successfully
shifting, one's accumulating assets into the new and- more profitable
industries. If the new fields are not broken into and the new
entrepreneurs are allowed to go it alone, then according to Kuznets "the
long-range returns...[on the property-holdings of the present upper-
income groups]... are likely to be significantly lower than those of the
more recent entrants into the class of substantial asset holders"
(Kuznets 1955 plO)
The fourth counteracting factor involves the earnings from services
(professional and entrepreneurial) of the upper-income groups, which
Kuznets suggests form an important part of the income differential of a
top group. The scope for increases in these earnings, he feels, is less
than that for the service incomes of lower-income groups. This is
because, insofar as very high service incomes are due to individual
excellence, there is less incentive for and possibility of keeping such
incomes at continued high relative levels. And so the service incomes of
the descendants of an initially high level unit are not likely to show
as strong an upward trend as the incomes for the large body of
population at lower-income levels. A further strand of this argument is
that a substantial part of the rising trend in per capita income is due
to inter-industry shift, i.e. a shift of workers from lower-income to
higher-income industries. The possibilities of rise due to such inter
industry shifts in the service incomes of the initially high income
groups are much more limited than for the population as a whole;
clearly, as they are already in higher income occupations and
industries, the range for them toward higher paid occupations is more
narrowly circumscribed.

12
The four factors outlined above are, for Kuznets, all.characteristics
of a dynamic and growing economy. It is essentially this which checks
the rise in the upper-income group1s share and thereby reduces income
inequality. Thus he concludes:
One can say, in general, that the basic factor militating
against the rise in upper-income shares that would be
produced by the cumulative effects of concentration of
savings, is the dynamism of a growing and free economic
society (Kuznets 1955 pll).
Kuznets, then, is positing a long swing in the inequality
characterizing what he would call the 'secular income structure1. Or, to
put it in more familiar terms, he is hypothesising an inverted U-shaped
income distribution curve. This is, in turn, related to other long
swings in the growth process, notably the rate of growth of population
and the rate of urbanisation. Dates are put to the long swings for
England, the United States and Germany. They are all completed, with
their individual variations, during the period 1780 through to the
beginning of the first world war.
So much for the now 'developed' countries. Of the 'underdeveloped'
countries, Kuznets suggests that, for the period after the Second World
War, income distribution is somewhat more unequal than in the developed
countries. This wider inequality is associated with the lower level of
per capita income in these countries. In particular, though, it is
associated with the absence of the dynamic forces associated with rapid
growth which are so important in Kuznets' scheme of things for the

13
developed countries, as we have seen. Kuznets concludes on this that the
pattern of the size distribution of income characterising underdeveloped
countries around the 1950's/19601s is not too different from that
observed in the developed countries of the time in the 1920' s/1930' s or
at the beginning of the century, i.e. before the trend toward narrower
inequality mentioned above.
However, in an article written in 1963, looking at data for eleven
underdeveloped countries, Kuznets points to two major differences
between the developed and underdeveloped societies at the points in time
when their size distribution of income profiles were similar:
...per capita incomes in the underdeveloped countries
today are much lower than they were in the presently
developed countries in the early twentieth and even in
the nineteenth centuries; and the welfare implications
of the same relative inequality are likely to be much
sharper in the underdeveloped countries (Kuznets 1963
p68) .
The above summary of Kuznets1 ideas has tried to reflect his broad
thesis of a turn in the income inequality profile at a point in time on
the economic growth curve. The data he used to arrive at such a thesis
was scanty to say the least and he himself admitted it was
inadequate.(5). We agree with Kuznets, though, when he tells us that his
excuse "for building an elaborate structure on such a shaky foundation"
is that "speculation is an effective way of presenting a broad view of
the field and....so long as it is recognised as a collection of hunches

14
calling for further investigation, rather than a set of fully tested
conclusions, little harm and much good may result", (quoted in Chenery
et al 1974, p6). So the best position seems to be to take his hypothesis
and test it with data collected for doing specifically that.
3) Responses to Kuznets (i)
Kuznets' writings on economic growth and income distribution, especially
the 1955 article, have generated a vast literature on the subject.
Critiques of his work have taken various forms. Some have sought to
challenge specific points within the hypothesis, for example the 'shirt
sleeves to shirt-sleeves in three generations' argument (plO above),
which many feel to be inappropriate in the developing countries of today
or of a few decades ago, considering the realities of the world's
capital markets and the possibilities of investing in broad portfolios
of equity shares, both of which mean that losing fortunes is now much
more difficult. Others have questioned Kuznets' income statistics,
suggesting that the study of material equality and inequality must look
beyond income to encompass, for example, mechanisms used in many
societies to transfer income and wealth between generations of families,
which often serve to hide the true extent of inequalities. (6)
This chapter, though, will focus on Kuznets' substantive hypothesis
of whether the level of economic development is related to levels of
inequality. (7). Indeed, this is the approach taken by most researchers,
15
who have sought, in the main, to test the U hypothesis by means of
comparing cross-country data from countries around the globe. This is
something they have been forced into as very few countries have income
distribution data covering a long period of time. First, though, it
seems appropriate to review the studies which have attempted, in the
spirit of Kuznets, to follow the time-series approach he used.
Soltow's (1968) study on Great Britain covers a very long period,
from 1436 to 1963. He finds some reduction of inequality between 1436
and 1688 and then no change between 1688 and 1801. There is some
evidence that in 1867 and 1880 the inequality was somewhat less than in
1801 but other evidence indicates no change during that period. The next
period, up to 1911 and 1913, provides a similar picture with basically
no change but with a possibility of a slight reduction in income
inequality. After 1913 up to 1962-3 there is a sharp reduction in
inequality, as is also documented in other studies. Soltow's conclusions
are noteworthy in indicating a long period when there was a more or less
similar degree of inequality, interrupted perhaps by one or two spells
of moderate reduction, but with no indication of an increase in increase
in inequality. Soltow (1965) has also looked at the long-term experience
of Norway, for which indicators of income distribution over the second
longest period exist. Using data for the period 1840-1960, he comes to
similar conclusions about the trends in inequality as those for Great
Britain.
Other countries are not blessed with data covering such long periods.
For the United States, for example, Irving B. Kravis (1962) presented
data for the distribution of family and personal income before tax for
the period 1929-58. Kravis's data, which he breaks down into quintiles

16
and Gini coefficients, shows a considerable reduction of inequality
between 1929 and 1944, followed by a stable situation- from then until
1958. Later data seem to confirm the post-war stability of income
distribution in the United States, such as that from the U.S. Bureau of
the Census.
In the developing countries, India has drawn the attention of many
researchers measuring income distribution, one reason being because of
the data regularly collected through the National Sample Surveys.
Observations by various writers (8) for the 1950's through to the early
1970's do not seem to indicate any increasing inequality in the
distribution - though a case could probably be made for the reduction of
inequality, particularly if we agree with Ahmed's (1971) data covering
the period 1956-57 through 1964-5. And a seminar on Income Distribution
in New Delhi in 1971 posited a reduction in inequality for the whole of
the 1960's using consumption expenditure data at current prices. Further
generalisations about income distribution changes in India are
unfortunately not available, which is a serious deficiency considering
the size of the country.
Of the other developing countries there are, at best, income
distribution estimates for a single year or for very short periods of
time, making generalisations difficult. Weisskoff (1970) found
information on short-term movements in income distribution for
Argentina, Mexico and Puerto Rico and later (Weisskoff and Figueroa
1976) expanded his net to include other Latin American countries. He
suggests, from looking at data for the 1950's and 1960's, that a
twisting of the distribution of income has occurred, away from the
bottommost 60 percent and topmost 5 percent toward a greater share for

17
the middle 81-95 percentiles, concluding that "so-called development
implies a loss of relative shares to the bottom 60 percent." (1976 p87).
The thesis that post-war growth has been associated with a general
worsening of the distribution of income in most developing countries,
borne out by Weisskoff and Figueroa (1976), was forcibly challenged in
1979 by Fei, Ranis and Kuo. They state that:
It is possible for economic growth to be compatible
with an improved distribution of income during every
phase of the transition from colonialism to modern
growth an equitable level of FID (Family Income
Distribution) can come about mainly through the kind
economic growth which is generated. (p310).
This counter to the general aura of trade-off pessimism was the upshot
of the authors' work on income distribution in Taiwan from the 1950's
through to the 1970's. They show that Taiwan's family distribution of
income in the 1950's was not very different from the unfavourable levels
most LDC's seem to be prey to in the early years of their transition
effort. During the next two decades in Taiwan, income distribution
"substantially improved" (p310). The authors thus conclude that at least
one developing country had its cake and ate it too. (9) .
It now seems, though, that Fei, Ranis and Kuo played down the unique
structural factors associated with the Taiwanese 'growth-with-equity'
experience, which makes it difficult to generalize from their findings.
Taiwan, like Korea, was able to impose fundamental and far reaching land
reforms in the years after the Second World War. During the war it had
18
been occupied by the Japanese, who owned a substantial proportion of the
arable land. After the war, "this land was available for redistribution
to landless rural workers without the political problems that generally
attend such a redistribution". (Morley, 1982, p268). In addition, during
the late 1940's and 1950's the Taiwanese government embarked upon
ambitious programmes of, amongst other things, rent control and primary
education.
Secondly, as Deyo (1989) has shown, the relatively equal income
distribution profile in Taiwan - as well as in South Korea, Hong Kong
and Singapore - came about due to the expansion of light industry
employment, which tends to emphasize low-skill, low-wage work, and in
this way to result in the formation of a "hyperproletariat" of marginal
workers, such as immigrants and young women. Deyo calls this "an
industrialisation strategy centred on the exploitation of low-cost
labour in the production of manufactured exports for world markets."
(p4). Its upshot is a relatively equal income distribution profile, but
one in which family incomes tend to be at the low end of the wage scale.
Fei, Ranis and Kuo failed to recognise that this question of the welfare
of the working population and their families is an essential part of an
inequality profile. As such, their analysis remains incomplete.
From a slightly different perspective to that of Fei, Ranis and Kuo,
but also with the aim of countering the trade-off pessimists, Morley
(1982) produced a controversial work on the sacrifice element of
economic development. The latter he sees as something which should raise
living standards and eliminate poverty - but that to reach it involves a
significant sacrifice by the present generations for their children.
Thus, he contends that:

19
Rising inequality is the short-run cost that the society
pays for the long-run improvement in the well-being of
the poor. (pl5).
Morley claims to show, by looking at the Brazilian experience post-1960
(10), that, following a period of rapid and apparently inequitable
growth (see the so-called 'miracle years' of 1960-73 in Brazil), wages
will rise rapidly for farm labour, skill differentials will begin to
narrow and the benefits of growth will finally begin to trickle down to
the poor. Morley also notes the conclusions of a social mobility study
on Brazil in 1979 (11) , which show a very large degree of upward
mobility both between and within generations, including in the periods
covered by what have become known as the 'breakneck growth' period
(1947-62) and the 'miracle years' (1960-73). This is noteworthy, as
neither cross-sectional nor time-series data, the most commonly used
methods of measuring income trends among different groups, are able to
pick up trends in social mobility or look at the same 'population' at
two points in time.
Morley's polemical thesis, which boils down to the fact that the poor
may have to do without some basic necessities while the country is being
organised for economic development, raises the wider political question
of whether democracy can be reconciled with such 'development'. (12). Of
course, as Morley himself would recognise, no society follows this
'heartless, cold-blooded' strategy to the letter; most do not permit
income to be completely determined by the market and take measures to
reduce starvation and opulence.

20
Writing not long after Morley, Williamson (1985) picks up the self
same theme and notes that there have been the two camps of the
'optimists' and the 'pessimists' since the debate between the critics
and defenders of capitalist economic development began one-hundred-and-
fifty-years ago during the British reform debates of the 1830's. (13).
He poses the question of whether the British inequality curve from 1760
to the First World War - which he gives a similar shape to the one drawn
by Kuznets in 1955, though disagreeing with his explanations - would
have been any different in the absence of industrialisation and/or
whether the poor would have been any better off. No direct answer is
given to this; but the improvements in the quality of urban life post-
1790 which Williamson documents suggests he is sympathetic to the
implication behind the question: British capitalism did deliver basic
goods to her poor and it did improve the living standards of the
working-class as a whole. The 'dark satanic mills', Williamson contends,
have had a bad press. Their palls of coal smoke implied cheap fuel,
which set off a chain reaction of low industrial costs, competitive
British exports and rapid urban job creation. Further, "cheap fuel made
for warmer houses, better cooked food and greater cleanliness, all of
which had their salubrious effect." (p26).
In a study of the Sao Paulo industrial working class between 1930-75,
John Wells (1983) came to similar conclusions. He found that there had
been an improvement in the standard of living of the typical manual
working class household in Sao Paulo City during the forty years between
the mid-1930's and the mid-1970's, when Brazil was experiencing rapid
agricultural and industrial transformations and the economy was growing
rapidly. Whereas in the 1930's the typical working class household
21
appears to have enjoyed a standard of living which was little higher
than the, basic physiological minimum, the typical household does appear
to have raised itself above that level by the mid-1970's. Wells found
working class diets to be improving, with a larger proportion of food
expenditure devoted to superior foodstuffs (reflected by increasing
intakes of rice, milk, chicken and eggs). It seems reasonable to assume
that Wells' sample, drawn from the "typical manual working class
household in Sao Paulo City" (p323, Part 2), would have included the
lowest/poorest 60 percent of the population.
How, then, are we to explain the finding of no absolute
impoverishment and indeed of absolute improvement in the incomes of the
poorest groups?. Or put another way: what affects the living standards
of non property-owning groups in poor capitalist countries, especially
in those experiencing rapid transformations in their agricultural and
industrial sectors? Such questions are similar to those asked by the
early observers and theorists - Rowntree (1901), Engels (1892), Marx (in
'Capital') - in the debate on the condition of the working class in
England, which began in the mid-nineteenth century.
Living standards will tend - it is often alleged - to decline under
the following conditions: i) with the influence of population growth and
surplus labour, especially in the cities, in restraining the bargaining
power of those in work; ii) weak labour demand, connected with the use
of advanced country production techniques, coupled with supply-side
factors (like population growth); iii) and/or obstacles inhibiting the
formation of an independent trade union movement, restricting workers'
bargaining power. These points remind one of something Marx might have
said, that during an early, rapacious period of expansion, industrial

capitalism, faced with an unlimited supply of unskilled workers from the
industrial sector, may be prepared to squander its -labour power by
paying less than the biological minimum. Indeed, why should employers in
such conditions do anything else? Well, often they do act contrary to
theory, as the standard of living of many members of the industrial
workforce in economies with an excess supply of labour attests. In all
developing countries, the casual observer would note that the standard
of living of many members of the industrial workforce lies considerably
above the physiological minimum. To understand why this is the case is
to get to the nub of one of the central issues in the
growth/poverty/income distribution debate.
Many explain the phenomenon in terms of persistent excess demands for
certain skills, as a result of rapid structural change. Others suggest
the standard of living will be determined by the value of the
necessities required to produce, develop, maintain and perpetuate
labouring power, which introduces an historical as well as a biological
element into the determination of real wages. Still others, including
Marx, would suggest there are two main reasons why wages rise above the
biological or subsistence minimum: i) capital, in its own interest, is
forced to improve the conditions of the working class, for otherwise
extreme rapaciousness will lead to a degenerate and stunted labour
force; ii) the development of a somewhat more skilled labour force
requires a higher wage to cover the costs of training and encourage
habituation.(14). Such is the materialist explanation for the emergence
of a relative labour aristocracy in semi-industrialised economies.
Wells, though, mixes material and political elements in his explanation,
which is more persuasive. Of the political element, he writes:

23
In many Latin American countries beneficial wage and
employment legislation arose in response to the need
felt by the embryonic industrial bourgeoisie to extend
the social basis of support for its industrialisation
project and, in some cases, in order to pre-empt growing
militancy among the industrial working class; since the
benefits of such legislation were not universally enjoy
ed it may also have served as a useful political weapon
to foster divisions within the urban working classes.
(pl49, Part 1).
Wells' material element is essentially that sectors of manufacturing
especially oriented to the production of wage goods would require at
least some growth in the per capita incomes of consumers in their
principal market. As such, "changes in relative prices favouring the
real incomes of the mass of manual workers are necessary for macro-
economic equilibrium." (p326, Part 2). Without the growth of mass
purchasing power, even in societies where labour's position is
especially weak, the embryonic capitalist economy could not make the
transition to full maturity. That is, if demand is insufficient the
economy will run into the sand. Under this scenario the poorer groups do
not have to wait for the trickle-down route to greater equality;
thoughts of enlightened self-interest and investment pay-offs help to
bring it sooner. Income concentration is thus lessened by providing the
working classes with some of the fruits of the increasing output. The
rationale of the dominant class no doubt being that a smaller proportion

24
of an ever increasing pie makes more sense than holding rigidly onto a
larger proportion of a never increasing pie.
4) Responses to Kuznets (ii)
Before turning to a review of the (more extensive) literature which
uses cross-section data to test Kuznets1 hypothesis, we should first
note the (sometimes fierce) objections to such an approach. These centre
around the criticism of 'timelessness1, i.e. that using cross-country
data to test the hypothesis is to compare countries which are at
different points in time in the development process and to ignore the
cultural and historical baggage of each. Writers have thus been driven
to dismissals of the method, believing reliance on the data it produces
to be "wholly inadequate" (Ahluwalia 1976) or meaningless (Saith 1983).
The same writers are forced to swallow their pride and use the method
anyway! This is because, if we do not have time-series data for
individual countries covering a sufficient time period, then the best
has to be made of cross-country data, as the only kind available. It can
at least identify 'associated relationships' which can best be treated
as stylised facts to be observed but still in need of explanation by an
appropriate theory. Put more succinctly, we have no choice but to treat
cross-section data as helpful in indirectly confirming the Kuznets (or
indeed any other) hypothesis.
Gunner Myrdal, in 1957, argued that at very low levels of development

25
upward spirals of economic activity in expanding sectors induced
downward- spirals in stagnant sectors, leading to -marked regional
differences in income inequalities. Paul Baran (1957) suggested that
extreme inequality at the lowest levels of development occurs because
the benefits of dualistic growth of a narrow sector exploiting abundant
natural resources accrue to ruling coalitions of expatriate businessmen
and indigenous property owners.
Kravis (1960) joined the debate soon after Kuznets. He concluded,
calculating quintile shares and Gini ratios for ten developed and
developing countries for the early 1950's, that the degree of inequality
tends to be positively correlated with the level of per capita income
but that the correlation is not consistent. Further, he confirmed
Kuznets' statement that the share of the lowest income groups tends to
be higher in the poor countries than in the developed countries and that
therefore the explanation for the greater inequality in developing
countries was to be sought in the greater dispersion in the upper part
of the income distribution scale. Oshima (1962), though, disagreed. He
thought Kravis's conclusions as to the greater inequality in
underdeveloped countries than in developed ones simplistic. Rather, he
suggested four stages of economic development through which countries
pass, during which the income distribution curve follows a Kuznetsian U
pattern.
Lenski (1966) went further, tracing out the contours of a U-curve as
countries move from hunting and gathering societies through to
industrial socities. As they move, first, into the 'simple
horticultural' societal type, then to the 'advanced horticultural' and
'agrarian' types, the degree of social inequality - level of income

26
concentration - increases steadily. It only decreases with the onset of
the 'industrial1 societal type. The increase in per capita income with
the change from the 'agrarian' to the 'industrial' type is dramatic.
Pure agrarian societies had a per capita income of no more than $100 per
year (1949 dollars) - compared to a per capita income in many developing
industrial societies which is up to twenty times greater.
Lenski develops something of a grand theory to explain this,
suggesting that it is the size of a country's surplus that affects the
nature of its distributive system. Specifically, that the degree of
technological advance (the latter creating the surplus) will determine
the degree of income concentration. In the simple and primitve
societies, lacking any surplus to be fought over, goods and services
tend to be distributed on the basis of need. With the appearance of the
surplus this changes, igniting a struggle for the increased resources.
That it be a 'struggle' is inevitable under Lenski's assumptions that
man, though a social being, is motivated by self-interest and a desire
to maximise his own satisfactions. Further, most of the objects of his
(insatiable) strivings are in short supply - money, wealth, status,
prestige. Unequal outcomes, too, are inevitable, under the assumptions
that "men are unequally endowed by nature with the attributes necessary
to carry on these struggles" (p32) and that "with technological advance,
an increasing proportion of the goods and services available to a
society will be distributed on the basis of [unequally distributed]
power" (p46). The appearance of the surplus cannot explain everything;
Lenski points to 'secondary variations' to explain differences in
inequality between societies at the same level of technological
development. These include 'the military participation ratio' - the

27
proportion of the adult male population utilised in military operations.
Where most adult males are utilised for such purposes, the degree of
inequality tends to be less than in those in which military needs are
supplied by a small force of military specialists.
There is a major problem with Lenski's scheme of things: his model
would predict ever-increasing inequalities the larger a country's
surplus, considering how the assumptions of self interest/partisan group
interest and the short supply of those things men most desire, would
give rise to conflicts and struggles aimed at the control of the
surplus. As we have seen above, however, he finds evidence to
corroborate Kuznets1 U-curve, which posits a reversal of the trend of
increasing inequalities with the appearance of a surplus. Specifically,
in agrarian societies the top 1% or 2% of the population usually
received not less than half of the total income of the nation, a
proportion which declined substantially in the industrial societies. To
account for this, Lenski, not unlike Wells (1983; discussed above)
brings in factors specific to the industrial societies themselves. These
include: i) the elite granting economic concessions to the lower classes
in order to dampen industrial tension. If the concessions are not too
large and the rate of the economy's growth is great enough, relative
losses can be accompanied by substantial absolute gains. This is
possible because, unlike the struggle for political power - a zero-sum
"game" in which one party's gains are another's losses - the struggle
for resources is a positive-sum "game", due to the constantly rising
level of productivity; ii) the different labour requirements of the
industrial societies. In the past, mainly (plentiful) unskilled labour
was needed. In industrial societies, due to the demand for (not so

28
plentiful) labour with various technical skills, employers cannot drive
wages down to their subsistence level as they could -before. In sum,
factors specific to industrial societies serve to check the long-term
trend towards the ever-increasing inequalities which Lenski's theory
predicts.
Paukert (1973) reviewed the existing statistical data for a large
number of countries and examined Kuznets' hypothesis. Unfortunately,
Paukert's work is not historical - as was Kuznets' work - but rather
synchronic, since it compares the contemporary situation of countries
with very different structures and income concentrations. His findings,
though, are important. They confirm Kuznets1 hypothesis by showing a
tendency for a higher income concentration in the countries with lower
levels of development (measured, as ever, by the per capita product) or,
in other words, an inverse relationship between the two. This changes
when the levels of development are raised, with the result that the
coefficients of inequality are reduced.
This change is not gradual but occurs when a certain threshold in
the degree of development is passed. This 'turning point', where
distribution begins to improve, occurs, according to Paukert, in
countries with a development level of around 500 dollars per capita, a
level lower than the average per capita income in Latin America at the
time Paukert was writing (1973). Paukert's work has attracted much
criticism, principally that the correlation between level of income and
coefficients of inequality, though detectable, is rather vague and
neither linear nor inexorable. Furthermore, it appears that once a less
skewed income distribution is achieved, this is no guarantee of its
permanence and there is no inevitable home-run, a point upheld by some
29
researchers since. (15). Just as there is no guarantee, either, that
economic, 'development' will continue once underway in a country; in
Argentina, Ghana, Uganda and Zambia growth has decelerated gradually
over the past century.
Ahluwalia's oft-cited 1976 article takes a sample of 60 countries -
40 developing countries, 14 developed and 6 socialist - and uses a
multivariate regression analysis to estimate cross-country relationships
between the income shares of different percentile groups and selected
variables reflecting aspects of the development process which are likely
to influence income inequality. He finds a substantial measure of
support for the hypothesis that there is a U-shaped pattern in the
secular behaviour of inequality. Specifically, the income shares of all
percentile groups, except the top 20 percent, first decline and then
increase as per capita GNP rises. Income shares of the top 20 percent
display a correspondingly opposite pattern.
Here, though, the problem of timelessness may be distorting the
conclusions, as indeed Ahluwalia recognises. For example, the U-shape
revealed from his cross-country data may be generated solely by the fact
that the 'middle-income' range is dominated by countries with particular
characteristics which generate high inequality. If this were so, the U-
shape would have little relavance to the long-term prospects facing the
low income countries of today, unless these countries shared the same
characteristics. Thus, it is often said that the U-shape reflects no
more than the concentration in the middle income range of Latin American
countries, which display greater inequality because of particular
historical and structural characteristics not applicable to others.
After testing for this 'Latin-American effect', however, Ahluwalia finds

30
no change in his U-shaped conclusion. Though he does conclude,
correctly, that GNP per capita, while a useful summary measure of the
level of development (16), "tells us nothing about the specific
mechanisms through which development affects the degree of
inequality." (p313) . Not only this; how to measure development and what
proxies to use for it are themselves contentious issues. They surfaced
again just recently, with the debate between Tsakloglou (1990) and
Branco and Williamson (1988) (17), and were the subject of extensive
debate at the latest United Nations conference on poverty and
inequality. (18).
Ahluwalia's "specific mechanisms" must include intersectoral shifts,
the expansion of the educational and skill characteristics of the
population, and a reduction in the rate of growth of population
('demographic transition'). The inclusion of these explanatory variables
in Ahluwalia's regression equations substantially improves the goodness
of fit compared to when development is measured solely in terms of per
capita GNP. This means that the U-shaped hypothesis is confirmed and
that to some extent the improvement in income distribution observed in
the later stages of development is explained by the three mechanisms
already mentioned.
Ahluwalia was also part of a landmark World Bank study in 1974,
headed by H.Chenery. It began by noting the high increase in per capita
incomes in the Third World since around 1960 and that such growth was
very unequally distributed among countries. Growth policies, therefore,
had succeeded beyond expectations. Whether aggregate growth was enough
to improve on highly skewed income distributions was another matter.
Chenery points out in the introduction to the study that there are a
31
number of developing countries in which tha poor have shared equitably,
specifically Israel, Yugoslavia, Korea, Costa Rica and Tanzania. In
those countries where they have not been so lucky the major disability
facing the poorest groups is their lack of physical and human capital.
And considering that 80 percent or more of what the study calls the
'low-end poverty group' are in employment of some kind, then the policy
focus shifts from quantity to quality of employment.
The Chenery/World Bank study is of interest as it points up the
general criticism of Kuznets' thesis that he ignored the fact that the
process of development may lead not just to increasing relative
inequality but also to the absolute impoverishment of the lower income
groups. That is, a high, or higher, per capita income does not ensure
that there is no absolute poverty problem. This is shown in the study by
the example that Ecuador and Sri Lanka had, in 1969, approximately one-
third of their populations below the U.S.$50 per capita (1969 dollars)
poverty line, but per capita income in Ecuador was three times as high.
Writing around the same time, Adelman and Morris (1973) also pick up
the theme of the absolute impoverishment of low-income groups. They
conclude their analysis of cross-sectional data for 43 countries by
suggesting that the incomes of the poorest groups - the lowest 40% - had
declined in real terms. They point out that Kuznets and others, as they
only really discussed the relative income position of the poor, ignored
movements in absolute levels. They thus failed to recognise absolute
poverty as an extreme situation of inequality and as such a special case
within the broader concept of income distribution. Equally, they tended
to over stress level of national income or rate of economic growth as
determinants of income distribution patterns, ignoring the role of
economic structure in the early and middle stages of economic
development. By this they mean the existence of expatriate enclaves
before the take-off stage of development, a highly concentrated
ownership profile of modern enterprises, the development of capital
intensive industrial technology, migration to cities of unemployed rural
workers, and the lack of social mobility. These, Adelman and Morris
contend, tended to swell the numbers of urban impoverished and to
decrease the income share of the poorest segments of the urban
population. This then led them to their now famous assertion that, in
most countries of the Third World, the poor would have been better off
if there had been no development at all! This thesis has come in for
some fierce criticism, with other samples apparently highlighting a
decline in the shares of the poorer quintiles over time but
insufficiently so to offset the recorded growth in the real mean incomes
of the poor. (19).
As for the distribution of income, Adelman and Morris find "an almost
perfectly shaped U-shaped relationship" (1973 pl96) after plotting the
means of groups of countries with successively higher levels of
industrialisation against the income shares of the poorest 60 percent.
They then tested 31 factors to look for determinants of the
relationship. Economic development, measured by the level of per capita
GNP or GDP, did not emerge as one of the six main determinants. Such a
finding contradicts the generally accepted theory of income distribution
changing significantly in the course of economic development. A view the
authors are content with: "our analysis supports the Marxian view that
economic structure, not level of income or rate of economic growth, is
the basic determinant of patterns of income distribution." (1973 pl86).
Unfortunately, there have been a number of doubts regarding the method
of study chosen by the authors as well as the accuracy of their
statistical disaggregations.(20). Some support for their findings,
though, comes from Fields' (1981) study of poverty in six developing
nations. His findings suggest that often the level of a country's income
can predict the numbers in poverty but equally often it cannot. Some
countries have alleviated poverty substantially, he notes, despite
little economic growth. He concludes - not dissimilarly to Adelman and
Morris - that the "character of growth" (p313) is more important.
Fields suggests two further points; firstly, that income variations
according to attributes of individuals are of primary importance, and
secondly, that the relationship between the level of national income and
the degree of relative income inequality is weak. Regarding the latter,
he finds the exceptions to any general pattern to be nearly as numerous
as the supporting cases - something numerous studies have noted.
Weisskoff and Figueroa (1976), for example, break down the Latin
American countries for the period 1950-1970 into those with higher
levels of inequality and those with lower levels and find no consistent
or remotely linear relationship with level of national income. Some
years later (1983), Felix was more forthright; Latin America had not
generated Kuznets curves despite some impressive growth records. This he
puts down to the excessive preference of the Latin American middle and
upper classes for imported goods, which gives little incentive for
governments to consider opening up the home market through an income
redistribution push. Precisely this point was made in 1970 by an
International Labour Organisation (ILO) mission to Colombia, which
prompted it to suggest that the best way to raise the level of

investment, considering the prevailing consumption pattern, and thereby
accelerate growth and produce something like a Kuznets curve, was
through taxation. The Latin American experience, though, has not
manifested itself in other LDC's, which leads Felix to conclude that any
explanation of inequality levels must focus on country-specific
structures. (21).
Two studies appearing shortly after Felix come to quite different
conclusions, both supporting the Kuznets hypothesis: Gupta and Singh
(1984); and what has become an influential article by Campano and
Salvatore (1988), not least because of the large sample of countries -
142 in all - they use. By comparing Gini coefficients for countries at
different levels of development, defined by income per-capita, Campano
and Salvatore find strong support for the U-shaped hypothesis. From the
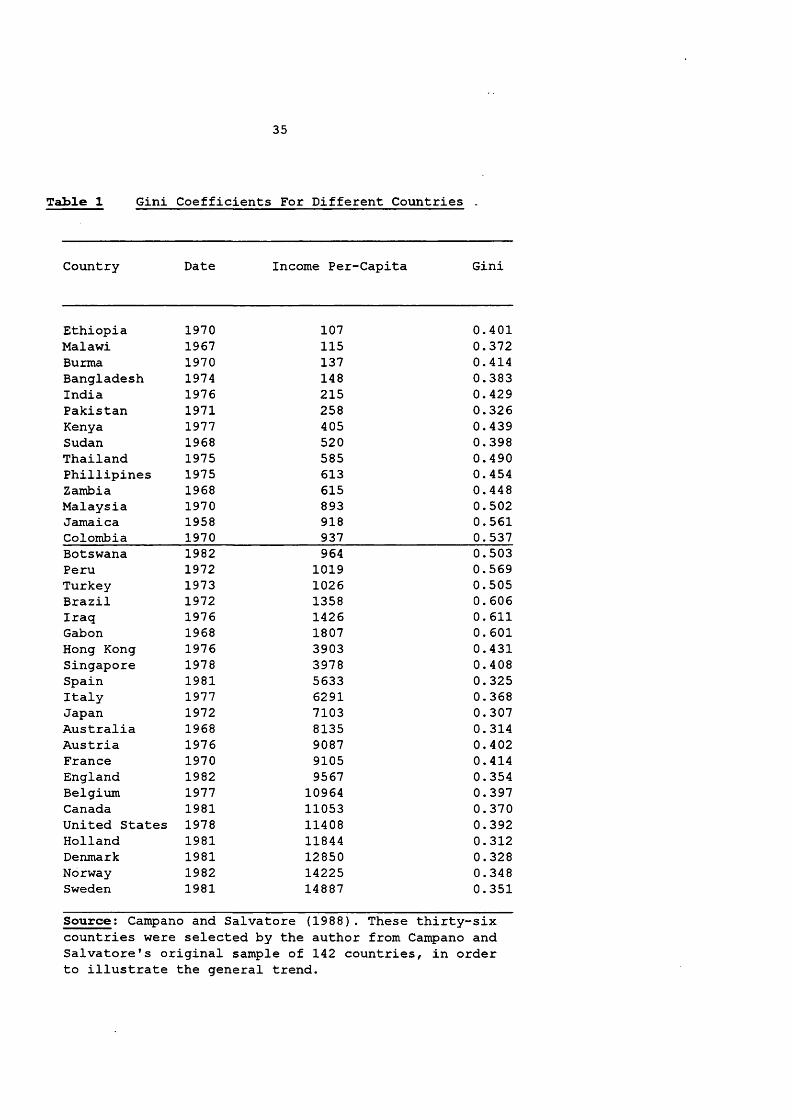
thirty-six countries in Table 1, below, we see that, at around 1970,
Ethiopia, Bangladesh and Burma, for example, have similar Gini's, at
approximately 0.40, to those of Belgium, Austria and the United States.
Countries at intermediate levels of develpoment have higher Gini's, at
between 0.50 and 0.61.
35
Table 1 Gini Coefficients For Different Countries
Country Date Income Per-Capita Gini
Ethiopia 1970 107 0.401Malawi 1967 115 0.372Burma 1970 137 0.414Bangladesh 1974 148 0.383India 1976 215 0.429Pakistan 1971 258 0.326Kenya 1977 405 0.439Sudan 1968 520 0.398Thailand 1975 585 0.490Phillipines 1975 613 0.454Zambia 1968 615 0.448Malaysia 1970 893 0.502Jamaica 1958 918 0.561Colombia 1970 937 0.537Botswana 1982 964 0.503Peru 1972 1019 0.569Turkey 1973 1026 0.505Brazil 1972 1358 0. 606Iraq 1976 1426 0. 611Gabon 1968 1807 0. 601Hong Kong 1976 3903 0.431Singapore 1978 3978 0.408Spain 1981 5633 0.325Italy 1977 6291 0.368Japan 1972 7103 0.307Australia 1968 8135 0.314Austria 1976 9087 0.402France 1970 9105 0.414England 1982 9567 0.354Belgium 1977 10964 0.397Canada 1981 11053 0.370United States 1978 11408 0.392Holland 1981 11844 0.312Denmark 1981 12850 0.328Norway 1982 14225 0.348Sweden 1981 14887 0.351
Source: Campano and Salvatore (1988). These thirty-six countries were selected by the author from Campano and Salvatore's original sample of 142 countries, in order to illustrate the general trend.

36
The authors' support for the hypothesis, though, carries the proviso
that "the bottom 20 percent of the population do not experience an
automatic improvement of their income shares as the U-shaped hypothesis
might lead one to expect." (Campano and Salvatore 1988 p278) . The
poorest segments of the population appear to be bypassed by the
development process and thus the "spread effect" and the "trickling-down
effect" seem not to reach the poorest people as a nation develops.
If such a conclusion were to be upheld, it would challenge some of the
more highly regarded contributions to the debate. Not least those of
Ahluwalia, who found, as we have seen, confirmation for the Kuznets
curves for all of the top 20 percent, middle 40 percent, bottom 60
percent, bottom 40 percent, and bottom 20 percent of the population.
Likewise those of Saith (1983), who conducted an onslaught into
Ahluwalia's research. He suggested that the research was heavily
affected by "a few outliers" (p378) in the sample - including the
presence of the socialist countries with explicit policies to strongly
affect the distribution of income - and that if these were excluded "the
U-curve fades into insignificance" (p378). Campano and Salvatore's
objection is that Saith was concentrating on only one of Ahluwalia's
equations (the income share of the bottom 20 percent) and that the rest
of Ahluwalia's equations remain robust. To therefore throw out the
entire U-shaped hypothesis on the strength of a small problem in the
sample is, they contend, inappropriate. Indeed, the figures in Table 2,
below, suggest they are correct: they support the U-shaped hypothesis by
showing more income inequality in low-income countries - and more still
in lower-middle income countries - than in high-income countries.

37
Table 2
Distribution of Household Income in Countries of Different Income (GNP Per Capita) Levels.
Low-income Group Countries
Lowe r-Mi ddleIncomeCountries
Upper-MiddleIncomeCountries
IndustrialMarketEconomies
Quintile1 5.71 4.70 3.95 6.60
Quintile2 9.46 8.67 8.55 11.96
Quintile3 13.66 13.62 13.44 17.00
Quintile4 20.10 20.63 21.33 23.63
Quintile5 51.07 52.38 52.74 40.77
Top 10% 36.41 36.90 35.85 25.20
Quintiles 1 & 2 15.17 13.37 12.50 18.56
Quintiles 3 & 4 33.76 34.25 34.76 40.63
Source: Tabulated by the author from data presented for individual countries in 'World Development Report1, World Bank, editions 1984 through to 1990.
-'Low-income Countries' includes Bangladesh, Nepal, India, Tanzania, Sri Lanka Kenya and Sierra Leone.
-'Lower-Middle-Income Countries' includes Sudan, Indonesia, Thailand, the Philippines, Costa Rica, Colombia and Turkey.
-'Upper-Middle Income countries' includes Malaysia, south Korea Panama, Chile, Brazil, Mexico, Argentina Venezuela, Israel, Hong kong and Trinidad and Tobago.
-'Industrial Market Economies' includes Iceland, Spain, Italy New Zealand, the United Kingdom, Austria, Japan, Belgium, Finland, the Netherlands, Australuia, Canada,

38France, Germany, Denmark, the United States, Sweden, Norway and Switzerland.
Note: this table is meant only as a guide to the general trends in income distribution among countries at different income levels: different methods of data collection as well as differences in data quality across countries prevent a more precise 'weighting' of percentage shares. Furthermore, the estimates for the different countries do not refer to the same year, rather to the latest available estimate. For some countries, particularly those in the 'low-income' and 1lower- middle-income' categories, there are no available estimates.
5) Concluding Thoughts
Controversy still reigns over whether Kuznets had found something or
not, over what he ignored, and more recently over his assumptions as to
what constitutes economic development. The question remains: what of the
"tough-minded, non-welfare" (Wiles p98) capitalist theory of the
trickle-down, or U-curve?
One can find evidence both to support the curve and to refute it. It
would probably be fair to say, though, that the general weight of
opinion lies in support of it. The majority of both the time-series and
cross-sectional data reviewed above affirm the existence of a U-curve.
The figures collated by Soltow (1965 and 1968), by Ahluwalia (1976) and
by Campano and Salvatore (1988) seem sufficient to be able to say this.
This is not to say the hypothesis can predict everything; the final
downswing part of the curve, as we have noted, is not always smooth.
Considering the vast literature over the last thirty years in
response to the guantlet thrown down by Kuznets, we now have to ask
ourselves what we know and when we decide that we know it. Confronted
with such an ultimatum, we can say, on the strength of the discussion in
this chapter, that the only way to reconcile some of the contradictory
conclusions we have found - for example, the differences between the
time-series analysis of Wells and Fei, Kuo and Ranis on the one hand and
the cross-sectional analysis of Adelman and Morris on the other - is to
suggest that researchers go to individual countries and perform time-
series studies, for this is where they will really find out what it is
that influences income distribution and poverty profiles. The absolute
impoverishment thesis of Adelman and Morris was arrived at using a
method wholly unsuited to noticing movements in income through time,
such as those mapped by Wells. The specific-country circumstances of
Taiwan, Korea, and Brazil noted by Morley (1982, ch. 11) - even though
he himself, by refusing to draw back from his 'no exceptions' theory,
ignores their implications - are important here, because they also could
not have been picked up by the insensitive cross-section method of
analysis.
By looking at individual countries we can better decide if economic
development is enough to explain movements in income distribution and
poverty, and whether the association between per capita income and
inequality coefficients can be upgraded to a causal relationship. And
anyway, finding more and more associated relationships would not take us
very much further in the quest for understanding the causal mechanisms
behind apparently decreasing income concentrations on the back of
increases in GNP per capita levels. And so this report will continue
with a case study analysis with a view to unearthing some of these

causal mechanisms.
40
N otes
(1) the quotation is from G.E. Lenski 'Power and Privilege - A Theory of
Social Stratification1 (1966) . Money is seen by Lenski as one of man's
primary goals, fought over selfishly in all but the most minor arenas of
daily life where little is at stake.
(2) see Weber's 'Economy and Society' (mainly volume 2) (1968) for his
detailed discussion on this.
(3) this point is made, and further developed, by Durkheim in 'The
Division of Labour in Society' (1964), p384.
(4) Marx's discussion of the pauperisation thesis outlined here was
taken from 'Capital' volume 1 (1970) and 'The Communist Manifesto'
(1970). The thesis, though, has its weaknesses, notably: i) failure to
predict the rise in living standards of the great majority of the
working population in capitalist Western Europe and the USA through the
last century; and ii) as noted by Giddens (1971) : "According to Marx's
own theory, profits show a tendency to decline; now if it happens that
the rate of surplus value remains the same, rising productivity must
produce an increase in real wages of labour." (p57).
41
(5) Kuznets made use of tax records and government expenditure accounts
available for each of the countries, as well as the limited number of
secondary works available at the time.
(6) this is the position of R.M. Titmuss in 'Income Distribution and
Social Change1 (1962). Other works have singled out tax fraud and
evasion and the restrictive definition of income in many tax statutes.
Still others have pointed out the disproportionate benefits received by
the privileged classes from government actions, which they feel should
be included in any income definition, though quite how is difficult to
see. Included here would be wealthy owners of private property being the
chief beneficiaries of the expenditures for defense and police services.
(7) it should be made clear that the question of the simple relationship
between rate of economic growth and equity is what we are not discussing
here. This is a separate issue and for reasons of clarity best avoided.
Many writers, though, do not understand this and get themselves tangled
up trying to relate it to the Kuznets1 curve. A sustained period of
output growth is of interest to us here insofar as it might indicate
that a country has reached a level of development which could mean it
approaches the final downswing of Kuznets1 inverted U-curve and so
begins to show a less concentrated income distribution profile.
(8) these include P.D.Ojha and V.V. Bhatt 'Pattern of Income
Distribution in an Undeveloped Economy: A Case Study of India', American
Economic Review (Sept 1964); and K.R.Ranadive 'Distribution of Income:
Trends Since Planning' (Paper presented to Seminar on Income
Distribution, New Delhi, Feb 1971).
(9) they do not, though, give much attention to the specifics of the
Taiwanese case, which undoubtedly have much to do with why its growth-
42
equity experience has not been replicated elsewhere. See, for example,
W. Baer (Latin American Research Review, Volume xxi, no- 2, 1986) on the
somewhat different paths followed by Mexico and Brazil, notably in their
more capital-intensive investment strategies, which produced much more
income concentration in both countries.
(10) Morley's thesis suffers throughout from the contradiction between
his desperate desire to universalise Brazilian experience and his many
references to the particular events and decisions which drove that
experience. See Morley (1982), ch 11, for more on this.
(11) J. Pastore 'Inequality and Social Mobility in Brazil' (1982).
(12) the recently fashionable 'basic needs' approach to development,
i.e. the Western model of redistribution-with-growth, may be
inappropriate for the eliciting of sacrifices from the populace in
developing countries, which may be necessary if the society is to build
a better tomorrow. The 'revolution of expectations' that it tends to
encourage may force governments to concentrate upon immediate, rather
than long-range, goals of economic development. Military and/or
totalitarian regimes may be more suited to the task of implementing
policies to produce the necessary rapid economic growth. The post-1964
military government in Brazil has been accredited with just such a
function.
For a full discussion on this, see chapter by the sociologist G. Sjoberg
in 'Social Structure, Mobility and Development', N.J.Smelser and
S.M.Lipset (eds.) 1966.
(13) see, e.g., E.J. Hobsbawm and R.M. Hartwell 'The Standard of Living
During the Industrial Revolution: A Discussion', Economic History
Review, 16 (Aug. 1963).

43
(14) This summary of the Marxian position relies heavily on R.E.
Rowthorn.'Capitalism, Conflict and Inflation' (1980).
(15) J. Graciarena (article in Cepal Review, second half of 1986) warns
of confusing short-term and more far reaching changes in income
distribution, the former often caused by some aspect of the political
game, the latter by "structural transformations and new correlations of
social forces" (p235). And Papanek and Kyn (article in Journal of
Development Economics, no 23, 1986) suggest the Kuznets curve is
flattening out relatively fast in many countries in the 1980's. Whether
this is permanent is not clear.
(16) it also has some technical problems. Principal among them is the
use of official exchange rates to convert GNP measured in domestic
currency to GNP measured in U.S.$. This introduces errors since exchange
rates typically do not reflect purchasing power parity. The result will
tend to be an understatement of GNP in developing countries compared to
developed countries.
(17) the debate is over what indicator to use to measure economic
development. Branco and Williamson (article in American Journal of
Economics and Sociology, July 1988) suggest per capita energy
consumption is an appropriate indicator, as it avoids the problem
associated with using per capita GNP (see n.16 above). Tsakloglou
(article in American Journal of Economics and Sociology, Jan 1990)
rightly disagrees, noting that per capita energy consumption exaggerates
differences between rich and poor countries more than either per capita
GNP or GDP in 'Real Purchasing Power Dollars', his own preferred
measure.
(18) the conference, in Quito, Ecuador, between 20-23 November, 1990,

44
was entitled 'Desarrollo sin Pobreza1 (Development without Poverty).
Amongst othert things, it explored the possibility of replacing GDP per
capita as an indicator of development with 'The Index of Social
Progress' (ISP). Those societies which devoted a higher percentage of
resouces to providing assistance to low-income groups (education,
health, housing) would be given a higher ISP (Source: Conference
Summary, United Nations, Bogota, 1990. My translations).
(19) Ahluwalia (1976) and Papanek and Kyn (1986) take this view.
(20) regarding their statistical disaggregations, they often
disaggregate incorrectly and so give an artificially high share of
income to the lower deciles and an artificially low share to the higher
deciles. The impression is thus created of less inequality than the
primary data available to them indicate. (See Paukert (1973), for a
technical explanation of this) . However, the data they used for the
poorest countries - including Chad, Burma, Niger, Sudan, Madagascer and
Bolivia - was of such poor quality as to be unsuitable for any
calculations.
(21) the 'institutional setting' of a country or its 'style of
development' is undoubtedly significant. For recent confirmation of
this, see A. Berry's account of changes in the Peruvian income
distribution profile (article in Latin American Research Review, volume
xxv, no 2, 1990).

Chapter 2 Inequality and Poverty in Colombia to
the End of the 1970’s.
1) Introduction and Methodological Approach
Colombia is, according to the World Bank's categorisation, a 'lower-
middle-income' country, which means that it has a GNP per capita level
of between around US$600 and around US$2000 (1988 figures).
Specifically, its GNP per capita level approaches the middle of this
range, at US$1180 (1988). This is (1988 World Bank figures) ten times
higher than in some of the 1 lower-income1 countries, but much lower -
between six and twenty-three times - than in the ' high-income', OECD-
member countries. Tables 1 and 2 in Chapter 1 illustrate Colombia's
lower-middle-income status.
Colombia is endowed with statistics on income distribution and
poverty to an extent which is almost matchless in the developing world.
For this reason, there are very few longitudinal studies on income
inequalities in the developing world outside Colombia. Estimates exist
from the 1930's through to the present day. Published work discusses the
period up to 1978, the year of the World Bank-DANE Household Survey.(1).
A fortuitous state of affairs for our purposes considering also that the
growth rate of the Colombian economy was sustained and exceptional from

46
the 1930's through to 1979. Availability of data coupled with the
existence of what Kuznets thought of as economic growth - a sustained
rise in per capita output - make Colombia an ideal choice as a
laboratory. The aim of this chapter is to review the published work as a
prelude to the main body of this report in the next two chapters, which
will bring the discussion up-to-date with an analysis of the trends from
1978 through 1990, with the aid of official statistics and other data
sources. This will help us later to draw out conclusions from the trends
over a longer period of time.
The methodological approach of this report is aggregative,
opportunistic and piecemeal. That is, data has been culled from a wide
variety of sources: official statistics (published and unpublished);
reports (published and unpublished) from ministries and agencies of the
Colombian Government and from international organisations inside
Colombia; in-depth interviews with various individuals; and participant
observation and pilot interviews inside the largest 'poor neighbourhood'
in Colombia.
This way the fullest possible picture can be painted of the trends
in inequality and their determinants. Making use of just one data source
would not be sufficient, because it would not reflect the richness and
variety of data available. Government ministries, for example,
invariably carry out their own internal surveys using unpublished
official statistics. Gaining access to such surveys - and to their
authors - is essential, in order to compare their findings with the raw
(published or publicly available on diskette) official statistics.
Further, carrying out pilot interviews with the poorest members of
society is absolutely necessary as a way of confirming the 'accuracy' of

47
the official statistics: the latter might not pick up informal resource
transfers among the poor, whereas a more ethnographicall-y-based approach
has a better chance of doing so. Up to now, however, researchers have,
to their cost, ignored this point, contenting themselves with an
analysis of official statistics. Indeed, this is the first report on
inequality trends which makes use of such a wide array of data sources.
The 'piecemeal' approach is thus about taking advantage of all data
options, with the different data sources supplementing one another. A
major difficulty with it is that it is very time consuming, as it
involves a great deal of physical effort ('leg-work') tracking down all
the different sources. For this report this involved visiting a large
number of people, places and institutions (see Appendix 1 for the
specific details) in Colombia. Consequently, travel, hotel and other
costs can be high when following such a method. For example, it may take
a few days to arrange a meeting with a government official, which
implies an extended stay away from one's home or base. In Colombia this
is a frequent problem, as arranging meetings by letter is very
difficult: letters invariably do not arrive or are not dealt with if
they do.
Secondly, it is by no means a perfect approach. Sometimes the
different data sources are contradictory - in terms of coverage, dates,
income units, and so on through a long list - and of questionable
quality. They are, in spite of this, all that is available and for this
reason have to be utilised to their best possible effect, and their
limitations noted along the way - even if this means that trends in
poverty aijd incomes can sometimes only be dimly discerned. "The excuse
for building an elaborate structure on a shaky foundation is a deep

48
interest in the subject and a wish to share it", concluded Kuznets in
his 1955 article on 'Economic Growth and Income Inequality1 (p.26). This
report is written in a similar spirit: the moment must be caught with
what we have.
2) Income Distribution
It has been suggested that, in Latin America generally, persistently
high concentrations of income and wealth, together with a limited
trickling down of material gains from output growth, have been the rule
since the middle of the nineteenth century. Indeed, evidence from
'hacienda' records from the savannah area around Bogota in the late
eighteenth century suggests that the purchasing power over food of rural
workers was lower in 1962 than it was then! (2). It has been suggested
(Reynolds, 1985) that Colombia reached the turning point - defined as
the beginnings of a sustained rise in per capita output - around 1885,
at the time of export-led growth dominated by the rise of coffee
production in Antioquia, in the central part of the country. It is
almost certain that per capita income was rising. Unfortunately, we
cannot discuss the inequality profile during this time as no research
exists on this period.
Indeed, Colombian income distribution and poverty trends were not
studied at all until the second half of the twentieth century. And
until the mid-1960's income distribution in Colombia was studied
exclusively by foreign experts and technical missions. (3). The

Colombian government took little interest in either its levels or its
determinants. Their change of heart, reflected in the appearance of
various government-funded surveys on unemployment and income levels, had
much to with the view taken by the foreign missions that income
distribution was an important indicator of well-being in a country.
Despite such official apathy, an income distribution estimate is
possible for 1964, for both urban and rural areas, as a result of
various surveys and censuses carried out in the country throughout the
1960's and collated by Berry and Urrutia (1976). It depicts a very
concentrated distribution at the beginning of the 1930's, in comparison
with other developing countries of the time; Colombia had a long way to
go to reach the concentration levels approaching those of the developed
countries. The country's economy had some catching-up to do too,
considering the seriously backward nature of the structure of production
in the 1920's and early 1930's; the share of the primary sector was much
higher than the international pattern of the time and the shares of both
industry and urban services much lower. The catch-ups necessary in both
spheres were not necessarily going to jeopardize one another, at least
according to our conclusions in chapter 1 as to the 'goodness of fit' of
the Kuznets curve internationally. Indeed, perhaps the
'technology/industry gap' would give the economy room to fashion
employment-creating opportunities to be able later to produce a Kuznets
curve.
The degree of income concentration in the urban areas at this time
was substantial. 1.5% of the labour force controlled about 15% of the
total income, with the top two deciles controlling about 60% of the
income. In contrast, the poorest 30% of the workforce earnt just 4.5% of

50
all income. Berry and Urrutia note that at the time this distribution
surprised many observers, considering the popular -impression that
Colombia did not have the great family fortunes that appeared to be
common in neighbouring countries. The authors seemed to agree with this,
seeing the "real problem" (p31) not as the absolute number of high
incomes but the extremely low levels of living of the great majority of
the population.
As for the rural areas, the degree of concentration at the top was
more severe. The top 1.5% of the labour force earned 27% of the income,
with the top two deciles taking 65% of the income. The bottom 30% of the
rural labour force, though, earned about 8.5% of all income (4% more
than their counterparts in the cities) due to the lack of overt
unemployment. However, this difference could be because of differences
in the way the figures were collected. In the rural distribution unpaid
family workers were excluded whereas all the urban unemployed were
assigned arbitrarily to the first two deciles. Thus the two
distributions would probably have been essentially similar with this
effect taken out. As to the absolute level of incomes in the two
distributions, this tended to be lower in the rural areas than in the
urban areas, both at the bottom and top levels.
Berry and Urrutia reach three conclusions from the above data: i) the
distribution among rural dwellers plus agriculturalists living in the
city (absentee landlords) is worse than the distribution among urban
dwellers excluding agriculturalists living in the city; ii) at the same
relative position in the income scale the urban dweller clearly has a
higher nominal income and appears in general to be better off; iii)
poverty and inequality in Colombia are a rural phenomenon.

These conclusions would seem to ignore any price differentials that
might make living in rural areas less expensive than in -the urban areas.
Berry and Urrutia, though, found little data on rural prices. They did
note that, because of the high degree of regional specialisation in
Colombia of the type of food grown, some traded food is more expensive
in local markets than in the cities, as food not grown locally is
distributed with greater cost to the villages than to the major cities.
The cost of a balanced diet in the countryside may not, on this
evidence, have been less than in the cities. And in the countryside,
although people spend much less on housing, it is of much lower quality
than in the cities. For example, the size of the dwelling and the
materials used are often inferior to those found in very poor urban
neighbourhoods. Furthermore there are no services; if the man-hours
dedicated to fetching water are priced, water services are much more
expensive in the countryside. The same is true for health and education
services. Beyond a basic level of education children have to be sent to
the nearest town or city. From this and other evidence Berry and Urrutia
conclude that
It is therefore not at all clear that the typical basket
of goods and services purchased by a poor family is less
expensive in the rural than in the urban areas. (p35).
The same authors show that the global countrywide income distribution
for 1964 gives the top 1.5% of the labour force 20% of all income
(compare 15% for the urban distribution and 27% for the rural) which is
less unequal than the rural distribution, but still "a substantial

52
degree of concentration" (p37) . The Gini coefficient. (4) for this
distribution was 0.57. The data used to arrive at the distribution
refers to 'economically active persons'. Available data for the same
year for urban family units gives a similar income distribution profile
- so it appears that both the individual and family data reflect well
the respective degrees of concentration. (5). The Gini coefficients for
the city of Medellin in 1964 are 0.53 (families) and 0.52 (individuals).
For the smaller city of Manizales the coefficients are 0.56 (families)
and 0.57 (individuals).
Other studies done on the period 1964-70 in Colombia show similar
distributions of income and therefore reinforce the validity of the
Berry-Urrutia estimates. The small differences in the percentages found
by each study could have been due to inadequate data or may have
reflected underlying trends. A comparison of the different results is
given in Table 3.

53
Table 3
Percentage of Income Received By Lowest Two-Thirds and Top 10%
Author Year Lowest two-thirds Top 10%
Taylor 1961 28 42 (Individuals)
ECLA 1962 30 43 (Individuals)
Musgrave 1964 23 50 (Individuals)
McLure 1964 27 50 (Individuals)
Urrutia 1964 24 48 (Individuals)
McLure 1970 25 44 (Households)
Sources: i) C.E. McLure Jr. 'The Incidence of Colombian
Taxes, 1970' (Houston 1973); ii) International Labour
Organisation 'Towards Full Employment: A Programme for
Colombia' (ILO, 1970, Geneva).
Turning to a discussion of how the overall distribution changed from
the 1930's through the 1960's, Berry and Urrutia suggest, firstly, a
worsening of the distribution from the early 1930's through the early
1950's. Both the overall personal and family distributions worsened.
There is, however, evidence of slower income growth for unskilled
labour than for other groups, especially those in agriculture. Indeed
for the period 1935-1950/4 labour income in agriculture grew less

54
rapidly than per capita income in the sector. In the manufacturing
sector from the mid-1940's to the early 1950's the- distribution of
labour income worsened also. Average blue-collar wages rose by about 25%
while average white-collar wages were increasing by about 50%. The
authors, by way of explanation here, state that "the fast growth of
manufacturing during these years and the special focus on import
substitution would be expected to contribute to such a trend." (p95).
(6 ) .
It seems, though, that such a relatively high white-collar wage trend
for the period as a whole, and particularly after the Second World War,
constitutes on its own a factor tending to worsen overall distribution.
At the same time the primary distribution also worsened: the gross
capital share rose, with the income of industrial capitalists increasing
somewhat faster than wages.
The authors found no data for artisan workers for this period, but
suggest that it seems unlikely that their earnings would have risen
rapidly, as there is little reason to believe that physical productivity
was doing so or that artisan workers were able to adjust to the modern
factory growth in their industry.
As for government employees - admittedly an extremely heterogenous
category - their wage determination involves a considerable non-market
element (for example, the existence or not of budget surpluses). For
this reason their remuneration may not parallel too closely general
trends for those of comparable skill. However, a moving average for all
government levels shows moderate rises over the decade 1945-55, compared
with no increase before World War One, and more pronounced rises
thereafter. The authors suggest this to be unsurprising considering that

55
a "good number" (p99) of government employees need little preparation
and have few skills. It therefore does not seem surprising that they
should not have shared in the rapid increase in white-collar wages in
the manufacturing sector.
The wages of construction workers were moving ahead of those of
unskilled agricultural workers during this period. Typically, a wage
(daily wages) differential in the order of 10-25% between a peon in
Bogota and a peon in the agricultural region near Bogota was the norm in
the 1935-50 period, which "clearly fits a worsening distribution
pattern" (pl03).
However, for the country as a whole, unskilled wage series for
construction workers are unavailable before 1950. The post-1950 evidence
is consistent with a rather close tie between construction and
agricultural wages. Possibly regional differences were greater in
earlier years, when geographic mobilty was more limited. In general,
construction wages suffered a decline in the 1930-50 period as a whole.
A pattern similar to that seen in the wages of commerce workers: a
decrease between 1936-54 and a subsequent sharp increase until 1963-64.
A factor here may have been the 'violencia' of the 1940's and 1950's
which, it appears, accelerated the shift to the cities and thus played a
role in holding down blue-collar salaries as well as pushing people into
low-income urban jobs.(7).
To summarize, then, the information on wages for agricultural, blue-
collar, manufacturing, construction and commerce workers all shows
comparatively small or no increases from some point in the 1930's to
some point in the 1950's. It appears that during this period there was
an excess labour supply in a number of sectors with the correspondingly

56
downward impact on wages. (8). If one looks at the income distribution
profile by deciles for this period, the point is confirmed: the top two
deciles increased their share of the pie with the bottom two deciles
losing out.
For the period from the early 1950's through the mid-1960's there was
an improvement in the distribution, at least in urban areas (the
agricultural distribution continued to worsen).
Looking first at the non-agricultural sector, blue-collar real wages
in the factory industrial sector rose dramatically after the early
1950's through to the mid-1960's, with an average annual increase of
4.6% - well above the overall urban sector average. Though, as the
average income of these workers was above the urban mean at the
beginning of the period and still further above it at the end, the trend
did not contibute to an improvement in the income distribution.
Meanwhile, wages in smaller factories and the income of artisan workers
increased less quickly, although still faster than urban incomes as a
whole. As they tended to be less than the median urban income at the
beginning of the period, their growth did contribute to a decrease in
inequality. The wages of white-collar workers in industry rose much more
slowly than those of blue-collar workers, the opposite of the trend up
to the early 1950's.
Further evidence of an improved urban distribution comes from the
lower-income sectors - construction workers, workers in small-scale
commerce, maids and street-sweepers in Bogota. It appears that the wages
of all these low-income occupations increased more rapidly than average
per capita income.
Little is known of the distribution of capital incomes for this

57
period. The International Labour Organisation (1970) finds data that
show an . extremely unequal distribution of property, especially in
agriculture (for 1960), as well as a heavily concentrated distribution
of company shares. Of the former, the World Bank (1984) published land
ownership data for 1971, according to which concentration appeared not
to have diminished. Of the latter, they (the ILO) record that just 0.2%
of shareholders (themselves a very small group) own 61% of all shares.
Urrutia (1970) (9) concludes from an analysis of tax returns that the
highest incomes represented a smaller share of national income in 1965
than in 1953 (10) . This would also confirm the finding that income
distribution improved after the ealy 1950's, following some
deterioration in the previous decades. Indeed, Berry and Urrutia
conclude that the urban distribution could only have worsened had there
been a substantial worsening of the intra-occupational distribution,
about which they found no data.
Agricultural wages for the period climbed slowly (approximately 1% on
the average), which contrasts with the increase in average earnings for
all those involved in agriculture (almost 2%). (11). The distribution of
capital may have been worsening, reflected by the rapid advance of
commercial agriculture in the late 1950's/early 1960's. In general,
though, the overall worsening was probably less than in the previous
period.
Combining the results for the agricultural and non-agricultural
sectors for this period, thus getting the overall distribution, the
authors conclude that inequality did diminish, in terms of the size
distribution of income (12), and that the Gini fell from the range 0.60-
0.63 to 0.57.

58
Putting Berry and Urrutia's two subperiods - mid 1930's to early
1950's and early 1950's to 1964 - together would give the following
profile of winners and losers: some decrease in the share of the top
decile, definite gains for the next two deciles, no change for the next
two, some decrease for the bottom 50% and some decrease for the bottom
20%. The relative worsening of the latter two groups appears to have
characterised only the first of the two subperiods. The only group whose
share moved in the same way (up) in both subperiods was composed of
deciles two and three. Such a result "confirms the casual impression of
a certain degree of prosperity in the so-called middle-class, whose
group in fact provided a limited but sufficient market for the import-
substituting industries that developed after the war" (pll6). The shift
from agriculture to non-agriculture, as predicted by Kuznets, played a
role in the apparent 1951-64 improvement (13).
These trends do not take into account the value of capital assets, an
important omission if we assume that capital appreciation be treated as
a form of income. (14) . The authors found no data on how this is
distributed among income groups but suggest that, as it is probably only
large-scale capitalists who are in a position to take advantage of
situations of rapid capital appreciation, any breakdown of the
distribution of capital gains would show a worsening of the overall
distribution.
The pattern found by Berry and Urrutia seems to be quite consistent,
as they themselves recognise, with Kuznets' 'worsening, then improving'
hypothesis on income distribution in the development process: "Assuming
such an improvement really did occur, one might be tempted to assume
optimistically that Colombia had turned the income distribution corner

59
and could anticipate a continuation of the positive, trend". (116).
According to a World Bank sample survey of the distribution of income in
1974, this indeed seemed to be the case, finding less income
concentration in both the urban and rural areas and nationally than
Berry and Urrutia (see Selowsky 1979).
This conclusion was not upheld, though, by Berry and Soligo (1980)
from the period from the mid-1960's through the mid-1970's, a period of
fast economic growth (averaging 6.8% annually). They instead posit a
deterioration in the distribution during this period. There was a sharp
decline in the share of income going to unskilled labour between 1967-
76. The wage differential between white and blue-collar workers widened
as the share of white collar workers in the labour force increased. In
the early 1970's there was a declining wage share coupled with a rising
share of both physical capital and non-labour incomes. For the decade as
a whole, wage data strongly suggest a worsening of the relative position
of the low-wage groups, including agricultural, construction and
personal service workers. These trends are attributed to the continuing
condition of surplus low-skilled labour and to inappropriate government
policies in many areas, notably taxation and public expenditure. They
too, though, end on an optimistic note: "...improvement may occur in the
next couple of decades, judging by certain trends now underway" (p44).
These included slowing labour force growth, continued fast economic
growth and more appropriate educational and family planning expeditures.
Looking at their views on the1 continued fast economic growth' variable,
however, one suspects the authors were more hopeful than anything. They
suggest that if continued growth does indeed prove to be the case,
"Colombia might be viewed ex-post as a case where reasonable income

60
inequality was only achieved through a process of growth* i.e. where the
'expand the pie first* then worry about redistribution' -approach was the
one that brought results" (p45). Indeed it "might"; Berry and Urrutia's
conclusions for the period 1945 to the mid-1950's* of worsening income
distribution under fast growth, would suggest that one be more cautious.
They were to be proved correct, though, if we are to agree with
Urrutia (1985) in his important book on the subject. Taking the 1970's
as a whole - up to 1978 - he suggests overall income distribution may
have improved. That is, the real wages of the very poor - the landless
agricultural labourers - increased rapidly in the decade, as did the
wages of unskilled urban workers. This compares to a sluggish trend in
real wages in the large manufacturing establishments and among white-
collar workers. Berry and Soligo's conclusions are borne out by data
showing little growth in the real income of the poor in the first part
of the decade. This changes in the second half of the decade, after
economic policy started to be consciously designed with distributional
goals in mind. Other factors which helped to avoid a deterioration in
income distribution, according to Urrutia, were the rapid growth of
coffee production (15) and decreasing rates of population growth.
It is worthwhile dwelling further on Urrutia's study, considering its
importance in the field and the extent to which it is discussed in other
works.
From Urrutia's analysis of government-produced statistical data in
the period 1964-78, we can distill the following conclusions. It appears
that in the urban sector income distribution deteriorated between 1964
and 1972. The 7th to 9th deciles of the population - that is, the middle
classes - and the 10th decile improved their positions at the expense of

61
the lower six deciles. In the rural sector, too, income became more
concentrated, with Gini coefficients of 0.58 for 1964 and 0.63 for 1972.
(16) . Nationally, though, due to a closing gap between rural and urban
incomes, the distribution changed little - something which is reflected
in similar Gini coefficients: 0.57 for 1964 and 0.58 for 1972.
Both the urban and rural income distributions 1964-71 are consistent
with wage series data analysed by Urrutia. They show that the urban
distribution of the 1960's had been one in which the middle-class
experienced rapid gains in real earnings, reflected in the increasing
share of total urban income received by the top four deciles of the
urban distribution. The rural distribution shows an increase in
agricultural wages, refecting a significant increase in the incomes of
the lower deciles in absolute terms (17), if less rapidly than that of
the wealthy landowners and rural entrepreneurs. This was due to the
rapid rate of economic growth and a decline in labour surplus conditions
in Colombia's rural areas where most poverty was concentrated in 1964.
This, in turn, explains why the national income distribution did not
deteriorate, despite growing inequality in both the rural and the urban
areas.
Looking at changes in the income distribution between 1971 and 1978,
Urrutia finds that income concentration decreased over this period also.
The lowest four income deciles seem to have improved their participation
in the national income. The participation of the upper 10% of the
population, on the contrary, decreased. (18). The urban distribution
improved in the second half of the decade with the improvement in real
industrial wages. However, even though the household surveys point to an
improvement in income distribution in the 1970's, Urrutia suggests their

62
large underestimation of rural incomes casts doubt on their overall
reliability. One should therefore focus attention solel-y on the results
of the survey for urban areas.
The December 1978 DANE-World Bank Household Survey of Bogota and Cali
(widely regarded as of very high quality) offers further evidence of an
improvement in the urban income distribution during the decade. Its data
are directly comparable with the DANE household survey of 1971. A
comparison between the two, for Bogota, shows a considerable improvement
in the income distribution: "Again, the first five deciles increase
their participation and both the middle-class and the upper-class (tenth
decile) register relative losses" (p90).
In summary, Urrutia's review of government statistical data (mainly
household surveys and wage rates) points to an improvement in the income
distribution between 1971 and 1978, compared to the 'little or no
change' trend of 1964-71/2. The improvement owed itself principally to
the improvement in the income of rural labourers and small farmers (the
least protected members of the workforce), helping to diminish income
dispersion. From the beginning of the 1970's rural-urban migration took
the rate of increase of the rural labour force to around 1%, at a time
when demand for agricultural goods was growing at over 4%. Also
influential were various government policies in the 1970's - notably the
'opening up' of primary and secondary education which lowered the rate
of return to education and thereby equalised earnings to some extent. In
addition, both the tax system and the public expenditure profile served,
from the 1950's, to ensure that the distribution did not worsen. (19).
This would tally with Urrutia's point that "the middle-class did well in
the 1960's and lost ground in the 1970's and...the poorest families

63
improved their standards of living, particularly in the latter half of
the 1970's". (p90).
Another important study, appearing soon after Urrutia, is that by
Mohan (1986) . Though the primary purpuse of the book is to map the
spatial profiles of residence and employment in Colombia using census,
household survey and labour force material, Mohan devotes some space to
the distribution of income through the 1970's. Noting that as the 1970's
witnessed a fall in fertility rates and a progressively smaller
proportion of the population in rural areas, rates of rural-urban
migration declined. This, together with the coffee boom and the
"success" of the drug trade, meant that the incomes of unskilled rural
workers rose - "and consequently those of their urban counterparts as
well" (p64) . Mohan's analysis of published data indeed highlights
Urrutia's point that the earnings of the most unskilled categories of
the urban labour force rose relatively fast between 1973-78. He
attributes this to a "slowdown in urbanisation rates" in the 1970's
which began to improve the overall distribution of incomes.
Discussing specifically the income distributions of Bogota and Cali,
as part of the World Bank's City Study (20), the conclusion is also that
the distribution of income in both cities, despite remaining high by
world standards, may have improved between 1973 and 1978, whether ranked
by household income or by household income per capita (21). The table
below gives the figures used to arrive at this conclusion:

64
Table 4Percentage Shares of Total Monthly Income
Bogota Cali
Category 1973 1975 1977 1978 1973 1977 1978
Households Ranked by Household Income
Bottom 20% 3.3 3.8 4.0 4.0 3.4 4.5 4.1
Bottom 40% 9.8 11.0 11. 6 11. 9 10.4 13. 0 12.4
Top 20% 62.5 56. 9 56.3 55.5 60.0 53.1 54.1
Top 5% 30.2 24.9 23. 8 25.1 31.7 23. 9 25. 0
Individuals Ranked by ]Household Income Per■ Capita
Bottom 20% 3.3 3.9 4.2 4.0 3.4 4.5 4.2
Bottom 40% 9.9 11.5 12. 0 11.5 10.5 13. 0 12.4
Top 20% 62. 6 57.4 56.0 58.0 60.5 54.4 55.5
Top 5% 30. 8 24.0 24.5 29.0 31.4 24.5 27.3
Sources: 1973 Population Census; 1975 DANE Household
Survey; 1977 DANE Household Survey EH15; 197 8 World Bank-
DANE Household Survey EH21.
The lower deciles appear to have obtained gains from economic
that are at least proportionate to, if not somewhat higher than,
growth
those

made by the rich. Apart from the 'tightening urban labour market'
explanation, Mohan concurs with Urrutia in seeing the rise in the
educational level of the labour force as leading to less inequality in
the distribution of earned income. It is worth noting that this has been
achieved despite the mixed record on educational subsidies in Colombia,
documented by Selowsky (1979); the total subsidy is distributed evenly
across income quintiles, with only the subsidy to primary education
being progressive.
The finding of a movement towards less income concentration in the
1970's is, however, dampened by another of Mohan's findings. TVs part of
the main body of his study, Mohan calculates what he terms 'the index of
spatial income segregation' (ISIS), defined as "the percentage
contribution of spatial zones to overall inequality in a city". For
Bogota and Cali the ISIS is substantially lower for labour earnings than
for household income per capita which, according to Mohan, suggests that
some of the inequality is due to locational differences in the
composition of households. A related finding Mohan considers
"disquieting" is that ISIS appears to be increasing over time while
inequality within sectors is declining. This suggests the richer and
poorer sectors are becoming more homogeneous and the cities more
spatially differentiated by income over time. This could mean different
labour markets are operating in the cities. If so, Mohan argues, the
deficiencies in environment faced by poor children would be reinforced
by higher segregation and "have an adverse effect on the future
distribution of earnings." (p78). (22).

66
3) Poverty.
Poverty is an emotive issue. Recently, attempts have been made to
attribute the emergence and growth of both guerrilla groups and the
'Colombian political crisis' to increasing numbers in poverty in the
country. (23). Often, such attempts are more politically than
scientifically inspired. Here, though, we are not concerned with these
debates, rather in mapping changes in poverty levels.
Poverty is included in most discussions of inequality because it is a
special aspect of it, i.e. an extreme manifestation of inequality at one
end. It is also closely related to the income distribution profile. A
very skewed income distribution, with a high number of poor at the
bottom, can either mean a poor country with insufficient resources to
attend to the welfare of all its inhabitants, or a relatively rich
country which has an unnecessary poverty problem due to the fact that
the bulk of its resources/GDP are held by other groups. The purpose of
this section is to review available literature on poverty profiles and
levels up to 1978 in Colombia with a view to establishing the extent of
poverty and whether such poverty is 'necessary' considering the
country's level of economic development.
Before we can do this, we need to know what sections of the
population we are referring to when we note that this or that proportion
are in a state of poverty. That is, we need to know the characteristics
of poverty and who the poor are. Identifying the poor - especially in
the urban sector - is not an easy task as many myths have developed. For
example, there is no evidence that recent arrivals from rural areas

constitute the largest group of urban poor, nor that they are poorer
than persons born in the city, nor that they face greater likelihood of
being unemployed. (Source: Mohan, 1986). Equally, the common conception
that many of the poor are in the informal sectors of the economy (as
self-employed persons, employees of small enterprises, trade and service
workers) is not wholly true. Two of the most complete breakdowns of
which groups constitute the poor are given by Mohan (1980), and by Mohan
and Hartline (1984), both referring to Bogota and both based on the DANE
household surveys of 1975 (March) and 1977 (June) . A summary of their
findings appears below:
- the poor are those in the bottom 30% of individuals ranked
according to household income per capita.
- among poor households, the largest ones are relatively less
poor, a trend connected to the greater number of workers
in larger households.
- children suffer disproportionately from poverty, as a
result of the relatively flat earnings profile for
less-educated, low-income workers.
- those without education are probably poor at any age.
- migrants are not noticeably poor when compared with
nonmigrants. Rather, the majority of the poor are made up of
those who have been in Bogota more than ten years. Thus, a
more satisfactory hypothesis than 'migrants are the poor'
would be 'migration has a depressing effect on urban
wages'.
- the rate of unemployment is inversely related to income

68
level. Or 'the unemployed are more likely to be poor
because they receive less income'.
- the unemployed fall disproportionately among the poor;
working at all does much to alleviate poverty.
- the poor, especially the very poor, are less likely to
participate in the labour force.
- of those in work, poverty is overrepresented among blue-
collar occupations: manufacturing, construction (male) and
trade workers. The same is true for those working in the
retail, transportation and communications sectors, as well
as those (male workers) in the personal and domestic
service sector.
- the poor are overrepresented among workers who work long
hours. Among males this is particularly true of sales,
construction and transport workers. Among women the
opposite is (generally) the case. Overall, poor male
workers are not lacking for work or underemployed; many
poor women are genuinely underemployed or unable to work
longer hours.
- at all educational levels, unemployment among the poor is
greater than among those who are not poor.
The conclusion that emerges from the above is that poverty will not
be alleviated simply by expanding employment opportunities. Rather,
training programmes may be needed for the least skilled and overworked
men along with more employment opportunities and day care programmes for
women. Among those with no work - the very poorest, or the 'super poor',

69
as they have been called (Lipton, 1988) - it seems difficult to
distinguish between those who are unemployed because they are poor and
those who are poor because they are unemployed. Differences in the
participation rates between the very poorest and the rest perhaps
suggest the existence of discouraged workers or people incapacitated by
sickness or injury. For these, employment generation is only partly the
answer. Mohan (1986) suggests: "Many of the poor are probably
unemployable and their poverty must be attacked directly" (pl22) .
Now that we have an idea of which groups constitute the poor, we can
proceed to an examination of how many of them there are. The first
attempt at bringing Colombian income distribution and poverty data
together was in 1976. (Berry and Urrutia). Its authors began by noting
the widespread view current at the time - which they agreed with - that
the extremely unequal income distribution in Colombia was the source of
the country's absolute poverty and that, because of this, absolute
poverty was unnecessary, especially considering Colombia's high income
per capita in comparison with many other developing countries. A state
of affairs which, the authors contend, justified embarking upon the
study of poverty and income distribution in Colombia.
They suggested that a redistribution of "only 7% or 8%" (pxiii,
preface) of the national income would be adequate to double the income
of the bottom quarter of the population. Unfortunately, the authors do
not devote a serious discussion to the incidence of poverty and we are
left to assume that the 'bottom quarter of the population' constitutes
the poor. They can only say: "the statistics may not convey the hardship
that [a] level of income dispersion implies for families at the bottom
of the distribution in a poor country. Given the low mean incomes in

rural and urban areas, large sectors of the population - those in the
lower deciles of the distribution - lead lives dominated by hunger and
death." (pl49). Elsewhere in the book, though, they note that adequate
figures on the income of several of the low-income subgroups were not
available at the time. From their estimate that the bottom 25% of the
labour force gained by 14 to 23 percent between 1934-36 and 1950-54, a
period of apparently worsening distribution, we can surmise that
relative poverty increased (during the same period their figures show
that the bottom 50% of the labour force gained by between 24 - 29
percent) . Such trends, though, shed no light on rates of, or movements
in, absolute poverty.
Berry and Soligo (1980) make no mention of poverty either, despite
mentioning 'the poor' often enough. It seems statistics were just not
available at the time for them to do anything else. Therefore, like
Berry and Urrutia, they had to content themselves with a review of
trends in income distribution.
Something not true of subsequent studies, which benefited from a
greater availability of government-produced figures on poverty and
malnutrition levels. Altimir (1982) found over a third (38%) of urban
households to be in a poverty situation in Colombia, unable to cover
their basic needs. Among the population as a whole, the incidence of
poverty was considerably higher (45%), due to the more widespead poverty
in rural areas (54%). Altimir's figures refer to "around 1970" (p82),
due to the fact that he uses estimates - from DANE and the World Bank
mainly - from 1967 to 1975. He also produces figures for the incidence
of destitution, i.e. where the purchasing power of a household is too
low to cover even the cost of minimum food needs. The figures are: 14%

71
(urban areas), 23% (rural areas) and 18% (nationally). Between a third
and a half of the urban poor are also destitute, according to Altimir's
calculations. (24).
Altimir concludes his analysis by noting the relevance of the concept
of the 'poverty gap'. This corrects indices of the incidence of poverty,
which measure the percentage of the population that is poor without
indicating the extent to which the incomes of the poor lie below the
poverty line. In Colombia the income shortfall of the poor as a
percentage of the total household income of the non-poor is 8.8% (around
1970) . This compares to poorer countries, such as Peru and Honduras,
which have a poverty gap closer to 20%. Colombia, according to Altimir,
is thus one of those countries in which "the dimensions of the poverty
problem appear manageable, at least as regards the magnitude of the
economic resources involved [in eliminating poverty]" (p94).
Altimir's study is useful as far as it goes, but it gives us no idea
of what happened over time. Urrutia (1985) begins to correct this,
comparing some of the different surveys from the mid-1960's through to
1978. He suggests the 1970's witnessed a reduction in absolute poverty
in Colombia.
In 1964 Colombia's poorest group of workers was that of landless
rural labourers. Of course, the fact that the majority of the poor are
to be found in the rural sector is common to most developing countries.
The reason for discussing their fate is because of the importance in the
debate given to both the notion of the 'turning point' and to dual
economy models, such as that espoused by W.A. Lewis and others. The
point is that an increase in real agricultural wages might reflect a
decline in underemployment and therefore the beginning of a development

72
phase in which income distribution could improve. The daily farm wages
of landless rural wages in 1964 were much lower than the wages earned by
any urban worker. Moreover, rural labourers had benefited little from
national economic growth during the previous three decades; between 1935
and 1964 the purchasing power of agricultural workers earning daily
wages did not increase. Though, DANE figures do show a slight
improvement in real agricultural wages for Colombia in the subperiod of
the 1950's and 1960's, with a more substantial improvement in the
1970's. (25).
Supplementing these figures with data from individual firms, Urrutia
suggests this improvement was faster than rises in national per capita
income. Something which motivates him to conclude: "in the second half
of the 1970's the income differential between rural and urban workers
declined and therefore the poorest group of workers in the society
increased its standard of living more than the average." (pl6). Much of
this improvement is put down to increases in the minimum wage - it
increased by 35% between November 1974 and January 1980 - which seem to
have taken hold, as much because of labour scarcity as anything else.
Real wage increases for farm workers and small landowners (also daily
workers), who together make up a significant proportion of the Colombian
rural poor, must have increased their standard of living. Within the
urban areas the finding is that the poorer, unskilled workers did better
than skilled workers (even in manufacturing) and that there was a
decrease in income differentials within industry and relative gains on
the part of poorer workers.
Despite such gains, it is clear that Colombia, like other Latin
American nations, is fast becoming an urban society and, as such, urban
poverty could become a more serious problem than rural poverty. Indeed
it is often postulated that with the acceleration of inflation in
Colombia between 1970-74 real urban wages decreased. This may have
pushed greater numbers into poverty during the decade. The findings,
though, are mixed. Picking out trends from various, often barely
comparable, studies gives a picture of growing urban poverty from 1970-
75 and decreasing poverty in the second part of the decade. For example,
Mohan Wagner and Garcia (1981), looking at nutrition levels from
household survey data, note that malnutrition in Bogota and Cali
decreased from about 30% to about 15% of the population between 1973 and
1978. Urrutia's conclusions, as we have seen, corroborate this. Absolute
poverty, he finds, was reduced due to incomes of poor families rising
during the 1970's at a rate matching or succeeding that of per capita
income. He puts this down to what he calls "the democratic nature of
Colombian politics." (pl31). His point is that, as elections have to be
won, government programmes and subsidies have not benefited exclusively
the top three deciles of the income distribution and economic policy has
not been geared exclusively to favour the modern urban sectors. As such,
"politics... .may have something to do with the improvement of the
Colombian income distribution in the 1970's" (pl31). For the 1980's and
beyond, the adjustment in wage differentials in favour of the poorer
groups could, according to Urrutia, mean less poverty and narrower
income differences.
It is worth comparing Mohan's (1986) poverty estimates for the 1970's
with those of the above. The range of estimates for the 1970 's of
poverty and malnutrition, he states, goes from 8% to 100% of the
population, depending on the reference population, the level of calorie

requirements and the methodology employed. As such little agreement
exists, Mohan suggests that only an idea of the magnitude of the problem
can be obtained. His own estimates reflect this reality, produced from a
method designed to produce lower-bound estimates of the number of people
who simply do not receive adequate income for even the barest minimum of
nutritional requirements. One can then state that at least an x
proportion of the population is malnourished and so in a state of
absolute poverty - in terms of one's assumptions as to what constitutes
'the barest minimum of nutritional requirements'.
For Mohan, that proportion was between 25%-35% in Bogota and between
30%-40% in Cali in 1973. In 1978 the range was between 10%-16% of the
populations of both cities. These estimates would be reduced somewhat,
though it is difficult to say by exactly how much, when it is taken into
account that the poor tend to be more efficent in their consumption of
calories than the rich. If it is assumed that food prices paid by the
poor are 20% less than the average - as the foods they buy are probably
lower in quality than those bought by the better-off but similar in
calorie content - the estimate of malnutrition is reduced. Thus Mohan's
revised figures are: not less than 25% for Bogota in 1973 and 12% in
1978, with similar estimates for Cali. This number of people simply did
not have incomes that would allow adequate nutrition. There might well
be more who have adequate incomes but suffer from malnutrition for other
reasons. This group will probably become more important in the near
future, if current poverty and income trends continue; income inadequacy
will take second place to neighbourhood/environmental effects, such as
lack of sanitation, prevalence of disease and availability of affordable
foodstuffs nearby.

Mohan attributes these trends to "an appropriate economic environment
bolstered by a judicious mix of policies" (p357) for the 1970's.
Included in this is a significant expansion in agricultural labour
demand, as sectoral output increased rapidly without 'excessive'
mechanisation; an increased demand for Colombia's agricultural products,
not least coffee (see n. 15); the growth in employment-promoting exports
of industrial products. Much of this was due to the introduction in 1967
of the crawling-peg exchange rate to guard against peso overvaluation
and encourage labor-intensive export manufacturing. This involved a
mixture of floating and fixed exchange rates, with the Colombian peso
shadowing the U.S. dollar (26); an expansionary fiscal policy;
considerable expenditures in education, health, transport, nutrition,
rural development and construction, themselves labour-using activities;
and the growth in the legislated minimum wage of agricultural workers by
35% between 1974 and 1980 (27).
4) Two Further Aspects of Inequality: Regional Inequality
and Social Mobility
Regional inequality is an important element of overall inequality,
not least because it tells us where poverty is concentrated. Berry and
Urrutia (1976) found that regional income differentials increased during
the period 1938-51, before decreasing somewhat through to the mid-
1960's. Compared with other developing nations at the time, Colombia had
"less severe" (pl45) regional inequalities, attributed partly to

Colombia's relatively - to other Latin American countries - balanced
urban development; it has several important cities as o.pposed to one or
two. (28) . Rapid postwar economic and transport integration of the
country also played its part. Berry and Urrutia's conclusions are given
some support in the study by Fields and Schultz (1980). Using variance
and multiple regression techniques, they attempt to quantify the
importance of personal and regional effects on inequality. Despite
noting that interregional inequality in Colombia is substantial, with
mean incomes between the richest and poorest departments differing by
four to one, they find it is not sufficient for predicting an
individual's income; knowing the individual's education (amongst other
personal variables) would give a more accurate prediction than would his
region. And anyway, they conclude, most income inequality is within,
rather than between, regions. As such, they deny the existence of
regional labour markets. For policymakers to assume that the poor are to
be found in some parts of Colombia and not in others would thus be
wrong. They would be better off designing policies to help the poor
generally, rather than in a particular region, or pocket, of the
country.
Finally, conspicuous by its absence so far has been any discussion of
social mobility. This is because it is a major and serious gap in the
literature on inequality in Colombia. Almost no data is available on the
subject. Conventional census and household survey material only give us
the proportion of the population at a certain income level for a
particular point in time. They cannot tell us if that proportion of the
population is made up of the same individuals over time. For example,
whether those in a state of absolute poverty today are the same as those

77
who were in a similar state ten years ago. This means we do not know how
fluid the Colombian social structure is - if it resembles more a
stagnant pool or a moving stream. As the world Bank stated in its 1978
Report: "Very few [household surveys] follow the fortunes of individuals
and families through time or disaggregate the household to examine the
well-being of women, children and the elderly".
An ILO mission to Colombia in 1974 - a mission which comprised no
less than twenty seven recognised 'development' experts, led by Dudley
Seers - reported that there was no social mobility in the country: "..in
Colombia, as in other developing countries, the probability of a person
reaching the highest levels of education or even of entering the modern
sector is strongly correlated with his family's income... thus
reinforcing the inequality of the overall distribution of income."
(1970, pl43) . Not a single table or piece of data is produced to back up
this claim, however. What is more, evidence from Brazilian trends in
both income distribution and social mobility suggests they may have been
wrong. There, between 1960 and 1970, inequality measured by decile
distributions increased markedly; but during the same period there was a
great deal of social mobility, especially among the sons of the urban
and rural lower-classes. (29). Considering such conclusions, there is
indeed "value in moving beyond data based solely on cross sections of
individuals". (Fields 1980, p94). Doing so would give us a greater
understanding of labour market barriers, take-up of educational
opportunities and the proximate causes of poverty.
Scouring the literature, though, turns up a data-set on nutrition in
the squatter districts of Colombia's third city (Cali) in 1970, carried
out by the Cali based 'Research Foundation for Human Ecology'. Questions
on income levels, housing quality and education were included in the
survey. Furthermore, the researchers looked into the incomes and welfare
indicators of a group of high income families as a control group. And in
1980 most of the families were located again and a follow-up survey
carried out. Thus we are able - partly by default - to pick out changes
in real incomes for the ten year period for groups of families at the
extremes of the income distribution. Following Urrutia's examination
(1985) of the survey's results, we can note that: i)during the 1970's,
income was redistributed towards those at the top and the bottom of the
income distribution. The real per capita incomes of both the rich and
the poor families rose at an average rate exceeding that of the per
capita national income. Similarly, the incomes of heads of households in
these groups rose during the period when real salaries and wages in the
manufacturing industry were declining or growing very slowly; ii)the
real family incomes of both the poor and the rich increased
significantly. The rise in the incomes of the poor seems to be due
primarily to increases in the average number of family members who work
and in the earnings of the wife and secondary workers, whereas among the
rich the increase in the income of the head of the household explains
most of the rise in total income; iii) single parent families in both
social classes have lower incomes than the average for all families of
their class, but the income gains for single-parent poor families were
substantial. This phenomenon probably helped to decrease the incidence
of absolute poverty because many of the poorest families are of this
nature. These points confirm the trends noted by both Urrutia (1985) and
Mohan (1986) on income distribution: during the 1970's there was a
reduction in poverty and the gap between the formal and informal sectors

79
diminished.
The other pointer one turns up after a search is a.1988 article in
the respected Colombian weekly, 'Semana'. It is a report on living
conditions in the country, in which it is noted that seven out of ten
Colombian graduates (in 1988) had fathers who had not completed
secondary school and five out of ten had fathers who had not even begun
secondary school.
The changing income trends of people documented by the Human Ecology
Foundation and the educational mobility suggested by the magazine report
(though it does not reveal its source) strongly suggest, as we suspected
above, that rigorous research into social mobility, looking at changes
in income, occupation and education through time, would bear fruit.
Unfortunately, in conversation with the Director of the Human Ecology
Foundation in Cali (November 1990) , this author was told that the two
groups used in the nutrition surveys will not be followed up again in
1990, due to funding constraints. Though, the same author has since
received positive noises from the government's statistical offices
(DANE) and various independent research institutes in Colombia about the
possibilities of financial assistance in the near future for a full-
scale social mobility survey covering the whole country. All, then, is
not lost.

80
5) Concluding Thoughts
The available evidence suggests that the Colombian income
distribution profile did become less concentrated in the period from the
mid-1930's through to the late 1970's, though this was not a linear
trend. During this time the economy grew substantially, to become one of
the largest of the 'middle-income economies', in terms of the size of
its GDP. (30) . In the years 1965 - 1980 the average annual growth rate
was an impressive 5.6%, with GNP per capita growing at around 3% in the
same period. And the fact that government figures show an upward trend
in real agricultural wages - the critical trend to watch - during the
1950's and 1960's, and a more substantial improvement in the late
1970's, shows that the development process as envisaged by Kuznets - the
creation of remunerative employment outside agriculture and in the
improvement of the productivity of agricultural workers, both as a
result of the rural-urban migration drive - was well under way in
Colombia in the second half of this century, apparently putting the
Colombian economy at that point on the Kuznets curve at which income
inequalities continue to decrease and to approach the lower level of
concentration characteristic of the advanced industrial economies.
Whether this is indeed what was occuring - and whether the trend
continued through the 1980's - is the subject of analysis in the next
two chapters.
The explanations for the movements in the distribution profile are
mostly to do with economic and social factors specific to the country

itself. This does not mean that some of Kuznets' explanatory variables,
such as his 'counteracting factors' to continuing income concentration,
can be discounted, as evidence is just not available to test them. For
example, his observation that wealthy men tend to lose their wealth in
three generations or less when a country is growing rapidly and
approaching the point on the U-curve when income distribution becomes
less concentrated, has received no attention, even though the relevant
data could probably - still - be found. Of another of the 'counteracting
factors' - that governments introduce protective and supportive
legislation to check the rise in concentration, particularly various
forms of taxation - we can perhaps venture that it has had something to
do with the decline in concentration in Colombia, even if only so as not
to worsen the distribution.
Our thesis, then, which this chapter confirms, is that the extent to
which the distribution profile will become less concentrated with
economic development depends upon economic and social factors specific
to Colombia, or, as we called it in Chapter 1, its 'style of
development' The type of growth-path encouraged, for one. The choice
between import-substitution (which tends to be capital-intensive and
income-concentrating) and export promotion (which tends to be
employment-creating and also fosters income dispersion) is the relevant
one in the Colombian case: it explains much of the 'worsening, then
improving' pattern of distribution since the mid-1930's. Secondly, had
the 1970's not been accompanied by increases in public expenditure in
areas like education and health, and the minimum wage not increased so
rapidly, the situation would probably not have continued to improve.
Just as, in the 1940's and 1950's, had it not been for the increase in

82
rural-urban migration as a result of 'La Violencia', blue-collar wages
would probably not have been held down anything like as much, with the
consequent deterioration in the income distribution profile.
The associated relationship between economic development per se and
the income distribution curve holds for most of the period taken in this
chapter. Positing a causal relationship would be entirely spurious; it
could not incorporate the many internal factors which drove changes in
the income distribution and poverty profiles.
Notes
(1) DANE refers to the Spanish acronym of the Colombian Government's
statistical collection agency, which is under the auspices of the
'Ministerio de Gobierno'. It is in charge of organising the census, as
well as other survey matters of interest to the government. Its full
name in Spanish is 'Departamento Administrativo Nacional de
Estadistica’.
(2) see McGreevey, 'Economic History of Colombia', 1971, (pl31). He
notes, though, that the lowest point for rural workers in Colombia came
in the 1890's. The Berry and Urrutia (1976) work, discussed in this

83
chapter, confirms this. They record a horizontal real-wage trend for
Colombian rural workers between 1935-74, but at a higher level than that
of the 1890's (pp68-72 and 90-95).
(3) These studies were carried out by: i)the World Bank in 1950, led by
Lauchlin Currie. This was the first World Bank mission to a developing
country; ii)the United Nations Economic Commission for Latin America
(ECLA) in 1957; iii) the Lebret Mission in 1958; iv)Milton C. Taylor in
1967; and v) the Musgrave Commission in 1969.
(4) see Appendix 2 for an explanation and a discussion of the Gini
coefficient.
(5) whether the household or the individual is selected as the income
receiving unit depends on one's interests. Using the household is more
appropriate for measuring purchasing power differentials, since
consumption is carried out by and for the family. Using the individual
is more appropriate for measuring the capacity for income generation of
persons with different levels of education, age, family background, etc.
The distribution of individual income will usually be less equitable
than that of household income, as in the latter a number of income
recipients are included in each unit.
(6) import-substitution (begun in the Depression of the 1930's in
Colombia and continued apace post-World War Two) tends to raise capital
income in manufacturing and commercial agriculture, as the generalised
protection of industry tends to increase the demand for capital, and
also leads to a less equitable distribution of labour income through
increasing unemployment and lower incomes for unskilled and semi-skilled
workers.
(7) 'La Violencia' refers to the period of widespread violence and

84
political upheaval in rural Colombia in the 1940's and 1950's, which had
much to do with a partial collapse of the state. For those not
acquainted with the period, E.J. Hobsbawm, 'The Anatomy of Violence'
(New Society, no 28, 11/4/63) and J. Pearce, 'Colombia: Inside the
Labyrinth', 1990, (pp49-66), provide full introductions.
(8) also at this time, the decreasing share of the agricultural,
relative to the total, labour force was still contributing to increased
inequality in the overall distribution. This was due to the greater
inequality at that time in the nonagricultural distribution.
(9) M. Urrutia, 'Variacion Historica de la Distribucion del Ingreso en
Colombia', Revista del Banco de la Republica 43, no. 509 (March 1970).
(10) the figures are: in 1953 the 2.9% of taxpayers reporting the
highest income had 35.7% of national income. In 1965 they had just 12.1%
to 14.1%.
(11) as well as this, the paid labour share in agriculture fell vis-a-
vis the capital share.
(12) for example, the top decile share decreased by 3-6 percent, the top
50 percent may not have suffered any decrease, and the bottom 20 percent
may have increased their share. The data for the bottom deciles, though,
is weak.
(13) the increasing percentage of the total labour force moving into the
nonagricultural sector at this time was significant because it was this
sector that was experiencing an improvement in its income distribution
profile.
(14) it is not at all clear, though, that this is indeed how we should
treat it. Income from capital appreciation, like that from profits, is
often reinvested, sometimes to generate more employment.
85
(15) coffee is grown on small-scale plots and so the benefits of
increased demand are relatively dispersed. In the 1970's coffee
production almost doubled in Colombia. At the same time a new variety of
coffee (the 'Caturra' variety) was introduced, which meant demand for
rural labour was high while the old plantations were being renewed and
the new lands prepared. As this occurred at a time when the level of
urbanisation had begun to exceed 60 percent, "surplus" labour became
scarce in rural areas! The new variety, though, is less labour intensive
than the old, but conversely, of course, leads to higher productivity
per worker.
(16) Selowsky (1974) and the DANE expenditure survey of 1971 show less
concentration. It appears, though, that these do not cover a significant
part of capital income and may underestimate significantly the income of
farmers who derived their income from their own land.
(17) this is critical: both W.A. Lewis's (1954) dual economy model and
Kuznets' thesis rest upon the 'turning point' in income distribution
ushered in by the rise in real agricultural wages, triggered when the
excess supply of rural labour has been absorbed.
(18) a comparison of Selowsky's (1974) survey and the DANE'S 1978
household survey confirms the improvement in the income distribution.
(19) for a detailed account of public expenditures in Colombia see M.
Selowsky, 'Who Benefits from Government Expenditures? A Case Study of
Colombia1 (1979); and on the tax system see M. Gillis and C.E. McLure
Jr., 'The 1974 Colombian Tax System and Income Distribution' in Berry
and Soligo (eds.), 'Distribution of Income in Colombia', (1980), as well
as R.A. Musgrave and M. Gillis, 'Fiscal Reform for Colombia' (1971).
(20) this was a major project of the World Bank which, in the 1970's and

86
1980's, looked into housing, transport, employment location, labour
markets and public finance in Bogota and Cali, Colombia.
(21) the results, though, show less overall inequality in Cali than in
Bogota. This probably reflects the fact that "a larger city with a more
diversified economic structure might be expected to have more higher
paid specialised professionals and more people with higher non labour
incomes" (Mohan 1986, p67).
(22) Mohan's findings contradict somewhat the literature on the
existence and the effects of different labour markets on Colombian
income distribution. For example, Kugler, Reyes and Gomez (1979),
Bourguignon (1979) and Fields (1980) all deny the importance of 'formal'
and 'informal' sectors in determining incomes in Colombia.
(23) see e.g., G.S. Garcia, 'El Proceso de Paz: Un Paso Adelante, Dos
Pasos Atras' (1985), as well as A.V. Carrizosa, 'Betancur y la Crisis
Nacional', (1986).
(24) all estimates of destitution suffer from the uncertainty
surrounding the effect that production for self-consumption can have in
enabling a household to adapt successfully to an extreme scarcity of
resources. Obviously this is more relevant in rural areas.
(25) there are regional differences: Antioquia and Caldas, both coffee-
producing areas, were high wage departments in the 1940's and had
experienced some industrialisation by that time. Boyaca and Narino were
both much poorer and had higher populations. By the 1970's Boyaca and
Narino had experienced increases in wage levels and some reduction in
excess labour.
(26) for a discussion of the pros and cons of such a policy, notably the
danger of shadowing a currency that might itself become overvalued, see

87
the article by M. Friedman, 'Financial Times', 18 December, 1989. For
confirmation that the policy had some success - in this case in making
labour-intensive clothing exports profitable - see D. Morawetz, 'Why the
Emperor's Clothes Are Not Made in Colombia', 1981. And for more on the
point that export industries typically use more labour than import-
substituting industries, see F. Thoumi, 'Estrategias de
Industrializacion, Empleo y Distribucion del Ingreso en Colombia', in
Coyuntura Economica, 1979, 9 (1): 119-142.
(27) available evidence suggests increases in the minimum wage at this
time were complied with in practice. They had a lot to do with raising
the incomes of the poor.
(28) Colombia has 33 cities with more than 100,000 inhabitants each, and
11 smaller cities that are at present growing faster than the capital.
(29) see n. 11, chapter 1, for reference here.
(30) see the 'World Development Report, 1990', World Bank, Oxford
University Press, p.182, Table 3, for the exact values of GDP in middle-
income economies; see Tables 1 and 2 in Chapter 1 for Colombia's
position on the 'economic development' and income distribution scales
relative to other countries.
Chapter 3 Income Distribution Trends in Colombia. 1978-90
In the second half of the 1980's the DANE made available the results
from various income and household surveys it had carried out earlier and
from the Census of 1985. From these results we can piece together the
profile of income distribution for various points in the decade. This
way we can then compare the situation through the 1980's with our
analysis in Chapter 2 of how it was before. And with some unpublished
data, provided to the author by the DANE, we are able to look, in
Chapter 4, at the situation in 1990; which is convenient, for this was
the year of a change in government.
The reason for such a veritable flood of data on income distribution
(and, as we shall see in Chapter 4, on poverty also) lies in the - pro
poor - stance of the 1986-90 government in Colombia, headed by Virgilio
Barco. It took a high profile anti-poverty line, which meant it had an
interest in generating primary information on poverty and incomes upon
which to base decisions as well as propaganda. For our purpose this is a
happy state of affairs, but one which may not continue through the
1990's because of financial difficulties facing the DANE from budget
cuts at central government level.
The appearance of the data generated articles and discussions in
Colombian academic journals and in the Colombian press. Much of these
were devoted to a working out of the determinants of the way the
distribution profile had developed since the late 1970's. This Chapter
will offer an analysis of the official statistics, with Chapter 6

89
coming to some conclusions as to the important factors which drove any
changes..
1) Urban Income Distribution
As part of a project to update the Consumer Price Index - from its
last adjustment in 1978 - a survey of incomes and expenses was carried
out between March 1984 and February 1985. It sampled only the fifteen
largest cities. One of its explicit aims was "to discover the
composition and distribution of individual and household incomes".
(Boletin de Estadistica (BE), no 432, March 1989, pl90).
The results, summarised in Table 5, indicate a high degree of income
concentration by households. The bottom decile is shown to have just
1.8% of all income, with the highest decile taking 36.5%. The bottom 40%
have 13.3% of all income. Broken down by expenditures (Table 6),
preferred by many as a more accurate measure of 'permanent income1, does
not give much of a different picture. If anything, it shows more
concentration, with the bottom 40% having the same 13.3% as when broken
down by incomes, and the top 10% having over 37%.

90
Table 5 .
Urban (Household) Income Distribution, 1984-85
Deciles Income (%)
1 OO
2 2.93 3.84 4.85 5.96 7.27 9.08 11.59 16.1
10 36.5
Source: Survey of Incomes and Expenditures, 1984-85, DANE.
Note: the data refers to monthly incomes in in the 15 cities and metropolitan areas sampled.

91
Table 6
Distribution of (Household) Expenditures, 1984-85
Deciles Expenditure
1 1.72 2.93 3.84 4.75 5.86 7.17 8.88 11.49 16.2
10 37.1
Source: Survey of Incomes and Expenditures, 1984-85, DANE.
Note: the data refers to monthly expenditures in the 15 cities and metropolitan areas sampled.
There are, though, some notable regional differences. For the bottom
decile the countrywide average of 1.8% hides a full 1.1% difference
between the bottom decile's participation in the cities of Ibague (2.8%)
and Bogota (1.7%). For the top two deciles the fluctuations around the
means are not so marked.
The ratio of the average income in the lowest decile to that in the
highest decile is 1:20. This is, predictably, distorted by the
relatively high incomes of those in the top decile residing in the
capital. Ratios of expenditures on certain items - notably food - are

not nearly as large as those for income differences. The. amount spent on
'food, drink and tobacco1 (DANE category), for example-, by the top and
bottom deciles gives a ratio of 1:8. (Source: Colombia Estadistica,
1987, p322). This hides, though, the tendency of the poorer groups to
spend a larger proportion of their income on foodstuffs - known in the
literature as 'Engels Law'. (1). It also hides the different prices
faced by the various income groups: the DANE has produced price indices
covering many years for different groups of workers, which show how the
lower income groups face slightly higher prices than the rest of the
population. Inter-regional price variations also need to be taken into
account, which is why it is necessary to calculate different poverty
lines for at least the rural areas, the metropolitan areas and the rest
of the urban areas. The 1988 official poverty lines for metropolitan
areas and rural areas, for example, differed by 33%. (2). The DANE index
of prices faced by the different income groups across cities shows how
Bogota, Cali, Barranquilla, Pasto, Pereira, Cucuta, Neiva and
Villavicencio are all relatively expensive places to purchase food and
other goods. Finally, food preferences by region and income group must
be taken into account when reading bare income and expenditure data.
Consumption of red meat is relatively high (relative to the rest of the
world - apart from Argentina and Uruguay - it is high throughout the
country) in the cities of Monteria, Pereira, Cartagena - indeed all
along the Atlantic coast - and Valledupar, and relatively low in Pasto
and Bogota. Red meat is cheaper in the former group of cities; transport
and distributional costs make it more expensive in Bogota and Pasto.
Urban-rural differences also exist. Fruit and vegetables, for example,
are mostly consumed in urban areas; yuca and platano in rural areas.

93
Indeed, there are significant differences in the type of foods consumed
by region in Colombia, not surprising considering th-e wide range of
climates. This, and the obstacles to speedy overland transportation,
implies that any benefits associated with technological advances in the
production of a particular foodstuff would be shared unequally by the
different regions. Across income groups there are marked differences in
consumption: the lower income groups consume much more rice, sugar and
oil than the average, the higher income groups more dairy products,
bread and fruits. (3). The poor, as we noted in Chapter 2, tend to be
more efficient consumers of calories and proteins than other income
groups, which should make us wary of jumping to conclusions from
statistics showing only the resources available to them.
We shall now proceed to a more detailed breakdown of the results.
(4) .

94
i) The Household Distribution of Income.
As shown in Table 7, the coefficients of the Gini and the Theil,
calculated for 13 cities, come out at 0.485 and 0.478 respectively.
Table 7
Household Income Distribution (13 Cities), 1984/85
Deciles Income(%)
1 1.12 2.63 3.64 4.65 5.76 7.17 9.08 11.79 16. 610 38.0
Gini: 0.485
Theil: 0.478
Source: DANE, 1990, using data from the 1984/5 Survey of Incomes and Expenditures.
Note: the decile distribution is slightly moreconcentrated than for the 15 cities in the original 1984/85 Survey. This is due to the absence of the two smallest cities - Ibague and Zulia - in which income is least concentrated.
95
And plotting a Lorenz curve permits us to see that Medellin, Colombia's
second city, has the most unequal distribution of income, with
coefficients of 0.516 and 0.535 respectively. Bogota and Cali are the
next most unequal cities, as measured by the same coefficients. The
Lorenz curve shows little difference between Bogota and the thirteen
cities together, nor between Cali and Bogota. Cities, all much smaller
than 'the big three', with lower indices of concentration are: Neiva
(Gini = 0.378, Theil = 0.266), Villavicencio (Gini = 0.391, Theil =
0.281) and Cartegena (Gini = 0.394, Theil = 0.277). Mohan's (1986)
point, noted in Chapter 2, that a larger city with a diversified
economic structure might be expected to have more higher paid
specialised professionals and more people with high non-labour incomes,
jfs undoubtedly behind the differences in the indices.
The Theil index allows us to see the contribution to the overall
inequality made by a particular subgroup of a distribution. Taking the
cities as the subgroups, the most notable statistic is that inequality
within Bogota contributes to 50.1% of the total inequality for all the
thirteen cities. Inequality inside Medellin contributes 13.6% and in
Cali 10.5%. Together, then, these three cities contribute 74.2% to the
total inequality within the sample of thirteen cities. This figure will
not seem so surprising when it is realised that the three cities
together generate 75.7% of the total income. It is for this reason also
that the 1984/5 survey showed that inequality of income between cities
explains just 8.8% of the total inequality.
Looking at the households themselves, the survey shows that the
average number of occupants per household is 4.9; the average size of

the household diminishes as income rises - going from 6.1 in the first
decile to 3.6 in the tenth. The number of earners per household shows a
similar distribution, all the deciles having two except the first
decile, which has just one. These two observations highlight the double
bind facing the poorest: large families and few workers. The educational
profile offers little comfort, either: the average number of years of
education for all deciles is seven, but for the first three deciles it
is five. The average age of the 'head of household' is forty-two. This
varies from thirty-nine in the first decile to forty-six in the tenth
decile, possibly reflecting the much greater number of years (twelve)
spent in the educational system by the latter. The proportion of heads
of household who are women is, on average, 24.3%; this diminishes as the
income of the household increases. Interestingly, the proportion of
total household income provided by the head of household shows no trend
across the deciles. On average, it accounts for 63.3% of household
income. In the first decile it represents 57.8% of the total. In the
second this figure increases to slightly over 70%, only to fall again
until rising later in the top decile. It is most important in the second
decile (73.8%) and least important in the eighth (56.9%). Taking the
four cities of Bogota, Bucaramanga, Cartegena and Neiva, there appears
to be a more discernible trend: as income increases, the importance of
the income of the head of household diminishes, only to increase again
in the tenth decile. This has much to do with the increasing
participation of women in the labour market since the 1970's, especially
amongst the middle classes. Women in the top decile do not participate
to the same degree; women in the lowest two deciles, in contrast, show
high participation rates - often associated with part-time cleaning

97
and/or domestic work. In fact, at the lowest levels of .income, work is
often easier to come by for women than for men, possibly due to greater
opportunities for unskilled 'women's work' than for unskilled 'men's
work'. (Source: author's interviews with individuals in the poor
neighbouhoods of Cali, between October 1990 and April 1991) .
ii) The Income Distribution Profile by Household Income Per Capita
Household income per capita depends on the size of the household and
of the numbers of earners in each. It is therefore more sensitive to the
actual condition of individuals - surely what we should be most
concerned about - than a simple household or per capita measure.
It shows, as can be seen from Table 8, a greater inequality than the
distribution by households. Both the Theil (0.555) and the Gini (0.507)
are greater for the personal distribution than for the household
distribution. This is due, essentially, to the fact that low income
households are more numerous than low income individuals, thus
contributing to a more equal household distribution of income.

98
Table 8 .
Household Income Per capita (13 Cities), 1984/5
Deciles Income (%)
1 Oi—1
2 2.53 3.44 4.45 5.46 6.77 008 11. 09 16.2
10 41.1
Gini: 0.507
Theil: 0.555
Source: DANE, 1990, using data from the1984/5 Survey of Incomes and Expenditures.
Note: concentration is greater in the household per capita distribution than in the simple household distribution due to the fact that low-income households tend to be more numerous than low-income individuals.
The highest concentration indices are those for Medellin (Gini =
0.55, Theil = 0.60) and Cali (Gini = 0.507, Theil = 0.525). These are
followed by Bogota (Gini = 0.480, Theil = 0.505) and Monteria (Gini =
0.486, Theil = 0.489). The cities with the lowest concentration indices
are Neiva (Gini = 0.398, Theil = 0.316), Villavicencio (Gini = 0.406,
Theil = 0.309) and Cartegena (Gini = 0.419. Theil = 0.335). This

99
breakdown of inequality across cities is broadly confirmed when we look
at the proportion of income received by the lowest 20% and the lowest
30% in each. Medellin, Cali and Monteria again come out as the more
unequal of the cities, with Neiva, Cucuta and Cartegena as the least
unequal. The same holds for the share of the bottom 30% except that
Villavicencio replaces Cartagena as the 'least unequal' of cities.
Disaggregating the Theil index, as we did for households, we note
that Bogota contributes to 47.2% of total inequality, owing basically to
the concentration of total personal incomes in the capital. The
contribution of Bogota, Medellin and Cali to the total inequality is
72.2%, according to the Theil. The personal income distribution itself
accounts for 11.2% of inequality between the thirteen cities, a
proportion higher than the 8.76% for the household distribution. The
sources of the per capita incomes are broken down in the following way:
salaries (34.3%); independent work (25.4%); imputed income - including
i) what the owners of a house would pay for renting the house, and ii)
the estimated savings from the consumption of home-grown produce -
(16.4%). The latter, interestingly, in the cities, is probably more
important for the middle and upper income groups; there is close to a
national obsession among these groups for having a 'place in the
country' to visit at weekends and to return to the city laden with fruit
and vegetables; occasional (9.6%); capital (7.3%); transfers (7.1%).
Salary incomes are most important in the intermediate deciles between
the third and the seventh, where they account for over 40% of all
incomes. The deciles in which they account for the smallest proportion
of incomes are the first (due to the instability of incomes generally)
and the tenth (because of the predominance of profits and unearned

100
incomes).
Independent work, as the breakdown of sources shows, is the second
most important source of income. The relative weight of these incomes is
high in the lower deciles, decreasing as income increases until the
tenth decile when it increases again. Thus, we note the heterogeneity of
this type of income, as well as of those who receive it. These factors
explain why it is difficult to design appropriate policies to affect all
independent workers.
Imputed incomes increase in importance as income decreases, except in
Bogota and Neiva, and capital and occasional incomes show an opposing
trend. Transfers, though relatively unimportant generally, have a
greater significance for low income homes. (5). In Cartagena and Neiva,
for example, transfer incomes in the first deciles (households) account
for over 10% of all incomes. (6).
Of the above forms of income, salary income is the least unequal,
with a Gini of 0.446. This compares to capital and occasional incomes
which show Gini coefficients of 0.694 and 0.688 respectively.
iii) The Distribution of Income Among Income Receivers.
Turning to the distribution of income among those who receive - from
earnings, transfers, capital - an income of some kind, we also find
concentration to be high: the overall Gini comes out at 0.525, the Theil
at 0.617 (see Table 9). Medellin and Bogota have the greatest degree of
concentration, with the smaller cities showing less concentration.

101
According to the Theil Index inequality in this particular distrubution
contributes to 5.3% of all inequality in the thirteen cities.
Table 9
Income Distribution of Income Receivers (13 Cities), 1984/85
Deciles Income (%)
1 0.82 2.23 3.44 4.35 5.26 6.47 8.18 10.59 15.5
10 43.3
Gini: 0.525
Theil: 0.617
Source: DANE, 1990, using data from the 1984/5 Survey of Incomes and Expenditures.
Of the income receivers 44.7%, on average, are women. The proportion
is highest in the first decile - 66.5% - and declines rapidly through to
the final decile - 18.9%. The sources of income emerge as essentially
the same as those for the per capita household distribution and are
similarly spread. There are just two exceptions. Firstly, imputed

102
incomes are not included, as they are best considered from the
standpoint of the household. Secondly, the importance - of transfers in
the lower deciles increases significantly when broken down by income
receivers. In Cartagena, for example, incomes from this source reach
28.1% in the first decile and 26% in the second, (see, though, n.6 for
the need for caution here).
Also as in the per capita distribution, the incomes with the greatest
degree of concentration are those from capital and occasional incomes;
the least concentrated those from salaries and transfers.
iv) The Distribution of Labour Incomes.
Turning, finally, to labour incomes - the principal source of income
for both households (58.5%) and for income earners (72.2%) - it should
be noted at the outset that it is difficult to locate precisely incomes
from 'independent work1. Sometimes, what surveys take to be income from
independent work could equally be categorised as capital income: many of
the employed who classify themselves as 'owner or employer' ('patron' or
'empleador') declare as their principal source of income 'independent
work' and not 'capital'.
As shown in Table 10, the Gini coefficient for the employed
population in the thirteen cities as a whole is 0.47, while the Theil is
0.489. This is a less concentrated distribution than that off all income
earners. Agricultural workers living in the city have a Gini of 0.587
and small independent traders ('comerciantes1) have a lower one at

103
0.492. Lower still are the Gini's for administrators (0.331) and all
non-agricultural workers and operators (0.364).
Table 10
Distribution of Labour Incomes (13 Cities), 1984/5
Deciles Income(%)
1 1.22 3.03 4.24 5.05 5.96 7.17 8.78 10.99 15.3
10 38. 8
Gini: 0.470
Theil: 0.489
Source: DANE, 1990, using data from the 1984/5 Survey of Incomes and Expenditures.
The concentration of earnings can be shown in another way: workers -
agricultural or not - small independent traders and service workers
together constitute approximately three quarters of the employed
population, but receive just 57.3% of labour incomes. In contrast,
professionals and managers, constituting 13% of the employed workforce,
receive almost a third of all earnings.

104
By occupational position, domestic employees and workers show the
least concentration, with independent workers and owners at the other
end of the scale - the latter with Gini1s of 0.506 and 0.478
respectively.
By level of education, the most unequal distribution is that of the
employed with some higher education (Gini = 0.464), followed by those
with some secondary education. This, as we shall see in Chapter 6,
reflects the expansion of secondary and higher education during the
1960's and 1970's in Colombia, thereby increasing the competition for
jobs at this level and forcing many secondary and university graduates
to 'trade down'.
By sex, the proportion of employed males in the total is 59.1%. They
account for 72.9% of total labour incomes. The distribution of labour
incomes of women (Gini = 0.407) is slightly less concentrated than that
for men (Gini = 0.473).
According to area of activity, the agricultural and mining sectors
show the greatest degrees of inequality, at 0.516 and 0.542
respectively. The least unequal were the electricity and transport
sectors. (Source: Boletin de Estadistica, no 446, 1990, pl30, table 29).
Using the Theil Index to evaluate the contributions between and
within various groups gives the following picture. It is notable that
inequality within each occupational group contributes to a full 73.3% of
total inequality, while that between groups accounts for 26.7%. For
example, inequality amongst employees accounts for 39.3% of all the
intra-occupational inequality. The picture is the same when broken down
into educational levels, sex and areas of economic activity - intra
group inequality far outweighs inter-group inequality. The degree of the

latter is determined, in order of importance, by educational level,
occupation, sex, and occupational position. The occupational sector in
which one works has a negligible influence. These findings are much the
same as those of Fields and Schultz (1980) , noted in Chapter 2, using
data from the 1973 Population Census.

106
2) The Rural Distribution of Income
The 1984/5 survey of incomes and expenditures was an urban survey,
for the urban Consumer Price Index was, rightly, seen as more relevant
to most people: in 1970 56% of the population lived in urban areas; in
1985/6 the proportion was closer to three-quarters. (7). For the
distribution of rural incomes we can adapt the findings of the DANE'S
1988 National Survey of Rural Households.
i) The Per Capita Distribution of Income.
In the first place, the general level of rural incomes is very low,
with reference to the minimum salary of 1988. Secondly, there are
important differences in incomes between the salaried and those working
on their own account (independent workers) in favour of the former. The
individual distribution of income shows that 20.6% of individuals - the
first two deciles - have just 3.9% of the labour incomes, in comparison
with the top 17.9% who share 43.8% of labour incomes. Labour incomes,
though, show less concentration than non-labour incomes; and less
concentration also than individual incomes overall (Table 11).

107
Table 11
Distribution of Rural (Individual) Income, 1988
Deciles Income (%) Individuals (%)
1 0.5 002 1.9 10.03 3.4 10.74 5.4 11.35 7.7 10.56 7.1 10.07 13.3 11.78 11.4 8.79 16.6 9.9
10 32. 6 8.6
Gini: 0.47
Source: calculations of the author from the 1988National Survey of Rural Households, DANE. All forms of income are taken into account.
The Theil Index of inequality for all labour incomes is 0.326, with
the degree of inequality amongst women greater than for men - something
which increases with age. Inequality between urban areas, semi-urban
areas, and rural areas ('cabeceras, nucleos no-cabeceras y areas
dispersas' ) does not appear to be very significant. This is not true,
though, between regions; the Central region, for example, has a Theil
Index of 0.260 while the Eastern region has one of 0.432.
Generally, inequalities within groups are significantly more

108
important than between groups. Thus, 8 9.8% of the inequality in earnings
is mostly explained by that existing within groups wit-h the same level
of education, with 10.2% explained by differences between groups with
different educational levels. Similarly, inequalities by occupational
position are mostly explained (88.7%) by the contribution within the
group, with differences between groups explaining 11.3%.
Despite this, it is useful to estimate the contribution of different
variables to overall inequality, including education, experience and
region. (8) . On average, an additional year of education increases
(men's) salaries by 4.2% and unearned income ( 1 ganancias1 ) by 7%. In
contrast, an additional year of experience diminishes their salaries by
0.5%. Salaried workers resident in semi-urban areas ('nucleos no-
cabeceras') earn, on average, 14.8% more than those resident in rural
areas ('areas dispersas'). For total earnings, those of men are greater
in the urban areas ('cabeceras') followed by those in rural areas and
then in the semi-urban areas.
The salaried in the agricultural sector do better than those in rural
manufacturing and those in commerce, but earn less than those in the
service sector. By regions, the salaried in the Central region earn more
than those in the Atlantic or in the Eastern regions.
Education appears to be less relevant as an explanation of income
differences in rural areas than it is in urban areas. Indeed, it has
been suggested that it explains up to a third of income variation in
urban areas and just a tenth in rural areas. (Source: Londono,
'Coyuntura Social', No.l, December 1989).
As for the position of the various agricultural groups within the
national income distribution (of 1988), approximately half of the

109
salaried in agriculture are in the lowest 40% of the national
distribution, while the figure for the salaried in non-agriculture is
22.5%. Further, the salaried in non-agriculture earn approximately one-
third (28%) more than those in agriculture. The income share of the
independent agricultural workers vis-a-vis those in the non-agricultural
sector is similar, as is its importance across the deciles. And
agricultural proprietors ('propietarios') have generally lower incomes
than those in non-agriculture; a lower percentage of the former are
found in the top 40% of the national income distribution. It would be
fair to say, then, that the rural employed tend to be concentrated in
the lower deciles of the national income distribution, due principally
to the low level of average rural incomes in the different occupational
positions.
ii) The Household Distribution of Income.
As we noted in Chapter 2 (Notes, n.5), if the concern is general
well-being of individuals, then knowledge of household incomes is more
appropriate as it more accurately reflects consumption. The assumption
is that resources available for consumption are - evenly - distributed
at the level of the household.
The quintile breakdown is given in Table 12. It shows that the bottom
20% of rural households share just 2.8% of salary incomes. The
households in these bottom two deciles have incomes well below the
minimum salary (Table 13). Even the bottom 26.5% of households earnt, on

110
average, just two-thirds of the minimum wage. And the poorest 45.8% took
16% of the incomes, also earning below the minimum wage. In contrast,
the top 10% of households received 31.7% of rural incomes. For all
incomes the Gini is 0.465, for salaries 0.394, for labour incomes 0.546,
and 0.579 for non-labour incomes (against 0.550 for unearned incomes, or
1ganancias1).
Table 12
Rural Income Distribution (Households), 1988
Income Group (Quintiles) Salaries
LabourIncomes
Non-LabourIncomes All Incomes
1 2.8 5.2 3.1 5.0
2 12.2 13. 0 7.6 12.4
3 20.5 18. 9 10.4 18.1
4 28.6 25.0 23.1 24. 8
5 36.0 37. 9 55.8 39.6
Gini: 0.394 0.546 0.579 0.465
* Not adjusted for consumption of home-produced foodstuffs.
Source: calculations of the Ministry ofAgriculture (1990), from the National Survey of Rural Households, 1988, DANE.

Ill
Table 13
Distribution of Total Rural (Household) Income,. 1988
Income Level (According to multiples of the 198 8 minimum wage) Households (%)
0- 50% 22.451-100% 23. 0101-150% 20. 0151-200% 13. 0201-250% 6.4251-300% 4.6301-400% 5.3401-600% 3.6601-800% 0.9801-1500% 0.8
Source: Calculations of the author from the 1988National Survey of Rural Households, DANE.
As in the urban distribution, salaries show the most equitable
distributional profile, followed by labour incomes and then by non
labour incomes. Such a breakdown has an effect upon the household
distribution of income between the urban, semi-urban and rural areas, as
well as upon differences between regions. For example, the Central
region, where salaries have the greatest weight - due to employment
opportunities in the coffee sector in this region, as well as the
presence of dynamic rural labour markets - has the 'best' distribution,
with a Gini of 0.424. The Eastern region, characterised by less dynamic

112
rural labour markets, and therefore with a less preponderant salary
element, has the most concentrated distribution and a Gini of 0.503.
(Source: National Survey of Rural Households, 1988). This finding is
similar to that of Schultz and Fields (1977), who, using a sample from
the 1973 Census, noted that the regional element was the main factor
explaining the variation in rural wages.
ill) The Distribution of Household Income Per Capita.
A better indicator still of well-being is household income per
capita. As well as recognising that the welfare of individuals rather
than households should be the main concern, it takes into account the
varying size of households. That is, household income is adjusted for
household size. However, it does not recognise economies of scale in
consumption or allow for 'equivalence scales' (see Chapter 4 for an
explanation of these) to be calculated. As a rule, it tends to produce
higher inequality indices than the unadjusted household income indicator
- suggesting that even though households with higher incomes tend to be
larger, the additional income is not compensating enough and the
distribution of household income per capita becomes worse than household
income. (9).
For 1988 the household income per capita measure (Table 14) shows the
bottom two deciles receiving approximately 5% of the income, with the
poorest 45% having approximately 20%. By contrast, the top 10% receives
close to a quarter of rural incomes. Thus - in this case - it seems that

113
taking into account the size of the household has the effect of reducing
the concentration of income. The Gini is somewhat smaller than that for
household income, at 0.275. The explanation lies in the decline, during
the inter-censal period of 1973-1985, of 'hacinamiento' , or occupation
density (defined by the DANE as 'three or more persons per room') - in
the country generally, but in the rural areas in particular, and so
offsetting the usual effect of the household income per capita measure.
Table 14
Distribution of Rural (Household Per-Capita) Income, 1988
Deciles Income (%) Households (%)
1 1.5 10. 82 3.5 11.13 5.7 10. 84 6.7 10.25 8.3 10.26 9.8 10.37 11.3 9.98 13.5 9.49 16.1 8 . 910 23.6 8.4
Gini: 0.275
Source: calculations of the author from the 1988National Survey of Rural Households, DANE.
The average incomes among the top 20% are seven times higher than
those of the bottom quintile. The latter receives 5% of total incomes,

114
2.8% of salaries and 9.9% of total earnings. In comparison, the top 20%
receives.39.6% of total income, 36% of salaries and 41.4% of unearned
income. The 'critical poor', or indigent, according to the NBI method of
measurement (see Chapter 4 for an explanation of this method), receives
23% of all incomes, 24.7% of salaries and 23% of unearned income. In
contrast, 'the non-critical poor' receives 24.8% of total incomes, 25.8%
of salaries and 22.5% of unearned income. Generally, as poverty
diminishes, the salary element of incomes increases. This is
particularly evident across the 'critical poverty' and the 'non-critical
poverty' divide. 'Las ganancias', though, according to the Line of
Poverty method, remain an important element in the incomes of the non
poor .
Disaggregating rural inequality using the Theil Index confirms much
of the above. Specifically: i) the negligible influence of education
upon rural incomes compared to its effect on urban incomes; ii) the much
less inequality among those receiving salaries than independent workers
- though the majority of inequality is still explained by differences
within the various income-earning groups. The Theil Index also shows how
income tends to increase with the size of one's land holding and that it
is substantially less among those with no land. However, inequality here
is explained mainly (95.94%) by the intra-group differences (the groups
being landholders and non-landholders), which suggests that it is
associated more with labour factors (salaries and other earnings) than
with access to land, even though the possibility of generating high
earnings is positively correlated with access to land.
In conclusion, the - growing - significance of salaries in the total
incomes of families is noteworthy, especially in its contribution to the

115
reduction in critical poverty. Much of this has to do with the
development of more complex labour markets in and around many rural
areas of the country, often centred around a thriving 'rural' urban
centre. Non-agricultural economic activities and commercial agriculture
combine to provide employment opportunities. The departments of Valle
and Cauca have many such centres; and the fast-growing city of
Valledupar (in the north-western department of Cesar) is the most
spectacular example at present. The recent phenomenon of 'satellization'
- whereby population increases as a result of migration are concentrated
not in departmental capitals but in nearby 'satellite' cities - is tied
up with the development of these centres. (10).
3) Wages During the 1980's.
Looking at average annual growth rates of real wages, between 1978 and
1986 (using ECLA figures for each year), it is clear that the poorest
groups of workers faired worse than the rest. The workers in commerce
and services experienced an average annual growth rate of 2.51%, stock-
raisers 1.59% and crop farmers just 1.17%. These compare with industrial
wages, which increased by 3.38% annually, and construction wages, which
increased even faster, at 5.65% annually. (11). The legal minimum wage
had an average annual growth rate of 5.94%. (ECLA figures). Latest
figures available from the DANE, covering 1987 through 1989, show the
agricultural and service workers to have clawed back some of their

116
earlier losses, as a result of their own wage gains and real wage losses
in the industrial and construction sectors and for those on the minimum
wage.
Taking the period 1978-1989 as a whole, though, lower-income groups
experienced a smaller increase in their wages than other groups. The
figures for both construction workers and for those receiving the
minimum wage are more encouraging. The construction sector tends to be a
point of entry into the labour market for many, and so the vast majority
of its workforce come from low-income - and young - groups. And despite
the fact that it can be difficult, at times, to see the relevance of the
minimum wage as a wage setter - ECLA reported, in 1980, that the
proportion of workers receiving wages equal to, or lower than, the
minimum wage in that year rose from 32% to 35%; in 1988, according to
the DANE, it was still hovering around the 35% mark - at least it has
maintained a respectable growth rate; indeed, it maintained its
purchasing power throughout the 1980's, which cannot be said of many
other Latin American countries (see, though, n.ll for the - different -
influences the minimum wage has upon each sector). Indeed, only the wage
in the construction sector and the minimum wage itself kept up with the
growth in GDP, which grew by 4.02% annually between 1978 and 1986. This
points up the regressive effects of economic development in the period:
in most companies the productivity of labour increased sharply at the
same time as real wages, especially those of poorer workers, declined.
The increase in corporate profits therefore did not stem from faster
growth, but from a deterioration in wages in relation to productivity.
This translated into a fall in the share of wages and salaries in
national income during the eight year period. Of course, the years 1980
117
- 1985 were particularly bad, not only for wage growth but for the
economy overall, which suffered from severe contractions of growth. Yet,
the government's wage policies must not be ignored; it limited pay
increases to public employees to 10% and the minimum wage to an increase
of 18%. This during a quinquennium when inflation averaged 22.5%
(figures from DANE and ECLA).
4) Unemployment
The unemployment rate, of interest due to its disproportionate effect
on the poor, remained fairly constant between 1978 and 1983, when it
went into double figures, reaching almost 14% in 1985 - compared to 8.8%
in 1978.
In 197 8 the employment situation improved, both in urban and rural
areas. Underemployment also dropped while the participation rate
continued to increase, making the reduction in unemployment all the more
'impressive1. In 1979 the unemployment rate remained stable at
approximately 9%, with underemployment falling and the rate of
participation increasing (which had been happening since 1970) again. In
1983 the unemployment rate shot up, to 12.7%, due to regular increases
in the labour force above the rate of value-added in the years up to
1983. The relaxation, in 1983, of dismissal procedures also played a
part. In 1984 and 1985 unemployment continued to rise, despite the
reactivation in production compared to the early 1980's. For example, in
1984 the industrial sector increased its productivity by 10%, yet
employment in the sector fell by 1.5%. The explanation is three-fold: i)

the expansion which took place was mainly in industry and mining -
activities which typically generate few jobs. ECLA commented, in its
1984 annual report on the Latin American economy, that "the rise in
output due to industrial expansion originated in a change in the
structure of production in favour of import substitution and exports,
activities which are in the hands of large enterprises characterised by
a low level of job creation".(pl70); ii) during 1980-83 there were
institutional restrictions operating on the dismissal of workers;
employers could not reduce employment at the same rate as the fall in
production. Thus, post-1983 employers were in a position to increase
production with the same, or a smaller, workforce; iii) the rise in
urban wages in relation to rural wages and the growth of housing without
an initial quota attracted labour to the cities, thereby swelling the
numbers of urban unemployed.
In 1986 the urban unemployment rate dropped slightly - on the back of
the highest rate of economic growth since 1979. In the period 1986-1990
the - urban - unemployment rate declined steadily from 13.9% to around
the 10% mark. This reflects the growth in production during these years,
despite the downturns of 1988 and 1989. The rural unemployment rate, in
1988, stood at 3.2% (DANE figure, from 1988 Survey of Rural
Households), which reflects the large number - close to a fifth - of
unpaid family workers. Since 1964 only twice has the rural unemployment
rate gone above 4.0% - during 1971 (July and November) and 1972
(September). Both these years were characterised by weak labour demand
in all the agricultural sectors, notably the coffee sector. (Source:
'Ministry of Agriculture' report, August 1990, pl77. See n.8 for the
title of the report.).

119
5) Summary
The results from the 1985 survey of Incomes and Expenditures indicates a
high level of concentration. To understand the full extent, though, of
the income differences one has to look beyond - shades of Richard
Titmuss here - the bare income data: regional differences in food prices
and differences in food preferences, by both income and region, have to
be taken into account.
The Theil index shows how the three largest cities - Bogota, Medellin
and Cali - contribute to three-quarters (74.2%) of the total (household)
inequality of the 13 largest cities. In comparison, inequality between
the 13 largest cities explains less than one-tenth (8.8%) of inequality.
The household per-capita distribution shows greater concentration,
due to the fact that low-income households are more numerous than low-
income individuals. Partly for this reason, the household per-capita
distribution, according to the Theil index, explains slightly more of
total inequality between the cities than household income.
The least concentrated distribution in the 13 cities is that of
labour incomes, with a Gini of 0.47. This is due to the preponderance of
'salaries' - the most equally distributed of incomes - within overall
labour incomes. Though, if the proportion of the various groups of
workers in the labour force is plotted against the proportion of total
incomes received by each, the distribution of labour incomes does not
appear so equal.
In the rural areas, the general level of incomes is much lower than
120
in the urban areas and, partly as a consequence, concentration is
generally lower too. Rural regions with a more preponderant 'salary'
element in overall incomes show lower indices of inequality.
Wage rates show changing trends in the period. Up to 1986 the poorest
groups of workers - in commerce, services and agriculture - faired worse
than the rest, though the minimum wage kept up with the latter. In the
second half of the decade the trends were reversed. Through the period
as a whole, though, lower-income groups did experience smaller wage
increases than other groups (with the minimum wage maintaining its
purchasing power). At the same time, however, productivity increased
sharply - which meant that profits increased their proportion of
national income at the expense of the wages of low-income groups.
The (official) urban unemployment rate fluctuated during the period,
increasing from 8.8% in 1978 to 13% in 1986, before declining to 10% in
1990. The expansion in the mid-1980's of even relatively low job-
creating sectors of the economy, as well as the continuing increases in
the participation rate throughout the decade, meant that it did not
decline further. It is wiser, though, to look at the distribution of
incomes, especially those of the household and of household per-capita,
rather than to the unemployment rate, when assessing the level of well
being of individuals: resources are distributed at the level of the
household. Unemployment for a worker in a poor household could mean the
family falling into the 'critically poor', whereas for a worker in an
upper-middle income household unemployment may not hit so hard,
considering the importance of 'unearned income' at the upper income
levels.
121
Notes
1) Engels' Law states that: when income increases, expenditure on food
also increases - but by a proportion less than the increase in income.
Technically: income elasticity for food is less than 1, but positive.
This is to be expected, considering that there is only so much food any
one indivdual can consume.
2) The exact values, according to CEPAL, 'Magnitude de la Pobreza en
America Latina en los Ochenta', May 1990, were: 18,464 for the
metropolitan areas and 12,511 for the rural areas (in 1988 Colombian
Pesos).
3) The author is indebted to the Rice Department of the International
Centre For Tropical Agriculture for making available the results from
its internal departmental surveys from which these trends were
identified.
4) The trends noted are from an analysis of the overall results obtained
from the 1984/5 Survey of Incomes and Expenditures, as well as from a
sample of 13 cities taken from the survey and analysed by the DANE in
Boletin de Estadistica, no's 443 - 446, 1990.
5) Due to the 'underground' nature of international money transfers into
Colombia - before January 1991 it was theoretically illegal in Colombia
to even possess dollars - much underreporting has undoubtedly lowered
the significance of transfers for all income groups.

122
6) Numbers of Colombian expatriate workers, principally in the United
States and Venezuela, are variously estimated at -between 500,000
('Forbes' magazine, 1990) and 3,000,000 (Director of 'Universal de
Cambio1, the principal Bureau de Change in Colombia, in an interview
with the author, March, 1990). The average amount of remittances sent
back to families is equally uncertain: 'Forbes' puts it at US$875.00
annually per worker, but the Director of 'Universal de Cambio1 puts it
much higher. Some empirical research is obviously needed to gauge,
precisely, the significance of transfers.
7) These figures are taken from 'Magnitude de la Pobreza en America
Latina en los Anos Ochenta', Economic Commission for Latin America
(CEPAL), May 1990.
8) This discussion relies heavily upon an internal report by the
Colombian Ministry of Agriculture ('El Desarrollo Agropecuario en
Colombia', August 1990), kindly made available to the author.
9) For a more detailed discussion of these issues, the reader is
directed to Anand, Sudhir. 1983. 'Inequality and Poverty in Malaysia:
Measurement and Decomposition'. New York: Oxford University press.
10) The phenomenon of 'satellization' is discussed at length in 'Boletin
de Estadistica', numbers 441 (December 1989) and 451 (October 1990).
11) For some years there has been a considerable imbalance between those
wages which can be regulated and those which cannot. Traditionally, the
minimum wage has been closely linked to industrial wages, has had a more
distant relation with wages in commerce, and has had practically no link
with agricultural day-wages. In this way, variations in the minimum wage
have been similar to those in industrial wages, not very different from
those in the commercial sector, and have had no relation whatever to

daily wages in the agricultural sector. As the Economic Commission for
Latin America has pointed out : "This assymmetric pattern is not always
taken into account.. .when the minimum wage is set; it is often assumed
that it influences wages equally." (ECLA Report, 1983, p200). In the
1980's, industrial wages rose much more than wages in rural areas and in
the commercial sector, and so worsened the overall income distribution.
The high industrial wages provided an incentive for companies to use a
variety of labour saving procedures, but at the same time they
encouraged people to move to the cities. Thus, the rise in industrial
wages has decreased the demand for manpower while increasing the supply
- in this way having a negative effect on urban employment and income-
related poverty.

Chapter 4 Poverty Trends in Colombia, 1978-90
Poverty trends in the period are as well documented as those of income
distribution, if not more so. This chapter analyses the latest data,
generated principally by the DANE, to try and trace trends for the
1980's. This is a prelude to a comparison with earlier trends in the
next chapter. As in the previous chapter, the data will be, as far as
possible, divided up into urban and rural categories. Such a division
allows for clarity and enables conclusions to be drawn - in Chapter 6 -
as to the forces behind the trends in each sector.
1) Two Methods of Estimating Poverty
The method of estimating lines of poverty and destitution has a direct
bearing on the magnitudes of both likely to be found. Because of this it
is necessary to be aware of - if not to state - the assumptions made by
the different methods of measuring poverty and of the particular
advantages and disadvantages attached to each. Failure to do this
renders estimates almost meaningless.
The method of drawing Lines of Poverty and Destitution (LP and LI
are, respectively, their Spanish acronyms) involves calculating the
minimum cost of a food basket that contains the minimum requirements of
calories, proteins and other nutrients. (1). After this, the proportion
of food expenditure in the total budget of low income households is

125
calculated. Finally, the cost of the minimum food basket is divided by
this proportion, thus obtaining the poverty line. -The supposition
involved is that a family with incomes below the value of the poverty
line lacks food in the same proportion that it lacks other goods and
services. Finding the line of destitution (LI) is done by calculating
the value of the minimum food basket. A household is destitute - or
'super-poor' or 'ultra-poor' or 'critically poor' - if its total income
is insufficient even to purchase this basic basket. The difference
between the value of the line of destitution and the line of poverty is
sometimes referred to in the literature (the DANE also uses it) as the
'poverty band'. Households are inside the band if their incomes could
cover basic food needs but not other needs - like housing, health,
clothing, transport and school materials.
Until very recently the DANE - indeed, all branches of the Colombian
government in their official documents - has preferred an alternative
measure of poverty, known as the Index of Unfulfilled Basic Needs (or
NBI, to use its Spanish acronym) . This method defines the poor by
selecting indicators of poverty, in this case five of them, and then
assigning each household a score which will define it as non-poor, poor
or destitute. Three of the indicators are to do with the state of
housing. Firstly, the quality of the materials used to construct the
house, including walls, roofs, floors. Secondly, the minimum density of
occupation - 3 or more people per room is considered as overcrowding.
Thirdly, the access to public services - electricity, drinking water and
drainage, mainly - enjoyed by the household. The two other indicators
are designed in part to replace the income data. They are: i) the 'rate
of economic dependence' in the household, or the number of family125

126
members per worker; ii) the number of school-age children in the family
that are. not attending school; this serves as an indicator of poverty
due to inability to meet even the nominal school fees of the state
schools, and of poverty-risk due to non-receipt of education. A family
or household is said to live in 'absolute poverty' if it registers on
just one of the five indicators; and in a 'state of destitution' if it
registers on two of them. (2).
Both methods, the LP and the NBI, have their strengths and
weaknesses. The LP, when calculating the minimum cost of adequate
nutrition, confronts a number of difficulties. Eating habits and
preferences for particular types of food, for one. Secondly, the method
is frequently employed without controlling for sex, age, activity and
place of residence, all of which influence amounts of calories needed.
Then there are the problems of establishing a nationwide poverty line,
in view of different costs in different regions (see Chapter 3 for some
examples here). And the assumption, mentioned above, of certain income-
elasticities among the poor is by no means incontrovertible. (3) .
Further, it is generally accepted that incomes tend to be underestimated
in household surveys, which would have the effect of overestimating the
numbers in poverty in a society. This is especially so for the poor,
who, according to official governmental surveys the world over, tend to
spend more than they earn. (4). Moreover, the critically-poor - the
destitute - would tend to die if they did not spend more than they
earned. In the literature (see, for example, Musgrove and Howe, 1973;
Prieto and Duran, 1977; Altimir, 1982) the explanations for this have
focused on the distorting effects of high inflation upon income
measurement; and the 'purchase' of durable goods - with long-term credit126

127
that is not divulged in the questionnaire. No effort, though, has been
made to -ask the poor themselves about this point. As a result, this
author, with a view to shedding more light on the apparent paradox,
conducted a number of pilot and extended interviews with some of the
poorest members of the urban district of Agua Blanca in Cali, between
October 1990 and May 1991. This ethnographic approach found - by asking
respondents to explain how they 'got by1 with little, and often no,
'income' - that the following are examples of the survival strategies
used by the poor to fill the income-expenditure 'gap': street begging;
knocking on 'friendly doors' in the immediate vicinity of their 'house',
asking for food and/or money; church and/or government assistance of one
form or another - the Catholic Church often donates food parcels, and
the Colombian Institute of Family Well-Being runs day schools for the
children of the poorest in which they give food supplements; building an
extra room, from discarded materials, to rent out; help from families,
either family members living nearby, or in the form of money transfers
sent from another part of Colombia and/or abroad.
Finally, measuring poverty and destitution through incomes and
expenditures is often said (for example, by the DANE in their Boletin de
Estadistica, no. 441, December 1989, pl88) to couple the results very
much to the contemporary economic situation, both nationally and within
regions. Though, why this should be a disadvantage is not clear; it
seems misplaced to see the economic situation, nationally or regionally,
in this light; it would be more helpful to understand it as a direct
cause of the level of poverty, something which is discussed in Chapter 6
of this report. The border cities of Cucuta, bordering Venezuela, and of
Pasto and Ipiales, bordering Ecuador, are obvious examples here: their127

128
fortunes, in terms of export markets and employment opportunities, are
inextricably tied to the prevailing economic health - of Ecuador and
Venezuela.
The strength of the LP as a measure is that it takes advantage of the
comparative simplicity of drawing poverty and destitution lines by
concentrating on the easily identifiable 'food1 variable, indisputably
related as it is to the condition of the poor. Further, the supposition
of a relatively constant level of family expenditures is helpful for
comparisons across income groups.
The problems associated with the NBI method of measuring poverty,
seem, at first sight, to be damning. Firstly, it is strongly biased in
favour of indicators relating to housing and public services. The main
objection here is that in rural zones the availability of public
services as a criterion of poverty is inappropriate. In such zones
infrastructural investment tends to be much less important than in urban
zones, meaning that the NBI measure will - erroneously - classify as
poor a much higher proportion of rural households than it will urban
households, on the basis of their lack of access to electricity and
drainage. That all those in rural areas without such services are poor
is clearly an unwarranted assumption; malnutrition, illiteracy,
unemployment, and underemployment are totally ignored. Secondly, the NBI
measure includes no information on family incomes and expenditures. This
is not surprising, for the DANE depends, for its statistics on the
1980's, upon information collected from the 1985 Census, which did not
include a question on either income or expenditure. The recently
published data from the 1984/5 survey on incomes and expenditures
changes this somewhat, though it restricted itself to urban zones. For128

129
rural zones the 1988 rural household survey helped to fill the gap.
Thirdly, NBI does not allow for disaggregation of -departmental and
municipal averages. By themselves these do show the type and magnitude
of (regional) poverty, but reveal nothing of the enormous disparities in
living conditions between communities in a single department. This is
especially noteworthy in the most economically developed areas of a
country: in Colombia the relatively prosperous departments of Bogota
D.E., Antioquia and Valle are a mix of conspicuous prosperity and
extreme poverty. Further, with only regional information it is
impossible to compare the relative situation of the inhabitants of
deprived urban neighbourhoods with that of rural peasants without land
in a remote village, and to decide which group needs assistance more
urgently.
To improve on the NBI measure the DANE needs to incorporate
information on family incomes and expenditures into it - as well as
information on employment, health and nutrition. Secondly, it needs to
increase the coverage of its household surveys, to include not only the
thirteen largest cities, as at present, but other areas of the country
too - rural and urban. To offset the increased cost of widening the
sample like this it could reduce the size of the sample frame from the
present 30 000 families in each survey. As the World Bank has recently
noted, "So large a sample is not necessary to obtain accurate results".
(World Bank Mission to Colombia, 1989, plO).
Despite the above, the NBI is an essential tool for measuring the
number of households that do not enjoy basic services considered as
essential. It is therefore more helpful to consider the two methods of
poverty measurement as complementary; the NBI may not capture all those129

130
who are poor due to income inadequacy - sudden, or repeated, loss of
livelihood, with so many of the borderline poor depending on temporary
work, would not change an individual's NBI score - but it does provide
information on coverage of those basic services without which a
community's standard of living would be less than tolerable. Such
information is essential for planning social investments and programmes.
After all, even the non-poor, on the LP measure, could not afford to
finance road building or electricity investment programmes without
direct council or government assistance. Both of the measures, then, are
needed if we want to know about all the relevant - infrastructural and
income-related - standard of living inputs.
A final element, not taken into account by either measure, is the
opinion of the poor themselves about how poor they are. Awareness of the
subjective element is useful in that it comes from those 'on the
ground' , and at the sharp end of what is discussed, objectively, as
poverty. Exploratory research has been done on this question amongst the
rural poor in the south-western department of Cauca. (5) . Its
conclusions suggest that the poor are not so concerned about the
structural indicators of poverty - as measured by the NBI - as by the
daily problems brought by unemployment and underemployment, the lack of
control they have over the prices of basic goods, and the absence of
small and workable plots of land. Also widespread was the view that the
government had abandoned them and took little, or no, interest in their
fate. More strikingly, many of those interviewed did not 'feel' poor,
despite being classified as such on both the LP and NBI indicators. The
following two respondents were quite sure about this:
130

131
"...while I am alive and healthy I cannot consider-
myself poor, thank the Lord..." (from: Bonilla, 1989,
p218; my translation).
"...thank the Lord that as I have my health I don't
feel poor, because the saddest thing of all is to be
sick in bed and without a penny, right?...." (from:
Bonilla, 1989, p218; my translation).
2) Poverty in Colombia - Results from the 1985 Census and the 1984/5 Survey on Incomes and Expenditures
Both surveys used in this chapter are 'point' surveys, or snapshots,
as they were called in Chapter 2. By their very nature they tend to
overstate poverty, especially within dynamic industrial economies like
Colombia. This is because they do not take into account family life
cycles, which tend to mean that many household members - particularly
chidren - move out of poverty as a result of upward (job) mobility. It
is useful to keep this in mind when considering 'point' trends.
Using the data from the 1985 Census we can distill the following,
overall, conclusions: 45.6% of the Colombian population has what the
DANE call 'Unfulfilled Basic Needs' (NBI) and 22.8% are in a situation131
132
of 'destitution1. Households not enjoying basic services make up 21.8%
of all households. Added to this, almost one-fifth have - inadequate space
in their house; approximately 16% of households suffer from high
economic dependency, defined either as those households with more than
three people per employed person or those households in which the head
of the household has completed less than two years of primary education;
almost 14% of homes are of an inadequate standard; and 11.5% of
households have children that do not attend school.
In the larger cities, with populations over 500,000 (of which there
are four), a quarter (25.6%) suffer from NBI and almost one-tenth (8%)
are considered to be in a state of destitution. The most important
single indicator within the NBI in these metropoli is that of
'insufficient space' in the home. 15.6% of households suffer from this.
In the much smaller population centres, with less than 10,000
inhabitants, 45% suffer from NBI and 26% from a state of destitution.
The most important NBI indicator here is households without basic
services (18%).
Putting the two urban areas together and comparing them with the
rural areas, shows (see Tables 15 and 16) that the latter has twice the
proportion of its population with NBI. Furthermore, although over two-
thirds of the Colombian population reside in urban areas (69% as at
1988, according to the World Bank Development Report, 1990, p238), more
than half of the country's poor live in the countryside. The figures for
NBI in the countryside show that 72.6% suffer from NBI, which is 52.3%
of the poor nationally. A full 44.4% of the rural population is
considered destitute. (6) . The most important elements of NBI are
households without basic services (49%) and inadequate housing (27.3%).132

133
Table 15
Households with NBI in the Urban Areas of each Department,1985.
1 . Choco 67.552. Sucre 49.753. Orinoquia 48.314. Cordoba 47.765. Bolivar 45.266. La Guajira 44.557. Magdalena 37.178 . Cesar 36.779. Caqueta 36.7410. Amazonia 36.2311. Atlantico 33. 9212. Narino 32. 6413. Norte de Santander 32.5614. Cauca 29. 0715. Huila 28.5216. Meta 27.7017. Tolima 24. 9118. Cundinamarca 24.3619. Valle 24. 0920. Risaralda 21.2121. Antioquia 20. 8022. Santander 20.7223. Boyaca 19. 9924. Quindio 19. 8125. Caldas 19. 0226. Bogota 18.33
Mean: 32.60
Source: author's calculations from the 1% sample of the 1985 Census made available by the DANE.
133
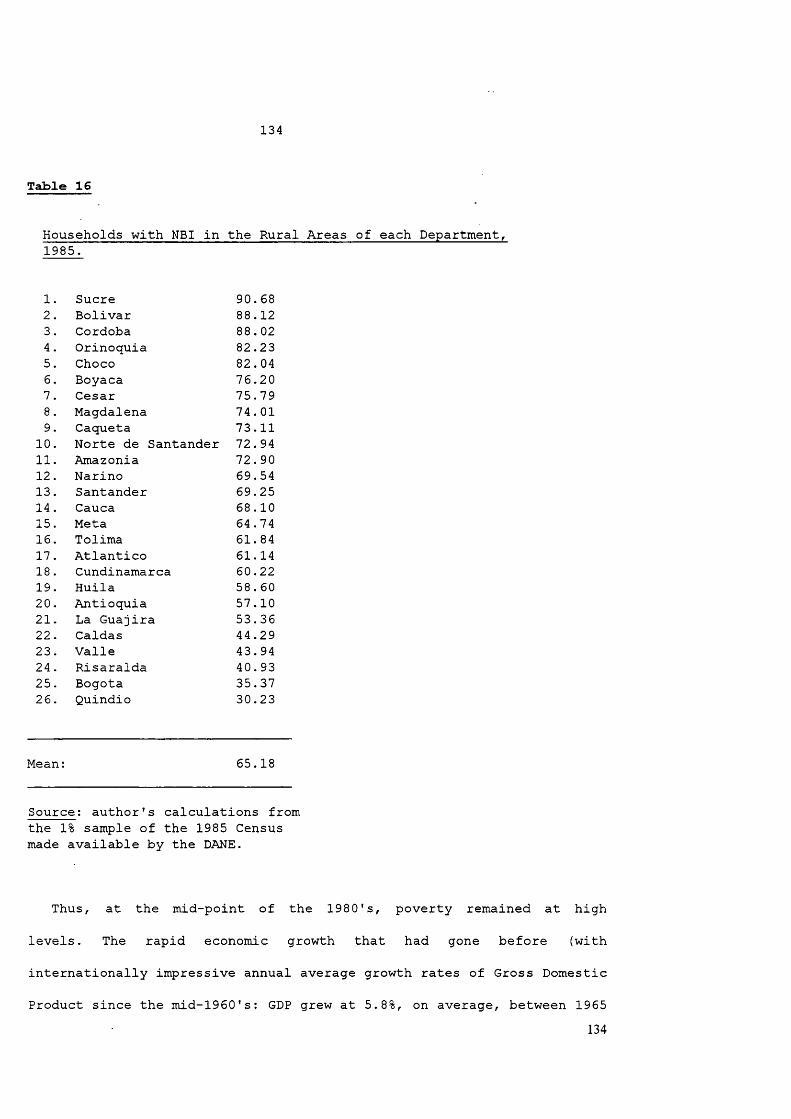
134
Table 16
Households with NBI in the Rural Areas of each Department,1985.
1. Sucre 90.682. Bolivar 88.123. Cordoba 88. 024. Orinoquia 82.235. Choco 82. 046. Boyaca 76.207. Cesar 75.798. Magdalena 74. 019. Caqueta 73.11
10. Norte de Santander 72. 9411. Amazonia 72. 9012. Narino 69.5413. Santander 69.2514. Cauca 68.1015. Meta 64.7416. Tolima 61. 8417. Atlantico 61.1418. Cundinamarca 60.2219. Huila 58. 6020. Antioquia 57.1021. La Guajira 53.3622. Caldas 44.2923. Valle 43. 9424. Risaralda 40. 9325. Bogota 35.3726. Quindio 30.23
Mean: 65.18
Source: author's calculations from the 1% sample of the 1985 Census made available by the DANE.
Thus, at the mid-point of the 1980's, poverty remained at high
levels. The rapid economic growth that had gone before (with
internationally impressive annual average growth rates of Gross Domestic
Product since the mid-1960's: GDP grew at 5.8%, on average, between 1965134
135
and 1980) had not made it disappear. Close to thirteen-and-a-quarter-
million people in the country were in a state of poverty, with slightly
over seven million in the rural areas and one million in Bogota alone.
Across regions, the proportion of people in poverty differs markedly
(Tables 17 and 18) . Sections of the country with higher percentages
(56%+) of households with NBI are - Choco, Cordoba, Sucre, Orinoquia and
Amazonia. With medium-to-high (47% to 56%) levels of NBI are the regions
of Boyaca, Magdelena, Narino, Cauca, Caqueta and La Guajira (excluding
the latter's relatively high indiginous population, all of whom the
Census assumed to be suffering from NBI; their nomadic lifestyle anyway
makes them difficult to survey). With medium-to low levels (35% to 46%)
of poor households are the regions of Norte de Santander, Atlantico and
San Andres. Finally, low levels (18% to 34%) of poverty are to be found
in Antioquia, Valle, Caldas, Risaralda, Quindio and Bogota.
It should be noted from such a breakdown that only Bogota, Quindio,
Risaralda, Caldas, Valle, Antioquia, Atlantico and the island of San
Andres are around the national average of households with NBI. These
regions correspond to those with the greatest levels of urbanisation
(Bogota, Valle and Antioquia); to the regions making up the 'coffee-
axis' (Quindio, Risaralda and Caldas); and to the special administrative
province made up of San Andres and Providencia - both are islands off
the East coast of Nicaragua - whose earnings accrue mainly from tourism
and from the financial services which their 'free port1 status allows
them to offer.
135

136
Table 17 .
Households with NBI, by Departments (1985)
1. Choco 77.102. Cordoba 69.713. Sucre 67.704. Orinoquia 66.325. Bolivar 59.326. Amazonia 56.247. Boyaca 55.068. Magdalena 54.369. Narino 53.7910. Cauca 52.7111. Caqueta 51.1912. Cesar 50.9513. La Guajira 47.2114. Norte de Santander 45.8215. Cundinamarca 43. 8216. Huila 41.6217. Tolima 40.4618. Meta 39.6919. Santander 39.3620. Atlantico 35.4921. San Andres 35.2322. Antioquia 31.9423. Valle 27.5724. Caldas 27.3625. Risaralda 26. 6226. Quindio 21.6627. Bogota 18.37
Mean: 44.49
Source: author's calculations from the 1% sample of the 1985 Census made available by the DANE.
According to a recent World Bank Employment Mission (1986), living
conditions in rural areas resemble those of around 197 0 in urban areas.
Mortality and birth rates, for example, were at similar levels. Coverage136

137
rates of educational programmes, lower in the rural areas, are reflected
in differences in the illiteracy rate with urban areas: 23.6% in the
countryside, 6.8% in urban areas. The percentage figure for the rural
areas is similar to that in the urban areas in 1938 (1938 Census, DANE).
Further findings are indicative of the situation in the countryside: 830
thousand rural households lack basic services (51.2%) compared to just
2.7% in the urban areas; 83% of children under five do not have access
to drinking water; 73% live in homes without drainage; and 95% live with
animals - frequently chickens, pigs or sheep - roaming around inside the
home. 933,000 have no plot of land with which to work. Set against this
is the extremely concentrated distribution of land ownership, with 7.7%
of rural proprietors owning 83% of the land (these figures are those
noted in the discussion in the House of Representatives, Bogota, prior
to the 1986 Legal Act, no. 062) . Despite this, the 1986 Employment
Mission concluded that the basic problem within the rural sector is not
lack of land, but underemployment (as we saw in Chapter 3) coupled with
low and unstable incomes and a very poor quality of life.
By drawing Poverty Lines we can also discover the extent of those in
poverty. For the rural areas, this produces a much more 'dense' map of
poverty, with each of the four regions in Table 18 exhibiting poverty
levels above 50%, producing a higher national average of poor households
than the NBI measure - 62.3% against the latter's 44.49%.
137

138
Table 18 .
Income-Related Poverty in Rural Areas, 1988.
Percentages
Income Unit RegionCriticalPoor
Non-CriticalPoor
TotalPoor Non-Poor
Household National 32.4 30. 6 62.3 37.0
Household Atlantic 41.0 25.8 71.6 28.4Household Eastern 40.2 35. 8 66.1 33.9Household Central 23.5 27.1 59.3 40.7Household Pacific 25.5 29.9 52.6 47.4
Individuals National 37. 0 31.1 68.0 32.0
Individuals Atlantic 47.6 30.4 77.9 22.1Individuals Eastern 45.1 27.0 72.1 27.9Individuals Central 26.5 36.8 63.3 36.7Individuals Pacific 29.3 29.4 58.7 41.3
Source: National Survey of Rural Households, DANE, November 1988.
Note: 'Critical Poverty1 refers to those below the Line ofIndigence (LI); 'Non-Critical Poverty' refers to those below the Line of Poverty (LP).
In urban areas (the thirteen principal cities), the Line of Poverty
measure shows 32% of individuals to be in a state of poverty and 26.8%
of homes. Of the poor individuals, 13.6% are destitute; that is, their
expenditure level does not allow them to purchase even the minimum food
basket; this is 4.4% of the total population (see Table 19). Among
138

139
households, the proportion of destitute is smaller - making up 11.6% of
the poor,- which is 3.1% of all households (Table 20).
Table 19
Individuals Below the Poverty■ and Destitution Lines,1984/5 (13 Cities)*
City Non-PoorTotalPoor
Non-DestitutePoor
DestitutePoor
Bogota 79.47 20.53 95.43 4.57Medellin 56.45 43.55 81.14 18. 86Cali 65.37 34.63 82.86 17.14Barranquilla 61. 00 39. 00 88.81 11.19Bucaramanga 75.58 24.42 90.26 9.74Manizales 58.08 41. 92 82.24 17.76Pasto 71.48 28.52 84.66 15.34Cartagena 61.18 38. 82 80.39 19.61Cucuta 61. 62 38.38 85 .78 14.22Pereira 54.58 45.42 85.55 14.45Monteria 53. 02 46. 98 73.46 26.54Neiva 64.27 35.73 90.48 9.52Villavicencio 68.51 31.49 88.49 11.51
13 Cities: 67.98 32. 02 86.38 13. 62
Source: retabulated by the author from the 'Indicators of Poverty1 Project, DANE, using data from the 1984/5 Survey of Incomes and Expenditures.
139

140
Table 20-
Households Below ■the Poverty and Destitution Lines,1984/5 (13 Cities ) •
Total Non-Destitute DestituteCity Non-Poor Poor Poor Poor
Bogota 81.81 18.19 95. 93 4.07Medellin 63.84 36.16 83. 83 16.17Cali 71.01 28.99 85.47 14.53Barranquilla 66.95 33.05 90.25 9.75Bucaramanga 77.74 22.26 91.42 8.58Manizales 64.37 35.63 84.38 15. 62Pasto 75.46 24.54 84 .24 15.76Cartagena 67.24 32.76 80. 68 19.32Cucuta 68.15 31. 85 86.44 13.56Pereira 61.17 38. 83 88.47 11.53Monteria 59.58 40.42 76.58 23. 42Neiva 69.90 30.10 91.28 8.72Villavicencio 73.66 26.34 89.16 10. 84
13 Cities: 73.15 26. 85 88.38 11. 62
Source: retabulated by the author from the 'Indicators of Poverty' Project, DANE, using data from the 1984/5 Survey of Incomes and Expenditures.
Bogota, with over a third of people and homes (of the urban DANE
sample of thirteen cities) appears to have the lowest proportion of poor
and destitute. According to the LP measure, 20.5% of its individuals are
poor and 18.2% of its households, which means that slightly less than
23.0% of poor individuals reside in the capital. Further, 4.6% of poor
individuals are destitute, approximately 1% of the total individual
population. This is a similar proportion to destitute households, which
make up 4.1% of poor households (0.7% of the total household population140

141
in Bogota). All told, Bogota has less than one-tenth of both individuals
and households defined as destitute for the urban areas.-
Of the other cities after Bogota, Bucaramanga and Pasto have the
lowest numbers in poverty, with approximately a quarter of both
individuals and households poor in each city. The proportions are larger
in the six cities of Villavicencio, Cali, Neiva, Cucuta, Cartagena and
Barranquilla, at around a third. In the four cities of Medellin,
Manizales, Pereira and Monteria the proportion increases slightly to
around 4 in 10.
Comparing the results from the 1984/85 sample of thirteen cities,
according to the different measures of LP and NBI (Table 21), we find
that the second shows a lower proportion (households) in poverty (21.3%)
than the first (26.8%). The reverse is true for the destitute: by NBI
they make up 6.7% of households compared to 3.1% by LP. Table 22 serves
to compare poverty levels in the rural areas with those in the urban
areas - though the rural figures are not directly comparable, as they
refer to 1988 - using the two measures. The proportion of poor
(households as well as individuals) in the rural areas is much higher,
whether measured by LP or NBI, than in the urban areas and, also in
contrast to the urban areas, similar whether measured by LP or NBI. The
higher LP reflects the relative lack of employment opportunities in the
rural areas and the higher NBI reflects the general absence of essential
services and infrastructure.
141
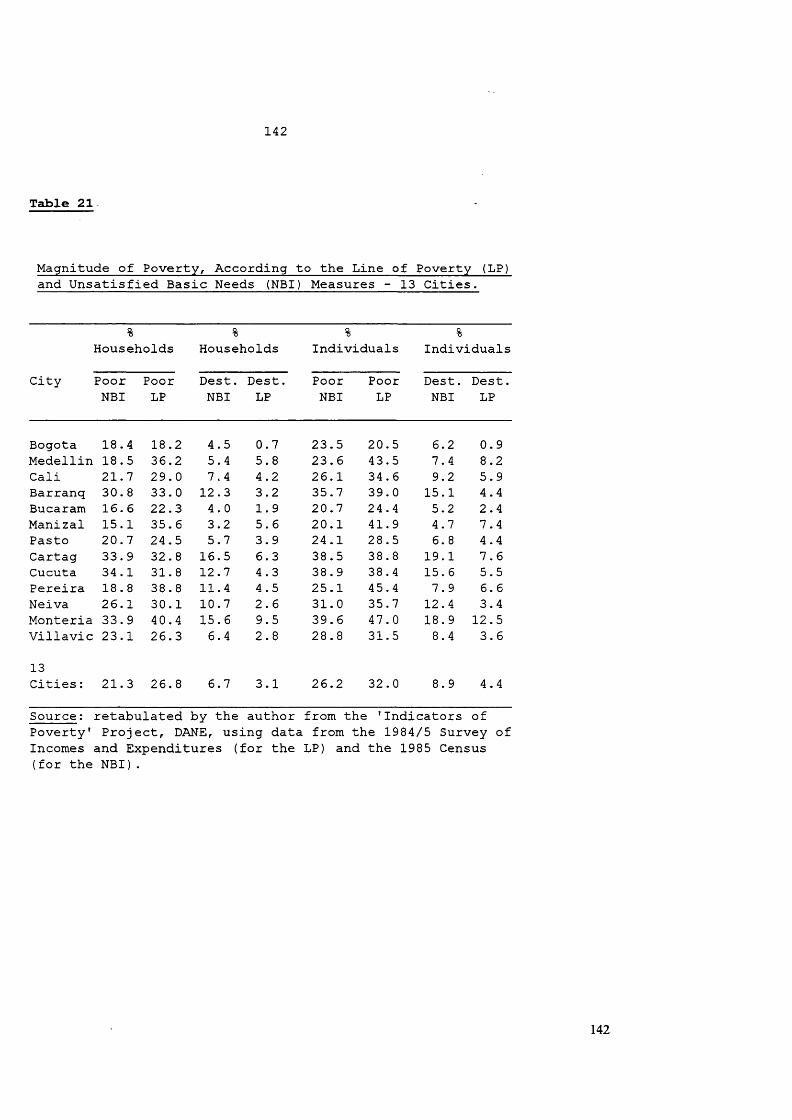
142
Table 21
Magnitude of Poverty, According to the Line of Poverty (LP)and Unsatisfied Basic Needs (NBI ) Measures - 13 Cities.
% % % %Households Households Individuals Individuals
City Poor Poor Dest. Dest. Poor Poor Dest. Dest.NBI LP NBI LP NBI LP NBI LP
Bogota 18.4 18.2 4.5 0.7 23.5 20.5 6.2 0.9Medellin 18.5 36.2 5.4 5.8 23.6 43.5 7.4 8.2Cali 21.7 29.0 7.4 4.2 26.1 34.6 9.2 5.9Barranq 30. 8 33.0 12.3 3.2 35.7 39.0 15.1 4.4Bucaram 16. 6 22.3 4 . 0 1.9 20.7 24.4 5.2 2.4Manizal 15.1 35.6 3.2 5.6 20.1 41.9 4.7 7.4Pasto 20.7 24.5 5.7 3.9 24.1 28.5 6.8 4.4Cartag 33. 9 32.8 16.5 6.3 38.5 38.8 19.1 7.6Cucuta 34.1 31.8 12.7 4.3 38 . 9 38.4 15. 6 5.5Pereira 18 . 8 38.8 11.4 4.5 25.1 45.4 7.9 6.6Neiva 26.1 30.1 10.7 2.6 31.0 35.7 12.4 3.4Monteria 33. 9 40.4 15.6 9.5 39.6 47.0 18. 9 12.5Villavic 23.1 26.3 6.4 2.8 28.8 31.5 8.4 3.6
13Cities: 21.3 26.8 6.7 3.1 26.2 32.0 8.9 4.4
Source: retabulated by the author from the 'Indicators of Poverty1 Project, DANE, using data from the 1984/5 Survey of Incomes and Expenditures (for the LP) and the 1985 Census (for the NBI).
142

143
Table 22
Numbers of Rural Poor According to NBI and LP, 1988
Income UnitCriteria and Type of Poverty Total (%)
Individuals
Unsatisfied Basic Needs
Critical Poverty 35.7Individuals Non-Critical Poverty 26.9Individuals Total Poverty 62.6Individuals Non-Poor 37 . 4
Households Critical Poverty 29.7Households Non-Critical Poverty 27.7Households Total Poverty 57.4Households Non-Poor 42.6
Line of Poverty
Individuals Critical Poverty 34.8Individuals Non-Critical Poverty 30.4Individuals Total Poverty 65.2Individuals Non-Poor 34.8
Households Critical Poverty 30.2Households Non-Critical Poverty 28.8Households Total Poverty 59.0Households Non-Poor 41.0
Source: calculations of the author from the National Survey of Rural Households, DANE, 1988.
The figures for the same thirteen cities can be broken down using
'equivalence scales' (7) and thus give a more 'accurate' poverty
profile. They produce the following two conclusions: i) the percentage

144
of destitute households is slightly higher than the original 1984/85
figure, in spite of the fact that the average value- of the line of
destitution remained the same. This is mainly due to taking into account
the age composition of household members, which shows a greater relative
weight of 8 to 17 year olds, whose caloric needs are greater; ii) the
level of poverty increases significantly when 'equivalence scales' are
calculated. For example, in Bogota the proportion of poor households
increases from 18.2% to 28.6%. In the city of Monteria the increase is
of a similar magnitude, going from 40.4% to 61.6%.
3) Other Poverty Estimates for the 1980's
Unpublished data made available to the author by the DANE allows
estimates of poverty, both according to NBI and LP, from 1986 through
1990. (8). The results, retabulated by the author in Table 23, bear out
many of the problems associated with the two measures, discussed above,
and support the now fashionable call in development circles to 'cross'
the two methods. A recent United Nations conference on poverty (in
Quito, Ecuador, 20-23 of November 1990; proceedings available from the
author), for example, called for an 'Integrated Poverty Method1 (MIP).
The reasoning is that it is more fruitful to see them as complementary,
rather than alternative, methods, where one method is selected to the
exclusion of the other. For example, Table 23 shows that households144

145
suffering from NBI declined from 14.3% to 9.3%, which could be
interpreted as heralding the end of the 'poverty problem' . However,
households not suffering from NBI, but that are poor according to the LP
measure, accounted for 30.8% of the population in 1990 - a 6% increase
on the same figure for 1986. By NBI, then, poverty has decreased notably
in the second half of the decade, and can perhaps - 'perhaps' because
recent riots in some urban areas of the country, particularly in the
north-eastern city of Barranquilla and the north-western city of
Riohacha (see El Tiempo, various issues in April 1991), seem to have
been partly driven by the absence of essential services - be thought of
as having been all but conquered; by LP, in contrast, total numbers in
poverty increased, with the proportion of the population below the
poverty line oscillating between a third and two fifths.
145

146
Table 23
1 Crossing1 NBI and LP, According to Households, 1986 - 1990(7 Cities) •
1986
Line ofNBI
Poverty Non-Poor Poor Total
Non-Poor 60. 9 4.8 65. 6
Poor 24. 8 9.5 34.4
Total 85.7 14.3 100. 0
1987
Line ofNBI
Poverty Non-Poor Poor Total
Non-Poor 57. 6 4.2 61.8
Poor 28.2 10.1 38.2
Total 85.7 14.3 100.0
1988
Line of Poverty
NBI
Non-Poor Poor Total
Non-Poor 56.3 3.3 59. 6
Poor 31.7 8.7 40.4
Total 88.0 12.0 100.0
146

147
1989
Line ofNBI -
Poverty Non-Poor Poor Total
Non-Poor 59.9 2.6 62.5
Poor 29.9 7.6 37.5
Total 89.8 10.2 100. 0
1990
Line of Poverty
NBI
Non-Poor Poor Total
Non-Poor 60.0 2.4 62.4
Poor 30. 8 6.8 37. 6
Total 90.7 9.3 100. 0
Source; Household Surveys between 1986 and 1990, DANE. These figures form part of an (unpublished) internal DANE report, kindly made available to the author. The Household Surveys used are no.53 (1986), no.57 (1987), no.61 (1988), no.65 (1989), and no.69 (1990).
Estimates of individuals below the lines of poverty and destitution
for 1988 are also possible using DANE data. They are not directly
comparable with the unpublished estimates above (Table 23) , for they
come from a larger sample frame; they are, though, still urban figures,
so can be seen as reasonably comparable. Those in poverty in the urban
area as a whole numbered 3.158.206 individuals - 27.6%. This is 4.1%
less than the unpublished estimate above for 1988 (31.7%) but about the
same as that for 1987 (28.2%); the relatively narrow range of the147

148
figures allows some confidence in their veracity. .The number of
destitute individuals for the urban area as a whole was 497.7 67 - 4.4%
of the total population, and 15.8% of the poor. We can also be confident
about these results, as the proportions are very similar to those culled
from the 1984/5 Survey of Incomes and Expenditures: 4.4% of the total
population were found to be destitute, which was 13.6% of the poor.
4) Who Are the Poor?
According to age, 2.6% of the poor are less than one year old, and
pre-school - younger than six years - children make up almost 18% of the
total number of poor. Those younger than 15 account for 43.5% and of
those of working age - 15 to 64 - 53% are poor. In comparison, those of
65+ account for just 3.48% of the total poor; though, this figure has
been, and no doubt will continue, increasing as life expectancy
increases. Children, then, are a significant proportion of those in
poverty. And when the proportion of children in poverty is compared with
the proportion of children in the national population - the latter lower
than the former - the point is reinforced.
Of the children themselves, over half (51.6%) are poor. 40.2% of
those less than one year of age come from poor households in the urban
areas, a figure which almost doubles (to 75.3%) in the rural areas. If
we add to this the negative environmental effects from poverty suffered
by poor mothers during pregnancy, we get some idea of the scale of the148

149
child-poverty problem. Mohan's (1986) anxieties about the negative
effects .of environmental deficiencies contributing,- cyclically, to
malnutrition and stunted growth, noted in Chapter 2, become very
relevant here.
The illiteracy rate for all those of fifteen years and over in
Colombia is 12%. Of those with their basic needs satisfied, 5.7% were
illiterate compared to 22.2% of those with NBI; the figure increases to
almost one-third for the destitute. In urban areas the illiteracy rate
is 7.3%, half that for the urban poor (15.4%). The overall rural
illiteracy rate, at 23.8%, is higher than that amongst the urban
destitute, at 23.1%. The illiteracy rate, it seems, tends to diminish as
the size of the urban centre increases. This is true for both the poor
and the destitute. More worryingly (in terms of the development of
'cycles of poverty'), among poor 'heads of households' the illiteracy
rate comes out at 29.4%, while among non-poor heads the figure is much
lower, at 6.4%.
These trends are reflected by the figures for school attendance.
Nationally, in 1985, 18.6% (600,000 children) of school-age children did
not attend school. Amongst the non-poor the figure is very low (0.8%);
amongst the poor much higher, at 33%, and approaching half (44%) of the
destitute. Again, the proportions differ by sector: 1 in 4 children in
urban areas do not attend school, compared to 4 in 10 in the rural
areas. Within the urban area the proportions break down according to the
size of settlement. Smaller settlements, of between 2501 and 10,000
inhabitants, have approximately 42% of destitute children not attending
school, with over half in the largest urban centres. The practice of
charging for entry into state-financed primary schools has much to do149

150
with this. This author found not a single school which, did not levy a
charge. At present, state schools in the poor neighbourhood of Agua
Blanca - the largest in Latin America - in the city of Cali charge
between two to four U.S. dollars per month, which is sufficient to put
off those at the extremes of poverty. Of course, this is not to mention
the further expenses incurred by the family by sending children to
school - clothing/uniforms, food, writing materials, transport.
According to occupation, 9.2% of the employed poor live from their
own work. Of these, 35.8% are workers, 17% employees, 9.7% unpaid family
workers and 5.7% domestic service employees. A percentage of 'patrones1,
or owners of businesses (3.7%) and of 'independent workers' (23.7%) are
poor. The means of production they own to carry out their labour would
be of little value and of low technology. They will often hire (unpaid)
family workers; as a rule, they would not be able to generate sufficient
income for either themselves or their families. Examples include those
'businesses' run from the house, such as making paper bags for
neighbouhood shops, making and repairing clothing, and - the commonest
case - running a 'general store' from the front room.
Overall, almost 4 in 10 of the employed cannot meet their basic
needs, remaining poor despite having a job (though this does not negate
the point that working at all does much to mitigate the effects of
poverty). Most likely to be poor are unpaid family workers (63.5%),
manual workers (55.7%), owners of businesses (38.1%), independent
workers (37.7%), domestic employees (37.6%) and employees generally
(20.5%).
The urban-rural split by poor workers is 25.2% : 66.7%. It is
noteworthy that, despite the fact that the employed urban population is150
151
double that of the rural, the absolute number of urban poor is greater.
In the countryside, small farm owners make up a high proportion of the
poor, with the degree of poverty in inverse relation to the activity and
quality of the land. Temporary agricultural workers with no land show a
greater tendency to be poor, with permanent salary workers without land
not so poor. Amongst the latter, those working on small-scale farms tend
to be poorer than those working on medium and larger farms. Those
renting small pieces of land are somewhat better off than owners/part
owners of plots, though they remain part of the poor.
There are differences in family structure between the poor and the
non-poor. Firstly, the proportion of nuclear and extended families, as
opposed to single-member households, is greater amongst the poor.
Secondly, among the destitute the nuclear family has a greater weight
than among either the poor or the non-poor. Thirdly, the tendency for
couples not to have children - an increasing trend in Colombia generally
- decreases with the level of poverty. By the same token, couples with
children increases as poverty becomes more acute.
The fertility rate also highlights differences between the poor and
the non-poor. The average number of children per woman in Colombia -
assuming that a woman's fertility throughout her life follows that
recorded for all women in the reference year of 1985 - is 2.84. In the
urban areas it is lower, at 2.5; and much higher, at 4.0, in the rural
areas. Generally, the average number of children per woman increases in
direct relation to the degree of poverty. The trend is very clear: for
the non-poor the figure is 2.1; for the poor, 4.1; and for the
destitute, 4.9. The trends hold for both the urban and rural areas, but
with lower fertility overall in the largest cities/by degree of151

152
urbanisation. Though, the best indicator of differences in fertility is
education. This is due, amongst other things, to late-r marriage among
more educated women.
The infant mortality rate in 1985 was 45.6 (per 1000), a figure
similar to that for Sweden in 1930. (Source: Boletin de Estadistica, no.
411, June 1987, pl99). There are no significant differences between the
rural and urban rates. However, by poverty level there are significant
differences. This should not be surprising, considering the widespread
view that differences in infant mortality are almost totally due to
socio-economic factors, making the infant mortality rate the 'benchmark
variable' when analysing poverty differentials. The poor, the non-poor
and the destitute exhibit rates, respectively, of 54.5, 36.1 and 58.0.
The difference between the poor who are not destitute (40.9) and those
who are (58.0) is more marked. More unequal still are the rates of the
urban destitute (75.9) and the urban non-poor (35.9); in the rural zone
this inequality is not so pronounced. Though these infant mortality
rates remain high, they have decreased somewhat from their 1973 (Census)
levels.
Nonetheless, significant regional differences remain: the regions of
Atlantico, Cundinamarca, Santander and Cordoba each have a rate of below
40 per 1000, whereas Choco (114 per 1000), Narino (71), Caqueta (68) and
Norte de Santander (52) perform not so well. The rate for Choco is,
incidentally, higher than that for Sweden at the turn of the century.
(Source: Boletin de Estadistica, no 411, June 1987, p200).
The quality of the structure of dwellings also differs according to
whether they are inhabited by the poor or the non-poor. Among the
(urban) non-poor the proportion of houses with walls of cane, wood or152
153
'bahareque' (a mixture of mud and straw) is just 6.2%, whereas amongst
the poor.it is over a quarter, and approaching half among the destitute.
The ratio is similar for dwellings with piped water supplies and much
larger for dwellings connected to a drainage system. For dwellings
connected to an electricity grid, though, the differences flatten out.
They reappear again, with a ratio similar to that for 'materials used to
construct the walls1, when we consider cooking conditions. Dwellings
without adequate cooking conditions are heavily concentrated among the
poor and the destitute, with 30.5% and 46%, respectively, in each group,
having to cook in a corridor, a patio or a lounge without a sink, or not
having anywhere to cook. Furthermore, 72% of destitute households cook
with 'cocinol' (a petroleum derivative produced by the national
petroleum company, Ecopetrol), gasoline, kerosene, firewood or discarded
materials ('desechos1). (9).
The DANE indicator of occupation density further divides poor and
non-poor households, again for urban areas. 13.1% of non-poor households
suffered from this, 61.7% of poor households and 77.4% of destitute
households. This should be seen in the context of the destitute having
relatively fewer households with between two to six occupants and more
with 7+ occupants. The average number of occupants per household is 5.1
nationally. For the non-poor, though, the average is slightly less (4.7)
and for the poor (5.8) and the destitute (6.1) slightly higher. These
figures reflect the findings from numerous micro-studies right across
the developing world: poverty risk is almost always (there are a few
West African exceptions) much greater among members of big households,
and among children. (10) . Single-member households and the old are,
conversely, relatively underrepresented among the poor. (11). The fact153

154
that large size is the principal demographic characteristic of poor
households in developing countries has major arithmetical consequences:
that a larger proportion of people than of households are poor; that it
is not appropriate to measure poverty via income-per-household; and that
any reduction in overall (planned and achieved) total family size helps
the poorest most. Composition, too, differs among households by poverty
level, with major consequences for policy. For instance, poor
households, especially in towns, have much higher proportions of
children under ten than non-poor households. The curve, though, flattens
as poverty bites harder; the ultra poor do not have much higher
child/adult ratios than the poor.
5) Summary
The method of measuring poverty is the principal determinant of the type
and extent of poverty to be found. In this chapter, two methods were
discussed - the Line of Poverty (LP) and the Index of Basic Needs
Unsatisfied (NBI). The first is income based, the second more
'structurally' based. Both have their strengths and weaknesses. The NBI
pays insufficient attention to employment, health, nutrition and incomes
and expenditures; the LP ignores the extent to which households enjoy
essential services. Both ignore the subjective view of poverty. The most
appropriate method of measurement, then, involves a fusion of the two,
seeing them not as competing methods, but as complementary. For this154

155
reason, poverty according to both methods was discussed in this chapter.
From the 1984/5 Survey of Incomes and Expenditures and the 1985
Census, one can get a good idea of the extent of poverty in the country
at the mid-point in the decade. A full 45.6% of households are
classified as poor and 22.8% as destitute (by the NBI measure). Poverty
and destitution are less widespread, at 25.6% and 8% respectively, in
the four largest cities. In comparison, the rural area has twice the
proportion of its population with NBI than does the urban area. Indeed,
over half of the country's poor live in the rural areas, despite 70% of
the population overall residing in urban areas.
According to the Line of Poverty measure, for the urban areas, a
slightly higher proportion of households are poor (26.8%) than under the
NBI measure. The reverse is true for the destitute. Using 'equivalence
scales' increases the levels of both poverty and destitution found, due
to the greater relative weight of 8 to 17 year olds among household
members, whose caloric needs are higher.
During the second half of the decade, poverty by NBI, in urban areas,
decreased notably. By LP, in contrast, it increased. 'Crossing' the two
shows that households not suffering from NBI, but that are poor
according to the LP measure, accounted for 30.8% of the population in
1990 - an increase of 6% on the same figure for 1986.
Identifying 'the poor1 is as important as counting them. By knowing
which groups are more likely to suffer from poverty, appropriate
policies can more easily be designed to 'target' specific groups and
their needs. From the 1985 Census and the various income and household
surveys conducted through the 1980's, the following were found most
likely to be among the (urban) poor:155
156
• children (younger than 6)
• children (younger than 15)
• those of working age (15 - 64); 53% of these are poor.
• children not attending school
• the illiterate
• unpaid family workers
• manual workers
• members of large households
• the unemployed/underemployed
156
157
Notes
1) The debate continues to rage among nutritionists and others as to the
relative importance of protein and calorie deficiencies. Sukhatme
(1978), though, has argued persuasively that "protein malnutrition...is
for the most part the indirect resault of inadequate energy in the
diet." Still, the point that the international tendency of concentrating
on intakes of calories and proteins to the detriment of other - often
equally essential - nutrients, like calcium and iron, remains valid. As
has been pointed out by Ochoa (1983), the 'calorie breach1 is not the
only important one.
2) A more detailed account of the way the NBI index is calculated
appears in Boletin de Estadistica, no. 411, June 1987.
3) This assumes, for example, that if a household spends 30% less of its
income on food than is allowed for in the Minimum-Cost Food Basket
(MCFB), then its deficiencies in other goods and services will also be
of the order of 30%. The same applies should the household spend 30%
more on food than the MCFB allows for - in this case it is assumed that
their expenditures on other goods and services also increases by 30%.
Such a supposition is undoubtedly false. For one, it ignores household
composition: a greater weight of 8 - 17 year olds in a household would
tend to increase the amount spent on food, due to the greater
nutritional requirements in this age-group.
4) Altimir (1982), pp78-81, recognised that "income measurement does not
fully capture the accumulation of resources that low-income households157

158
manage to obtain in order to cope with their deprivation" (p. 81), but
offered no explanation or any thoughts on alternative - methods of more
fully capturing the income of low-income households.
5) This research was carried out in 1988 and 1989, as part of a joint
project between the Universidad del Valle, Cali, Colombia and the DANE.
The chief researcher was Maria Bonilla de Restrepo, under whose name the
publications from the research appear in the bibliography of this
report.
6) One should bear in mind that the NBI method is always likely to
classify many more of the rural population as poor, considering its
heavy reliance on the quality of housing and the presence of essential
services. For an excellent discussion of how the different methods of
measuring poverty affect the extent of poverty found in different
countries, see Glewwe and van der Gaag (1990).
7) 'Equivalence Scales' set the basic needs of each household according
to the size and composition of that household - taking into account the
numbers in each household and the different nutritional requirements of
different age-groups and of the sexes. In this way weighted poverty and
destitution lines can be drawn, as opposed to simply arriving at a
poverty line and multiplying it by the number in each household. Using
equivalence scales tends, in developing countries at least - due to the
greater relative weight of 8 - 17 year olds in their populations, whose
needs across a range of goods and services are greater than for any
other age-group - to increase numbers in both poverty and destitution,
despite the Lines of Poverty and Destitution remaining the same. Despite
being a theoretically more acceptable method of calculating numbers in
poverty, the problem of disagreements over minimum levels of158

159
requirements for different age and sex groups remains: . the U.S. Food
and Nutrition Board, The Food and Agricultural Organisation (FAO) and
the Colombian Institute of Family Well-Being (ICBF) have never agreed on
minimum calorie requirements. Further, it is relatively easy to
disaggregate calories consumed by sex and age groups. Doing the same for
different types of activity, varying climatic and ecological conditions
and for populations in which chronic infections (stomach diseases and
amoebic infections, for example, can render the magnitude of energy
ingested somewhat irrelevant) are widespread, is more difficult
altogether.
8) Unpublished figures for these years were kindly provided to the
author by the DANE in February 1991.
9) This author found many cases of the poor cooking with gasoline in an
enclosed space inside the house, often in a bedroom with no windows. The
fumes would thus remain in the room, which, if space was limited, as it
frequently is in poor and destitute households, would be inhaled by the
occupants. Medical workers in Colombia, and throughout the developing
world, report numerous cases of tuberculosis arising out of such
conditions.
10) See Chapter 6 for a discussion of the community pre-school child
care and nutrition programme instigated by the Colombian Institute of
Family Well-Being (ICBF) in 1987. By 1989 it had served half a million
children. Its goal is to reach all children at risk - more than a
million of them - by 1994. Among other things, it gives parents - often
single female heads of household - an opportunity to seek paid work
outside the home.
11) Lipton (1988) has pointed out that "most of this completely reverses159

160
the experience of the now developed countries (NDC's) from 1400 through
1900, when large households generally were better-off than others".
(p39). Much of this, he contends, has to do with the larger proportion
of households in NDC's which contained resident servants. The servants
moved from poorer to richer households, making poorer households smaller
and richer households bigger. For example, in 100 English communities
between 1574 and 1821, over 13% of all persons were - and 28% of
households contained - resident (domestic or farm) servants, "...the
proportion in today's LIC's is much lower - 1% to 5%". (Lipton, 1988,
p43) .
160
Chapter 5 Comparison of pre-1978 Trends with 1978-90 Trends
Bringing the trends noted in Chapters 2, 3 and 4 together will show us
how they moved over time. For clarity, this chapter will begin with an
overall view of changes to the inequality profile in Colombia, including
a discussion of changes in the NBI indicator, which still, despite its
problems, dominates official thinking - and policy - on the subject. A
breakdown of trends in rural and urban areas will follow, with a
discussion of changes to the functional distribution of income
concluding the chapter.
The aim of this chapter is to offer the reader a clear and concise
breakdown of trends in inequality up to the end of the 1980's, before
the discussion, in Chapter 6, of what drove these trends.
1) Overall Changes in Inequality
In a recent report CEPAL (1990) noted that Latin America began the
1990's with higher levels of poverty than in 1970. Between 1970 and
198 0 the number of households below the poverty line diminished but then
registered a sharp increase up to 1986; so sharp, in fact, that the
1980's have come to be called the "lost decade" for the poor in Latin
America. Only two countries in the region followed a different path -

162
Brazil and Colombia. However, at the end of the sixteen year period,
Colombia,, despite having reduced its poverty levels .(see Table 24),
still had higher numbers in poverty - 37.7% of the population - than
many other Latin American countries.
Table 24
Income-Related Poverty in Colombia, 1970 - 1986
Region
Households (%) Individuals (%)
1970 1980 1986 1980 1986
Urban Poor 38.0 35.5 35.9 39.7 40.2
Rural Poor 54.0 45.4 42.4 47.7 44.5
Total Poor 45.0 38.6 37.7 42.3 41.6
Source: United Nations Development Programme. The figures were presented to the Programme's conference on 'Poverty in Latin America and the Caribbean', Quito, November 20-23,1990.
For 1988 another report, by PREALC/OIT (1990), puts urban poverty,
measured by numbers below the poverty line, at 38% and rural poverty at
62%. Both figures are higher - the rural one significantly so - than
those for 1986 from CEPAL (1990), which show 36% of urban households in
poverty and 42% of rural. Assuming the two year gap between the
estimates too short to produce such changes, lack of comparability
between the data sets used by the reports must be the answer. The
PREALC/OIT report noted that "the largest reduction in poverty occurred

163
in the period 1980-84. In the period 1984-88 the decrease in poverty
slowed down and the payment of the social debt benefited the destitute
to a greater degree". (p81; my translation).
Using the 'poverty breach1, or 'poverty gap', tool gives us an
alternative indicator of poverty. It records, as noted in Chapter 2, the
severity of the poverty problem in a country. It does this by capturing
the total amount of resource transfers (money) needed to bring all the
poor up to the poverty line. Put more technically, a measurement of the
'degree of insufficiency of incomes' is made. This way, some assessment
can be made of the feasibility of eliminating poverty by using purely
financial criteria. For 1986 (using CEPAL, 1990, figures) the
insufficiency of the income of poor households as a proportion of the
combined income of all households, was 4.6% for Bogota and 7.6% for the
rest of the urban areas. As a proportion of the total income of non
poor households, the income unsufficiencies stood at 4.9% for Bogota and
8.3% for the rest of the urban areas (the latter figure for 1970, noted
in Chapter 2, was 8.8%). As none of these figures is above 10% - the
corresponding figures for destitute households are lower still - one
might be tempted to conclude that poverty alleviation is a simple
matter, involving relatively few resource transfers. There are many
reasons to beware of such a temptation, not least the point that lasting
eradication of poverty would involve transfers on a permanent basis as
well as infrastrucural investments - to say nothing of the political
will needed to push these through.
Income distribution in the period 1971-89, measured by family
incomes, apparently changed little. Between 1980 and 1989 the majority
of (urban) incomes were concentrated among the top 20%; in 1980 this

164
group appropriated 52.6% of all (urban) incomes and in 1989 53.3%.
Looking specifically at the 1980's, it has been suggested recently (1)
that the urban income distribution profile passed through three phases:
i) a tendency to increasing concentration between 1980 and 1985. The
Gini coefficient moved, slightly, from 0.46 to 0.47; ii) deconcentration
of incomes, with the Gini contracting to 0.45, during the years 1986/7;
iii) a swing back towards income concentration, with the Gini once again
creeping upwards. Together, the three phases show how the 1980's was a
decade in which income distribution worsened, then improved, before
worsening again. Though, how far such short-term movements are
indicative of 'real' trends, as much as differences in the urban sample
frames used, remains a moot point: the figures through the decade come
from the 1984/5 Survey of Incomes and Expenditures, various Household
Surveys, as well as the 1985 Census.
The general trends, though, are clear: the poorest 50% of families
held on to their shares; the intermediate deciles - 6, 7 and 8 - lost
0.6% of their share, which was taken by the richest 20%. The rural
zones, according to the data from the 1988 National Survey of Rural
Households, had a level of inequality similar to that in the urban zones
at the beginning of the 1970's. The lowest 50% of rural families
appropriated 17.8% of rural incomes; the intermediate deciles took 30.3%
and the top 20% took 51.9%. The rural Gini was 0.48.
In summary, the income distribution profile for the 1980's was just
slightly - if not imperceptibly - less unequal than during the 1970's.
This conclusion has been supported by others recently. Londono (2) has
noted how the sharp distributive swing in Colombia, with inequality
rising sharply after the 1930's, reaching a peak during the 1960's, and

165
improving through to the late 1970's, tailed off during the 1980's.
Table 25.illustrates this long-term trend.
Table 25
Indicators of Inequality
Inequality Index 1938 1951 1964 1971 1978 1988
Gini Coefficient
Theil Index
0.454
0.364
0.525
0.535
0.555
0.594
0.527
0.517
0.481
0.421
0.476
0.413
Source: Londono (1990). The indicators are calculated fromDANE Household Surveys.
The (1990) PREALC/OIT report commented that: "in the 1980's Colombia did
not generate any further short-term social debt and it paid a part of
its long-term social debt", (pi; my translation). And the World Bank, in
its World Development Report of 1990, noted how the improvements to the
income distribution which occurred in the 1970's fell off, possibly
leading to a worsening of the distribution in the 1980's.
During the period 1973-85 the Colombian population grew by 28.4%. In
the same twelve years the proportion of individuals suffering from NBI
declined by 24.6%. In 1973 a full 70% of individuals were affected by at
least one of the five poverty indicators which make up the measure. In
1985 this had decreased to 46%. Similarly, the percentage of destitute
in the population declined from 44.9% in 1973 to 22.8% in 1985. The

166
improvements continued, as we saw in Chapter 3, through to 1990.
These, trends were most notable in the urban zones, or 'cabeceras
municipales', where the proportion of the population with NBI declined
by 26.6% (those in poverty) and by 18% (those in a state of
destitution). The rural areas have also registered declines in those
suffering from NBI, but from a much larger - almost the whole of the
rural population - poverty base. Despite a decline of 23.4% in the
proportion of its population in destitution - a higher percentage change
than in the cities - 44.4% of its inhabitants remained destitute in
1985. This is 2.8 times greater than the corresponding urban figure. In
both zones, rural and urban, registered improvements were greater for
the destitute than for the poor, which suggests that at least the social
programmes followed in the period benefited an important part of their
'target population' (though, as discussed elsewhere in this report,
rural emigration was probably more instrumental in bringing about the
improvements. And, as discussed in Chapter 6, government programmes were
not, despite the rhetoric, adequately designed to help the poorest).
By political-administrative sections of the country, six show a
relatively fast improvement in living conditions. (Source: p84, PNUD
Report, 1989). These are: Bogota and Valle (principal industrial
centres); Santander (a relatively well developed industrial and
agricultural region); and Quindio, Risaralda and Caldas (the coffee-axis
departments). All exhibit dynamic economies, relatively successful in
employment generation - necessary prerequisites for the guaranteeing of
funds to meet NBI' s. This is confirmed by a comparison with the other
sections of the country - both those showing some success in reducing
numbers with NBI and those showing little or no success. The latter in

167
Colombia tend to be characterised by, at best, incipient agricultural
and industrial development and to show a tendency to be 1 zonas de
latifundios, minifundios o de colonaje'. (p85, PNUD Report, 1989).
Generally, these areas show rapid population growth, also. Vaupes,
though, is an exception; despite a diminishing population the profile of
NBI remained unchanged in the twelve year period.
Since the second world war new regimes of dynamic development have
appeared, located in zones of frontier agricultural expansion, such as
those in Atlantic and Meta, and in newly colonised zones, such as
Caqueta. In contrast, zones of traditional agriculture registered large-
scale emigration of labour. Further, since 1973 the coffee dominated
departments have not been able to reverse their relative decline,
despite the rise of the modern 1coffee-culture'. Similarly, the slower
growth of non-coffee commercial agriculture after 1974 probably
contributed to the relative deterioration of certain agricultural
regions, including those then 'dynamic'. Something similar seems to have
occurred in the poles of industrial development around Bogota. It is
clear, then, that inter-regional disparities have tended to diminish in
the post-war period. In spite of the continued tendency for economic
activity to be concentrated in Bogota, employment opportunities
generated by the post-war development process have benefited regions
that, since 1950, had remained on the margins. The resultant internal
migration, both rural-rural and rural-urban, has had the effect of
reducing regional differences in NBI. (3).
Looking at the individual indicators by administrative zones
('secciones politico-administrativos y zonas'), throws up six very
dynamic urban zones (see above for these). Weighing heaviest in the

168
overall improvement is the 'inadequate housing' indicator, which
declined, by 87.3%. Non-attendance at school registered the second
steepest decline, at -67.9%. In the rural zones, 'non-attendance at
school' and 'households with high economic dependence rates' registered
the most significant declines, at -61.1% and -52.2% respectively.
Further, the occupation density and economic dependence variables both
show larger reductions in the rural zones than in the urban zones. All
these trends can be explained by the greater concentration of the
population in urban areas, consequent - in part - upon rural
depopulation.
At the other end of the extreme, some sections of the country failed
to lower their numbers with NBI or actually increased them. Important
examples here are the departments of Choco and Guainia, in which some
of the indicators registered worsening conditions: numbers living in
houses with inadequate services, in overcrowded homes and in
inadequately built homes, all increased.
2) Changes in Rural Inequality
a) Income Distribution
For the rural areas, between 1978 and 1988, there was an increase of
49.4% in average real salaries (the most equitably distributed incomes)
and a fall of 30.3% in average profits (which form part of non-labour

169
incomes and are the most inequitably distributed incomes). The latter
seems to. have been a result both of the agricultural recession in the
first half of the 1980's and the disincentive, in some rural areas at
this time, to follow productive activities on their own plots due to the
attractions offered by the increments in average salaries. Taken
overall, total rural incomes grew by 19.5% nationally, but at different
speeds in different regions: in the Atlantic and Central regions growth
was negative at close to -1% ; in the Eastern and Pacific regions total
income increased by 28.2% and 72.3% respectively.
Generally, individual incomes in the rural areas are at a higher
level, with less concentration, for the 'salaried' than for 'own
account' workers. Incomes are, as a rule, higher in the urban areas than
in the rural areas, and rural occupations tend to be concentrated in the
lower quintiles of the national income distribution, mainly as a result
of the lower average incomes of the various occupational positions.
As a result of these trends, the 'survival strategies' of rural
workers have centred around the need to link themselves to more
developed labour markets in the small-to-medium urban centres where
average salaries are higher. This way they can diversify their
activities inside and outside the agricultural sector.
Reflecting the development of these 'rural towns' is the increasing
weight of salaries in rural labour incomes. From 1978-88 they increased
from 53.9% to 69%, a trend similar to that in other Latin American
countries. Of course, the importance regionally of this statistic
depends on the extent of the development of the local labour market in
commercial agriculture as well as of non-agricultural activities.
The greater importance of salaries in the rural income profile, apart

from the consequences for overcoming some of the critical poverty, has
meant a decrease in income concentration in the countryside. Indeed, it
is probably the principal factor explaining the 1978-88 improvement -
reflected in a lower Gini Coefficient for 1988 (0.464) than for 1978
(0.486). (Source: the 1978 and 1988 National Surveys of Rural
Households) . This is due to the fact that salaries show less dispersion
than other forms of income (within labour-incomes, salaries are indeed
the most equitably distributed, with Gini's of 0.387 and 0.397 for 1978
and 1988, respectively) and so an increase in their importance reduces
the breach in rural incomes. Likewise, the positive relation between the
greater participation of salaries and the diminution of critical poverty
allows a questioning of the traditional view that relates rural poverty
exclusively to a skewed distribution of land and to low educational
levels. Indeed, the latter is not, from the 1978 and 1988 survey
results, an explanation of any weight for differences in rural incomes.
Despite the above, one should not underestimate the significance of
'non-wage/unearned incomes' ('ganancias1) (4) in the improvement of
peasant incomes and in overcoming rural poverty. They show a relatively
high participation among the non-poor, which perhaps implies a need to
see them as complementary to salaries in any rural anti-poverty
programme. The figures for profits, though, may be understated, not only
due to underreporting but also to the nature of the survey question (in
the 1988 National Survey of Rural Households) which inquires into the
payments received for work done by the family as a unit and not into net
profits earned from unearned incomes specifically.

171
b) Poverty
A detailed breakdown of rural poverty shows that - according to
incomes - critical poverty diminished among both individuals and
households. Among individuals, it first rose from 1970 through 1978 from
54% (Altimir's estimate, noted in Chapter 2) to 57.6%, before declining
vertiginously to 37% in 1988; among households, it also registered
something of a dizzy decline, going from 52.1% (1978) to 32.4% (1988).
Total numbers in poverty also decreased for both categories: from 84%
(1978) to 68% (1988) for individuals and from 80.1% to 62.3% for
households. Despite these trends, non-critical poverty increased
slightly for both individuals and households, by 4.1% and 2.6%
respectively.
By regions, the picture is similar. Total poverty decreased in all
regions, driven by the general reduction in critical poverty. This was
especially apparent in the Pacific and Central regions. Non-critical
poverty, though, increased in all regions, except for households in the
Atlantic and Central areas, where it decreased slightly.
It seems that demographic effects had something to do with the
changes. Average household size in rural areas diminished from 5.83 in
1978 to 5.07 in 1988. The largest reduction took place amongst
households in critical poverty, whose size diminished from an average of
6.63 to one of 5.78. It is noteworthy that the same households have the
highest birth-rates, but mortality rates similar to those of the non-
critically poor. The main element in the reduction of household size
among this group, then, must have been emigration. For households in

172
critical - and non-critical - poverty total household income has
diminished while per capita income has increased, due to the lowering of
the average size of households. Thus, the reduction in household size
has compensated somewhat for lower household incomes among the poor. The
recent decline in the rate of rural emigration suggests that this trend
may lose some of its force, assuming no significant declines in rural
birth-rates.
In summary, though the magnitude of rural poverty diminished in the
period 1978-88, it remains a problem - to the extent that close to two-
thirds of the rural population suffer from it. It is at greater levels
in those areas where employment generation is least dynamic. This means
predominantly those areas dominated by peasant smallholdings and
extensive cattle raising. In contrast, those areas in which peasant
production coexists with commercial agriculture (high in labour demand)
exhibit lower proportions of their populations in poverty. It seems,
then, that proximity to the relatively diversified employment markets in
the 'urban' centres of rural areas is inextricably linked to lower
indices of poverty.

173
3) Changes in Urban Inequality
a) Income Distribution
The urban distribution of income through the 1970's and 1980's shows
a slight improvement. Movements in the Gini and Theil concentration
indicators show how the economic crisis in the first half of the decade
had a regressive effect. Between 1976 and 1983 the Gini coefficient went
from 0.496 to 0.459, before rising to 0.474 in 1985. (Source: United
Nations Development Programme - PNUD - Report, 1989, p26). The poorest
50% of families received an income transfer of 2% between 1976 and 1980,
before slowly losing some of this up to 1985. Declining family size,
coupled with the tendency for families to pool resources, no doubt had
much to do with such a gain. In the countryside, in 1983, there was
greater concentration than in the urban zones. The respective Gini's
were 0.49 and 0.46. The poorest 50% of the rural population received
16.4% of incomes, while the richest 20% received 51.3%. Rural poverty is
concentrated in those households whose principal activity is farming.
Over half (52.9%) of rural households own no land, a third (33.5%) own
some land, while 3.7% rent land.
In urban areas, comparing two DANE surveys from 1970 and from 1984,
the Gini coefficient descended from 0.49 to 0.47. Though this would
confirm the slight improvement in the distribution, the decrease is
small enough to be able to doubt whether it is significant or not.
According to the surveys, the poorest 10% of households received 1.5% of

\
174
of incomes in 1970 and 1.8% in 1984. The figures for the poorest 50% are
17.7% (1970) and 18.8% (1984). The intermediate deciles-- 6 through 9 -
experienced even smaller changes. All these trends were confirmed in a
study by Reyes (1986) which traced the urban distribution of income from
1976 through to 1985.
The income distribution figures through to 1989 are also available,
as a result of data collected from the DANE Household Surveys (stages
53, 57, 61 and 65). As noted above, they show that the second half of
the 1980's witnessed a halting of the improvements to the distribution
earlier in the decade.
b) Poverty
The department of Bogota D.E., according to 1985 Census figures, has the
lowest proportion of poor in the country - at 23.5%. At the same time,
it has the second highest absolute number of individuals in poverty
(measured by NBI), at 928.414. Of these, 245.315 individuals are
destitute, which is 6.2% of the total population of Bogota. By
households, the proportions are: 18.5% in poverty and 4.5% in a state of
destitution. These percentages are lower than those for individuals,
owing to the fact that poor and destitute households tend to be larger
than non-poor/destitute households. Compared to Mohan's (1986) estimates
of poverty in the capital during the 1970's, discussed in Chapter 2, it
appears that numbers in poverty may have increased. He put the
percentage of poor in Bogota - and Cali - at between 10%-16% for 1978,
down from the 25%+ figures for 1973. These estimates compare closely

175
with those of Mohan, Wagner and Garcia (1981), also discussed in Chapter
2.In the rest of the urban areas the incidence of poverty is somewhat
higher: the latest estimate (from CEPAL, 1990, for 1986) puts it at 36%,
which compares to the 40% estimate one gets from an analysis of the
1984/5 DANE Survey of Incomes and Expenditures (see Chapter 4 for more
detail here).
Compared to earlier estimates of those below the urban poverty line,
noted in Chapter 2, it appears that the overall proportion has not
changed much. Altimir (1982) found 38% of urban households to be below
the poverty line in 1970. Of these, 14% were destitute, unable to cover
the cost of minimum food needs. Again, this proportion is very similar
to that found in the 1984/5 DANE Survey of Incomes and Expenditures -
13.6%.
4) Changes to the Functional Distribution of Income
A discussion of the functional distribution of income (as opposed to
the size distribution of income, discussed up to now) is also important,
in that it tells us how the total product of the economy is divided up -
between profits, salaries, state appropriation of resources and national
and foreign capital. The total income available for redistribution in
Colombia grew, in the period 1970-86, by an annual average of 6.2% -
making it one of the fastest growing economies in the world at this

176
time. The income received by foreign entities ('agentes extranjeros')
grew by more than double this figure, at 13.6%. In contrast, the income
received by national entities ('agentes nacionales') grew by an average
of 6%. In other words, the total income for redistribution grew, in the
seventeen year period, by a factor of 2.1. That appropriated by foreign
entities grew by a factor of 3.32 and that by national entities by a
factor of 2.02.
By far the most significant element in the incomes received by
foreign entities is the payment of interest on the (public sector)
external debt. This grew by a factor of 7.3 in the period. Incomes of
salaried non-residents are also important here, growing by a factor of
4.3. Growing less dramatically were interest payments on private sector
foreign debt (2.9) and profits and dividends from multinational
companies (1.4).
Among the national entities, labour incomes grew by a factor of 1.96,
capital incomes by 1.94 (compared to 2.92 for returns generated to
national capital placed outside the country, which is an important
source of income for some of the bigger state owned companies, like
Ecopetrol, which places a proportion of its profits abroad) and incomes
accruing to the state by 2.17. Net transfers from abroad grew by a
factor of almost 10 (9.85), explained by increases in labour transfers,
chiefly from the U.S., and by an upturn in foreign donations as a result
of a spate of tragedies, paticularly in 1986.
An account of winners and losers, then, between national and foreign
entities, gives the following balance for the period. National entities
slipped by two percentage points, from taking 97% of all income in 1970
to taking 95% in 1986. The loss was appropriated by foreign entities,

177
who increased their income share from 3% to 4.9%. Increases on interest
payments, on the external debt, which by 1986 represented 3.6% of
national income - from 1.4% in 1970 - largely explain why. As to which
groups have borne the brunt of the loss in participation of national
income, labour and capital appear to have faired worse. The first
slipped from 38.3% in 1970 to 36.5% in 1986 and the second from 45.4% to
42.9%. In contrast, the state increased its participation a little from
12.9% to 13.6%.
The subperiod 1982-86 shows the most striking changes. It corresponds
to an upswing in the economy after the economic crisis entered into in
1978 began to bottom out. Foreign entities, national capital and the
state were the principal beneficiaries, while workers suffered losses
(Table 26).
Table 26
Winners and Losers, 1982 - 1986
Winners (%) Losers (%)
State +1.9 Labour -5.2
NationalCapital +1.7
ForeignCapital +1.6
Total +6.2 -5.2
Source: Boletin de Estadistica, no. 442, January 1990; collated by the author from data on pages 174 and 202.
178
The incomes of those selling their labour in this subperiod fell by
5.2 percentage points, which is a loss of 4,315 million (1975) Colombian
pesos - 863 million pesos lost annually from the national salary
account. Higher rates of profit taking and of interest, increased
payments on the external debt, and higher taxes (especially indirect;
value-added tax rates were raised in 1983 and made less progressive)
explain why workers were the only losers.
In contrast, the state appears as the main winner in the subperiod,
increasing its participation by almost two percentage points. The
destination of this newly found income is of interest, considering its
redistributive potential. The most notable increases in expenditure were
in the areas of: operational expenses for the public sector; cultural
and recreational expenses; education; health; and social security. All
benefited from increases in expenditure by factors of between 2.4 and
3.3. Benefiting by less than a factor of 2 were the areas of defence,
economic services and public debt. Notably, expenditures on rural and
urban housing and infrastrucure fell - in 1985 they represented 84% of
their 1970 level.
Expenditures on education, social security, and health continue to
have a positive effect on income redistribution in Colombia. This is
especially true of the period 1980-1984, when expenditures in these
areas rose, on average, by 7.1%. For the period 1984-1988, in stark
contrast, they declined by an average of 8.3%. (Source: Coyuntura
Social, 'Debates', no.2, July 1990 p30). Expenditures on defence, public
administration, justice, the police and the armed forces, on the other

hand, do not obviously benefit one group or another. It is often alleged
that these are, in market economies, the props to the domination of
capital over labour, and that they tend to be paid for as much by the
working classes as by the capitalist classes. (5). This view takes no
account of the complexities involved in compiling a complete 'who
benefits and who loses1 breakdown by socio-economic group for these
areas of expenditure. Defence spending, for example, could benefit
national or foreign capital accumulation through contracts to produce
weapons and equipment as much as the ability of the rural peasantry to
carry on its subsistence production in relative peace through
improvements in the hardware and organisation of the local military vis-
a-vis guerrilla groups. Expenditure on the judiciary is equally open to
varying interpretations as to 'who benefits'. This has long been
understood: in the late nineteenth century Anatole France noted that
"the law in its majestic equality forbids the rich as well as the poor
to sleep under bridges, to beg in the street, and to steal bread." (6).
The final balance of winners and losers, then, shows that owners of
national production entities had between 4 to 8 percentage points shaved
off their share of the primary income distribution, The labour force,
though, was not the beneficiary; between 1970 and 1986 its annual
percentage losses were in the range of 0.7 - 1.7 percentage points. The
state had much to do with this. In the period, national social
expenditures came to less than the total amount transferred to the state
by employees in the form of taxation and social security payments. In
this way some of the costs of the economic crisis up to 1982 and of
economic recovery thereafter were borne by the labour force. 'Agentes
extranjeros', like the state, came out a winner during the period:

180
interest payments on the external debt, the profits of multinationals,
and the salaries of foreign workers all rose in real terms.
5) Summary
In 1986 Colombia had - slightly - less of its population, measured by
household income, in poverty than in 1970. The proportion, though,
still hovered around the one-third mark - that is, for overall poverty
and for urban poverty; rural poverty has been put at between 42% and
62%. The 'poverty gap' hardly changed either, remaining low in Latin
American terms at below 9%. This suggests that poverty in Colombia is
due to a skewed distribution of income rather than to a lack of national
resources. This became a salient point once again in the second half of
the 1980's, when, according to the Line of Poverty measure, increasing
numbers fell into poverty at the same time as GDP, or output, continued
to grow.
The NBI poverty measure, using data from 1973 and 1985, shows, in
some contrast, significant reductions in poverty - from 70% of
households to 46%. The proportion of destitute in the population also
declined, almost halving itself from 44.9% to 22.8%. Figures for rural
areas are higher, and much more worrying, than they are for urban areas.
This point is dramatically highlighted by the different proportions of
destitute households, in 1985, in each area: 44% (in rural areas) and
18% (in urban areas).

181
The income distribution profile changed very little between the years
1971-1989. From the decrease in concentration of the 1970's, as measured
by the Gini coefficient, the (urban) profile worsened up to 1985,
improved again during the years 1986/7, before again worsening through
to the end of the decade. If there was a slight increase in
concentration between 1980-1989, it was not at the expense of the
poorest 50%. Rather, the intermediate deciles - 6, 7 and 8 - lost out to
the top 20%. The rural distribution also changed little, according to
the available figures covering the years between 1970 and 1988. Its
Gini, in 1988, was 0.48, compared to the urban Gini of 0.46 for the same
year.
An analysis of the functional distribution of income shows that
labour and capital have borne the brunt of the loss in participation of
national income. The state, by contrast, has increased its
participation. In the sub-period of 1982-1986, corresponding to the
economic upswing, workers suffered the only losses, with labour incomes
declining by 5.2 percentage points. The state appears as the main
winner. Much, but not all, of this 'new' income went into areas of
public expenditure which might be expected to have a redistributive
effect - education; health; social security. Despite this, the fact that
national social expenditures in this period amounted to less than labour
transfers in the form of social security payments and taxation, suggests
that the labour force was still the main loser overall.

182
Notes
1) By Libardo Sarmiento Anzola in an article entitled "Ten Years Without
Changes", in 1Economia Colombians1, no.230, June/July 1990, pp93-109.
2) Juan Luis Londono de la Cuesta, 'Income Distribution During the
Structural Transformation: Colombia 1938-1988', Research Report, Harvard
University, September 1990; and, by the same author: 'Distibucion
Nacional del Ingreso en 1988: Una Mirada en Perspectiva', in Coyuntura
Social, no.l, December 1989.
3) This historical account is taken from Ocampo, Jose A. Et al, 'La
Consolidacion del Capitalismo Moderno (1945-1986)', in 'Historia
Economica de Colombia', Siglo XXI Editores, 1987.
4) 'Non-Wage Earnings' are formally defined by the DANE as: "Incomes
from independent work, professional services, sale of domestic products,
etc." They are calculated as an annual figure and then estimated
monthly.
5) See Boletin de Estadistica, no.442, January 1990, for a recent such
statement, pl76.
6) The quotation is cited in Lenski (1966), p52. For those interested,
there is a wealth of literature on the 'partiality of laws', which
includes: Edwin Sutherland, 'White-Collar Crime' (New York: Holt, 1949);
and Philip Stern, 'The Great Treasury Raid' (New York: Random House,
1964).

Chapter 6 Determinants
Introduction
Poverty, according to the structural NBI indicator, diminished
through the 1980's, to what might be seen as 'uncritical' levels. In
contrast, numbers in poverty rose when measured by the LP indicator, to
include approximately one-third of households in 1990. Income
distribution, measured by the Gini coefficient, changed very little over
the period as a whole. It first improved, between 1978 and 1983, before
worsening again in 1985. The Gini moved downwards thereafter," but at the
end of the decade was back at its mid-1980's level.
It would appear, then, that the 'ideal conditions', according to
Kuznets, which existed in Colombia at the end of the 1970's (falling
unemployment; rural wages increasing faster than urban wages; an
extended period of fast GNP growth; a Kuznetsian income distribution
profile that had worsened, then improved, since the 1930's) did not
produce the final tail of Kuznets's inverted U-curve, with income
distribution continuing to improve. The consequences of this for the
Kuznets thesis as well as for the - essentially similar - conclusions of
other theorists and researchers, discussed in Chapter 1, are unclear.
Perhaps Kuznets and others may not - yet - be unduly perturbed by the
empirical conclusions which emerge from Chapters 3, 4 and 5 of this

184
report, as the twelve year time period to which they refer is a
relatively short one and, as such, only future studies-will be able to
determine whether it is merely a blip on the long swing of the secular
income curve or part of a longer term trend. Further, it may be that the
finding of some researchers, as noted in Chapter 1, of no inevitable
"home run" once a less skewed income distribution is achieved, is
relevant for Colombia during the period 1978-1990 - which would uphold
the "it's a blip" interpretation.
Alternatively, it could be that the forces at work in the developing
countries of the mid-to-late twentieth century, such as Colombia, are
very different from those which were at work in the now developed
countries studied by Kuznets and others, which would limit the
applicability of their hypotheses concerning what happens to inequality
during economic growth. For example, as Kuznets himself noted, when the
size distribution of income profiles of the now developed countries were
similar to those of some of the still-developing countries, per capita
incomes were "much lower" (Kuznets, p68, 1963) in the latter. This, he
speculated, could lead to greater numbers in poverty in the developing
countries than in the developed - due to the presence of a much lower
national income base from which to distribute.
Whatever the case, a reliance upon cross-sectional studies, such as
those of Kuznets, Lenski, Soltow, Paukert, Adelman and Morris, and
Ahluwalia, discussed in Chapter 1, can never tell the whole story. The
problems of, amongst other things, 'timelessness1 and incomparable data
sources, inherent in such studies, mean that understanding the causal
mechanisms behind changes to inequality profiles - as opposed to simply
finding associated relationships between aspects of inequality and GNP184
185
per capita levels - becomes very dfficult. In contrast, an understanding
of what happened inside a single country - in this case -in Colombia from
the late 1970's through to 1990 - is more likely to detect causal
mechanisms, while at the same time to shed light upon some of the
general questions in the debate.
What happened, then, during the twelve year period of 1978-1990 to
prevent sustained improvements to the Colombian income distribution
profile? It seems relevant to ask this question because Kuznets1s ripe
conditions were, at the very least, insufficient. Further, by taking a
case study approach we can do what Kuznets, with his cross-section data,
could not do: tease out and speculate upon particular determinants -
economic, political, educational - in one country. Conversely, of
course, a longitudinal study such as this cannot, by definition,
formulate a general hypothesis like that of the 'Kuznets Curve', nor can
it 'prove' anything. Yet it does act as an essential complement to
cross-sectional studies by looking at 'local' factors and influences
ignored by the latter; and always with the intent to "clarify the larger
context" (Deyo, 1989, p2) - in this case the relationship between
inequality and economic growth.
The first task when analysing the many and varied causes of movements
in inequality is one of disentanglement; the second, one of establishing
which of the determinants has been most important. With these two points
in mind, the following five determinants will be discussed in this
Chapter, with a view to offering some pointers - an empirical
determination of causes is not tendered here, though it may be the next
step - as to their influences upon inequality in the period: i)
economic determinants; ii) government-led determinants; iii) education-185

186
related determinants; iv) drug-related determinants; v) 'culture of
violence', related determinants. Of course, these frequently overlap and,
as such, cannot be considered cast-iron categories. As far as possible
the overlaps will be noted here - the view being that reality cannot be
distilled into, nor be expected to shadow, the convenient subdivisions
of researchers.
Determinants i-iii, that is those related to the economy, the
government and education, have been chosen due to the - correct -
universal assumption that they are instrumental in influencing movements
in a society's inequality profile; together, they probably explain a
good deal of trends in poverty and income distribution. This is not to
profer a 'theory' of inequality or of income distribution - something
which is still absent from the literature. Rather, it is to suggest that
economic trends, public policies and the educational profile of the
population "are something more than residual [factors] in explaining the
structure and continuity of patterns of income concentration."
(Graciarena, 1976, p206) . In other words, they are instrumental in
guiding the 'development style' of any society, and must therefore be
taken into account.
Determinants iv-v, those related to the drug trade and to what can be
termed the 'culture of violence', have been chosen because of their
importance - or at least their high-profile - within Colombian society.
The extent and nature of the influence of each upon inequality has
received little or no attention up to now. Consequently, data is sparse
and so much of the discussion is still at the level of informed
speculation. It is hoped, though, that the thoughts offered here will
serve as pointers, or "a collection of hunches" (Kuznets, 1955, p26), to186

187
future researchers.
Determinants, then, include specifically economic as well as
specifically sociological factors. As this chapter illustrates, economic
factors alone do not explain inequality; "sociological" factors - those
associated with governmentally-driven determinants, education, drugs and
violence - have also to be taken into account.
i) Economic Determinants
1978 saw the largest increase in Gross Domestic Product in Colombia, at
8.5%, since the mid-1960's. It came on the back of the 'coffee-bonanza',
which began in 197 6. Since then, though, the Colombian economy has
witnessed an equally pronounced fall in GDP growth, descending to 0.9%
in 1982 and 1.6% in 1983, largely as a result of declining coffee
exports (the earlier 'coffee-bonanza' itself had the effect of bringing
down world prices in the early 1980's) and declining 'minor' exports.
The economy then picked up in the years 198 6/7, with average growth
rates at 4.5%, before abating to growth rates of approximately 3% at the
end of the decade. At no point in the period, though, was the economy
failing to grow - which could not be said of other countries in the
region: Bolivia, Guatemala, Nicaragua, Uruguay and Argentina all had
negative average annual growth rates in the 1980's. (Source: World
Development Report, 1990, pl80, table 2).
Decelerating economic growth through the period can be explained by187

188
the still skewed distribution of income in the country. As we saw in the
previous- chapter, the capital share of incomes rose in the 1980's
relative to the workers' share, helped by high monopoly profits in many
sectors of the economy. Also, the overall distribution of income, as
measured by the Gini coefficient, did not improve, and unemployment and
numbers in income-related poverty both increased. These trends made it
inevitable that the internal market for manufacturing and other goods
should shrink, thus making sustained - expanding and diversifying -
economic growth all but impossible; which, in turn, meant that neither
the resources nor the jobs were being created to make an impact upon
poverty. This 'catch 22' was touched upon in Chapter 1 (see, e.g.,
Wells, 1983) as part of a discussion on the need for a developing
country to improve its income distribution profile. More recently,
development economists have coined the phrase 'equity-led growth' to sum
up this particular strategy of trying to ensure that the economy does
not run into the sand due to a contracting internal market.
Inflation in Colombia has always been kept under relative control.
Through the period, calculated for the expenditures of blue-collar
families, it at no point reached more than 29.8% (its 1979 figure)
annually, a figure close to the monthly averages of most other Latin
American countries. In the decade as a whole, through to 1989, blue-
collar inflation (DANE figures) was at 718%. The rate differed, though,
across the various sub-groups of articles. Foodstuffs showed the highest
price rises, at 810% for the decade. This undoubtedly means, assuming
that the Colombian administration, considering its external debt
commitments (see below), is not in a position to subsidize foodstuffs,
that some reorganisation in the countryside is necessary, in order to188

189
ensure a greater and cheaper supply to the cities. (1). Having said
this, in- 1989 foodstuffs showed price increases below-the average for
other articles. Yet the point remains valid, especially when price rises
of other groups of articles are considered, specifically raw materials
and intermediate products, which showed price increases well below those
for the blue-collar family basket, at 577% for the decade. Inflation,
then - especially food inflation - had something to do with pushing
larger numbers below the poverty line, and at the same time with
lowering production costs for the owners of capital.
Something which could nullify any inflationary consequences upon the
poor is the minimum wage. It has been used by the various
administrations throughout the 1980's as a tool with which to fix the
legal minimum salary and, secondarily, with which to give a signal to
higher paid workers as to what is an 'acceptable' percentage increase in
their salaries in a given year. At first sight it looks as though its
effect was to compound the problem of food infation. The legal minimum
salary went from 4,500 Colombian Pesos in December 1979 to 32,560 in
December 1989 - an increase of 624% but a loss of purchasing power of
11.6%. However, the constant/real value of the minimum wage at the
beginning of 1990 was 8% above its 1979 level, which suggests that it
maintained, roughly, its purchasing power through the decade. In
contrast, as we saw in Chapter 4, the real incomes of state and private
sector white-collar workers and of independent professional workers
deteriorated over the decade. Coupled with the increases in profits
taken by large companies and increases in capital incomes, the upshot is
that the middle-income earners lost out to the low and high income-
earners.189

190
In terms of its influence on poverty, the minimum wage was not such a
success.-Considering the ratio of workers to non-workers in both poor
and destitute families, or the 'demographic dependency rate', the
minimum wage has not, throughout the 1980's, been at a sufficient level
to cover either the minimum food basket (for the destitute) or the
basket of basic necessities (for the poor). Specifically - taking 1988 -
the average number of household members among the destitute is 7.1 and
6.0 among the poor (1985 Census figures). Among both groups the average
number of workers per household is two (and more likely than in non-poor
househoulds to be less than two) - which, with the minimum salary at
25,637 Colombian Pesos in 1988, is not sufficient to meet either group's
minimum needs.
Considering, then, that approximately one-third, on average, of the
working population, between 1976 and 1988, had incomes at or below the
minimum salary (DANE: 'Colombia Estadistica', 1988, p230) , this has been
an important factor in pushing greater numbers into poverty: towards the
end of the 1980's (1988) the percentage of workers receiving the minimum
wage or less increased markedly - to over 35%. Therefore, despite having
maintained its purchasing power through the decade, the minimum wage
acted as a negative influence upon poverty, in this way failing in its
ostensible purpose of placing a floor under the wages of urban unskilled
manual labour in the enterprise sector, at a level above the market-
clearing wage. Further, in view of its relevance to actual wages, noted
in Chapter 4, and its - possibly more important - role in dragging
unskilled and blue-collar wages along with it, acting as a reference
point, the legal minimum wage probably consigned, indirectly, even
greater numbers to income-related poverty in the period. In a recent190

191
conference of the Colombian Sociological Association (29/11/90, Cali,
Colombia)- it was suggested by various contributors that absence of
political will on the part of successive administrations - for example,
to finance an energetic campaign of enforcement - was the root cause of
the minimum wage short-fall. Perhaps. But this ignores the financial
strictures placed on the administrations of the late 1970's and 1980's
from having to meet other costs, notably those arising out of foreign
debt (see below) and 'national order' commitments. The latter, made up
of expenditures on the police and military, took a full (and
astonishing) 44.9% of government expenditure in 1986, declining slightly
to 40.3% in 1989. (source: Financial Report of the 'Contraloria General
de la Republica', August 1990, p28).
Indeed, Colombian government expenditure on 'national order' has been
high throughout the 1980's: only Israel, Pakistan, Oman, Syria, Yemen
and Yugoslavia devoted, as at 1988, comparable proportions of total
public expenditure to defense. (Source: World development Report, 1990,
Table 11). High defense expenditures tend both to fuel inflation, which
acts as a 'regressive indirect 'tax' on lower-income groups, thereby
increasing income concentration, and to reduce the proportion of public
expenditure available for widening the provision of essential public
services. Yet, the Colombian administrations of the 1980's probably had
little alternative but to maintain a high defense budget: the perceived
'threats' from the various guerrilla movements and from the activities
of the drug trade meant that a programme of 'arming for internal
defense' was inevitable.
Numbers of those not, according to official DANE figures, earning an
income decreased in the second half of the decade. After moving up to191

192
14% in 1985, from 8.1% in 1979, the unemployment rate descended steadily
to 8.9% in 1989, rising slightly to 10% in 1990. At first sight it seems
paradoxical that the unemployment rate should decline in the midst of
the falling economic growth during the second half of the 1980's. What
actually happened, though, was that open unemployment did diminish but
disguised unemployment, or underemployment, increased - especially among
those working only part of a day or working independently in the
'informal' or 'marginal' sector. (2). This undoubtedly pushed more
people into (income related) poverty. On the other hand, when the
increasing rate of participation in the employment market, which was far
over and above the population increases in the period 197 9-1990, is
taken into account, the official (open) unemployment statistics turn
into something of a 'success story', or at least reflect the existence
of employment generation. This is true to a point: the employment
opportunities through the 1980's came in low job-creating sectors,
predominantly in large enterprises involved in import-substituting, or
exporting, activities. Yet these jobs did prevent even further increases
in income-related poverty.
The effects of the external debt on the inequality profile also need
to be drawn out. According to the Banco de la Republica, the external
public debt, as at November 1979, stood at U.S.$3,450 million. It
increased by a multiple of 3.6 in the ten years to 1989. In the same
period external private debt went from U.S. $1,850 million to
approximately U.S.$3,200 million (though this does not include short
term advances). In total, the Colombian external debt grew from U.S.
$5,300 million in December 1979 to U.S.$15,510 million in 1989. That is,
it increased by 200%; through the same period, the Gross Domestic192

193
Product grew by just 40%. Such an imbalance has been a major factor in
making the relative economic recovery of the mid-1980's unsustainable,
especially regarding the availability of funds for infrastructural
projects. This is not to ignore the political element in the absence of
such funds: throughout the ten year period, 'neo-liberal' economic
leanings of the various administrations meant that funds were withdrawn
from public services, forcing local and national government to finance
their operations through debt. This, in turn, meant that higher charges
were levied on users of public utilities - for the interest bills of the
foreign banks had to be met. The importance of this chain of events is
understood when one considers that 60% of external public debt is
carried by that part of the state sector responsible for providing
public services.
Spiralling charges for public services also have a lot to do with
government policy on devaluation, which goes back, as noted in Chapter
2, to its 'crawling peg' policy of 1967. Without taking into account the
Dollar's devaluation itself against other quoted currencies, the
devaluation of the Colombian Peso against the Dollar triggers a large
increase in the liabilities of public companies and other public
entities. Of course, this is eventually borne by the users of the public
entities. It has been estimated (Silva, 1990) that the total of the
increasing prices charged as a result of the devaluation of the last ten
years is equivalent to close to 10% of the (1990) GDP. But the
devaluation not only affects the inflation rate: it also has a negative
effect on economic activity - through its tendency to reduce internal
saving and consequently to frustrate productive investment and the
creation of employment. In 1989 alone devaluation, which ran at 98193

194
Colombian Pesos, represented an increase on the foreign debt of 1.5
billion Pesos. This would have paid the legal annual minimum salary for
3.8 million workers. (Source: Silva, 1990, pl4). To protect - especially
poor and low-income - users of public services from the price rising
effects of devaluation it may be necessary in the future for the
government to adopt a differential exchange rate for public utility
debt. That is, to devalue the latter at a slower pace than debt incurred
for other purposes, in order to reduce the rate of price increases for
essential public services. In this way lower income groups will not be
faced with exponential tariffs for public services.
In fact, it is worth recounting the history of the exchange rate
generally through the late 1970's and 1980's, considering its
significance for employment creation and, in turn, its import upon
pulling individuals out of poverty and/or changing the income
distribution profile. The latter, for example, could be altered if
enough individuals were to move into, say, the protected manufacturing
sector, taking up salaried jobs which tied them into the national social
security network. In this case, for the actual level of income
concentration to decline the new employees would have to come from
either jobs where they previously earned less or from a position of
unemployment. Whereas, if the new employees simply moved within the same
sector to a similar type of job, nothing would have changed.
At the end of the 1970's the Colombian Peso was openly overvalued.
This had much to do with the perceived need to check the inflationary
pressures coming from the 'coffee bonanza' of 1976-1978. The price,
though, was the loss of international export competitiveness of the
national productive sector, with the attendant absence of employment194

195
creation. As a result, from 1980 the policy was altered: the rythm of
devaluation now compensated for the differential between domestic
inflation and that in the United States, the country's principal trading
partner. The policy ran into trouble in 1982 when the Dollar itself
became overvalued against other quoted currencies, which meant that
compensating for inflation differences in the two countries was no
longer sufficient. (3) . Thus, in 1982 a more active devaluation was
begun, despite the attached risk of capital flight. This time it was
perceived a success, with the real exchange-rate rising against both the
Dollar and the basket of the country's 23 principal trading partners.
Inflation, furthermore, was held relatively in check. Not until 1989 did
the policy again change - to an even faster devaluation as part of the
government's liberal, barrier-reducing strategy of opening up the
economy to international investment. It was intended as a spur to
employment creation and as a way of exposing national industry to
foreign competition, with a view to bringing down profit margins and
improving productivity. The corollary, from the present government's
point of view, is an improvement in income distribution and a
significant reduction in poverty - both coming from the extra dynamism
injected in to the economy by the policy. Support for the government, it
is calculated, will be the denouement.
What is known of the late 1980's indicates some success: among the
products which increased their participation most in the export profile
were those most intensive in labour use. These were predominantly low-
technology goods, such as those in the clothes making and leather
manufacturing sectors. Also important were the various chemical
industries producing goods derived from hydrocarbons. The changing195

196
export profile reflects the increasing realisation of the two
administrations between 1982 and 1990, and now of the 1990-1994
administration of Cesar Gaviria, that, to avoid a calamitous collapse of
exports and jobs, concentration had to be centred, more than usual, on
the developed countries for trading links. The economic recessions
through the 1980's in the Andean and other Latin American countries
meant they could not be relied upon as exports markets as before. In
1980 they took over a third of Colombia's manufacturing exports, a
figure which declined to less than a fifth by 1989. (Source: Villar,
1990, p45, table 5).
For the immediate future, with the faster devaluation continuing and
with the recent relaxation of administrative and tariff barriers on
imports, indirectly cheapening exports, it seems that the trend towards
growth in labour-intensive exports is set to continue. And should the
incoming competition indeed force owners of capital to accept lower
yields, then the income distribution profile will undoubtedly become
less concentrated overall. How ironic, therefore, that an ostensibly
free-market development path should be heralded as 'equity-led', when
what is normally meant by 'equity-led growth' is the generation of
employment through infrastructural works and more direct government
intervention through the likes of progressive taxation and the setting
of minimum, 'non-hunger wages'. There remain, though, some
contradictions within the Colombian economy which have to be addressed
before our upbeat conclusion is upheld. Two in particular are
noteworthy: i) the fund set up by the government to assist and encourage
exporters with credits - El Fondo de Promociones de Exportaciones, known
as Proexpo - receives its budget, ironically, from the still high import196

197
tariffs imposed, which stood at 43%, on average, in March 1990; ii) at
the end .of the 1980's import tariffs as a proportion -of total Central
Government income reached 25%. (4) . The straitjacket in which this
places the present administration is obvious. It will be necessary,
though, to slowly lower the import tariffs, if labour intensive
exporters are to be able to import their raw materials and have any
lasting effect upon income distribution.
11) Government-Driven Determinants
The role of government action during the transition to 'modern'
growth is pivotal. Governments must set the policy environment for
private economic activity through their actions with respect to foreign
exchange, trade, domestic credit, tariffs, wage rates, public
expenditure, public ownership of enterprises and taxation. Some of these
were discussed in the previous section. In this section three further
forms of government intervention will be discussed: public expenditures
(with the specific aim of alleviating poverty) and taxation and subsidy
regimes.197

198
a) Government Social Programmes
In the second half of the 1970's and throughout the 1980's Colombian
administrations initiated various social programmes with the specific
aim of combating malnutrition and poverty.
The first of these, in 1975, was a two-pronged strategy, consisting
of a plan to combat malnutrition (PAN) and a programme of integrated
rural development (DRI) . The objectives were to increase the incomes and
improve the nutritional status of low income groups, defined
undoubtedly too sweepingly - as the "poorest 50% of the population". The
DRI plan was essentially geared to increasing production while at the
same time investing significant resources in social and public services,
with the aim of improving general well-being in the rural communities.
Strictly speaking, the focus of the DRI was not towards the poor
directly but rather the agricultural ' minifundistas' (small-scale
farmers) that were in a position to become 'empresarios agricolas'
(larger, more commercially-minded concerns). By providing agricultural
support services such as credits, inputs, fertilizers and pesticides,
along with commercial and accounting advice, it was hoped that the farm
owners, their families and their employees (240,000 beneficiaries, all
told, across eight departments) would benefit from increasing incomes
attendant upon improvements in productivity and sales.
The PAN, in some contrast, circumscribed the "poorest 30%" of the
population - rural and urban - including non-land owning agricultural
workers and small-scale farmers whose plots or farms were not large198

199
enough to benefit from the credit and investment provided by the DRI.
The strategy of the plan revolved around the perceived need to integrate
community health services, the supply of drinking water, toilet
facilities and nutritional education. It also involved encouraging the
cultivation of small plots of land in the household garden (a programme
known as 'Pancoger') and the distribution of subsidised foodstuffs. The
two principal characteristics, and innovations, of the plan were: i) the
setting up of a community health post as a centre for nutritional advice
and assistance; ii) the use of coupons to supply specially prepared and
subsidised foodstuffs to pregnant women during lactation, to children
below one year of age and to malnourished, pre-school aged children. In
1976 the government set up a national system of primary health care as a
complement to these two prongs.
The results from the PAN-DRI axis have been impressive, particularly
to do with production. Firstly, in the period 1975-1979 the DRI plan
resulted in the production of 100,000 tonnes of foodstuffs as well as
great leaps in the productivity of various cultivations. (Source: World
Bank Mission to Colombia 1989). Wheat, for example, increased its
productivity by 50% and yuca (cassava) by 300%. Secondly, thanks to the
use of food coupons, the production of five basic foodstuffs tripled:
soya flour, corn flour, vegetable protein, vegetable mixtures and
'fideos' (vermicelli).
Secondly, the emphasis on widening the coverage of public and social
services has had very conspicuous success, in terms of helping to lower
NBI levels nationally. Furthermore, the programmes provided a much
needed motor for the development of an incipient system of primary
health care, as well as the construction of, and improvements to, the199

200
primary health posts. In the first few years 420,000 individuals
benefited from the receipt of food coupons. Having said this, however,
it has been impossible to quantify exactly the effects of the two plans
on the nutritional status of the population as a whole. This is due to
the absence of any governmental measurement and evaluation programme.
Basically, the government paid little heed to what the 'success rate' of
the nutrition programme may or may not be; which made it difficult for
policymakers to decide whether or not to continue with the programme on
the strength of its technical merits. Even these considerations became
irrelevant from 1980 onwards, as the economic situation began
deteriorating and funds dried up. The PAN came to an abrupt halt in 1983
with the arrival of the Betancur government. Its position was that the
problems associated with malnutrition could best be dealt with by means
of the increased food production - the corollary to which, it was
calculated, would be lower food prices - being encouraged by various
rural development programmes, notably the DRI. Food coupons and
'Pancoger' were dispensed with.
As for the DRI, since the Betancur administration it has become
divorced from its rural development origins and now offers services to
small-scale farmers in 360 municipalities across the whole country.
While it is nonetheless still the most important 'rural development'
programme, continuing with its multi-sectoral approach of providing
credits, services and infrastructural works, its remit - much as before
- is not to directly assist the rural poor. So the beneficiaries
continue to be the (non-poor) small-scale farmers. Taken in conjunction
with the abandonment of the PAN, then, the period from 1975 to the end
of the Betancur administration was one of mixed fortunes for the poorer200

201
groups in terms of receiving government attention.
In the final year of the Betancur administration the National
Rehabilitation Plan (PNR) was set up, with the aim of promoting economic
progress in those undeveloped and remote parts of the country
characterised by a significant presence of guerrilla groups and a
concomitant absence of the state. (5) . Whatever the content of the
programme, the more pressing political aim was to bring some semblance
of 'order' to these areas, with a view to being able to herald the
defeat and irrelevance of the guerrillas and to win the support of the
local inhabitants; all in order to project an image of strong, efficient
government in the 1986 election campaign.
Poverty was seen as biting hardest in the rural areas, and so the
objective of the PNR was to improve the incomes and the well-being of
"the agricultural poor" - who, in the main, lack land - by means of road
construction, irrigation services, schools, health posts, agricultural
credits and redistribution of land. The plan - across 250 municipalities
and 13 departments - was relatively well financed: between 1987 and 1990
it took 17% of total agricultural investment. (Source: World Bank
Mission to Colombia, 1989, p79) . Though it may still be early to
evaluate the effectiveness of the plan, on the face of it some of the
desired results were obtained. The 1988 National Survey of Rural
Households, discussed at length in Chapters 3 - 5, obtained data
indicating a reduction in total poverty and critical poverty, but not
non-critical poverty, between 1978 and 1988 in rural areas - though by
both the Line of Poverty and the NBI measures close to two-thirds of the
rural population (that is, individuals; the proportion is, as always,
slightly less for households) remained poor in 1988. The uncertainty,201
202
however, is whether it was the efforts of the PNR which brought the
reductions. Demographic trends could equally have been responsible:
household size in rural areas diminished in the period, declining from
5.83 in 1978 to 5.07 in 1988; the decline among households in critical
poverty was more pronounced, moving from 6.63 to 5.78. Considering that
the critically poor also show relatively high birth-rates and average
mortality rates, then the principal factor behind the reduction in their
household size must have been emigration. In this way, and despite
average household incomes falling for the poorest groups of rural
workers, per capita incomes rose. (6).
A further, urban based, strand of the Betancur administration's
development plan was to reactivate the tottering economy of the early
1980's using the construction sector as a motor. This seemed to fit in
with the government's overall strategy of achieving growth with equity.
The particular emphasis was to be a reorientation of house-building
towards low-income groups. It had some success: in the period 1983-86
400,000 new urban houses were constructed - an amount without precedent,
and double that of the previous four years. More significantly, almost
two-thirds were low-cost houses ('viviendas populares'), of sufficiently
low cost to be within the reach of families earning less than two
minimum salaries. As well as the 400,000 new homes, the plan promoted
self-construction as a way of reducing production costs, utilizing the
labour of family members themselves. These tended to be from the poorer
sections of the poor. As a result of these programmes, the 'housing
deficits' in terms of 'overcrowding' and 'unsuitable constructions'
declined between 1973 and 1985. (Source: 1973 Census and 1985 Census).
The housing programme, though, had its limits. Principally, it failed202

203
to meet the needs of the poorest of the urban poor. This was probably
because of the way it was administered - through a mixture of public and
private credit and savings institutions. The coordinating government
entity, the Institute of Territorial Credit (ICT), put up far too strict
and unreachable requirements for the lowest income families. The houses
were sold, as a rule, to families that earned more than two minimum
salaries - essentially the lower-middle income groups of the second and
third quintiles of the income distribution. Further, 20% of families and
slightly over one-third of individuals (DANE figures, for 1988) in
Colombia earn less than the minimum salary, so would not have sufficient
monthly incomes needed to keep up with regular mortgage payments. What
is more, at this level of the income scale employment tends to be
erratic and, as such, a monthly commitment of any sort is difficult to
meet.
Apart from the selective focus of the programme, the credit and
finance policies adopted benefited neither the institutions charged with
carrying them out nor - again - those most in need of assistance. This
was perhaps the fundamental contradiction within the plan. Essentially,
the policy of exempting beneficiaries from having to put down an initial
quota exposed the lenders to the risk of non-payment, without
significantly increasing access to new houses, and the savings
corporations soon became wary of lending in this way once they realised
that payments on 50% of their loans were not kept up with. For this
reason the policy of exempting families from having to put down an
initial quota has been abandoned. And if the ICT is to continue to carry
out housing programmes for the low-income groups in the future, a
substantial injection of government funds will be necessary.203

204
It appears, in conclusion, that the strategy of the plan was ill-
founded.. In 1982 a study by the National Centre for Construction Studies
(CENAC) demonstrated that families that were able to keep up with the
monthly payments on their new house would anyway have few problems in
getting together a 'substantial' initial quota. This suggests that a
two-tier or multi-tier loan structure would have been more appropriate,
allowing the not-so-poor to subsidise the poorer recipients to the
programme via monthly payments, with interest attached.
A further government-led programme of the Betancur administration -
continuing the basic needs approach to reducing poverty but
concentrating on different aspects of it - was the National Plan for
the Survival and Development of the Child (NPSDC). The plan, initiated
jointly by the Ministry of Health and Education in August 1984, sought
to set up a vertical campaign to reduce child (children under 5)
mortality and morbidity in all regions of the country. The plan
consisted of training student volunteers (from the oldest of the
secondary school students), 'community mothers' ('las madres
comunitarias'), the Red Cross, the National Police and the Catholic
Church to work as primary health workers. They were to visit families in
the poorer neighbourhoods, offering basic instruction designed to
promote general health and to prevent common diseases. The latter were
taken as: perinatal mortality; acute respiratory infections; acute
diarrhoeal diseases; diseases preventable by immunisation; malnutrition;
psycho-affective development; and accidents. As an example of the basic
health advice given, and its far-reaching consequences, this author
spoke, in January 1991, to a Catholic Church representative in the
Aguablance district of Cali, who commented on the 'hand-washing' advice204

205
given to the poor: the results from hand-hygiene were usually quick to
appear, .especially in those neighbourhoods characterised by a lack of
drinking water and sanitary facilities. A significant reduction in the
incidence of many common, virus related infections and diseases usually
resulted.
The NPSDC has been very successful, with some estimates of its
coverage put at 1.5 million families. However, this has not been
accompanied by a correlative growth in primary health care
infrastructure. This is important, as it is the very success of the
NPSDC in diffusing basic health care knowledge which has produced a
growing demand for community health services among the poor. The
volunteer health workers, who form the backbone of the NPSDC, just do
not have the experience or access to health care facilities and
technology to be able to make any further inroads into the health status
of the poor. The root of the problem is lack of government finance and,
more significantly, lack of government will to transfer some of the much
greater amounts of money and resources dedicated to the National Health
Security System - based on affiliation dues - to the primary health
sector, which deals much more with the poorest. Figures for 1985 show
that expenditure per patient within the National Health Security System
was eight times that in the primary health sector. (Source: World bank
Mission to Colombia, 1989, p48).
The Presidency of Virgilio Barco, between 198 6 and 1990, saw the
introduction of a government plan specifically designed to reduce
poverty and deconcentrate income distribution. It was known as the 'Plan
of the Struggle Against Poverty and for the Generation of Employment1
(PLPGE). Barco gave priority on the hustings to the eradication of205

206
poverty and on being elected declared it the principal theme of his
quadrennial development plan. Without mentioning 'equity-led growth' by
name, he spoke of sustained economic growth depending, for its success,
upon a relatively prosperous working class.
Those in need of assistance - the target population - were thought to
be those in the bottom 40% of the income distribution. The plan defined
them as the 'absolutely poor', who could not satisfy their basic needs
(see Chapter 4 for how absolute poverty was defined). A seven prong
strategy was suggested to bring the poor out of their poverty situation:
basic health for all
improvements to the home
basic education for all
establishment of 'human' housing settlements
a plentiful supply of basic goods
f) integrated rural development
g) employment generation
These almost platitudinous statements of intent reflected the original
declaration of the plan: it was really no more than a general policy
declaration accompanied by an enumeration of a number of programmes and
sub-programmes, without establishing priorities between them. (7).
Further, the choice of the bottom 40% as the target population was far
too wide and vague: it took no account of the very different needs of
the 'poor' and the 'super poor' - the first likely to benefit from
employment generation and extended educational facilities, the second
not so likely, due to the prevalence of chronic sickness and acute lack206

207
of resources. In short, the plan lacked sophistication.
Still,, because it formed the main plank of the Barco .government' s 'go
for equity1 strategy, it is worth breaking down the component parts of
the plan in order to assess the success of each.
Firstly, health. Health services in Colombia are in the charge of the
national public health system, the Institute of Social Security and the
private sector. The financially precarious social security system only
treats a small group of the population - salaried workers in the 'formal
sector1; and the private sector treats the relatively well-off. This
leaves the public health system as the only sector treating low-income
groups. Even this is found wanting, as the World Bank (1989) recently
pointed out: between 25% - 30% of Colombians - including the greater
part of 'the poor' - have no access to any type of health service or
health post. This indeed forms the backdrop to the 'basic health for
all' component of the plan, the two aims of which were: i) to widen the
coverage of the social security system, from the present 16% of the
population to close to 80%; ii) to guarantee free primary health care to
the poorest and most vulnerable groups, who have not the means to take
out either private or public health insurance. Despite these clear and
broad aims, there has been an absence of concrete measures - something
which has much to do with the enormous problems of initiating
institutional and financial change in the health sector, widely
recognised to suffer from debilitating corruption and slack accounting.
In the area of nutrition and 'family well-being' the government plan
has had more success. The Colombian Institute of Family Well-Being
(ICBF) , an arm of the Ministry of Public Health, is responsible for
nutrition and family well-being in the country. Its flagship programme207

208
within the PLPGE was, and is - the programme continued after the end of
the Barco government - the Well-Being of Infants in Households ('Hogares
de Bienestar Infantil1) project. This involved setting up a network of
day nurseries, run by trained, local (paid) 'volunteers' within many of
the poorest, mainly urban, neighbourhoods throughout the country. Their
raison d'etre was not only to act as day time child custodians (though
this was an important function: it frees many poorer women from child
care responsibilities during the day. As an alternative to locking up
children in a dark house until the mother returns from work, a common
solution to the child-care problem among the poor, it is undoubtedly
preferable), but also to provide free food supplements and some primary
instruction. The nursery programme at present covers approximately
400,000 children.
Turning to education, at present in Colombia around 30% of school age
children in the rural areas and 10% in the urban areas are not attending
school. Most of these are children of the poor. Further, rates of giving
up school and of having to repeat failed semesters are far higher
amongst the poor. To remedy the situation the PLPGE foresees the
extension of free formal education, especially at the primary level.
More specifically, a new policy of automatic movement into the next age
group (to reduce the strain put on poor families from having to repeat a
semester, which often results in giving up school altogether) is being
introduced, as is the 'new school' programme in the rural areas. The
latter is a method of simultaneous instruction to various age and
ability groups, to take maximum advantage of limited resources. It is
being tried in some 8,000 rural schools.
Again, though, good intentions are not always translated into208

209
reality. State primary and secondary schools are very rarely provided
free of .charge (Source: author's interviews with school administrators
in low-income urban areas of Cali and Bogota, October 1990 - May 1991);
for the poorest, even a nominal, such as the common fee at present of
U.S.$3.00 per month per child (1.9% of the minimum monthly salary, as at
January 1991) is out of the question. And anyway, even providing free
school education is not enough: the level of the minimum salary,
weighted for average numbers of family members, must be sufficient to
meet the basic needs of a family - which include being able to send a
child to school, with all the attendant costs on materials, clothes,
transport and food that this implies. As was pointed out above, in the
discussion of economic determinants, the minimum wage has not succeeded
in covering such costs.
The component of the plan concerned with housing looks to guide urban
expansion and make efficient use of available space. Firstly, through
improving those houses not enjoying basic services like drinking water
and drainage facilities. Secondly, through the construction of new
houses for low-income groups in areas with adequate infrastructural
support. (This is an outgrowth of the PNR plan introduced earlier in the
decade by the Betancur government). Thirdly, through the renovation of
areas and/or neighbourhoods considered underutilised or lacking in
adequate infrastructure. A variety of other schemes also formed part of
the drive to improve housing and neighbourhoods: credit plans;
legalisation of property titles in the 'invasion' and 'pirate' housing
zones; the training and organising of local self-help groups to equip
them to undertake themselves much of the improvements and construction
work.209

210
Again, though, the results have not matched up to the rhetoric.
Progress, has been slow - probably due to the failure to designate a
particular Ministry to organise and plan the overall details. The
President's Office initially attributed overall responsibility to the
ICT (The Institute of Territorial Credit), already charged with the
housing plan within the PNR, which, considering its financial problems
alluded to already, did not seem a wise decision.
'Food security' and increasing agricultural production, a further
strand of the PLPGE, was concerned to make available cheap and plentiful
basic food goods to low-income groups (see n.l). It looked to do so
through influencing food supply and demand. On the supply side,
increasing agricultural production and promoting agro-industries and
small businesses were the chosen mechanisms. On the demand side, the
strategy is to reduce the prices of food and other essentials, by
constraining monopolistic and oligopolistic practices with a view to
reducing the profits of intermediaries. Attention is being turned
typically to those poor agricultural regions not covered by the earlier
PNR. At present, though, the plan has not gone beyond an enumeration of
general proposals and the government has advanced little in even
establishing an interinstitutional committee to examine the food
security question.
The employment generation prong seeks to increase the productivity of
non-qualified and semi-qualified workers in the informal urban and
traditional agricultural sectors, by means of employment creation,
training facilities and widening the coverage of the 'unemployment
insurance' programme to include the independent workers in the informal
sector. Such a programme, if successful, would undoubtedly reduce non-210

211
critical poverty - and improve the income distribution profile by
putting more resources into the hands of low-income groups. Up to now,
this has not been the case: little, in practice, has been done to
execute what are still vague and poorly focused proposals. There is
still a need, on the part of the government, to work out the employment-
related causes of poverty and low-incomes. Without such knowledge it is
difficult to act. For one thing, knowing which groups among the poor are
likely to benefit from which particular strategy is a necessary
beginning. The lack of such knowledge is reflected in the still high
proportions of both households and individuals below the line of
destitution: between 1970 and 1986 the first declined from 18% to 16.1%,
the second, between 1980 and 1986, increased from 17.4% to 18.8%.
(Source: report from the United Nations Conference on Poverty, Quito,
November 1990, p72). Employment creation strategies, as opposed to
'direct action', are not the appropriate response to the problem of
destitution.
b) Taxation and Subsidies
Taxation
Government tax policies also have an import, whether intended or not,
upon poverty and income distribution. They represent 'after the fact1
government action to affect the poverty and income distribution
profiles, that is, after the dust of production has settled. That211

212
governments resort to them at all reflects their feeling that, for
whatever.reason - political or economic - the primary or growth-related
outcome is unsatisfactory or unacceptable in some way.
In Chapter 2 it was noted that, from the 1950's to the end of the
1970's, the tax system in Colombia has served to ensure that the income
distribution profile did not worsen. In the 1980's, however, the three
Colombian administrations made various changes to the country's taxation
regime, as part of an effort to raise tax revenues. For this reason, it
is worth considering once again the overall effect of the tax structure
upon the inequality profile.
Direct taxes (known in Colombia as 'Retencion de la Fuente') were
made more progressive during the 1980's. This was achieved by taking
greater numbers out of the tax net at the lower end of the income scale
- so that in 1981 1% of incomes was the lowest rate of tax levied,
whereas in 1991 it was 0.35%. (Source: Legislacion Economica, 1981 and
1991) - and by breaking the complete range of incomes down into more,
and narrower, income bands, each attracting a different rate of tax. At
the upper end of the income scale the highest rate of tax was
maintained, at approximately 30%.
On the face of it, then, the structure of direct taxation in the
1980's would have served, on its own, to improve the income
distribution. However, in practice this seems not to have been the case.
In the first place, at the lower end of the income scale it was not
progressive at all: in 1991 all those earning up to approximately five
minimum salaries, which, according to the data from the 1984/5 Survey of
Incomes an Expenditures, is 56.3% of households (author's calculation),
paid no tax. This means that, for tax purposes, the destitute and the212

213
poor are lumped together with the lower-middle income groups - which
introduces a degree of regressivity into the tax structure. This is
undoubtedly one of the reasons why the income distribution profile in
the 1980's did not become less concentrated and why low-income groups
failed to increase their share.
Secondly, evasion of direct tax has been a continuing problem
throughout the decade, especially among those in the upper half of the
income distribution. (Source: Legislative Decree 2503, December 1987).
It has been estimated that it cost the state three hundred thousand
million Colombian pesos annually at the end of the 1980's (El Occidente,
22/11/1990; and El Tiempo, 22/11/1990) - approximately half of the total
of direct taxes owed. This has tended to blunt the aspirations of
consecutive administrations for a progressive - and efficient - tax
structure. Not only does evasion limit government resources, but it
renders direct taxation a relatively ineffective tool with which to
redistribute incomes. Something which is apparent for the 1980's, when
the richest 20% of workers maintained their large slice - over half - of
national income. Moreover, a solution appears still to be some way off,
as a Director of the Colombian Fiscal and Treasury service recently
noted: "the system of direct taxation in Colombia is now twenty years
old and controlling tax evasion is still one of the principal goals".
(Economia Colombiana, April 1988, p64; author's translation).
Direct taxation in the 1980's, then, served, much as it had done in
previous decades, to ensure that the income distribution profile did not
worsen (or improve). Further, its regressive nature among those in the
bottom half of the distribution meant that the destitute and the poor
failed to increase their relative income shares. Changes to indirect213

214
taxation, on the other hand, have served, through the 1980's, to clearly
increase_both income concentration and numbers below the poverty line.
In 1982 and 1983 the country's trade deficit on current account was
the largest in Latin America. As a result, various measures were taken
to increase government tax receipts and thereby correct the imbalance.
These included an increase in the number of goods subject to the 10%
rate of VAT (known in Colombia as the 'Impuesto al Valor Agregado').
Specifically, VAT was extended to certain popular consumer goods
currently exempt, notably to soft drinks, which are consumed widely by
the urban poor due to the unavailability of suitable drinking water.
(Source: author's pilot interviews, and observation, in Agua Blanca
district, Cali). The Economic Commission for Latin America has noted
that "this process seriously affected the progressiveness of the fiscal
system. The weight of the reform ended by falling mainly on the middle-
income groups and even came to affect the poorest groups." The loss of
income share by the intermediate deciles - 6 through 8 - during the
course of the 1980's is testimony to such a process.
On the 1st of January 1991 rates of VAT were further changed: the
basic rate of VAT was increased - with a view to recouping some of the
revenue lost through the trade liberalisation programme begun at the end
of the decade, which involved, amongst other measures, a lowering of
import tariffs - from 10% to 12%. And the purchase tax on luxury goods
('articulos suntuarios') was reduced from 35% to 12%. Together, these
two measures compounded the regressive nature of indirect taxes, hitting
low and middle-income groups hardest.
214

215
Subsidies
Most governments, in the developed as well as the developing world,
resort to giving subsidies of one form or another. The rationale for
doing so is not always, as is often assumed, a politically motivated
concern for the plight of - numerically significant - low-income groups:
frequently it is to prop up a particularly vital sector of the economy,
witness the grants given to coffee growers to improve or extend their
farms in countries where coffee represents an important source of
foreign currency earnings; and just as often it is to cushion the impact
of market forces upon a numerically significant middle-class, such as in
England where successive administrations have subsidised house purchases
through a Mortgage Interest Tax Relief scheme.
This section will look at the distributional effects of three types
of subsidy - those on petrol, mass urban transport and public utilities
- which reigned in Colombia throughout the period 1978-1990.
The Colombian administrations of the late 1970's and throughout the
1980's continued the policy of subsidising each gallon of petrol bought
at the pumps. They did so for reasons of administrative convenience and
in order to hold down politically unpopular inflation. 75% of the
internal demand for petrol is satisfied by home-produced and refined
gasoline; the remaining 25% has to be imported at the (generally 30%-40%
higher) international price. As a result, what is sold at the pumps is a
mixture of Colombian and foreign-produced petrol. Yet the higher-priced,
imported petrol is not sold at a higher price internally, to reflect its215

216
market price. This is partly because the government, through the
nationally-owned petroleum company 1Ecopetrol’, does not want to have
two different prices offered at the pumps, for it is of the opinion that
this would bring unnecessary accounting difficulties. (Source: author's
interview with the Director of the Financial Division of 'Ecopetrol1,
Octavio Borgos, in Bogota on 23/4/91).
The distributional consequences of subsidising petrol are both
negative and positive. Negative because in a developing country such as
Colombia, car owners tend to be in the intermediate and top deciles of
the distribution; to offer these income groups a subsidy towards the
maintenance of a luxury good undoubtedly increases income concentration.
Positive because subsidised petrol helps to keep down the price of some
essentials, particularly foodstuffs, through its effect upon road-
transport delivery costs. This is especially important for those in low-
income groups, who spend a much greater proportion of their income on
food (see 'Engels Law', explained in n.l, Chapter 3) than those in
middle and high-income groups.
As well as a subsidy, petrol sales also attract a tax: for the
purpose of providing funds for road building and maintenance, the
Colombian government levies a road tax ('impuesto vial') on petrol
consumption, which is at present 10% of the price of a gallon. (Source:
Legislacion Economica, Number 895, January 1990). Ecopetrol can, by law,
keep this for two weeks, after which time it must be transferred to the
Treasury. The distributional effects from this, however, are unclear. On
the one hand, the financial benefits received by Ecopetrol from the two
weeks of credit help to keep the price of petrol from rising above its
current level, and so cushions low-income groups from further increases216

217
in food prices. On the other hand, the uses to which the Treasury puts
the road- tax receipts need to be known if we are to understand the full
picture. Does it, as it contends, spend all or part of the receipts on
road construction and maintenance? If only a part of them, on what else
are they spent and what are the distributional consequences? Future
researchers might consider these questions. Indeed, a detailed cost-
benefit analysis of all the uses to which the road tax receipts are put
- by both Ecopetrol and the Treasury - would be instructive in
completing the discussion, and would enable a conclusion to be reached
as to the overall distributional effect of petrol taxes and subsidies in
Colombia.
In a drive to lower the fiscal deficit - prompted, in part, by IMF
and World Bank strictures - the 'impuesto vial1 was increased by 35%
between 1984 and 1986; concurrently, subsidies upon mass urban
transportation - buses - were virtually eliminated. From a total of
16,328 urban buses in the largest 13 cities in 1983, 15,457 (94.7%)
received a government subsidy which enabled them to charge lower fares.
In striking comparison, in 1990, out of a total bus population of
18,092, just 520 (2.9%) received such a subsidy. (Source; author's
calculations from DANE figures, May 1990) . Considering the very clear
class-based structure of transport use in Latin American cities,
withdrawing the subsidy from the only mode of transport available to
low-income groups is bound to be regressive. During the 1980's it was
indeed a contibutory factor towards the increase in the numbers below
the poverty line in Colombia.
In contrast, subsidies on public utilities do appear to have had some
equity-enhancing effects. As a means of cross-subsidisation, local217

218
governments in Colombia have established six payment-bands - drawn up
with reference to the degree of 'desirability' -of the various
neighbouhoods in an urban area - for the purpose of levying differential
charges for telephone-line rental and for each unit of gas, water and
electricity consumed. Higher-income groups fall into payment-bands V and
VI, with lower-income groups falling, accordingly, into payment-bands I,
II, III and IV. Consequently, low-income groups are in effect receiving
a subsidy from higher-income groups. It is difficult to generalise about
the size of this subsidy, as it differs according to the specific
charges levied by each local government. But the fact that the
overwhelming proportion of the urban population, almost 91% in 1990
(Source: figures on the 7 largest cities provided to the author by the
DANE) , are not suffering from NBI - which implies that they do not lack
essential services - means that it can be confidently stated that the
subsidy is reaching a significant proportion of the population. This is
not to encourage complacency, as the remaining 9% are probably among the
poorest of the urban population.
iii) Education as a Determinant of Inequality
a) Level of Educational Provision
Those countries with most invested in education tend to have both the
highest GNP per capita levels as well as the least concentrated income
distribution profiles. As a result, it has become a universal assumption218

219
that investment in education is a determining factor in national
development and that therefore government investment in -education should
be a priority. What, in that case, is the precise link between
education, GNP per capita and income distribution - are they related in
a concomitant or causal way? Further, in what way does the expansion of
an educational system, measured by widening coverage, affect inequality?
Is it wise to invest heavily in education as a form of reducing
inequality? Does the return to education, on an individual level, fall
with the increasing supply of qualified personnel? And if it does, and
therefore only serves to improve the income distribution profile by
lowering wages, can an increase in the coverage of education be
justified at all? Recent Colombian experience can shed some light on
these questions.
A study in the Colombian research journal 1Coyuntura Social1
(Psacharopoulos and Velez, 1990), looking at education in Bogota, found
that the rate of return to education, measured by calculating 1 the
economic yields from an average number of years in education1 (pl61),
expressed as a percentage, was significantly lower in Colombia than in,
for example, Brazil or Mexico: in the latter countries it was 36%
higher. This seems to reflect the relatively low level of educational
coverage in the latter countries, which would tend to mean that educated
personnel are at a premium in the labour market; once their supply
increases they become 'victims1 of the law of diminishing returns, and
their economic yields from purely education decrease accordingly. This
strongly suggests that, over time, investment in human capital shows
decreasing returns for the individual, with returns to education - and
skills - tending to rise during the initial stages of economic219

220
development, reach a maximum and then fall. (8) . In Colombia, since the
end of the 1960's, the latter has indeed occurred - in a period when the
overall educational level of the labour force has increased notably.
Specifically, the rate of return has declined from close to 17.3% (1965)
to 11% (1988) - during a period in which the percentage of the labour
force with either secondary or higher education rose from 38.9% to
64.6%. (Source: 1973 and 1985 Censuses, DANE).
In addition, average number of years of schooling of the labour
force in the late 1930's was less than two, compared to an international
average of around four. These figures had changed dramatically by 1988,
to 6 and 5.5 respectively. (Sources: Londono, 1990, pp56-58;
Psacharopoulos and Velez, 1990, pl62). In other words, educational
expansion, or an increase in the 'human-capital-intensive mode of
accumulation1, has produced a decline in the influence of education upon
incomes - much the same as the law of diminishing returns as applied to
physical capital investment. Boudon (1974) has noted this. He develops -
admittedly thinking of the advanced industrial societies, though it
seems to apply equally to the Colombian case - an ' education-
opportunity' model to explain it. He notes how individuals may feel
themselves to be acting rationally by obtaining as much education as
possible, yet, as the overall educational level of the population
increases, the benefits obtained will accrue more to the collectivity
than to the individual. He calls this the "aggregation paradox": "if a
youngster born in year y + k wants to have the same expectations as a
youngster born in the year y, he will be obliged, other things being
equal, to secure x more years of education". (Boudon, 1974, pl98). This
may be illustrated, for Colombia, by comparing the differences in the220

221
wage rates over time of workers without education to those of high-
school graduates. The latter earned, on average, 5.3 times more than the
former during the 1930's; 9.1 times more during the 1960's; and just 3.5
times more in the 1980's. (Sources: Londono, 1990, p64; Psacharopoulos
and Velez, 1990, pl62). Urrutia (1968 and 1980) found a similar pattern
for the wage differentials of the secretaries and porters in the Finance
Ministry in Bogota between the 1930's and the 1970's: they increased
from a wage differential of 6.4 in the late 1930's to one of 8.9 in the
early 1960's, before declining to 5.0 by the late 1970's. These figures
reflect the fact that the 1950's and 1960's was the period when, like in
many other countries worldwide, increased amounts of public expenditure
were given over to education in Colombia.
Returning to one of the questions posed above, do these conclusions
justify putting a break upon the expansion of education, not least for
the future income benefits of those already in the educational system?
Probably not: as the economy diversifies and competes more in world
markets - that is, as it 'catches up' - it will need more, not fewer,
educated personnel. Further, education widens the possibilities both of
the form of work one is able to obtain and of obtaining it outside the
generally lower paid, and more unstable, informal sector; in this way
education reduces the possibility of falling into poverty, as well as
serving to increase the marginal productivity of the poor and, with it,
their wage rates and income share. From a different point of view,
Tsakloglou (1988) has suggested that "it can be expected that higher
educational level increases self-esteem and hence leads to an increasing
claim for equality." (p518). The latter invariably takes the form of
political demands for equality.221
222
The income distribution and poverty profiles in Colombia, then, have
turned on investments in education to the extent that the first has
become less concentrated, since the 1960's, and the second, defined by
incomes, has been reduced - both of which are predictable consequences
of having a more educated population. During the 1980's, though, the
income distribution and poverty trends began to take on a different
form: the former changing little, the latter, defined by numbers below
the poverty line, increasing - yet educational coverage continued to
increase. This would suggest, as reflected by the declining differential
between the salaries of the educated and the non-educated, that factors
other than increasing educational coverage were behind the movements in
the inequality profile during the decade.
On the other hand, the major change in the income distribution
profile during the decade - the decline in the share of the intermediate
deciles (6 through 8), reflected by the relative decline in the real
wages of state and private sector white-collar workers and of
independent professional workers - can perhaps be partly (for other
factors were also significant, notably government efforts to hold down
the wages of public sector workers and the increase in the share of
capital incomes) explained by the wage dampening effects of increasing
educational provision.
And the increase in the population below the poverty line, though
primarily the result of relatively high blue-collar inflation, an
inadequate minimum wage and government poverty programmes which have
been stronger on rhetoric than results, may not have been as steep had
educational coverage reached the poorest members of the population. In
Chapter 4 we noted the fewer years spent in education by the very poor222

223
and the poor compared to the non-poor. This implies a strong association
between receiving at least some education and being poor. To confirm
this simple association, though, research needs to be done on the
different types of education received by different social, income and
spatial groups, looking especially into the 'quality' of the education.
Comparing the facilities and teachers in the different schools and the
environment in which each operates would be good places to start.
b) Social Mobility
Education can also act upon inequality by providing a channel for
social mobility. Sociological literature has highlighted some of the
important relationships to be studied - occupational status and
education, as much from an intragenerational perspective as
intergenerational, being the most common. (9).
As we noted in Chapter 2 (Section 4), however, the study of social
mobility in Colombia is hampered by the unavailability of data,
preventing an empirical analysis of the degree of fluidity in the social
structure. For this reason, we are forced to rely upon household surveys
that do not follow the fortunes of individuals and families through
time. As such, the researcher must piece together other forms of data
which, at best, can give indications of the level of social mobility -
the approach taken in Chapter 2.
Velez, looking at education specifically, has followed much the same
course in his research on Bogota. The figures, he suggests, give some223

224
idea of the fluidity of the capital's social structure: 95% of the
children .of fathers with no education reached the level of secondary
education and 6.2% went into higher education. (Source: Velez, 1989).
The trends continue in the same vein for children of fathers with
primary education - 80% of these reached higher levels of education,
with almost a quarter (23.9%) entering higher education. For the
children of fathers with secondary and higher education the trends are
stronger, as would be expected. It is noteworthy, though, that
approximately one-third of children whose fathers had entered higher
education did not do the same. Considering the recent expansion of
higher education in Colombia, especially during the 1970's and early
1980's, this is surprising.
Turning to the most frequently studied intergenerational mobility
indicator - the relationship between father's occupation and son's
education - the picture is similar: intergenerational mobility is
widespread, if not the norm. 53.1% of the sons of rural peasant workers
('campesinos1) reached a primary level of education, 36.2% reached a
secondary level and 8.5% went to university.
Sons of manual workers were more mobile still. 29.1% reached primary
education, 55.6% secondary education and 15.3% university level
education. Sons of non-manual workers almost all reached either
secondary (52.6%) or higher (36.9%) levels.
Intragenerational mobility also appears to be rife, with 'descending
occupational mobility1 affecting only a minority. Very broadly, 32.5% of
workers have experienced 'vertical ascendant' mobility, with a little
less than half staying where they are. Total mobility, ascendant and
descendant, at 44.8%, is comparable with that found by Lopreato and224

225
Nazelrigg (1972) for Italy (45.1%). More noteworthy is that it is
comparable with the percentages reported by Lipset and Bendix (1959) for
the 1950's in the USA (30%), Japan (27%), France (27%), Western Germany
(31%) and Switzerland (23%).
Knowing the educational and occupational status of the father, then,
allows an approximate prediction of those of the son. It has recently
been put more strongly than this: "the education of the father seems to
be the determinant characteristic of occupation and income in Bogota".
(Velez, 1990, pl56) . Such a view, though, ignores the education of the
son as a determinant; this is not to detract from the salience of the
relationship found. Whether it is a determinant or just an associative
relationship, though, is up for discussion. Velez is quite certain it is
the former, but he is looking at it in isolation: the way in which the
economy expands and the type of jobs it throws up as well as government
wage policies, amongst other things, have to be taken into account. And
what of the conclusions from the previous discussion of educational
provision? These implied downward mobility for many, attendant upon the
increase in the supply of educated personnel. More importantly,
governmentally-driven education policy was seen as the prime mover,
determining both the probability of ending up in a particular level of
the education system and of what could be achieved in the employment
market with that level of education. It is therefore facile to suggest
that a child's chances of reaching a certain educational and/or
occupational level turn simply on the father's education and/or
occupation.
225

226
iv) Drug-Related Determinants
Assessing the impact of the illegal trade in narcotics upon inequality
is no exact science. Inevitably, due to the illegality of the activities
associated with it, there is an element of stabbing in the dark.
Nonetheless, some things are known, and can be quantified. We have
little choice but to take advantage of any relevant data available - and
at the same time to hope this leads to other, equally fruitful sources.
Most observers have sought to draw out the links between drug
trafficking and the economy as a whole, endeavouring to track currency
flows in and out of the country as well as investments, and their
yields, inside the country. The sociological assumption behind this
approach is that the "drug-trade" resembles, in terms of its actions and
effects, a medium-to-large-scale company, creating employment
opportunities and multiplier effects, as well as remitting taxes. Again,
though, the stumbling block is one of available, and trustworthy, data.
Despite this, everyone in Colombia - researchers and non-researchers
alike - suspects the impact of drug money upon the economy to be
significant. Even on the assumption that this may be a myth - although
even myths do not come out of thin air - such a widespread supposition
deserves attention. For our purposes the existence of the debate is
fortuitous: we can tap into it and consider how the various drug-economy
linkages affect inequality.
First, it would be useful to have some ideas of the size of the trade
itself. International observers have commonly given dire warnings about226

227
the recessionary consequences of a withdrawal of the aggregate demand
produced by the drug trade from the economy. More recently, this has
been challenged by Colombian researchers, who have suggested less of a
role for the drug trade in the economy - citing what is seen as a
relatively small proportion of the country's GDP accounted for by drug
monies and the relatively small proportion of aggregate demand, measured
through currency flows, taken up by them. Further, the view ignores the
importance of foreign currency arrivals into the international reserves
from tourism and remittances from Colombian workers abroad, notably in
the United States and Venezuela.
In the 1970's the marihuana trade - predominantly with the U.S. - was
the source of drug traffickers' profits. In the 1980's these declined,
due, amongst other things, to increasing production in the United States
- a form of import substitution there - and to relatively successful
fumigation programmes in areas where the crop was most dense: the Sierra
Nevada de Santa Marta and the Serrania del Perija. In the second half of
the 1980's, though, once again the cultivated area began to increase,
due to the tendency for cultivators to concentrate themselves in the
South-West of the country, where the population is more dense and the
variety of agricultural activities greater - both factors making it more
difficult to destroy the cultivated areas by simply blanket spraying
them. As a percentage of the country's GDP, however, marihuana export
earnings have never been very high, peaking at 0.56% in 1981. (Source:
'Economia Colombiana', February/March 1990, no.226/227, pl4).
Incomes from exports of cocaine, only around a third (1988 figure) of
the raw material for which is produced in Colombia, are significantly
higher than those for marihuana exports. Still, the 1980's saw falling227
228
profits: in the beginning of the decade (1981) a kilo, of cocaine was
fetching- U.S.$50,000; at the end of the decade- (1988) nearer
U.S.$15,000. The same period saw gross incomes declining from 4,680
million dollars (1982) to 1,158 million dollars (1988). Meanwhile, net
profits went from 3,700 million dollars to 667 million dollars.
At the beginning of the 1980's, net incomes from cocaine exports - to
the U.S. - oscillated between 5% and 9.5% of GDP. With the coming of the
lower price this steadily declined to 2% by 1988. Taking into account
the nascent exporting trade with the European countries, the figure
would probably rise to between 3% - 3.5%.
Cocaine incomes are an important source of finance for contraband and
capital flight. Funds from the sale of the former are used to finance,
in Colombian Pesos, the activities and investments of the drug dealers
in Colombia and Latin America - paying growers in Bolivia and Peru,
covering local transport and 'security' costs and basic living expenses.
Within the latter, current account deposits in the United States,
Panama, the Bahamas, Switzerland and Hong Kong figure largely, as do
purchases of rural properties in the United States and other Latin
American countries. Though, the Banco de la Republica also includes as
part of its 'illegal incomes' account the underbilling of exports and
the overbilling of imports. In the period 1981-88, this made up
approximately 20% (Source: 'Economia Colombiana', February/March 1990,
no.226/227, pl5, table 6) of illegal incomes. The uses to which these
incomes, overall, are put (all of which are primarily to 'wash', not
make, money, as the latter has already been done) are, it seems,
primarily capital flight and contraband activities, neither of which
fuels internal demand to any great extent. Arango (quoted in228

229
Hardinghaus, 1989), though, has recently attempted a breakdown of
internal, investments made with drug profits: urban and rural 'bienes
raices1, 45%; 'ranchos de ganado', 20%; 'comercio1, 15%; construction,
10%; and recreation and services, like discoteques and restaurants, 10%.
Thus, an increase in 'vivienda suntuaria' occurred, especially - and
conspicuously - in the three largest cities. The increase in demand took
middle- and upper-market house prices with it. The same occurred with
rural farms and ranches: the demand for them increased prices - to the
extent that the prices began to bear little relation to reality, thereby
squeezing middle income groups out of the housing market. However, in
both cases the overall sectoral and regional effects were not
significant.
In other respects the illegal currency flows did have a broader
sweep, notably in the money changing sector. Essentially, the increase
in the supply of dollars reduced its price on the black market, which
had the effect of cheapening contraband goods sold in the country. This,
in turn, acted as a drag upon the growth of manufacturing industry at
home. Indeed, the industrial recession of the early 1980's probably had
much to do with such 'disloyal' competition.
Following those foreign currency flows on the margins of the official
accounts, then, shows that the majority of the drug-related profits went
to finance contraband and capital flight and/or non-arrival of capital.
The direct impact of narcotrafficking upon aggregate internal demand,
then, was not very significant through the decade. It was important,
nonetheless, in other respects. Principally, by concentrating its
effects in the ' finca raiz' and construction sectors and by cheapening
the cost of the 'black market' dollar, it tended to distort the229

230
assigning of resources and to encourage contraband activities, which
generated costs in terms of national industrial growth. These effects,
together with the rather small proportion of the GNP covered by the
drug-related incomes, suggest that the overall effect of the drug-trade
on the economy was negative in the 1980's.
Turning to a more specific analysis of the effects upon inequality
wrought by the drug trade, the first point is that a great deal turns
upon the entry of contraband goods into the country, and the
consequences this has for national industry. The most notable example is
the textile industry, one of the most important industries in Medellin.
During the late 1970's and early 1980's unemployment increased rapidly
in the industry, precisely the period when large quantities of
contraband goods, including cloths and clothes, were entering the
country. This generated unemployment among the permanently employed, and
generally skilled, workers within the industry.
Concurrently, of course, narco-dollars were financing a fever of
construction activity in the same city, which generated employment for
partially qualified or non-qualified construction workers and
bodyguards. Put together, these two consequences of the drug trade
probably improved the income distribution profile, by equalising income
shares somewhat between skilled and unskilled groups of workers. If the
knock-on effects from the closure of many textile firms are considered,
then the improvements to the income distribution are compounded, with
increased unemployment tending to equalise incomes. Clothes
manufacturing firstly needs cloth, the makers of which purchase cotton,
from growers in the north-east (Department of Cesar) of the country,
fertilizers, transport services, financial and security services and230

231
agricultural machinery. In contrast, the cocaine trade, generates very
few knock-on effects. The leaf is cultivated in Bolivia-and Peru and the
majority of the hardware for the processing laboratories in Colombia is
bought abroad and brought in as contraband. In addition, the high value
per gramme does not generate a need for large-scale transport services.
At the very least, though, the leaf in these countries is produced by
peasant farmers who otherwise might have little or no income. An
enumeration of the numbers involved would be useful here in indicating
how important coca leaf cultivation is in keeping rural farmers out of
poverty. This applies to Colombia as well.
The drug trade at the same time worsens the overall income
distribution profile through concentrating its high profits in just a
few hands. Seen in conjunction with the consequences for national
industry from contraband, this implies that the short-term possibilities
for a more egalitarian income profile, or at least one driven by
resources from the drug trade, look remote. This is because loss of
industrial production and unemployment mean that basing an economic
growth strategy on producing for a relatively prosperous population is
impossible. Industry is then back in the double bind so common in
developing countries: it cannot lower its costs by producing on a large
scale for a mass market, nor can it grow by satisfying increased demand.
There is now an extensive literature on the benefits to employment
generation of the production of exports - and its tendency to employ
workers in a variety of sectors, thereby creating a mass market for
national industry. (See n.6, Chapter 2, on the contrasting results
obtained from import substitution). Coffee has been the most dramatic
example in Colombia. It created both the funds and the need for a231

232
transport infrastructure as well as a mass consumer market. More
recently, the flower growing industry has, on a much smaller scale,
begun to do the same. Cocaine production does neither.
There are alternative interpretations which can be put upon the
influence of contraband goods, all of which, however, are difficult to
quantify. Firstly, by lowering the prices of some goods, contraband
helps to control inflation; this could have a beneficial effect on the
finances of the poor, who tend to be the hardest hit from - the non
progressive nature of - hikes in inflation. Secondly, it can be
suggested that other factors contributed to the industrial decline of
the late 1970's and early 1980's. For example, poor productivity due to
the cushion of monopoly positions held by many firms; or the fact that
the Colombian Peso was openly overvalued in the second half of the
1970's and in the early 1980's, due to the government's concern to check
inflationary pressures arising from the "coffee bonanza". Thirdly, it is
difficult to gauge the size of the internal market for contraband goods,
which tend to be, in Colombian terms, luxury, or semi-luxury, products -
stereos, fridges, foreign-produced clothing etc. In interviews with
shopkeepers in some of the unofficial 'contraband centres' in and around
the country (known as 'San Andresitos') this author discovered that the
majority of contraband which arrives in the country does not sell very
quickly; it is not uncommon for a modern fridge, for example, to be
standing in a shop for between one and two years. This seems to suggest
that the size of the income groups able to afford such products is
limited - or at least limited in terms of its ability to buy sufficient
amounts of goods for drug dealers to successfully 'wash' very large
quantities of narco-dollars. Even if it were much larger, could it232

233
anyway absorb, say, the hundreds of millions of fridges that billions of
drug profits could buy! This analysis suggests that the view that
contraband has been an important factor in the decline of national
industry may be wrong. With the relatively small size of the middle and
upper-income groups in Colombia, drug dealers would be better off
'washing' dollars some other way.
The drug trade also influences the inequality profile through the
non-payment of direct taxes, or of import and export tariffs, by the
drug dealers. Increases in the numbers of military and police personnel,
and in the imports of arms, all due to the 'fight against drugs' waged
by successive governments, influence the inequality profile in the same
way. That is, the loss of government funds from non-payment of taxes,
allied with the increases in expenditure necessitated by the drug war,
mean that fewer funds are available for progressive social expenditures,
notably housing for low-income groups.
A cost-benefit analysis, then, of the effect of the drug trade upon
inequality in Colombia throws up mixed conclusions. It may be,
considering the doubts surrounding most propositions, that its effect is
neutral. More research is needed to disentangle the costs and benefits
of each effect. For example, increased military spending undoubtedly
takes resources away from social programmes. Yet enlisting more young
men into the police and army, who would tend to come from the poorer,
less educated income groups, could at once bring many of them out of a
poverty situation and improve their income earning and social mobility
possibilities. (10). This would improve the income distribution profile,
in a Kuznetsian sense, by increasing the non-poor population. Urrutia's
(1990) recent conclusion that Colombia cannot afford the luxury of233

234
tolerating the drug trade within its borders is, then, not at all clear.
v) 'Culture of Violence' Related Determinants
Throughout the 1980's in Colombia, internationally high indices of
violence (with 'violence' defined as "the rate of violent death per
10,000 inhabitants") have been the norm. How these have affected the
poverty and inequality profiles is therefore a relevant question to ask.
Does violence act as cause or effect upon inequality? That is, do the
consequences of violent acts shape the inequality profile, or is it that
a particular inequality profile brings with it high or low indices of
violence? Apart from such theoretical conundrums, there are the problems
of availability and reliability of information; with the state
effectively absent from large swathes of the country an accurate
recording, let alone a satisfactory sociological assessment, of what is
going on is that much more difficult.
What, then, are we to make of the coexistence of high levels of both
poverty and violence? A popular view is that, as the fruits of economic
growth have tended to concentrate themselves in the hands of a relative
few, then large sections of the population, seeing themselves as
marginalised from the development process, and lacking many basic needs,
would see violence as a way of 'destabilising the system1 and thus of
bringing about change. This is not far away from the Marxian view of the
development process discussed in Chapter 1. A variant of this view is234

235
that recently expressed by a prominent Colombian journalist: "today's
violence.is the result of three generations of frustrated hopes - and
this also explains why Medellin has the highest crime figures in the
country." (Ana Maria Cano, in an interview on BBC television, 18/2/90).
It is not, however, easy to find a direct causal relationship between
poverty and violence in Colombia. In fact, it is often, on the face of
it, the inverse: the highest indices of violence tend to occur in the
most developed regions of the country - defined as those areas with the
highest amounts of capital investment.
Of the 1016 municipalities in Colombia, 40% saw 'scenes of violent
confrontations' (11) during the period 1946-1985. In 1985 violent
confrontations between armed groups occurred in 17% of municipalites.
Further, 11% of the municipal areas have been affected, for the first
time in the 1980's, by 'organic violence' - carried out by politically
and/or economically motivated groups. 52% of these areas experiencing
this new type of violence are zones of colonisation, either on the
frontier or in the interior; 17% are areas of 'minifundio andino'; 11%
non-coffee growing, medium-scale peasant farming areas; and 10%
correspond to areas on the Caribbean coast. These percentages show that
the map of violence has drawn itself in those areas - predominantly
rural and with high levels of poverty - that are just beginning to
integrate themselves into the national economic system. One should not,
from this, conclude that violence tends to contribute to the advance of
capitalism, as some areas which experienced violence prior to the
1980's, for example during 'la violencia' of 1946 - 1966, did not do so
in the 1980's - notably small-scale peasant farming regions in the
Andes. Pecaut (1987) has suggested that in these areas violence235

236
inhibited capitalist development.
What, . then, of the specific relation between povert-y and homicides?
Broadly, in the 62% of municipalities with the highest rates of poverty
only 27% show high rates of violent death (not all these resulted from
confrontations between armed groups), From this, poverty is patently not
a sufficient cause of violence. Only in five of fourteen 'municipal
types' is there an association between poverty, violence and the
presence of armed groups. These are: the marginal rural periphery;
frontier and internal colonisation areas; non-coffee, medium-sized
peasant farming areas; and the depressed, small-scale peasant farming
areas in the Andean regions. On the other hand, the association between
the presence of armed groups and high homicide rates is equally positive
in areas of commercial agriculture, which show relatively low indices of
poverty. Finally, a high homicide rate with neither high levels of
poverty nor the presence of armed groups is apparent in the coffee
growing areas as well as in the urban areas. This perhaps reflects the
presence of 'inorganic' violence, not associated with organised
guerrilla groups of one form or another; an institutional culture of
'resolving one's own problems' may have developed in these areas, such
that individual conflicts are not taken to a third party - some arm of
the state - for adjudication. Physical elimination of one's opponent,
the solution, is normally arranged, rather, through a third party of
one's own choosing - frequently by paying a nominal sum to a 'sicario',
or 'young man riding shotgun on a motorbike'. In those rural areas which
exhibited high rates of poverty and 'organic' violence before the
1980's, but no longer, it could be suggested that such a form of
resolving personal problems grew out of the values acquired during the236
237
period of violence, and have been 'encouraged' by the absence of the
state. In the urban areas, though, the latter is not the case. Perhaps
here the phenomenon of private resolution of problems has something to
do with the illegal nature of the original relationship or transaction
between the parties involved, notably to do with disputes - contracts
not carried out; straying into another's market share - among the
various players in the drug-trafficking business. At present, much of
this is at the level of informed scepticism, but it undoubtedly
represents a fascinating area of future research.
The conclusion, then, is that in Colombia there is no stable or
unidirectional relationship between poverty and violence (the figures
for the 1980's refer to the Census year of 1985). It does seem, though,
that there is greater violence and/or social conflict in the more
economically dynamic areas of the country - notably in the areas of
colonisation, characterised by rapid rural and urban development. A good
deal of the conflicts in these regions originate in the struggle for
land and income. However, before being certain of such an interpretation
one should recall that the terrain of a region has a strong influence
upon the presence of guerrillas: jungle, or mountainous, areas without
roads tend to be 'occupied' by armed groups, and these are precisely
those areas which tend to exhibit high levels of poverty. In many of the
rural areas, then, the coincidence of poverty and violence could be
nothing more than a variant of Che Guevara's fish bowl analogy, with
guerrilla groups living off the land and the local, predominantly
peasant, population. Often - in Colombia - they are engaged in violent
struggles with narcotraffickers - for control of an area in which the
latter has significant investments.237
238
In a recent article it has been suggested that "the Colombian social
model, with its deep social inequalities and permanent -concentration of
resources, has generated the generalised phenomenons of poverty and
violence." (Boletin de Estadistica, July 1990, no.448, p221; my
translation) . The basic problem with this analysis is that 'deep social
inequalities' and 'permanent concentration of resources' characterise
many other societies, too. Staying within Latin America, one finds
Bolivia with higher rates of poverty than Colombia, yet no record of
guerrilla violence; Peru, with still greater numbers in poverty, does
have active guerrilla groups. Thus, a society's inequality or poverty
profile is no predictor of level - or type; in Peru the armed groups are
involved in more of an ethnically based struggle than in Colombia - of
violence. The state of the economy is also a non-starter as a predictor
of the presence of guerrilla violence. The Colombian economy, in terms
of the growth of both GDP and foreign investment, is almost without
equal over the last forty years in the developing world outside South
East Asia. In stark comparison, the Peruvian economy has not grown, in
real terms, since the 1920's; indeed, between 1961 and 1979 average
annual per capita income fell from U.S.$232 to U.S.$197. (Brundenius,
1984). Yet both societies exhibit high international levels of
intentional deaths.
The explanation, then, of the presence of violence must be sought at
the micro level, that is, looking at its particular roots in each
country. Comparative sociology, by contrast, does not take us very far.
238
239
vi) Conclusions: Substantive and Methodological
a) Substantive
The ultimate justification for examining the development experience of a
particular country is to identify trends and relationships which may be
either relevant elsewhere or specific to the country under study. This
way general hypotheses can be formed or altered accordingly. For this
reason this report has attempted to draw out the phenomena which have
both increased and decreased income concentration and poverty in the
course of Colombia's economic growth - with a view to coining to some
conclusion about the degree of discord between growth and equity.
As a starting point, we noted, in Chapter 1, the widespread
pessimism current in the 1970's about the distibutional effects of post
war growth in most developing countries. Yet, is such a feeling
justified? Moreover, is the thirty year period between the end of the
Second World War and the middle of the 1970's anyway a long enough one
upon which to base such a conclusion? The answer to both of these
questions, after having surveyed, in Chapters 2 to 5, the available
Colombian data since the 1930's, is 'no'. Rather, whether the starting
point is 1930 or 1944/5, the Colombian growth-equity experience through
to 1990 engenders a good deal of optimism: the economy has grown
consistently and income concentration and poverty have both, over either
period as a whole, declined. As a result, the conclusion which emerges239

240
from this report is that there is no necessary conflict between growth
and equity.
Indeed, the first detailed work on income inequalities in Colombia
(Berry and Urrutia, 1976) was inspired by an interest in whether or not
there was an inherent conflict between growth and equity. In it a call
was made to look more closely at the relationship between economic
(output) growth on the one hand, and income distribution and the welfare
of low-income groups on the other. It was pointed out that in the period
of fast economic growth in Colombia, between 1935 and 1966, income
distribution apparently worsened, and in the subsequent slow-growth
period of 1956-66 it seemed to improve. The authors commented that these
findings "...do raise questions. The evidence is suggestive enough to
call for additional empirical work to permit more confident acceptance
or rejectiofi of the relationship." (pl21) .
Subsequent studies did not address this question specifically, though
Mohan (1986) noted, in passing, that high urban unemployment, long-run
employment problems, high poverty and segmented labour markets need not
accompany rapid urban growth. An appropriate economic environment
bolstered by a judicious mix of policies can make better outcomes
possible." (p357) . As Mohan was referring to the 1970's, up to 1978,
which was a period of rapid economic growth in Colombia, it seemed to
suggest that Berry and Urrutia's earlier hypothesis of a worsening
distribution under fast growth could not be upheld.
With these thoughts in mind, this study picked up Berry and Urrutia's
gauntlet with a view to examining its relevance for the 1980's. The
theoretical model used was the Kuznets hypothesis. This suggests a 'long
swing' in a society's income distribution profile, which worsens before240

241
it improves. In the late 1970's the Colombian economy was, according to
Kuznets' .hypothesis, at that point when the income distribution profile
should begin to improve, and continue to do so. Findings such as Mohan's
gave a further indication that this might indeed be what was about to
occur. In fact, it did not. From the late 1970's through to 1985 (a
slow-growth period) there was a clear tendency towards concentration;
during 1986 and 1987 (a high-growth period) concentration decreased.
Identifying a definite trend is not easy, though there was probably a
(very) slight improvement in the profile by the end of the 1980's
compared with the end of the 1970's.
The ups and downs in the rate of growth in the period do not really
permit a conclusion on the relationship noted by Berry and Urrutia: the
decrease in concentration during the years 1986/7, for example, though
it took place when economic growth was picking up, could equally have
been due to factors which occurred in the earlier period of slow
economic growth which were just making themselves felt: the higher, pre-
1986 public expenditure levels were probably, at that time, beginning to
have an effect. One needs, clearly, to look at a longer period of time
in order to come to any firm conclusions about any definite relationship
between the economic growth rate and the distribution of income.
Perhaps, of course, the same can be said of any attempt to apply the
"Kuznets Hypothesis", and that consequently the twelve year period (1978
- 1990) of this study is not long enough to be sure that any observed
relationship or absence of relationship between economic growth and
inequality is not merely a blip on the Kuznets curve or the beginning of
a completely different curve altogether. This is a valid point - but not
a reason not to apply Kuznets1 hypothesis to some distribution or other,241

242
whether the distribution covers a short or long time-period.
What is more important - and this is one of the contributions made to
the debate by this study - is to deconstruct the Kuznets hypothesis: to
draw out the assumptions and limitations behind it.
It would be unfair to say that Kuznets entirely overemphasised
economic variables, for he points up the significance of, amongst other
things, the waning tolerance throughout society of extreme income
inequalities, as well as the need for governments to take note of at
least some of the more basic rules of democratic politics, like the need
to 'provide favours' to one's constituency - progressive taxes, social
expenditures and the like. Both of these, in Kuznets' scheme of things,
encourage the movement towards less income concentration.
Having said this, the overwhelming force behind the 'long swing' in
the income distribution profile is, for Kuznets, economic growth. The
changes accompanying economic growth - rural to urban migration and the
increasing (competitive) dynamism in the economy, in particular - bring
down the Gini coefficient and level-up incomes.
As a result, Kuznets does tend to de-emphasise non-economic
variables. Sociological and political variables do not figure to any
great extent in the Kuznets hypothesis. The coincidence, say, of a
successful government programme to reduce income-related poverty in the
rural areas and a rise in unskilled rural wages due to rural emigration
- both of which would improve the overall distribution of income - would
not be picked up by Kuznets' hypothesis. Only the second would be
interpreted as causal; the first would not even be noticed. This is, as
this report has pointed out, an inherent problem with cross-sectional
studies such as that of Kuznets' : they do not enable the measurement of242

243
over-time effects of a given factor or a comparison of the cumulative
effects of various factors. As a result, they tend -to overdramatize
those factors common to different populations.
While this reduces the weight of Kuznets' hypothesis, the limitations
of longitudinal studies - from which, in the main, criticisms of the
hypothesis have come - should not be forgotten. Essentially, they cannot
generate a proposition to rival the universality of the Kuznets
hypothesis - apart, of course, from the reductionist proposition that
the 'sum of the minutiae of the case studies themselves will,
eventually, generate the hypothesis1 . The problem with this is that it
implies a very long wait for general trends to be recognised and that we
may never decide that we know what we think we know.
A second contribution of this study to the debate has been to bring
the poverty and income distribution figures for Colombia up-to-date,
primarily using recently made available official statistics. To have
lost the continuity of such a valuable series of statistics, which goes
back to the early 1930's, would have been lamentable. Further, the
report has been supplemented by a wide variety of other data sources,
enabling checks and balances to be made to the official statistics as
well as giving the debate an unusual richness; unusual because no other
study on Colombian inequality has garnered together such a wide array of
data sources and attempted the difficult and often frustrating task of
piecing them together.
The aim has also been to make the trends and their determinants
available 'in good time': social scientists may be able to wait for data
and conclusions, but policy makers, needing pointers to today's
problems, cannot. Hanson (1987), after reviewing a series of studies on243

244
the general theme of growth and distribution in Colombia,, notes that "if
one were .to make a general criticism of the books reviewed, it would be
that they did not appear soon enough from the standpoint of
policymaking." (p263). The studies by Urrutia (1985) and Mohan (1986)
are cases in point: both referred to the period up to 1978, but took a
full seven and eight years afterwards, respectively, to appear.
What happened to inequality, then, in the sub-period of 1978-1990? In
contrast to the full sixty year period between 1930 and 1990, there was
(something of) a conflict between growth and equity: despite continued
economic growth, income distribution failed to improve and income-
related poverty increased. This supports our conclusion of no necessary
conflict between growth and equity; for the dominant factors in
determining the degree of conflict and strain are those associated with
the larger economic and social situations and the mixture of government
policy. This must be the case, as economic growth occurred throughout
the period 1930-1990.
Decelerating economic growth from the late 1970's through to 1986/7,
with attendant increases in unemployment and underemployment, and the
increase in the capital share, heightened overall income concentration.
In contrast, the household income distribution did not worsen, due to
income gains in the late 1980's - when the economic and employment
situations began to pick up again - by the bottom 50% and the top 20%,
at the expense of the, predominantly white-collar, intermediate deciles,
who experienced a relative wage decline during the decade.
The minimum wage was something of a double-edged sword. It maintained
its purchasing power through the decade relative to other wages, in this
way helping to deconcentrate the wage and income distributions. The244

245
level of the minimum wage, though, was not pitched high enough to
prevent .increasing numbers falling into income-related poverty.
Specifically, it assumed a 1worker-dependency ratio1 which was - and is
- too low. The inadequate minimum wage was compounded by the relatively
high food inflation of the 1980's, which must have pushed still greater
numbers into poverty, due to the higher proportion of income devoted to
food among low-income groups.
The ever-increasing external public debt, along with the concurrent
peso devaluation, have meant higher charges being levied for public
utilities. Despite the progressive nature of public utility charges (see
section on Subsidies below), this will not have helped low-income users
of public services and is another factor which has further limited
resources in poor households. At the same time, national and local
governments, because of the high cost of financing both the internal
military effort and external debt commitments, have not been able to
adequately finance many of the infrastructural improvements and social
expenditure programmes promised in election campaigns. Amongst other
things, this has prevented the NBI index, especially in the rural areas,
from coming down further. This is not to deny the success achieved in
bringing down the NBI index in urban areas to what can perhaps be
considered uncritical levels, according to figures for 1990.
The taxation regime through the decade appears not to have had any
deconcentrating effect upon income distribution nor to have reduced
poverty. Direct taxation has, at best, served not to worsen the
distribution; indirect taxation has, due to its inherent regressive
nature and to the Colombian government's decision in 1985 to abolish
exemptions on some popular goods, served to worsen the 'after the fact1245

246
distribution and to push greater numbers into income-related poverty.
The overall effect of government subsidies has not been so clear cut;
rather, it is necessary to look at the specific effects of particular
subsidies. Petrol subsidies have helped to concentrate incomes through
the benefits they give to the private car-owning middle and upper-income
groups as well as to deconcentrate incomes, or at least not to
concentrate them further, through the knock-on effect that artificially
low petrol prices tend to have upon food prices. More research is needed
into the distributional consequences of the uses to which the receipts
from the 10% tax on petrol are put by Ecopetrol and the Colombian
government before a firm conclusion can be ventured as to the overall
effect of subsidies and taxes on petrol.
Subsidies to mass urban transport have been all but withdrawn through
the course of the 1980's. This policy has very clearly hit low-income
groups, who are the main users of the urban bus networks. In conjunction
with the artificially low petrol prices paid by middle and high-income
groups, the losers overall when it comes to 'getting about town' are
those in the bottom half of the distribution.
The stepped system of payment for public utilities introduced by
local governments has, in contrast, had a progressive outcome. Although
more research needs to be done on the precise level of progressivity -
due to the different charges levied in each municipality - cross
subsidisation from middle-income and higher-income groups to low-income
groups and from higher-income to middle-income groups has undoubtedly
occurred.
The faster devaluation of the late 1980's and the recent government
policy of 'opening up the economy' appear to have created an increase in246
247
the importance of labour-intensive, export-led industries. Should this
continue. it bodes well for an improvement in the income distribution
profile, especially if the emerging foreign competition brings with it
lower profit margins and, in turn, a decrease in the capital share.
However, for this to occur the Colombian government will have to alter
the level of the minimum wage accordingly and somehow free itself from
its external debt commitments. As the latter is not, in the short-term,
feasible, the former will have to be considered.
Education has - since the 1950's - helped to increase income
equality, through a general lowering of returns to education. At the
same time, the increasing equality of educational level among
individuals - since the expansion of the educational system during the
1950's and 1960's - has meant that education now has a more limited
influence upon income differences, witness the movements in the wage
ratio of workers without education to high school graduates since the
1930's. In the 1980's, when income distribution changed very little,
education may have helped not to worsen the distribution through its
dampening effect - throughout the distribution - on wages. It was not
able to improve the distribution as there remain, in urban as well as
rural areas, significant minorities of (mostly poor) children outside
the education system - who cannot therefore benefit from the income-
increasing consequences, most notable at the low-income levels, of even
a rudimentary level of education.
The influences wrought by both the drug trade and the so-called
'culture of violence' upon the inequality profile are much more
difficult to draw out. It can be speculated, though, that the impact of
the drug trade and the resources it brings into Colombia is neutral. At247

248
least this must be the present position, considering the uncertainties
surrounding most of the propositions linking the - drug trade to
inequality.
The 'culture of violence1 - linked, of course, to the drug trade in
many ways - is not clearly associated, either, with the income
distribution and poverty trends. This is not to say it has no influence
- military-guerrilla-drug trafficker conflicts in many rural areas
undoubtedly discourage investment and force many to migrate to the
cities, with negative consequences for urban employment and poverty;
only that an enumeration of the precise numbers thus affected by
violence is not yet available. For example, to what extent was the
rural-urban migration of the 1980's, identified in Chapter 5 as the
principal reason for the increase in per-capita incomes among the rural
poor, the result of the presence of violent struggles?
b) Methodological
One conclusion of this report is that theory on economic growth and
development cannot - yet - easily incorporate or predict the movements
in income distribution and poverty; the latter must rather be drawn out
by an inductive effort, which means following a micro, case-study
approach. Fei, Ranis and Kuo (1979) recognised this, when they concluded
that "the way transition growth is generated largely determines the
levels of transition equity" (p324).
What, then, are the implications of this for future research? The248

249
first is that, as the attempt at constructing a theory of inequality and
income distribution is still at the data gathering stage, it would be of
great value to focus on individual countries with a view to identifying
causal mechanisms. This way, with the availability of more case studies
from developing countries around the world, we can expect, in the
future, to separate the quantitatively important causes of movements in
income inequalities, such as the extent of educational provision and
rural-to-urban migration, from the less important causes, such as
discrimination against newly-arrived urban immigrants. The attention of
policymakers could then be directed at the important causes and
appropriate action - assuming economic and political feasibility - could
be taken.
The second implication for future research involves the process of
data collection. It is that some types of data in such a study are more
useful than others. Official statistics are most valuable when their
coverage is nationwide and when they adequately cover the rural as well
as the urban areas. This, lamentably, is seldom the case. Because of
this it is normally necessary to make use of a number of different sets
of official statistics, often ones not originally intended as income
surveys. This report, for example, was forced to make use of government
surveys carried out in order to up-date the Consumer Price Index, to map
the general characteristics of the rural population and to assess the
quality of the national housing stock. This is not necessarily a
drawback, for the income information that there is in such reports is
often very accurately collated, but it does mean that, because of
differing sample sizes and frameworks, comparisons between populations
in different areas of a country are not easy to make.249

250
In addition, the information collected from official, questionnaire-
based surveys is, by definition, limited by the questions themselves.
This means, in particular, that certain types of income will probably
not be tapped, especially at the top and bottom ends of the income
distribution. At the top end of the income scale respondents may not be
inclined to divulge sources of unearned incomes through fears of later
being forced to declare them and pay tax on them. At the bottom end, the
informal network of income transfers within poor neighbourhoods will
almost certainly be overlooked: the irregular nature of such transfers
as well as the fact that many of the poor will not think of certain
types of 'income' as income at all - such as food given by a neighbour
or the Catholic Church, and subsidised medicines which can be bought
from neighbourhood primary health-care units - make it difficult for a
structured questionnaire to trace and enumerate them.
To fill these gaps left by the official statistics, the researcher
needs to construct, as far as possible, small samples from the top and
bottom of the distribution and undertake in-depth interviews with each
individual. Among those in the top of the distribution the questions
will concentrate on investments and (legal or illegal) unearned incomes
not mentioned in the responses to the questionnaire; among those in the
bottom of the distribution questions will concentrate on all types of
'resources' from which the respondent benefits - and on all types of
'survival strategies', whether legal or otherwise. Due to the sensitive
nature of some of the questions involved, particularly those enquiring
into 'undeclared' income sources, interviewers would have to stress the
absolute confidentiality of the responses in order to elicit the desired
information.250

251
This report, as a beginning, has followed such an approach, through a
series of pilot interviews, among those at the bottom end of the
distribution. The results have helped to explain the universal conundrum
of how destitute individuals who, according to the official statistics
should be dead from lack of food, manage to survive. Past studies have
contented themselves with macro-economic explanations of this
phenomenon, thus missing completely the real reasons. The next step is
to follow a similar exercise, but using a more formal sample than was
the case in this report. With time, it could even be extended as a
method to individuals in middle-income groups, who, in the Latin
American context at least, frequently undertake home-based remunerative
activities apart from their 'principal' activity, from making and
selling t-shirts to cultivating fruits and vegetables on a small rural
' farm' .
Refining the detection of what we can call, for all the income
groups, 'survival strategies' would enable more confident conclusions to
be reached about the true levels of income concentration and poverty in
a society, as it involves a much wider definition of income than that
used in the collection of official statistics.
251

252
Notes
1) Food availability in the cities is not the problem. Rather, what is
lacking is a cheap supply of food for low-income families. They cannot,
without high costs in transport and time, reach the supermarkets, which
are increasingly being constructed out of town. Corchuelo (1990) found
evidence of higher food prices in the low-income neighbourhoods of Cali
than in any other area of the city. Efforts are afoot, notably by the
'Carvajal Foundation1, to rectify this, by means of setting up food
warehouses inside the poor neighbourhoods themselves, in order that the
local shopkeepers do not have to incur the travel or delivery costs
involved in buying from warehouses elsewhere in the city.
2) The Colombian government defines the 'informal sector' as: business
'concerns' employing five or fewer individuals. Silva (1990) has
estimated that this would include approximately half of the working
population; the Bogota based research institute, 'INVAL1, put (1990) the
figure at one million for Bogota alone. As such, the definition needs
refining, as at present it appears to be picking up both low-income and
middle-income individuals. One should be accordingly wary, therefore, of
drawing conclusions from an enlarging 'informal' sector.
3) See the points raised by Friedman, 1989, on the problems associated
with shadowing another currency, noted in Chapter 2, n.26.
4) These figures are taken from various reports from Proexpo, the Banco
de la Republica and the DANE.
5) The Ministry of Agriculture has estimated that 7.9% of the total252

253
population and 23.6% of the rural population live (figures refer to
1987) in such areas. Source: Ministry of Agriculture, 'Mision de
Estudios del Sector Agropecuario1, Bogota, May 1990).
6) For the precise wage levels through the period, see: Ministry of
Agriculture, 'El Desarrollo Agropecuario en Colombia1, August 1990,
p204, table 322.
7) The original statement of the plan is contained in: Presidencia de la
Republica: 'Plan de Lucha Contra la Pobreza Absoluta y para la
Generacion de Empleo - Informe al Senor Presidente de la Republica',
December 1986 - June 1987, Bogota.
8) Psacharopoulos (1985) confirmed this with his findings on the
different rates of return to primary education by continents, ranging
from 34% in Africa to 12% in the most advanced countries. Source: quoted
in Londono, 1990, p80.
9) This literature includes: Blau and Duncan (1967); Duncan et al
(1972); Sewell and Hauser (1975); Portes (1982); Featherman and Stevens
(1982) .
10) The function of the military as an 'equalising' force in societies
has long been recognised: see Lenski (1966) for a general discussion and
Stepan (1971 and 1988) for a discussion of the well-documented Brazilian
case.
11) This discussion relies heavily on figures produced by the DANE in
Boletin de Estadistica, July 1990, no.448 p210.
253

Appendix 1 Fieldwork and Data
a) Fieldwork
In 1988 and 1989 I lived and worked in Colombia. During this time I
carried out a review of the available literature on the poverty and
income distribution profiles of Colombia, taking in published and
unpublished material. I soon came to the conclusion that both were well
traced up to 1978, the year of the end of Alfonso Lopez Michelsen's
Presidency. Beyond that year there was a paucity of analysis, which
seemed lamentable as the 1986-1990 administration of Virgilio Barco took
a high-profile interest in poverty and low incomes - and the DANE, at
the same time, devoted more of its resources to collecting data on them.
It therefore seemed appropriate to delve into the official statistics,
with a view to seeing if the poverty and income distribution trends
could be brought up-to-date. An initial, and cursory, inspection showed
that they could.
Further, existing publications hinted at the possibility that simple
economic growth could have a lot to do with widely found improvements
in the poverty and income distribution profiles from the 1930's through
to the end of the 1970's. This led me to the 'Kuznets hypothesis', which
posits just that - or at least that economic development, defined by GNP
per capita, is characterised by decreasing income concentration.
With these thoughts in mind, I returned to London at the end of 198 9

255
to begin a year long literature review in the British Library of
Political and Economic Science, the library of the London School of
Economics and Political Science. In this year I concentrated on
understanding the theses of Kuznets and others as to the relationships
between economic growth and inequality, and how they differed from one
another.
Once this was done I embarked upon a fieldwork trip to Colombia,
financed by the Central Research Fund of the University of London. The
six month trip began in October 1990 and ended in April 1991. My remit
was to trace the inequality trends from the late 1970's through 1990 and
to look for the more important determinants.
During the trip I spent much of my time working in the Government
Statistical Offices (known as the DANE) in Bogota and Cali. Here I was
looking for official statistics which might give a clue to poverty and
income distribution trends. Mainly, I looked at the results from the
most recent Census undertaken (in 1985), the latest National Survey of
Incomes and Expenditures (in 1984/85), the 1988 National Survey of Rural
Households and the Household Surveys for the period, carried out
annually. At the Head Office of the DANE, in Bogota, I managed to
contact the various sociologists and economists in the research
department, with whom I worked for a number of weeks, exchanging ideas
and information. They kindly made unpublished information available to
me, notably computer print-outs from an internal departmental project to
'cross' the two methods of measuring poverty - the NBI and the LP.
I also worked with universities in the country, specifically the
'Universidad del Valle' in Cali, and the 'Universidad Externado' in
Bogota. In the first, I was kindly given access to the university's255

256
reference collection, which includes all the Colombian, social science
journals;, and I worked with the coordinator, a sociologist, of a joint
United Nations/DANE/Universidad del Valle project on rural poverty in
the 1980's, Maria Bonilla de Restrepo. In the second, I was kindly given
access to unpublished data from a project by staff of the Sociology
Department on poverty among families in the poor neighbourhoods of
Bogota.
During my time in Cali I worked with a number of different people and
organisations:
i) the 'Carvajal Foundation', a large organisation - in fact, the
philanthropic arm of Carvajal, one of the country's largest companies -
devoted to eradicating poverty by aiding small businesses. On the 6th of
December, 1990, I carried out an extended interview with the Director of
the organisation, discussing, amongst other things, how best to assist
the critically poor (the destitute) and whether the 'Carvajal
Foundation', through its programme of help and advice to small
businesses - which are invariably 'shops', commonly run from the front
windows of houses in some of the poorest neighbourhoods - which have to
have been operating for at least one year to qualify for assistance, was
indeed doing so.
ii) officials in the Government Taxation Office, where I researched,
during various days in March 1991, direct and indirect tax levels to
gauge their effects upon poverty and income distribution.
iii) researchers at the Head Office of the Institute of Family Well-256

257
Being (ICBF), the government agency responsible for monitoring nutrition
in Colombia. During my four visits there in December 1990 they furnished
me with details of their programmes through the 1980's, which were
designed to assist the children of the poorest. The discussion of child
poverty in Chapter 6 is partly a product of my time at the ICBF.
iv) the Director of Colombia's largest Bureau de Change ('Universal de
Cambio'), which has its Head Office in Cali, in order to get an idea of
the amount and significance of money transfers (the company's principal
activity) into Colombia from, predominantly, the United States; and of
the mechanisms, licit and illicit, available to launder drug-monies.
This was done with a view to estimating the accuracy of figures from the
Drug Enforcement Agency, the Colombian National Bank and others as to
the importance of drug-money to the Colombian economy, and to aid a
discussion, which appears in Chapter 6, of possible links between 'the
drug trade1 and inequality.
I carried out two extended interviews with the bureau's Director in
Cali during March 1991.
v) Colombian and North American aid workers inside 'Agua Blanca', Cali's
poorest district, in whose neighbourhoods live approximately one-third
of the city's inhabitants. They toured some of the neighbourhoods once
a week, on Monday afternoons, looking in on its poorest members,
discussing their problems and needs with them and, often, providing much
needed food and liquid. I accompanied them on these tours while I was in
Cali, which was for approximately three months, between November 1990
and January/February 1991. I took detailed notes of all the tours and257
258
many photos and slides. In addition, I carried out extended, in-depth
interviews with at least one person in each household we visited.
Specifically, during the course of the three-month period we visited
thirty households, which included a representative cross-section of 'the
poor' (see Chapters 2 and 5) and 'the critically poor' (see Chapters 3
to 5) . I was particularly interested in discovering how the latter
manage to survive: according to the results obtained down the years by
the DANE, they do not generate sufficient resources to be able to avoid
malnutrition and starvation, let alone meet other costs such as rent and
medicines. These included the old living alone (5 interviews); the
mentally and physically disabled (3 and 4 interviews respectively); the
sick (6 interviews); and single-parent families, large and small, in
which the parent was both unemployed and without education (3 interviews
with small families - one or two children - and 3 with large families -
3 or more children) . I was not able to construct a more formal sample-
frame because of security problems in parts of the district: certain
areas of the district were considered 'no-go areas' by the police, who
advised me, on repeated occasions throughout my stay in Cali, neither to
enter them nor to carry out interviews there. This was unfortunate, for
these areas are also inhabited by poor and critically poor households
and so my research would have benefited from interviews with household
members there. As it is, the conclusions in the text regarding the
'survival strategies' of the poorest are limited to results obtained
through interviews with individuals in areas representing only part -
approximately half, according to the latest (Janaury 198 6) map of Agua
Blanca drawn up by the Municipal Planning Department in Cali - of the
district.258

259
The tours of the neighbourhoods were a very valuable and informative
part of my fieldwork, for they gave me an opportinity to analyse, more
critically, the literature on poverty and its causes and solutions. And
knowing the regular aid workers - from the Catholic Church as well as
from various national government and foreign agency programmes - gave me
an 'entry1 into the neighbourhoods, which meant that I was immediately
accepted by all those people we visited and by everyone else in the
respective neighbourhoods. On some occasions it was felt, by the regular
aid workers, 'easier' not to explain why I was there - and so frequently
I would be variously introduced as a visiting North American priest or a
long-standing friend of one of the aid workers. Without this 'entry' it
would have been both difficult and dangerous (in many of the
neighbouhoods we entered neither the police nor strangers would venture)
for me to have either observed or to have conducted interviews.
vi) the 'International Centre of Tropical Agriculture' (CIAT), which has
its Head Office in Cali. This is a large research centre funded
principally by the Kellog Foundation, the United Nations and the
governments of the United States, Japan and Northern Europe. I was
kindly given access to their library, which is exceptionally well-
stocked with publications on Colombian economic and social trends. In
addition, I worked, throughout the month of November 1990, with
economists and sociologists at the centre, exchanging ideas and data on
(rural) poverty and income distribution in Colombia and Latin America.
vii) local government officials - architects, planners, researchers -
who furnished me, during frequent visits to the Municipal Office259

260
throughout my six-month stay in the country, with data .and information
on public transport subsidies, the structure of public- utility charges
and the overall state of the infrastructure in the south-western
corridor of the country.
viii) the Director of 'The Human Ecology Research Foundation', based in
Cali. The work of the Foundation was of interest to me because, as part
of a longitudinal study on the health-status of the poor in Cali through
the 197 0's, they produced data which can be used to estimate social and
economic mobility in Colombia (discussed in Chapter 2) . I carried out,
in November 1990, an extended interview with the Director, who kindly
gave me access to all the Foundation's unpublished data.
During my time in Bogota, approximately three months, I also worked with
a number of different organisations:
i) the Permanent United Nations Programme on Poverty in Latin America,
which has its continental Head Office in Bogota. In the course of three
visits to the Head Office in February 1991 I talked to researchers
attached to the Programme and was kindly given access to unpublished
data.
ii) the principal social and economic research organisation in Colombia,
known as ' Fedesarrollo' . Its library and data bank are second-to-none
for anyone researching into Colombian social and economic trends. The
centre is privately funded. Its present Director, Miguel Urrutia, as
well as being an ex-Energy Minister, is one of the principal authorities260

261
on Colombian poverty and income distribution. On 15/02/91 I carried out
an extended interview with him, in which I gained a greater
understanding of all aspects of my research, especially to do with
possible causes through the 1980’s of movements in Colombian inequality.
iii) the National Planning Department (DNP) - a government ministry -
where I gained access to unpublished reports on urban and rural poverty.
iv) the national petroleum company (Ecopetrol) to research the influence
of subsidised gasoline sold in Colombia upon income distribution. The
financial section of the company kindly either gave me the relevant
information or told me where I could get it. I also carried out, in the
Head Office of Ecopetrol in Bogota on the 23 of April 1991, an extended
interview with the head of the section concerned with gasoline
subsidies.
v) a private research centre, known as INVAL, which for a number of
years has provided consultancy work for the Colombian Government and the
United Nations. Of late, it has been concentrating on the 'informal1, or
'marginal' sector in Colombian cities, recently having attempted a head
count of street traders. Its head is a sociologist, with whom I spent
three very informative and stimulating days at the centre's Bogota
offices (between 21 - 23 of February 1991 inclusive).
As well as the above, I was lucky enough to be in Cali in December for
the 1990 annual conference of the Colombian Sociological Association -261

262
held in the offices of the National Bank of Colombia! Here I made some
invaluable contacts from all over Colombia and discussed my research at
length with Colombian social scientists working in university and
government departments.
b) A summary of the principal data sources made use of in the report.
The 1985 Census
The Census was carried out in October 1985. Its official title was 'The
XV Census of the Population and the IV of Households'. A post-Census
exercise by the Centro Nacional de Consultoria (CNC) to gauge the
quality of the Census, using a sample of 28,000 households, found that
coverage rates were low - 90.5% for urban areas and 73.7% for rural
areas. However, the cartographic information used in this sample,
especially for the rural areas, has since been questioned, on the
grounds that it was not up-to-date. A subsequent exercise by the CNC,
asking householders whether or not their household had been counted in
the Census, found coverage rates to be slightly higher: 94.5% in the
urban areas and 83.8% in the rural areas.
Coverage rates differ greatly across regions. The north-eastern262

263
department of La Guajira, for example, has a large indigenous
population, many of whom are itinerant; counting and surveying such a
population is more difficult than in, say, consolidated urban
neighbourhoods. Other regions in which it is difficult to survey the
population accurately include: a) those of low demographic density,
which are likely to be of rugged terrain and to have very limited road
access. These areas are also likely to have high indices of poverty,
which implies that overall levels of poverty found from the Census
results are underestimates; b) those in which guerrilla and/or drug-
related violence is known to be common: for obvious reasons of security,
personnel associated with the Census are loathe to enter such zones; c)
those, predominantly urban, areas with high population growth rates as a
result of immigration. The fact that the city maps used for the 1985
Census were the same as those for the 1973 Census meant that relatively
new neighbourhoods, often 'invasions', were not always included in the
former.
Something else which compromised the quality of the 1985 Census was
that it did not immobilise the population, as the 1973 Census had done.
This meant that a greater proportion of responses were from third
persons, who may not, for example, have know the exact age of another
member of the household or indeed have been aware of the precise nature
of the intra-household family links.
Unfortunately for the purposes of this report, the 1985 Census,
unlike those in 1967 and 1973, did not include a question on income,
though it did ask all the necessary questions for us to be able to
construct the NBI poverty index.
263

264
The 1984/5 Survey of Incomes and Expenditures
This survey was carried out by the DANE as the first step in the up
dating of the Consumer Price Index (IPC) for January 1989. Happily, the
questions it asked on incomes and expenditures enable an income
distribution profile to be constructed - for individuals and households.
Its sample frame, though, was restricted to the principal (15) urban
centres - excluding the cities of Santa Marta and Armenia - of the
country, each with more than 100, 000 inhabitants. The size of the
samples chosen for each city was dictated by the requirement of the DANE
to reach a confidence level for the estimates obtained of 90%, with a
maximum permissible error of 5%. The final sample was of 28,704
households.
The 1988 Survey of Rural Households
This was carried out in November and December of 198 8, with a sample of
7,104 households stratified across the four geographical regions of
Atlantica, Oriental, Central and the Pacific. Its aim was to collect
demographic and employment data for the rural areas, with a view,
amongst other things, to estimating rural poverty levels.
The concept of 'rurality1 used in the survey differs slightly from264

265
earlier surveys, such as in the five Rural-Urban DANE Household Surveys
carried -out between 197 0 and 1974 and the 197 8 Survey of Rural
Households. In all of these, only the 'scattered rural populations' were
included in the sample. The 1988 survey, by contrast, also included
'semi-rural' communities, specifically those with "houses and buildings
constructed contiguously and delimited by streets; and with the presence
of civil authorities", as well as communities characterised as "a
consolidated, almost urban, area with houses constructed in a 'semi-
disperse' manner; and with a place name which clearly identifies the
settlement". (Source: Boletin de Estadistica, no.436, July 1989, pl32.
My translations).
As a result of the different sample frames, only the 'scattered rural
populations' are directly comparable between the various surveys. The
wider net of the 1988 survey is useful, though, in that it incorporates
the expanding, semi-rural labour markets which have become increasingly
important sources of residence and employment in 'rural' areas.
Household Surveys
At the beginning of the 1970's the DANE began a permanent programme of
National Household Surveys, with the aim of collecting statistical data
on the individual, the family and the household during the intercensual
periods. Initially, the proposal was to construct a national sample of
12,000 households, to be surveyed every four months. Sadly, budgetary265
266
and technical restrictions prevented such an ambitious start.
As a compromise, the surveys were to be at four monthly intervals -
in 1976 they became trimestrial - but the sample frame was restricted to
the principal cities. The following were, and continue to be, the areas
of interest: the general characteristics of the population (sex, age,
civil status, family size); education (literacy, school attendance,
educational level) ; the work force, taken to be those of 12 years and
over (employment, unemployment, underemployment, occupation,
occupational position, etc). Through the years, the Household Survey has
come to collect data on other themes. These include migration, housing,
nutrition, expenditures on food and the informal sector.
The Household Survey programme has helped to give the DANE valuable
experience in data collection techniques and problems, such that it has
come a long way since the Census of 1967, which has been roundly
criticised for its poor quality (see, for example, Urrutia 1985).
However, the programme could be improved, firstly, by including the
rural and semi-rural areas in the sample. Secondly, by reducing the size
of the sample, which at present stands at 30,000 households in each
survey. A recent World Bank mission (1989) to Colombia stated that "[the
DANE] does not need such a large sample to obtain accurate results".
(plO). Indeed, considering the present budgetary problems being
experienced by the DANE, the cost reductions from using a smaller sample
would be welcomed.
266

Appendix 2 Measures of Inequality
The measures of inequality that have been used in the report are Income
Shares, the Gini Coefficient and the Theil Index. Since none is a
perfect measure of inequality, each one with certain specific merits, it
is useful to employ them all simultaneously to determine the extent of
inequality and the direction of change in inequality over time. As far
as possible, this has been the approach in the report. Thus, in this
appendix, which aims to give the reader an intuitive grasp of the
different measures, the strengths and weaknesses of each measure will be
discussed.
The Income Share measure slices the population into percentile
groups, frequently deciles or quintiles, and then looks at the
proportion of total income appropriated by each group. Taking quintiles,
a value of 0.20 for each of the bottom 20% and top 20% would imply
perfect equality or zero inequality, while values of zero and unity for
the bottom 2 0% and the top 2 0%, respectively, would mean perfect
inequality in the income distribution. Income shares permit us to focus
on the impact of the development process over different ranges of the
income distribution, in this way allowing a 'winners and losers' profile
to be constructed. This is the principal strength of the Income Shares
measure: it captures the whole distribution, or "the full arithmetical
array." (Wiles, 1974. p.ix). It cannot, however, give a summary index of
inequality; that is, an idea of the overall degree of income
concentration in a population.

268
For this the Gini Coefficient is employed. It is. essentially a
formula to calculate the average of (income) differences-. The origin of
the Gini coefficient - first discussed in C. Gini (1912) - is probably
the work of F.R. Helmert (1876), who discussed the ordinally equivalent
measure, now known as Gini's mean difference. Formally, the Gini
coefficient is the ratio of the area bounded by a Lorenz curve (see M.
0. Lorenz, 1905) and the diagonal to the area of the triangle. The
coefficient is 1 when all income is controlled by one person, and 0 when
everyone has the same income.
As a summary measure of income distribution the Gini coefficient, or
ratio, presents several difficulties. Firstly, because two different
Lorenz curves may intersect, it follows that significantly different
distributions, and therefore "societies of radically different social
structure" (Wiles, 1974. pll), may yield identical Gini ratios.
Secondly, the Gini ratio, because it is an average, is insensitive both
to extremes and to shifts of a small percentage of total income from one
group to another; such shifts may represent large income variations,
especially for the lower-income groups. Its relative insensitivity tends
to give it a limited variation across countries, which makes it
difficult to identify statistically significant relationships. Thirdly,
the boundaries of perfect inequality and equality are so extreme that
meaningful changes in the level of inequality may correspond to only
small changes in the Gini ratio, making it somewhat difficult to
interpret.
Why, then, use the Gini coefficient at all, considering such a litany
of limitations? Some researchers, invoking one or more of its drawbacks,
do indeed decline to use it. This seems an overly drastic step, in view

269
of how well-known and simple to calculate the Gini is; .the first means
that at least a rough idea of the degree of inequality in and across
distributions can be gauged, the second that it is not a great
sacrifice, in terms of time, to arrive at the Gini's value. Of course,
the Gini will not tell you where the inequality is in a distribution,
but for this we can use the Income Share measure.
Finally, the Theil Index (see Theil 1967, for a technical explanation
of the Index) . This, like the' Gini, is a weighted index of income
concentration, and so shares its strengths and weaknesses. Its
particular strength, taken advantage of in this report, is that it can
calculate the contribution of a subgroup in a population to overall
inequality. For example, the extent to which inequality in a particular
city contributes to overall inequality in all cities; and, equally,
whether intra-city inequalities are more important in explaining overall
inequalities in cities than inter-city inequalities.
The Theil's minimum value is zero (perfect equality) and its maximum
value is 1.61 (perfect inequality).

Bibliography
Adelman, I. and Morris, C. T. 1973. "Economic Growth and Social Equity in Developing Countries." Stanford University Press, Stanford.
Ahluwalia, Montek S. 1976. "Inequality, Poverty andDevelopment." Journal of Development Economics, No. 3, 1976.
Ahluwalia, Montek S. and Carter, Nicholas G. 1979. "Growth and Poverty in Developing Countries." In Chenery, H. (ed.) 'Structural Change and Development Policy', 1979,Oxford University Press.
Ahluwalia, Montek S. et al. 1980. "Who Benefits From Economic Development?: Comment." The American Economic Review, Volume 70, No. 1, March 1980.
Altimir, Oscar. - 1981. "Poverty in Latin America." CEPAL [ECLA] Review, April 1981.
- 1982. "Poverty in Latin America." World Bank Staff Working Paper, No. 522, Washington, D.C.
- 1987. "Income Distribution Statistics in Latin America and Their Reliability." The Review of Income and Wealth, Series 33, No.2, June 1987.
Altimir, Oscar and Sourrouille, Juan. 1980. "Measuring Levels of Living in Latin America: An Overview of Main Problems." World Bank Living Standards Measurement Study, Working Paper No. 3.
Anand, Sudhir. 1983. "Inequality and Poverty in Malaysia: Measurement and Decomposition." New york: Oxford University Press.
Atkinson, A. B. 1974. "Unequal Shares: Wealth in Britain." Penguin Books, England.
Baran, Paul A. 1957. "The Political Economy of Growth." Calder.
Bejarano, Jesus. 1989. "Empleo y Distribucion de Ingresos en el Sector Rural." Revista de Planeacion y Desarrollo, Volume XXI, Nos.1 and 2, June-January 1990. Bogota.
Berg, Elliot (ed.). 1988. "Policy Reform and Equity."

271San Francisco, California: ICS Press.
Berlin, I. 1961. "Equality." In Olafson, F. (ed.), 'Justice and Social policy1, Spectrum Books.
Berry, Albert. 1990. "International Trade, Government and Income Distribution in Peru Since 1870." Latin American Research Review, Volume XXV, No. 2, 1990.
Berry, Albert and Soligo, Ronald (eds.). 1980. "Economic Policy and Income Distribution in Colombia." Westview.
Berry, Albert, and Urrutia, Miguel. 1976. "Income Distribution in Colombia." New Haven and London,Yale University Press.
Blau, P. and Duncan, O. 1967. "The American Occupational Structure." Wiley, New York.
Boltvinik, Julio. 1990. "Necesidades Basicas y Pobreza: Conceptos y Metodos de Medicion." Paper delivered to the conference on 'Latin American Social Surveys', Bogota, 28-30 March 1990.
Bonilla, Maria, et al. 1989. "Sistema de Indicadores Sociales Sobre la Evolucion de la Pobreza Absoluta en Colombia: El Caso de la Pobreza de la Region Nortecaucana." Universidad del Valle, Cali/DANE, April1989.
Bonilla, Maria. 1988. "Pobreza Rural Colombiana: ElCampesinado Nortecaucano." Universidad del Valle, Cali, March 1988.
Boudon, Raymond. 1974. "Education, Opportunity and Social Inequality." John Wiley and Sons, Inc.
Bourguignon, F. - 1978. "Pobreza y Dualismo en el Sector Urbano de las Economias en Desarrollo: el Caso de Colombia." Desarrollo y Sociedad, January 1978.
- 1983. "The Role of Education in the Urban Labour Market During the Process of Development: the Case of Colombia. In Urquidi, V. and Trejo, S. (eds.) 'Human Resources, Employment and Development' (Volume 4).
Brundenius, Claus. 1984. "Revolutionary Cuba: The Challenge of Economic Growth With Equity." Boulder, Colo.: Westview Press.
Brundenius, C. and Zimbalist, A. 1989. "The Cuban Economy: Measurement and Analysis of Socialist Performance." Baltimore: John Hopkins University Press.

272Campano, F. and Salvatore, D. 1988. "Economic Development, Income Inequality and Kuznets1 U-Shaped Hypothesis." Journal of Policy Modeling, No. 10 (2), 1988.
Cartier, William and Reina, Mauricio. 1989. "Desigualdad y Pobreza en Colombia." in 'La Democracia en Blanco y Negro: Colombia en los Ochenta', Patricia Vasquez de Urrutia (Ed.). 1989. Bogota: Ediciones Unidades.
Centro Internacional de Agricultura Tropical. [CIAT]. 1988. "Participacion de alimentos en el gasto total." Rice Department, Cali, Colombia. Unpublished figures made available to the author.
Chenery, H. et al. (eds.). 1974. "Redistribution WithGrowth." New York: Oxford University Press.
Contraloria General de la Republica. 1990. "Informe Financiero." August 1990. Bogota.
Corchuelo, Alberto. 1990. "La Tienda en la ActividadEconomica de la Ciudad de Cali." Boletin Socioeconomico, No. 20, April 1990.
Cowell, F. A. 1977. "Measuring Inequality." Philip Allen Ltd.
Cuddington, John, and Urzua, Carlos. 1989. "Trends and Cycles in Colombia's Real GDP and Fiscal Deficit."Journal of Development Economics, 30 (1989), pp.325-343.
Currie, Lauchlin. 1984. "La Situacion Macroeconomica deColombia." Desarrollo y Sociedad, Nos.15 and 16, Sept 1984 - March 1985.
DANE: - Boletin de Estadistica. Various issues between 1978 and 1990.
- Cartographic Breakdown of the 1973 and 1985 Census Samples. Bogota, 1987.
- Census, 1985. Bogota, 1986.
- Colombia Estadistica. Annual editions between 1978- 1990. Bogota.
- Cuentas Nacionales de Colombia 1970-1989. Bogota, September 1990.
- Evaluacion de la Calidad y Cobertura del Censo [1985]. Bogota, Sept. 1990.
- "Indicadores de Pobreza 1986 - 1990." Feb. 1991. Unpublished estimates provided to the author.

273
- "La Pobreza en Bogota - 1985." Bogota, April 1989.
- '.'Poverty in Colombia." 1989. Volumes I and II. - Bogota, June 1989.
Departamento Nacional De Planeacion. - 1975. "Para Cerrar la Brecha: Plan de Desarrollo Social, Economico y Regional 1975-197 8." Bogota: Banco de la Republica.
- 1980. "Plan de Integracion Nacional: 1979-1982." Bogota.
- 1983. "El Programa DRI-PAN en el Plan de 'Desarrollo con Equidad'." in Revista Nacional de Agricultura, SAC, No. 863, June 1983.
- 1987. "Plan deEconomia Social." Editorial Presencia Ltda., Bogota.
Deyo, Frederic C. 1989. "Beneath the Miracle: Labour Subordination in the New Asian Industrialism."University of California Press.
Duncan, O. et al. 1972. "Socioeconomic Background and Achievement." Seminar, New York.
Drug Enforcement Administration (DEA), United States.Various Documents.
Durkheim, E. 1964. "The Division of Labour in Society." London.
El Tiempo [Colombian national daily newspaper]. Various editions 1978-1990.
El Espectador [Colombian national daily newspaper]. Various editions 1978-1990.
Featherman, D. and Stevens, G. 1982. "A RevisedSocioeconomic Index of Occupational Status: Application in Anaysis of Sex Differences in Attainment." In Hauser, R.M. et al, 'Social Structure and Behaviour1, New York: Academic Press.
Fedesarrollo. 1990. "Deuda Social." Debates, No. 2, July 1990.
Fei, J. Ranis, G. and Kuo, S. 1979. "Growth With Equity: the Taiwan Case." Oxford University Press.
Felix, David. 1983. "Income Distribution and the Quality of Life in Latin America." Latin American Research Review,

274Volume XVIII, No. 2, 1983.
Fields, Gary S. - 1980. "How Segmented is the Bogota Labour Market?" World Bank Staff Working Paper, No. 434, Washington, D.C.
- 1981. "Poverty, Inequality and Development:A Distributional Approach." Journal of Policy Modeling, No. 3, (3), 1981.
Fields, G.S. and Schultz, T. Paul. 1980. "Regional Inequality and Other Sources of Income Variation in Colombia." Economic Development and Cultural Change,Volume 28, No. 3, April 1980.
Fishlow, Albert. 1972. "Brazilian Size Distribution ofIncome." The American Economic Review, Volume LXII, No. 2, May 1972.
Food and Agricultural Organisation [FAO]. 1973. "Energy and Protein Requirements." Report of a joint FAO-WHO Ad Hoc Expert Committee, Rome.
Food and Nutrition Board. 1980. "Recommended Dietary Allowance." Washington, D.C.
Fundacion Carvajal. 1989. "Annual Report." Cali, Colombia.
Garcia, Jorge. - 1980. "La Situacion de Desnutricion en Colombia." Desarrollo y Sociedad, No. 4, July 1980, pp.335-357.
- 1991. "Agricultural Prices and Wages in Colombia: Impact of the Coffee Boom and Government Expenditures." Food Policy, Volume 16, No. 1, Feb. 1991.
Giddens, Anthony. 1971. "Capitalism and Modern Social Theory." London: Cambridge University Press.
Gillis, Malcolm and McLure, Jr., Charles. 1978. "The 1974 Colombian Tax Reform and Income Distribution." Journal of Development Economics, No. 5 (1978) .
Gini, C. 1912. "Variabilita e Mutabilita." Bologna.
Glewwe, P. and Van der Gaag, J. 1990. "Identifying the Poor in Developing Countries: Do Definitions Matter?" World Development, Volume 18, No. 6, June 1990.
Gomez, Hernando. 1990. "El Tamano del Narcotrafico y su Impacto Economico." Economia Colombiana, Nos.226-227,Feb.-March 1990.
Graciarena, Jorge. 1976. "Types of Income Concentration and

275Political Styles in Latin America." CEPAL [ECLA] Review, Second Half of 1976.
Granovetter, Mark. - 1992a. "Introduction," pp. 1-26 in-Mark Granovetter and Richard Swedberg, "The Sociology of Economic Life." Westview Press, Inc.
- 1992b. "The Sociological and Economic Approaches to Labour Market Analysis: A Social Structural View," pp. 233-263 in Mark Granovetter and Richard Swedberg, "The Sociology of Economic Life." Westview Press, Inc.
Gupta, Gir S. and Singh Ram D. 1984. "Income Inequality Across Nations Over Time: How Much and Why?" Southern Economic Journal, No. 51, 1984.
Hanson, James A. 1987. "Growth and Distribution in Colombia: Some Recent Analyses." Latin American Research Review, Volume 22, No. 1.
Hardinghaus, Nicolas H. 1989. "Droga y CrecimientoEconomico." Nueva Sociedad, No. 102, July-August. Caracas.
Helmert, F. R. 1876. "Die Berechnung des wahrscheinlichen Beobachtungsfehlers aus den ersten Potenzen dur Differenzen gleichgenauer direkter Beobachtungen." Astronomische Nachrichten, 88.
Heinz, Wolfgang S. 1989. "Guerrillas, Political Violence, and the Peace Process in Colombia." Latin American Research Review, XXIV, No.3, September 1989.
Hobsbawm, E.J. 1963. "The Anatomy of Violence." New Society, No. 28, 11/04/63.
Instituto Colombiana de Bienestar Familiar (ICBF). - 1989. "Diagnostico Evaluativo de los Hogares de Bienestar: Distrito de Aguablanca, Cali, Colombia." Cali, Colombia.
- 1990."Proyecto Hogares de Bienestar." Cali, Colombia.
Inter-American Development Bank. 1988. "Economic and Social Progress in Latin America." Washington, D.C.
International Labour Organisation [ILO]. 1970. "Towards Full Employment: A Programme For Colombia." Geneva.
International Labour Organisation [ILO] and the Regional Programme for Employment in Latin America and the Caribbean [PREALC]. 1990. "La Deuda Social en los Ochenta." Santiago, Chile.
276
International Monetary Fund. [IMF]. August 1991. "Colombia: Economic Adjustment and the Poor." Prepared by Claire Liuksila. Unpublished Manuscript provided to the author.
Kalmanovitz, Salomon. - 1988. "Tributacion, Ahorro e Inversion." Economia Colombiana, No. 204, April 1988.
- 1990. "La Economia del Narcotrafico en Colombia." Economia Colombiana, Nos.226-227, Feb.-March 1990.
Kravis, Irving B. - 1960. "International Differences in the Distribution of Income." Review of Economics and Statistics, November 1960.
- 1962. "The Structure of Income: Some Quantitative Essays." University of Pennsylvania.
Kugler, B., Bernado A. R., and Gomez, M. I. 1979. "Educacion y Mercado de Trabajo Urbano en Colombia: Una Comparacion Entre Sectores Moderno y no Moderno." Monograph 10,Bogota: Corporacion Centro Regional de Poblacion.
Kuznets, Simon. - 1955. "Economic Growth and IncomeInequality." The American Economic Review, Volume XLV,No. 1, March 1955.
- 1963. "Quantitative Aspects of the Economic Growth of Nations." Economic Development and Cultural Change, Volume XI, No. 2, Part II, January 1963.
- 1966. "Modern Economic Growth." Yale University Press.
Latin American Special Reports. 1990. "Foreign Investment in the Region." SR-90-04, August 1990.
Legislacion Economica. Various issues between 1988 - 1990. Legis Publications, Bogota.
Lenski, Gerhard E. 1966. "Power and Privilege: A Theory of Social Stratification." McGraw-Hill Book Company, New York.
Lewis, W. Arthur. - 1954. "Economic Development with Unlimited Supplies of Labour." In 'Selected Economic Writings of W. Arthur Lewis', 1983, New York University Press.
- 1976. "Development and Distribution." In 'Employment, Income Distribution and Development Strategy' Cairncross, A. and Puri, M. 1976, London Macmillan.
277Lipset, S. and Bendix, R. 1959. "Social Mobility in
Industrial Society." University of California Press, Berkeley.
Lipset, S.M. and Smelser, N.J. (eds.) 1966. "SocialStructure and Mobility in Economic Development." Aldine Publishing Company.
Lipset, Seymour Martin - 1963. "Political Man: The Social Bases of Politics." New York.
- 1978. "From Abundance to Scarcity: Implications for the American Tradition." Ohio State University Press.
Lipton, Michael. 1988. "The Poor and the Poorest." World Bank, Washington, D.C.
Londono, Juan L. - 1989. "Distribucion Nacional del Ingreso en 1988: Una Mirada en Perspectiva." Coyuntura Social,No. 1, December 1989.
- 1990. "Income Distribution During the Structural Transformation: Colombia 1938 - 1988." Research Report, Harvard University, September 1990.
Lopreato, J. and Hazelrigg, Y. 1972. "Class, Conflict and Mobility." Chandler, San Francisco.
Lorenz, M. O. 1905. "Methods of Measuring the Concentration of Wealth." Quarterly Publications of the American Statistical Association, No. 70, June 1905.
Marx, Karl. 1970. "Capital I." London: Lawrence and Wishart.
Marx, Karl and Engels, Frederick. 1970. "Manifesto of the Communist Party." In Marx, K. and Engels, F. 'Selected Works', London: Lawrence and Wishart, pp.31-63.
Matthews, M. 1986. "Poverty in the Soviet Union." Cambridge University Press.
McGreevey, William P. 1971. "An Economic History of Colombia 1810-1930." Cambridge: Cambridge University Press.
McKay, Harrison, et al. 197 8. "Improving Cognitive Ability in Chronically Deprived Children." Science, April 1978, Volume 200, pp.270-278.
McNamara, Robert S. 1981. "The McNamara Years at the World Bank: Major Policy Addresses of Robert S. McNamara, 1961- 1980." John Hopkins.
Midgley, J. 1984. "Social Security, Inequality and the Third

278World." John Wiley and Sons, Ltd.
Ministry of Agriculture, Bogota. 1990. "EL Desarrollo Agrop- ecuario en Colombia." Volume I, Editorial Presencia.
Ministry of Mines and Energy, Bogota. Various Legal Decrees, between 1985-1990, on the price, tax and subsidy levels of gasoline. Published by the Ministry itself, Bogota.
Mohan, Rakesh. - 198 0. "The People of Bogota: Who They Are, What They Earn, Where They Live." World Bank Staff Working Paper No. 390, Washington, D.C.
- 1986. "Work, Wages and Welfare in a Developing Country". Oxford University Press.
Mohan, Rakesh and Hartline, Nancy. 1984. "The Poor ofBogota: Who They Are, What They Do, and Where They Live." World Bank Staff Working Paper No. 635, Washington, D.C.
Mohan, Rakesh, Wagner, Vilhelm and Garcia, Jorge. 1981."Measuring Urban Malnutrition and Poverty: A Case Study of Bogota and Cali, Colombia." World Bank Staff Working Paper No. 447, Washington, D.C.
Molina, Sergio. 1982. "Poverty: Description and Analysis of Policies for Overcoming it." CEPAL [ECLA] Review, December 1982.
Morawetz, David. 1981. "Why the Emperor's Clothes are not made in Colombia." Oxford University Press.
Moreno, Alvaro Alfonso. 1989. "La Distribucion del Ingreso Laboral Urbano en Colombia 1976 - 1988." Desarrollo y Sociedad, No. 24, Sept. 1989, pp.63-129.
Morley, Samuel A. 1982. "Labour Markets and Inequitable Growth: The Case of Authoritarian Capitalism in Brazil." Cambridge: Cambridge University Press.
Municipio de Santiago de Cali. 1990. "Diseno de las Estrategias Sociales del Plan de desarrollo de la Municipalidad de Cali." Cali, 29/10/1990.
Musgrave, Philip and Howe, Howard. 1973. "Estudio de Consumo e Ingreso Familiar." Programa de Estudios Conjuntos sobre Integracion Economica Latinoamericana [ECIEL], University of Chile, Santiago. April 1, 1973 (Revised Edition).
Myrdal, Gunner. 1957. "Economic Theory and Under-Developed regions." London.
Ochoa, Mario. 1983. "Hambre y Desnutricion en Colombia." Revista Nacional de Agricultura, SAC, No. 8 63, June 1983.
279
Oshima, Harry. 1962. "The International Comparison of Size Distribution of Family Incomes With Special reference to A s i a r e v i e w of Economics and Statistics, November 1962.
Papanek, G. and Kyn, 0. 1986. "The Effect on Income Distribution of Development, the Growth Rate and Economic Strategy." Journal of Development Economics,No. 23, 1986.
Parsons, Talcott and Smelser, Neil J. 1956. "Economy and Society: A Study in the Integration of Economic and Social Theory." The Free Press: New York.
Pastore, Jose. 1982. "Inequality and Social Mobility in Brazil." Madison: University of Wisconsin Press.
Paukert, Felix. 1973. "Income Distribution at Different Levels of Development: A Survey of Evidence."International Labour Review, Volume 108, Nos.2-3, August- Sept. 1973.
Pearce, Jenny. 1990. "Colombia: Inside the Labyrinth."Latin American Bureau, London.
Pecaut, Daniel. - 1985. "Orden y Violencia: Colombia 1930- 1954." Siglo Veintiuno Editores.
- 1987. "Cronica de Dos Decadas de Politica Colombiana." Siglo Veintiuno Editores. Bogota.
Portes, A. 1982. "Immigrants Attainment: An Analysis of Occupation and Earning Among Cuban Exiles in the United States." In Hauser, R. M. et al (eds.), 'Social Stucture and Behaviour', Academic Press, New York.
Presidencia de la Republica. 1988. "El Cambio Social: Realizaciones en la Lucha Contra la Pobreza Absoluta y para la generacion del Empleo." A collection of speeches given by President Virgilio Barco in 1987 and 1988.
Prieto Duran, Rafael. 1977. "Gasto e Ingreso Familiar Urbano en Colombia." Ensayos ECIEL, No. 4, Washington, D.C., August 1977.
Psacharopoulos, George. - 1973. "Returns to Education: An International Comparison." San Francisco, California: Elsevier International.
- 1980. "Returns to Education: An Updated International Comparison." 'Education and Income', Timothy King (ed.), World Bank Staff Working Paper,No. 402, Washington, D.C.

280Psacharopoulos, George, and Velez, Eduardo. 1990. "Una nota
sobre las tendencias de la tasa de retorno de la educacion en Bogota 1965 - 1988." Coyntura Social, No. 3, Nov. 1990.
Ranis,. Gustav. 1980. "Distribucion del Inreso y Crecimiento en Colombia." Desarrollo y Sociedad, No. 3, January 1980.
Rawls, John. 1971. "A Theory of Justice." Oxford University Press.
Reyes, Alvaro. 1988."Evolucion de la Distribucion de Ingreso en Colombia." Desarrollo y Sociedad, No. 21, March 1988.
Reynolds, L. G. 1985. "Economic Growth in the Third World: 1850 - 1980." New Haven: Yale University.
Rowthorn, Bob. 1980. "Capitalism, Conflict and Inflation: Essays in Political Economy." London: Lawrence and Wishart.
Saith, A. 1983. "Development and Distribution: A Critique of the Cross-Country U-Hypothesis.M Journal of Development Economics, 13.
Sanint, Luis R., et al. 1985. "Analisis de los patrones de consumo de alimentos en Colombia a partir de la encuesta de hogares DANE/DRI de 1981." Revista de Planeacion y Desarrollo, Volume XVII, No. 3., Sept. 1985.
Sarmiento, Eduardo. 1990. "Economia del Narcotrafico." Desarrollo y Sociedad, No. 26, Sept. 1990.
Sarmiento, Libardo. 1990. "Diez Anos sin Cambios." Economia Colombiana, No. 230, June-July 1990.
Selowsky, Marcelo. 1979. "Who Benefits from GovernmentExpenditure? A Case Study of Colombia." Oxford University Press.
Semana [Colombian current affairs weekly magazine]. Various issues between 1978 - 1990. Editorial Caribe, S.A.
Sewell, W. and Hauser, M. 1975. "Education, Occupation and Earnings." Academic Press, New York.
Silva, Colmenares. 1990. "Principales signos y perspect- ivas." Economia Colombiana, No. 230, June-July 1990.
Sjoberg, Gideon. 1966. "Rural-Urban Balance and Models of Economic Development." In Smelser, N. J. and Lipset, S. M. (eds.), 'Social Structure and Mobility in Economic Development', 1966. London: Routledge and Kegan Paul.
Smelser, N. J. and Lipset, S. M. (eds.). 1966. "Social

281Structure and Mobility in Economic Development."London: Routledge and Kegan Paul.
Soltow, Lee. - 1965. "Toward Income Inequality in Norway." University of Wisconsin Press.
- 1968. "Long-Run Changes in British Income Inequality." Economic History Review, April 1968.
Sombart, Werner. 1976. "Why is there no Socialism in the United States of America?" White Plains, New York. [This was first published, in German, in 1905].
Stepan, Alfred. - 1971. "The Military in Politics: Changing Patterns in Brazil." Princeton, N. J.: Princeton University Press.
- 1988. "Rethinking Military Politics:Brazil and the Southern Cone." Princeton, N. J.: Princeton University Press.
Stinchcombe, Arthur. 1990. "Interview," pp. 285-302 inRichard Swedberg, "Economics and Sociology: On Redefining Their Boundaries. Conversations with Economists and Sociologists." Princeton: Princeton University Press.
Subdireccion de Divulgacion Tributaria. [In which Colombian laws on taxation are published]. Various issues throughout 1980's Calle 98 No. 17-A-28, Bogota.
Sukhatme, P. V. 1978. "Assessment of Adequacy of Diets at Different Income Levels." Economic and Political Weekly 13 (31, 32; and 33 - special number).
Swedberg, Richard. - 1987. "Economic Sociology: Past and Present." Current Sociology, 35, no. 1:1-221.
- 1990a. "Economics and Sociology: On Redefining Their Boundaries. Conversations with Economists and Sociologists." Princeton: Princeton University Press.
- 1990b. "Socioeconomics and the New 'Battle of the Methods' - Towards a Paradigm Shift." Journal of Behavioural Economics, 19:141-154.
Tawney, R. H. 1964. "Equality." 5th Edition, George Allen and Unwin Ltd., London.
Theil, Henri. 1967. "Economics and Information Theory." Amsterdam: North Holland.
Titmuss, R. M. 1962. "Income Distribution and Social Change." London: George Allen and Unwin Ltd.

282
Tsakloglou, Panos. - 1988. "Development and Inequality Revisited." Applied Economics, No. 20, 1988.
- 1990. "Economic Development and the Income of the Poor." American Journal of Economics and Sociology, Volume 49, No. 1, January 1990.
United Nations:
- Economic Commission for Latin America. [ECLA]."Annual Economic Survey of Latin America and the Caribbean." Various issues throughout the 1970's and 1980's. ECLA, Santiago, Chile.
- United Nations Development Programme. [PNUD].1990. "Desarrollo sin Pobreza." Proceedings of the Programme's 'Second Regional Conference on Poverty in Latin America and the Caribbean', held in Quito, Ecuador, 20-23 Nov. 1990. Editorial Presencia Ltda., Bogota.
- ECLA. 1990. "Magnitude de la Pobreza en America Latina en los Anos Ochenta." Saniago, Chile, May 1990.
Urrutia, Miguel. - 1968. "Los Salarios Reales en Bogota." in CEDE, 'Empleo y Desempleo en Colombia', Bogota: Universidad de los Andes.
- 1979. "Tendencias en la Distribucion del Ingreso en la Proxima Decada." in 'La Economia Colombiana en la Decada de los Ochenta.' 1979, Fedesarrollo,Editorial Presencia, Bogota.
- 1985. "Winners and Losers in Colombia's Economic Growth of the 1970's." Oxford University Press.
- 1990. "Analisis Costo-Beneficio del Trafico de Drogas para la Economia Colombiana." Coyuntura Economica, October 1990. Bogota.
Velez, Eduardo. - 1989. "Origen Familiar, Educacion y Logros Ocupacionales." Discussion Document, No. 026, SER Research Institute, Bogota.
- 1990. "Educacion y Movilidad Social." Coyuntura Social, No. 3, 1990.
Villar, Leonardo G. 1990. "Ajuste y Vecinos en Problemas." Economia Colombiana, No. 230, June-July 1990.
Weber, Max. 1968. "Economy and Society." New York:Bedminster Press.
Weisskof, R. and Figueroa, A. 1976. "Traversing the Social

283Pyramid: A Comparative Review of Income Distribution in Latin America." Latin American Research Review, Volume.XI, No. 2, 1976.
Wells, John. 1983. "Industrial Accumulation and Living Standards in the Long-Run: The Sao Paulo Industrial Working Class, 1930-1975." The Journal of Development Studies, Volume 19, Nos.l and II, January and April 1983.
Wiles, Peter. 1974. "Distribution of Income, East and West." North Holland Publishing Company, Amsterdam and Oxford.
Williamson, J. 1985. "Did British Capitalism Breed Inequality?" Allen and Unwin Ltd.
Williamson, J. and Lindert, P. 1980. "American Inequality: A Macro-Economic History." New York: Academic Press.
World Bank. - 1984. "Colombia: Economic Development and Policy Under Changing Conditions." A World Bank Country Study, Washington, D.C.
- 1989. "Colombia: Programas Sociales y Eradicacion de la Pobreza." Report No. 7271-CO.
- 1990. "World Development Report 1990." Oxford University Press.


