93
Member of the Helmholtz Association Characterization of effective hydraulic properties of unsaturated porous media using spectral induced polarization (SIP) Katrin Breede

Mem
ber
of th
e H
elm
holtz
Ass
ocia
tion Characterization of effective hydraulic properties of unsaturated
porous media using spectral induced polarization (SIP)
Katrin Breede
Energie & Umwelt / Energy & EnvironmentBand/ Volume 175ISBN 978-3-89336-875-4

Schriften des Forschungszentrums JülichReihe Energie & Umwelt / Energy & Environment Band / Volume 175

Forschungszentrum Jülich GmbHInstitute of Bio- and Geosciences (IBG)Agrosphere (IBG-3)
Characterization of effective hydraulic properties of unsaturated porous media using spectral induced polarization (SIP)
Katrin Breede
Schriften des Forschungszentrums JülichReihe Energie & Umwelt / Energy & Environment Band / Volume 175
ISSN 1866-1793 ISBN 978-3-89336-875-4

Bibliographic information published by the Deutsche Nationalbibliothek.The Deutsche Nationalbibliothek lists this publication in the Deutsche Nationalbibliografie; detailed bibliographic data are available in the Internet at http://dnb.d-nb.de.
Publisher and Forschungszentrum Jülich GmbHDistributor: Zentralbibliothek 52425 Jülich Tel: +49 2461 61-5368 Fax: +49 2461 61-6103 Email: [email protected] www.fz-juelich.de/zb Cover Design: Grafische Medien, Forschungszentrum Jülich GmbH
Printer: Grafische Medien, Forschungszentrum Jülich GmbH
Copyright: Forschungszentrum Jülich 2013
Schriften des Forschungszentrums JülichReihe Energie & Umwelt / Energy & Environment, Band / Volume 175
D 5 (Diss., Bonn, Univ., 2012)
ISSN 1866-1793ISBN 978-3-89336-875-4
The complete volume is freely available on the Internet on the Jülicher Open Access Server (JUWEL) at www.fz-juelich.de/zb/juwel
Neither this book nor any part of it may be reproduced or transmitted in any form or by any means, electronic or mechanical, including photocopying, microfilming, and recording, or by any information storage and retrieval system, without permission in writing from the publisher.

iii
Acknowledgements
I firstly thank my promoter Prof. Andreas Kemna, Chairman of Applied Geophysics,
University of Bonn, and Prof. Harry Vereecken, head of IBG-3, Agrosphere,
Forschungszentrum Jülich for the opportunity and support to do this research.
This Ph.D. project would have let to nowhere without the support of Dr. Johann Alexander
Huisman.
I’m also very grateful for the support from the SIP workgroup of the IBG-3 institute. Our
meetings and numerous discussions helped me to overcome some problems.
I would like to thank all the people who were involved in the set-up of the laboratory
equipment as well as the measurements and analysis of the data. I especially thank Odilia
Esser who helped me with the experiments and for many hours of discussion about the
experiments and measurement results.
The support of Dr. Egon Zimmermann, Sander Huisman, Jürgen Höltkemeier, Dr. Roy
Kasteel, Andreas Kemna, Ferdinand Engels, and the staff of the IBG workshop was crucial
for constructing the measurement cells.
I’m thankful to Egon Zimmermann and Joachim Berwix for providing the electrical
impedance spectrometer and the measurement software. Whenever there was a problem with
the device or the software I could be sure that they would help me and solve the problem very
quickly.
I thank Ansgar Weuthen and Jürgen Höltkemeier for the setup of the Multi Step Outflow
device and programming the necessary software. Occurring problems with the equipment
were quickly solved by both of them so that the experiments could proceed without greater
interruptions.
I’m thankful to Prof. Dr. Jan Vanderborght for supporting me with help from the technical
staff for the set-up of the Multi Step Outflow equipment.
I would like to thank Anke Langen for measurements of the water content.
I’m very grateful to Prof. Dr. Gioia Falcone who allowed me to work further on my Ph.D.
thesis while I was starting my new job at the Clausthal University of Technology.
I especially thank Ansgar, Ferdi, Jutta, Odilia, Myriam and Jana for companionship.
Last but not least, a big thank-you to my husband, my family, and friends for their support
and encouragement.

iv
v
Abstract
Groundwater is a life-sustaining but vulnerable resource which is endangered by
contaminants. Soil acts as an important protective buffer for groundwater and, therefore, the
understanding of flow and transport processes in soils is of utmost importance. However, the
prediction capabilities of flow and transport models in the vadose zone are often limited due
to an insufficient knowledge about the structural and textural heterogeneity of the soil. To
obtain more information about soil structure, texture and heterogeneity, as well as hydraulic
parameters, non-invasive electrical methods may be employed in laboratory and field-scale
studies. One of the more promising electrical methods is spectral induced polarization (SIP),
which measures the complex electrical conductivity in the low-frequency range from 1 mHz
to 45 kHz. Recently, this method has been used to predict the saturated hydraulic conductivity
of consolidated and unconsolidated porous media. To better understand the mechanisms
causing polarization and to extend the range of SIP applications to the vadose zone, it is
important to investigate how the SIP response is affected by water content. In addition, it
might be possible to relate the SIP response to the unsaturated hydraulic conductivity.
Therefore, the general aim of this thesis is the determination of effective hydraulic properties
of unsaturated and unconsolidated porous media from SIP measurements.
In a first step, a laboratory measurement setup was developed that allows combined electrical
and hydraulic measurements on unconsolidated porous media. The experimental design
allows draining samples in various consecutive pressure steps and water outflow is
automatically recorded to determine the water content. Measurements of the complex
electrical conductivity are conducted using a high-accuracy electrical impedance
spectrometer. Experiments were conducted on unconsolidated quartz sand and three sand-clay
mixtures with 5, 10, and 20 weight-percent clay. The measured complex electrical
conductivity was interpreted using a Debye decomposition approach that provides the DC
resistivity, the total chargeability, and a distribution of relaxation times.
The influence of water content on electrical properties like real and imaginary part of the
complex electrical conductivity, phase shift, and the parameters obtained from Debye
decomposition was investigated for all four artificially mixed sediment samples. The
measured resistivity magnitude and phase spectra and their dependence on water content are
clearly different for each mixture. For pure sand, the phase values increased with decreasing
water content over the entire frequency range and a phase peak appeared for moderate to low
water content. The phase spectra of the sand-clay mixtures show the same behavior as the
pure sand. In addition, a shift of the phase peak to higher frequencies with decreasing water
saturation was observed for all samples. This shift suggests that relaxation time and length
become smaller with decreasing water content, which is related to the smaller pores that are
still saturated at lower water content.
The relationship between unsaturated hydraulic properties and SIP parameters was also
investigated. The results show a clear power-law relationship between the matric potential and
the peak relaxation time of the sand-clay mixtures. However, two different slopes were
observed for this relationship, one for matric potentials greater than -120 cm and another one
for smaller ones. The observed slope was quadratic for matric potentials > -120 cm and linear
for matric potentials below -120 cm. The quadratic relationship was attributed to diffusion
processes, but the linear relationship indicates a hitherto unknown relaxation process. Using
the empirical relationship between the relaxation time and the matric potential, respectively
pore radius, and a simplified version of the Mualem-van Genuchten model, a relationship
between the relaxation time and the unsaturated hydraulic conductivity was obtained. The

vi
slope of this power-law dependence between unsaturated hydraulic conductivity and
relaxation time depends on the width of the pore size distribution as expressed by the semi-
empirical n parameter of the Mualem-van Genuchten model. It was concluded that the
unsaturated hydraulic conductivity can be determined from spectral induced polarization
using the relaxation time and additional information like the n parameter of the Mualem-van
Genuchten model.
vii
Zusammenfassung
Grundwasser ist eine lebenserhaltende aber empfindliche Ressource, die durch
Kontaminationen gefährdet ist. Boden ist ein wichtiger schützender Puffer für Grundwasser.
Das Verständnis von Fließ- und Transportprozessen in Böden ist daher von besonderem
Interesse. Die Vorhersagefähigkeiten von ungesättigten Fließ- und Transportmodellen in der
ungesättigten Zone sind jedoch oft begrenzt aufgrund von ungenügender Kenntnis über die
strukturelle und texturelle Heterogenität des Bodens. Um mehr Informationen über
Bodenstruktur, -textur und –heterogenität, als auch hydraulische Parameter zu erzielen,
können nicht-invasive geoelektrische Methoden in Labor- und Feldstudien angewendet
werden. Eins der mehr versprechenden elektrischen Verfahren ist die Spektrale Induzierte
Polarisation (SIP), die die komplexe elektrische Leitfähigkeit im Niedrigfrequenzbereich von
1 mHz bis 45 kHz misst. In der letzten Zeit wurde diese Methode verwendet um die gesättigte
hydraulische Leitfähigkeit von verfestigten und unverfestigten porösen Medien
vorherzusagen. Um die Polarisationsmechanismen besser zu verstehen und die Bandbreite der
SIP-Anwendungen in der ungesättigten Zone zu erweitern, ist es wichtig die Beeinflussung
der SIP Antwort vom Wassergehalt zu untersuchen. Des Weiteren ist es vielleicht möglich
SIP Ergebnisse mit der ungesättigten hydraulischen Leitfähigkeit zu verknüpfen. Aus diesem
Grund ist das Hauptziel dieser Doktorarbeit die Bestimmung von effektiven hydraulischen
Eigenschaften von ungesättigten und unverfestigten porösen Medien mit Hilfe von SIP
Messungen.
In einem ersten Schritt, wurde ein Labormessplatz entwickelt, der kombinierte elektrische und
hydraulische Messungen an unverfestigten porösen Medien zulässt. Das experimentelle
Design ermöglicht es Proben in mehreren aufeinander folgenden Druckstufen zu entwässern
und den Wasserausfluss automatisch aufzuzeichnen um den Wassergehalt zu bestimmen.
Messungen der komplexen elektrischen Leitfähigkeit werden mit Hilfe eines elektrischen
Impedanzspektrometers mit hoher Messgenauigkeit durchgeführt. Experimente an einem
unverfestigten Quarzsand und drei Sand-Ton-Gemischen mit 5, 10 und 20 Gewichtsprozent
Ton wurden durchgeführt. Die gemessene komplexe elektrische Leitfähigkeit wurde mit Hilfe
einer Debye-Zerlegung interpretiert, die DC Widerstand, Aufladbarkeit und
Relaxationszeitverteilung zur Verfügung stellt.
Der Einfluss des Wassergehalts auf elektrische Parameter wie Real- und Imaginärteil der
komplexen elektrischen Leitfähigkeit, Phasenverschiebung und Debye Parameter wurde für
alle vier künstlich gemischten Sedimentproben untersucht. Die Amplitude des spezifischen
elektrischen Widerstands, der Phasenspektren und deren Abhängigkeit vom Wassergehalt
sind für jede Probe unterschiedlich. Im Falle des reinen Sandes nimmt die Phase mit
abnehmendem Wassergehalt über den kompletten Frequenzbereich zu und ein
Phasenmaximum ist bei mittleren bis niedrigen Wassergehalten vorhanden. Die
Phasenspektren der Sand-Ton-Gemische zeigen das gleiche Verhalten wie der Sand;
allerdings tritt zusätzliche eine Verschiebung des Phasenmaximums zu höheren Frequenzen
auf. Diese Verschiebung lässt die Folgerung zu, dass Relaxationszeit und –länge kleiner
werden, wenn der Wassergehalt abnimmt, was im Zusammenhang mit den kleineren Poren
steht, die bei niedrigem Wassergehalt noch gesättigt sind.
Zusätzlich wurde der Einfluss der effektiven ungesättigten hydraulischen Eigenschaften auf
die SIP Parameter untersucht. Die Ergebnisse zeigen eine klare Potenzgesetz-Korrelation
zwischen dem Matrixpotenzial und der Relaxationszeit des Phasenmaximums der Sand-Ton-
Gemische. Es wurden jedoch zwei unterschiedliche Steigungen für diese Beziehung
beobachtet, eine für Matrixpotentiale größer als -120 cm und eine weitere für kleinere
Matrixpotentiale. Die beobachtete Steigung war quadratisch für Matrixpotentiale >-120 cm

viii
und linear für Matrixpotentiale <-120 cm. Die quadratische Korrelation wurde
Diffusionsprozessen zugeordnet, während die lineare Korrelation einen bislang unbekannten
Relaxationsprozess andeutet. Die Beziehung zwischen der elektrischen Relaxationszeit und
der ungesättigten hydraulischen Leitfähigkeit wurde mit Hilfe dieser Beziehung und einer
vereinfachten Version des Mualem – van Genuchten Models erzielt. Die Steigung dieser
Potenzgesetz-Abhängigkeit zwischen ungesättigter hydraulischer Leitfähigkeit und
Relaxationszeit hängt von der Breite der Porengrößenverteilung ab, die durch den semi-
empirischen n-Parameter des Mualem-van Genuchten Models ausgedrückt wird. Es wurde die
Schlussfolgerung gezogen, dass die ungesättigte hydraulische Leitfähigkeit mit Hilfe von SIP
bestimmt werden kann, indem die Relaxationszeit und zusätzliche Informationen wie der n-
Parameter des Mualem-van Genuchten Models genutzt werden.

ix
Table of Contents
1 Introduction .................................................................................................................... 1
1.1 Motivation .................................................................................................................. 1
1.2 Modeling of flow in unsaturated zone ........................................................................ 1
1.3 Laboratory and field methods to determine water retention and hydraulic
conductivity function .............................................................................................................. 2
1.4 Geophysical methods to determine hydraulic properties ........................................... 3
1.4.1 Analogy electrical and hydraulic flow ....................................................................... 3
1.4.2 DC electrical methods ................................................................................................ 4
1.4.3 Induced Polarization ................................................................................................... 4
1.4.4 Spectral Induced Polarization ..................................................................................... 5
1.4.4.1 Models of SIP for saturated soil ..................................................................... 5
1.4.4.2 Spectral Induced Polarization measurements on saturated soil ..................... 7
1.4.4.3 Prior work on SIP for unsaturated soil ........................................................... 8
1.5 Aims and structure of thesis ....................................................................................... 9
2 Joint measurement setup for determining spectral induced polarization and soil
hydraulic properties .................................................................................................................. 11
2.1 Introduction .............................................................................................................. 11
2.2 Fundamentals and interpretation of spectral induced polarization (SIP)
measurements ....................................................................................................................... 13
2.3 Fundamentals and interpretation of multi-step outflow measurements ................... 14
2.4 Description of the measurement setup ..................................................................... 15
2.4.1 Electrical measurement equipment .......................................................................... 15
2.4.2 Joint measurement cell for simultaneous SIP and MSO measurements .................. 16
2.5 Test measurements on sand ...................................................................................... 20
2.5.1 Methods .................................................................................................................... 20
2.5.2 Electrical results for the sand ................................................................................... 21
2.5.3 Electrical results for shrinking material ................................................................... 25
2.6 Summary and conclusions ........................................................................................ 26
3 Spectral induced polarization measurements on variably saturated sand-clay mixtures
………………………………………………………………………………………………...29
3.1 Introduction .............................................................................................................. 29
3.2 Materials and Methods ............................................................................................. 30
3.2.1 Measurement setup ................................................................................................... 30
3.2.2 Sample preparation ................................................................................................... 31
3.2.3 Data interpretation .................................................................................................... 32
3.3 Results and Discussion ............................................................................................. 32
3.4 Conclusions .............................................................................................................. 43
4 Electrical-hydraulic relationships of unsaturated sand-clay mixtures using spectral
induced polarization ................................................................................................................. 45
4.1 Introduction .............................................................................................................. 45
4.2 Materials and Methods ............................................................................................. 47
4.2.1 Measurement setup ................................................................................................... 47
4.2.2 Sample characterization ........................................................................................... 48
4.2.3 Experimental approach ............................................................................................. 48
4.2.4 Data interpretation of electrical results .................................................................... 49
4.2.5 Data interpretation for hydraulic measurements ...................................................... 50
4.3 Results and Discussion ............................................................................................. 52
4.4 Conclusions .............................................................................................................. 61

x
5 Conclusions and Outlook ............................................................................................. 63
5.1 Final Conclusions ..................................................................................................... 63
5.2 Outlook ..................................................................................................................... 65
5.2.1 Further laboratory studies using SIP ........................................................................ 65
5.2.2 Laboratory EIT experiments .................................................................................... 65
5.2.3 Step to the field ........................................................................................................ 65
5.2.4 Simulation ................................................................................................................ 66

xi
List of Tables
Table 2.1: Dimensions of the measurement cells. .................................................................... 17
Table 2.2: Physical properties of the ceramic plates from the manufacturer. d – thickness, ∅ -
diameter, α−1
- air entry value, Φ - approximate porosity, rp – maximum pore size, Ks –
saturated hydraulic conductivity. ............................................................................................. 19
Table 3.1. Petrophysical properties of the pure sand and the sand-clay mixtures. .................. 31 Table 3.2: Fitted petrophysical model parameters (Eq. 4) for the pure sand and the sand-clay
mixtures. ................................................................................................................................... 34 Table 4.1: Soil physical properties of the pure sand and the sand-clay mixtures. ................... 48 Table 4.2: Pressure steps for all four samples. ......................................................................... 49
Table 4.3: Initial parameter estimates of the sample material for the optimization during the
modeling with HYDRUS-1D. θs is the saturated water content, θr is the residual water
content, α is the inverse of the air-entry-pressure, n is a shape parameter related to the pore
size distribution, and Ks is the saturated hydraulic conductivity. ............................................ 51 Table 4.4: Mualem-van Genuchten parameter obtained by inverse modeling with HYDRUS
1D. θs – saturated water content, θr – residual water content, α - inverse of air entry value, n –
n parameter, Ks – saturated hydraulic conductivity, R2 – coefficient of determination. .......... 53
Table 4.5: Petrophysical parameters fitted using the model of Jougnot et al. (2010). ............ 55
Table 4.6: Coefficients b3 for h ≤ 120 cm (b3,a) and h ≥ 120 cm (b3,b). ................................... 60

xii
xiii
List of Figures
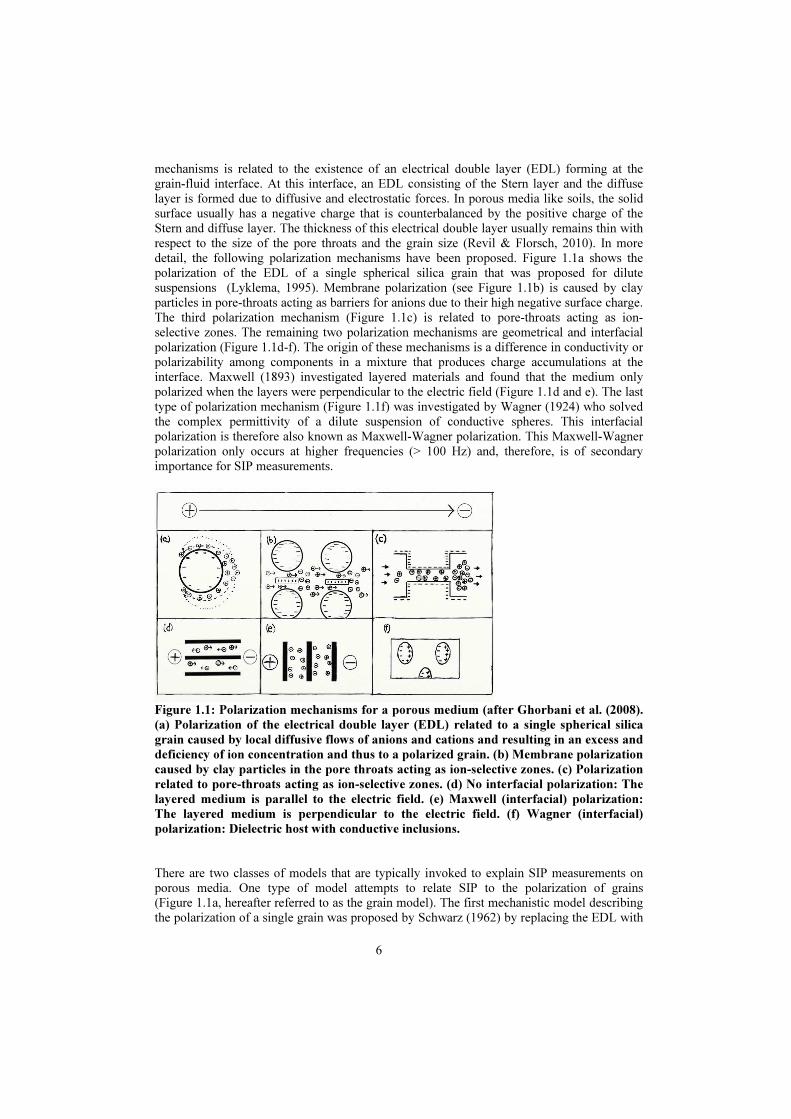
Figure 1.1: Polarization mechanisms for a porous medium (after Ghorbani et al. (2008). (a)
Polarization of the electrical double layer (EDL) related to a single spherical silica grain
caused by local diffusive flows of anions and cations and resulting in an excess and deficiency
of ion concentration and thus to a polarized grain. (b) Membrane polarization caused by clay
particles in the pore throats acting as ion-selective zones. (c) Polarization related to pore-
throats acting as ion-selective zones. (d) No interfacial polarization: The layered medium is
parallel to the electric field. (e) Maxwell (interfacial) polarization: The layered medium is
perpendicular to the electric field. (f) Wagner (interfacial) polarization: Dielectric host with
conductive inclusions. ................................................................................................................ 6 Figure 2.1: a) Picture of measurement cell; drawing of measurement cell for b) non-shrinking
soil and c) shrinking soil: 1 – Current porous bronze electrodes, 2 – Potential electrodes: non-
polarizable, 3 – Potential electrodes: steel, 4 – Chamber filled with water, 5 – Chamber for the
pressurized air supply (only for shrinking soil), 6 – Chamber filled with the sample, 7 –
Ceramic plates, 8 – Small tube of PMMA, 9 – Connecter to pressurized air, 10 – Connecter to
water burette; d) picture of measurement cell for shrinking cell; e) drawing of non-polarizable
potential electrodes: 1 – Tube of PMMA, 2 – Ceramic cone point, 3 – Calcium chloride
solution, 4 – Silver wire, 5 – Plug. ........................................................................................... 16 Figure 2.2: a) Test measurements for calibration of the non-polarizable ceramic and stainless
steel potential electrodes. Phase spectra with (+cp) and without (−cp) ceramic plates in the
measurement cell were measured using the ceramic electrodes. b) Test measurements for
comparison of the phase spectra measured with both potential electrode types on relatively
dry sand-clay mixture. .............................................................................................................. 18
Figure 2.3: Hydraulic measurements with the MSO equipment. Applied pressure (red crosses
– left Y axis) and outflow (blue circles – right Y axis) as a function of time in days. ............ 20 Figure 2.4: Soil-water characteristic curve. Water content as a function of the capillary
pressure achieved from the hydraulic measurements and from HYDRUS1D. ........................ 21
Figure 2.5: Amplitude of the complex electrical conductivity versus fre-quency for all equili-
brium water saturations measured with ceramic electrodes. .................................................... 22 Figure 2.6: Real part of the complex conductivity versus water saturation at a frequency of
1 Hz: a) model of Waxman & Smits (1968) and b) model of Revil et al. (2007). ................... 22
Figure 2.7: a) Phase angle and b) imaginary part of the complex electrical conductivity versus
frequency for all equilibrium water saturations measured with ceramic electrodes. ............... 23
Figure 2.8: Cole-Cole chargeability associated with the phase peak in dependence on water
saturation. ................................................................................................................................. 24 Figure 2.9: Cole-Cole relaxation time associated with the phase peak in dependence on a)
water saturation and b) unsaturated hydraulic conductivity determined by Hydrus1D. .......... 24 Figure 2.10: Phase angle of the complex electrical conductivity versus frequency for
Selhausen soil conducted in the measurement cell for shrinking material. The arrows show
how the phase spectra have changed when the upper part of the measurement cell was
lowered to reestablish the electrical contact between the upper current electrode and the
sample. ...................................................................................................................................... 26
Figure 3.1: Sketch of experimental setup: A pump is used to desaturate the sample using
several pressure steps. Electrical measurements are conducted using a high-accuracy
impedance spectrometer. The high air-entry porous ceramic cones of the non-polarizing
potential electrodes are located in the sample to keep a good electrical contact. .................... 30
Figure 3.2: Measured and modeled real part of the complex electrical conductivity (σ’) at 1
Hz as a function of water saturation: (a) pure sand, (b) 5% sand-clay mixture, (c) 10% sand-
clay mixture, and (d) 20% sand-clay mixture. ......................................................................... 33

xiv
Figure 3.3: Frequency-dependent imaginary part of the complex electrical conductivity (σ’’)
of the investigated pure sand as a function of water saturation. .............................................. 35
Figure 3.4: Frequency-dependent imaginary part of the complex electrical conductivity (σ’’)
of the investigated sand-clay mixture with 5% clay content as a function of water saturation.
.................................................................................................................................................. 36
Figure 3.5: Frequency-dependent imaginary part of the complex electrical conductivity (σ’’)
of the investigated sand-clay mixture with 10% clay content as a function of water saturation.
.................................................................................................................................................. 37
Figure 3.6: Frequency-dependent imaginary part of the complex electrical conductivity (σ’’)
of the investigated sand-clay mixture with 20% clay content as a function of water saturation.
.................................................................................................................................................. 37
Figure 3.7: Imaginary part of the complex electrical conductivity (σ’’) at a frequency of (a)
0.01 Hz and (b) 1 kHz for all samples as a function of water saturation. ................................ 38 Figure 3.8: Normalized total chargeability (mn,tot) of all samples as a function of water
saturation. ................................................................................................................................. 39
Figure 3.9: Conceptual model for electrical response associated with unsaturated sand-clay
mixtures. a) Full saturation: Intergrain pore spaces act as large pores, while the grain contact
regions act as narrow pores. The clay minerals are mainly loosely arranged within the entire
saturated pore space. b) Medium saturation: The clay minerals are rearranged into a smaller
available saturated pore volume. Some of the clay particles are associated with the sand
grains. c) Low saturation: Grain contact regions become the large pores, while the water films
around the sand grains act as narrow pores. d) Dry soil: The amount of water in the grain
contact regions is reduced, resulting in a decreased difference between effective pore radii
associated with grain contacts and water films. ....................................................................... 40
Figure 3.10: Estimated peak relaxation time (τpeak) from the τ distribution obtained with
Debye decomposition for different water saturations of the 5% sand-clay mixture. ............... 41
Figure 3.11: Peak relaxation time (τpeak) of all samples as a function of water saturation. ..... 42 Figure 4.1: Simplified sketch of the measurement column for joint hydraulic and electric
measurements: Ce 1 and ce 2 are current electrodes being porous bronze plate electrodes. Cp1
and cp2 are ceramic plates with an air-entry pressure of 1 bar. Pe1 and pe2 are non-
polarizable electrodes consisting of a Plexiglas tube filled with a calcium chloride solution
and having a ceramic cone with an air-entry pressure of 1 bar. ............................................... 47
Figure 4.2: Outflow experiments for a) pure sand b) 5% sand-clay mixture c) 10% sand-clay
mixture, and d) 20% sand-clay mixture. .................................................................................. 52 Figure 4.3: Retention curves for a) pure sand b) 5% sand-clay mixture c) 10% sand-clay
mixture, and d) 20% sand-clay mixture. .................................................................................. 53 Figure 4.4: Electrical phase spectra for a) pure sand b) 5% sand-clay mixture c) 10% sand-
clay mixture, and d) 20% sand-clay mixture. ........................................................................... 54
Figure 4.5: DC resistivity ρ0 which was achieved by the Debye Decomposition versus the
unsaturated hydraulic conductivity. ......................................................................................... 56
Figure 4.6: Normalized total chargeability achieved by the Debye Decomposition versus the
unsaturated hydraulic conductivity. ......................................................................................... 57
Figure 4.7: (a) Matric potential versus peak relaxation time. (b) Relaxation time versus pore
radius. ....................................................................................................................................... 58 Figure 4.8: Peak relaxation time versus the unsaturated hydraulic conductivity. .................... 60
1
1 Introduction
1.1 Motivation
Groundwater is one of the most important resources for humanity because it is used, for
instance, as drinking water and for agriculture use and thus to feed humanity. However,
groundwater is endangered through overuse and contamination. Soils fulfill important
functions to protect the groundwater and to maintain a good water quality. They act as filter,
buffer, and storage for water (Scheffer & Schachtschabel, 2010). For many applications, the
understanding of flow and transport processes in soils is of importance. However, these
processes are controlled by structural and textural heterogeneities that are difficult to
determine in the field. Geophysical measurement methods like spectral induced polarization
(SIP) can help to determine saturated (e.g., Pape et al., 1987; de Lima & Niwas, 2000; Binley
et al., 2005; Hördt et al., 2007) and unsaturated (e.g., Titov et al., 2004; Binley et al., 2005;
Jougnot et al., 2010) hydraulic properties to gain information on flow (Ghorbani et al., 2008;
Jougnot et al., 2009) and transport processes (e.g., Börner et al., 1996; Revil & Linde, 2006;
Revil, et al., 2007) in porous media. In addition, electrical impedance tomography (EIT),
which is the 3D imaging version of SIP, is able to provide information about the structural
and textural heterogeneity. Thus, in the future it may be possible to use EIT to determine
unsaturated hydraulic conductivity distribution in the field.
1.2 Modeling of flow in unsaturated zone
Water flow and chemical transport are often numerically simulated with computer models to
better understand contamination of the subsurface environment or for enhancing agricultural
applications. A multitude of those models is based on the Richard’s equation that describes
the water flow in the vadose zone (Richards, 1931):
( ) ( )
−
∂
∂
∂
∂=
∂
∂
∂
∂=
∂
∂1
z
hK
zz
HK
ztθθ
θ, (1.1)
where K is the hydraulic conductivity, H is the hydraulic head, h is the matric potential, z is
the elevation above a vertical datum, θ is the water content, and t is the time. In order to use
Richard’s equation, closed-form expressions are used to relate K, h, and θ. In particular, the
water retention function relates the water content with the matric potential and the hydraulic
conductivity curve relates the hydraulic conductivity and the matric potential. A lot of
research has been dedicated to the formulation and parameterization of these closed-form
expressions. Leij et al., (1997) provided an overview of closed-form expressions that are used
in computer modeling programs like for instance Hydrus-1D. These closed-form expressions
can be differentiated into different types, such as single-porosity, dual-porosity, and dual-
permeability expressions. The most commonly used type is the Mualem-van Genuchten
model (Mualem, 1976; van Genuchten, 1980):
( ) ( ) mn
rs
r
rh
hS
−
+=
−
−
= αθθ
θθ1 (1.2)
( )( ) ( )
,11
2
121
−
−−−
−
−=
mm
rs
r
rs
r
s
hhKhK
θθ
θθ
θθ
θθ
(1.3)
2
where Sr is the relative saturation, θr is residual water content, θs is the water content at full
saturation, α is the inverse of the air-entry value, n is a shape parameter related to the pore
size distribution, m = 1 – 1/n, and Ks is the saturated hydraulic conductivity.
1.3 Laboratory and field methods to determine water retention and
hydraulic conductivity function
There are different methods to obtain estimates of effective hydraulic properties. These
methods can be divided into empirical and experimental approaches. Empirical approaches
are based on estimating the hydraulic properties from more easily available information. For
example, the Kozeny-Carman equation (Carman, 1997) or the Hazen equation (Hazen, 1893)
can be used to estimate the saturated hydraulic conductivity from the grain size distribution
obtained by sieving and from pedotransfer functions (Vereecken et al., 2010).
The experimental approaches can be separated in laboratory and field methods (see for
instance (Dane & Topp, 2002). For laboratory methods, disturbed or undisturbed soil samples
have to be taken in the field. Experimental approaches like permeameters are used to measure
the hydraulic head and thus determine the unsaturated hydraulic conductivity. For such
permeameter approaches water runs through a core sample under either constant (constant-
head) or variable hydraulic gradient (falling-head). The first method is usually used for
materials of moderate to high K while the second one is used for materials with low K. Multi
step outflow experiments (e.g., van Dam et al., 1994) are commonly to determine effective
unsaturated hydraulic properties by draining soil samples via several consecutive pressure
steps. The hydraulic head and water outflow measured during drainage are used to inversely
estimate the Mualem-van Genuchten parameters using hydrological modeling programs like
HYDRUS-1D.
One class of field methods are the hydrogeological methods to determine the saturated
hydraulic conductivity of aquifers. These are typically conducted in or in-between boreholes
like for instance pump tests (Sanchez-Vila et al., 1999) and slug tests (Butler et al., 1996;
Butler, 1998). Pump tests are conducted by stimulating an aquifer through constant pumping
in observation wells. The observed drawdown is usually interpreted using an analytical model
of aquifer flow, for example the Theis solution, under the assumption that the parameters
from this idealized model apply to the real-world data. For more complex cases, numerical
models may be used to analyze the observed data. Slug tests being a variation of typical
pumping tests are also conducted in wells through an instantenous change (increase or
decrease) of the water table. This test is often conducted to get a quick estimate of the aquifer
properties in a few minutes.
A second class of field methods are used to characterize hydraulic properties of the vadose
zone, such as infiltrometry with single ring, double ring, and disc infiltrometers (resp. disc
permeameters). With these methods, the rate of water infiltration into the soil is measured and
analytical or numerical solutions of water flow are used to obtain estimates of the unsaturated
hydraulic properties (Simunek et al., 1999). Inverse modeling of field data is also increasingly
used to determine unsaturated hydraulic properties (e.g., Bauer et al., 2012; Mboh et
al., 2011).
Information about the shallow subsurface is usually gained by collecting samples or
conducting hydrological or geophysical borehole measurements. However, these approaches
3
are limited because they contain only information about the subsurface at that specific point,
are time-consuming and also expensive. For some investigation objectives, such local
measurements might be sufficient but when the study site is large compared to the scale of the
heterogeneity or when the hydrology is complex, key-information about the hydrological
situation may not be achieved (Binley et al., 2010).
1.4 Geophysical methods to determine hydraulic properties Limitations of the hydrologic approaches have resulted in a multitude of studies that explored
the possibility of combining hydrologic approaches with geophysical measurements to
provide improved and minimally invasive characterization and monitoring information. Such
joint approaches build the relatively new research area of “hydrogeophysics”. Rubin &
Hubbard (2005) defined “hydrogeophysics” as “the use of geophysical measurements for
mapping subsurface features, estimating properties, and monitoring processes that are
important to hydrological studies, such as those associated with water resources, contaminant
transport, and ecological and climate investigations”. The main applications of
hydrogeophysical approaches are to provide information and input parameters for
hydrological flow and transport models, hydrogeological mapping, and monitoring of
hydrological processes. In the last decades, numerous geophysical studies were dedicated to
hydrological investigations and almost all geophysical methods can be used for
hydrogeophysical studies, such as seismic refraction and reflection, electrical resistivity,
electromagnetic methods, and ground penetrating radar (GPR) (Slater, 2006; Vereecken et
al., 2006; Revil et al., 2012). In this thesis, we focus on the use of electrical methods to
estimate hydraulic properties.
1.4.1 Analogy electrical and hydraulic flow
The estimation of the hydraulic conductivity from electrical measurements is based on the fact
that both water and the electrical current flow through the interconnected pore space of a
porous medium. Electrical methods include: Electrical Resistivity (ER), Electrical Resistivity
Tomography (ERT), Induced Polarization (IP), Spectral Induced Polarization (SIP), Electrical
Impedance Tomography (EIT), and Self Potential (SP) measurements. These methods are
used to measure potential differences in volts between two (or more) potential electrodes.
This voltage can be transformed into electrical resistance, R, using Ohm’s law:
I
UR = , (1.4)
where U is the potential difference, and I is the electric current. Using a geometric factor G
for the applied electrode configuration, the resistance can be transformed into electrical
resistivity, ρ, or electrical conductivity, σ:
I
UG==
σρ
1 . (1.5)
For complex electrical resistivity methods like IP, SIP, and EIT, the electrical resistivity is
measured as a complex quantity ρ*(ω) consisting of real (ρ′) and imaginary (ρ″) part. The
complex electrical resistivity can also be written as resistivity magnitude ( ρ ) and phase
angle (ϕ) between the excitated sinusoidal current and measured voltage signal:
( )( )
( ) ( ) ( ) ( )ωϕωρωρωρ
ωσωρ
iei ⋅=′′+′==∗
∗1
, (1.6)
4
where fπω 2= , and 1−=i . It is a matter of choice whether measurements are expressed in
terms of complex electrical conductivity or complex electrical resistivity. The imaginary part
of the electrical resistivity is related to the specific surface area of a porous medium and is
caused by polarization processes coming from ion displacement currents in the pore space.
Thus, measurements of the complex resistivity provide information on two important
properties of the pore volume, i.e. the real part is related to the porosity and the imaginary part
is related to the specific surface area.
1.4.2 DC electrical methods
Many studies investigated the estimation of the hydraulic conductivity using petrophysical
relations between electrical measurements and effective properties like the interconnected
pore space and the interconnected pore surface area (Börner & Schön, 1991; Börner et
al., 1996; Lesmes & Frye, 2001; Weller et al., 2010). The review paper of Slater (2006)
provides a good overview of various approaches to estimate K from electrical measurements.
Several electrical studies during the 1970’s and 1980’s revealed a log-log relationship
between the electrical resistivity and the hydraulic conductivity for DC electrical
measurements. However, both positive and negative correlations have been found depending
on site mineralogy, grain size distribution, pore size distribution, and pore fluid chemistry
(Huntley, 1986). Purvance & Andricevic (2000) reviewed these findings and showed that the
log-log relationship between electrical resistivity and hydraulic conductivity is negative when
interconnected pore volumes dominate the electrical current flow and positive when the
electrical current flow is governed by interconnected pore surface areas. Thus, K estimation
using DC electrical resistivity measurements is often limited because these measurements
cannot separate whether the electrical resistivity is dominated by electrical conduction of the
pore fluid or by interface conductivity of clay minerals.
In case of studies that attempt to relate electrical properties to the unsaturated hydraulic
conductivity, the dependence of the electrical resistivity on the water saturation has to be
taken into account. This was for example done by Doussan & Ruy (2009). They proposed
three different approaches to estimate the unsaturated hydraulic conductivity using DC
electrical measurements and parameters like the saturated hydraulic conductivity and the
surface conductivity. They accounted for the water content by using the formation factor for
different water contents, i.e. as a function of the matric potential, instead of the formation
factor for saturated conditions. However, the approach of Doussan & Ruy (2009) is not able
to estimate the unsaturated hydraulic conductivity from electrical measurements alone but
needs additional information like saturated hydraulic conductivity, electrical resistivity of the
pore fluid, and clay content that have to be determined in further experiments and are not
always available.
1.4.3 Induced Polarization
Although the electrical resistivity is both sensitive to the pore volume and the specific surface
of a porous medium, those two properties cannot be clearly separated by DC electrical
methods. In contrast to DC electrical methods, Induced Polarization (IP) measures not only
the real part but also the imaginary part of the electrical conductivity or respectively the phase
shift between the induced current and the measured voltage signal. During the last decades, a
comprehensive volume of electrical studies has been published demonstrating a power-law
dependence between the imaginary part of the electrical resistivity and the pore-related
5
specific surface area of a porous medium (Börner & Schön, 1991; Börner et al., 1996; Slater
& Lesmes, 2002; Slater et al., 2006; Weller et al., 2010). Therefore, several studies have
attempted to predict the saturated hydraulic conductivity from complex electrical properties.
Several approaches are based on Kozeny-Carman type equations to predict the permeability k
from electrical and petrophysical properties:
π8
effa
Tk
Φ= , (1.7)
with Φ being the porosity, T is the tortuosity, and aeff is the effective hydrodynamic cross
section. The permeability k can be transformed into the hydraulic conductivity K using the
following equation:
η
gdkK w
⋅⋅= , (1.8)
where dw is the density of water, g is the gravitational acceleration, and η is the dynamic
viscosity. Thus, K is dependent on both the physical properties of the porous medium and the
fluid. A modified version of the Kozeny-Carman equation is the PARIS equation (Pape et
al., 1982; Pape et al., 1987), which is only valid for sandstones:
1.3
475
porSF
k⋅
= , (1.9)
with F being the formation factor and Spor is the pore-volume related specific surface area.
This semi-empirical equation is based on the approach to replace the two geometric
parameters T and aeff with parameters that can easily be determined. The tortuosity was
replaced by the formation factor with the assumption that the geometrical and electrical
tortuosity are the same. The second geometric parameter aeff can be written as 2
effrπ , whereas
reff can be expressed using the capillary surface area *
porS :
eff
porr
S2*
= (1.10)
A similar approach using a power-law relationship between the hydraulic conductivity K and
the imaginary component of the electrical conductivity was presented by Slater &
Lesmes (2002):
( ) jaK
−
′′⋅= σ , (1.11)
where a and j are empirical constants. It was observed that the power law exponent is a
function of soil type with ranges from 0.9-1.3 for unconsolidated soils (Slater & Lesmes,
2002) and 2.8-4.6 for sandstones (Börner et al., 1996). However, recent studies (Binley et
al., 2005; Scott & Barker, 2005) showed that the relationship between the imaginary part of
the electrical conductivity and Spor may not always be strong enough to allow K estimation
using such Kozeny-Carman type approaches.
1.4.4 Spectral Induced Polarization
1.4.4.1 Models of SIP for saturated soil
An overview of the different polarization mechanisms in a porous medium without metallic
components like ores (see Figure 1.1) was given by Ghorbani et al. (2008). They generalized
that any restriction of relative displacement of charges results in an accumulation of negative
charges on one side of the medium and positive charges on the opposite side and thus results
in the polarization of this medium. The electrochemical origin of most of the polarization
6
mechanisms is related to the existence of an electrical double layer (EDL) forming at the
grain-fluid interface. At this interface, an EDL consisting of the Stern layer and the diffuse
layer is formed due to diffusive and electrostatic forces. In porous media like soils, the solid
surface usually has a negative charge that is counterbalanced by the positive charge of the
Stern and diffuse layer. The thickness of this electrical double layer usually remains thin with
respect to the size of the pore throats and the grain size (Revil & Florsch, 2010). In more
detail, the following polarization mechanisms have been proposed. Figure 1.1a shows the
polarization of the EDL of a single spherical silica grain that was proposed for dilute
suspensions (Lyklema, 1995). Membrane polarization (see Figure 1.1b) is caused by clay
particles in pore-throats acting as barriers for anions due to their high negative surface charge.
The third polarization mechanism (Figure 1.1c) is related to pore-throats acting as ion-
selective zones. The remaining two polarization mechanisms are geometrical and interfacial
polarization (Figure 1.1d-f). The origin of these mechanisms is a difference in conductivity or
polarizability among components in a mixture that produces charge accumulations at the
interface. Maxwell (1893) investigated layered materials and found that the medium only
polarized when the layers were perpendicular to the electric field (Figure 1.1d and e). The last
type of polarization mechanism (Figure 1.1f) was investigated by Wagner (1924) who solved
the complex permittivity of a dilute suspension of conductive spheres. This interfacial
polarization is therefore also known as Maxwell-Wagner polarization. This Maxwell-Wagner
polarization only occurs at higher frequencies (> 100 Hz) and, therefore, is of secondary
importance for SIP measurements.
Figure 1.1: Polarization mechanisms for a porous medium (after Ghorbani et al. (2008).
(a) Polarization of the electrical double layer (EDL) related to a single spherical silica
grain caused by local diffusive flows of anions and cations and resulting in an excess and
deficiency of ion concentration and thus to a polarized grain. (b) Membrane polarization
caused by clay particles in the pore throats acting as ion-selective zones. (c) Polarization
related to pore-throats acting as ion-selective zones. (d) No interfacial polarization: The
layered medium is parallel to the electric field. (e) Maxwell (interfacial) polarization:
The layered medium is perpendicular to the electric field. (f) Wagner (interfacial)
polarization: Dielectric host with conductive inclusions.
There are two classes of models that are typically invoked to explain SIP measurements on
porous media. One type of model attempts to relate SIP to the polarization of grains
(Figure 1.1a, hereafter referred to as the grain model). The first mechanistic model describing
the polarization of a single grain was proposed by Schwarz (1962) by replacing the EDL with

7
a single layer of counterions that was able to move only tangentially to the grain surface (i.e.
no exchange between bulk solution and EDL). In addition, Schwarz (1962) related the
relaxation time to the square of the particle radius and the diffusion coefficient of the
counterions. However, Dukhin & Shilow (1974) demonstrated that the treatment of Schwarz
of the polarization of the EDL was not accurate for disperse solutions. They developed a
linearized polarization model for a particle surrounded by a Gouy-Chapman diffuse layer and
hypothesized that the Stern layer does not polarize and thus does not contribute to the surface
conductivity. However, it was found that the model of Dukhin & Shilow (1974) could not
explain the available experimental data. Thus, Lyklema (2002) proposed that the Stern layer
could be the important part of the EDL for polarization of a single grain. More recently, Leroy
et al. (2008) proposed a model combining polarization of the Stern layer and Maxwell-
Wagner polarization. This model is connected to a triple-layer model and accounts for the
partitioning of counterions between the Stern and diffuse layer. A key assumption in the
model of Leroy et al. (2008) is that for saturated porous media with a small grain-to-grain
contiguity the polarization of the diffuse layer is prevented by the overlapping of the EDLs at
the grain contacts. Experimental studies such as those by Klein & Sill (1982), Chelidze &
Gueguen (1999), Lesmes & Morgan (2001), and Revil & Florsch (2010) have also related the
relaxation time to the grain size.
A second class of models attempts to relate SIP to the polarization of pore-throats acting as
ion-selective zones (Figure 1.1c, hereafter referred to as the pore size model). This model is
supported by Marshall and Madden (1953) and Titov et al. (2002, 2004), who proposed the
consecutive short-narrow pore model. They showed a dependence of the relaxation time on
the square of a pore surface length scale that can be determined by the distribution of wide or
narrow pores. The experimental studies of Binley et al. (2005) and Scott & Barker (2003)
support the pore size model. For example, Binley et al. (2005) found a power-law relationship
between the relaxation time and the dominant pore throat size with an exponent of 1.04. Scott
& Barker (2003) also observed a positive power-law relationship between these two
parameters.
1.4.4.2 Spectral Induced Polarization measurements on saturated soil
Spectral Induced Polarization measures the complex electrical resistivity in a frequency range
between 1 mHz and several kHz. This multi-frequency analysis gives additional electrical
parameters that can be obtained by using one of the many phenomenological relaxation
models, like the Cole-Cole model (Cole & Cole, 1941; Pelton et al., 1987):
( )( )
+−−= ∑
kc
kk
k
imRZ
ωτ
ω
1
111
0, (1.12)
where Z is the impedance, R0 is the DC electrical resistivity at very small frequencies, mk is
the chargeability, 1−=i being the imaginary unit, τk is the relaxation time, fπω 2= , and ck
is the Cole-Cole exponent. More recently, Debye decomposition (Nordsiek & Weller, 2008;
Zisser et al., 2010) is often used. The chargeability is a measure of the polarization that is
related to the interfacial charge storage of ion displacements in the pore space but is also
influenced by the electrical resistivity. Thus, the normalized total chargeability is often used
which is a measure of the polarization of the whole sample. The relaxation time is related to
the length-scale over which ions in the electrical double layer move during electric current
application. The Cole-Cole exponent determines the width of the phase maximum and usually
ranges between 0.1 and 0.6 for consolidated and unconsolidated sedimentary rocks.
8
Many studies investigated the potential of SIP for K estimation in saturated conditions. Based
on the theoretical proportionality of both relaxation time and hydraulic conductivity on the
square of an effective length scale, Kemna (2000) proposed a linear relationship between the
relaxation time τ and the permeability k. Pape & Vogelsang (1996) also proposed that the
time constant of their pigeon-hole model was a measure of the permeability. Strong power
law relationships between the relaxation time and the hydraulic conductivity were found for
sandstones ( 26.0~ Kτ , Binley et al., 2005) and unconsolidated sands ( 78.1
~ Kτ , Kemna et
al., 2005). The different exponents for unconsolidated and consolidated sediments are related
to the cementation factor m of Archie’s law that is dependent on the cementation and the rock,
respectively soil type. All these empirical studies indicate that the relaxation time is a measure
of the effective hydraulic radius used in the original Kozeny-Carman equation.
1.4.4.3 Prior work on SIP for unsaturated soil
Most SIP studies were conducted on fully saturated samples so that only relationships
between the relaxation time and the saturated hydraulic conductivity have been investigated.
Binley et al. (2005) also conducted SIP measurements on unsaturated sandstones and showed
that the water saturation has to be taken into account for SIP studies. They observed a
decrease of the relaxation time with decreasing water saturation. In addition, they suggested a
parallelism between SIP behavior and unsaturated hydraulic conductivity.
Titov et al. (2004) investigated sieved quartz samples in dependence on the water content. For
some cases the unsaturated pores contained air in other cases it was filled with kerosene. They
found two different power-law relationships between resistivity and water content and also
between chargeability and water content. They proposed the short-narrow-pore model as a
conceptual model to explain the observed results. In the saturated case, the water filled pore
space was considered to be the largest current pathways and the areas of grain contact were
assumed to act as narrow ion-selective pores. In the unsaturated case, most of the water is
bound at the areas of grain contacts and thus form the largest current pathways, whereas the
water films coating the particles are the ion-selective zones.
Jougnot et al. (2010) presented a mechanistic model for partially saturated clay-rocks. This
model is based on the model proposed by Leroy et al. (2008) and combines polarization of
grains in the Stern layer of the EDL and additional Maxwell-Wagner polarization at high
frequencies. The model predicts that the relaxation time is independent of the water content
and is only dependent on the dominant grain size. However, measurements of Jougnot et
al. (2010) showed a increasing relaxation time with decreasing water content which was
attributed to an increase of ‘dominant length scale’ with desaturation due to clay mineral
deformation that increased the relaxation path length of the ions causing polarization. Finally,
Cassiani et al. (2009) investigated the SIP behavior in dependence of saturation with both air
and a non-aqueous phase liquid (octanol and benzene). They found that the resistivity increase
with decreasing water saturation is less for non-aqueous phase liquids than with the same
amount of air. In addition, they found that the relaxation time increases with decreasing
saturation, albeit differently for air and non-aqueous phase liquids.

9
1.5 Aims and structure of thesis
SIP has proven to be a valuable measurement method for hydrologic applications due to the
links between properties of the complex electrical resistivity and hydraulic conductivity.
However, much work remains to be done. In particular, the relationship between SIP and
unsaturated hydraulic conductivity and the origin of the observed relaxation in porous media
is still debated. Therefore, the general aim of this thesis is to determine effective hydraulic
properties of unsaturated porous media using electrical spectral induced polarization
measurements. This thesis has three specific objectives. The first objective is to build a joint
measurement setup for simultaneous hydraulic and electrical measurements on unsaturated
and unconsolidated porous media. The second objective is to study the dependence of the
spectral induced polarization response on water saturation. Finally, the third objective was to
investigate relationships between SIP parameters and unsaturated effective hydraulic
properties.
Chapter two deals with the first objective. The developed joint measurement setup consists of
a multi step outflow equipment to desaturate unconsolidated porous media using several
pressure steps. For the electrical measurements a high-accuracy electrical impedance
spectrometer was applied. A special measurement cell was constructed to allow spectral
induced polarization measurements while the sample is drained without loosing electrical
contact between the electrodes and the sample. A test measurement with pure quartz sand is
shown.
Chapter three is concerned with investigations of the influence of water saturation on spectral
induced polarization properties. Long-term desaturation experiments on four different
unconsolidated porous media - one sand and three artificially mixed sand-clay mixtures - were
conducted using the joint measurement setup described in the second chapter. The behavior of
spectral induced polarization is investigated in dependence on the water saturation, and a
conceptual model is presented that explains our measurements.
Chapter four presents and discusses relationships between SIP parameters and unsaturated
hydraulic properties. The results from the same four experiments on sand and sand-clay
mixtures described in the third chapter are used. Unsaturated hydraulic properties for each
sample are determined using the Mualem - van Genuchten parameters determined with
inverse modeling of water outflow using HYDRUS-1D. Debye parameters like DC electrical
resistivity, chargeability, and peak relaxation time of each pressure step are determined for all
samples. Relationships between unsaturated hydraulic conductivity and the Debye parameters
are investigated.
Finally, chapter five summarizes the main outcomes of this research project. In addition,
possible future applications of spectral induced polarization to characterize soil hydraulic
properties are discussed.

10
11
2 Joint measurement setup for determining spectral induced
polarization and soil hydraulic properties*
2.1 Introduction
Soil is an important resource that is useful in many ways for mankind. For example, it
supports food and other biomass production and it stores many essential substances, such as
water, carbon, and nitrogen. In addition, soil is an important protective buffer for vulnerable
groundwater resources against contaminants. To manage and protect vital soil and
groundwater resources, understanding of flow and transport processes in soils is essential. To
describe water flow in the unsaturated zone, both hydraulic conductivity and water retention
functions need to be provided. A range of methods is available to determine these soil
hydraulic properties. The two most commonly used groups of methods are based on
monitoring infiltration in the field (e.g., double-ring infiltrometer, tension-disk infiltrometer)
or monitoring drainage or evaporation in the laboratory (e.g., multi-step outflow experiment).
A detailed overview of methods to determine soil hydraulic properties is provided by Dane &
Topp (2002).
The prediction capabilities of unsaturated flow and transport models are limited by
insufficient knowledge of the structural and textural heterogeneity of the soil. Both infiltration
measurements in the field and drainage and evaporation experiments in the laboratory are
time-consuming and impractical to estimate the spatial variability of hydraulic properties. To
obtain more information, geophysical methods may be employed in field-scale studies. Slater
& Lesmes (2002) summarized the advantages of geophysical approaches to estimate hydraulic
properties. First, geophysical measurements are non-invasive when applied from the earth
surface and minimally invasive when conducted from a small number of boreholes. Second,
measurements can be quickly performed and are less time-consuming than classical methods
to determine hydraulic properties. Third, a relatively high temporal and spatial sampling
density can be achieved. Nowadays, geophysical equipment and inversion algorithms can
even provide 3D images of the subsurface.
The analogy between electric current flow and groundwater flow has led to various attempts
to predict hydraulic properties from geoelectrical measurements (e.g., Vereecken et al., 2005;
Slater, 2007). Since water in interconnected pores is the main path for water flow and
electrolytic conduction, it is clear that both electrical and hydraulic properties are governed by
pore space properties. Therefore, several studies have attempted to estimate hydraulic
conductivity from DC electrical conductivity (e.g., Kosinski & Kelly, 1981). However, as
discussed in detail by Purvance & Andricevic (2000), both positive and negative correlations
between electrical and hydraulic conductivity can exist. A positive correlation is found when
porosity controls electrical conductivity (e.g., clay-free sediments), while a negative
correlation results from an electrical conductivity being controlled by specific surface area
and cation exchange phenomena. Thus, it is not possible to uniquely predict the hydraulic
conductivity from DC electrical measurements without additional knowledge of the specific
surface area or cation exchange capacity.
Significant improvements in the estimation of hydraulic properties have been made using
induced polarization (IP) measurements (e.g., Börner et al., 1996; Slater & Lesmes, 2002);
* Adapted from K. Breede, A. Kemna, O. Esser, E. Zimmermann, H. Vereecken, and J.A. Huisman. Joint
measurement setup for determining Spectral Induced Polarization and soil hydraulic properties. Vadose Zone J.
10: 716-726, doi: 10.2136/vzj2010.0110

12
Hördt et al., 2007; Revil & Florsch, 2010). With IP, the complex electrical conductivity of a
sample is determined for a single frequency (or a small subset of frequencies). The complex
electrical conductivity is a measure of both the electrolytic conductivity and the ohmic
interface conductivity (real part) and the polarization effects (imaginary part). Polarization is
caused by charged interfaces and constrictions in the pore space, which lead to zones of
unequal ionic transport properties in the pore space (e.g., Börner et al., 1996; Titov et
al., 2002). Polarization at interfaces is associated with metals and clays (e.g., Madden &
Cantwell, 1967; Olhoeft, 1985) and with the electrical double layer that exists for all minerals
Leroy et al. (2007). In clay-free and metal-free sediments, polarization effects are mainly
associated with tangential ion displacement in the electrical double layer forming at the grain-
fluid interface (e.g., Schwarz, 1962; Börner et al., 1996; Chelidze & Gueguen, 1999). There
have been several studies that established empirical correlations between the imaginary part
of the electrical conductivity at a particular frequency and hydraulic conductivity (e.g., Börner
et al., 1996; Slater & Lesmes, 2002). However, it is difficult to generalize these empirical
relationships because of the inherently frequency-dependent nature of the complex electrical
conductivity, which is not considered in IP.
Spectral induced polarization (SIP) is used to characterize the complex electrical conductivity
for a broad frequency bandwidth (i.e., mHz to kHz range). The frequency dependence of the
complex electrical conductivity is of great interest because it provides information on
characteristic relaxation times which are indicative of characteristic length scales of the
sample (e.g., Scott & Barker, 2003; Binley et al., 2005). Recently, Jougnot et al. (2010)
proposed a mechanistic model for interpreting SIP measurements of partially saturated clay-
rocks. Their model combines the polarization of the inner part of the electrical double layer
(Stern layer) and Maxwell-Wagner polarization and predicts that the characteristic relaxation
time is independent of water saturation, but instead only depends on the given grain size (i.e.,
grain diameter). Furthermore, they showed an adequate fit between measured and modeled
complex electrical conductivity above 1 Hz, although the measured characteristic relaxation
time increased with decreasing saturation due to deformation within the clay rock. Binley et
al. (2005) reported correlations between the characteristic relaxation time and both the
hydraulic conductivity and the air entry pressure (i.e., the α parameter in the Mualem-van
Genuchten model) of sandstone samples. In addition, for their samples the characteristic
relaxation time decreased with decreasing saturation, as would be expected for a characteristic
length scale because the water is held in smaller pores for lower saturation. Although not
further explored by Binley et al. (2005), this implies a link between unsaturated hydraulic
conductivity and relaxation time.
There have been only a few studies that focus on the relationship between spectral induced
polarization and unsaturated hydraulic properties for unconsolidated samples (e.g., Münch et
al., 2005; Ghorbani et al., 2008). Because of the low polarizability of most unconsolidated
samples, such investigations require highly accurate measurements of the complex electrical
conductivity. Therefore, the aim of this paper is to present an experimental setup that allows
simultaneous hydraulic and SIP measurements with the high accuracy required for
characterization of soils and sediments with low polarizability. As a proof of concept, we
analyze the complex electrical conductivity as a function of saturation for an unconsolidated
sandy soil sample. The paper is organized as follows. First, the fundamentals of SIP
measurements are shortly outlined in section 2. The multi-step outflow approach used to
determine the soil hydraulic properties is shortly presented in section 3. In section 4, the joint
setup for simultaneous electrical and hydraulic measurements is presented. Section 5 presents
results of complex electrical conductivity measurements on unconsolidated sand as a function
13
of saturation using the newly developed experimental setup. Furthermore, results of the
hydraulic measurements are shown in this section.
2.2 Fundamentals and interpretation of spectral induced polarization
(SIP) measurements
To measure the effective complex electrical conductivity of a soil sample, an electrical
excitation voltage with known amplitude and frequency is applied at two current electrodes
positioned at both ends of the sample. This results in an alternating electric current in the
sample, and the associated voltage is measured at two potential electrodes, which are located
between the current electrodes. The recorded voltage and current are converted to the
frequency dependent complex electrical conductivity (σ*(ω)) using the geometric factor for
the electrode arrangement. σ*(ω) can also be expressed as conductivity magnitude (|σ|) and
phase angle (ϕ) between the excitated sinusoidal current and measured voltage signal or as a
sum of the real (σ’) and imaginary part (σ’’) of the electrical conductivity:
( ) ( ) ( )ωσωσσωσϕ
′′+′=⋅=∗
iei
, (2.1)
with 1−=i and fπω 2= .
It is a matter of choice whether measurements are expressed in terms of σ*, complex
electrical resistivity, ρ*, or complex dielectric permittivity, ε*:
( )( )
*1
*ωε
ωρωσ i==
∗
. (2.2)
These electrical parameters can all be calculated from the measured impedance and the
sample geometry. We choose to present the spectral electrical response in terms of amplitude
and phase angle, ϕ, of σ*. These can be calculated from the real and imaginary components of
σ* as follows:
( ) ( ) ( )( )22
ωσωσωσ ′′+′= , (2.3)
( )( )( )
( )( )ωσ
ωσ
ωσ
ωσωϕ
′
′′≈
′
′′= arctan . (2.4)
The approximation in Eq. (2.4) is valid for phase angles below ~100 mrad (Ulrich & Slater,
2004).
Ohmic conduction in unconsolidated sediments is ionic, occurring through the pore-filling
electrolyte and by ion migration in the electrical double layer forming at the grain-fluid
interface (surface conductivity). The surface conductivity (σ*s) depends on matrix
mineralogy, grain size, and electrical conductivity of the pore fluid. A classic model to
describe the bulk conductivity of a porous medium (σ*) in the presence of surface
conductivity was presented by Waxman & Smits (1968):
+=
w
s
w
n
w
SF
S*
*σ
σσ , (2.5)
where F is the formation factor, Sw is the water saturation, n is the saturation exponent, and σw
is the pore water conductivity. In this equation, the ‘surface conductivity’ should be
interpreted as a contribution of the ions in the diffuse double layer. In addition, the division of
the surface conductivity by the saturation implies that the diffuse double layer extends over
the entire pore space. Recently, Revil et al. (2007) derived the following model using a
volume averaging approach:

14
( )**)1(
1s
n
wwFS
Fσσσ −+= . (2.6)
In this model, the surface conductivity is related to the Stern layer and, thus, to the tortuosity
of the solid phase instead of the water phase. For this reason, the formation factor appears as a
multiplier before the surface conductivity. It should be noted that in Revil et al. (2007) and
Jougnot et al. (2010) the contribution of the diffuse double layer was considered in σw through
the Donnan equilibrium approach. Here, we assume that σw equals the conductivity of the
bulk solution used to saturate the sample, which implies that we neglect the contribution of
the diffuse double layer to the bulk electrical conductivity in Eq. (2.6). Therefore, these two
models can be considered as limiting cases where the surface conductivity is either attributed
to the diffuse double layer or to the Stern layer.
To characterize the measured electrical spectra, we used the program SPECFIT described in
Kemna (2000) and Chen et al. (2008). In this program, the magnitude and phase spectra of
complex resistivity ( )(1)( ωσωρ∗∗
= ) are regarded as a superposition of three Cole-Cole
spectra:
( )( )
+−−= ∑
=
∗
kc
kk
k
i
m
ωτ
ρωρ
1
111
3
1
0, (2.7)
where each Cole-Cole dispersion term is characterized by a chargeability mk, a relaxation time
τk, the Cole-Cole exponent ck, and ρ0 is the DC resistivity. The relaxation time is related to a
relaxation frequency by ( ) 1
2−
= fπτ . The Cole-Cole term with the smallest relaxation time
accounts for the effect of capacitive coupling at high frequencies. This approach is similar to
that of Pelton et al. (1978) to describe inductive coupling in complex resistivity spectra. The
other two Cole-Cole terms summarize the electrical response of the soil. The parameters of
the three Cole-Cole terms are determined by minimizing the difference between measured and
modeled log magnitude and phase data using a conventional real-valued least-squares
approach with Marquardt regularization Press et al. (1992).
2.3 Fundamentals and interpretation of multi-step outflow measurements
For hydraulic measurements, the multi-step outflow (MSO) method was selected. This
method is widely considered to be one of the standard laboratory methods for the
determination of hydraulic conductivity and water retention functions (e.g., Dane &
Topp, 2002). The idea behind the MSO method is to drain a soil sample by applying a set of
predefined pneumatic pressures. The hydraulic parameters can be determined by inverse
modeling of the recorded outflow as a function of the applied pressure (van Dam et al., 1994).
The program HYDRUS-1D of Simunek et al. (2005) was used for modeling the multi-step
outflow experiment. The applied pressure at the top of the soil column was transformed into
suction at the bottom of the soil column and the measured outflow was normalized to the area
of the soil column. The water content and the hydraulic conductivity as a function of the
pressure head, h, were described by the Mualem–van Genuchten model (Mualem, 1976; van
Genuchten, 1980):
| | mn
rs
r
αh+=θθ
θhθ−
−
−
)(1)(
, (2.8)
where θr is the residual and θs is the saturated soil water content, α is the inverse of the air-
entry value, n is a shape parameters related to the pore size distribution and nm 11−= . The
hydraulic conductivity is given by

15
2
12
1
)))(
(1(1)(
m
m
rs
r
rs
r
s
θθ
θhθ
θθ
θhθK=K(h)
−
−−−
−
−, (2.9)
where Ks is the saturated hydraulic conductivity.
2.4 Description of the measurement setup
The novel measurement setup consists of a combined SIP measurement system and a multi-
step outflow cell to drain the sample. Most SIP studies on variably saturated porous media
were conducted with evaporative drying so far. The advantage of pressure drainage over
evaporative drying is that the electrical conductivity of the pore fluid remains stable and must,
therefore, not be considered for data interpretation or modeling. In the following, we first
present the electrical measurement equipment and then the combined measurement cell.
2.4.1 Electrical measurement equipment
The SIP measurements are made with a high-accuracy electrical impedance spectrometer
described by Zimmermann et al. (2008). It is based on a 4-point electrode array: two
electrodes for current injection and two electrodes for voltage measurement. A sinusoidal
excitation voltage with a predefined frequency in the range from 1 mHz to 45 kHz is
generated by a function generator (Agilent 33120A). The amplitude and frequency of the
signal are remotely controlled. The measurement system is typically operated using an
excitation voltage of ± 5 V, which was shown to provide a good signal-to-noise ratio
(Zimmermann et al., 2008). An amplifier unit measures the voltages at the potential electrodes
with minimum load and crosstalk. The voltages are then transmitted via short triaxial cables
of 0.5 m to the DC-coupled amplifiers (JFET OP AD825) with high impedance and low
capacity. To reduce parasitic leakage currents and capacitive loads, the cables are used with a
driven shield (Morrison, 1998). The input capacity between the triaxial cables and ground is
less than 5 pF, while the input resistance is higher than 1 GΩ. Due to the high input
resistance, it is not required to use non-polarizable electrodes for the voltage measurements.
To minimize crosstalk, the outer shields of the triaxial cables are connected to ground
potential and the coupling capacities of the amplifiers are minimized so that they are smaller
than 0.1 pF. Three different shunt resistors Rs (10 Ω, 100 Ω or 1 kΩ) can be used for current
measurement. All channels are constructed in an identical manner to minimize phase and gain
differences between the channels.
The measured voltages are simultaneously digitized with 24-bit Sigma-Delta data acquisition
cards (NI4472) providing a high phase accuracy and digital anti-aliasing filters. The
maximum measurement frequency is about 45 kHz. The 24-bit (1.2 µV) resolution enables
the measurement of the AC voltages with a high signal-to-noise ratio. A LabVIEW program
controls the function generator and the data acquisition cards. For each measurement
frequency, the time series of the voltages are stored. A MATLAB program removes the drifts
in the time series (as proposed by Dahlin et al., 2002) and computes the complex voltages
from the measured time series at the known excitation frequencies.

16
2.4.2 Joint measurement cell for simultaneous SIP and MSO measurements
To simultaneously determine SIP and unsaturated hydraulic properties, design considerations
for accurate SIP measurements have to be integrated into the MSO measurement cell. An
important design consideration is the separation between current and potential electrodes
because of the polarization of the current electrodes. Zimmermann et al. (2008) showed that
the distance between the current and the potential electrodes should be at least twice the
sample diameter to avoid errors associated with the polarization of the current electrodes.
Therefore, our first measurement cell for non-shrinking materials, such as sand, consists of
three units: a middle unit which is filled with the soil sample and an upper and a lower unit
which are filled with tap water (see Figure 2.1a and b). The two water-filled units are used to
increase the separation between current and potential electrodes, thus increasing the
measurement accuracy. The dimensions of the measurement cell are provided in Table 2.1. To
allow electrical measurements, the measurement cell is made of PMMA. The soil sample is
fixed between two ceramic plates in the middle unit.
Figure 2.1: a) Picture of measurement cell; drawing of measurement cell for b) non-
shrinking soil and c) shrinking soil: 1 – Current porous bronze electrodes, 2 – Potential
electrodes: non-polarizable, 3 – Potential electrodes: steel, 4 – Chamber filled with
water, 5 – Chamber for the pressurized air supply (only for shrinking soil), 6 – Chamber
filled with the sample, 7 – Ceramic plates, 8 – Small tube of PMMA, 9 – Connecter to
pressurized air, 10 – Connecter to water burette; d) picture of measurement cell for
shrinking cell; e) drawing of non-polarizable potential electrodes: 1 – Tube of PMMA, 2
– Ceramic cone point, 3 – Calcium chloride solution, 4 – Silver wire, 5 – Plug.
Another important consideration for accurate SIP measurements is the selection of current and
potential electrodes. Zimmermann et al. (2008) tested different current electrode materials like
copper, stainless steel, and porous bronze. The results showed that at frequencies higher than
10 Hz, the impedance is almost independent of the electrode material and the current density.
It depends only on the sample material and on the shape of the sample holder. For low
frequencies, the porous bronze electrodes performed best. These porous bronze electrodes are
made of Cu89Sn11 filter elements with an average pore diameter of 15 µm and a porosity of
32% and they are located at the top as well as at the bottom of the measurement cell (Figure
2.1b). The current electrodes have a diameter of 89 mm and a thickness of about 4 mm. In
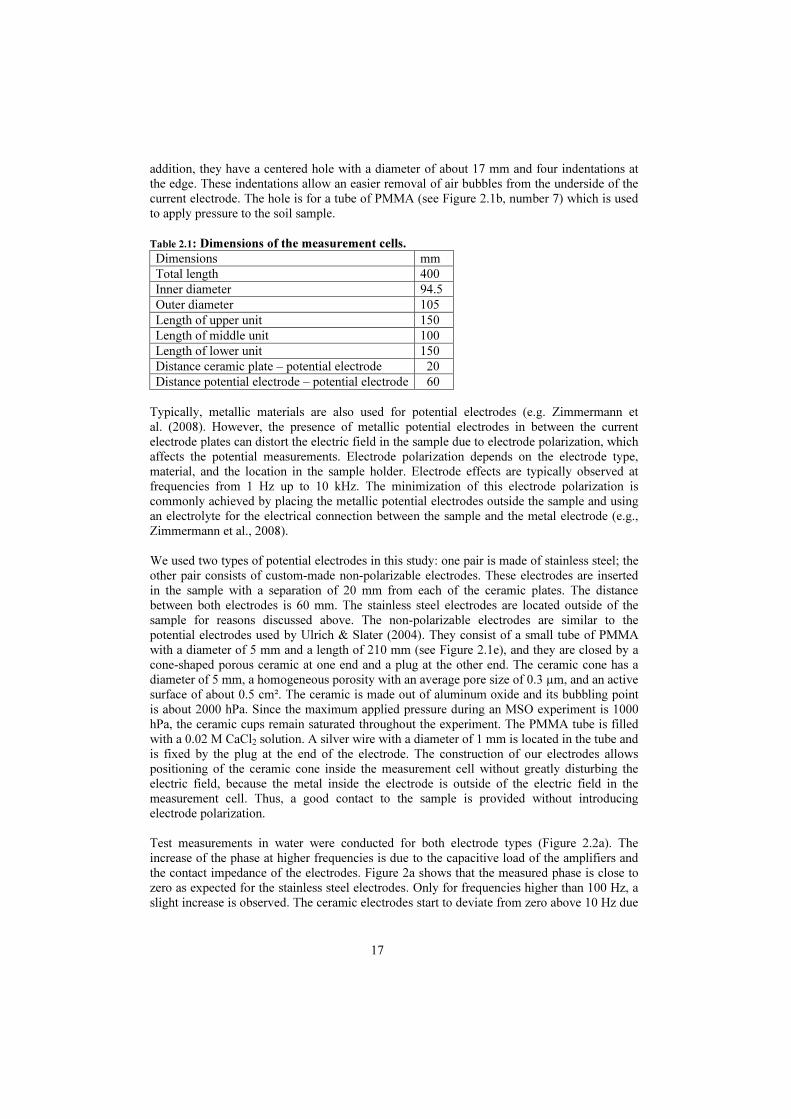
17
addition, they have a centered hole with a diameter of about 17 mm and four indentations at
the edge. These indentations allow an easier removal of air bubbles from the underside of the
current electrode. The hole is for a tube of PMMA (see Figure 2.1b, number 7) which is used
to apply pressure to the soil sample.
Table 2.1: Dimensions of the measurement cells.
Dimensions mm
Total length 400
Inner diameter 94.5
Outer diameter 105
Length of upper unit 150
Length of middle unit 100
Length of lower unit 150
Distance ceramic plate – potential electrode 20
Distance potential electrode – potential electrode 60
Typically, metallic materials are also used for potential electrodes (e.g. Zimmermann et
al. (2008). However, the presence of metallic potential electrodes in between the current
electrode plates can distort the electric field in the sample due to electrode polarization, which
affects the potential measurements. Electrode polarization depends on the electrode type,
material, and the location in the sample holder. Electrode effects are typically observed at
frequencies from 1 Hz up to 10 kHz. The minimization of this electrode polarization is
commonly achieved by placing the metallic potential electrodes outside the sample and using
an electrolyte for the electrical connection between the sample and the metal electrode (e.g.,
Zimmermann et al., 2008).
We used two types of potential electrodes in this study: one pair is made of stainless steel; the
other pair consists of custom-made non-polarizable electrodes. These electrodes are inserted
in the sample with a separation of 20 mm from each of the ceramic plates. The distance
between both electrodes is 60 mm. The stainless steel electrodes are located outside of the
sample for reasons discussed above. The non-polarizable electrodes are similar to the
potential electrodes used by Ulrich & Slater (2004). They consist of a small tube of PMMA
with a diameter of 5 mm and a length of 210 mm (see Figure 2.1e), and they are closed by a
cone-shaped porous ceramic at one end and a plug at the other end. The ceramic cone has a
diameter of 5 mm, a homogeneous porosity with an average pore size of 0.3 µm, and an active
surface of about 0.5 cm². The ceramic is made out of aluminum oxide and its bubbling point
is about 2000 hPa. Since the maximum applied pressure during an MSO experiment is 1000
hPa, the ceramic cups remain saturated throughout the experiment. The PMMA tube is filled
with a 0.02 M CaCl2 solution. A silver wire with a diameter of 1 mm is located in the tube and
is fixed by the plug at the end of the electrode. The construction of our electrodes allows
positioning of the ceramic cone inside the measurement cell without greatly disturbing the
electric field, because the metal inside the electrode is outside of the electric field in the
measurement cell. Thus, a good contact to the sample is provided without introducing
electrode polarization.
Test measurements in water were conducted for both electrode types (Figure 2.2a). The
increase of the phase at higher frequencies is due to the capacitive load of the amplifiers and
the contact impedance of the electrodes. Figure 2a shows that the measured phase is close to
zero as expected for the stainless steel electrodes. Only for frequencies higher than 100 Hz, a
slight increase is observed. The ceramic electrodes start to deviate from zero above 10 Hz due

18
to the higher contact impedance as compared to the stainless steel electrodes in water.
However, it should be noted that the observed difference is still below 1 mrad.
Figure 2.2: a) Test measurements for calibration of the non-polarizable ceramic and
stainless steel potential electrodes. Phase spectra with (+cp) and without (−cp) ceramic
plates in the measurement cell were measured using the ceramic electrodes. b) Test
measurements for comparison of the phase spectra measured with both potential
electrode types on relatively dry sand-clay mixture.
The contact impedance of the electrodes generally increases with decreasing water content.
Figure 2.2b shows the phase angle for a measurement on a dry sand-clay mixture with a clay
content of 5% for both the ceramic and the stainless steel electrodes. For frequencies lower
than 10 Hz, the measured phase angle is similar for the two electrode types. At frequencies
higher than 10 Hz, the phase error of the stainless steel electrodes increases dramatically due
to the higher contact impedances of the electrodes. The measurements with the ceramic
electrodes are clearly more appropriate, although the contact impedance of the electrodes also
affects the measurements at higher frequencies. The reason for the strong increase in the
measured phase angle with the stainless steel electrodes is the reduced electrical contact
between the sample and the electrode when the water content decreases (i.e., no water film is
present anymore between soil and electrode as in the case of a saturated sample).
The specifications of the ceramic plates that hold the sample in place are provided in
Table 2.2. The ceramic plate at the top of the soil sample has a centered hole with a diameter
of 10 mm. A tube of PMMA with a length of about 210 mm and a diameter of 10 mm was
glued into the hole. The tube of this ceramic plate is fixed by a compression fitting to the lid
of the measurement cell. The influence of the ceramic plates on the electrical measurements
was evaluated. For this purpose, two measurements were conducted on water: one with and
one without ceramic plates in place (Figure 2.2a). The results show that the ceramic plates
have a negligible impact on the electrical measurements. The saturated hydraulic conductivity
of the ceramic plates is relatively low (Table 2.2), which means that the ceramic plate at the
bottom of the sample needs to be considered in the hydrologic model to obtain meaningful
estimates of the hydraulic parameters from inverse modeling of the outflow data.

19
Table 2.2: Physical properties of the ceramic plates from the manufacturer. d –
thickness, ∅ - diameter, α−1
- air entry value, Φ - approximate porosity, rp – maximum
pore size, Ks – saturated hydraulic conductivity.
d
[mm] ∅
[mm]
α−1
[hPa] Φ
[vol.-%]
rp
[µm]
Ks
[cm/sec]
Flow through ¼-inch plate
[ml/hr/cm²/14.7 psi]
7 90 1000 45 2.5 8.6E-6 50
Figure 2.1c and d show the second measurement cell designed for measurements on shrinking
soil. The upper unit of the cell was modified for this purpose. It now consists of the same
outer cylinder and a new inner cylinder with a diameter of 70 mm and a length of 130 mm.
The inner cylinder is filled with water and the space between the inner and the outer cylinder
is filled with air. The current electrode is located at the top of the inner cylinder (see
Figure 2.1c). The bottom of the inner cylinder is closed with a ceramic plate. This unit of the
cell can be moved up and down by a small tube of PMMA, which has a length of 210 mm and
a diameter of 10 mm. The connection for the current electrode, a silver wire with a diameter
of 1 mm, is fed through this PMMA tube. The pressure is applied to the sample via the air-
filled space between inner and outer cylinder. If the soil material shrinks during desaturation,
an air gap typically occurs between the ceramic plate and the soil sample, which prohibits
electrical measurement because of the lack of electrical contact. In this adapted design, the
inner cylinder can be adjusted without removing the pressure from the soil. The disadvantage
of the adapted design is that the distribution of the electric field is not as homogeneous as it is
for the measurement cell shown in Figure 2.1b, because of the smaller diameter of the upper
current electrode.
For both measurement cells, air pressure is applied to the measurement cell (see
Figure 2.1b, c) As the air pressure is directly applied at the interface between the saturated
upper ceramic plate and the top of the soil sample, part of the soil water is removed for each
pressure step. This soil water flows through the lower ceramic plate and because of the
incompressibility of water, this water will displace a comparable amount of water in the
bottom water reservoir that will flow into the burette through the flexible tube. The water
height in the burette is measured by a pressure sensor and converted into milliliter using a
calibration factor. With increasing pressure steps, smaller and smaller pores of the sample are
desaturated. As long as the lower ceramic plate is saturated, only water can flow or diffuse
through it. Saturation of the ceramic plates is ensured by the high air entry pressure. The
applied air pressure at the interface between the upper ceramic plate and the sample acts as a
counter pressure such that water flow from the upper water reservoir through the ceramic
plate and into the sample is prevented.
The rather complicated design of our joint measurement cell for combined measurements of
SIP and hydraulic properties has some advantages over a simple design, where a column is
packed with sediment with imbedded current and potential electrodes. First, it needs to be
emphasized that a large separation between current and potential electrodes is required to
determine SIP properties of sediments with sufficient accuracy. If a simple design of a one-
piece column with a diameter of 8 cm is desired, then the entire length has to be about 40 cm
to achieve high-accuracy SIP data. However, such a long sample holder completely filled with
soil material has some disadvantages. First, the hydraulic measurements would take much
more time. Second, a homogeneously packed sample is more difficult to achieve. Finally, the
soil sample holder with a height of 10 cm and a diameter of 8 cm used in this study can be
used to take in-situ soil samples representative of a soil horizon, which is not possible for a
longer column design completely filled with soil material.
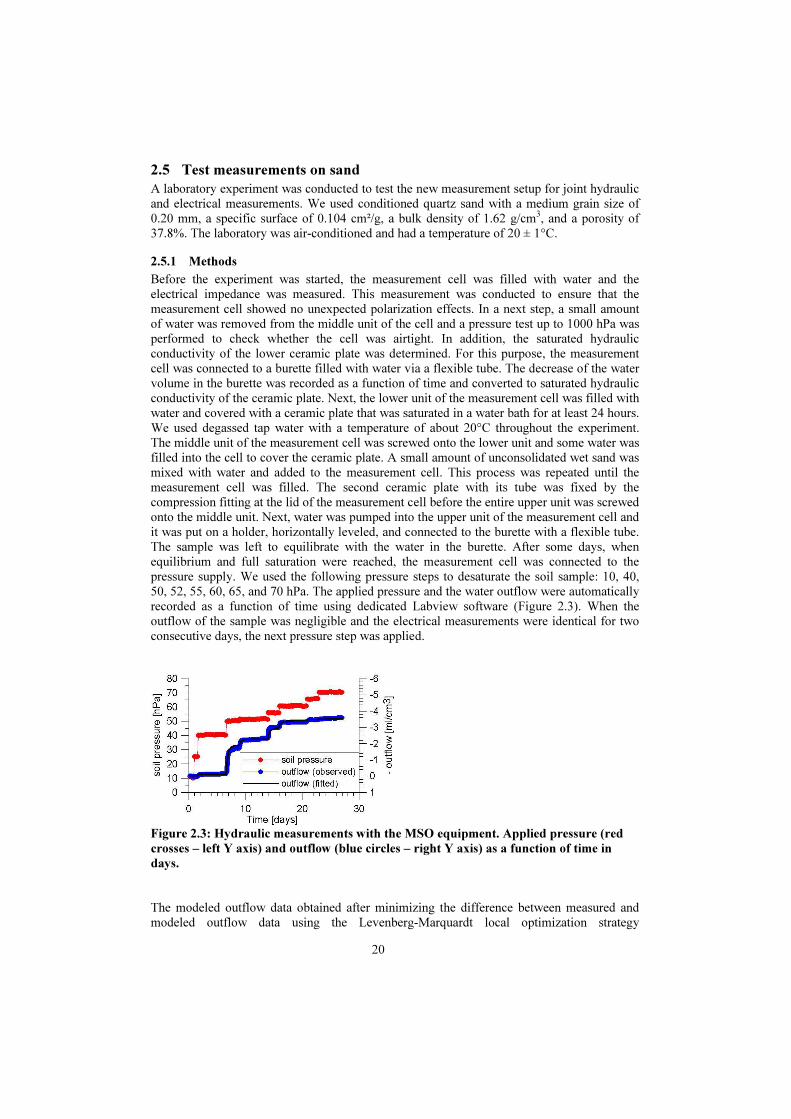
20
2.5 Test measurements on sand
A laboratory experiment was conducted to test the new measurement setup for joint hydraulic
and electrical measurements. We used conditioned quartz sand with a medium grain size of
0.20 mm, a specific surface of 0.104 cm²/g, a bulk density of 1.62 g/cm3, and a porosity of
37.8%. The laboratory was air-conditioned and had a temperature of 20 ± 1°C.
2.5.1 Methods
Before the experiment was started, the measurement cell was filled with water and the
electrical impedance was measured. This measurement was conducted to ensure that the
measurement cell showed no unexpected polarization effects. In a next step, a small amount
of water was removed from the middle unit of the cell and a pressure test up to 1000 hPa was
performed to check whether the cell was airtight. In addition, the saturated hydraulic
conductivity of the lower ceramic plate was determined. For this purpose, the measurement
cell was connected to a burette filled with water via a flexible tube. The decrease of the water
volume in the burette was recorded as a function of time and converted to saturated hydraulic
conductivity of the ceramic plate. Next, the lower unit of the measurement cell was filled with
water and covered with a ceramic plate that was saturated in a water bath for at least 24 hours.
We used degassed tap water with a temperature of about 20°C throughout the experiment.
The middle unit of the measurement cell was screwed onto the lower unit and some water was
filled into the cell to cover the ceramic plate. A small amount of unconsolidated wet sand was
mixed with water and added to the measurement cell. This process was repeated until the
measurement cell was filled. The second ceramic plate with its tube was fixed by the
compression fitting at the lid of the measurement cell before the entire upper unit was screwed
onto the middle unit. Next, water was pumped into the upper unit of the measurement cell and
it was put on a holder, horizontally leveled, and connected to the burette with a flexible tube.
The sample was left to equilibrate with the water in the burette. After some days, when
equilibrium and full saturation were reached, the measurement cell was connected to the
pressure supply. We used the following pressure steps to desaturate the soil sample: 10, 40,
50, 52, 55, 60, 65, and 70 hPa. The applied pressure and the water outflow were automatically
recorded as a function of time using dedicated Labview software (Figure 2.3). When the
outflow of the sample was negligible and the electrical measurements were identical for two
consecutive days, the next pressure step was applied.
Figure 2.3: Hydraulic measurements with the MSO equipment. Applied pressure (red
crosses – left Y axis) and outflow (blue circles – right Y axis) as a function of time in
days.
The modeled outflow data obtained after minimizing the difference between measured and
modeled outflow data using the Levenberg-Marquardt local optimization strategy

21
implemented in HYDRUS1D are also presented in Figure 2.3. During optimization of the
Mualem–van Genuchten model parameters, the saturated water content, θs, was fixed to the
measured value of the porosity (0.379 m3
m−3
). The values of the remaining optimized
parameters were: θr = 0.024 m3
m−3
, α = 0.0222 cm−1
, n = 19, and Ks = 402 cm d−1
. The
coefficient of determination, R2, was 0.99 and the mass balance error was 0.32%. The quality
of the fit is comparable to results obtained with dedicated MSO equipment.
Figure 2.4: Soil-water characteristic curve. Water content as a function of the capillary
pressure achieved from the hydraulic measurements and from HYDRUS1D.
Figure 2.4 shows the water retention function obtained from steady-state in the MSO
measurement cell, and the water retention function obtained using the inversion is also
provided. Both retention curves show a good agreement, emphasizing the quality of the fit.
The high value of n is related to the steep decrease in the hydraulic conductivity when the
unconsolidated sand starts to drain. High values of n were also reported by other researchers
for unconsolidated sand samples (e.g., Lambot et al., 2009).
2.5.2 Electrical results for the sand
Figure 2.5 presents the measured amplitudes of the complex conductivity for the equilibrium
water content associated with each pressure step. The amplitudes are nearly constant over the
whole frequency range. For low water contents, the amplitude increases at high frequencies
due to increased contact impedance of the electrodes as discussed in the context of
Figure 2.2b. For the first three pressure steps (0, 10, and 40 hPa), the amplitudes are the same
because the water outflow is small for these small applied pressures (water content remains
close to saturation). With decreasing water content, the amplitude decreases.
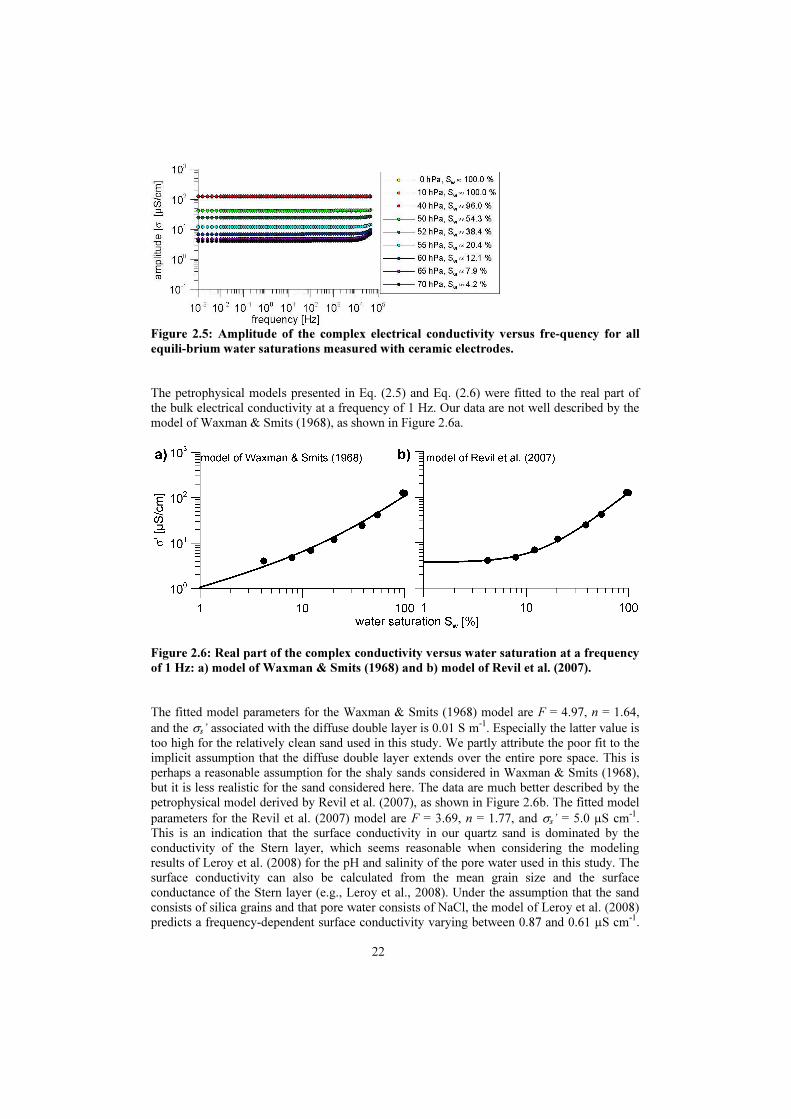
22
Figure 2.5: Amplitude of the complex electrical conductivity versus fre-quency for all
equili-brium water saturations measured with ceramic electrodes.
The petrophysical models presented in Eq. (2.5) and Eq. (2.6) were fitted to the real part of
the bulk electrical conductivity at a frequency of 1 Hz. Our data are not well described by the
model of Waxman & Smits (1968), as shown in Figure 2.6a.
Figure 2.6: Real part of the complex conductivity versus water saturation at a frequency
of 1 Hz: a) model of Waxman & Smits (1968) and b) model of Revil et al. (2007).
The fitted model parameters for the Waxman & Smits (1968) model are F = 4.97, n = 1.64,
and the σs’ associated with the diffuse double layer is 0.01 S m-1
. Especially the latter value is
too high for the relatively clean sand used in this study. We partly attribute the poor fit to the
implicit assumption that the diffuse double layer extends over the entire pore space. This is
perhaps a reasonable assumption for the shaly sands considered in Waxman & Smits (1968),
but it is less realistic for the sand considered here. The data are much better described by the
petrophysical model derived by Revil et al. (2007), as shown in Figure 2.6b. The fitted model
parameters for the Revil et al. (2007) model are F = 3.69, n = 1.77, and σs’ = 5.0 µS cm-1
.
This is an indication that the surface conductivity in our quartz sand is dominated by the
conductivity of the Stern layer, which seems reasonable when considering the modeling
results of Leroy et al. (2008) for the pH and salinity of the pore water used in this study. The
surface conductivity can also be calculated from the mean grain size and the surface
conductance of the Stern layer (e.g., Leroy et al., 2008). Under the assumption that the sand
consists of silica grains and that pore water consists of NaCl, the model of Leroy et al. (2008)
predicts a frequency-dependent surface conductivity varying between 0.87 and 0.61 µS cm-1
.
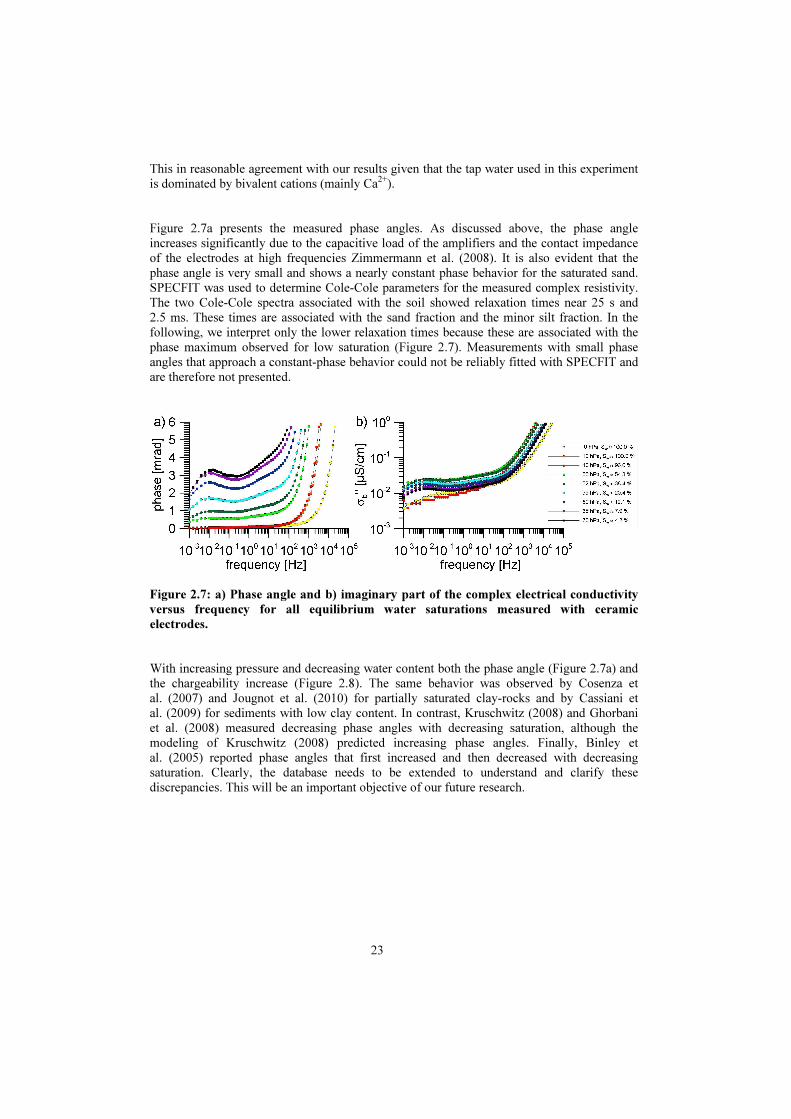
23
This in reasonable agreement with our results given that the tap water used in this experiment
is dominated by bivalent cations (mainly Ca2+
).
Figure 2.7a presents the measured phase angles. As discussed above, the phase angle
increases significantly due to the capacitive load of the amplifiers and the contact impedance
of the electrodes at high frequencies Zimmermann et al. (2008). It is also evident that the
phase angle is very small and shows a nearly constant phase behavior for the saturated sand.
SPECFIT was used to determine Cole-Cole parameters for the measured complex resistivity.
The two Cole-Cole spectra associated with the soil showed relaxation times near 25 s and
2.5 ms. These times are associated with the sand fraction and the minor silt fraction. In the
following, we interpret only the lower relaxation times because these are associated with the
phase maximum observed for low saturation (Figure 2.7). Measurements with small phase
angles that approach a constant-phase behavior could not be reliably fitted with SPECFIT and
are therefore not presented.
Figure 2.7: a) Phase angle and b) imaginary part of the complex electrical conductivity
versus frequency for all equilibrium water saturations measured with ceramic
electrodes.
With increasing pressure and decreasing water content both the phase angle (Figure 2.7a) and
the chargeability increase (Figure 2.8). The same behavior was observed by Cosenza et
al. (2007) and Jougnot et al. (2010) for partially saturated clay-rocks and by Cassiani et
al. (2009) for sediments with low clay content. In contrast, Kruschwitz (2008) and Ghorbani
et al. (2008) measured decreasing phase angles with decreasing saturation, although the
modeling of Kruschwitz (2008) predicted increasing phase angles. Finally, Binley et
al. (2005) reported phase angles that first increased and then decreased with decreasing
saturation. Clearly, the database needs to be extended to understand and clarify these
discrepancies. This will be an important objective of our future research.
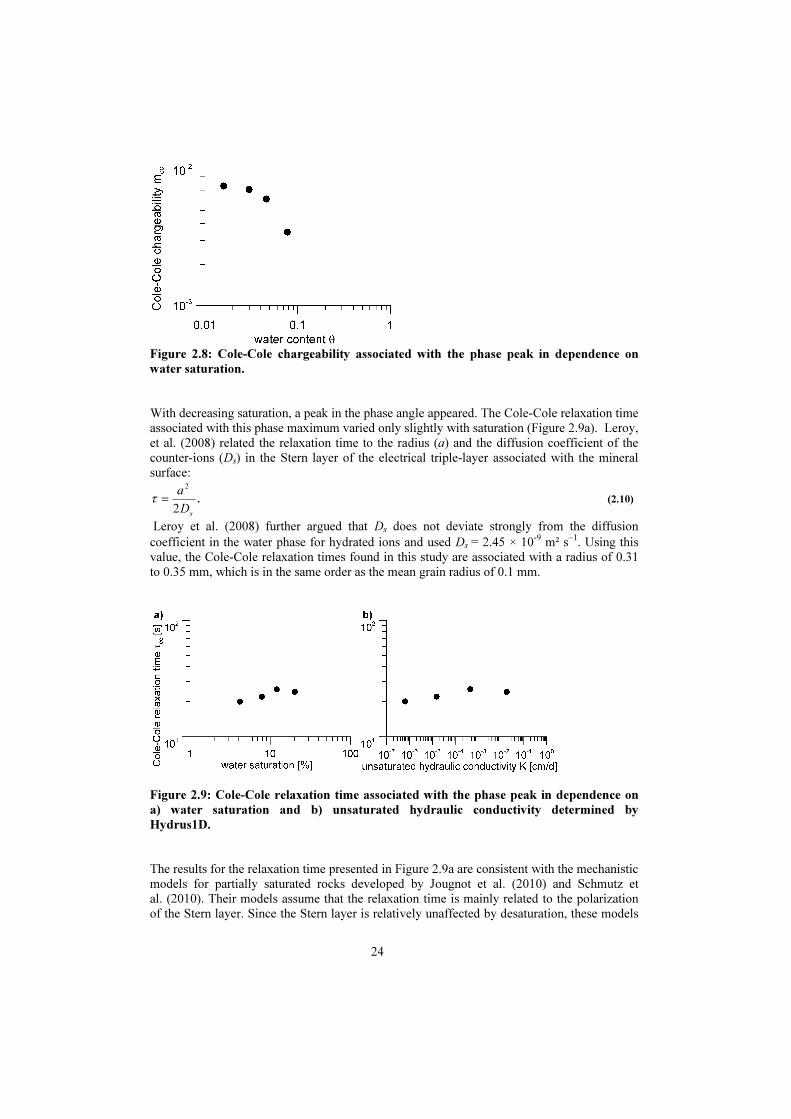
24
Figure 2.8: Cole-Cole chargeability associated with the phase peak in dependence on
water saturation.
With decreasing saturation, a peak in the phase angle appeared. The Cole-Cole relaxation time
associated with this phase maximum varied only slightly with saturation (Figure 2.9a). Leroy,
et al. (2008) related the relaxation time to the radius (a) and the diffusion coefficient of the
counter-ions (Ds) in the Stern layer of the electrical triple-layer associated with the mineral
surface:
sD
a
2
2
=τ . (2.10)
Leroy et al. (2008) further argued that Ds does not deviate strongly from the diffusion
coefficient in the water phase for hydrated ions and used Ds = 2.45 × 10⁻⁹
m² s−1
. Using this
value, the Cole-Cole relaxation times found in this study are associated with a radius of 0.31
to 0.35 mm, which is in the same order as the mean grain radius of 0.1 mm.
Figure 2.9: Cole-Cole relaxation time associated with the phase peak in dependence on
a) water saturation and b) unsaturated hydraulic conductivity determined by
Hydrus1D.
The results for the relaxation time presented in Figure 2.9a are consistent with the mechanistic
models for partially saturated rocks developed by Jougnot et al. (2010) and Schmutz et
al. (2010). Their models assume that the relaxation time is mainly related to the polarization
of the Stern layer. Since the Stern layer is relatively unaffected by desaturation, these models

25
predict that relaxation time does not change with saturation and is mainly an expression of the
dominant grain size. However, there are also discrepancies between our data and the models
of Jougnot et al. (2010) and Schmutz et al. (2010). For example, the model of Schmutz et
al. (2010) predicts an increasing σ’’ with decreasing water saturation. This is not the case for
our measurements where σ’’ first increases and then decreases again with decreasing water
saturation (Figure 2.7b). As already suggested by Jougnot et al. (2010), the correspondence
between modeling results and data can perhaps be further improved by including a membrane
polarization term in these models.
Since the Cole-Cole relaxation time is nearly constant as a function of saturation, this implies
that the Cole-Cole relaxation time also shows little variation as a function of unsaturated
hydraulic conductivity (Figure 2.9b). A practical implication of this is that relaxation times
determined for well-sorted unconsolidated sands can be related to the saturated hydraulic
conductivity, but do not provide information on unsaturated hydraulic conductivity. Again,
the database of complex conductivity measurements on variably saturated soils needs to be
extended to assess the validity of this finding for a wider range of soil materials.
2.5.3 Electrical results for shrinking material
We have also conducted an experiment in the measurement cell for shrinking material. For
this experiment, a sieved soil sample from an agricultural soil with 13% sand, 70% silt, and
17% clay was used. The sample was packed as described above for the sand. During the
experiment it was necessary to adjust the upper part of the measurement cell to reestablish the
electrical contact between the ceramic plate and the sample (Figure 2.1c and d). Loss of
electrical contact was determined from the impedance between the upper current electrode
and the upper potential electrode and the lower current electrode and the lower potential
electrode, which is provided by the electrical impedance spectrometer system of Zimmermann
et al. (2008). If the real part of the impedance between the upper electrodes increased much
more than the impedance between the lower electrodes, this was a good indicator for the loss
of electrical contact.
The phase spectra for this shrinking soil are shown in Figure 2.10. Again, the phase values are
relatively low, even for unsaturated soil. No clear peak can be recognized, which is most
likely related to the wide grain and pore size distribution. It is interesting to note that the
phase initially decreased with decreasing saturation at higher frequencies and then it slightly
increased again. Already at low pressure, the electrical contact was lost twice because the soil
sample shrunk and cracks between the upper ceramic plate and the sample occurred. These
cracks resulted in deviating phase angles at low frequencies (Figure 2.10). After adjusting the
upper part of the measurement cell, the phase values were more plausible as indicated by the
arrows in Figure 2.10. The difference between the phase spectra before and after adjusting the
upper part of the measurement cell was as large as 2 mrad, which is high considering the
small phase angles that were observed for this soil. At a pressure of 200 hPa, horizontal
cracks at the height of the upper and lower potential electrodes appeared. Both the hydraulic
and the electrical measurements could not be interpreted anymore from this point onwards.
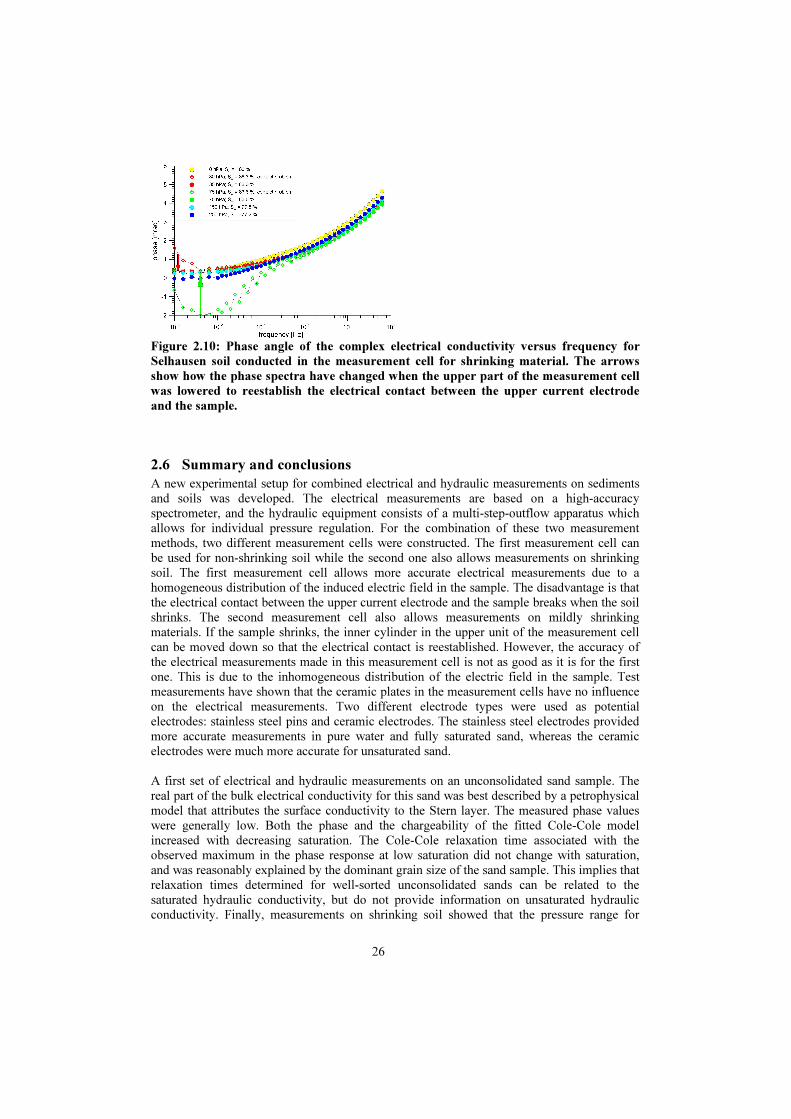
26
Figure 2.10: Phase angle of the complex electrical conductivity versus frequency for
Selhausen soil conducted in the measurement cell for shrinking material. The arrows
show how the phase spectra have changed when the upper part of the measurement cell
was lowered to reestablish the electrical contact between the upper current electrode
and the sample.
2.6 Summary and conclusions
A new experimental setup for combined electrical and hydraulic measurements on sediments
and soils was developed. The electrical measurements are based on a high-accuracy
spectrometer, and the hydraulic equipment consists of a multi-step-outflow apparatus which
allows for individual pressure regulation. For the combination of these two measurement
methods, two different measurement cells were constructed. The first measurement cell can
be used for non-shrinking soil while the second one also allows measurements on shrinking
soil. The first measurement cell allows more accurate electrical measurements due to a
homogeneous distribution of the induced electric field in the sample. The disadvantage is that
the electrical contact between the upper current electrode and the sample breaks when the soil
shrinks. The second measurement cell also allows measurements on mildly shrinking
materials. If the sample shrinks, the inner cylinder in the upper unit of the measurement cell
can be moved down so that the electrical contact is reestablished. However, the accuracy of
the electrical measurements made in this measurement cell is not as good as it is for the first
one. This is due to the inhomogeneous distribution of the electric field in the sample. Test
measurements have shown that the ceramic plates in the measurement cells have no influence
on the electrical measurements. Two different electrode types were used as potential
electrodes: stainless steel pins and ceramic electrodes. The stainless steel electrodes provided
more accurate measurements in pure water and fully saturated sand, whereas the ceramic
electrodes were much more accurate for unsaturated sand.
A first set of electrical and hydraulic measurements on an unconsolidated sand sample. The
real part of the bulk electrical conductivity for this sand was best described by a petrophysical
model that attributes the surface conductivity to the Stern layer. The measured phase values
were generally low. Both the phase and the chargeability of the fitted Cole-Cole model
increased with decreasing saturation. The Cole-Cole relaxation time associated with the
observed maximum in the phase response at low saturation did not change with saturation,
and was reasonably explained by the dominant grain size of the sand sample. This implies that
relaxation times determined for well-sorted unconsolidated sands can be related to the
saturated hydraulic conductivity, but do not provide information on unsaturated hydraulic
conductivity. Finally, measurements on shrinking soil showed that the pressure range for

27
which electrical measurements could be made was extended by using an adjustable upper part
of the measurement cell.

28
29
3 Spectral induced polarization measurements on variably saturated sand-clay mixtures
†
3.1 Introduction
In recent years, there has been a growing interest in using the spectral induced polarization
(SIP) method in environmental studies (see for example Vanhala, 1997; Kemna et al., 2000;
Kemna et al., 2004; Slater & Binley, 2006; Hördt et al., 2007; Williams et al., 2009). The
relationships between characteristics in the SIP response and lithological and pedological
parameters, such as grain size distribution (Lesmes & Morgan, 2001), pore size distribution
(Scott & Barker, 2003), specific surface area (Börner et al., 1996; Slater & Lesmes, 2002),
presence of clay minerals (Klein & Sill, 1982; Slater & Lesmes, 2002), and permeability
(Börner et al., 1996; Binley et al., 2005; Revil & Florsch, 2010) were investigated in several
studies. However, most of these studies were conducted on fully saturated samples.
To better understand the mechanisms causing polarization and to extend the range of SIP
applications to the vadose zone, it is important to investigate how the SIP response is affected
by water saturation. Several studies have investigated the SIP response of unsaturated
consolidated (e.g. Vinegar & Waxman, 1984; Worthington & Collar, 1984; Binley et al.,
2005; Jougnot et al., 2010) and unconsolidated samples (e.g. Titov et al., 2004; Ulrich &
Slater, 2004). Titov et al. (2004) conducted time-domain induced polarization (IP)
measurements on sands with varying saturation. Their results showed a maximum in the
chargeability at a water saturation of 18%. Interestingly, the relationship between log DC
resistivity and log saturation also showed a change in slope at this water saturation. Ulrich &
Slater (2004) also presented IP data of unsaturated unconsolidated porous media. In this
study, saturation was varied by evaporative drying and pressure drainage and imbibition.
They found a power-law dependence of the polarization magnitude on the saturation and
observed that the behavior of the imaginary conductivity varied strongly as a function of the
desaturation method (e.g. drainage or evaporation) and the sample lithology. Some samples
showed an initial increase and a subsequent decrease of the imaginary conductivity with
saturation, whereas other samples only showed an increase or decrease of the imaginary
conductivity. Although these studies provided important insights into the IP response of
unsaturated porous media, they did not analyze the frequency-dependent complex
conductivity as a function of saturation for a wide range of frequencies.
Binley et al. (2005) analyzed broadband measurements of complex electrical conductivity
(10 mHz to 1 kHz) as a function of saturation for sandstones. They were the first to report that
the relaxation time associated with a maximum in the phase of the complex conductivity
decreased with decreasing saturation. More recently, Jougnot et al. (2010) developed a
mechanistic model for partially saturated clay-rocks that considers the polarization of the
Stern layer of the electrical double layer and Maxwell-Wagner polarization. This model
predicts that the relaxation time is independent of saturation and is only affected by the
dominant diameter of the grains. The measurements on clay-rocks presented in Jougnot et al.
(2010) showed an increase of relaxation time with decreasing saturation, which was attributed
to an increase of ‘dominant length scale’ with desaturation due to clay mineral deformation
that increased the relaxation path length of the ions causing polarization.
† Adapted from K. Breede, A. Kemna, O. Esser, E. Zimmermann, H. Vereecken, and J.A. Huisman. Spectral
Induced Polarization measurements on variably saturated sand-clay mixtures. Revised to Near Surface
Geophysics (22.12.2011)

30
This overview clearly indicates that there is a need to extend the database of SIP
measurements on unsaturated samples. Therefore, the aim of this study is to investigate the
complex electrical conductivity for pure sand and three sand-clay mixtures in the mHz to kHz
frequency range as a function of frequency, saturation and clay content. In the remainder of
this paper, we first present the experimental set-up used to drain the four samples and to make
accurate measurements of the complex electrical conductivity. Next, sample preparation and
data interpretation using a Debye decomposition procedure is discussed. Finally, the observed
changes in the real and imaginary part of the electrical conductivity as a function of
frequency, saturation and clay content are discussed and conclusions are drawn.
3.2 Materials and Methods
3.2.1 Measurement setup
We developed an experimental setup for accurate SIP measurements on variably saturated
porous media (Figure 3.1). The soil sample holder has a height of 10 cm and an inner
diameter of 8 cm. Pressure was used to drain the samples in several steps. The advantage of
drainage over evaporative drying is that the electrical conductivity of the pore fluid remains
nearly constant during the experiment. The setup relies on a high-accuracy electrical
impedance spectrometer described by Zimmermann et al. (2008). The electrical impedance
over a frequency range from 1 mHz to 45 kHz was measured using a four-point electrode
array by applying an alternating sinusoidal current to the sample using two bronze plate
electrodes. The voltage and the phase shift between the applied current and measured voltage
were determined using non-polarizing potential electrodes. For more details on the
experimental set-up, see second chapter.
Figure 3.1: Sketch of experimental setup: A pump is used to desaturate the sample using
several pressure steps. Electrical measurements are conducted using a high-accuracy
impedance spectrometer. The high air-entry porous ceramic cones of the non-polarizing
potential electrodes are located in the sample to keep a good electrical contact.

31
3.2.2 Sample preparation
We investigated the complex conductivity as a function of water saturation for pure sand and
three sand-clay mixtures with 5, 10, and 20 weight-% clay content. The pure quartz sand used
in all four samples had a medium grain size of 0.2 mm and a mass related specific surface
area (Sm) of 0.104 m2 g
−1 determined using the BET method. For the sand-clay mixtures, a
silt-clay mixture composed of 29% kaolinite, 18% illite and 47% quartz was added to the
quartz sand. About 60% of the silt-clay mixture was smaller than 2 µm and more than 96%
was smaller than 63 µm. The Sm of the silt-clay mixture was 13.30 m2 g
−1. A summary of the
bulk density, porosity and estimated pore-volume related specific surface area (Spor) of each
of the four samples is provided in Table 3.1.
Table 3.1. Petrophysical properties of the pure sand and the sand-clay mixtures.
sand
Sand-clay mixtures
5% clay 10% clay 20% clay
bulk density [g/cm³] 1.62 1.66 1.71 1.71
porosity [%] 39.02 36.05 34.22 34.10
estimated Spor [µm−1
] 0.43 3.44 6.55 13.70
To prepare the sample, the material was first moistened with tap water with a conductivity of
450 µS cm-1
and then mixed so that the clay was well distributed in the sand. Some tap water
was filled in the sample holder and a layer of about 5 mm of moistened sand-clay mixture was
added. This procedure was repeated until the sample holder was filled. It was ensured that
supernatant water was present at all times during the filling procedure. Small air bubbles were
removed with a spoon during filling. The two non-polarizing ceramic potential electrodes
were installed in the sample during the packing procedure to ensure good contact and limit
soil disturbance by insertion.
At the beginning of each experiment, the filled sample holder was attached to the burette by a
flexible tube. To fully saturate the sample, the water level in the burette was maintained above
the top of the soil sample without applying pressure. After equilibrium was reached, the water
level in the burette was leveled with the top of the sample and an SIP measurement was
conducted. Next, the first pressure step was applied and the associated water outflow was
monitored by determining the water level in the burette using a calibrated pressure transducer.
When water outflow became negligibly small, it was assumed that hydrostatic equilibrium
was reached and an SIP measurement was made on two consecutive days. If the complex
electrical conductivity did not significantly change between consecutive days, the next
pressure step was applied. The distribution of the pressure steps was chosen such that the
sample was drained in small steps. This was considered to be important because preliminary
experiments showed that changes in the complex electrical conductivity were substantial even
for small changes in the water saturation. The experiment for the pure sand took about 1
month, while measurements on the sand-clay mixtures took about 3 months. At the end of
each experiment, the sample was oven-dried to obtain the water content, bulk density and
porosity. This information was combined with the measured water outflow to obtain the water
content of the sample. All experiments were performed in an air-conditioned laboratory with a
temperature of 20 ± 1°C.

32
3.2.3 Data interpretation
The geometrical factor of the four-point electrode configuration was used to convert the
measured impedance in complex electrical conductivity (σ*(ω)), which can be written as
( ) ( ) ( )ωσωσσωσϕ
′′+′==∗
iei
, (3.1)
where 12
−=i , ω denotes the angular frequency ( fπω 2= with frequency f), σ’(ω) is the real
part of σ*, σ’’(ω) is the imaginary part of σ*, σ is the magnitude of σ*, and ϕ is the phase
of σ*. The relationship between ϕ, σ’(ω) and σ’’(ω) is given by
( )( )( )
( )( )ωσ
ωσ
ωσ
ωσωϕ
′
′′≈
′
′′= arctan . (3.2)
The last approximation is only valid for small phase values, i.e. below 100 mrad.
To characterize the measured electrical spectra, we used Debye decomposition as proposed by
Morgan & Lesmes (1994) and adapted by Nordsiek & Weller (2008). In this procedure, the
magnitude and phase spectra of complex resistivity ( )(1)( ωσωρ∗∗
= ) are regarded as a
superposition of a certain number (N) of Debye spectra:
( )
+−−= ∑
=
∗
k
N
k
k
im
ωτρωρ
1
111
1
0, (3.3)
where each of the N Debye spectra is characterized by a chargeability mk and a relaxation time
τk, and ρ0 is the DC resistivity. We used an extension of the Debye decomposition approach
of Nordsiek & Weller (2008) proposed by Zisser et al. (2010), in which a weighting factor
between the real and the imaginary part of the normalized complex resistivity was introduced.
The discretization of the τ-axis was chosen such that 100 relaxation times logarithmically
spaced in the range from 10−5
to 105
s were obtained. The effect of electromagnetic coupling
at high frequencies was determined by fitting a Cole-Cole model to the high frequency data
and these coupling effects were subsequently removed from the measured data by subtracting
this fitted model, as previously proposed by Pelton et al. (1978).
3.3 Results and Discussion
The real part of the complex electrical conductivity, σ’, varied only marginally with
frequency. Therefore, σ’ is exemplarily shown at 1 Hz as a function of water saturation for
the pure sand and the three sand-clay mixtures (Figure 3.2). For the 10% and 20% sand-clay
mixtures, the saturation quickly dropped after the applied pressure was increased slightly
above the air-entry pressure of the soil. Therefore, no complex conductivity measurements are
available for saturations between 70% and 95% for these two sand-clay mixtures. Also, the
maximum air pressure range that can be achieved with the experimental setup did not allow
reaching saturations below 20% for the 10% and 20% sand-clay mixtures, which has led to a
rather narrow saturation range where electrical measurements are available.
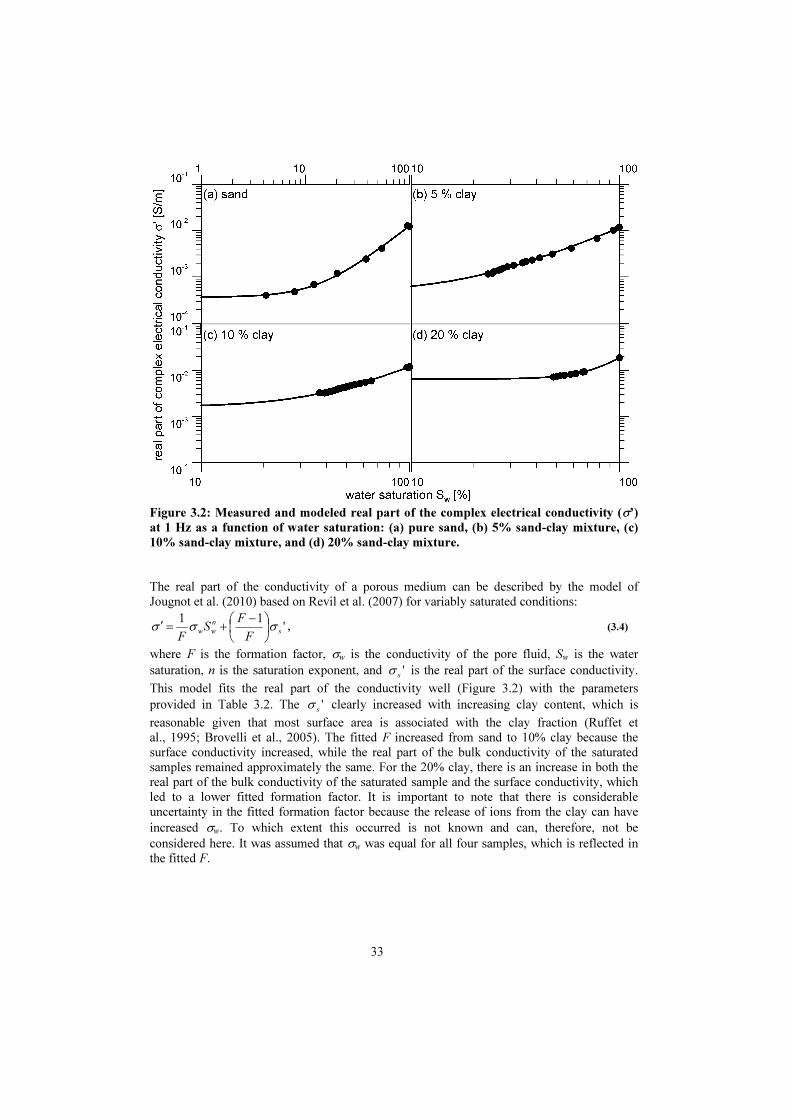
33
Figure 3.2: Measured and modeled real part of the complex electrical conductivity (σ’)
at 1 Hz as a function of water saturation: (a) pure sand, (b) 5% sand-clay mixture, (c)
10% sand-clay mixture, and (d) 20% sand-clay mixture.
The real part of the conductivity of a porous medium can be described by the model of
Jougnot et al. (2010) based on Revil et al. (2007) for variably saturated conditions:
'11
s
n
ww
F
FS
Fσσσ
−+=′ , (3.4)
where F is the formation factor, σw is the conductivity of the pore fluid, Sw is the water
saturation, n is the saturation exponent, and 's
σ is the real part of the surface conductivity.
This model fits the real part of the conductivity well (Figure 3.2) with the parameters
provided in Table 3.2. The 's
σ clearly increased with increasing clay content, which is
reasonable given that most surface area is associated with the clay fraction (Ruffet et
al., 1995; Brovelli et al., 2005). The fitted F increased from sand to 10% clay because the
surface conductivity increased, while the real part of the bulk conductivity of the saturated
samples remained approximately the same. For the 20% clay, there is an increase in both the
real part of the bulk conductivity of the saturated sample and the surface conductivity, which
led to a lower fitted formation factor. It is important to note that there is considerable
uncertainty in the fitted formation factor because the release of ions from the clay can have
increased σw. To which extent this occurred is not known and can, therefore, not be
considered here. It was assumed that σw was equal for all four samples, which is reflected in
the fitted F.
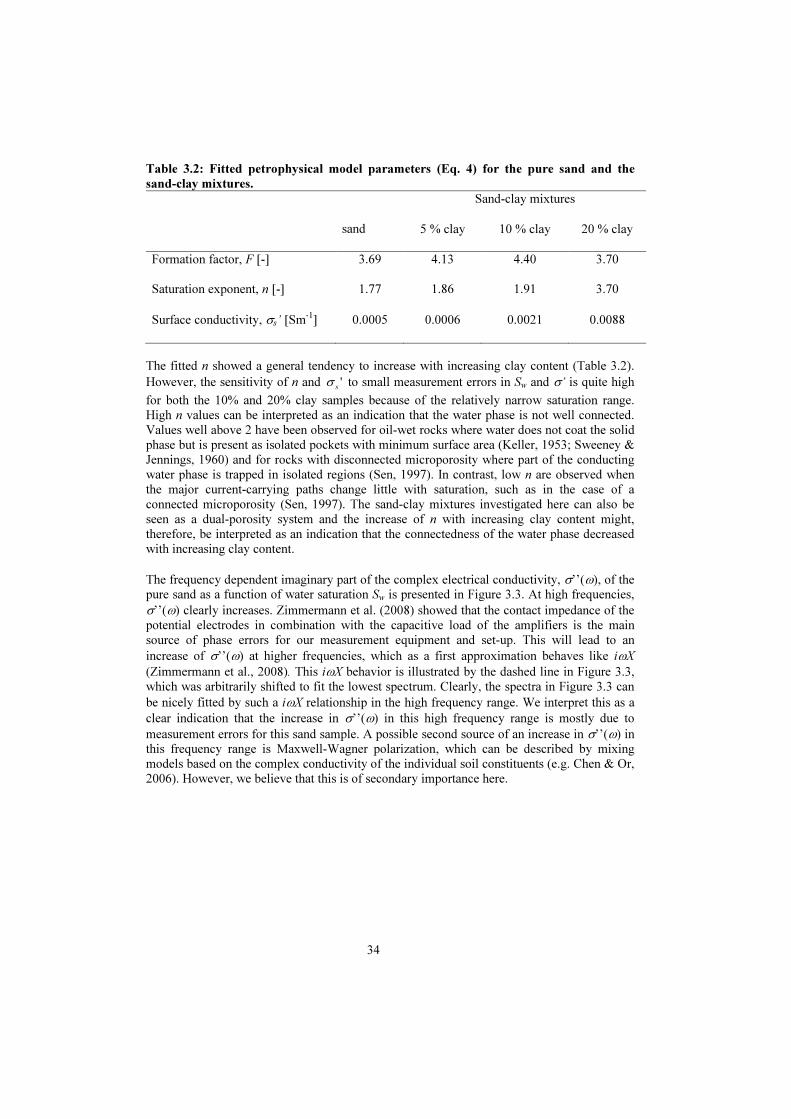
34
Table 3.2: Fitted petrophysical model parameters (Eq. 4) for the pure sand and the
sand-clay mixtures.
sand
Sand-clay mixtures
5 % clay 10 % clay 20 % clay
Formation factor, F [-] 3.69 4.13 4.40 3.70
Saturation exponent, n [-] 1.77 1.86 1.91 3.70
Surface conductivity, σs’ [Sm-1
] 0.0005 0.0006 0.0021 0.0088
The fitted n showed a general tendency to increase with increasing clay content (Table 3.2).
However, the sensitivity of n and 's
σ to small measurement errors in Sw and σ’ is quite high
for both the 10% and 20% clay samples because of the relatively narrow saturation range.
High n values can be interpreted as an indication that the water phase is not well connected.
Values well above 2 have been observed for oil-wet rocks where water does not coat the solid
phase but is present as isolated pockets with minimum surface area (Keller, 1953; Sweeney &
Jennings, 1960) and for rocks with disconnected microporosity where part of the conducting
water phase is trapped in isolated regions (Sen, 1997). In contrast, low n are observed when
the major current-carrying paths change little with saturation, such as in the case of a
connected microporosity (Sen, 1997). The sand-clay mixtures investigated here can also be
seen as a dual-porosity system and the increase of n with increasing clay content might,
therefore, be interpreted as an indication that the connectedness of the water phase decreased
with increasing clay content.
The frequency dependent imaginary part of the complex electrical conductivity, σ’’(ω), of the
pure sand as a function of water saturation Sw is presented in Figure 3.3. At high frequencies,
σ’’(ω) clearly increases. Zimmermann et al. (2008) showed that the contact impedance of the
potential electrodes in combination with the capacitive load of the amplifiers is the main
source of phase errors for our measurement equipment and set-up. This will lead to an
increase of σ’’(ω) at higher frequencies, which as a first approximation behaves like iωX
(Zimmermann et al., 2008). This iωX behavior is illustrated by the dashed line in Figure 3.3,
which was arbitrarily shifted to fit the lowest spectrum. Clearly, the spectra in Figure 3.3 can
be nicely fitted by such a iωX relationship in the high frequency range. We interpret this as a
clear indication that the increase in σ’’(ω) in this high frequency range is mostly due to
measurement errors for this sand sample. A possible second source of an increase in σ’’(ω) in
this frequency range is Maxwell-Wagner polarization, which can be described by mixing
models based on the complex conductivity of the individual soil constituents (e.g. Chen & Or,
2006). However, we believe that this is of secondary importance here.

35
Figure 3.3: Frequency-dependent imaginary part of the complex electrical conductivity
(σ’’) of the investigated pure sand as a function of water saturation.
For frequencies well below 1 kHz, the observed σ’’(ω) is not strongly affected by
measurement errors associated with the electrode contact impedance. Here, σ’’(ω) first
increased and then decreased with decreasing water saturation. In addition, a weak maximum
of σ’’(ω) in the low-frequency range indicates a characteristic frequency (f) at about 0.01 Hz
for water contents below 54% water saturation. For higher saturation, such a maximum was
not observed because of the extremely low phase angle (<0.1 mrad) related to the low σ’’(ω)
and relatively high σ’(ω). Such low phase angles are below the limit of what can be measured
with our experimental setup. Titov et al. (2002) suggested the following relationship between
grain diameter, d (in mm), and the characteristic frequency f (in Hz):
fd
π2
109.0= . (3.5)
Leroy et al. (2008) following the work of Schwarz (1962) suggested that d is related to the
relaxation time, τ, and the diffusion coefficient of the counter-ions (Ds) in the Stern layer of
the electrical triple-layer associated with the mineral surface:
sD
d
8
2
=τ (3.6)
Leroy et al. (2008) further argued that Ds does not deviate strongly from the diffusion
coefficient in the water phase for hydrated ions and used Ds = 2.45 × 10⁻⁹
m² s-1
. By rewriting
and substitution, this results in
fDDd
ss
π
ττ
2
1140.088 =⋅== . (3.7)

36
Accordingly, a characteristic frequency of 0.01 Hz corresponds with an average grain size of
0.36 – 0.56 mm, which is above the median grain size diameter of 0.2 mm for the sand used
in this study, but nevertheless in reasonable agreement given the uncertainty in Ds.
The imaginary conductivity spectra of the 5%, 10%, and 20% sand-clay mixtures showed a
more complex behavior in dependence on saturation (Figure 3.4 - Figure 3.6). Again, the
dashed lines indicate the expected iωX behavior related to the electrode contact impedance.
The lines were shifted to fit the lowest spectrum for the highest frequency. In contrast to
σ’’(ω) for the sand sample, the increase in σ’’(ω) above 1 kHz is not well described by iωX
for the three sand-clay mixtures. Clearly, σ’’(ω) at these frequencies is not solely determined
by measurement errors associated with the electrode contract impedance. This is further
supported by the increasing deviation from iωX with increasing clay content.
Figure 3.4: Frequency-dependent imaginary part of the complex electrical conductivity
(σ’’) of the investigated sand-clay mixture with 5% clay content as a function of water
saturation.

37
Figure 3.5: Frequency-dependent imaginary part of the complex electrical conductivity
(σ’’) of the investigated sand-clay mixture with 10% clay content as a function of water
saturation.
Figure 3.6: Frequency-dependent imaginary part of the complex electrical conductivity
(σ’’) of the investigated sand-clay mixture with 20% clay content as a function of water
saturation.
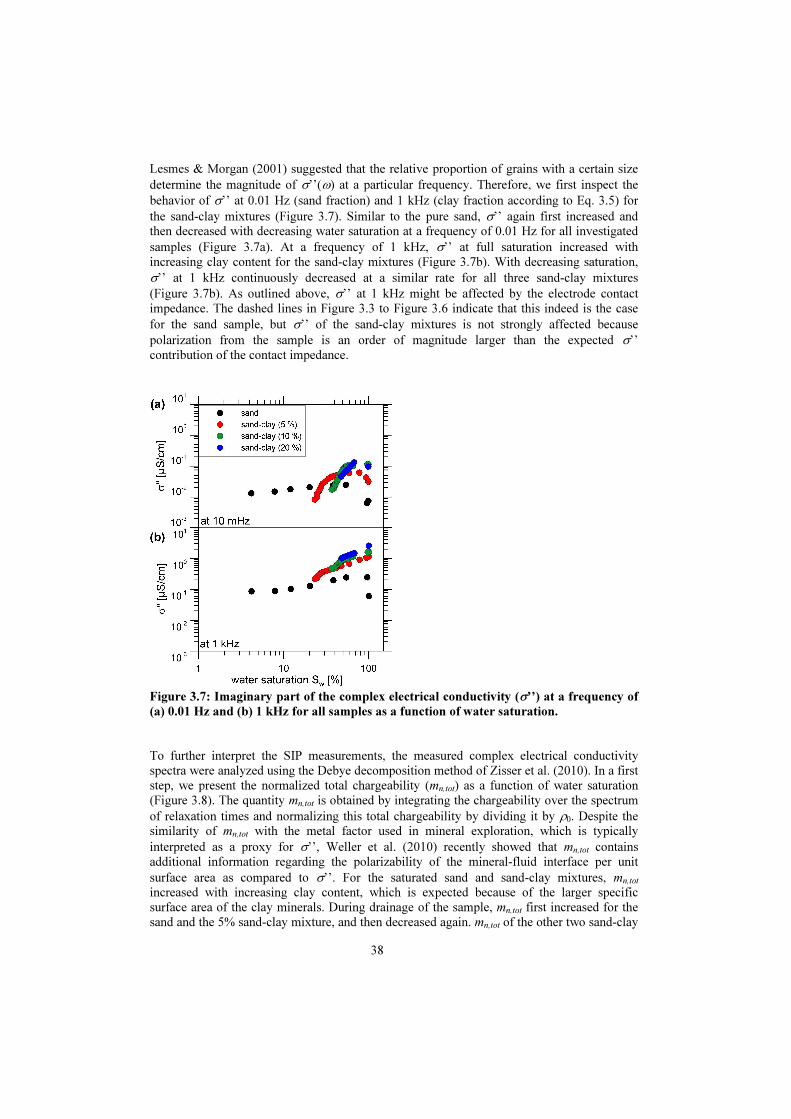
38
Lesmes & Morgan (2001) suggested that the relative proportion of grains with a certain size
determine the magnitude of σ’’(ω) at a particular frequency. Therefore, we first inspect the
behavior of σ’’ at 0.01 Hz (sand fraction) and 1 kHz (clay fraction according to Eq. 3.5) for
the sand-clay mixtures (Figure 3.7). Similar to the pure sand, σ’’ again first increased and
then decreased with decreasing water saturation at a frequency of 0.01 Hz for all investigated
samples (Figure 3.7a). At a frequency of 1 kHz, σ’’ at full saturation increased with
increasing clay content for the sand-clay mixtures (Figure 3.7b). With decreasing saturation,
σ’’ at 1 kHz continuously decreased at a similar rate for all three sand-clay mixtures
(Figure 3.7b). As outlined above, σ’’ at 1 kHz might be affected by the electrode contact
impedance. The dashed lines in Figure 3.3 to Figure 3.6 indicate that this indeed is the case
for the sand sample, but σ’’ of the sand-clay mixtures is not strongly affected because
polarization from the sample is an order of magnitude larger than the expected σ’’
contribution of the contact impedance.
Figure 3.7: Imaginary part of the complex electrical conductivity (σ’’) at a frequency of
(a) 0.01 Hz and (b) 1 kHz for all samples as a function of water saturation.
To further interpret the SIP measurements, the measured complex electrical conductivity
spectra were analyzed using the Debye decomposition method of Zisser et al. (2010). In a first
step, we present the normalized total chargeability (mn,tot) as a function of water saturation
(Figure 3.8). The quantity mn,tot is obtained by integrating the chargeability over the spectrum
of relaxation times and normalizing this total chargeability by dividing it by ρ0. Despite the
similarity of mn,tot with the metal factor used in mineral exploration, which is typically
interpreted as a proxy for σ’’, Weller et al. (2010) recently showed that mn,tot contains
additional information regarding the polarizability of the mineral-fluid interface per unit
surface area as compared to σ’’. For the saturated sand and sand-clay mixtures, mn,tot
increased with increasing clay content, which is expected because of the larger specific
surface area of the clay minerals. During drainage of the sample, mn,tot first increased for the
sand and the 5% sand-clay mixture, and then decreased again. mn,tot of the other two sand-clay

39
mixtures (10% and 20% clay) seemed to have remained relatively constant upon desaturation
initially, but then decreased rapidly. However, this is somewhat uncertain due to a lack of
electrical measurements. Generally, the behavior of mn,tot is consistent with the interpretation
of σ’’ provided earlier.
Figure 3.8: Normalized total chargeability (mn,tot) of all samples as a function of water
saturation.
It is interesting to note that a maximum in mn,tot at moderate saturation for the pure sand
(Figure 3.8) occurred in a water saturation range where the relationship between log(σ’) and
log(Sw) also showed a change in slope because of the increasing importance of surface
conductivity (Figure 3.2). This was also observed by Titov et al. (2004) for pure sands.
However, the maximum in mn,tot was at a water saturation of about 38% for the pure sand in
this study, whereas the maximum in chargeability reported by Titov et al. (2004) occurred at a
lower saturation of 18%. In addition, for the 5% sand-clay mixture two local maxima instead
of one maximum were observed for mn,tot (Figure 3.8). For the 10% and 20% sand-clay
mixtures, a maximum in mn,tot is not observed.
We propose the following conceptual model to explain the variation of σ’’(ω) and mn,tot for
the sand-clay mixtures. It is based on the assumption that σ’’(ω) and mn,tot can be interpreted
simply as a superpositioning of two individual conceptual models for the sand and clay
fraction (both illustrated in Figure 3.9). The conceptual model of the sand fraction is based on
the short-narrow pore model of Titov et al. (2002, 2004). This model proposes that the
intergrain pore spaces act as large pores, while the grain contact regions act as narrow pores in
a saturated porous medium (Figure 3.9a). As the electrical current follows the way of
minimum resistance, most of it flows through the bulk solution and only a small amount of
current flows through the polarizable part of the cells near the grain contacts. With decreasing
40
saturation, the largest pores are desaturated while water remains at the grain contacts.
Therefore, the grain contact regions become the large pores, while the water films around the
sand grains act as narrow pores (Figure 3.9c). Since the electrical current flow cannot by-pass
the polarizable part of the cells near the grain contacts anymore, Titov et al. (2002, 2004)
postulated that the chargeability must first increase with decreasing saturation. With a
progressing decrease in water saturation, the amount of water in the grain contact regions is
reduced, which results in a decrease of the difference between the effective pore diameters
associated with grain contacts and water films, and thus to a decrease in chargeability with
decreasing saturation (Figure 3.9d) as observed for all sand-clay mixtures (Figure 3.7a).
The conceptual model for the clay fraction (also Figure 3.9) is an attempt to explain the
continuous decrease of σ’’ at 1 kHz observed in the presence of clay (Figure 3.7b). When the
sand-clay mixtures are fully saturated, we speculate that the clay particles are loosely
arranged in the water-filled pores (Figure 3.9a). Although such an arrangement is not typically
observed for natural soils, we believe that this a realistic assumption for the packed sand-clay
mixtures used in this study. With decreasing water saturation, the clay particles are rearranged
into a smaller available water-filled pore volume (Figure 3.9b). Apparently, this
rearrangement results in a decrease of the specific surface area of the clay minerals, and an
associated decrease of σ’’ at a frequency of 1 kHz (Figure 3.7b).
Figure 3.9: Conceptual model for electrical response associated with unsaturated sand-
clay mixtures. a) Full saturation: Intergrain pore spaces act as large pores, while the
grain contact regions act as narrow pores. The clay minerals are mainly loosely
arranged within the entire saturated pore space. b) Medium saturation: The clay
minerals are rearranged into a smaller available saturated pore volume. Some of the
clay particles are associated with the sand grains. c) Low saturation: Grain contact
regions become the large pores, while the water films around the sand grains act as
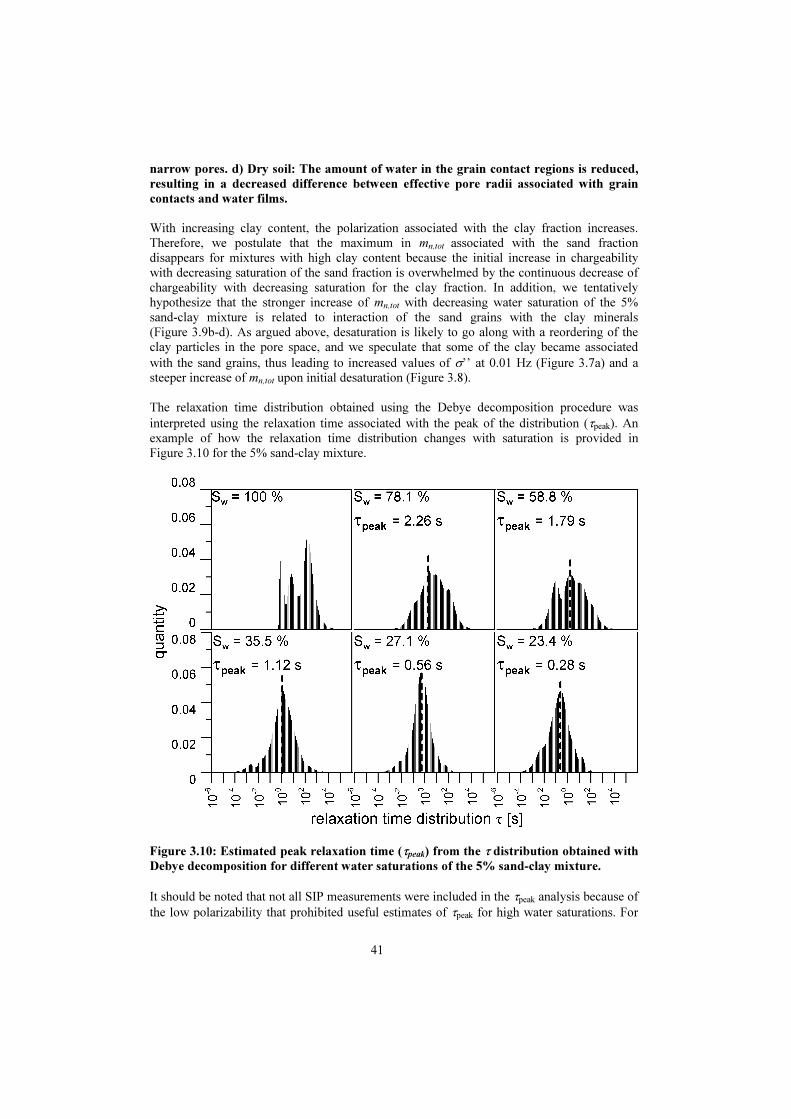
41
narrow pores. d) Dry soil: The amount of water in the grain contact regions is reduced,
resulting in a decreased difference between effective pore radii associated with grain
contacts and water films.
With increasing clay content, the polarization associated with the clay fraction increases.
Therefore, we postulate that the maximum in mn,tot associated with the sand fraction
disappears for mixtures with high clay content because the initial increase in chargeability
with decreasing saturation of the sand fraction is overwhelmed by the continuous decrease of
chargeability with decreasing saturation for the clay fraction. In addition, we tentatively
hypothesize that the stronger increase of mn,tot with decreasing water saturation of the 5%
sand-clay mixture is related to interaction of the sand grains with the clay minerals
(Figure 3.9b-d). As argued above, desaturation is likely to go along with a reordering of the
clay particles in the pore space, and we speculate that some of the clay became associated
with the sand grains, thus leading to increased values of σ’’ at 0.01 Hz (Figure 3.7a) and a
steeper increase of mn,tot upon initial desaturation (Figure 3.8).
The relaxation time distribution obtained using the Debye decomposition procedure was
interpreted using the relaxation time associated with the peak of the distribution (τpeak). An
example of how the relaxation time distribution changes with saturation is provided in
Figure 3.10 for the 5% sand-clay mixture.
Figure 3.10: Estimated peak relaxation time (τpeak) from the τ distribution obtained with
Debye decomposition for different water saturations of the 5% sand-clay mixture.
It should be noted that not all SIP measurements were included in the τpeak analysis because of
the low polarizability that prohibited useful estimates of τpeak for high water saturations. For
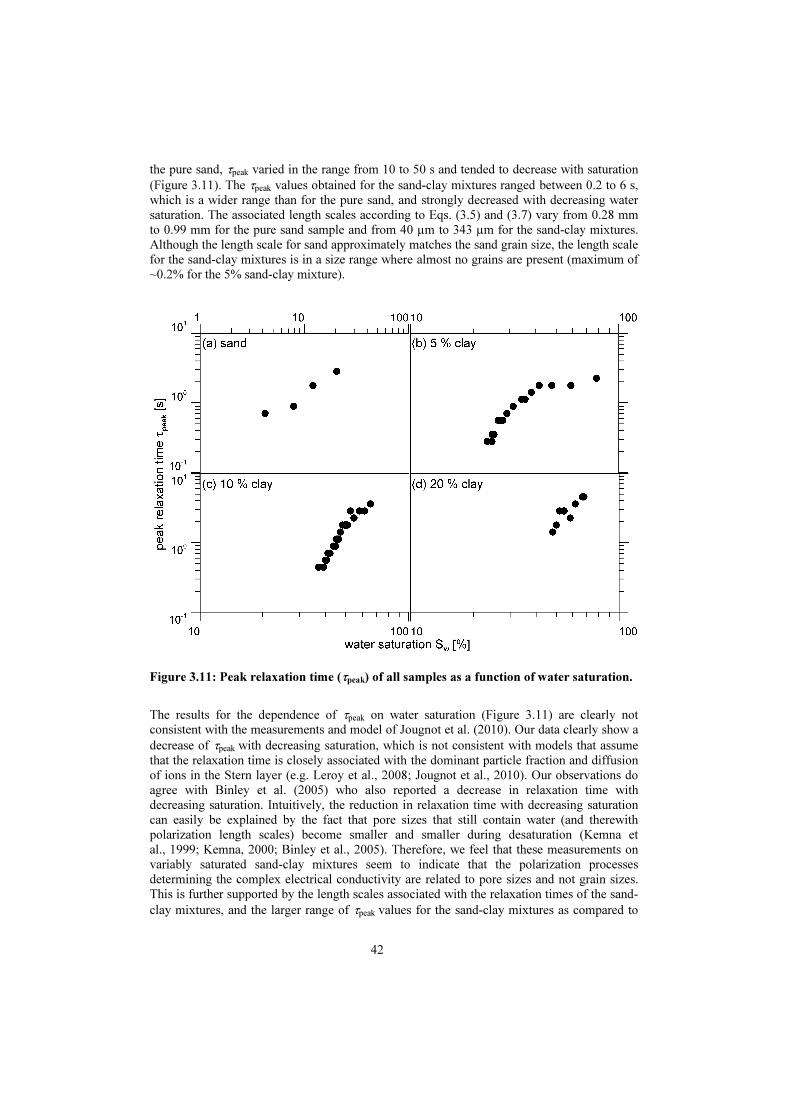
42
the pure sand, τpeak varied in the range from 10 to 50 s and tended to decrease with saturation
(Figure 3.11). The τpeak values obtained for the sand-clay mixtures ranged between 0.2 to 6 s,
which is a wider range than for the pure sand, and strongly decreased with decreasing water
saturation. The associated length scales according to Eqs. (3.5) and (3.7) vary from 0.28 mm
to 0.99 mm for the pure sand sample and from 40 µm to 343 µm for the sand-clay mixtures.
Although the length scale for sand approximately matches the sand grain size, the length scale
for the sand-clay mixtures is in a size range where almost no grains are present (maximum of
~0.2% for the 5% sand-clay mixture).
Figure 3.11: Peak relaxation time (τpeak) of all samples as a function of water saturation.
The results for the dependence of τpeak on water saturation (Figure 3.11) are clearly not
consistent with the measurements and model of Jougnot et al. (2010). Our data clearly show a
decrease of τpeak with decreasing saturation, which is not consistent with models that assume
that the relaxation time is closely associated with the dominant particle fraction and diffusion
of ions in the Stern layer (e.g. Leroy et al., 2008; Jougnot et al., 2010). Our observations do
agree with Binley et al. (2005) who also reported a decrease in relaxation time with
decreasing saturation. Intuitively, the reduction in relaxation time with decreasing saturation
can easily be explained by the fact that pore sizes that still contain water (and therewith
polarization length scales) become smaller and smaller during desaturation (Kemna et
al., 1999; Kemna, 2000; Binley et al., 2005). Therefore, we feel that these measurements on
variably saturated sand-clay mixtures seem to indicate that the polarization processes
determining the complex electrical conductivity are related to pore sizes and not grain sizes.
This is further supported by the length scales associated with the relaxation times of the sand-
clay mixtures, and the larger range of τpeak values for the sand-clay mixtures as compared to

43
the pure sand, which is a reflection of the wider range of pore diameters present in the sand-
clay mixtures as compared to the pure sand, which only has a small range of pores.
3.4 Conclusions
We investigated the SIP properties of variably saturated sand and sand-clay mixtures using a
novel measurement set-up allowing pressure drainage and SIP measurements with a high
accuracy. The SIP spectra were interpreted by Debye decomposition, which provided a
relaxation time distribution and a chargeability distribution that was converted to a
normalized total chargeability (mn,tot). The results showed that mn,tot of the fully saturated
samples increased with increasing clay content due to the larger specific surface area of the
clay minerals. Using this dependence, it might be possible to determine the clay content of
different saturated materials from mn,tot. In addition, we found that mn,tot first increased and
then decreased upon desaturation for the pure sand and the 5% sand-clay mixture. Just as
Titov et al. (2004), we found that the maxima of mn,tot coincided with changes in the slope of
logσ’ versus logSw (i.e. changes in the saturation exponent). The mn,tot values for the 10% and
20% sand-clay mixtures only decreased with saturation.
The behavior of σ’’(ω) and mn,tot for the sand and sand-clay mixtures were explained using a
superpositioning of two individual conceptual models for the sand and clay fraction. The
conceptual model of the sand fraction is based on the short-narrow pore model of Titov et
al., (2002, 2004), which explains the initial increase and subsequent decrease of mn,tot with
decreasing saturation. The conceptual model for the clay fraction assumes a rearrangement of
the clay in the water-filled pore space with decreasing saturation, and an associated decrease
in specific surface area and polarizability. This explains the decrease of mn,tot with decreasing
saturation for the 10% and 20% sand-clay mixtures
The relaxation time, τpeak, decreased strongly with decreasing water saturation for the sand-
clay mixtures, but only showed a tendency to decrease for the pure sand. The decrease of τpeak
with decreasing water saturation can intuitively be explained by the decrease of the sizes of
the active pores during the desaturation process. The strong decrease in relaxation time in the
sand-clay mixtures was attributed to the wider range of pores as compared to the pure sand.
These results have implications for direct attempts to estimate saturated hydraulic
conductivity from the relaxation time. In pure sand or sandstone with a narrow pore size
distribution, it might, as a first approximation, be reasonable to use relaxation times
determined on unsaturated samples to estimate saturated hydraulic conductivity. However, for
samples with a wide pore size distribution, this will not be a reasonable approximation and
clearly the relaxation times obtained for unsaturated samples should first be corrected to an
equivalent relaxation time at saturation before an estimation of saturated hydraulic
conductivity can be done. It might also be possible to relate the relaxation time for an
unsaturated sample directly to the unsaturated hydraulic conductivity. This will be explored in
a follow-up study.
Finally, the strong decrease of the peak relaxation time with decreasing water saturation
suggests that the application of grain-size based mechanistic models, such as described by
Jougnot et al. (2010) and Schmutz et al. (2010) do not capture the behavior of our samples
because these models predict that relaxation time does not change with water saturation.
Instead, mechanistic models that explain SIP properties from polarization in the pore space
seem warranted to explain the measurements on variable saturated porous media presented
here.

44
45
4 Electrical-hydraulic relationships of unsaturated sand-clay mixtures using spectral induced polarization
‡
4.1 Introduction
Hydraulic conductivity is a key parameter in several branches of earth sciences and
engineering, such as hydrogeology, soil science, geotechnics, and petroleum engineering. By
controlling the magnitude of flow, the hydraulic conductivity is important for the protection
of groundwater aquifers, the remediation of contaminated sites, and the long-term storage of
toxic or radioactive materials to name but a few examples.
Saturated hydraulic conductivity depends both on porous medium properties, such as
porosity, pore size, pore structure, and tortuosity (Dias et al., 2008), as well as on the
properties of the fluid (i.e., density and viscosity). For the determination of the saturated
hydraulic conductivity, Ks, two general approaches are available: an empirical and an
experimental approach. The empirical approach attempts to estimate hydraulic conductivity
from soil physical properties that are more widely available and easier to measure, such as
pore size distribution (Shepherd, 1989), grain size distribution, and soil texture (Wösten et
al., 2001; Vereecken et al., 2010). The experimental approaches are based on Darcy’s law and
can be classified in laboratory and field methods. These experiments typically use a hydraulic
excitation of the system and the reaction of the system is interpreted in terms of saturated
hydraulic conductivity using analytical or numerical modeling techniques (see for example
Dane & Topp, 2002). However, a disadvantage of all experimental approaches is that they are
time-consuming and supply only local information.
In the last two decades, geoelectrical methods with alternating current like Induced
Polarization (IP) and Spectral Induced Polarization (SIP) have shown promising results to
determine hydraulic properties of rocks (Börner et al., 1996) and unconsolidated sediments
(Slater & Lesmes, 2002). These methods determine complex electrical resistivity for a single
frequency (IP) or across a broad frequency range (SIP) from the ratio and phase shift between
induced sinusoidal current signals and measured voltage signals. The real part of the complex
electrical resistivity is a measure for ohmic conduction in the porous medium. The imaginary
part of the electrical resistivity is a measure for polarization processes occurring in the
sample. These polarization effects depend on the specific surface (e.g., Börner & Schön,
1991; (Weller et al., 2010, 2011), the cation exchange capacity (e.g. Vinegar & Waxman,
1984; Scott & Barker, 2006), grain size distribution (e.g. Revil & Florsch, 2010), pore size
distribution (e.g., Titov et al., 2002; Binley et al., 2005), pore-throat size (Scott & Barker,
2003), tortuosity (e.g., Titov et al., 2002, 2004; Kruschwitz et al., 2010), electrical
conductivity (e.g., Weller et al., 2010; Kruschwitz et al., 2010) and chemical composition of
the pore fluid (Weller et al., 2010; Vaudelet et al., 2011a, 2011b).
In more detail, polarization effects in porous media can be understood as follows. Due to the
application of electric current, ions are moved from their original position in the pore space
and move in the direction of the electrical field. The distance that ions move away from their
original position is the relaxation length and the time which is required to cover this distance
is the relaxation time. Relaxation processes are governed by polarization mechanisms in the
electrical double layer (EDL) occurring at the interface between the solid phase and the
‡ Adapted from K. Breede, A. Kemna, O. Esser, E. Zimmermann, H. Vereecken, and J.A. Huisman. Electrical-
hydraulic relationships of unsaturated sand-clay mixtures using spectral induced polarization. Will be submitted
to Vadose Zone Journal

46
electrolyte. At this interface, an EDL consisting of the Stern layer and the diffuse layer is
formed due to diffusive and electrostatic forces. In porous media like soils, the solid surface
usually has a negative charge that is counterbalanced by the positive charge of the Stern and
diffuse layer. The thickness of this electrical double layer usually remains thin with respect to
the size of the pore throats and the grain size (Revil & Florsch, 2010).
There are different polarization mechanisms like electrode polarization, membrane
polarization and interface polarization that might act in the mHz to kHz frequency range. The
latter one, also called Maxwell-Wagner effect, is important at kHZ frequencies and higher.
For frequencies smaller than 1 kHz, polarization is related to redistribution of ionic charge in
the EDL. There are two prevailing views concerning the dominant polarization mechanism for
IP and SIP: the granular model (e.g., Lesmes & Morgan, 2001; Leroy et al., 2008; Revil &
Florsch, 2010) and the pore model (e.g., Titov et al., 2002; Scott & Barker, 2003; Binley et
al., 2005). The most recent version of the granular model assumes that polarization is rooted
in tangential movement of ions in the Stern layer of the EDL (Revil & Florsch, 2010). For this
model, relaxation time is related to the ion diffusion coefficient (D) and the grain radius (R),
according to the equation of Schwarz (1962):
D
R
2
2
=τ (4.1)
The pore model is based on local ion concentration gradients occurring in areas of pore radii
variation (Titov et al., 2004). For this model, the relaxation time is related to the ion diffusion
coefficient (D) and the characteristic diffusion length (l) (Kormiltsev, 1963):
D
l
4
2
=τ (4.2)
If the narrow pore is much shorter than the large pore, l is equal to the length of the narrow
pore (Titov et al., 2004).
In both models, electrical relaxation times are related to important characteristic length scales
in porous media that are known to exert key controls on the hydraulic conductivity. Indeed,
promising relationships between the electrical relaxation time and the saturated hydraulic
conductivity have been observed for instance by Binley et al. (2005) and Kemna et al. (2005).
Both studies suggested that the relaxation time distribution depends on the pore size
distribution of the soil and that it might be possible to determine the unsaturated hydraulic
conductivity from the relaxation time distribution. However, we are not aware of any studies
correlating the relaxation time with the unsaturated hydraulic conductivity. In previous work
(Breede et al., 2011), we presented a new measurement setup for joint hydraulic and electric
measurements on unsaturated porous media. Measurements with a pure sand illustrated the
ability of this new joint measurement setup for accurate SIP measurements on unsaturated
porous media. Breede et al. (2012) studied the dependence of SIP on water saturation for a
pure sand sample and three sand-clay mixtures. It could be shown that the peak relaxation
time decreased with decreasing water saturation and that the frequencies for which phase
maxima occurred could not be correlated to grain sizes that were available in the samples.
The aim of this study is to investigate relationships between SIP and the unsaturated hydraulic
conductivity using the measurements previously analyzed in Breede et al. (2012) with respect
to water content. The remainder of the paper is organized as follows. First, we present our
experimental setup for combined electrical and hydraulic measurements and describe the
sample properties and our experimental approach to characterize their hydraulic and electrical
properties. Next, we discuss relationships between SIP and the unsaturated hydraulic

47
conductivity in the results and discussion section. In the final section, the main conclusions of
our study are presented.
4.2 Materials and Methods
4.2.1 Measurement setup
Electrical and hydraulic measurements were conducted using a joint measurement setup that
is described in detail by Breede et al. (2011). A simplified sketch of the set-up is shown in
Figure 4.1. The measurement column consisted of three parts: a sample holder with a height
of 10 cm and a diameter of 8 cm, which was located in-between two water reservoirs that
were separated from the sample by ceramic plates with a thickness of 0.7 cm and a high air-
entry pressure that ensured that they remained saturated throughout the experiment. Porous
bronze plate electrodes for the current injection were located at the top of the upper water
reservoir and the bottom of the lower reservoir. Two non-polarizable electrodes with a
ceramic tip were inserted in the sample holder with the ceramic tip in direct contact with the
sample to ensure a good contact even when the sample was relatively dry. Pressure was
applied in several steps to the sample via a tube that was connected to the top of the sample
through the top ceramic plate as is commonly done in so-called Multi-Step Outflow (MSO)
experiments (for details see van Dam et al., 1994). The water outflow from the sample flowed
into a burette, and the water height in the burette was recorded continuously so that the water
content of the sample could be calculated at all times. The advantage of pressure drainage
over evaporative drying is that the electrical resistivity of the pore fluid remains almost
constant.
Figure 4.1: Simplified sketch of the measurement column for joint hydraulic and electric
measurements: Ce 1 and ce 2 are current electrodes being porous bronze plate
electrodes. Cp1 and cp2 are ceramic plates with an air-entry pressure of 1 bar. Pe1 and
pe2 are non-polarizable electrodes consisting of a Plexiglas tube filled with a calcium
chloride solution and having a ceramic cone with an air-entry pressure of 1 bar.
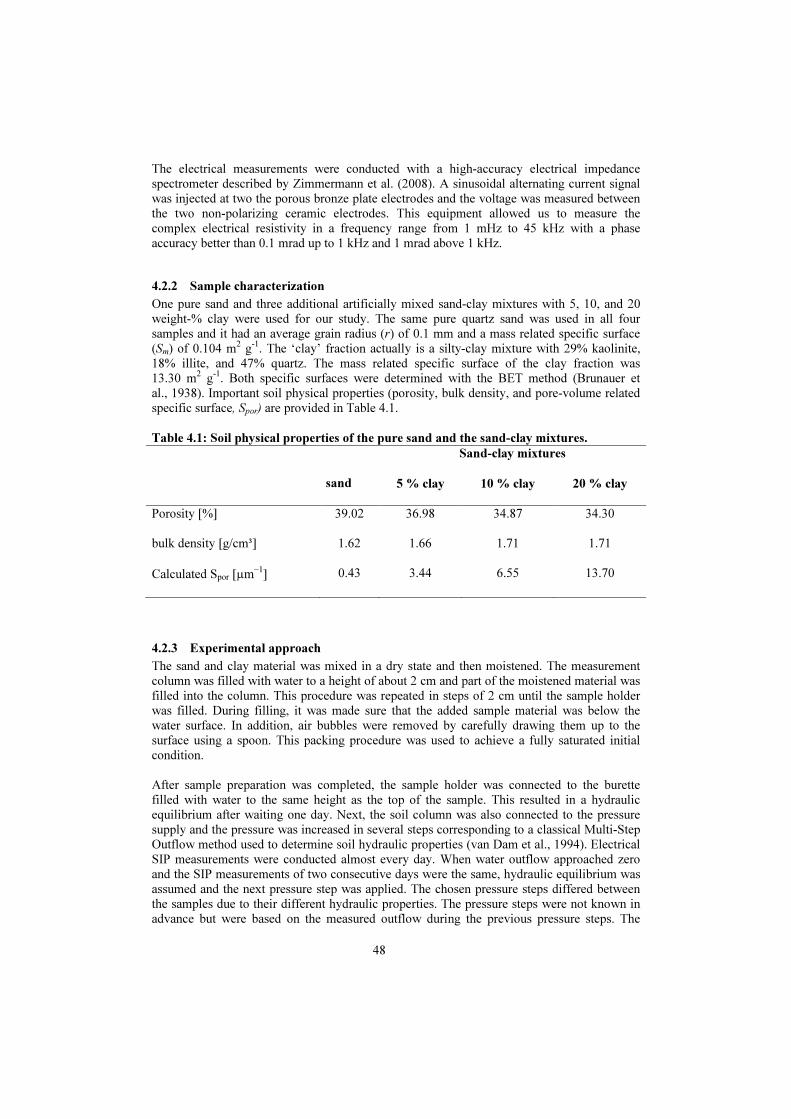
48
The electrical measurements were conducted with a high-accuracy electrical impedance
spectrometer described by Zimmermann et al. (2008). A sinusoidal alternating current signal
was injected at two the porous bronze plate electrodes and the voltage was measured between
the two non-polarizing ceramic electrodes. This equipment allowed us to measure the
complex electrical resistivity in a frequency range from 1 mHz to 45 kHz with a phase
accuracy better than 0.1 mrad up to 1 kHz and 1 mrad above 1 kHz.
4.2.2 Sample characterization
One pure sand and three additional artificially mixed sand-clay mixtures with 5, 10, and 20
weight-% clay were used for our study. The same pure quartz sand was used in all four
samples and it had an average grain radius (r) of 0.1 mm and a mass related specific surface
(Sm) of 0.104 m2 g
-1. The ‘clay’ fraction actually is a silty-clay mixture with 29% kaolinite,
18% illite, and 47% quartz. The mass related specific surface of the clay fraction was
13.30 m2 g
-1. Both specific surfaces were determined with the BET method (Brunauer et
al., 1938). Important soil physical properties (porosity, bulk density, and pore-volume related
specific surface, Spor) are provided in Table 4.1.
Table 4.1: Soil physical properties of the pure sand and the sand-clay mixtures.
sand
Sand-clay mixtures
5 % clay 10 % clay 20 % clay
Porosity [%] 39.02 36.98 34.87 34.30
bulk density [g/cm³] 1.62 1.66 1.71 1.71
Calculated Spor [µm−1
] 0.43 3.44 6.55 13.70
4.2.3 Experimental approach
The sand and clay material was mixed in a dry state and then moistened. The measurement
column was filled with water to a height of about 2 cm and part of the moistened material was
filled into the column. This procedure was repeated in steps of 2 cm until the sample holder
was filled. During filling, it was made sure that the added sample material was below the
water surface. In addition, air bubbles were removed by carefully drawing them up to the
surface using a spoon. This packing procedure was used to achieve a fully saturated initial
condition.
After sample preparation was completed, the sample holder was connected to the burette
filled with water to the same height as the top of the sample. This resulted in a hydraulic
equilibrium after waiting one day. Next, the soil column was also connected to the pressure
supply and the pressure was increased in several steps corresponding to a classical Multi-Step
Outflow method used to determine soil hydraulic properties (van Dam et al., 1994). Electrical
SIP measurements were conducted almost every day. When water outflow approached zero
and the SIP measurements of two consecutive days were the same, hydraulic equilibrium was
assumed and the next pressure step was applied. The chosen pressure steps differed between
the samples due to their different hydraulic properties. The pressure steps were not known in
advance but were based on the measured outflow during the previous pressure steps. The
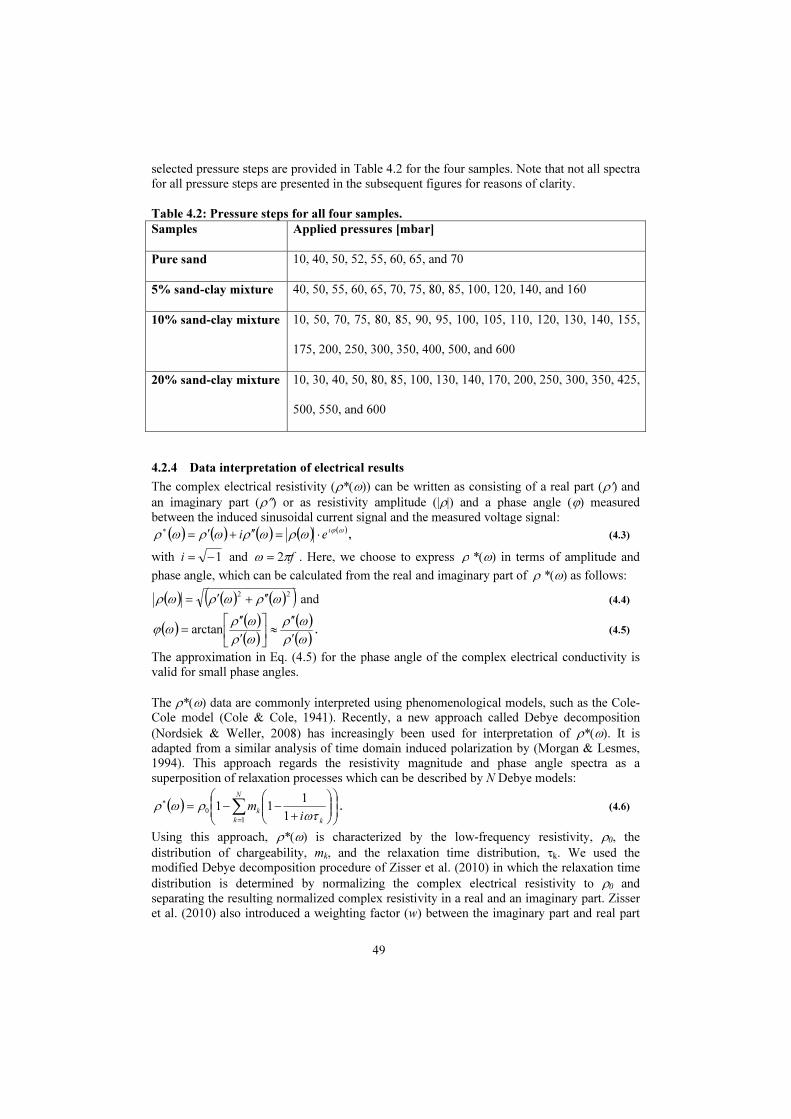
49
selected pressure steps are provided in Table 4.2 for the four samples. Note that not all spectra
for all pressure steps are presented in the subsequent figures for reasons of clarity.
Table 4.2: Pressure steps for all four samples.
Samples Applied pressures [mbar]
Pure sand 10, 40, 50, 52, 55, 60, 65, and 70
5% sand-clay mixture 40, 50, 55, 60, 65, 70, 75, 80, 85, 100, 120, 140, and 160
10% sand-clay mixture 10, 50, 70, 75, 80, 85, 90, 95, 100, 105, 110, 120, 130, 140, 155,
175, 200, 250, 300, 350, 400, 500, and 600
20% sand-clay mixture 10, 30, 40, 50, 80, 85, 100, 130, 140, 170, 200, 250, 300, 350, 425,
500, 550, and 600
4.2.4 Data interpretation of electrical results
The complex electrical resistivity (ρ*(ω)) can be written as consisting of a real part (ρ′) and
an imaginary part (ρ″) or as resistivity amplitude (|ρ|) and a phase angle (ϕ) measured
between the induced sinusoidal current signal and the measured voltage signal:
( ) ( ) ( ) ( ) ( )ωϕωρωρωρωρ
iei ⋅=′′+′=
∗
, (4.3)
with 1−=i and fπω 2= . Here, we choose to express ρ *(ω) in terms of amplitude and
phase angle, which can be calculated from the real and imaginary part of ρ *(ω) as follows:
( ) ( ) ( )( )22
ωρωρωρ ′′+′= and (4.4)
( )( )( )
( )( )ωρ
ωρ
ωρ
ωρωϕ
′
′′≈
′
′′= arctan . (4.5)
The approximation in Eq. (4.5) for the phase angle of the complex electrical conductivity is
valid for small phase angles.
The ρ*(ω) data are commonly interpreted using phenomenological models, such as the Cole-
Cole model (Cole & Cole, 1941). Recently, a new approach called Debye decomposition
(Nordsiek & Weller, 2008) has increasingly been used for interpretation of ρ*(ω). It is
adapted from a similar analysis of time domain induced polarization by (Morgan & Lesmes,
1994). This approach regards the resistivity magnitude and phase angle spectra as a
superposition of relaxation processes which can be described by N Debye models:
( )
+−−= ∑
=
∗
k
N
k
k
im
ωτρωρ
1
111
1
0. (4.6)
Using this approach, ρ*(ω) is characterized by the low-frequency resistivity, ρ0, the
distribution of chargeability, mk, and the relaxation time distribution, τk. We used the
modified Debye decomposition procedure of Zisser et al. (2010) in which the relaxation time
distribution is determined by normalizing the complex electrical resistivity to ρ0 and
separating the resulting normalized complex resistivity in a real and an imaginary part. Zisser
et al. (2010) also introduced a weighting factor (w) between the imaginary part and real part

50
of the normalized resistivity. From numerical tests on synthetic data, the optimal weighting
factor was found to be:
( )
( )∑
∑
=
=
′′
′
=p
l
norm
p
l
norm
w
1
1
1
1
6.0
ωρ
ωρ
, (4.7)
where p is the number of measured frequencies. The resulting linear equation system was
solved using the constraint that no negative chargeability values are allowed. The inversion of
the measured spectra into relaxation time distributions was done by using 100 logarithmically
spaced relaxation times in the range from 10−5
to 105
s. To remove the electromagnetic
coupling effects and the effects of the contact impedance of the non-polarizing electrodes, the
high-frequency part of the phase spectra was fitted with a Cole-Cole term and subsequently
removed from the electrical spectra as proposed by Pelton et al. (1978). A potential
disadvantage of this procedure is that not only the effects of electromagnetic coupling and
contact impedances of the potential electrodes are removed, but that polarization of the
sample in the kHz range (i.e. associated with small pores or clay particles and Maxwell-
Wagner polarization) is also removed.
4.2.5 Data interpretation for hydraulic measurements
Using inverse modeling, the unknown hydraulic parameters governing the processes and
fluxes in the system are estimated with help of independent observations of the system. In the
inversion process, the model parameters are adjusted to minimize the difference between
observed and modeled values. We used HYDRUS-1D by Simunek et al. (2005) to model
water flow using the Richards equation:
( ) ( )
+
∂
∂
∂
∂=
∂
∂zh
zhK
zt
θ, (4.8)
where z is the axis in vertical direction, h is the matric potential, θ is the water content, and
K(h) is the unsaturated hydraulic conductivity. The Richards equation can be solved by
defining the moisture retention characteristic, the hydraulic conductivity function, and the
initial and boundary conditions. To describe the moisture retention characteristic and the
hydraulic conductivity function, we used the single porosity Mualem - van Genuchten model
(Mualem, 1976; van Genuchten, 1980):
( ) ( ) mn
rs
r
rh
hS
−
+=
−
−
= αθθ
θθ1 , (4.9)
( )( ) ( )
,11
2
121
−
−−−
−
−=
mm
rs
r
rs
r
s
hhKhK
θθ
θθ
θθ
θθ (4.10)
where Ks is the saturated hydraulic conductivity, Sr is the relative saturation, θr is residual
water content, θs is the water content at full saturation, α is the inverse of the air-entry value,
n is a shape parameter related to the pore size distribution, and m = 1 – 1/n. To model our
MSO experiments, the upper boundary condition was defined as a no flow boundary and a
time-variable pressure head was applied to the bottom of the sample to simulate outflow (i.e.
the applied pressure at the top of the sample was transformed into suction at the bottom and
then normalized to the area of the soil column). The initial conditions were set to static
equilibrium with a water level at the top of the soil sample. No hysteresis effects were
considered.

51
The model domain of 10.7 cm was discretized in 108 nodes with a denser spacing in the lower
part of the model domain. We considered two materials in the simulation: the 10 cm thick
sample (sand or sand-clay mixture) and the bottom ceramic plate of 0.7 cm. It was necessary
to include the ceramic plate in the simulation because it has a relatively low hydraulic
conductivity that affected the outflow of the sample, especially when the sample was near to
saturation (also see Breede et al., 2011). The saturated hydraulic conductivity of the ceramic
plate was determined independently in a falling-head experiment (Head, 1982) and θr and θs
were determined by saturating the ceramic plate and weighting it before and after it was dried
for 24h at 105°C. Furthermore, α was set to a very low value of 0.00049 cm-1
to ensure that
the ceramic plate remained saturated throughout the simulation.
We decided to fix θs of the sample to the measured porosity value during inverse modeling.
This is a reasonable assumption given the careful sample preparation that avoided air
entrapment. In addition, Ks was independently determined using a falling-head experiment
prior to drainage of the sample and fixed to this value. The objective function used during
inverse modeling contained two types of information. First, the difference between measured
outflow, q*, and simulated outflow, q (in m) for j measurements was considered. Second, two
independently measured points of the water retention characteristic determined with a
pressure plate extractor (for 3 and 15 bar) were included in the objective function. Therefore,
the objective function OF to be minimized during the parameter estimation procedure can be
written as:
( ) [ ] [ ] [ ]21515
2
33
1
2
22,, barbarbarbar
n
j
jjj
b
qqvpqbOF θθθθ −+−+−=∗∗
=
∗
∑ (4.11)
To minimize the objective function, the Levenberg-Marquardt nonlinear minimization method
was used (Marquardt, 1963). The initial parameter estimates that were used to start the
optimization are summarized in Table 4.3.
Table 4.3: Initial parameter estimates of the sample material for the optimization during
the modeling with HYDRUS-1D. θs is the saturated water content, θr is the residual
water content, α is the inverse of the air-entry-pressure, n is a shape parameter related
to the pore size distribution, and Ks is the saturated hydraulic conductivity.
sand
Sand-clay mixtures
5 % clay 10 % clay 20 % clay
θs [m³ m-³] (fixed value) 0.390 0.370 0.349 0.343
θr [m³ m-³] 0.045 0.087 0.145 0.137
α [cm-1
] 0.022 0.030 0.017 0.015
n 19.00 3.00 4.91 2.00
Ks [cm d-1
] (fixed value) 720.00 9.12 3.96 0.48
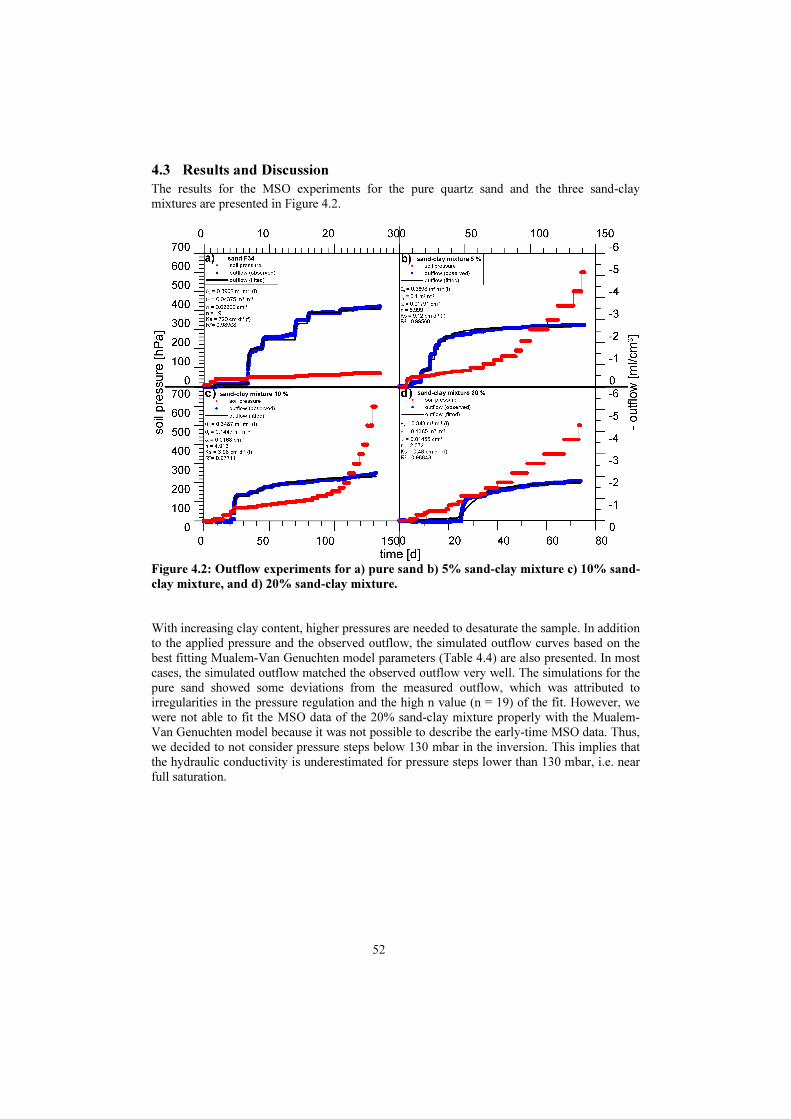
52
4.3 Results and Discussion
The results for the MSO experiments for the pure quartz sand and the three sand-clay
mixtures are presented in Figure 4.2.
Figure 4.2: Outflow experiments for a) pure sand b) 5% sand-clay mixture c) 10% sand-
clay mixture, and d) 20% sand-clay mixture.
With increasing clay content, higher pressures are needed to desaturate the sample. In addition
to the applied pressure and the observed outflow, the simulated outflow curves based on the
best fitting Mualem-Van Genuchten model parameters (Table 4.4) are also presented. In most
cases, the simulated outflow matched the observed outflow very well. The simulations for the
pure sand showed some deviations from the measured outflow, which was attributed to
irregularities in the pressure regulation and the high n value (n = 19) of the fit. However, we
were not able to fit the MSO data of the 20% sand-clay mixture properly with the Mualem-
Van Genuchten model because it was not possible to describe the early-time MSO data. Thus,
we decided to not consider pressure steps below 130 mbar in the inversion. This implies that
the hydraulic conductivity is underestimated for pressure steps lower than 130 mbar, i.e. near
full saturation.
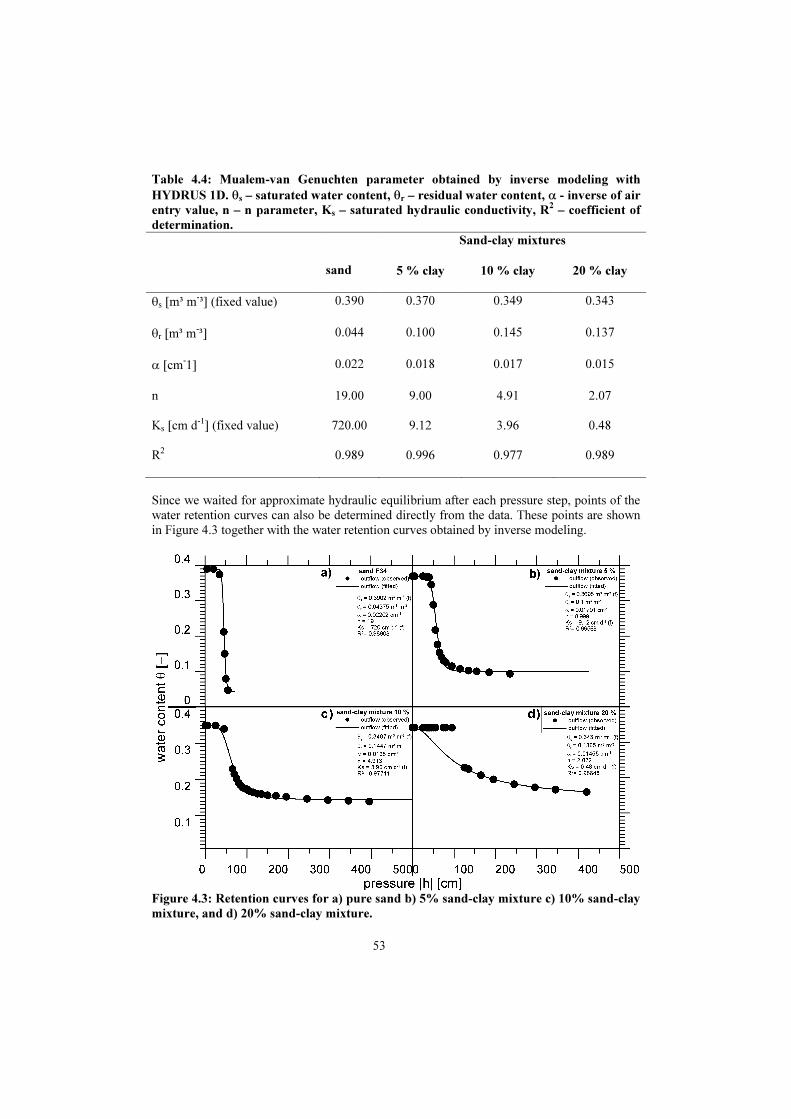
53
Table 4.4: Mualem-van Genuchten parameter obtained by inverse modeling with
HYDRUS 1D. θs – saturated water content, θr – residual water content, α - inverse of air
entry value, n – n parameter, Ks – saturated hydraulic conductivity, R2 – coefficient of
determination.
sand
Sand-clay mixtures
5 % clay 10 % clay 20 % clay
θs [m³ m-³] (fixed value) 0.390 0.370 0.349 0.343
θr [m³ m-³] 0.044 0.100 0.145 0.137
α [cm-1] 0.022 0.018 0.017 0.015
n 19.00 9.00 4.91 2.07
Ks [cm d-1
] (fixed value) 720.00 9.12 3.96 0.48
R2 0.989 0.996 0.977 0.989
Since we waited for approximate hydraulic equilibrium after each pressure step, points of the
water retention curves can also be determined directly from the data. These points are shown
in Figure 4.3 together with the water retention curves obtained by inverse modeling.
Figure 4.3: Retention curves for a) pure sand b) 5% sand-clay mixture c) 10% sand-clay
mixture, and d) 20% sand-clay mixture.

54
There are some deviations in the lower part of the retention curves indicating that the Mualem
– van Genuchten model might not be able to describe the outflow data for high pressures. In
addition, the high air-entry pressure of the 20% sand-clay mixture in combination with the
quick drop in water content for higher pressure could not be reproduced with the Mualem-van
Genuchten model.
The hydraulic parameters obtained by inverse modeling (Table 4.4) seem consistent and
plausible. The saturated water content was determined from the porosity, which decreased
with increasing clay content indicating that the clay partly filled up the pores of the sand
matrix. The Ks of the samples was also determined independently in a falling-head
experiment and decreased with increasing clay content as would be expected because
increasing clay content lowers the largest pore sizes that control Ks. The fitted residual water
content of the sand is within the expected range with a value of 0.04. With increasing clay
content, the fitted residual water content increased, which again is reasonable because more
water is expected to be adsorbed to the grains due to the increase in surface area with
increasing clay content. The fitted α (inverse of air-entry pressure) decreased with increasing
clay content. This is due to the fact that higher pressures have to be applied to inject air into
the much smaller pores of the sand-clay mixtures. Finally, the fitted n-parameter decreased
with increasing clay content indicating that the width of the pore size distribution increased
with increasing clay content.
Figure 4.4: Electrical phase spectra for a) pure sand b) 5% sand-clay mixture c) 10%
sand-clay mixture, and d) 20% sand-clay mixture.
The electrical phase spectra of all samples in dependence of the water saturation are shown in
Figure 4.4. The variation of the real and imaginary part of the electrical conductivity, the total
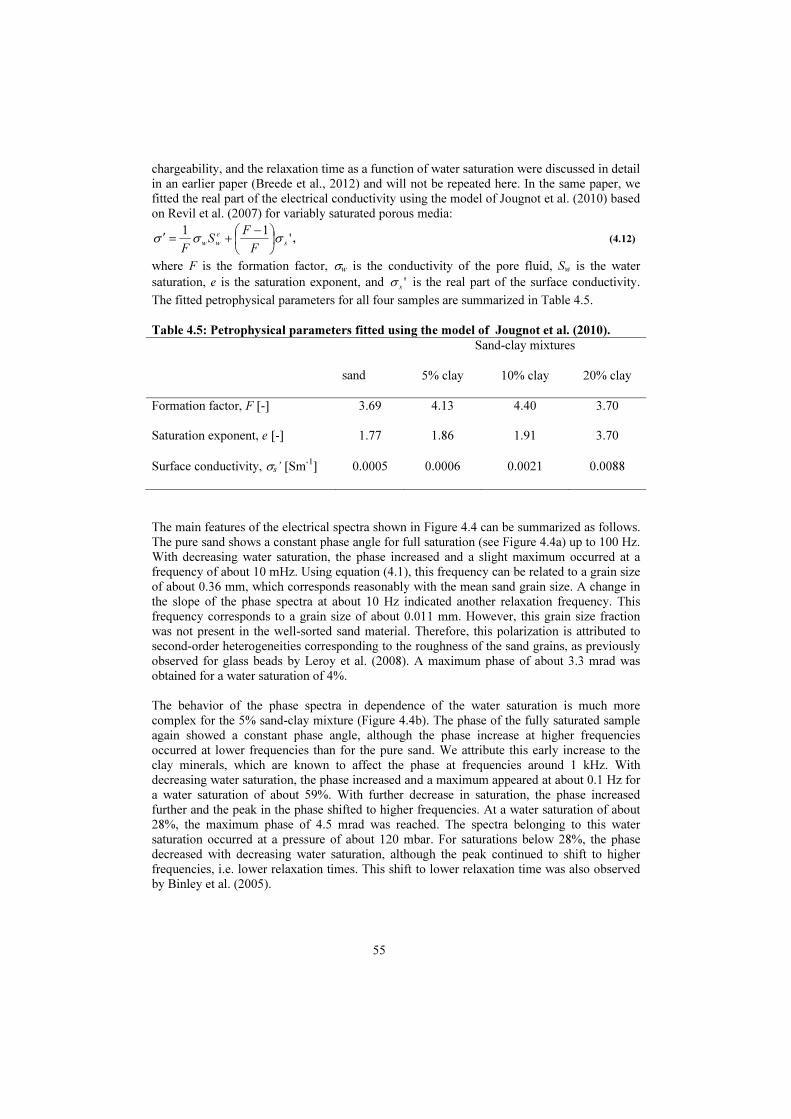
55
chargeability, and the relaxation time as a function of water saturation were discussed in detail
in an earlier paper (Breede et al., 2012) and will not be repeated here. In the same paper, we
fitted the real part of the electrical conductivity using the model of Jougnot et al. (2010) based
on Revil et al. (2007) for variably saturated porous media:
'11
s
e
ww
F
FS
Fσσσ
−+=′ , (4.12)
where F is the formation factor, σw is the conductivity of the pore fluid, Sw is the water
saturation, e is the saturation exponent, and 's
σ is the real part of the surface conductivity.
The fitted petrophysical parameters for all four samples are summarized in Table 4.5.
Table 4.5: Petrophysical parameters fitted using the model of Jougnot et al. (2010).
sand
Sand-clay mixtures
5% clay 10% clay 20% clay
Formation factor, F [-] 3.69 4.13 4.40 3.70
Saturation exponent, e [-] 1.77 1.86 1.91 3.70
Surface conductivity, σs’ [Sm-1
] 0.0005 0.0006 0.0021 0.0088
The main features of the electrical spectra shown in Figure 4.4 can be summarized as follows.
The pure sand shows a constant phase angle for full saturation (see Figure 4.4a) up to 100 Hz.
With decreasing water saturation, the phase increased and a slight maximum occurred at a
frequency of about 10 mHz. Using equation (4.1), this frequency can be related to a grain size
of about 0.36 mm, which corresponds reasonably with the mean sand grain size. A change in
the slope of the phase spectra at about 10 Hz indicated another relaxation frequency. This
frequency corresponds to a grain size of about 0.011 mm. However, this grain size fraction
was not present in the well-sorted sand material. Therefore, this polarization is attributed to
second-order heterogeneities corresponding to the roughness of the sand grains, as previously
observed for glass beads by Leroy et al. (2008). A maximum phase of about 3.3 mrad was
obtained for a water saturation of 4%.
The behavior of the phase spectra in dependence of the water saturation is much more
complex for the 5% sand-clay mixture (Figure 4.4b). The phase of the fully saturated sample
again showed a constant phase angle, although the phase increase at higher frequencies
occurred at lower frequencies than for the pure sand. We attribute this early increase to the
clay minerals, which are known to affect the phase at frequencies around 1 kHz. With
decreasing water saturation, the phase increased and a maximum appeared at about 0.1 Hz for
a water saturation of about 59%. With further decrease in saturation, the phase increased
further and the peak in the phase shifted to higher frequencies. At a water saturation of about
28%, the maximum phase of 4.5 mrad was reached. The spectra belonging to this water
saturation occurred at a pressure of about 120 mbar. For saturations below 28%, the phase
decreased with decreasing water saturation, although the peak continued to shift to higher
frequencies, i.e. lower relaxation times. This shift to lower relaxation time was also observed
by Binley et al. (2005).

56
The behavior for the 10% sand-clay mixture is similar to the 5% sand-clay mixture (see
Figure 4.4c), although the water saturation where the peak in the phase was highest occurred
at a saturation of ~ 47% for a pressure of 110 mbar. The associated maximum phase was only
3.3 mrad. At first sight, the behavior of the phase spectra for the 20% sand-clay mixture
(Figure 4.4d) seemed different. For example, a slightly increasing phase angle instead of a
constant phase angle was obtained at full saturation although the observed increase in phase
angle was less than 1 mrad. Directly after the pressure step of 130 mbar, a considerable
amount of water drained out of the sample and the phase increased abruptly and showed a
peak at a frequency of about 0.03 Hz and a maximum phase value of 1.75 mrad. With further
decreasing water saturation, the phase decreased and again the phase maximum shifted to
higher frequencies. This initial increase and subsequent decrease of the phase maximum is
consistent with the other two sand-clay mixtures. In all three sand-clay mixtures, the change
from an increasing to a decreasing phase maximum with decreasing saturation occurred in a
relatively small pressure range between 110 – 130 mbar.
Figure 4.5: DC resistivity ρ0 which was achieved by the Debye Decomposition versus the
unsaturated hydraulic conductivity.
In the remainder of this paper, we focus on the relationship between electrical parameters and
the unsaturated hydraulic conductivity. Figure 4.5 shows the DC resistivity ρ0 obtained from
the Debye decomposition as a function of the unsaturated hydraulic conductivity. Obviously,
ρ0 increased with decreasing K due to the decreasing water saturation. However, no clear and
consistent relationship between ρ0 and K was observed. ρ0 at full saturation was the same for
all materials except the 20% sand-clay mixture, while Ks was considerably different. The
similar values of ρ0 for different amounts of clay content imply that it is not possible to
determine K or Ks from DC resistivity alone. In addition, ρ0 increased with decreasing clay
content at partial saturation, i.e. lower hydraulic conductivity. The increase in ρ0 with
decreasing saturation also varied considerably between the samples. We compared our

57
relationships between the DC resistivity and the unsaturated hydraulic conductivity with other
findings in the literature. For example, Doussan & Ruy (2009) proposed three different
approaches to determine the unsaturated hydraulic conductivity from electrical measurements.
Similar to our findings, they were not able to estimate the unsaturated hydraulic conductivity
from the DC resistivity alone, but added additional information like the surface conductivity
and the saturated hydraulic conductivity. We applied the simplified approach of Doussan &
Ruy (2009) that relies on a minimum amount of additional information to our data. However,
the hydraulic conductivity estimates from this approach did not agree with the unsaturated
hydraulic conductivity estimates from the HYDRUS-1D modeling. Other approaches to
determine the saturated hydraulic conductivity like the Kozeny-Carman equation or the
PARIS equation (Pape et al., 1987) also require additional information, such as the specific
surface or the imaginary component of the complex electrical resistivity. However, these
approaches could also not be successfully applied to our samples.
Figure 4.6: Normalized total chargeability achieved by the Debye Decomposition versus
the unsaturated hydraulic conductivity.
Figure 4.6 shows the normalized total chargeability mn,tot as a function of the unsaturated
hydraulic conductivity. The normalized total chargeability is the total chargeability of the
sample normalized by the DC resistivity and reflects the polarization of the whole sample:
0
1
,ρ
∑=
=
n
k
k
totn
m
m (4.13)
We observed that the behavior of the relationship between mn,tot and K is very similar to the
relationship between mn,tot and the water saturation Sw (not shown, see Breede et al., 2012).
The normalized total chargeability of the sand and the 5% sand-clay mixture first increased
and then decreased with decreasing K and Sw. The 10% sand-clay mixture first showed a
decrease followed by a slight increase and then mn,tot decreased again with decreasing K. A
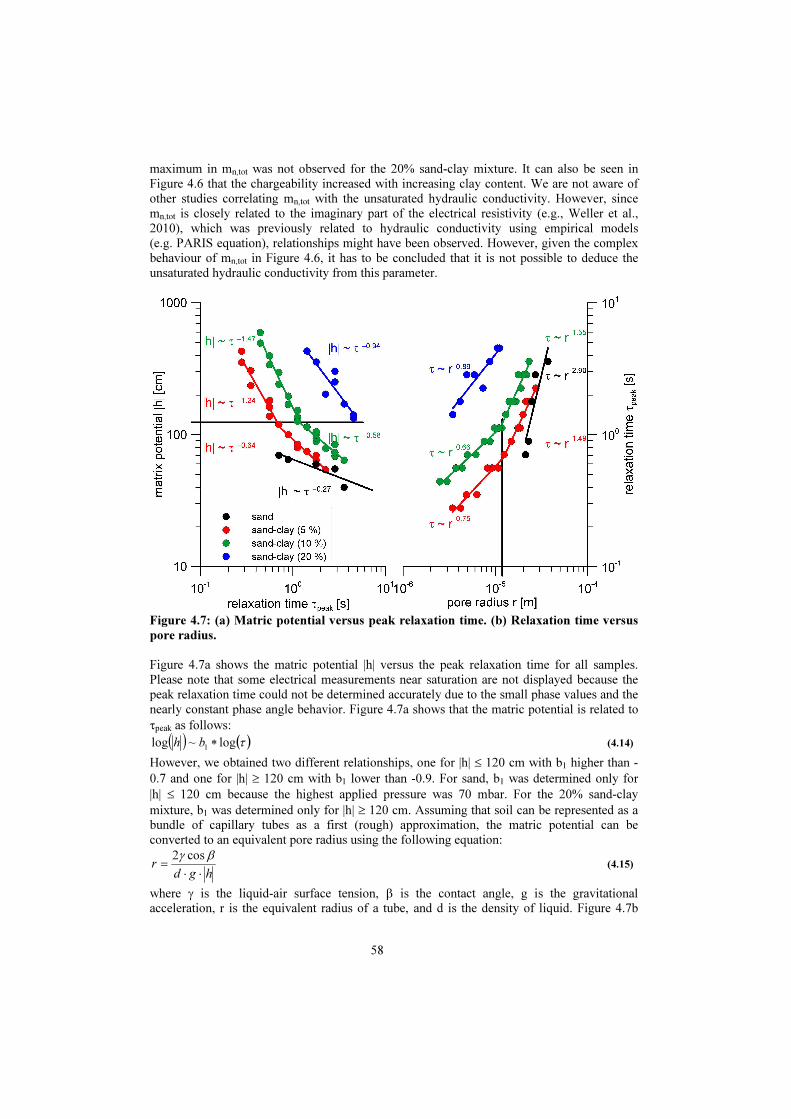
58
maximum in mn,tot was not observed for the 20% sand-clay mixture. It can also be seen in
Figure 4.6 that the chargeability increased with increasing clay content. We are not aware of
other studies correlating mn,tot with the unsaturated hydraulic conductivity. However, since
mn,tot is closely related to the imaginary part of the electrical resistivity (e.g., Weller et al.,
2010), which was previously related to hydraulic conductivity using empirical models
(e.g. PARIS equation), relationships might have been observed. However, given the complex
behaviour of mn,tot in Figure 4.6, it has to be concluded that it is not possible to deduce the
unsaturated hydraulic conductivity from this parameter.
Figure 4.7: (a) Matric potential versus peak relaxation time. (b) Relaxation time versus
pore radius.
Figure 4.7a shows the matric potential |h| versus the peak relaxation time for all samples.
Please note that some electrical measurements near saturation are not displayed because the
peak relaxation time could not be determined accurately due to the small phase values and the
nearly constant phase angle behavior. Figure 4.7a shows that the matric potential is related to
τpeak as follows:
( ) ( )τlog~log1∗bh (4.14)
However, we obtained two different relationships, one for |h| ≤ 120 cm with b1 higher than -
0.7 and one for |h| ≥ 120 cm with b1 lower than -0.9. For sand, b1 was determined only for
|h| ≤ 120 cm because the highest applied pressure was 70 mbar. For the 20% sand-clay
mixture, b1 was determined only for |h| ≥ 120 cm. Assuming that soil can be represented as a
bundle of capillary tubes as a first (rough) approximation, the matric potential can be
converted to an equivalent pore radius using the following equation:
hgdr
⋅⋅
=
βγ cos2 (4.15)
where γ is the liquid-air surface tension, β is the contact angle, g is the gravitational
acceleration, r is the equivalent radius of a tube, and d is the density of liquid. Figure 4.7b

59
shows the relationship between τpeak and this equivalent pore radius. The observed power-law
relationship can be described by:
( ) ( )rbpeak log~log2⋅τ . (4.16)
The observed change in slope of the power-law relationships now occur at an equivalent
radius of 12.5 µm. We found an approximately quadratic dependence between the peak
relaxation time and equivalent pore radius for big pores ≥ 12.5 µm. We assume that this
quadratic dependence was related to diffusion processes in big pores, as is consistent with
current modeling paradigms for SIP. We found a nearly linear dependence between τpeak and
r for pores < 12.5 µm. This low value of the power law exponent might suggest that different
relaxation processes dominate for small pores Although there is some consistency in the slope
of the power-law relationships, the strong difference in offset between the four samples
illustrated in Figure 4.7 also indicates that τpeak is not solely dependent on the pore radius and
that other factors also need to be considered (i.e. clay content, pore size distribution).
Although a quadratic dependence between characteristic length scale and relaxation time is
the basis of both the granular and the pore model for relaxation processes in porous media,
other dependencies have also been proposed. For example, a linear dependence for simple
geometries was already proposed by O'Konski (1960). Chelidze & Gueguen (1999)
hypothesized that the relaxation time is linear when the particles are large and quadratic when
they are small because diffusion as the cause of the quadratic dependence must become
inefficient at large distances. However, this observation does not apply to our findings since
we observed a quadratic dependence for large pores. The range of exponents found in
experimental data is even wider. An exponent close to 1 was found by Klein & Sill (1982)
and Binley et al. (2005). An exponent of 2 was found in several studies (Revil &
Florsch, 2010 and Titov et al., 2002). Kemna et al. (2005) even found an exponent between
2.59 and 5.75 dependent on the electrical conductivity of the pore fluid. Kruschwitz et al.
(2010) summarized the findings of different authors and found an exponent of 2.97 for large
pore sizes, while they could not find any correlation for small pore sizes. Wong (1979) found
an exponent of one for small grain sizes and an exponent of two for larger grain sizes which is
in agreement with our findings. The results presented here clearly indicate complex relaxation
processes that are not consistent with current IP models.
The observed power law relationship between peak relaxation time and matric potential
directly implies a power law relationship between unsaturated hydraulic conductivity and
peak relaxation time. This can be illustrated by the following simplification of the Mualem-
van Genuchten model
( ) mn
h−
=Θ α (4.17)
for values of h considerably larger than the air entry pressure. Following the Mualem theory
with m = 1-1/n, it follows that (van Genuchten, 1980):
( ) ( ) 2
)1(52
−
−−
=
n
hhK α (4.18)
After some mathematical manipulation, the following expression that relates log(K) to log(h)
can be derived:
( ) ( ) ( ) hnnhK log)1(5.22log)1(5.22log −−−+−−−= α . (4.19)
Substitution of eq. (4.14) into this equation results in:
( ) ( )( ) ( )peaknbhK τlog215.2~log1
⋅−−− , (4.20)
which shows that the power law relationship between peak relaxation time and unsaturated
hydraulic conductivity has a slope that depends on b1 and the n parameter of the Mualem-van
Genuchten model, which is a measure of the width of the pore size distribution.
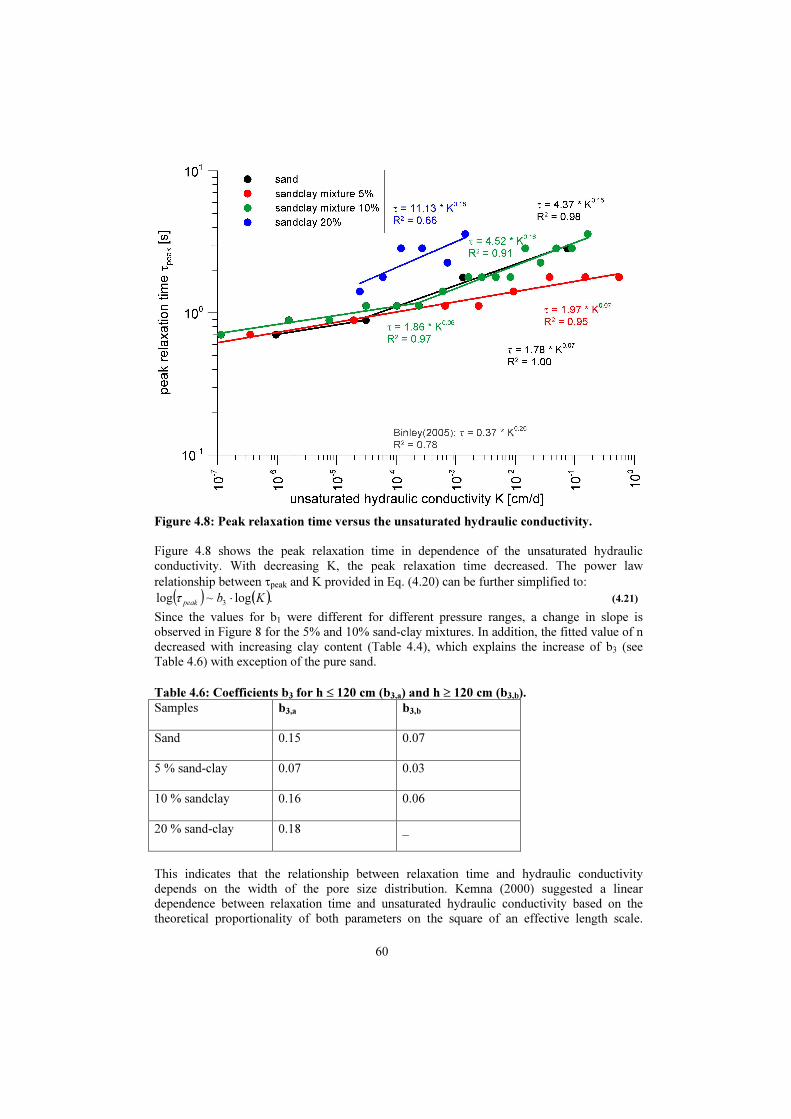
60
Figure 4.8: Peak relaxation time versus the unsaturated hydraulic conductivity.
Figure 4.8 shows the peak relaxation time in dependence of the unsaturated hydraulic
conductivity. With decreasing K, the peak relaxation time decreased. The power law
relationship between τpeak and K provided in Eq. (4.20) can be further simplified to:
( ) ( ).log~log3
Kbpeak ⋅τ (4.21)
Since the values for b1 were different for different pressure ranges, a change in slope is
observed in Figure 8 for the 5% and 10% sand-clay mixtures. In addition, the fitted value of n
decreased with increasing clay content (Table 4.4), which explains the increase of b3 (see
Table 4.6) with exception of the pure sand.
Table 4.6: Coefficients b3 for h ≤ 120 cm (b3,a) and h ≥ 120 cm (b3,b).
Samples b3,a b3,b
Sand 0.15 0.07
5 % sand-clay 0.07 0.03
10 % sandclay 0.16 0.06
20 % sand-clay 0.18 _
This indicates that the relationship between relaxation time and hydraulic conductivity
depends on the width of the pore size distribution. Kemna (2000) suggested a linear
dependence between relaxation time and unsaturated hydraulic conductivity based on the
theoretical proportionality of both parameters on the square of an effective length scale.
61
Kemna et al. (2005) found a power law relationship with an exponent of 1.78 for five pure
sands of varying grain size. However, Binley et al. (2005) found a power law relationship
between the relaxation time and the unsaturated hydraulic conductivity with a power-law
exponent of 0.26 for 28 sandstone cores from three lithologic formations. This finding is close
to our results with an exponent of about 0.17 for matric potentials smaller than 120 cm.
4.4 Conclusions
In this work, we investigated the relationship between SIP parameters like DC resistivity,
normalized total chargeability, and peak relaxation time and the unsaturated hydraulic
conductivity for a pure sand and three different sand-clay mixtures. We found that the DC
electrical resistivity increased with decreasing unsaturated hydraulic conductivity due to the
decreasing water saturation. Surprisingly, the resistivity was the same for the sand and the
5%, and 10% sand-clay mixtures at full saturation although the saturated hydraulic
conductivity was different. This leads to the conclusion that no useful relationships between
DC electrical resistivity and unsaturated hydraulic conductivity could be found for our data.
The relationship between the normalized total chargeability and the unsaturated hydraulic
conductivity was similar to the relationship between normalized total chargeability and water
saturation. As expected, the chargeability increased with increasing clay content. However, no
consistent relationships between normalized total chargeability and unsaturated hydraulic
conductivity could be identified.
We found that the peak relaxation time is proportional to the matric potential and thus to the
pore size. However, the exponent of the observed power-law relationship was different for
matric potentials smaller than 120 cm and matric potentials larger than this critical value. This
exponent was close to 1 for absolute matric potentials larger than 120 cm and varied near 2
for absolute matric potentials smaller than 120 cm. Assuming a simplified capillary tube
model, an absolute matric potential of 120 cm corresponds to a pore radius of 12.5 µm. We
attribute the quadratic dependence to diffusion processes in big pores, as is typically assumed
in current SIP modeling approaches. The observed low exponent for small pores was
tentatively attributed to a hitherto unknown relaxation process that warrants more
investigation.
The observed relationship between matric potential and peak relaxation time directly implies
a power-law relationship between the peak relaxation time and the unsaturated hydraulic
conductivity that depends on the n parameter of the Mualem – van Genuchten model. Thus,
we conclude that it might be possible to estimate the unsaturated hydraulic conductivity from
SIP measurements using the peak relaxation time. However, additional information like the
pore size distribution seems to be necessary.

62
63
5 Conclusions and Outlook
5.1 Final Conclusions
Groundwater is an important resource for humanity because it is used for instance as drinking
water and for agricultural usage. However, it is endangered by contaminants and overuse.
Soils act as filter, buffer, and storage for groundwater and thus flow and transport processes in
soils are of importance. Geophysical methods provide information about the heterogeneity
and soil structure, texture, and composition and are often used for hydrological applications.
Especially electrical methods like SIP have recently been investigated for the determination of
hydraulic properties of saturated and unsaturated porous media. The overall aim of this thesis
was to establish an approach for the determination of unsaturated hydraulic conductivity from
SIP measurements. This involved three specific aims: (1) to develop a new joint measurement
setup for hydraulic and electrical measurements (2) to investigate the dependence of the SIP
response on water content, (3) to investigate the dependence of SIP on unsaturated hydraulic
conductivity and properties.
The newly designed measurement setup for simultaneous measurements of hydraulic
properties and complex electrical resistivity showed accurate and reproducible results for
hydraulic and electrical measurements on low polarizable porous media like pure quartz sand.
The high measurement accuracy was achieved by using appropriate dimensions for the newly
constructed measurement cell, a high-accuracy electrical impedance spectrometer, and newly
designed non-polarizable ceramic electrodes. Two different measurement cells were
constructed and tested: one for non-shrinking soil like sand with very high accuracy of
electric measurements and another one for mildly-shrinking soils like sand-clay mixtures. The
accuracy of the electrical measurements with the measurement cell for shrinking soils was not
as good as for the other measurement cell, but the adjustable upper part of the measurement
cell allowed to expand the pressure range for electrical measurements on shrinking soils. Test
measurements showed that the ceramic plates have no influence on the electric measurements
but have to be taken into account for the modeling of the hydraulic results with HYDRUS-1D.
The newly designed non-polarizable ceramic electrodes were compared to stainless steel
potential electrodes. The electromagnetic coupling effects for the stainless steel electrodes
were at higher frequencies than for the ceramic electrodes for full saturation. However, the
ceramic electrodes showed better results for partial saturation.
Using the joint measurement setup and measurement columns developed in the first part of
the thesis, combined electrical and hydraulic measurements were conducted on four different
samples: a pure quartz sand and three sand-clay mixtures with 5%, 10%, and 20% clay
content. These samples were investigated in dependence of the water content. The SIP results
of these four mixtures were interpreted using a Debye decomposition approach. The resulting
Debye parameter like DC electrical resistivity, normalized total chargeability and peak
relaxation time were investigated in dependence of the water saturation. The real part of the
electrical conductivity or DC electrical resistivity was the same at full saturation for all
samples except the 20% sand-clay mixture. The normalized total chargeability of the fully
saturated samples increased with increasing clay-content due to the larger specific surface
area of the clay minerals implying that it might be possible to estimate the clay content from
this parameter. A conceptual model combining two individual models for sand and clay
fraction was proposed to explain the behavior of the imaginary part of the complex electrical
conductivity for 10 mHz and 1 kHz and the behavior of the normalized total chargeability.
The model for the sand fraction is based on the short-narrow pore model of Titov et al.
(2002), which also predicts that the chargeability is first increasing and then decreasing with
64
decreasing water saturation. The model for the clay fraction was based on the observed
continuous decrease of the imaginary part of the electrical conductivity at 1 kHz, which was
explained by rearrangement of the clay particles in the pore volume due to the decreasing
amount of water in the pore space. The strong decrease of the peak relaxation time with
decreasing water saturation for all sand-clay mixtures can be intuitively explained by the
decrease of the size of the hydraulically active pores during the desaturation process. All SIP
parameters correlated strongly with water. This implies that water content has to be taken into
account for the determination of unsaturated hydraulic properties in the vadose zone from SIP
measurements and the distribution of the unsaturated hydraulic conductivity from EIT
measurements. In addition, the dependence of the relaxation time on water content cannot be
explained by existing grain size models. Thus, more research is necessary to better understand
the polarization processes of porous media.
In the fourth chapter of the thesis, we investigated the dependence of the Debye parameters on
the unsaturated hydraulic conductivity. The same DC electrical resistivity was measured for
the sand and two of three sand-clay mixtures, although they possessed widely different
saturated hydraulic conductivities. Thus, additional information in form of clay content or
pore size distribution has to be accounted for to determine the saturated or even unsaturated
hydraulic conductivity from DC electrical resistivity. No consistent relationships could be
found between normalized total chargeability and unsaturated hydraulic conductivity.
However, we did find a power-law relationship between the peak relaxation time and the
matric potential. This seems to suggest that the peak relaxation time is dependent on the pore
size distribution and not the grain size distribution. However, the slope of these curves was
different whether the matric potential is above or below a critical matric potential of -120 cm.
For matric potentials above this value, we obtained a quadratic dependence, which is
consistent with theories that attempt to relate SIP to diffusion processes around a grain or
within pores. For matric potentials smaller than -120 cm, we observed a linear relationship
indicating a hitherto unknown relaxation process.
As a direct consequence of the relation between the peak relaxation time and the matric
potential, we also found power-law relationships between the peak relaxation time and the
unsaturated hydraulic conductivity. Using an approximation of the Mualem-van Genuchten
model, we derived an empirical relationship between the peak relaxation time and the
unsaturated hydraulic conductivity. This empirical relationship is dependent on the n-
parameter of the Mualem-van Genuchten model that reflects the width of the pore size
distribution. Thus, we conclude that it might be possible to estimate the unsaturated hydraulic
conductivity from SIP measurements using the peak relaxation time. However, additional
information like the pore size distribution seems to be necessary.
65
5.2 Outlook
5.2.1 Further laboratory studies using SIP
We found power-law relationships with different exponents between the relaxation time and
the matric potential, respectively between relaxation time and unsaturated hydraulic
conductivity for matric potentials above and below -120 cm. Thus, the sample base should be
extended by (1) using sands with different average grain sizes and (2) using sand-clay
mixtures with different clay types. Thus, it can be investigated if this critical matric potential
is related to the average sand grain size or the clay type.
In addition, further experiments on artificial samples and sieved soils are required to further
investigate this dependency for a wide range of pore size distributions. Artificial samples have
the advantage that they are easier to understand because its composition and grain size
distribution can easily be determined. In addition, measurements on natural soils are usually
containing additional material like humic substances which can cause additional polarization
processes that are not easily understood and would complicate the interpretation of the SIP
response. However, it is possible that the observed results are specific to the artificially mixed
sand-clay samples and that they are caused by reorientation of the clay particles in the pore
space. This would probably not be the case for natural soil samples. Thus, additional SIP
experiments on natural soils in the laboratory would be a next step to investigate the power-
law relationship between relaxation time and matric potential, respectively between relaxation
time and unsaturated hydraulic conductivity. If the experiments are done in the laboratory,
influences on the SIP response like temperature and water content can be better controlled. In
addition, the data base should be extended by specifically using samples with a wider pore-
size distribution and a wider range of saturated hydraulic conductivities. Thus, it could be
investigated if the above mentioned power-law relationships for matric potentials below and
above -120 cm are also valid for a wider range of saturated hydraulic conductivities.
SIP experiments on artificial mixtures and natural soils combined with NMR measurements
would be sensible to further investigate the probable relationship between NMR and SIP
relaxation times. Both parameters are probably a measure of the pore size distribution. Thus, a
confirmation of the pore size distribution achieved from SIP with NMR might show if the SIP
relaxation time is really a measure of the pore size distribution.
5.2.2 Laboratory EIT experiments
EIT experiments on natural soil samples in lysimeters could be an important step towards
field experiments. Due to the larger scale of such lysimeter experiments, structural and
textural heterogeneity of the soil could be better investigated. The proposed EIT experiments
could be combined with infiltration experiments and a color tracer. Thus not only the
heterogeneity but also the heterogeneous water flow through the soil column could be
investigated. Using steady-state flow experiments, such a set-up could also be used to directly
establish a relationship between the peak relaxation time and the unsaturated hydraulic
conductivity.
5.2.3 Step to the field
The accuracy of field and borehole SIP and EIT devices has to be improved to allow accurate
SIP measurements on natural soils in the field. If this can be achieved, it would be possible to
confirm the findings of this thesis on the field-scale. Field EIT experiments on well

66
investigated field sites should be a first step. Thus the observed EIT results could be
compared with the already existing knowledge about the subsurface. In addition, surface EIT
measurements could be combined with SIP borehole measurements or other additional surface
and borehole geophysical methods like GPR. Thus a better spatial resolution and
characterization of the subsurface could be achieved.
5.2.4 Simulations
Our measurement results cannot be explained or simulated by existing models. Thus, a new
model is needed taking account for the decreasing peak relaxation time with decreasing water
saturation and decreasing unsaturated hydraulic conductivity. For the latter one, the model has
also to account for the two different relaxation processes that were found for our experiments:
a quadratic relationship between peak relaxation time and matric potentials for matric
potentials above -120 cm and a linear relationship for matric potentials below -120 cm. Thus,
the dependence on the matric potential has also to be considered for this model. Another
problem for our SIP measurement results was the high-frequency response of the clay
minerals at about 1 kHz. Signals at such frequencies are often ignored or fitted by a Cole-Cole
term for instance to subtract it from the phase spectrum in order to delete the electromagnetic
coupling effects. Either approach results in ignoring signals coming from clay minerals that
often occur at such high frequencies. Thus a model is needed to fit the electromagnetic
coupling effects alone without high-frequency effects coming from the sample.
67
References
6 Literaturverzeichnis
Bauer, J., Weihermüller, L., Huisman, J., Herbst, M., Graf, A., Sequaris, J., et al. (2012).
Inverse determination of heterotrophic soil respiration response to temperature and
water content under field conditions. Biogeochemistry, 108, p. 119-134.
Binley, A., Cassiani, G., & Deiana, R. (2010). Hydrogeophysics opportunities and challenges.
Bollettino di Geofisica Teorica ed Applicata, 51, p. 267-284.
Binley, A., Slater, L. D., Fukes, M., & Cassiani, G. (2005). Relationship between spectral
induced polarization and hydraulic properties of saturated and unsaturated sandstone.
Water Resources Research, 41, W12147.
Börner, F. D., Schopper, J. R., & Weller, A. (1996). Evaluation of transport and storage
properties in the soil and groundwater zone from induced polarization measurements.
Geophysical Prospecting, 44, p. 583-601.
Börner, F., & Schön, J. (1991). A relation between the quadrature component of electrical
conductivity and the specific surface area of sedimentary rocks. The Log Analyst, 32,
p. 612-613.
Breede, K., Kemna, A., Esser, O., Zimmermann, E., Vereecken, H., & Huisman, J. (2011).
Joint measurement setup for determining spectral induced polarization and soil
hydraulic properties. Vadose Zone Journal, 10, p. 716-726.
Breede, K., Kemna, A., Esser, O., Zimmermann, E., Vereecken, H., & Huisman, J. (2012).
Spectral induced polarization measurements on variably saturated sand-clay mixtures.
Near Surface Geophysics. In review process.
Brovelli, A., Cassiani, G., Dalla, E., Bergamini, F., Pitea, D., & Binley, A. (2005). Electrical
properties of partially saturated sandstones: Novel computational approach with
hydrogeophysical applications. Water Resour. Res., 41.
Brunauer, S., Emmet, P., & Teller, E. (1938). Adsorption of gases in multimolecular layers.
Journal of the American Chemical Society, 60(2), p. 309-319.
Butler, J. J. (1998). The Design, Performance, and Analysis of Slug Tests. Lewis Pub.
Butler, J. J., McElwee, C. D., & Liu, W. (1996). Improving the quality of parameter estimates
obtained from slug tests. Ground Water, 34, p. 480-490.
Carman, P. C. (1997). Fluid flow through granular beds. Chemical engineering research &
design, 75, p. S32-S48.
Cassiani, G., Kemna, A., Villa, A., & Zimmermann, E. (2009). Spectral induced polarization
for the characterization of free phase hydrocarbon contamination of sediments with
low clay content. Near Surface Geophysics, 7, p. 547-562.
Chelidze, T., & Gueguen, Y. (1999). Electrical spectroscopy of porous rocks: a review - I
Theoretical models. Geophysical Journal International, 137, p. 1-15.
Chen, J., Kemna, A., & Hubbard, S. (2008). A comparison between Gauss-Newton and
Markov-chain Monte Carlo - based methods for inverting spectral induced-
polarization data for Cole-Cole parameters. Geophysics, 73, p. F247-259.
Chen, Y., & Or, D. (2006). Geometrical factors and interfacial processes affecting complex
dielectric permittivity of partially saturated porous media. Water Resour. Res., 42.
Cole, K., & Cole, R. (1941). Dispersion and absorption in dielectrics, vol. I. Alternating
current field. Journal of Chemical Physics, 9, p. 341-351.
Cosenza, P., Ghorbani, A., Florsch, N., & Revil, A. (2007). Effects of drying on the low-
frequency electrical properties of Tournemire argillites. Pure Appl. Geophys., 164,
p. 2043-2066.
Dahlin, T., Leroux, V., & Nissen, J. (2002). Measuring techniques in induced polarization
imaging. J. Appl. Geophys., 50, p. 279-298.
68
Dane, J. H., & Topp, G. C. (2002). Methods of soil analysis Part 4 Physical methods.
Madison, WI, USA: Soil Science Society of America, Inc.
de Lima, O. A., & Niwas, S. (2000). Estimation of hydraulic parameters of shaly sandstone
aquifers from geoelectrical measurements. J. Hydrology, 235, p. 12-26.
Dias, R., Fernandes, C., Teixeira, J., Mota, M., & Yelshin, A. (2008). Permeability analysis in
bisized porous media: Wall effect between particles of different size. Journal of
Hydrology, 349, p. 470-474.
Doussan, C., & Ruy, S. (2009). Prediction of unsaturated soil hydraulic conductivity with
electrical conductivity. Water Resources Research, 45.
Dukhin, S., & Shilow, V. (1974). Dielectric phenomena and the double layer in disperse
systems and polyelectrolytes. New York: John Wiley & Sons.
Ghorbani, A., Cosenza, P., Ruy, S., Doussan, C., & Florsch, N. (2008). Non invasive
monitoring of water infiltration in a silty clay loam soil using Spectral Induced
Polarization. Water Resources Research, 44, W08402.
Hazen, A. (1893). Some Physical Properties of Sands and Gravels with Special Reference to
their Use in Filtration. 34, p. 539-556. Massachusetts State Bureau of Health, Publ.
Doc.
Head, K. (1982). Manual of soil laboratory testing Vol. 2. Pentech Press.
Hördt, A., Blaschek, R., Kemna, A., & Zisser, N. (2007). Hydraulic conductivity estimation
from induced polarisation data at the field scale - the Krauthausen case study. Journal
of Applied Geophysics, 62, p. 33-46.
Huntley, D. (1986). Relations between permeability and electrical resistivity in granular
aquifers. Groundwater, 24, p. 446-474.
Jougnot, D., Ghorbani, A., Revil, A., Leroy, P., & Cosenza, P. (2010). Spectral induced
polarization of partially saturated clay rocks: a mechanistic approach. Geophys. J. Int.,
180, p. 210-224.
Jougnot, D., Revil, A., & Leroy, P. (2009). Diffusion of ionic tracers in the Callovo-
Oxfordian clay-rock using the Donnan equilibrium model and the formation factor.
Geochimica et Cosmochimica Acta, 73, p. 2712-2726.
Keller, G. (1953). Effect of wettability on the electrical resistivity of sand. Oil and Gas
Journal, 51, p. 62-65.
Kemna, A. (2000). Tomographic inversion of complex resistivity - theory and application,
Ph.D. thesis. Bochum Ruhr-Univ., Germany.
Kemna, A., Binley, A., & Slater, L. (2004). Crosshole IP imaging for engineering and
environmental applications. Geophysics, 69, p. 97-107.
Kemna, A., Binley, A., Ramirez, A., & Daily, W. (2000). Complex resistivity tomography for
environmental applications. Chem. Eng. J., 77, p. 11-18.
Kemna, A., Münch, H., Titov, K., Zimmermann, E., & Vereecken, H. (2005). Relation of SIP
relaxation time of sands to salinity, grain size and hydraulic conductivity: 4pp.
Extended Abstracts: Near Surface 2005 - 11th European Meeting of Environmental
and Engineering Geophysics P054.
Kemna, A., Räkers, E., & Dresen, L. (1999). Field application of complex resistivity
tomography. Proceedings of the 69th Annual International Meeting. p. 331-334.
Society of Exploration Geophysics, Expanded Abstracts.
Klein, J., & Sill, W. (1982). Electrical properties of artificial clay bearing sandstones.
Geophysics, 47, p. 1593-1605.
Kormiltsev, V. (1963). O vozbuzhdenii I spade vyzv annoy polarizatsii v kapilliarnoi srede
(On the excitation and decay of induced polarization in a capillary medium). (In
Russian.). Sov. Solid Earth Phys., 11, p. 1658-1666.
Kosinski, W., & Kelly, W. (1981). Geoelectrical soundings for predicting aquifer properties.
Ground Water, 19, p. 163-171.
69
Kruschwitz, S. (2008). Assessment of the complex resistivity behaviour of salt affected
building materials: Ph.D. diss. Federal Institute for Materials Research and Testing
(BAM), Germany.
Kruschwitz, S., Binley, A., Lesmes, D., & Elshenawy, A. (2010). Textural controls on low-
frequency electrical spectra of porous media. Geophysics, 75(4), p. 113-123.
Lambot, S., Slob, E., Rhebergen, J., Lopera, O., Jadoon, K., & Vereecken, H. (2009). Remote
estimation of the hydraulic properties of a sand using full-waveform integrated
hydrogeophysical inversion of time-lapse, offground GPR data. Vadose Zone J., 8,
p. 743-754.
Leij, F. J., Russell, W. B., & Lesch, S. M. (1997). Closed-Form Expressions for Water
Retention and Conductivity Data. Groundwater, 35, p. 848-858.
Leroy, P., Revil, A., Altmann, S., & Tournassat, C. (2007). Modeling the composition of the
pore water in a clay rock geological formation (Callovo-Oxfordian, France).
Geochimica et Cosmochimica Acta, 71, p. 1087-1097.
Leroy, P., Revil, A., Kemna, A., Cosenza, P., & Ghorbani, A. (2008). Complex conductivity
of water-saturated packs of glass beads. J. Colloid Interface Sci., 321, p. 103-117.
Lesmes, D., & Frye, K. (2001). Influence of pore fluid chemistry on the complex conductivity
and induced polarization responses of Berea sandstone. Journal of Geophysical
Research, 106, p. 4079-4090.
Lesmes, D., & Morgan, F. (2001). Dielectric spectroscopy of sedimentary rocks. J. Geophys.
Res., 106, p. 13329-13346.
Lyklema, J. (1995). Fundamentals of Interface and Colloid Science. London, U.K.: Elsevier.
Lyklema, J. (2002). Specificity in the statics and dynamics of surface-confined ions.
Molecular Physics, 100, p. 3177-3185.
Madden, T., & Cantwell, T. (1967). Induced polarization, a review. Mining geophysics 2,
p. 373-400.
Marquardt, D. (1963). An Algorithm for least-squares estimation of nonlinear parameters.
Journal of the Society for Industrial and Applied Mathematics, 11(2), p. 431-441.
Maxwell, J. (1893). Treatise on Electricity and Magnetism 2nd ed., Oxford: Clarendo.
Mboh, C., Huisman, J., & Vereecken, H. (2011). Feasibility of Sequential and Coupled
Inversion of Time Domain Reflectometry Data to infer soil hydraulic parameters
under falling head infiltration. Soil Science Society of America Journal, 75, p. 775-
786.
Morgan, F., & Lesmes, D. (1994). Inversion for dielectric relaxation spectra. J. Chem. Phys.,
100, p. 671-561.
Morrison, R. (1998). Grounding and shielding techniques. New York: John Wiley & Sons.
Mualem, Y. (1976). A new model for predicting the hydraulic conductivity of unsaturated
porous media. Water Resources Research, 12, p. 513-522.
Münch, H., Kemna, A., Herbst, M., Zimmermann, E., & Vereecken, H. (2005). Multi-step
outflow experiments to link soil hydraulic properties with electrical characteristics.
Proc. Workshop on HYDRUS Applications, 19, p. 42-45. held at Dept. of Earth
Sciences, Utrecht Univ., October.
Nordsiek, S., & Weller, A. (2008). A new approach to fitting induced polarization spectra.
Geophysics, 73, p. F235-F245.
O'Konski, C. (1960). Electrical properties of macromolecules V. Theory of ionic polarization
in polyelectrolytes, p. 605-619.
Olhoeft, G. (1985). Low-frequency electrical properties. Geophysics, 50, p. 2492-2503.
Pape, H., & Vogelsang, D. (1996). Fractal evaluation of induced polarization logs in the
KTB-Oberpfalz HB. Geologisches Jahrbuch, 54(E), p. 3-27.
Pape, H., Riepe, L., & Schopper, J. (1982). A pigeon-hole model for relating permeability to
specific surface. The Log Analyst, 23, p. 5-13.
70
Pape, H., Riepe, L., & Schopper, J. R. (1987). Interlayer conductivity of rocks - A fractal
model of interface irregularities for calculating interlayer conductivity of natural
porous mineral systems. Colloids and Surfaces, 27, p. 97-122.
Pelton, W., Ward, S., Hallof, P., Sill, W., & Nelson, P. (1978). Mineral discrimination and
removal of inductive coupling with multifrequency IP. Geophysics, 43, p. 588-609.
Press, W., Teukolsky, S., Vetterling, W., & Flannery, B. (1992). Numerical recipes in
FORTRAN the art of scientific computing. Cambridge University Press.
Purvance, D., & Andricevic, R. (2000). On the electrical hydraulic conductivity correlation in
aquifers. Water Resources Research, 36, p. 2905-2913.
Revil, A., & Florsch, N. (2010). Determination of permeability from spectral induced
polarization in granular media. Geophys. J. Int., 181, p. 1480-1498.
Revil, A., & Linde, N. (2006). Chemico-electromechanical coupling in microporous media.
Journal of Colloid and Interface Science, 302(2), p. 682-694.
Revil, A., Karoulis, M., Johnson, T., & Kemna, A. (2012). Review: Some low-frequency
electrical methods for subsurface characterization and monitoring in hydrogeology.
Hydrogeology Journal, 20, p. 617-658.
Revil, A., Linde, N., Cerepi, A., Jougnot, D., Matthai, S., & Finsterle, S. (2007).
Electrokinetic coupling in unsaturated porous media. J. Colloid Interface Sci., 313,
p. 315-327.
Richards, L. A. (1931). Capillary conduction of liquids through porous mediums. Physics, 1,
p. 318-333.
Rubin, Y., & Hubbard, S. (2005). Hydrogeophysics. P.O. Box 17, 3300 AA Dordrecht, The
Netherlands: Published by Springer.
Ruffet, C., Darot, M., & Gueguen, Y. (1995). Surface conductivity in rocks: a review. Surveys
in Geophysics, 16, p. 83-105.
Sanchez-Vila, X., Meier, P. M., & Carrera, J. (1999). Pumping tests in heterogeneous
aquifers: An analytical study of what can be obtained from their interpretation using
Jacob's method. Water Resources Research, 35, p. 943-952.
Scheffer, & Schachtschabel. (2010). Lehrbuch der Bodenkunde. Heidelberg: Spektrum
Akademischer Verlag.
Schmutz, M., Revil, A., Vaudelet, P., Batzle, M., Femenia Vinao, P., & Werkema, D. (2010).
Influence of oil saturation upon spectral induced polarization of oil-bearing sands.
Geophys. J. Int., 183, p. 211-224.
Schwarz, G. (1962). A theory of the low frequency dielectric dispersion of colloidal particles
in electrolyte solutions. J. Phys. Chem. , 66, p. 2636-2642.
Scott, J., & Barker, R. (2003). Determining throat size in Permo-Triassic sandstones from low
frequency electrical spectroscopy. Geophysical Research Letters, 30.
Scott, J., & Barker, R. (2005). Characterization of sandstone by electrical spectroscopy for
stratigraphical and hydrogeological investigations. Q J Eng Geol Hydrogeol, 38,
p. 143-153.
Scott, J., & Barker, R. (2006). Pore geometry of Permo-Triassic sandstone from
measurements of electrical spectroscopy. In R. Barker, & J. Tellam (Hrsg.), Fluid
Flow and Solute Movement in Sandstones: The Onshore UK Permo-Triassic Red Bed
Sequence, 263, p. 65-81. London: Geological Society, London, Special Publications.
Sen, P. (1997). Resistivity of partially saturated carbonate rocks with microporosity.
Geophysics, 62, p. 415-425.
Shepherd, R. (1989). Correlations of permeability and grain size. Ground Water, 27(5),
p. 633-638.
Simunek, J., van Genuchten, M., & Sejna, M. (2005). HYDRUS-1D, V3.00, Code for
simulating the one dimensional movement of water, heat and multiple solutes in
variably-saturated porous media. Riverside, USA.

71
Simunek, J., Wendroth, O., & van Genuchten, M. (1999). Estimating unsaturated soil
hydraulic properties from laboratory tension disc infiltrometer experiments. Water
Resources Research, 35, p. 2965-2979.
Slater, L. (2006). Near Surface electrical characterization of hydraulic conductivity from
petrophysical properties to aquifer geometries - a review. Surv. Geophys., 28, p. 169-
197.
Slater, L. (2007). Near surface electrical characterization of hydraulic conductivity: From
petrophysical properties to aquifer geometries - A review. Surv. Geophys., 28, p. 169-
197.
Slater, L., & Binley, A. (2006). Synthetic and field based electrical imaging of a zerovalent
iron barrier: implications for monitoring long-term barrier performance. Geophysics,
71, p. B129-137.
Slater, L., & Lesmes, D. (2002). Electrical-hydraulic relationships observed for
unconsolidated sediments. Water Resources Research, 38, p. 3101-3110.
Slater, L., Ntarlagiannis, D., & Wishart, D. (2006). On the relationship between induced
polarization and surface area in metal-sand and clay-sand mixtures. Geophysics, 71,
p. A1-A5.
Sweeney, S., & Jennings, H. (1960). Effect of wettability on the electrical resistivity of
carbonate rock from a petroleum reservoir. Journal of Physical Chemistry, 64, p. 551-
553.
Titov, K., Kemna, A., Tarasov, A., & Vereecken, H. (2004). Induced polarization of
unsaturated sands determined through Time Domain Measurements. Vadose Zone
Journal, 3, Article Number. 11601168.
Titov, K., Komarov, V., Tarasov, V., & Levitski, A. (2002). Theoretical and experimental
study of time domain induced polarization in water saturated sands. J. Appl. Geophys.,
50, p. 417-433.
Ulrich, C., & Slater, L. (2004). Induced polarization measurements on unsaturated,
unconsolidated sands. (Geophysics, Hrsg.) Geophysics, 69, p. 762-771.
van Dam, J. C., Stricker, J. M., & Droogers, P. (1994). Inverse method for determining soil
hydraulic functions from multi step outflow experiments. Soil Sci. Soc. Am. J., 58,
p. 647-652.
Van Genuchten, M. (1980). A closed-form equation for predicting the hydraulic conductivity
of unsaturated soils. Soil Sci. Soc. Am. J., 44, p. 892-898.
van Genuchten, M. T. (1980). A closed form equation for predicting the hydraulic
conductivity of unsaturated soils. Soil Sci. Soc. Am. J., 44, p. 892-898.
Vanhala, H. (1997). Mapping oil-contaminated sand and till with the spectral induced
polarization (SIP) method. Geophys. Prosp., 45, p. 303-326.
Vaudelet, P., Revil, A., Schmutz, M., Franceschi, M., & Begassat, P. (2011a). Changes in
induced polarization associated with the sorption of sodium, lead, and zinc on silica
sands. Journal of Colloid and Interface Science, 360, p. 739-752.
Vaudelet, P., Revil, A., Schmutz, M., Franseschi, M., & Begassat, P. (2011b). Induced
polarization signatures of cations exhibiting differential sorption behaviors in
saturated sands. Water Resources Research, 47.
Vereecken, H., Binley, A., Cassiani, G., Revil, A., & Titov, K. (2006). Applied
Hydrogeophysics. P.O. Box 17, 3300 AA Dordrecht, The Netherlands: Published by
Springer.
Vereecken, H., Kemna, A., Tillmann, A., Vanderborght, J., & Verweerd, A. (2005).
Hydrogeophysical characterization of subsurface solute transport at the Krauthausen
test site: experiments and numerical modeling. In G. Nutzmann, P. Viotti, & Aagaard
(eds.), In: Reactive Transport in Soil and Groundwater - Processes and Models,
p. 221-237. Springer.
72
Vereecken, H., Weynants, M., Javaux, M., Pachepsky, Y., Schaap, M. G., & van Genuchten,
M. T. (2010). Using Pedotransfer Functions to Estimate the van Genuchten - Mualem
Soil Hydraulic Properties: A Review. Vadose Zone Journal, 9, p. 795-820.
Vinegar, H., & Waxman, M. (1984). Induced polarization of shaly sands. Geophysics, 49(9),
p. 1267-1287.
Wagner, K. (1924). Erklärung der Dielektrischen Nachwirkungsvorgänge aufgrund
Maxwellscher Vorstellungen. Arch. Electrotech., 2, p. 371-381.
Waxman, M., & Smits, L. (1968). Electrical conductivities in oil bearing shaly sands. Soc.
Petroleum Eng. J., 8, p. 107-122.
Weller, A., Breede, K., Slater, L., & Nordsiek, S. (2011). Effect of changing water salinity on
complex conductivity spectra of sandstones. Geophysics, 76(5), p. 315-327.
Weller, A., Slater, L., Nordsiek, S., & Ntarlagiannis, D. (2010). On the estimation of specific
surface per unit pore volume from induced polarization: A robust empirical relation
fits multiple data sets. Geophysics, 75.
Williams, K., Kemna, A., Wilkins, M., Druhan, J., Arntzen, E., N'Guessan, A., et al. (2009).
Geophysical monitoring of coupled microbial and geochemical processes during
stimulated subsurface bioremediation. Environ. Sci. Technol., 43, p. 6717-6723.
Wong, J. (1979). An electrochemical model of the induced-polarization phenomenon in
disseminated sulphide ores. Geophysics, 44(7), p. 1245-1265.
Worthington, P., & Collar, F. (1984). Relevance of induced polarization to quantitative
formation evaluation. Marine and Petroleum Geology, 1, p. 14-26.
Wösten, J., Pachepsky, Y., & Rawls, W. (2001). Pedotransfer functions: bridging the gap
between available basic soil data and missing soil hydraulic characteristics. Journal of
Hydrology, 251(3-4), p. 123-150.
Zimmermann, E., Kemna, A., Berwix, J., Glaas, W., Münch, H., & Huisman, J. (2008). A
high-accuracy impedance spectrometer for measuring sediments with low
polarizability. Meas. Sci. Technol., 19: 105603.
Zisser, N., Kemna, A., & Nover, G. (2010). Relationship between low-frequency electrical
properties and hydraulic permeability of low-permeability sandstones. Geophysics, 75,
p. E131-E141.
Schriften des Forschungszentrums Jülich Reihe Energie & Umwelt / Energy & Environment
Band / Volume 162 Effects of 137Cs and 90Sr on structure and functional aspects of the microflora in agricultural used soils B. Niedrée (2013), XII, 92 pp ISBN: 978-3-89336-843-3 Band / Volume 163 Lidar observations of natural and volcanic-ash-induced cirrus clouds C. Rolf (2013), IX, 124 pp ISBN: 978-3-89336-847-1 Band / Volume 164 CO2-Abscheidung, -Speicherung und -Nutzung: Technische, wirtschaftliche, umweltseitige und gesellschaftliche Perspektive Advances in Systems Analysis 2 W. Kuckshinrichs; J.-F. Hake (Eds.) (2012), iv, 354 pp ISBN: 978-3-89336-850-1 Band / Volume 165 Interest Mediation and Policy Formulation in the European Union Influence of Transnational Technology‐Oriented Agreements on European Policy in the Field of Carbon Capture and Storage Advances in Systems Analysis 3 O. Schenk (2013), XIII, 253 pp ISBN: 978-3-89336-852-5 Band / Volume 166 Versagensverhalten plasmagespritzter Mg-Al-Spinell-Schichten unter Thermozyklierung S. M. Ebert (2013), X, 173 pp ISBN: 978-3-89336-853-2 Band / Volume 167 Coupled modeling of water, vapor and heat in unsaturated soils - Field applications and numerical studies C. Steenpaß (2013), X, 123 pp ISBN: 978-3-89336-854-9 Band / Volume 168 An analysis of the global atmospheric methane budget under different climates A. Basu (2013), v, 110 pp ISBN: 978-3-89336-859-4

Schriften des Forschungszentrums Jülich Reihe Energie & Umwelt / Energy & Environment
Band / Volume 169 Experimental determination of the partitioning coefficient of nopinone as a marker substance in organic aerosol B. Steitz (2013), 132 pp ISBN: 978-3-89336-862-4 Band / Volume 170 Ion Beam Treatment of Functional Layers in Thin-Film Silicon Solar Cells W. Zhang (2013), xi, 191 pp ISBN: 978-3-89336-864-8 Band / Volume 171 Pulvermetallurgische Herstellung von porösem Titan und von NiTi-Legierungen für biomedizinische Anwendungen M. Bram (2013), X, 238 pp ISBN: 978-3-89336-866-2 Band / Volume 172 IEK-3 Report 2013. Langlebige Elektrochemische Verfahrenstechnik (2013), ca. 185 pp ISBN: 978-3-89336-868-6 Band / Volume 173 Combined Steady State and High Cycle Transient Heat Load Simulation with the Electron Beam Facility JUDITH 2 T. W. Loewenhoff (2013), XVI, 108 pp ISBN: 978-3-89336-869-3 Band / Volume 174 High-Quality Thorium TRISO Fuel Performance in HTGRs K. Verfondern, H. Nabielek, M.J. Kania, H.-J. Allelein (2013), viii, 109 pp ISBN: 978-3-89336-873-0 Band / Volume 175 Characterization of effective hydraulic properties of unsaturated porous media using spectral induced polarization (SIP) K. Breede (2013), xiv, 72 pp ISBN: 978-3-89336-875-4 Weitere Schriften des Verlags im Forschungszentrum Jülich unter http://wwwzb1.fz-juelich.de/verlagextern1/index.asp


Mem
ber
of th
e H
elm
holtz
Ass
ocia
tion Characterization of effective hydraulic properties of unsaturated
porous media using spectral induced polarization (SIP)
Katrin Breede
Energie & Umwelt / Energy & EnvironmentBand/ Volume 175ISBN 978-3-89336-875-4


